TAKING THE LEAD - HKEXnews
280
TAKING THE LEAD ANNUAL REPORT
-
Upload
khangminh22 -
Category
Documents
-
view
1 -
download
0
Transcript of TAKING THE LEAD - HKEXnews

HANG SENG BANK LIMITED83 Des Voeux Road Central, Hong Kong
HA
NG
SE
NG
BA
NK
LIMIT
ED
Annual R
epo
rt 2010
TAKING THE LEAD
ANNUAL REPORT

TAKING THE LEADIn a competitive operating environment, Hang Seng Bank strives
for top-level performance as we pursue long-term growth.
Our objective is to serve our stakeholders by becoming the
leading personal and private bank for middle-class and affluent
customers in Hong Kong and on the Mainland, and the leading
trade bank in Greater China.
This year’s theme – Taking The Lead – reflects our determination
to reinforce our market leadership in traditional banking and
build a strong position in new areas of financial services to
achieve our goals.
strength perception
Passion
strategy
skill
2006 Asian Games – Table Tennis, Gold Medal
Li Ching
2010 Asian Games – Table Tennis, Silver Medal
Jiang Huajun

Corporate Profile Results in Brief * Five-year Financial Summary Major Milestones Recognition
Chairman’s Statement* Chief Executive’s Report* Corporate Responsibility Corporate Governance and Other Information
Management Discussion and Analysis Business in Hong Kong Business on the Mainland Financial Review
Contents
3
4
5
6
8
10
16
24
32
46
60
68
80
86
89
96
250
251
273
274
275
Biographical Details of Directors Biographical Details of Senior Management Report of the Directors
2010 Financial Statements Independent Auditor’s Report Supplementary Notes to the Financial Statements (Unaudited)
Analysis of Shareholders Subsidiaries Corporate Information and Calendar
* Where possible, percentages in this section have been rounded to the nearest percentage point to facilitate easy reading. Percentage-based indicators remain at 1 or 2 decimal places as appropriate.

Corporate Profile
Established in 1933, Hang Seng Bank is one of
Hong Kong’s largest listed companies and among
the 50 largest listed banks in the world in terms of
market capitalisation (HK$244.3bn as at the end of
December 2010).
In Hong Kong, we serve over one-third of the population
through about 220 service outlets. We also maintain
a branch in Shenzhen for foreign currency wholesale
business, branches in Macau and Singapore, and
representative offices in Xiamen and Taipei.
Established in 2007 and headquartered in Shanghai,
wholly owned mainland China subsidiary Hang Seng
Bank (China) Limited operates a network of 38 outlets
in Beijing, Shanghai, Guangzhou, Shenzhen, Dongguan,
Fuzhou, Nanjing, Hangzhou, Ningbo, Tianjin, Kunming,
Foshan and Zhongshan.
Hang Seng is a principal member of the HSBC Group,
one of the world’s largest banking and financial
services organisations.

2010 2009 Change
For the year HK$m HK$m %
Operating profit excluding loan impairment charges and other credit risk provisions 14,475 14,026 3
Operating profit 14,085 13,214 7
Profit before tax 17,345 15,400 13
Profit attributable to shareholders 14,917 13,138 14
HK$ HK$ %
Earnings per share 7.80 6.87 13.5
Dividends per share 5.20 5.20 –
At year-end HK$m HK$m %
Shareholders’ funds 70,012 62,148 13
Total assets 916,911 830,668 10
Ratios % %
For the year
Return on average shareholders’ funds 22.8 22.9
Cost efficiency ratio 33.7 32.6
Average liquidity ratio 38.1 48.1
At year-end
Capital adequacy ratio* 13.6 15.8
Core capital ratio* 10.8 12.8
* Capital ratios at 31 December 2010 were compiled in accordance with the Banking (Capital) Rules (the “Capital Rules”) issued by the Hong Kong Monetary Authority (“HKMA”) under section 98A of the Hong Kong Banking Ordinance for the implementation of Basel II. Having obtained approval from the HKMA to adopt the advanced internal ratings-based approach (“AIRB”) to calculate the risk-weighted assets for credit risk from 1 January 2009, the Bank used the AIRB approach to calculate its credit risk exposure. The standardised (operational risk) approach and internal models approach were used to calculate its operational risk and market risk respectively.
The basis of consolidation for calculation of capital ratios under the Capital Rules follows the basis of consolidation for financial reporting with the exclusion of subsidiaries which are “regulated financial entities” (e.g. insurance and securities companies) as defined by the Capital Rules. Accordingly, the investment costs of these unconsolidated regulated financial entities are deducted from the capital base.
HANG SENG BANK4
RESuLTS IN BRIEF

2006(restated)
2007(restated)
2008(restated)
2009(restated)
2010
For the year HK$bn HK$bn HK$bn HK$bn HK$bnOperating profit 12.5 17.7 13.6 13.2 14.1Profit before tax 14.3 21.4 15.7 15.4 17.3Profit attributable to shareholders 12.0 18.1 13.9 13.1 14.9
At year-end HK$bn HK$bn HK$bn HK$bn HK$bnShareholders’ funds 49.2 59.2 55.0 62.1 70.0Issued and paid up capital 9.6 9.6 9.6 9.6 9.6Total assets 671.8 749.4 766.0 830.7 916.9Total liabilities 622.6 690.2 711.0 768.6 846.9
Per share HK$ HK$ HK$ HK$ HK$Earnings per share 6.26 9.49 7.29 6.87 7.80Dividends per share 5.20 6.30 6.30 5.20 5.20
Ratios % % % % %Post-tax return on average shareholders’ funds 26.0 33.6 24.3 22.9 22.8Post-tax return on average total assets 1.9 2.6 1.8 1.7 1.7Capital adequacy ratio* 13.6 11.2 12.5 15.8 13.6Core capital ratio* 10.7 8.4 9.5 12.8 10.8Cost efficiency ratio 29.3 26.9 29.6 32.6 33.7
* Capital ratios at 31 December 2010 were compiled in accordance with the Banking (Capital) Rules (the “Capital Rules”) issued by the Hong Kong Monetary Authority (“HKMA”) under section 98A of the Hong Kong Banking Ordinance for the implementation of Basel II. Having obtained approval from the HKMA to adopt the advanced internal ratings-based approach (“AIRB”) to calculate the risk-weighted assets for credit risk from 1 January 2009, the Bank used the AIRB approach to calculate its credit risk exposure. The standardised (operational risk) approach and internal models approach were used to calculate its operational risk and market risk respectively.
The basis of consolidation for calculation of capital ratios under the Capital Rules follows the basis of consolidation for financial reporting with the exclusion of subsidiaries which are “regulated financial entities” (e.g. insurance and securities companies) as defined by the Capital Rules. Accordingly, the investment costs of these unconsolidated regulated financial entities are deducted from the capital base.
8
6
4
2
0
14
12
10
18
16
20HK$bn
Results
Attributable profit
Operating profit
06 07 08 09 10
400
300
200
100
0
700
600
500
900
800
1,000HK$bn
0
40
35
30
25
20
15
10
5
%
Total Assets and Shareholders’ Funds
Total assets
Shareholders’ funds
Post-tax return on average shareholders’ funds
06 07 08 09 10
4
2
0
6
8
10HK$
Per Share Earnings and Dividends
Dividends per share
Earnings per share
06 07 08 09 10
ANNUAL REPORT 2010 5
FIVE-YEAR FINANCIAL SuMMARY

January - March
• Hang Seng China opens first cross-location sub-branch in Foshan
• Hang Seng China launches new branding campaign
• Hang Seng becomes first bank in Hong Kong to set renminbi prime rate
APRIL - JUNE
• Hang Seng launches Hong Kong dollar China UnionPay Credit Card
• Hang Seng China opens cross-location sub-branch in Zhongshan
• Hang Seng launches securities and foreign exchange investment information iPhone application
• Hang Seng Indexes launches Hang Seng Dividend Point Index Series
HANG SENG BANK6
MAJOR MILESTONES

JULY - SEPTEMBER
• Personal e-Banking celebrates 10th anniversary
• Hang Seng launches first-of-its-kind foreign exchange margin trading iPhone application
• Hang Seng launches Hong Kong’s first renminbi certificate of deposit for retail customers
• Hang Seng Indexes launches Hang Seng Corporate Sustainability Index Series
OCTOBER - DECEMBER
• Hang Seng launches Hang Seng RMB Bond Fund
• Hang Seng lead-arranges Hong Kong’s first renminbi syndicated loan
• Hang Seng China unveils new headquarters building in Shanghai
ANNUAL REPORT 2010 7

Awards
Best Domestic Bank in Hong Kong (for 11th consecutive year) The Asset
Best Local Private Bank in Hong Kong Euromoney
No. 1 for Financial Reputation (Hong Kong) No. 3 Most Admired Company Overall (Hong Kong) The Wall Street Journal Asia
No. 1 for Most Committed to a Strong Dividend Policy (China and Hong Kong) FinanceAsia
Achievement Award for Cash Management in Hong Kong The Asian Banker
Best Risk Management Bank in Asia 21st Century Business Herald
Wealth Management Company of the Year Best-in-Class: Innovation of the Year – Investment Management; Online Capabilities; Training and Development Benchmark
Best in Hong Kong Structured Products
Best Investor Relations by Sector – Banks & Financial (Greater China) Best Investor Relations by a CFO (Hong Kong) Best Governance and Disclosure (Hong Kong) IR Magazine
Best Fund (two funds managed by Hang Seng) Lipper Fund Awards Hong Kong
SME’s Best Partner Award Hong Kong Chamber of Small and Medium Business
Trusted Brands Gold Award – Bank Trusted Brands Gold Award – Credit Card Issuing Bank Reader’s Digest
Best Foreign Bank (Hang Seng China) National Business Daily
No. 1 for Wealth Management Products’ Investment Return (Hang Seng China) China Benefit
2010 Top Ten Best Wealth Management Products in China (Hang Seng China – Equity-linked investment product ‘Pick & Win’) Money Week
Best SME Services Award (Hang Seng China) CFO World
HANG SENG BANK8
RECOGNITION

Moody’s Investors Service
Hang Seng Bank
Long-term Bank Deposit (local and foreign currency) Aa1
Short-term Bank Deposit (local and foreign currency) Prime-1
Subordinated Debt (local and foreign currency) Aa2
Bank Financial Strength B+
Outlook Stable
Hang Seng Bank (China) Limited
Long-term Bank Deposit (local and foreign currency) A1
Short-term Bank Deposit (local and foreign currency) Prime-1
Bank Financial Strength D
Outlook Stable
Standard & Poor’s
Hang Seng Bank
Long-term Counterparty Credit (local and foreign currency) AA
Short-term Counterparty Credit (local and foreign currency) A-1+
Bank Fundamental Strength B+
Outlook Stable
Hang Seng Bank (China) Limited
Long-term Counterparty Credit (local and foreign currency) AA-
Short-term Counterparty Credit (local and foreign currency) A-1+
Outlook Stable
Fitch Hang Seng Bank Individual Rating B
RATINGS
ANNUAL REPORT 2010 9

TAKING THE LEAD
DETERMINATION

2010 Asian Games – Cycling, Silver Medal
Jamie Wong

Raymond Ch’ienChairman
HANG SENG BANK12
CHAIRMAN’S STATEMENT

TAKING THE LEAD
As the global economic recovery progressed, we took steps to maintain our leading position in traditional areas of banking and capitalise on new business opportunities, achieving increases in both net interest and non-interest revenue streams. The success of our approach saw income growth in the second half of the year outpace that in the first half despite increasingly competitive operating conditions.
As economic confidence returned, we used our time-to-market strength to capture the shift in investment sentiment, driving good growth in both personal and corporate wealth management business.
We leveraged our strong balance sheet, excellent market knowledge and effective credit risk management system to expand lending portfolios, underpinning the rise in net interest income.
We continued to support local industry through active participation in government-sponsored lending schemes as well as efforts to enhance service access and delivery for SME customers.
Assisted by our comprehensive cross-border capabilities, our rapid response to the further opening up of renminbi banking in Hong Kong strengthened our status as a preferred partner for trade-related financial services.
Our focus on strengthening Hang Seng’s platform for long-term growth produced solid results in 2010.
Raymond Ch’ienChairman
DISTINCTIVE VISION
ANNUAL REPORT 2010 13

Hang Seng Bank (China) Limited purchased headquarters premises in Shanghai and achieved increases in its customer and deposit bases, further improving its springboard for long-term business growth. We continued to collaborate with our strategic mainland China partners – Industrial Bank and Yantai Bank – to good effect. In the first half of the year, we took up our full entitlement under a rights share issue by Industrial Bank.
Financial Performance
Operating profit excluding loan impairment charges and other credit risk provisions rose by 3% to HK$14,475m. Operating profit grew by 7% to HK$14,085m, with the stabilisation in economic conditions and our good management of credit risk driving a 52% improvement in loan impairment charges and other credit risk provisions to HK$390m.
Profit before tax was up 13% at HK$17,345m. Profit attributable to shareholders rose by 14% to HK$14,917m. Earnings per share were up 13.5% at HK$7.80.
We built good business momentum during the year to record increases of 11% in operating profit excluding loan impairment charges and 14% in attributable profit in the second half of the year compared with the first half.
Higher performance-related pay as well as more investment in marketing to support future growth saw operating expenses rise by 8% to HK$7,355m. Our cost efficiency ratio for 2010 was 33.7%.
Return on average shareholders’ funds was 22.8%, compared with 22.9% in 2009. Return on average total assets was 1.7% – the same as a year earlier.
At 31 December 2010, our capital adequacy ratio was 13.6%, compared with 15.8% at the end of 2009. The decline mainly reflects our participation in Industrial Bank’s rights issue and the rise in risk-weighted assets. Our core capital ratio was down 2 percentage points at 10.8%.
The Directors have declared a fourth interim dividend of HK$1.90 per share, payable on 30 March 2011. This brings the total distribution for 2010 to HK$5.20 per share.
Our strong stakeholder relationships are a vital element in our success as we work to contribute to and share in the long-term prosperity of the markets in which we operate.
I wish to express sincere appreciation to our customers and shareholders for continuing to place great confidence in Hang Seng. Your support provides encouragement that we have an excellent strategy for business growth, and inspiration for the development of new products and services. While global markets have staged a recovery from the international financial crisis in the past year, its effects will continue to reverberate. In good economic times and bad, we will work hard to provide the service and value that have become synonymous with the Hang Seng brand.
Our close partnerships with customers – old and new – are built and maintained by our dedicated and professional team. I wish to thank staff at all levels for their enthusiasm and commitment in executing our vision for service excellence and long-term growth. Their invaluable efforts will ensure we continue to strengthen our position as a leading provider of financial services in Greater China.
HANG SENG BANK14
CHAIRMAN’S STATEMENT

Outlook
Large-scale fiscal and monetary stimulus initiatives launched in the wake of the international financial crisis supported a rebound in the global economy in 2010. However, the recovery has occurred on two distinct tracks, with fast growth in emerging economies but slower progress in advanced economies.
The resurgence in export activity and robust domestic consumption underpinned GDP growth in Hong Kong and on the Mainland, although the pace began to moderate in the second half of the year.
With many stimulus programmes now being phased out, challenges remain. The US Federal Reserve’s announcement in November of another round of quantitative easing underlines the continuing fragility of the US economy, while many countries in Europe have instituted austerity measures as they attempt to restore fiscal discipline and address unprecedented levels of sovereign debt.
These developments may dampen export demand in 2011. In addition, the persistence of low interest rates and excess market liquidity in Hong Kong are fuelling concerns over inflation and asset price bubbles. However, unemployment remains low and overall market sentiment is upbeat. Along with the major boost to construction provided by several large government-led infrastructure projects, this should support domestic consumption, helping to cushion the effects of a slowdown in the external sector.
Despite recent measures to curb rising inflation and property prices on the Mainland, steady income growth and the government’s efforts to promote private consumption through its 12th five-year plan should sustain strong domestic demand, which will be the primary driver of GDP growth in the short term.
In uncertain market conditions, our competitive strengths will ensure we maintain our leadership in areas such as mortgages, credit cards and commercial lending. We will use our trusted brand, time-to-market capabilities and extensive range of service delivery channels to capture new business opportunities. We will also continue to build on the good progress we have made in strongly positioning ourselves to achieve sustainable growth.
Raymond Ch’ienChairmanHong Kong, 28 February 2011
ANNUAL REPORT 2010 15

Margaret LeungVice-Chairman and Chief Executive
HANG SENG BANK16
CHIEF EXECuTIVE’S REPORT

TAKING THE LEAD
Backed by our trusted brand and strong financial fundamentals, our timely actions to meet changing customer needs reinforced our leadership in traditional bank services and strengthened our position in new areas of business – supporting good growth in the customer bases, revenue and profit of our core business lines.
Low interest rates had an adverse effect on deposit spreads and returns from Treasury’s balance sheet management portfolio. While remaining vigilant in managing credit risk, we redeployed the commercial surplus to expand lending, outperforming the market for growth in customer advances and increasing our share in the competitive credit card and residential mortgage sectors.
We achieved year-on-year growth in net interest income, building good momentum during the year to record increases in net interest income and net interest margin in the second half compared with the first half.
With our strong wealth management and cross-border trade-related capabilities, we also achieved a second-half growth trend in net fee income – supporting a solid rise in fee-related revenue for the year.
The operating environment was very competitive in 2010 as banks sought to capitalise on improved investment sentiment and the upturn in economic activity.
unrivalled passion
ANNUAL REPORT 2010 17

We launched new mainland China-focused investment products and increased our retail investment fund market share, reaffirming our reputation as a leading fund manager and distributor in Hong Kong.
Innovative initiatives to support business customers with operations in Hong Kong and on the Mainland established us as a market leader for renminbi financial services. We are now well positioned to capture a growing share of this rapidly expanding sector.
A new iPhone application for foreign exchange margin trading and the expansion of services on our online banking platforms helped customers take timely advantage of investment opportunities. At 31 December 2010, our Personal e-Banking and Business e-Banking customer bases were up 10% and 19% respectively compared with a year earlier.
Customer Groups
Personal Financial Services recorded an 8% increase in profit before tax to HK$7,872m. Operating profit excluding loan impairment charges grew by 5% to HK$7,865m. Operating profit was up 9%.
Despite downward pressure on mortgage pricing and deposit spreads, we achieved a 4% rise in net interest income to HK$8,485m by expanding our loan portfolios.
Unsecured lending recorded a 52% rise in profit before tax compared with 2009, attributable to good business momentum and improved loan quality. Our new Hong Kong dollar China UnionPay credit card helped support an 11% increase in the card base, which passed the major milestone of 2 million cards in circulation. Card spending and receivables rose by 18% and 14% respectively. Personal loans grew by 29%. Impairment charges for unsecured lending fell by 46%.
We reinforced our strong position in the residential mortgage sector. We outperformed the market in terms of the number of new mortgage registrations and increased our share of mortgage business.
We used our time-to-market strength and extensive distribution network to capitalise on the improvement in investor outlook during the year, achieving a 9% increase in wealth management income. Wealth management revenue in the second half of 2010 rose by 4% compared with the first half.
Investment income was up 10%. Timely new products, including the Hang Seng RMB Bond Fund, supported a 181% increase in retail investment fund sales and an 85% rise in investment fund fee revenue. Funds under management (including private banking) exceeded HK$150bn for the first time. With a diverse investment product suite and an emphasis on customised wealth management solutions, private banking achieved a 25% increase in service fee income.
Our enhanced online securities services and innovative iPhone application for foreign exchange margin trading drove increases in the number of securities and margin trading accounts.
We strengthened our position as a prominent provider of retirement planning solutions and insurance coverage for different life stages by launching new products and enhancing protection under existing plans. Life insurance income rose by 10%. Total life insurance policies in-force and annualised premiums grew by 9% and 13% respectively.
We were named ‘Company of the Year’ in Benchmark’s Wealth Management Awards 2010 and ‘Best Local Private Bank in Hong Kong’ by Euromoney for the second consecutive year.
HANG SENG BANK18
CHIEF EXECuTIVE’S REPORT

Commercial Banking took good advantage of the global economic recovery and the further opening up of renminbi financial services in Hong Kong. Profit before tax rose by 42% to HK$3,748m, reflecting broad-based income growth as well as a 36% improvement in loan impairment charges. Operating profit excluding loan impairment charges was up 34% at HK$2,671m. Operating profit rose by 46%.
We took steps to facilitate commercial activity. Our cross-border and renminbi offerings helped companies capitalise on new business opportunities while managing risk, driving a 225% increase in trade finance. Our financial support for SMEs through government-initiated lending schemes topped HK$18.4bn by the end of 2010. We used technology to reduce turnaround times for new and renewed lending and credit facility decisions. These efforts helped drive a 102% increase in customer advances, with a 58% rise in related net interest income.
Customer deposits rose by 14%, but pressure on spreads resulted in a 19% fall in deposit net interest income.
We established a leadership position for renminbi commercial banking services that will provide an excellent springboard for future growth. Among other initiatives, we became the first bank in Hong Kong to establish a prime rate and lead-arrange a syndicated loan denominated in renminbi.
Close collaboration between commercial banking teams in Hong Kong and on the Mainland and new strategic alliances with Mainland partners enhanced our cross-border service proposition and proved a valuable source of referral business. At the end of 2010, we had over 58,000 renminbi commercial accounts and our renminbi cross-border trade-related business exceeded RMB35bn.
Net fee income rose by 9%, supported in part by an enriched portfolio of corporate wealth management products and enhanced online investment services.
Corporate wealth management income rose by 27%, representing 13% of Commercial Banking’s net operating income before loan impairment charges.
Stronger Internet-based business banking platforms helped drive continued customer migration to online channels. At 31 December 2010, the number of Business e-Banking customers had reached over 92,000. The number of online business transactions in 2010 grew by 19% compared with 2009.
Corporate Banking recorded a 38% increase in profit before tax to HK$1,266m. Operating profit excluding loan impairment charges was up 29% at HK$1,264m. Operating profit rose by 40%.
Total operating income rose by 25% on the back of a 24% increase in net interest income.
We reaffirmed our reputation as a leading fund manager and distributor in Hong Kong.‘‘
’’ANNUAL REPORT 2010 19

Tighter regulations in the Hong Kong and Mainland property markets and intensifying competition among lenders created new challenges for traditional drivers of Corporate Banking growth. We took steps to further diversify the revenue base, leveraging our strong customer relationships and good market knowledge to capture business in a broader range of industry sectors and explore opportunities created by the growing demand for cross-border financial services. Customer advances and deposits grew by 32% and 34% respectively.
Treasury’s profit before tax fell by HK$32m, or 1%, to HK$3,361m. With increased loan demand from business customers, a substantial proportion of the commercial surplus was redeployed to support commercial lending. Good growth in trading income, a disposal gain and an increase in share of profits from associates was more than offset by the effects of continuing low global interest rates on net interest income, which dropped by 35%. Operating profit fell by 24%.
We made prudent use of gapping opportunities and took steps to enhance the investment mix under the balance sheet management portfolio by disposing of selected instruments and investing in high-quality debt securities, resulting in a HK$95m disposal gain. These actions led to a 30% increase in net interest income in the second half of 2010 compared with the first half despite the challenging market conditions.
Closer collaboration with business banking colleagues and efforts to meet the growing demand for renminbi-denominated products drove the 10% increase in trading income.
We became the first bank in Hong Kong to establish a prime rate and lead-arrange a syndicated loan denominated in renminbi.‘‘
’’Mainland Business
Hang Seng Bank (China) Limited moved forward with its strategy for long-term development with the RMB510m purchase of headquarters premises in Shanghai. With the opening of two cross-location sub-branches under CEPA VI in 2010, Hang Seng China now has 38 outlets across 13 Mainland cities.
An enhanced customer referral mechanism, good cross-border commercial banking capabilities and a diverse portfolio of products proved valuable in attracting new business and building a broader platform to sustain growth in deposits. The Mainland personal and commercial banking customer bases increased by 15% and 14% respectively year on year.
HANG SENG BANK20
CHIEF EXECuTIVE’S REPORT

The expansion of wealth management offerings to better meet the needs of customers at different life stages underpinned a 17% rise in the number of Prestige Banking accounts. Along with enhancements to services for commercial customers, this rise helped drive a 76% year-on-year increase in deposits – improving balance sheet strength. With continuing emphasis on credit quality over portfolio size, advances to customers increased by 28%.
Hang Seng China’s profit before tax recorded solid growth, with the 24% rise in total operating income outweighing increases in loan impairment charges and operating expenses.
Collaboration with Hang Seng’s strategic Mainland partners, Industrial Bank and Yantai Bank, continued to extend our reach in regions with good economic growth potential.
Financial Highlights
Total assets rose by HK$86.2bn, or 10%, to HK$916.9bn. Our efforts to facilitate the upswing in commercial trade and capitalise on robust consumer demand underpinned the 37% increase in customer advances. Customer deposits, including certificates of deposit and other debt securities in issue, were up 7%, driven partly by good growth in renminbi deposits. With the emphasis on using surplus funds to support loan growth, financial investments and trading assets were down 17% and 61% respectively.
Net interest income rose by 2% to HK$14,300m. The 9% increase in average interest-earning assets, improved loan spreads and returns from the life insurance funds investment portfolio outweighed reduced contributions from deposits and the Treasury balance sheet management portfolio. In challenging operating conditions, we achieved a 13% rise in net interest income and a 3 basis points improvement in net interest margin in the second half of 2010 compared with the first half. Net interest margin for the year was down 12 basis points on 2009 at 1.78%.
We recorded a 13% increase in net fee income to HK$4,897m, largely reflecting the 72% rise in investment fund fee income. Fees from trade services, remittances and credit facilities grew by 19%, 19% and 44% respectively. Successful credit card customer acquisition and card utilisation campaigns supported a 3% rise in fee income from card services. As investor confidence improved, our diverse range of wealth management products and service excellence supported a 35% increase in insurance agency fees and a 24% rise in private banking service fee income. Net fee income in the second half of 2010 was up 7% compared with the first half.
Trading income grew by 7% to HK$2,059m. Income from securities, derivatives and other trading activities rose by HK$160m, or 122%, reflecting an improvement in derivatives trading. Foreign exchange income fell by HK$24m, or 1%, due mainly to a fall in net interest income from funding swaps and increased losses on the revaluation of Hang Seng China’s US dollar capital against the renminbi.
While continuing to carefully monitor costs, we invested in staff and marketing to recognise good performance and support future growth. Rental expenses increased with higher rents in Hong Kong and new outlets on the Mainland.
Our cost efficiency ratio for 2010 was 33.7%.
ANNUAL REPORT 2010 21

The combined impact of the improved economic climate and our effective actions to manage credit risk saw loan impairment charges and other credit risk provisions fall by HK$422m, or 52%, to HK$390m.
Total loan impairment allowances as a percentage of gross advances to customers was 0.39% compared with 0.56% a year earlier. Gross impaired advances as a percentage of gross advances to customers improved by 30 basis points to 0.40%.
A Winning Strategy
The economic rebound boosted international trade and investment markets in 2010, but the outlook for 2011 remains uncertain. With stimulus initiatives winding down, many of the world’s advanced economies are still grappling with major monetary and fiscal issues, which may subdue export demand.
Although upbeat consumer and business sentiment should continue to support domestic demand, a slowdown in the external sector would create new challenges for Hong Kong. Despite recent measures to curb economic overheating, domestic consumption on the Mainland looks set to remain robust, underpinning continued growth – albeit at a more moderate pace.
Our long-term goals are to be the leading personal and private bank for affluent and middle-class customers in Hong Kong and on the Mainland, and the leading trade bank in Greater China.
To achieve these objectives, we have identified business priorities that capitalise on our competitive strengths and support sustainable growth.
Hang Seng’s strengths are its unique market positioning, comprehensive wealth management capabilities and extensive business referral network.
Our long-term goals are to be the leading personal and private bank for affluent and middle-class customers in Hong Kong and on the Mainland, and the leading trade bank in Greater China.
‘‘’’
HANG SENG BANK22
CHIEF EXECuTIVE’S REPORT

The rapidly growing middle and affluent classes on the Mainland are seeking new investment opportunities at home and in Hong Kong. With our good cross-border reach and trusted brand, we are strongly positioned to meet their needs.
In support of achieving our goals, we will maintain our excellent service level. We will make further investments in technology and launch service innovations to facilitate transactions and capture more business, particularly in the Prestige Banking segment and among young people. We will develop new applications for personal mobile devices to provide convenient access to account and market information. We will work to drive continuing good growth in deposits in Hong Kong and on the Mainland, providing a solid foundation for business expansion.
We have placed ourselves at the leading edge of the wealth management and offshore renminbi financial services markets. We will continue to make good use of our product development strength and well-established service platforms to become the preferred bank in these rapidly growing sectors.
Our strong cross-border banking proposition is proving an important tool as we work to become the leading trade bank in Greater China.
Treasury will continue to develop effective hedging solutions and new renminbi-related products, and Commercial Banking has enhanced online banking services to support renminbi account enquiries and transaction instructions. We will remain close to customers and to Mainland regulators to ensure we stay ahead of the game.
Enduring characteristics of Hang Seng’s success are a willingness to aim high in setting our business objectives and our focus on serving customers well by providing financial solutions that are tailored to their needs. We have a winning strategy for maintaining a strong position in traditional business lines and for taking the lead in key areas of new banking business to deliver long-term growth.
Margaret LeungVice-Chairman and Chief ExecutiveHong Kong, 28 February 2011
ANNUAL REPORT 2010 23


dedicationTAKING THE LEAD
ENVIRONMENTCOMMuNITY EDuCATION EMPLOYEES

We work to continuously improve the sustainability of our operations and encourage customers and suppliers to do the same through our procurement, investment and financing policies.
We take steps to raise awareness of social and environmental issues among our staff and the general public. We also provide financial and volunteer support for a variety of community development projects.
In 2010, we marked our 10th year as a member of the FTSE4Good Global Index, which tracks the performance of companies that meet internationally recognised standards of corporate responsibility. We have been named a Caring Company by the Hong Kong Council of Social Service every year since 2003.
In May, we received the Gold Award in the Financial, Insurance and Accounting Institutions Sector of the Hong Kong Awards for Environmental Excellence in recognition of our environmental initiatives.
As a leading corporate citizen in Hong Kong, our commitment to excellence extends beyond the provision of financial services.
HANG SENG BANK26
CORPORATE RESPONSIBILITY

Our annual corporate responsibility report, available online via our website since 2005, gives more details of our principles and activities as regards our interactions with stakeholders and provides a crucial benchmark for tracking our social and environmental performance.
Deep Community Roots
Over the past decade, we have provided more than HK$207m in donations and community sponsorships – including about HK$30m in 2010 – to support various educational, environmental, social welfare and sports development programmes.
We also give back through volunteer service, with members of staff and their family members collectively spending about 20,000 hours to serve the community in 2010. The Bank organised more than 100 volunteer activities – including craft and cooking workshops for underprivileged children, festive lunches for the elderly, and environmental and conservation activities.
We are a long-term supporter of The Community Chest of Hong Kong, which provides funding for 148 charities in Hong Kong, making more than HK$28m in donations over the past decade. Matching staff contributions on a dollar-for-dollar basis, we raised about HK$1.2m for The Chest’s annual Dress Special Day campaign in 2010.
Our e-Donation channel makes it easier for customers to offer financial support to those in need, with about HK$2.4m in donations reaching 60 charitable organisations in Hong Kong via this online service in 2010. More than HK$19m has been donated to deserving causes since the service was launched in December 2001.
Bank staff and their families gave about 20,000 hours in volunteer service.
ANNUAL REPORT 2010 27

Leadership Through Education
With our desire to contribute to a better future for our communities, we place a strong emphasis on youth development programmes. In 2010, we allocated over HK$6m to educational initiatives.
Since 1995, we have given out more than HK$54m under various scholarship schemes, providing financial support for about 1,500 outstanding students from Hong Kong and mainland China – including 190 in 2010.
We worked with the Hong Kong Federation of Youth Groups to produce the ‘Hang Seng Bank Leaders to Leaders Lecture Series’, which gives secondary school children the chance to engage in direct dialogue with prominent community and business leaders. With the theme of ‘Hong Kong Today – Pass on the Wonders of Hong Kong’, over 300 students took part in each of the 10 lectures organised under the series.
Designed to help raise awareness about crime-related issues and reduce criminal activity among young people, the biennial ‘Hang Seng Bank – Help the Police Fight Youth Crime Competition’ received a record 140,000 entries in 2010.
We continued to sponsor the Ming Pao Student Reporter Programme, which uses media training activities to improve participants’ critical thinking and language skills as well as promote a better understanding of current affairs.
In collaboration with The Pathways Foundation, we helped children with specific learning disabilities and attention deficit/hyperactivity disorders explore their potential and alternative ways of learning through a programme of after-school activities and family workshops.
HANG SENG BANK28
CORPORATE RESPONSIBILITY
In partnership with the Regeneration Society, we promoted the importance of positive life values and attitudes through the Hang Seng Bank Regeneration Society Top Ten Regeneration Warriors Competition, which highlighted the stories of 10 ‘Regeneration Warriors’ who had overcome chronic illness to live rewarding lives.
The arts enrich communities by providing a variety of channels through which to express and exchange different social, cultural and philosophical ideas. Since 2007, our sponsorship of various student ticket schemes has helped open up access to artistic performances for more than 45,000 young people.
Providing Sporting Inspiration
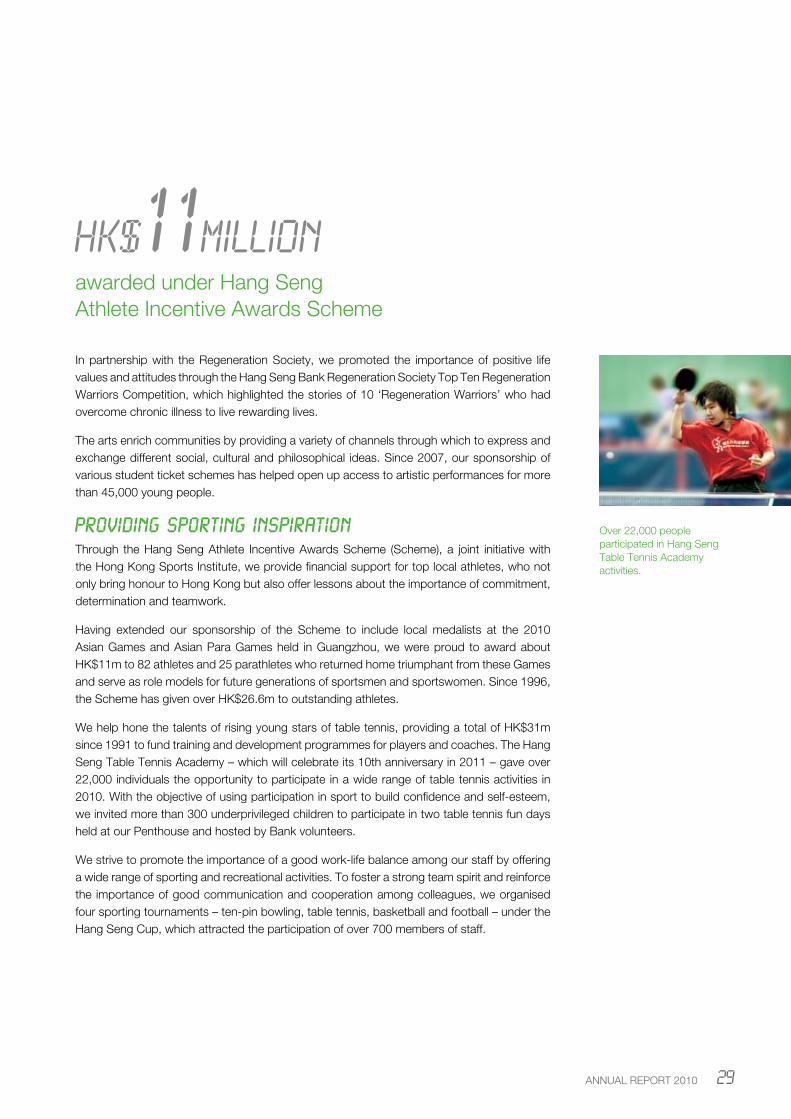
Through the Hang Seng Athlete Incentive Awards Scheme (Scheme), a joint initiative with the Hong Kong Sports Institute, we provide financial support for top local athletes, who not only bring honour to Hong Kong but also offer lessons about the importance of commitment, determination and teamwork.
Having extended our sponsorship of the Scheme to include local medalists at the 2010 Asian Games and Asian Para Games held in Guangzhou, we were proud to award about HK$11m to 82 athletes and 25 parathletes who returned home triumphant from these Games and serve as role models for future generations of sportsmen and sportswomen. Since 1996, the Scheme has given over HK$26.6m to outstanding athletes.
We help hone the talents of rising young stars of table tennis, providing a total of HK$31m since 1991 to fund training and development programmes for players and coaches. The Hang Seng Table Tennis Academy – which will celebrate its 10th anniversary in 2011 – gave over 22,000 individuals the opportunity to participate in a wide range of table tennis activities in 2010. With the objective of using participation in sport to build confidence and self-esteem, we invited more than 300 underprivileged children to participate in two table tennis fun days held at our Penthouse and hosted by Bank volunteers.
We strive to promote the importance of a good work-life balance among our staff by offering a wide range of sporting and recreational activities. To foster a strong team spirit and reinforce the importance of good communication and cooperation among colleagues, we organised four sporting tournaments – ten-pin bowling, table tennis, basketball and football – under the Hang Seng Cup, which attracted the participation of over 700 members of staff.
HK$11millionawarded under Hang Seng Athlete Incentive Awards Scheme
Over 22,000 people participated in Hang Seng Table Tennis Academy activities.
ANNUAL REPORT 2010 29

We allocated over HK$6 million to educational initiatives.
A Green Bank
We operate our business in an environmentally responsible manner. We are working to reduce the negative environmental impacts of our own operations and participate in activities that positively influence the environmental practices of our staff, customers and the wider community.
Our Environmental Management Committee implements and monitors our environmental system. We achieved ISO 14001 compliance at our headquarters building in 2005 – making us the first local financial institution in Hong Kong to receive such accreditation – and have since attained certification for our Hang Seng Tower and MegaBox offices and all our street-level bank branches. We have been carbon neutral since 2007.
In October, staff volunteers travelled to Yunnan province to inspect a Bank-sponsored project organised by The Conservancy Association, under which 600 biogas toilets are providing renewable energy to about 2,400 people in local villages – saving approximately 1,500 tonnes of firewood per year (equivalent to about 375 acres of forest) and cutting annual carbon dioxide emissions by 7,500 tons. The Bank has now sponsored the construction of 1,100 biogas toilets in Yunnan, benefitting more than 4,600 people.
Launched jointly with the Federation of Hong Kong Industries, the Hang Seng Pearl River Delta Environmental Awards (Awards) are part of our commitment to working with the business community on environmental issues. By recognising the green achievements of participants, the Awards encourage manufacturing companies in Hong Kong and the Pearl River Delta region to enhance their environmental performance. The 144 companies that took part in the 2009/10 Awards submitted a total of 555 environmental projects – a 40% increase on the previous year. The collective impact of the projects includes reducing waste by about 140,000 tons and cutting electricity consumption by over 97 million kWh.
HANG SENG BANK30
CORPORATE RESPONSIBILITY

Other ways in which we are working with stakeholders to reduce the consumption of resources is through our e-Statement and e-InvestAdvice services, under which customers can choose to receive account statements and various investment notices in electronic rather than paper format. By the end of 2010, subscribers to the e-Statement service were up 30.3% compared with a year earlier at over 435,000 and customers using the e-InvestAdvice service had increased by 42.8% to more than 90,000 – collectively saving over 24 million sheets of paper a year.
As part of a three-year partnership with Friends of the Earth (HK), we planted 10,000 trees in Tuen Mun in 2010 and are helping to maintain the reforestation site. During The Conservancy Association’s Tree-Caring Day, staff volunteers and their families helped tidy up a Bank-sponsored reforestation site in Ma On Shan. Since 1999, we have facilitated the planting of 70,000 trees in country parks in Hong Kong.
We are playing our part in helping to conserve biodiversity. We comply with the sustainability principles set out in the WWF Hong Kong’s Seafood Guide. We stopped serving shark’s fin at Bank functions in 2003, and have since extended this policy to include endangered reef fish species and black moss.
We recycled more than 15,200 toner cartridges and over 2,800 items of computer equipment in 2010. We promoted green messages to staff through various channels, including talks, training, newsletters and in-house broadcasts, and environmentally themed outings. We continued our tradition of making a donation to charity in lieu of sending Christmas cards.
Social and environmental considerations are an important element of our financing decisions. We include environmental factors in our credit assessments and support the Equator Principles, which address sustainability risks in project financing. We also follow sector-specific guidelines for financing activities in ecologically sensitive industry sectors. We are a participant in the Carbon Disclosure Project, which provides a forum for the world’s largest institutional investors to collectively consider the business implications of climate change.
Environmental Performance
2010 2009 2008 2007 20062010 vs
2009 (%)2010 vs
2008 (%)
Greenhouse gas emissions per person* (tons CO2 /FTE) 3.01 3.13 3.28 3.30 3.30 -3.76% -8.16%
Greenhouse gas emissions per m2* (tons CO2 /m2) 0.17 0.17 0.20 0.20 0.20 -1.50% -16.28%
Greenhouse gas emissions* (kilotons CO2) 23.97 24.52 27.40 26.70 25.30 -2.26% -12.54%
Electricity consumption (GWh) 35.32 36.50 38.10 35.90 34.10 -3.24% -7.30%
Gas consumption (GWh) 0.39 0.40 0.42 0.70 0.82 -1.36% -6.06%
Water consumption (000 m3) 71.16# 55.85 50.80 54.10 70.40 27.40% 40.07%
IT/electrical waste recycled (tons) 50.84 85.03 64.90 59.00 41.70 -40.21% -21.66%
Data coverage: Hang Seng Bank’s Hong Kong operations
* Hang Seng Bank’s Hong Kong operations have been carbon neutral since 2007.# The rise is largely due to the installation of water-cooled chillers for the air-conditioning system at the Bank’s headquarters building, which has led to a reduction in
electricity consumption.
Key:
FTE: Full-time equivalent m2: Square metres m3: Cubic metres CO2: Carbon dioxide GWh: Gigawatt hours
We organised more than 100 volunteer activities.
ANNUAL REPORT 2010 31

Hang Seng is committed to high standards of corporate governance with a view to safeguarding the interests of shareholders, customers, staff and other stakeholders. The Bank has followed the module on “Corporate Governance of Locally Incorporated Authorised Institutions” under the Supervisory Policy Manual issued by the Hong Kong Monetary Authority (“HKMA”) and has fully complied with all the code provisions and most of the recommended best practices as set out in the Code on Corporate Governance Practices contained in Appendix 14 of the Rules Governing the Listing of Securities on The Stock Exchange of Hong Kong Limited (the “Listing Rules”) throughout the year. The Bank also keeps its corporate governance framework under constant review to ensure that it is in line with international and local best practices.
BOARD OF DIRECTORS
The Board has collective responsibility for leadership and control of, and for promoting the success of, the Bank by directing and supervising the Bank’s affairs.
The types of decisions which are to be taken by the Board include those relating to :
– five-year strategic plan;
– annual operating plans and performance targets;
– annual and interim results;
– risk appetite;
– internal control and risk management framework;
– specified senior appointments;
– acquisitions and disposals above predetermined thresholds; and
– substantial changes to balance sheet management policies.
Chairman and Chief Executive
The roles of Chairman of the Board and Chief Executive of the Bank are segregated, with a clear division of responsibilities. The Chairman of the Board is an Independent Non-executive Director who is responsible for the leadership and effective running of the Board. The Chief Executive is an Executive Director who exercises all the powers, authorities and discretions of the Executive Committee as may be delegated to her in respect of the Bank and its subsidiaries.
Board Composition
As at the date of this Annual Report, the Board comprises 15 Directors, of whom two are Executive Directors and 13 are Non-executive Directors. Of the 13 Non-executive Directors, eight are Independent Non-executive Directors. There is a strong independent element on the Board, to ensure the independence and objectivity of the Board’s decision-making process as well as the thoroughness and impartiality of the Board’s oversight of the Management.
All the Independent Non-executive Directors meet the guidelines for assessment of independence as set out in Rule 3.13 of the Listing Rules. The Bank has also received from each of the Independent Non-executive Directors an annual confirmation of his/her independence.
Members of the Board, who come from a variety of different backgrounds, have a diverse range of business, banking and professional expertise. Brief biographical particulars of all the Directors, together with information relating to the relationship among them, are set out in the section “Biographical Details of Directors” in this Annual Report.
Board Process
Regular Board/Board Committee meeting schedules for each year are made available to all Directors/Board Committee members before the end of the preceding year. In addition, notice of meetings will be given to all Directors at least 14 days before each Board meeting.
Other than regular Board meetings, the Chairman also met with Non-executive Directors, including Independent Non-executive Directors, without the presence of Executive Directors, to facilitate an open and frank discussion among the Non-executive Directors on issues relating to the Bank.
Meeting agendas for regular Board meetings are set after consultation with the Chairman and the Chief Executive. All Directors are given an opportunity to include matters in the agenda. Regular reports include the Bank’s financial performance, strategic plan, risk appetite, and review of internal control and risk management framework; as well as the large credit exposures and connected lending of the Bank and its subsidiaries.
HANG SENG BANK32
CORPORATE GOVERNANCE AND OTHER INFORMATION

Minutes of Board/Board Committee meetings with details of the matters discussed by the Board/Board Committee and decisions made, including any concerns or views of the Directors/Board Committee members, are kept by the Company Secretary and are open for inspection by Directors/Board Committee members.
During 2010, the important matters discussed at the Board meetings included:
– acquisition of headquarters premises in Shanghai by Hang Seng Bank (China) Limited;
– the Bank’s internal capital adequacy assessment process;
– review of the Bank’s remuneration policy and remuneration system;
– the Bank’s strategy for RMB business;
– the Bank’s strategy for recruitment, retention and development of talents;
– capital management plan;
– appointments of Directors and senior management; and
– pay review for 2010 and variable incentive pool for 2009.
The Board reviews and evaluates its work process and effectiveness annually, with a view to identifying areas for improvement and further enhancement.
All Directors have access to the Executive Directors as and when they consider necessary. They also have access to the Company Secretary who is responsible for ensuring that the Board procedures, and related rules and regulations, are followed.
Under the Articles of Association of the Bank, a Director shall not vote or be counted in the quorum in respect of any contract, arrangement, transaction or other proposal in which he/she or his/her associate(s), is/are materially interested.
Appointment, Re-election and Removal
The Bank’s Articles of Association provide that each Director is required to retire by rotation once every three years and that one-third (or the number nearest to one-third) of the Directors shall retire from office every year at the Bank’s Annual General Meeting. A Director’s specific term of appointment, therefore, cannot exceed three years. Retiring Directors are eligible for re-election at Annual General Meetings of the Bank.
The Bank uses a formal, considered and transparent procedure for the appointment of new Directors. Before a prospective Director’s name is formally proposed, opinions of the existing Directors (including the Independent Non-executive Directors) will be solicited. The appointment will be considered and if thought fit, approved by the Board after due deliberation. In accordance with the requirement under the Banking Ordinance, approval from HKMA will also be obtained. All new Directors are subject to election by shareholders of the Bank at the next Annual General Meeting after their appointments have become effective.
Four new Directors have been appointed since 2010 Annual General Meeting, namely, Ms L Y Chiang, Ms Sarah C Legg, Mr Mark S McCombe and Mr Michael W K Wu. The aforesaid Directors will all stand for election by the Bank’s shareholders at the Bank’s Annual General Meeting to be held on 13 May 2011.
Responsibilities of Directors
The Bank regularly reminds all Directors of their role and responsibilities. Through regular Board meetings, all Directors are kept abreast of the conduct, business activities and development of the Bank.
Induction programmes on the following key areas are arranged for newly appointed Directors:
– the Bank’s business operations in Hong Kong, including personal financial services, corporate and commercial banking, treasury and investment services;
– the Bank’s business operations on the Mainland; and
– the Bank’s financial control, risk management, internal audit, compliance, information technology and support, and human resources.
All Directors are given opportunities to update and develop their skills and knowledge.
All Directors have full and timely access to all relevant information about the Bank so that they can discharge their duties and responsibilities as Directors. There are established procedures for Directors to seek independent professional advice on matters relating to the Bank where appropriate. All costs associated with obtaining such advice will be borne by the Bank. In addition, each Director has separate and independent access to the Bank’s senior management.
ANNUAL REPORT 2010 33

The Bank has adopted a Code for Securities Transactions by Directors on terms no less exacting than the required standards as set out in the Model Code for Securities Transactions by Directors of Listed Issuers (as set out in Appendix 10 to the Listing Rules). Specific enquiries have been made with all Directors who have confirmed that they have complied with the Bank’s Code for Securities Transactions by Directors throughout the year of 2010.
Appropriate Directors’ liability insurance cover has also been arranged to indemnify the Directors for liabilities arising out of corporate activities. The coverage and the sum insured under the policy are reviewed annually.
The interests in Group securities, including securities relating to HSBC Holdings plc and the Bank, held by the Directors as at
31 December 2010 are disclosed in the Report of the Directors as set out in this Annual Report.
DELEGATION BY THE BOARD
Board Committees
The Board has set up three committees, namely, the Executive Committee, the Audit Committee and the Remuneration Committee, to assist it in carrying out its responsibilities.
Each of these committees has specific written terms of reference which set out in detail their respective authorities and responsibilities. All committees, except the Executive Committee, are comprised solely of Independent Non-executive Directors. All committees report back to the Board on their decisions or recommendations on a regular basis.
BOARD
Executive Committee Audit Committee Remuneration Committee
Members: Mrs Margaret Leung (Chairman)
Members: Dr Eric K C Li (Chairman)
Members: Dr John C C Chan (Chairman)
Mr William W Leung Mr Richard Y S Tang Mr Jenkin Hui
Mr Andrew H C Fung Dr Marvin K T Cheung Dr Raymond K F Ch’ien
Mr David W H Tam
Mr Andrew W L Leung
Mr Christopher H N Ho
Mr Nixon L S Chan
Executive Committee
The Executive Committee meets at least once each month and operates as a general management committee under the direct authority of the Board. It exercises the powers, authorities and discretions as delegated by the Board in so far as they concern the management and day-to-day running of the Bank in accordance with its terms of reference and such other policies and directives as the Board may determine from time to time. The Executive Committee also sub-delegates credit, investment and capital expenditure authorities to its members and senior executives.
To further enhance the Bank’s risk management framework and in line with best practices, the Bank has set up a Risk Management Committee to centralise the risk management oversight function of the Bank and its subsidiaries. The Risk
Management Committee reports directly to the Executive Committee. Its main functions are to review, analyse, evaluate, recognise and manage various risks of the Bank, including all the eight types of risks stipulated in the Supervisory Policy Manual of HKMA, namely, credit risk, market risk, liquidity risk, interest rate risk, operational risk, legal and compliance risk, reputation risk and strategic risk. In addition, the Risk Management Committee also covers insurance risk, pension risk and sustainability risk, and is responsible for approval of all risk management related policies.
Audit Committee
The Audit Committee meets at least four times a year, with the Bank’s senior executives (including, but not limited to, the Chief Financial Officer, the Chief Risk Officer, the Chief Credit Officer, the Chief Compliance Officer and the Head of Audit)
HANG SENG BANK34
CORPORATE GOVERNANCE AND OTHER INFORMATION

and representatives of the external auditor, to consider, among other things, the Bank’s financial reporting, the nature and scope of audit reviews, and the effectiveness of the systems of internal control and compliance. It is also responsible for the appointment, reappointment, removal and remuneration of the Bank’s external auditor. Further, given the importance of risk management to the business and operations of a financial institution, the scope of responsibilities of the Audit Committee has recently been expanded to cover risk management oversight. As such, the Audit Committee will also review the Bank’s risk appetite, tolerance and strategy, and the effectiveness of the Bank’s risk management framework.
The Audit Committee reports to the Board following each Audit Committee meeting, drawing the Board’s attention to salient points that the Board should be aware of, identifying any matters in respect of which it considers that action or improvement is needed and making relevant recommendations.
The Audit Committee held five meetings in 2010. The major work performed by the Committee during 2010 included:
– reviewing the Bank’s financial statements for the year ended 31 December 2009 and the related documents, and the management letter and audit issues noted by the Bank’s external auditor;
– reviewing the Bank’s interim financial statements for the six months ended 30 June 2010 and the related documents, and the issues noted by the Bank’s external auditor;
– reviewing essential matters or reports relating to financial control, internal audit, credit, compliance and internal control, and discussing the same with the Management;
– reviewing risk-related matters including the Bank’s risk management framework, risk maps, and balance sheet management position;
– reviewing regulatory review reports and internal audit reports, and discussing the same with the Management and Head of Audit;
– reviewing the revised accounting standards and prospective changes to accounting standards, and the impact on the Bank’s financial reporting;
– reviewing the internal audit plan for 2011 and monitoring the staffing and resources of the Bank’s internal audit function;
– reviewing the remuneration and engagement letters of the Bank’s external auditor, and its objectivity and independence;
– reviewing the adequacy of resources, qualifications and experience of the staff of the accounting and financial reporting function of the Bank, and their training programme and budget;
– reviewing the implementation progress of Sarbanes-Oxley Act;
– reviewing the implementation and effectiveness of the Policy for the Reporting of Improprieties;
– reviewing the terms of reference of the Audit Committee for the purpose of expanding its role and responsibilities to cover risk management oversight; and
– exercising oversight over the audit committees of the Bank’s principal subsidiaries.
The Audit Committee meets with the representatives of the Bank’s external auditor and Head of Audit on a regular basis and also meets with them without the presence of the Management at least once a year. Further, the Committee meets with the representatives of HKMA to maintain a regular dialogue with the regulator and to share HKMA’s general views on their supervisory focus.
In order to identify areas for further improvements, the Audit Committee conducts an annual gap analysis as regards the effective discharge of its role and responsibilities under its terms of reference.
Remuneration Committee
The Remuneration Committee meets at least twice a year to consider human resources issues and make recommendations to the Board on, among others, the Bank’s policy and structure for all remuneration and fees of Directors, senior management and key personnel in order to attract, motivate and retain quality personnel. The Committee will also review annually and independently of the Management, the adequacy and effectiveness of the Bank’s remuneration policy and its implementation to ensure that the Bank’s remuneration policy is consistent with regulatory requirements and promote effective risk management.
In determining the bank-wide remuneration policy, the Remuneration Committee will take into account the Bank’s business objective, people strategy, short-term and long-term performance, business and economic environment conditions, market practices and risk management needs, in order to ensure the remuneration aligns with business and individual performances, promotes effective risk management, facilitates retention of quality personnel and is competitive in the market. The Committee may invite any Director, executive, consultant or other relevant party to provide advice in this respect.
ANNUAL REPORT 2010 35

The Remuneration Committee held two meetings in 2010. The major work performed by the Committee during 2010 included:
– reviewing the fees payable to the Directors and Board Committee Chairmen/members of the Bank and its subsidiaries;
– reviewing the remuneration packages of the Executive Directors and senior management of the Bank; and the Chief Executive of Hang Seng Bank (China) Limited;
– reviewing the proposed variable incentive pool for 2009;
– reviewing the pay review proposal for 2010;
– determining the proposed revisions of certain senior executives’ remuneration packages of the Bank; and
– conducting independent review of the Bank’s remuneration system.
In order to identify areas for further improvements, the Remuneration Committee conducts an annual gap analysis as regards the effective discharge of its role and responsibilities under its terms of reference.
Attendance Records
The attendance records of Board and Board Committee meetings are set out in the following table:
Meetings held in 2010
2010 AGM BoardExecutive
CommitteeAudit
CommitteeRemuneration
CommitteeNumber of Meetings 1 7 12 5 2
DirectorsDr Raymond K F Ch’ien* (Chairman) Note 1 1/1 7/7 N/AMrs Margaret Leung (Vice-Chairman and Chief Executive)
1/1 7/7 12/12
Dr John C C Chan* 1/1 7/7 2/2Dr Marvin K T Cheung* 1/1 6/7 5/5Ms L Y Chiang* Note 2 N/A 1/1Mr Alexander A Flockhart# Note 3 0/1 4/7Mr Jenkin Hui* 1/1 7/7 2/2Ms Sarah C Legg# Note 4 N/A N/AMr William W Leung 1/1 7/7 11/12Dr Eric K C Li* 1/1 5/7 5/5Dr Vincent H S Lo# 1/1 6/7Mr Iain J Mackay# Note 3 1/1 6/7Mr Mark S McCombe# Note 4 N/A N/AMrs Dorothy K Y P Sit# 1/1 7/7Mr Richard Y S Tang* 1/1 7/7 5/5Mr Peter T S Wong# 1/1 5/7Mr Michael W K Wu* Note 2 N/A 1/1
Senior ExecutivesMr Andrew H C Fung 12/12Mr Nixon L S Chan 11/12Mr Christopher H N Ho 11/12Mr Andrew W L Leung 12/12Mr David W H Tam 8/12
Average Attendance Rate 92% 90% 92% 100% 100%
* Independent Non-executive Directors# Non-executive DirectorsNote 1 Dr Raymond K F Ch’ien was appointed as a member of the Remuneration Committee with effect from 5 November 2010.Note 2 Ms L Y Chiang and Mr Michael W K Wu were appointed as Independent Non-executive Directors with effect from 20 September 2010.Note 3 Mr Alexander A Flockhart and Mr Iain J Mackay resigned from the Board with effect from 31 December 2010.Note 4 Ms Sarah C Legg and Mr Mark S McCombe were appointed as Non-executive Directors with effect from 14 February 2011.
HANG SENG BANK36
CORPORATE GOVERNANCE AND OTHER INFORMATION
REMUNERATION OF DIRECTORS, SENIOR
MANAGEMENT AND KEY PERSONNEL
The Bank’s policy on remuneration is to maintain fair and competitive packages based on business needs and industry practice.
The level of fees paid to Non-executive Directors is determined by reference to factors including fees paid by comparable institutions, and Directors’ workload and commitments.
The following factors are considered when determining the remuneration packages of Executive Directors:
– business needs;
– general economic situation;
– changes in appropriate markets such as supply/demand fluctuations and changes in competitive conditions;
– individual contributions to results as confirmed in the performance appraisal process; and
– retention consideration and individual potential.
No individual Director will be involved in decisions relating to his/her own remuneration.
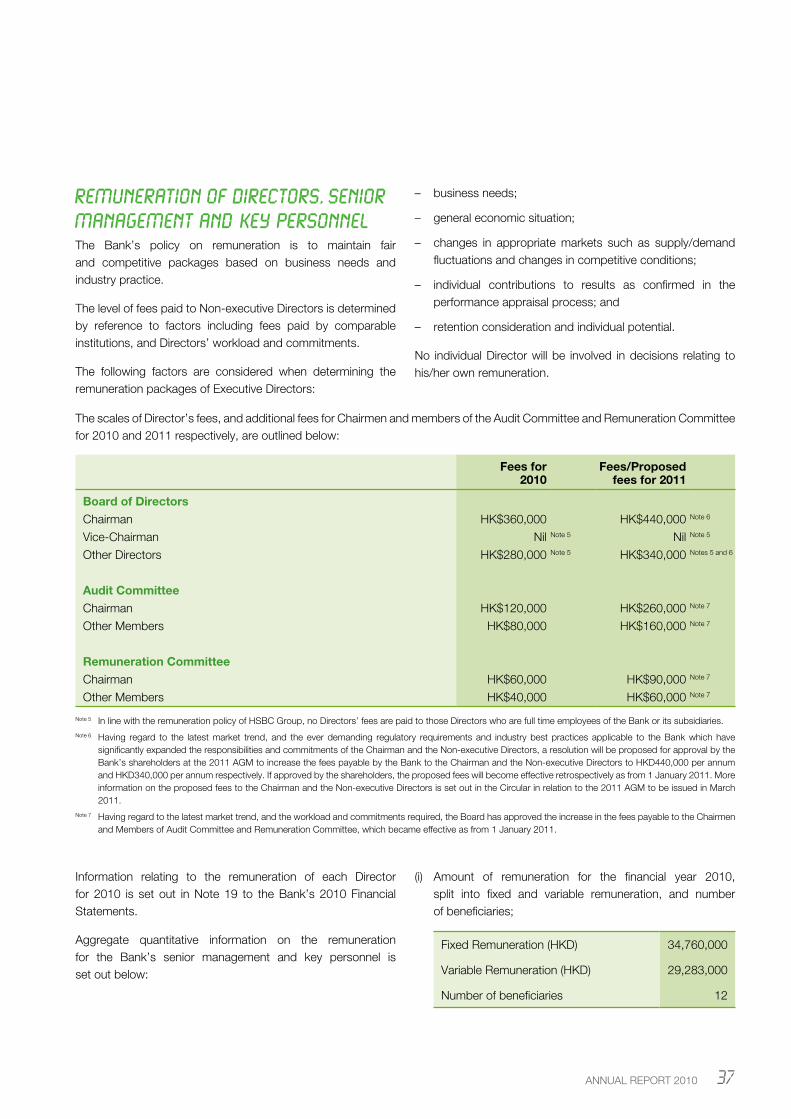
The scales of Director’s fees, and additional fees for Chairmen and members of the Audit Committee and Remuneration Committee for 2010 and 2011 respectively, are outlined below:
Fees for 2010
Fees/Proposed fees for 2011
Board of DirectorsChairman HK$360,000 HK$440,000 Note 6
Vice-Chairman Nil Note 5 Nil Note 5
Other Directors HK$280,000 Note 5 HK$340,000 Notes 5 and 6
Audit CommitteeChairman HK$120,000 HK$260,000 Note 7
Other Members HK$80,000 HK$160,000 Note 7
Remuneration CommitteeChairman HK$60,000 HK$90,000 Note 7
Other Members HK$40,000 HK$60,000 Note 7
Note 5 In line with the remuneration policy of HSBC Group, no Directors’ fees are paid to those Directors who are full time employees of the Bank or its subsidiaries.Note 6 Having regard to the latest market trend, and the ever demanding regulatory requirements and industry best practices applicable to the Bank which have
significantly expanded the responsibilities and commitments of the Chairman and the Non-executive Directors, a resolution will be proposed for approval by the Bank’s shareholders at the 2011 AGM to increase the fees payable by the Bank to the Chairman and the Non-executive Directors to HKD440,000 per annum and HKD340,000 per annum respectively. If approved by the shareholders, the proposed fees will become effective retrospectively as from 1 January 2011. More information on the proposed fees to the Chairman and the Non-executive Directors is set out in the Circular in relation to the 2011 AGM to be issued in March 2011.
Note 7 Having regard to the latest market trend, and the workload and commitments required, the Board has approved the increase in the fees payable to the Chairmen and Members of Audit Committee and Remuneration Committee, which became effective as from 1 January 2011.
Information relating to the remuneration of each Director for 2010 is set out in Note 19 to the Bank’s 2010 Financial Statements.
Aggregate quantitative information on the remuneration for the Bank’s senior management and key personnel is set out below:
(i) Amount of remuneration for the financial year 2010, split into fixed and variable remuneration, and number of beneficiaries;
Fixed Remuneration (HKD) 34,760,000
Variable Remuneration (HKD) 29,283,000
Number of beneficiaries 12
ANNUAL REPORT 2010 37

(ii) Amounts and form of variable remuneration for the financial year 2010, split into cash, shares and share-linked instruments and other instruments (if any);
Variable Remuneration in Cash (HKD) (a) 16,170,000
Variable Remuneration in Shares (HKD) (b) 13,113,000
Variable Remuneration (HKD) (a) + (b) 29,283,000
(iii) Amount of deferred remuneration during the financial year 2010 was HKD13,113,000. The aforesaid relates to share awards (variable remuneration) granted and unvested in 2010. According to the terms of the share scheme, the shares awarded have a vesting period of three years, commencing from the first anniversary of the date of award;
(iv) As mentioned in item (iii) above, the share awards were unvested in the financial year 2010. Accordingly, there was no deferred remuneration awarded during 2010 being paid out or reduced through performance adjustment; and
(v) No senior management or key personnel has been awarded with new sign-on or severance payment during the financial year 2010.
ACCOUNTABILITY AND AUDIT
Financial Reporting
The Board aims at making a balanced, clear and comprehensive assessment of the Bank’s performance, position and prospects. An annual operating plan is reviewed and approved by the Board on a yearly basis. Reports on financial results, business performance and variances against the approved annual operating plan are submitted to the Board for regular discussion and monitoring at Board meetings.
Strategic planning cycles are generally from three to five years. The Bank’s strategic plan for 2008 to 2012, following an interim review and adjustments, was reviewed by the Board in December 2009. Progress on the implementation of the strategic plan was reported to and reviewed by the Board on a regular basis.
The annual and interim results of the Bank are announced in a timely manner within the limits of three months and two months respectively after the end of the relevant year or period.
The Directors acknowledge their responsibilities for preparing the accounts of the Bank. As at 31 December 2010, the Directors were not aware of any material uncertainties relating to events or conditions which may cast significant doubt upon the Bank’s ability to continue as a going concern. Accordingly, the Directors have prepared the financial statements of the Bank on a going-concern basis.
The responsibilities of the external auditor with respect to financial reporting are set out in the Independent Auditor’s Report attached to the Bank’s 2010 Financial Statements.
Internal Controls
System and Procedures
The Board is responsible for internal control at the Bank and its subsidiaries and for reviewing its effectiveness.
The Bank’s internal control system comprises a well-established organisational structure and comprehensive policies and standards. Areas of responsibilities for each business and functional unit are clearly defined to ensure effective checks and balances.
Procedures have been designed for safeguarding assets against unauthorised use or disposition; for maintaining proper accounting records; and for ensuring the reliability of financial information used within the business or for publication. The procedures provide reasonable but not absolute assurance against material errors, losses or fraud. Procedures have also been designed to ensure compliance with applicable laws, rules and regulations.
Systems and procedures are in place in the Bank to identify, control and report on the major types of risks the Bank faces. Business and functional units are responsible for the assessment of individual types of risk arising under their areas of responsibilities, the management of the risks in accordance with risk management procedures and reporting on risk management. The Board maintains an effective risk management framework through the Risk Management Committee which reports to the Executive Committee by setting up of specialised management committees for supervision of major risk areas and the establishment of risk management departments for relevant functions of the Bank. The scope of responsibilities of the Audit Committee has also been recently expanded to cover risk management oversight. The relevant risk management reports are submitted to Asset and Liability
HANG SENG BANK38
CORPORATE GOVERNANCE AND OTHER INFORMATION

Management Committee, Risk Management Committee, Executive Committee and Audit Committee, and ultimately to the Board for monitoring the respective types of risk. The Bank’s risk management policies and major control limits are approved by the Board or its delegated committees, and are monitored and reviewed regularly according to established procedures of the Bank.
More detailed discussions on the policies and procedures for management of each of the major types of risk the Bank faces, including credit, market, liquidity and operational risks, are included in the risk management section of the “Financial Review” under the Bank’s 2010 Annual Report, and in Note 61 to the Bank’s 2010 Financial Statements.
Annual Assessment
A review of the effectiveness of the Bank’s internal control system covering all controls, including financial, operational and compliance, and risk management controls, is conducted annually. The review at the end of 2010 was conducted with reference to the COSO (The Committee of Sponsoring Organisations of the Treadway Commission) internal control framework, which assesses the Bank’s internal control system against the five elements of control environment, risk assessment, control activities, communication and monitoring. The Bank has also conducted an annual review to assess the adequacy of resources, qualifications and experience of staff of the Bank’s accounting and financial reporting function, and their training programmes and budget. The approach, findings, analysis and results of these annual reviews have been reported to the Audit Committee and the Board.
Framework for Disclosure of Price Sensitive Information
The Bank has put in place a robust framework for the disclosure of price-sensitive information in compliance with the Listing Rules and other regulatory requirements in this respect. The framework sets out the procedures and internal controls for the handling and dissemination of price-sensitive information in a timely manner so as to allow the shareholders, customers, staff and other stakeholders to apprehend the latest position of the Bank and its subsidiaries. The framework and its effectiveness are subject to review on a regular basis according to established procedures.
Internal Audit
The internal audit function plays an important role in the Bank’s internal control framework. It monitors the effectiveness of internal control procedures and compliance with policies and standards across all business and functional units. All management letters from external auditor and reports from regulatory authorities will be reviewed by the Audit Committee and all recommendations will be implemented. The Management is required to provide the internal audit function with an annual written confirmation that it has acted fully on all recommendations made by external auditor and regulatory authorities. The internal audit function also advises the Management on operational efficiency and other risk management issues. The work of the internal audit function is focused on areas of greatest risk to the Bank as determined by risk assessment. The Bank’s Head of Audit reports to the Chairman and the Audit Committee.
External Auditor
KPMG is the Bank’s external auditor. The Audit Committee is responsible for making recommendations to the Board on the appointment, reappointment, removal and remuneration of the external auditor. The external auditor’s independence and objectivity are also reviewed and monitored by the Audit Committee on a regular basis.
During 2010, fees paid to the Bank’s external auditor for audit services amounted to HK$13.3m, compared with HK$13.4m in 2009. For non-audit services, the fees paid to the Bank’s external auditor amounted to HK$5.8m, compared with HK$5.6m in 2009. In 2010, the significant non-audit service assignments covered by these fees include the following:
Nature of serviceFees paid
(HK$m)
Other assurance services 5.7
Tax services 0.1
5.8
Audit Committee
The Audit Committee assists the Board in meeting its responsibilities for ensuring effective systems of risk management, internal control and compliance, and in meeting its financial reporting obligations.
ANNUAL REPORT 2010 39

COMMUNICATION WITH SHAREHOLDERS
Effective Communication
The Bank attaches great importance to communication with shareholders. To this end, a number of means are used to promote greater understanding and dialogue with the investment community. The Bank holds group meetings with analysts in connection with the Bank’s annual and interim results. The results announcements are also broadcast live via webcast. Apart from the above, designated senior executives maintain regular dialogue with institutional investors and analysts to keep them abreast of the Bank’s development, subject to compliance with the applicable laws and regulations. Including the two results announcements, a total of 95 meetings with 308 analysts and fund managers from 222 companies were held in 2010. In addition, the Bank’s Vice-Chairman and Chief Executive; and Chief Financial Officer also made presentations and held group meetings with investors at investor forums in Hong Kong and overseas.
Further, the Bank’s website (www.hangseng.com) contains an investor relations section which offers timely access to the Bank’s press releases and other business information. For efficient communication with shareholders and in the interest of environmental preservation, shareholders are encouraged to browse the Bank’s corporate communications on the Bank’s website, in the place of receiving printed copies of the same.
The Annual General Meeting provides a useful forum for shareholders to exchange views with the Board. The Bank’s Chairman, Executive Directors, Chairmen of the Board Committees and Non-executive Directors are available at the Annual General Meeting to answer questions from shareholders. Separate resolutions are proposed at general meetings for each substantial issue, including the re-election and election (as the case may be) of individual Directors. An explanation of the detailed procedures of conducting a poll will be provided to shareholders at the commencement of the Annual General Meeting, to ensure that shareholders are familiar with such procedures.
The Bank’s last Annual General Meeting was held on Friday, 14 May 2010 at Hang Seng Bank Headquarters, 83 Des Voeux Road Central, Hong Kong. All the resolutions proposed at that meeting were approved by the shareholders by poll voting. Details of the poll results are available under the investor relations section of the Bank’s website at www.hangseng.com.
The next Annual General Meeting will be held on Friday, 13 May 2011, the notice of which will be sent to shareholders at least 20 clear business days before the said meeting. Shareholders may refer to the section “Corporate Information and Calendar” in this Annual Report for information on other important dates for shareholders in year 2011.
OTHER INFORMATION
The Annual and Interim Reports contain comprehensive information on business strategies and developments. Discussions and analyses of the Bank’s performance during 2010 and the material factors underlying its results and financial position can be found in the sections “Business in Hong Kong”, “Business on the Mainland” and “Financial Review” in this Annual Report.
Material Related Party Transactions and Contracts of Significance
The Bank’s material related party transactions are set out in Note 60 to the 2010 Financial Statements. These transactions include those that the Bank has entered into with its immediate holding company and fellow subsidiary companies in the ordinary course of its interbank activities, including the acceptance and placement of interbank deposits, corresponding banking transactions, off-balance sheet transactions, and the provision of other banking and financial services.
The Bank uses the information technology services of, and shares an automated teller machine network with, The Hongkong and Shanghai Banking Corporation Limited, its immediate holding company. The Bank also shares information technology and certain processing services with fellow subsidiaries on a cost recovery basis. In 2010, the Bank’s share of the costs includes HK$164m for system development, HK$214m for data processing, and HK$168m for administrative services.
HANG SENG BANK40
CORPORATE GOVERNANCE AND OTHER INFORMATION

The Bank maintains a staff retirement benefit scheme for which a fellow subsidiary company acts as insurer and administrator. As part of its ordinary course of business with other financial institutions, the Bank also markets Mandatory Provident Fund products and distributes retail investment funds for fellow subsidiaries, with a fee income of HK$209m and HK$81m respectively in 2010. Hang Seng Investment Management Limited, a wholly owned subsidiary of the Bank, manages in the ordinary course of its business a fund administered by a fellow subsidiary, to which management fee rebates were made. The rebate for 2010 amounted to HK$137m.
These transactions were entered into by the Bank in the ordinary and usual course of business on normal commercial terms, and in relation to those which constituted connected transactions under the Listing Rules, they also complied with applicable requirements under the Listing Rules. The Bank regards its usage of the information technology services of The Hongkong and Shanghai Banking Corporation Limited (amount of information technology services cost incurred for 2010: HK$478m) as contracts of significance for 2010.
Connected Transaction and Continuing Connected Transactions
Connected Transaction
On 20 May 2010, Hang Seng Bank (China) Limited (“HACN”), a wholly-owned subsidiary of the Bank, entered into a sale and purchase agreement with HSBC Bank (China) Company Limited (“HBCN”) and Shanghai Senmao International Real Estate Company Limited. Pursuant to the aforesaid agreement, HACN conditionally agreed to acquire (the “Acquisition”) from HBCN, Unit 101 and the whole of 34th, 35th and 36th Floors (the “Property”) of HSBC Tower (now renamed as Hang Seng Bank Tower) (the “Building”) at 1000 Lujiazui Ring Road, Shanghai, the People’s Republic of China, together with the right to the exclusive use of certain car parking spaces, and the naming right in respect of the Building and the right to put up signages on certain designated places of the Building (collectively the “Naming and Signage Rights”), at a total consideration of RMB510m.
Following the completion of all conditions precedent, the Acquisition was completed on 16 September 2010. The consideration was funded by internal resources of the Group.
HACN would relocate its headquarters to the Property for its long term development and achievement of the China strategies of the Group. The acquisition of the Naming and Signage Rights would serve the dual purposes of enhancing the Group’s corporate profile and image on the Mainland, and signifying its commitment to the mainland market.
The Directors (including the Independent Non-executive Directors) consider that the Acquisition is in the ordinary and usual course of business of the Bank and the terms of the Acquisition are on normal commercial terms, fair and reasonable and in the interests of the Bank and its shareholders as a whole.
HBCN is a wholly-owned subsidiary of HSBC Holdings plc (“HSBC”), the controlling shareholder of the Bank and therefore a connected person of the Bank. Accordingly, the Acquisition constituted a connected transaction for the Bank under the Listing Rules. An announcement relating to the aforesaid was issued by the Bank on 20 May 2010. The Bank has complied with the disclosure requirements in accordance with Chapter 14A of the Listing Rules.
Continuing Connected Transactions
(a) On 22 June 2007, Hang Seng Life Limited (“HSLL”) entered into the following agreements, which expired on 21 June 2010:
(i) A management services agreement (“Previous Management Services Agreement”) for a term of three years with HSBC Life (International) Limited (“INHK”), pursuant to which INHK would continue to provide certain management services, being services relating to risk management, back office processing and administration, development and pricing for selected products, information technology and business recovery, financial control and actuarial services (the “Management Services”), to HSLL to enable HSLL to conduct its life insurance business.
INHK charged HSLL for the provision of the services on a fully absorbed cost basis plus a mark-up of 5%. These charges were determined following negotiation on an arm’s length basis and in accordance with the policy of HSBC Group, which took into account the transfer pricing guidelines of UK and the Organisation for Economic Co-operation and Development (“OECD”).
ANNUAL REPORT 2010 41

(ii) An investment management agreement (“Previous Investment Management Agreement”) for a term of three years with HSBC Global Asset Management (Hong Kong) Limited (formerly known as HSBC Investments (Hong Kong) Limited) (“ISHK”), pursuant to which ISHK would continue to act as investment manager in respect of certain of HSLL’s assets held from time to time to maintain business continuity of HSLL.
HSLL paid to ISHK a fee of between 0.17% and 0.375% per annum of the mean value of the assets under management, which was determined on an arm’s length basis.
HSLL has become a wholly-owned subsidiary of Hang Seng Insurance Company Limited (“HSIC”), which in turn is a wholly-owned subsidiary of the Bank, since September 2007. As part of the plan of the Bank to rationalise its insurance business structure, HSLL’s long term insurance business has been integrated into that of HSIC. Accordingly, all rights and obligations under the agreements entered into between HSLL and the third parties have then been novated to HSIC. These agreements include, among others, the Previous Management Services Agreement and the Previous Investment Management Agreement.
Details of the terms of and the annual caps under the Previous Management Services Agreement and the Previous Investment Management Agreement for the years 2007, 2008 and 2009 were announced by the Bank on 22 June 2007. The Bank has also set the caps under each of the aforesaid agreements for the period from 1 January to 22 June 2010, details of which were announced by the Bank on 18 December 2009.
(b) On 22 June 2010, HSIC entered into the following new agreements:
(i) a new management services agreement (“New Management Services Agreement”) with INHK for a term of three years commencing from 22 June 2010, pursuant to which INHK, directly or through one or more of its affiliates, would provide the Management Services to HSIC.
INHK will charge HSIC for the provision of the services on a fully absorbed cost basis plus a mark-up of 5%, which is the same as that under the Previous Management Services Agreement. These charges have been determined following negotiation on an arm’s length basis and in accordance with the policy of the HSBC Group, which takes into account UK and OECD transfer pricing guidelines.
(ii) a new investment management agreement (“New Investment Management Agreement”) with ISHK for a term of three years commencing from 22 June 2010, pursuant to which ISHK would act as investment manager in respect of certain of HSIC’s assets held from time to time.
HSIC will pay, on a quarterly basis, to ISHK a fee of between 0.17% and 0.375% per annum of the mean value of the assets under management, which is equal to the fee payable under the Previous Investment Management Agreement and has been determined on an arm’s length basis.
Details of the terms of and the caps under the New Management Services Agreement and the New Investment Management Agreement for the period from 22 June to 31 December 2010, and for the years ending 31 December 2011 and 2012, and for the period from 1 January to 21 June 2013, were announced by the Bank on 22 June 2010.
The Directors believed that the New Management Services Agreement would enable HSIC to run at a reasonably low cost structure by leveraging on the shared infrastructure and expertise of INHK. The resulting cost efficiency has contributed to increased competitiveness of HSIC’s manufactured products in the market, which the Directors considered to be essential to the future business growth of HSIC.
The New Investment Management Agreement was based on the commercial terms set out in the Previous Investment Management Agreement and the Directors (including the Independent Non-executive Directors) believed that these terms should remain in place.
HANG SENG BANK42
CORPORATE GOVERNANCE AND OTHER INFORMATION

INHK and ISHK are both indirect wholly-owned subsidiaries of HSBC, the controlling shareholder of the Bank and therefore are connected persons of the Bank. Accordingly, the Previous Management Services Agreement, the Previous Investment Management Agreement, the New Management Services Agreement and the New Investment Management Agreement all constituted continuing connected transactions of the Bank. The Bank has complied with the disclosure requirements in accordance with Chapter 14A of the Listing Rules.
For the year ended 31 December 2010, the aggregate amount paid under the Previous and the New Management Services Agreements was HK$97m, whereas the aggregate amount paid under the Previous and the New Investment Management Agreements was HK$52m.
In respect of the agreements mentioned in paragraphs (a) and (b) above which constituted the Bank’s continuing connected transactions, all the Independent Non-executive Directors of the Bank have reviewed the said transactions and confirmed that the said transactions have been entered into:
(1) in the ordinary and usual course of business of the Group;
(2) on normal commercial terms; and
(3) in accordance with the relevant agreements governing them on terms that are fair and reasonable and in the interests of the Bank and its shareholders as a whole.
Further, the Bank has engaged its external auditor to report on the Group’s continuing connected transactions in accordance with Hong Kong Standard on Assurance Engagements 3000 “Assurance Engagements Other Than Audits or Reviews of Historical Financial Information” and with reference to Practice Note 740 “Auditor’s Letter on Continuing Connected Transactions under the Hong Kong Listing Rules” issued by the Hong Kong Institute of Certified Public Accountants. The auditor has issued an unqualified letter containing their findings and conclusions in respect of the continuing connected transactions set out in paragraphs (a) and (b) above in accordance with Listing Rule 14A.38. A copy of the auditor’s letter has been provided by the Bank to The Stock Exchange of Hong Kong Limited.
Human Resources
The human resources policies of the Bank are designed to attract people of the highest calibre and to motivate them to excel in their careers, as well as uphold the Bank’s brand equity and culture of quality service.
Employee Statistics
As at 31 December 2010, the Bank’s total headcount was 9,642, representing an increase by 300, or 3.2%, compared with a year earlier. The total headcount comprised 1,251 executives, 3,896 officers and 4,495 clerical and non-clerical staff.
Grading Structure
To simplify the Bank’s job grade structure and to facilitate the implementation of a market pay strategy, “Broadbanding” is introduced to replace the Bank’s existing grading structure with effect from 1 January 2011.
The broad-banded structure allows for greater ease of movement by enabling career and/or salary progression without the prerequisite of changing job grade. It also provides flexibility to match internal pay levels to market trends and to differentiate rewards based on performance and potential.
The implementation of Broadbanding will facilitate the Bank in adopting a market-led strategy which helps to attract, develop and motivate the best employees which should ultimately result in improved productivity and achievement of business objectives.
Employee Remuneration
The Bank has adopted the Total Reward Approach which focuses on staff’s total compensation with fixed pay based on individual market pay position and variable pay differentiated by performance. To facilitate the implementation of the Bank’s performance-based reward strategy, individual and business performances are assessed systemically against pre-determined business, compliance and risk management objectives in guiding reward decisions. In determining the total remuneration for employees, the Bank will take into account the seniority, responsibility, remuneration package and risk profile to ensure an appropriate balance between the fixed pay and variable pay.
ANNUAL REPORT 2010 43

Fixed pays take into account levels and composition of pay in the markets in which the Bank operates. Salaries are reviewed in the context of individual and business performance, market practice, internal relativities, risk management requirements and competitiveness compared to peers.
Under appropriate circumstances, performance-related variable pay is provided as an incentive for those eligible staff members under performance-based remuneration strategy. In determining the size and allocation of variable pay budget, the Bank will take into consideration the Bank’s performance over the longer term, the economic outlook, market practices, risk appetite, capital and liquidity position as well as other non-financial factors. Variable pays for individual employees are differentiated with their responsibilities, performance, potential, and contributions. According to specific variable pay award criteria, a portion of variable pay of senior staff is deferred in the share award so as to tie them to the future performance of the Group and ensure effective alignment of incentive reward to effective risk management. The deferred share award has a vesting period of three years; with gradual vesting on a pro-rata basis commencing from the first anniversary of the date of award. The vesting of share award is also subject to the employee’s continued employment.
In addition, the Bank has participated in the HSBC Holdings Savings-related Share Option Plan (“Sharesave”), under which staff members can make monthly savings for the purchase of shares of HSBC Holdings plc after a specified period. For Sharesave 2010, 2,349 staff members have subscribed to the plan.
Employee Involvement
Communication with staff is a key aspect of the Bank’s policies. Information relating to employment matters, the Bank’s business direction and strategies, and factors affecting the Bank’s performance are conveyed to staff via different channels, including an intranet site, in-house magazines, morning broadcasts and training programmes.
The fourth bankwide Global People Survey was conducted in June 2010 as a continuous initiative to measure staff engagement level. The results were very positive as the employee engagement index was among the best in class. Communication sessions to staff were organised to share the survey results and collect feedback for continual enhancement.
Staff Development
In order to fully develop staff capability and potential, the Bank offers a wide range of training and development programmes that help the staff fulfill their personal career goals and professional requirements, including those for regulated businesses and activities, and equip them to meet future challenges.
New staff joining the Bank will participate in a comprehensive induction programme that provides them with an understanding of the Bank’s history, culture, values and corporate governance. Sustainable development of staff is enabled through multiple learning channels, including instructor-led training courses and web-based learning via an intranet platform. Staff members are also encouraged to pursue professional or academic qualifications through the Bank’s Professional Qualifications and Education Award Scheme.
A talent strategy has been in place with the aim to provide a ready, good quality internal pipeline to fill critical positions, and to build talents to feed leadership roles across the Bank. Identified talents are populated into the succession plans to critical positions and are provided with a mix of development interventions to accelerate their growth.
On average, our staff members received six days of training in 2010.
Recruitment and Retention
The employment market was very active especially in the second half of 2010. Vigorous recruitment activities continued to meet business needs and for replacement of staff turnover, especially for front-line sales positions, experienced professionals and specialists.
HANG SENG BANK44
CORPORATE GOVERNANCE AND OTHER INFORMATION

There were also conscious efforts on retention of talents and key staff. As part of the Bank’s staff retention strategies, remuneration packages and career paths for certain job positions have been reviewed to increase career advancement opportunities and ensure market competitiveness. Further, trainee programmes have been provided for jobs in selected functional areas in order to build pipeline for succession.
Business principles and values
The Bank has adopted HSBC Group’s business principles and values requiring staff to keep the highest personal standards of integrity at all levels, to commit to truth, fair dealing, quality and competence as well as to comply with the spirit and letter of all laws and regulations when conducting business. “Commitment to integrity and ethics” is also one of the expectations on its staff. Staff members are required to adhere strongly to high professional ethics and demonstrate an honest and credible character in work as well as in the relationship with the Bank’s customers.
Code of Conduct
To ensure the Bank operates according to the highest standards of ethical conduct and professional competence, all staff are required to strictly follow the Code of Conduct contained in the Bank’s Staff Handbook. With reference to the applicable regulatory guidelines and other industry best practices, the Code sets out ethical standards and values to which all the Bank’s staff are required to adhere and covers various legal, regulatory and ethical issues. These include topics such as prevention of bribery, dealing in securities, personal benefits, outside employment and anti-discrimination policies.
The Bank uses various communication channels to periodically remind staff of the requirement to adhere to the rules and ethical standards set out in the Code of Conduct.
Health and Safety
The Bank acknowledges and accepts its responsibilities for securing the health, safety and welfare of all its employees, of contractors working at premises over which it has control, and
of visiting members of the public. By successfully implementing the certified BS OHSAS 18001:2007-compliant Safety Management System, the Bank marks its achievement to be the first bank world-wide to conform to this internationally acclaimed best practice aiming at reducing the exposure of the Bank’s staff and customers to occupational safety and health risks associated with its business activities.
The Bank provides a range of training and promotional activities to enhance the knowledge of its staff in occupational safety and health, fire safety, manual handling, and office safety.
The Bank maintains a Contingency Plan for Communicable Disease. This sets out the key issues to be addressed and the actions to be taken by various units in the event of the occurrence of a serious communicable disease, and the arrangement of keeping adequate stock of Face Masks and Tamiflu by the Bank to cater for the needs of its staff in case of an outbreak of influenza pandemic. Staff have been made aware through various communication channels of the importance of personal hygiene and health, and informed of the contingency measures to be adopted. This is to ensure that the Bank will be in a position to continue with its services to the community in the event of an outbreak of a serious communicable disease.
The Bank also operates a Staff Recreation Centre at Kowloon Bay with various facilities for health enhancement and leisure activities as a means to foster work life balance among its staff and their family members.
Corporate Governance Recognition
In recognition of the Bank’s continuous excellence in and reputation for its leading approach to good corporate governance, it was named No.3 in the Best Corporate Governance Awards in Hong Kong by Euromoney, a leading financial sector publication, in 2010. The Euromoney’s award, which was based on a survey of market analysts at leading banks and research institutes in Asia, affirmed the Bank’s adherence to the highest standards of business ethics and corporate governance.
ANNUAL REPORT 2010 45

driveTAKING THE LEAD

2010 Asian Games – Squash, Silver Medal
Rebecca Chiu

Our swift response to the opening up of new avenues of business strengthened our foothold in sectors with good potential for future growth.
With increased demand for loans, we leveraged our balance sheet strength to achieve a 36.9% increase in gross advances to customers to HK$474.5bn. Customer deposits, including certificates of deposit and other debt securities in issue, rose by HK$46.7bn, or 7.0%, to HK$710.3bn, driven in part by good growth in renminbi deposits.
Personal Financial Services
Personal Financial Services’ operating profit excluding loan impairment charges rose by 5.5% to HK$7,865m, reflecting increases in lending and fee-related business. Operating profit was up 9.3% at HK$7,656m, driven by a 54% improvement in loan impairment charges. Profit before tax grew by 8.5% to HK$7,872m.
Hang Seng’s trusted brand, diverse portfolio of financial products and extensive network of service channels reinforced our leading position in key areas of banking during 2010.
HANG SENG BANK48
MANAGEMENT DISCuSSION AND ANALYSISBUSINESS IN HONG KONG

Net interest income increased by 3.5% to HK$8,485m, with good growth in credit card business and personal loans more than offsetting the adverse effects of downward pressure on deposit spreads and mortgage loan pricing.
Net fee income rose by 14.1%. We used our wealth management strength to help customers pursue their financial goals against a backdrop of changing market conditions – recording significant increases in investment fund and insurance agency fees. The upturn in investment sentiment and our emphasis on personalised service supported a 24.9% rise in service fee income from private banking.
We continued to invest in technology to provide our customers with fast, convenient and secure access to financial services. Personal e-Banking passed two major milestones in 2010 – registering its 1 millionth customer in the first half of the year and celebrating its 10th anniversary in August.
We launched a first-of-its-kind foreign exchange margin trading iPhone application.
ANNUAL REPORT 2010 49

We made good use of the popular mobile platform, reaching out to younger and tech-savvy customers with the launch of two iPhone applications. Our first application, which provides on-the-move access to securities and foreign exchange investment information, recorded about 40,000 registrations in its first month. In August, we built on this success with the launch of a first-of-its-kind foreign exchange margin trading application, helping drive growth in the retail margin trading account base.
At the end of 2010, the number of Personal e-Banking customers was up 10.2% at 1.1 million compared with a year earlier. The percentage of total personal banking transactions conducted via Personal e-Banking was up 0.7 percentage points at 52.2%.
Wealth Management
Wealth management income rose by 9% to HK$5,092m. We maintained a steady growth trend during the year to record a 4.1% increase in revenue in the second half of 2010 compared with the first half.
Against the backdrop of a tighter regulatory environment, we achieved a 9.8% rise in investment services income to HK$2,786m – driven largely by the 85.1% growth in fee revenue from investment fund business. Enhancements to our life insurance proposition and increased returns from the life insurance investment funds portfolio generated a 9.7% rise in life insurance income to HK$2,121m.
HANG SENG BANK50
MANAGEMENT DISCuSSION AND ANALYSISBUSINESS IN HONG KONG

Improving economic conditions and continuing low interest rates generated renewed customer interest in investment opportunities offering enhanced yields. Our trusted reputation for wealth management services and time-to-market competitive strength helped us capitalise on the increase in investor activity. We also established a new customer referral mechanism to capture more business from affluent mainland Chinese individuals looking for wealth management services in Hong Kong.
Riding on the robust Mainland economy and growing demand for investment exposure to the renminbi, we developed new China-related funds. In November, we became the first non-Mainland fund manager to offer a renminbi bond investment fund in Hong Kong with the launch of the Hang Seng RMB Bond Fund – which was fully subscribed in four days. Our Hang Seng A Share Focus Fund that was authorised earlier in the year also enjoyed a good response from customers. These new products helped drive strong growth of 180.8% in retail investment fund sales and we increased our investment fund market share – further reinforcing our reputation for Hong Kong and Mainland-focused product development expertise.
Our innovative foreign exchange margin trading iPhone application was a primary driver of the 54.5% increase in new margin trading accounts in the second half of the year compared with the first half. The margin trading account base increased by 3.8% year on year.
We worked to establish ourselves as a market leader in providing renminbi-related retail investment opportunities. In addition to our RMB Bond Fund, we offered a renminbi-denominated floating rate bond and equity-linked note. We were also the first bank in Hong Kong to launch renminbi certificates of deposit for retail investors.
With strong market competition in securities services, we launched customer acquisition and service utilisation promotions, and enhanced our Internet-based securities platform with convenient new functions such as online submission of corporate events instructions, supporting a 16.2% increase in income from stockbroking and related services in the second half of 2010 compared with the first half.
+180.8%retail investment funds sales
We worked to establish ourselves as a market leader for renminbi-related retail investment opportunities.
ANNUAL REPORT 2010 51

Our credit card base passed the 2 million cards in circulation milestone.
We continued to strengthen our position as a prominent provider of retirement planning and life insurance solutions. We further diversified our insurance offerings with new products and improved protection under existing plans to meet the needs of customers at different life stages. We enhanced the capacity of our telemarketing channel to increase our market penetration of the younger customer segment. We also launched strategic promotional offers to expand relationships with existing insurance customers. This proved effective in driving sales, with life insurance policies in-force and annualised premiums growing by 8.6% and 13.3% respectively. Insurance agency fee income rose by 34.7%.
Effective management of the life insurance funds investment portfolio generated a HK$270m increase in investment gains and an 18.4% rise in related net interest income and fee income for the year.
Consumer Finance
Lending to individuals grew by 8.8% to HK$185.3bn.
We capitalised on the positive outlook of consumers and robust domestic demand with card utilisation incentive offers. In June, we launched the Hang Seng Hong Kong dollar China UnionPay (CUP) credit card which offers cardholders access to the extensive CUP merchant network in Hong Kong and on the Mainland, as well as in many countries overseas. This new card enjoyed strong uptake, with over 100,000 issued by the end of 2010, helping to drive the 11.2% rise in the card base to over 2 million cards in circulation. We gained market share and maintained our number two ranking for card advances and cardholder spending, which grew by 13.9% and 18.4% respectively.
Excluding Government Home Ownership Scheme mortgages, residential mortgage lending to individuals increased by 11.1% to HK$134.7bn. Amid intense market competition and government measures to cool speculation in the property sector, our multi-platform mortgage services helped us outperform the market in terms of new mortgage registrations and grow our overall market share.
+224.8%Commercial Banking trade finance
HANG SENG BANK52
MANAGEMENT DISCuSSION AND ANALYSISBUSINESS IN HONG KONG

Commercial Banking
Commercial Banking leveraged its competitive strengths to capitalise on improved commercial and trade activity in 2010, recording a 34.3% increase in operating profit excluding loan impairment charges to HK$2,671m. Operating profit rose by 45.7% to HK$2,493m, reflecting the positive impact of the economic recovery and effective credit risk management on loan impairment charges, which fell by 36%. Profit before tax was up 42.1% at HK$3,748m.
Net interest income rose by 34.7% to HK$2,709m. Benefitting from our close customer relationships and good understanding of market trends, we moved quickly to meet the growing demand for financing, achieving a 102.1% increase in customer advances to HK$167.5bn, with a 57.8% rise in related net interest income.
As a well-established supporter of local business, we remained an active participant in government-initiated loan schemes for SMEs, with total lending under these programmes reaching more than HK$18.4bn by the end of 2010.
We helped customers manage risk while taking advantage of the improving economic conditions, resulting in a 224.8% increase in trade finance to HK$62.5bn.
We took steps to enhance service access and efficiency at Business Banking Centres and strengthened customer referral mechanisms, supporting a 35.2% rise in the number of new account openings compared with 2009.
Commercial Banking achieved a 35.2% year-on-year increase new account openings.
ANNUAL REPORT 2010 53

The increase in the customer base helped drive a 14.5% increase in deposits, which partly offset the adverse effects of the continuing compression of spreads. Net interest income from deposits fell by 19%.
With the widening scope of renminbi financial services in Hong Kong, we leveraged our strong internal infrastructure to establish ourselves as a market leader. We were the first bank in Hong Kong to launch a renminbi prime rate and to lead-arrange a renminbi syndicated loan, placing us in a good position to capture a growing share of business in this important new market sector. At the end of 2010, we had more than 58,000 renminbi commercial accounts and had helped settle more than RMB35bn in renminbi cross-border trade-related business.
Net fee income increased by 8.5% to HK$1,209m, supported in part by good growth in corporate insurance business.
Trade-related fee income was up 16.1%. In addition to our comprehensive suite of renminbi products and services, our close collaboration with Hang Seng China and strategic alliances with Mainland partners reinforced the competitive strength of our cross-border capabilities and proved a valuable source of top-end customer referrals.
Our extensive Mainland correspondent bank network facilitated efficient cross-border transactions, resulting in a 22.1% increase in fee income from remittances.
HANG SENG BANK54
MANAGEMENT DISCuSSION AND ANALYSISBUSINESS IN HONG KONG

We used platforms including cash management and yield enhancement to market our growing portfolio of corporate wealth management offerings. We worked to streamline insurance underwriting processes and extended the reach of our ‘premium financing’ programme to provide customers with a faster service and more flexibility in obtaining insurance coverage, helping us achieve good growth in sales of universal life insurance products and our Executive Retention Insurance Plan.
In the low interest rate environment, we offered customers improved-yield investment opportunities serving a variety of risk appetites, recording increases in sales of structured products and treasury instruments. Income from investment and treasury business rose by 80.6%.
Overall, income from corporate wealth management increased by 26.6%, representing 13.4% of Commercial Banking’s net operating income before loan impairment charges.
Our efforts to assist customers brought us industry recognition, with an ‘Achievement Award for Cash Management in Hong Kong’ at The Asian Banker Transaction Banking Awards 2010. We received an ‘SME’s Best Partner Award’ from the Hong Kong Chamber of Small and Medium Business for the fifth consecutive year.
Our service excellence was recognised with an ‘Achievement Award for Cash Management in Hong Kong’.
ANNUAL REPORT 2010 55
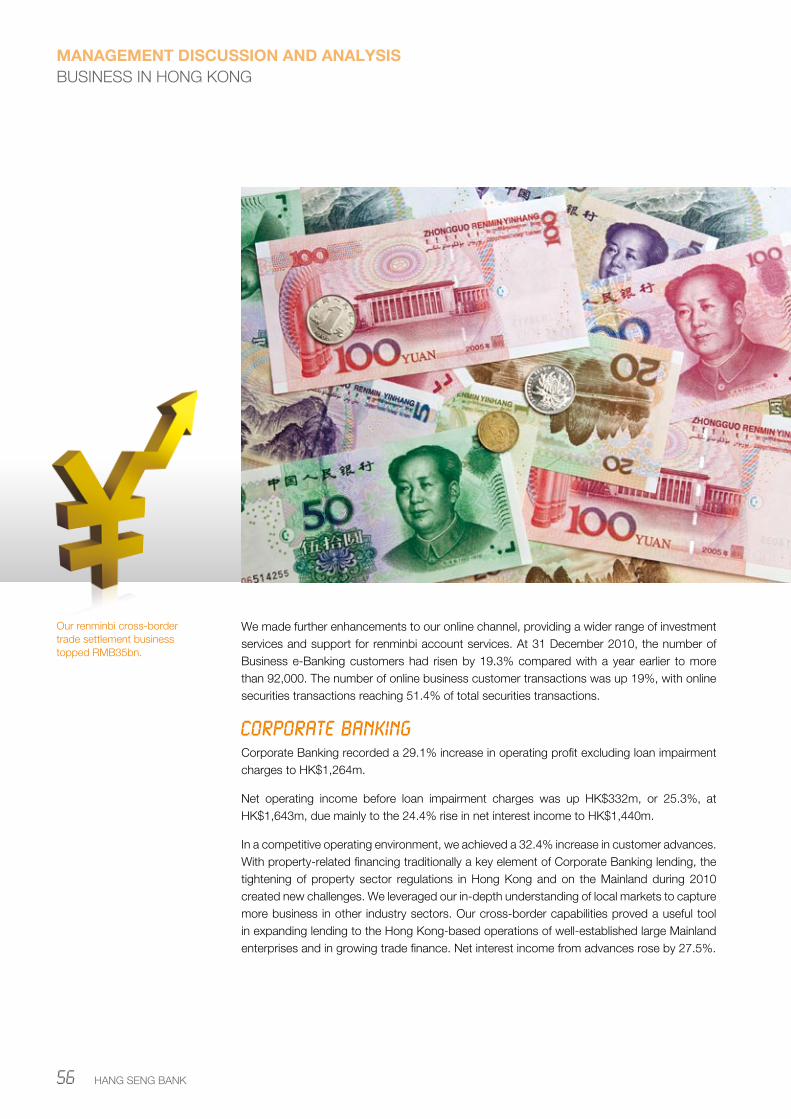
We made further enhancements to our online channel, providing a wider range of investment services and support for renminbi account services. At 31 December 2010, the number of Business e-Banking customers had risen by 19.3% compared with a year earlier to more than 92,000. The number of online business customer transactions was up 19%, with online securities transactions reaching 51.4% of total securities transactions.
Corporate Banking
Corporate Banking recorded a 29.1% increase in operating profit excluding loan impairment charges to HK$1,264m.
Net operating income before loan impairment charges was up HK$332m, or 25.3%, at HK$1,643m, due mainly to the 24.4% rise in net interest income to HK$1,440m.
In a competitive operating environment, we achieved a 32.4% increase in customer advances. With property-related financing traditionally a key element of Corporate Banking lending, the tightening of property sector regulations in Hong Kong and on the Mainland during 2010 created new challenges. We leveraged our in-depth understanding of local markets to capture more business in other industry sectors. Our cross-border capabilities proved a useful tool in expanding lending to the Hong Kong-based operations of well-established large Mainland enterprises and in growing trade finance. Net interest income from advances rose by 27.5%.
Our renminbi cross-border trade settlement business topped RMB35bn.
HANG SENG BANK56
MANAGEMENT DISCuSSION AND ANALYSISBUSINESS IN HONG KONG

Customer deposits increased by 34.5%, but the effects of continuing low interest rates saw net interest income from deposits fall by 29.4%.
We leveraged our strong customer relationships and market leadership for renminbi financial services to explore new opportunities for growing fee-based business and further diversifying income. We capitalised on rising demand for renminbi investment products to open more client investment accounts and increased corporate wealth management sales turnover. Fee income for the year grew by 29.7% to HK$188m.
With loan impairment charges improving by 96.2%, Corporate Banking recorded an operating profit of HK$1,261m – up 40% compared with a year earlier. Profit before tax rose by 38.4% to HK$1,266m.
Treasury
Treasury’s operating profit fell by 24.3% to HK$2,207m, with growth in trading income outweighed by the decline in net interest income in difficult market conditions. A 68.4% increase in the share of profits from associates and a disposal gain helped support profit before tax, which was down just 0.9% at HK$3,361m.
Net interest income dropped by 35.1% to HK$1,403m. Excess market liquidity and continuing uncertainty over the outlook for sustained global economic recovery kept downward pressure on interest rates, serving to limit good investment opportunities under the balance sheet management portfolio. Yield curves remained relatively flat, particularly in the first half of the year. With increased loan demand from business customers, a substantial proportion of the commercial surplus was redeployed to support commercial lending.
We continued to emphasise prudent risk management while taking steps to defend the interest margin. As market conditions changed, we disposed of selected instruments and invested in high-quality enhanced-yield assets, generating a HK$95m disposal gain. We took advantage of gapping opportunities to capitalise on yield differentials. This effective management of the balance sheet management portfolio underpinned the 30.4% increase in net interest income to HK$794m in the second half of the year compared with the first half.
+19.3%Business e-Banking customers
ANNUAL REPORT 2010 57

With the further liberalisation of the renminbi financial services sector in Hong Kong, we actively sourced and developed renminbi-denominated products to meet growing demand from customers, and strengthened cross-selling and customer referral mechanisms with corporate and commercial banking business units, supporting a 10.2% increase in trading income to HK$1,162m.
Hang Seng Indexes
Wholly owned subsidiary Hang Seng Indexes Company Limited (Hang Seng Indexes), strengthened its indexing services and expanded its global exposure in 2010 with the launch of new indexes and the overseas listing of new index-linked funds.
In March, Hang Seng Indexes restructured the Hang Seng Family of Indexes based on the findings of an extensive market consultation exercise undertaken in 2009 and, in July, deepened its coverage of the Hong Kong and Mainland markets with the launch of two new index series.
The Hang Seng Corporate Sustainability Index Series serves the increasing market interest in the development of socially responsible investment products and also aims to raise awareness about corporate sustainability issues among listed companies and the financial communities
We took steps to enhance service access and efficiency for customers.
HANG SENG BANK58
MANAGEMENT DISCuSSION AND ANALYSISBUSINESS IN HONG KONG

in Hong Kong and on the Mainland. Comprised of the Hang Seng Corporate Sustainability Index, the Hang Seng (China A) Corporate Sustainability Index and the Hang Seng (Mainland and HK) Corporate Sustainability Index, the series is the first of its kind to focus exclusively on Hong Kong and the Mainland.
The Hang Seng Dividend Point Index Series – consisting of the Hang Seng Index Dividend Point Index and the Hang Seng China Enterprises Index Dividend Point Index – provides the market with indicators to track cash dividends from Hang Seng Index (HSI) constituents and Hang Seng China Enterprise Index (HSCEI) constituents respectively. In November, Hong Kong Exchanges and Clearing Limited launched dividend futures based on the index series, reflecting its value in providing benchmarks for investment products hedging dividend risks.
Hang Seng Indexes increased its profile in both Asia and Europe during 2010. In July, the exchange-traded funds (ETFs) of ComStage HSI and ComStage HSCEI were listed on the SIX Swiss Exchange. Later in the year, new funds tracking the HSCEI were listed in the Mainland and Japan – an open-ended fund on the Shenzhen Stock Exchange and an ETF on the Tokyo Stock Exchange.
Hang Seng Indexes now compiles 88 publicly available indexes – 46 real-time price indexes and 42 daily indexes – of which 34 track the Mainland segment of the market. In addition to its publicly available indexes, Hang Seng Indexes also compiles customised indexes to serve the specific indexing needs of various clients.
The total number of futures and options contracts traded on the HSI and the HSCEI in 2010 increased by 11.8% and 7.1% respectively compared with 2009. At 31 December 2010, the total size of ETFs tracking all indexes in the Hang Seng Family of Indexes was over US$12bn.
Backed by our trusted brand, we reinforced our leading position in key areas of financial services.
88publicly available indexes compiled by Hang Seng Indexes Company Limited
ANNUAL REPORT 2010 59

SHENZHEN
DONGGuAN
ZHONGSHAN
FOSHAN
GuANGZHOu
KuNMING

directionTAKING THE LEAD
TIANJIN
NINGBO
SHANGHAI
FuZHOu
NANJING
BEIJING
HANGZHOu

Through our Mainland subsidiary bank, Hang Seng Bank (China) Limited, we further leveraged strategic alliances to offer a wider range of wealth management products and more convenient access to services. An improved business referral mechanism assisted with the acquisition of new customers and helped us deepen existing relationships. We launched initiatives to promote greater awareness of the Hang Seng China brand among key customer segments and in cities with good economic potential.
These developments drove a 15.3% increase in the customer base, providing support for the expansion of deposits to underpin long-term business growth.
Hang Seng China purchased headquarters premises in Shanghai and added two new cross-location sub-branches in the Pearl River Delta region.
Assisted by good brand building and steps to expand the breadth and depth of our financial services proposition, we made significant progress with developing our mainland China business in 2010.
HANG SENG BANK62
MANAGEMENT DISCuSSION AND ANALYSISBUSINESS ON THE MAINLAND

Excluding exchange losses on the revaluation of US dollar capital against the renminbi, Hang Seng China’s profit before tax rose by 139.8%. Total operating income grew by 24.1%, supported by increases in both net interest income and non-interest revenue, to more than offset rises in operating costs and loan impairment charges.
Government steps to keep inflation under control amid robust economic growth led to a tighter regulatory environment, particularly for property-related lending. Market competition for deposits business remained keen. Against this backdrop, we achieved encouraging increases in customer advances and deposits, resulting in an 8.3% rise in net interest income.
We continued to emphasise credit risk management over portfolio expansion, focusing on high-quality borrowers that offered good potential for generating additional revenue through cross-selling opportunities and deposits business. At 2010 year-end, lending was up 28.4% compared with a year earlier. Residential mortgage lending fell by 3%, reflecting the impact of government measures to cool activity in the property market.
Customer deposits rose by 76.1%, leading to further improvement in our advances-to-deposits ratio.
Leveraging our growing Mainland wealth management and renminbi trade settlement capabilities, we took successful steps to further diversify our revenue base, resulting in a 106.3% rise in non-interest income.
We achieved a 17.2% increase in the Mainland Prestige Banking account base.
ANNUAL REPORT 2010 63
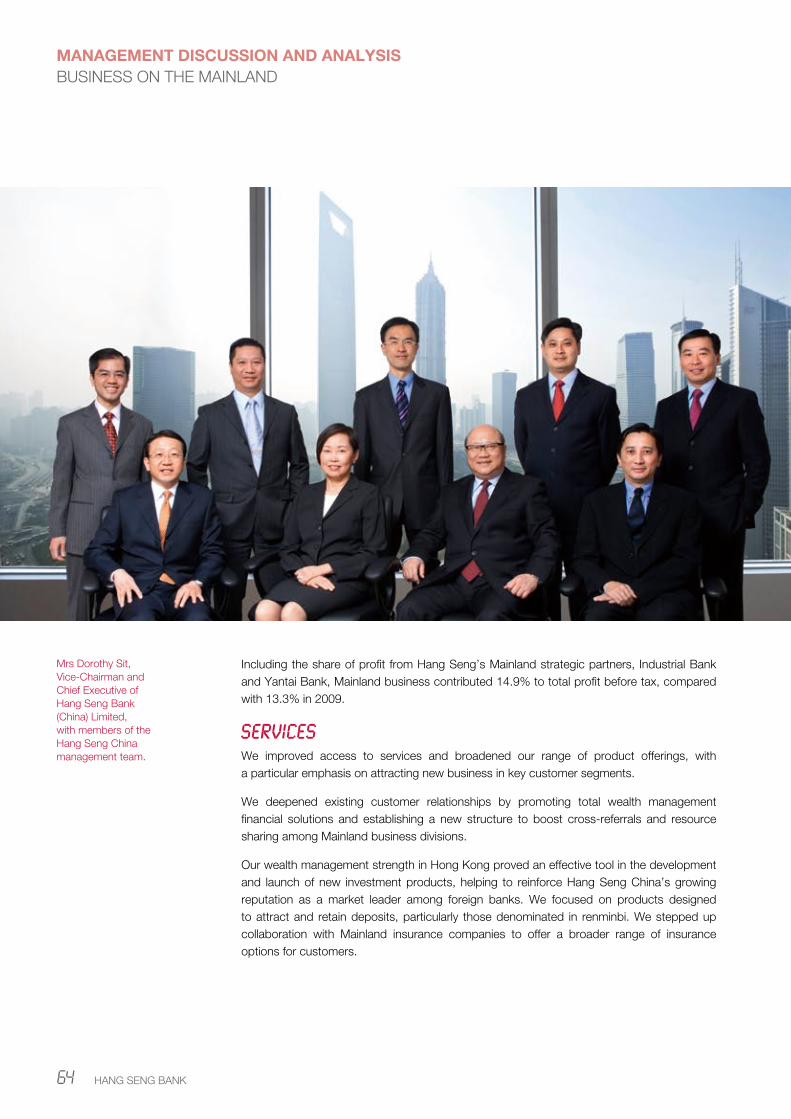
Including the share of profit from Hang Seng’s Mainland strategic partners, Industrial Bank and Yantai Bank, Mainland business contributed 14.9% to total profit before tax, compared with 13.3% in 2009.
Services
We improved access to services and broadened our range of product offerings, with a particular emphasis on attracting new business in key customer segments.
We deepened existing customer relationships by promoting total wealth management financial solutions and establishing a new structure to boost cross-referrals and resource sharing among Mainland business divisions.
Our wealth management strength in Hong Kong proved an effective tool in the development and launch of new investment products, helping to reinforce Hang Seng China’s growing reputation as a market leader among foreign banks. We focused on products designed to attract and retain deposits, particularly those denominated in renminbi. We stepped up collaboration with Mainland insurance companies to offer a broader range of insurance options for customers.
Mrs Dorothy Sit, Vice-Chairman and Chief Executive of Hang Seng Bank (China) Limited, with members of the Hang Seng China management team.
HANG SENG BANK64
MANAGEMENT DISCuSSION AND ANALYSISBUSINESS ON THE MAINLAND

Our efforts to exceed customer service expectations helped us win a number of awards in 2010, including ‘Best Foreign Bank’ from National Business Daily and CFO World’s ‘Best SME Services Award’. We were ranked number 1 for investment returns in China Benefit’s ‘Wealth Management Survey’ and our Pick & Win equity-linked investment product was one of Money Week’s ‘Top Ten Best Wealth Management Products in 2010’.
With our growing appeal among the mass-affluent and affluent customer segments, we achieved a 17.2% increase in the Mainland Prestige Banking account base – supporting an 89% rise in Mainland Personal Financial Services’ deposits. The overall personal customer base grew by 15.3% year on year.
New insurance offerings enriched our trade-related financial services proposition for Mainland commercial customers. We partnered with China Export and Credit Insurance Corporation (Sinosure) to extend our factoring business from foreign trade to domestic trade. We also launched a domestic trade forfeiting service for local banks.
We worked with China Union Merchant Service to provide merchant acquiring services, which helped us grow our operating accounts base and deposits business in the retail sector.
Facilitated by our strategically located network of outlets and close collaboration between commercial banking teams in Hong Kong and on the Mainland, we continued to be an active player in cross-border renminbi trade settlement business. Following the expansion of the pilot programme from four selected cities in Guangdong and Shanghai to 20 provinces and municipalities in mid-2010, we achieved a 13-fold increase in renminbi trade settlement transaction volume compared with that recorded between July 2009 and May 2010. Trade turnover in 2010 more than doubled compared with 2009.
The Mainland corporate and commercial banking customer base grew by 14.4% year on year. Corporate and commercial customer advances and deposits were up 33.1% and 58.4% respectively.
Market competition and a tighter regulatory environment put pressure on interest-based revenue business in the second half of the year. We worked to strengthen non-interest revenue streams, including successful efforts to grow treasury business by promoting our trading capabilities and leveraging an enhanced cross-referral mechanism to boost corporate treasury sales.
Hang Seng China customer deposits
We launched new initiatives to achieve greater awareness of the Hang Seng China brand.
+76.1%
ANNUAL REPORT 2010 65

Network
Hang Seng China opened two cross-location sub-branches – one each in Foshan and Zhongshan – under CEPA VI, which allows Hong Kong banks with branches in Guangdong to apply to establish cross-location sub-branches in the province.
With 17 outlets in the Pearl River Delta region, we are in a good position to capture a growing share of commercial business flows and take advantage of new opportunities under the cross-border renminbi trade settlement programme.
Including the two cross-location sub-branches, Hang Seng China now has 38 outlets across 13 Mainland cities.
In a further demonstration of our long-term commitment to the Mainland market, Hang Seng China completed the RMB510m purchase of headquarters premises in Shanghai’s financial district, Lujiazui.
In addition to acquiring over 7,000 square metres of office and retail space, the transaction included naming and signage rights to the building – providing a strong boost to our brand-building efforts. We gained further valuable exposure by securing the naming rights to the building that houses our Foshan sub-branch.
HANG SENG BANK66
MANAGEMENT DISCuSSION AND ANALYSISBUSINESS ON THE MAINLAND

Improvements in service delivery included upgrading and expanding our online platform to provide a better customer experience and support greater sales via self-guided channels.
In addition to using Hang Seng China’s 67 ATMs across the Mainland, our customers can access their accounts through HSBC China’s Mainland ATM network. Hang Seng China debit cards can be used on the China UnionPay (CUP) network at home and overseas. CUP cardholders can use their cards at Hang Seng China ATMs, providing another important opportunity for brand exposure.
We extended our counter services agreement with Industrial Bank – under which our customers can enjoy renminbi deposit services at the Mainland bank – from its outlets in Shanghai to all its outlets on the Mainland.
To support growth and strengthen relationships with customers, Hang Seng China increased its number of full-time staff by 12.5% to 1,614 in 2010. With customer service as our key competitive strength, we continued to invest in our people through training and career development programmes.
Strategic Alliances
We have built strategic partnerships that complement our organic growth through Hang Seng China.
Our partnership with Industrial Bank continues to yield good returns, both in financial terms and in areas such as service delivery and business referrals. We took up our full entitlement under a rights share issue by the Mainland bank during the first half of 2010 – raising our equity interest from 12.78% to 12.80% and underscoring our commitment to this valuable alliance.
Our holding in Yantai Bank extends our brand reach in the strategically significant Bohai Economic Rim region. We continued to leverage our strengths in working with Yantai to enhance its internal infrastructure and build a deeper foundation for future growth in key areas of business.
Future Growth
Looking ahead, we will use our competitive advantages to attract more customers in target segments. The acquisition of deposits, particularly renminbi deposits, remains key to the sustainable expansion of our business – helping to strengthen our balance sheet and providing liquidity to prudently grow our loans portfolio.
We will reach out to customers through the extended network provided by Hang Seng China’s outlets and our strategic alliances.
We will reinforce our reputation as a leader in wealth management and commercial banking services among foreign banks, and further diversify our income base by expanding fee-based business. With support provided by Hang Seng’s business strengths in Hong Kong, we will launch innovative new products and services. We will continue to capitalise on opportunities provided under CEPA VI and the further opening up of the cross-border renminbi trade settlement programme.
We will explore new avenues of cooperation with our strategic partners to strengthen our platform for long-term business growth.
We focused on products designed to attract and retain deposits.
ANNUAL REPORT 2010 67

financial performance
Income Statement
Summary of Financial Performance
Figures in HK$m2010 2009
(restated)
Total operating income 34,417 32,816
Total operating expenses 7,355 6,786
Operating profit after loan impairment charges and other credit risk provisions 14,085 13,214
Profit before tax 17,345 15,400
Profit attributable to shareholders 14,917 13,138
Earnings per share (in HK$) 7.80 6.87
Hang Seng Bank Limited (“the Bank”) and its subsidiaries (“the Group”) reported an audited profit attributable to shareholders of HK$14,917m for 2010, up 13.5% compared with 2009. Earnings per share were HK$7.80, up HK$0.93 from 2009. Profit attributable to shareholders for the second half of 2010 increased by HK$989m, or 14.2%, when compared with the first half.
Operating profit excluding loan impairment charges and other credit risk provisions grew by HK$449m, or 3.2%, to HK$14,475m.
Although Hong Kong’s economy improved solidly on the back of the strong rebound in exports, the operating environment for banks remained challenging with the persistence of low interest rates and intensifying market competition. Net interest income registered an increase of 2.0%, underpinned by strong loan growth. Supported by the improvement in investment sentiment, non-interest income grew by 10.9%. While continuing to carefully manage costs, investment for future growth led to an 8.4% rise in operating expenses compared with 2009. The Bank built encouraging business momentum, resulting in an 11.3% increase in operating profit excluding loan impairment charges and other credit risk provisions in the second half of the year compared with the first half.
101009
11
12
13
14
15HK$bn
Operating Profit Analysis
2009 Operating profit
Change due to:
Net interest income
Net fee income
Other operating income
Operating expenses
Loan impairment charges and other credit risk provisions
2010 Operating profit
HK$m
13,214
277
576
165
(569)
422
14,085
5
0
10
15
20
25
30HK$bn
Net Operating Income(Before loan impairment charges and other credit risk provisions)
Net operating income
Non-interest income
Net interest income
06 07 08 09 10
HANG SENG BANK68
MANAGEMENT DISCuSSION AND ANALYSISFINANCIAL REVIEW

Net interest income rose by HK$277m, or 2.0%, with an 8.9% increase in average interest-earning assets.
Figures in HK$m 2010 2009
Net interest income/ (expense) arising from:
– financial assets and liabilities that are not at fair value through profit and loss 14,459 14,151
– trading assets and liabilities (238) (234)
– financial instruments designated at fair value 79 106
14,300 14,023
Average interest-earning assets 802,464 736,953
Net interest spread 1.72% 1.84%
Net interest margin 1.78% 1.90%
The increase in net interest income was largely contributed by strong growth in customer advances, which more than offset the adverse effects of the repricing of assets at lower market interest rates and the continuing compression of deposit spread.
Net interest margin narrowed by 12 basis points to 1.78% compared with 2009, and net interest spread fell by 12 basis points to 1.72%. Liability spread continued to be constrained by the low interest rate environment. Treasury’s balance sheet management portfolio was negatively affected by the repricing of assets at lower interest rates and the flattening of yield curves, although increased contributions from the credit card business, personal loans and corporate lending provided a partial buffer. The Bank achieved volume growth in the average balance of mortgage lending, but intense market competition continued to drive down mortgage pricing. The contribution from debt securities under the life insurance funds investment portfolio grew, with a 17.7% rise in related net interest income. The contribution from net free funds remained the same as in 2009 at 6 basis points.
Net interest income in the second half of 2010 grew by HK$874m, or 13.0%, compared with the first half, due mainly to fewer days in the first half of the year and a 9.3% increase in average interest-earning assets. Net interest margin in the second half was 1.80% – up 3 basis points on the first half of the year.
The HSBC Group reports interest income and interest expense arising from financial assets and financial liabilities held for trading as “Net trading income”. Income arising from financial instruments designated at fair value through profit and loss is reported as “Net income from financial instruments designated at fair value” (other than for debt securities in issue and subordinated liabilities, together with derivatives managed in conjunction with them).
The table below presents the net interest income of Hang Seng, as included within the HSBC Group accounts:
Figures in HK$m 2010 2009
Net interest income 14,456 14,137
Average interest-earning assets 756,110 670,321
Net interest spread 1.86% 2.06%
Net interest margin 1.91% 2.11%
Net fee income increased by HK$576m, or 13.3%, to HK$4,897m compared with 2009.
Leveraging its strong wealth management platform and improved investment market sentiment, income from retail investment funds rose by 72.0%. Income from stockbroking and related services fell by 6.3%, reflecting keen market pricing competition and a decline in stock market trading turnover. Insurance agency fee income rose by 34.7%, due mainly to strong sales of a life protection with return insurance product. In improved market conditions, private banking leveraged its core strengths of a diverse suite of investment products and client service excellence to grow private banking service fee income by 24.0%.
Card services income increased by 3.5%. The Bank grew the card base by 11.2% to over two million and gained market share in terms of card receivables and card spending, supporting a 13.9% increase in receivables and 18.4% rise in spending. Credit facilities fee income grew by 44.4%, due mainly to higher fees from increased corporate lending.
The upturn in trade activity together with the expansion of the cross-border renminbi trade settlement scheme boosted remittances and trade-related fee income by 19.4% and 19.3% respectively.
ANNUAL REPORT 2010 69

Compared with the first half of 2010, net fee income in the second half grew by HK$159m, or 6.7%, mainly reflecting increases in income from stockbroking and related services and the sales of retail investment funds. Fee income from private banking services, trade-related business and remittances also registered solid growth in the second half of the year.
Trading income rose by HK$136m, or 7.1%, to HK$2,059m.
Trading income rose by HK$136m, or 7.1%, to HK$2,059m. Foreign exchange income fell by HK$24m, or 1.3%, attributable partly to reduced net interest income from funding swaps* and lower customer demand for foreign exchange-linked structured products. The reduction was also affected by increased losses on the revaluation of certain US dollar capital funds – maintained in the Bank’s mainland subsidiary bank and subject to regulatory controls – against the renminbi. Excluding the above items, foreign exchange trading grew by HK$72m, or 4.7%.
Income from securities, derivatives and other trading activities increased by HK$160m, or 122.1%, reflecting an improvement in derivatives trading.
* Treasury from time to time employs foreign exchange swaps for its funding activities, which in essence involve swapping a currency (“original currency”) into another currency (“swap currency”) at the spot exchange rate for short-term placement and simultaneously entering into a forward exchange contract to convert the funds back to the original currency on maturity of the placement. In accordance with HKAS 39, the exchange difference of the spot and forward contracts is required to be recognised as foreign exchange gain/loss, while the corresponding interest differential between the original and swap funding is reflected in net interest income.
Net income from financial instruments designated at fair value reported a revaluation gain of HK$282m, compared with a revaluation loss of HK$75m in 2009.
This was mainly due to the improvement in financial markets in 2010. The gain is due mainly to changes in the fair value of assets supporting the linked insurance contracts and reported in “net income/(loss) from financial instruments designated at fair value” with offsetting movements in the value of these contracts reported under “net insurance claims incurred and movement in policyholders’ liabilities”.
Net earned insurance premiums fell by HK$212m, or 1.8%. Net insurance claims incurred and movement in policyholders’ liabilities rose by HK$583m, or 4.9%.
Analysis of income from wealth management business
Figures in HK$m 2010 2009
Investment income:
– retail investment funds 1,039 604
– structured investment products* 448 473
– private banking service fee** 196 158
– stockbroking and related services 1,468 1,566
– margin trading and others 129 141
3,280 2,942
Insurance income:
– life insurance 2,282 2,070
– general insurance and others 342 337
2,624 2,407
Total 5,904 5,349
* Income from structured investment products includes income reported under net fee income on the sales of third-party structured investment products. It also includes profit generated from the selling of structured investment products in issue, reported under trading income.
** Income from private banking includes income reported under net fee income on investment services and profit generated from selling of structured investment products in issue, reported under trading income.
Wealth management business maintained good growth momentum in 2010, achieving a 10.4% increase in income compared with 2009. Investment and insurance income rose by 11.5% and 9.0% respectively.
Leveraging the open architecture of its wealth management platform, the Bank promoted a comprehensive range of yield enhancement investment products to suit the various risk appetites of customers in the low interest rate environment. Benefiting from the improvement in equity markets and investor sentiment, the Bank achieved strong growth of 72.0% in income from retail investment funds. Stockbroking and related services income fell by 6.3% as a result of lower stock market turnover activity recorded by the Bank and keen market pricing competition.
HANG SENG BANK70
MANAGEMENT DISCuSSION AND ANALYSISFINANCIAL REVIEW

Private banking service income grew by 24.1%, supported by the improvement in investment sentiment.
The Bank continued to enhance its leading position in providing retirement savings and life insurance protection to customers. Total policies in-force increased by 8.6%. Net interest income and fee income from the life insurance funds investment portfolio rose by 18.4%, due mainly to growth in the size of the life insurance investment portfolio, which held bond investments as its major assets.
Investment return on life insurance investment funds improved by HK$270m. The gain mainly reflects changes in the fair value of assets supporting linked insurance contracts and reported under “net income/(loss) from financial instruments designated at fair value”, with offsetting movements in policyholders’ liabilities. Movement in the present value of in-force insurance business increased strongly, due mainly to the growth in volume and profitability of new business written during 2010.
General insurance income increased by 1.5% to HK$342m.
While carefully managing costs, the Bank continued to make investments in support of long-term business growth. Excluding mainland business, operating expenses rose by 7.1%.
Employee compensation and benefits increased by HK$339m, or 10.0%. Salaries and other related costs increased by 11.5%, reflecting the annual salary increment and higher average headcounts as well as an increase in performance-related pay expenses. General and administrative expenses were up 6.7%. Rental expenses rose as a result of increased rents for branches in Hong Kong and new branches on the Mainland. Depreciation charges rose by 4.7%, mainly reflecting increases
in depreciation on the Bank’s headquarters building in Hong Kong. Marketing and advertising expenses increased by 23.0% to support business growth.
Staff numbers* by region
2010 2009
Hong Kong 7,960 7,834
Mainland 1,623 1,449
Others 59 59
Total 9,642 9,342
* Full-time equivalent
Operating Expenses for 2010
Employee compensation and benefits
Other operating expenses
Premises and equipment
Depreciation and amortisation
50.5%
21.1%
18.6%
9.8%
Operating Expenses for 2009
Employee compensation and benefits
Other operating expenses
Premises and equipment
Depreciation and amortisation
49.8%
20.7%
19.6%
9.9%
Operating expenses rose by HK$569m, or 8.4%, to HK$7,355m.
Figures in HK$m 2010 2009
Life insurance:
– net interest income and fee income 2,382 2,012
– investment returns on life insurance funds 287 17
– net earned insurance premiums 10,966 11,193
– net insurance claims incurred and movement in policyholders’ liabilities* (12,479) (11,912)
– movement in present value of in-force long-term insurance business 1,126 760
2,282 2,070
General insurance and others 342 337
Total 2,624 2,407
* Including premium and investment reserves
ANNUAL REPORT 2010 71

At 31 December 2010, the Group’s number of full-time equivalent staff was up by 300 compared with the end of 2009.
With the increase in operating expenses outpacing the growth in net operating income before impairment charges and other credit risk provisions, the cost efficiency ratio rose by 1.1 percentage points compared with 2009 to 33.7%.
Loan impairment charges and other credit risk provisions fell by HK$422m, or 52.0%, to HK$390m compared with a year earlier, reflecting an overall improvement in the credit environment.
Figures in HK$m 2010 2009
Loan impairment charges:
– individually assessed (186) (310)
– collectively assessed (204) (502)
(390) (812)
of which:
– new and additional (609) (1,104)
– releases 157 230
– recoveries 62 62
(390) (812)
Other credit risk provisions – –
Loan impairment charges and other credit risk provisions (390) (812)
Individually assessed provisions were down HK$124m, with lower impairment charges made for Commercial Banking customers as economic conditions continued to improve.
Collectively assessed provisions were down HK$298m, attributable to lower charges on credit card and personal loans portfolios as a result of fewer delinquencies and the falling bankruptcy trend. Impairment allowances for loans not individually identified as impaired also fell due to lower historical loss rates with the improvement in global credit markets.
Total loan impairment allowances as a percentage of gross advances to customers are as follows:
2010%
2009%
Loan impairment allowances:
– individually assessed 0.24 0.33
– collectively assessed 0.15 0.23
Total loan impairment allowances 0.39 0.56
600
400
200
0
800
1,000
1,200
1,400
1,600HK$m
Net Charges for Loan Impairment Allowances
Individually assessed allowances
Collectively assessed allowances
06 07 08 09 10
0.4
0.2
0.0
0.6
0.8
1.0%
Loans Impairment Allowances as a Percentage of Gross Advances to Customers
Individually assessed allowances
Collectively assessed allowances
Total
06 07 08 09 10
HANG SENG BANK72
MANAGEMENT DISCuSSION AND ANALYSISFINANCIAL REVIEW

Operating profit rose by HK$871m, or 6.6%, at HK$14,085m.
Profit before tax increased by 12.6% to HK$17,345m, after taking into account a 39.8% (or HK$74m) fall in gains less losses from financial investments and fixed assets; a 93.3% (or HK$235m) increase in net surplus on property revaluation and a 52.2% (or HK$913m) increase in share of profits from associates, mainly from Industrial Bank Co., Ltd. (“Industrial Bank”).
Gains less losses from financial investments and fixed assets amounted to HK$112m, a decrease of 39.8% when compared with 2009.
Net gains from the disposal of available-for-sale equity securities fell by HK$151m, or 93.8%, attributable to the profit realised from the disposal of Visa Inc. shares in 2009. The Bank realised a HK$95m gain from the disposal of available-for-sale debt securities – reflecting profit realised primarily from the disposal of government-guaranteed debt securities – compared with a loss of HK$152m on the disposal of certain debt securities in the previous year. The net gain on the disposal of assets held for sale in 2010 was HK$12m, compared with HK$187m for 2009 which included a significant disposal profit from the sale of a property.
Net surplus on property revaluation rose by 93.3% to HK$487m.
Figures in HK$m2010 2009
(restated)
Surplus of revaluation on investment properties 474 250
Surplus of revaluation on assets held for sale 10 –
Reversal of revaluation deficit on premises 3 2
487 252
The Group’s premises and investment properties were revalued at 30 November 2010 and updated for any material changes at 31 December 2010 by DTZ Debenham Tie Leung Limited. The valuation was carried out by qualified persons who are members of the Hong Kong Institute of Surveyors. The basis of the valuation of premises was open market value for existing use and the basis of valuation for investment properties was open market value. The net revaluation surplus for Group premises amounted to HK$2,105m of which HK$2,102m was credited to premises revaluation reserve and HK$3m was credited to the income statement. Revaluation gains of HK$474m on investment properties were recognised through the income statement. The related deferred tax provisions for Group premises and investment properties were HK$345m and HK$78m respectively.
The revaluation exercise also covered business premises/investment properties reclassified as properties held for sale. In accordance with HKFRS 5, the revaluation gain of HK$10m was recognised through the income statement.
Customer Group Performance
The table below sets out the profit before tax contributed by the customer groups for the years stated.
Figures in HK$m
PersonalFinancialServices
CommercialBanking
CorporateBanking Treasury Other
Totalreportablesegments
Year ended 31 December 2010Profit before tax 7,872 3,748 1,266 3,361 1,098 17,345
Share of profit before tax 45.4% 21.6% 7.3% 19.4% 6.3% 100.0%
Year ended 31 December 2009 (restated)
Profit before tax 7,258 2,637 915 3,393 1,197 15,400
Share of profit before tax 47.1% 17.1% 5.9% 22.0% 7.9% 100.0%
ANNUAL REPORT 2010 73

Personal Financial Services (“PFS”) recorded a profit before tax of HK$7,872m for 2010, up 8.5% compared with 2009. Operating profit excluding loan impairment charges rose by 5.5% to HK$7,865m.
Net interest income grew by 3.5% over 2009, with the expansion in deposits and lending portfolios more than compensating for the squeeze on the net interest margin and severe price competition.
Unsecured lending grew strongly to achieve a 51.9% rise in profit before tax when compared with a year earlier, attributable to the impressive business momentum and improved loan quality. PFS took successful steps to increase the credit card base, which surpassed the two million mark, supporting year-on-year increases in card spending and receivables of 18.4% and 13.9% respectively. Personal loans grew by 29.1% to HK$4.6bn. Overall loan impairment charges dropped by 46.1% in 2010.
Against a backdrop of intense market competition and new government measures to cool property speculation, the residential mortgage business achieved good growth in 2010 to remain a top three mortgage lender and sustain its market share.
With new regulations governing investment business, PFS implemented the physical segregation of banking and investment services and reconfigured the investment sales process to maintain business momentum under the new operational structure. New products were launched to capture the shift in investor appetite in the changing market conditions. Wealth management income grew by 9.0% year-on-year and by 4.1% in the second half of the year compared with the first half.
Investment-related income increased by 9.8%, driven in part by an 85.1% rise in revenue from investment funds business. Timely new products, including the Hang Seng RMB Bond Fund, supported growth of 180.8% in retail investment fund sales as well as a significant increase in the Bank’s investment fund market share. Stockbroking and related services fee income grew by 16.2% in the second half of 2010 compared with the first half.
New life insurance plans offering improved protection propositions proved effective in driving sales. Income from the life insurance business grew by 9.7% compared with 2009. Total life insurance policies in-force and annualised premiums rose by 8.6% and 13.3% respectively.
Hang Seng continued to be recognised as the leading wealth management bank in Hong Kong, receiving awards including “Best Domestic Bank in Hong Kong” from The Asset for the 11th consecutive year, “Company of the Year” in Benchmark’s 2010 Wealth Management Awards and “Best Local Private Bank in Hong Kong” from Euromoney for the second year in a row.
Personal e-Banking grew its registered customer base by 10.2% compared with the end of 2009 to reach 1.1 million. PFS continued to implement service innovations, including the development and launch in August 2010 of a first-of-its-kind iPhone application to support foreign exchange margin trading. As of December over 435,000 customers had added their support to the Bank’s environmental efforts by registering to receive electronic rather than paper statements through the e-Statement service – a 30.3% increase compared with a year earlier.
Commercial Banking (“CMB”) achieved a 42.1% increase in profit before tax to HK$3,748m. CMB’s contribution to the Bank’s total profit before tax increased to 21.6%, up 4.5 percentage points from 2009. Operating profit excluding loan impairment charges was up by 34.3% to HK$2,671m, due mainly to increases in net interest income from advances and net fee income. With improving market conditions and a continuing emphasis on risk management, loan impairment charges fell by 36.0%.
Against a backdrop of economic recovery and the rebound in exports, CMB’s swift response to the increase in demand for financing saw customer advances increase by 102.1%, underpinning a 57.8% rise in net interest income from lending. The influx of liquidity into the region drove a 14.5% rise in customer deposits. However, with continuing pressure on spreads, deposit-related net interest income fell by 19.0%.
Supported by a comprehensive business development plan and the Bank’s strong internal infrastructure, CMB was quick to respond to the further relaxation of the scope of renminbi business in Hong Kong in early 2010, rolling out a comprehensive range of renminbi commercial banking services and establishing the Bank as a pioneer in this expanding area of business. Hang Seng was the first bank in Hong Kong to set up a renminbi prime rate and to sign a renminbi syndicated loan. CMB has developed a full suite of renminbi commercial banking products including, but not limited to, renminbi commercial finance, renminbi savings and current accounts, and renminbi factoring and solutions. At the end of 2010, we had more than 58,000 renminbi commercial accounts and had helped settle more than RMB35bn in renminbi cross-border trade-related business.
HANG SENG BANK74
MANAGEMENT DISCuSSION AND ANALYSISFINANCIAL REVIEW

To assist commercial customers in growing their cross-border business and to establish a dynamic customer referral channel, CMB closely collaborated with Hang Seng China and several strategic partners on the Mainland, including Industrial Bank and China Export and Credit Insurance Corporation (SINOSURE). This collaboration has enhanced CMB’s ability to offer one-stop commercial banking solutions and capture an increasing share of cross-border business flows.
CMB worked to provide timely, competitive corporate wealth management products to its customers, focusing particularly on those in the top-end segment. Enhanced corporate insurance products were marketed on various platforms, including wealth management and yield enhancement. Underwriting procedures were streamlined to improve service efficiency.
Income from corporate wealth management business increased by 26.6% and contributed 13.4% to CMB’s total net operating income before loan impairment charges in 2010.
With strong roots in its local communities, CMB continued to be an active player in government-backed schemes to support small and medium-sized enterprises. Since late 2008, the Bank has approved about 6,800 applications with a total loan amount of more than HK$18.4bn under the government-backed SME Loan Guarantee and Special Loan Guarantee schemes, with market shares of 25% and 15% respectively at the end of 2010.
CMB customers continued to migrate to online and automated banking channels. At 31 December 2010, over 92,000 customers had registered for the Bank’s Business e-Banking service, up 19.3% compared with a year earlier. The number of online business transactions grew by 19.0%.
Corporate Banking (“CIB”) experienced an intensification of market competition in 2010. With the uneven pace of global economic recovery, many banks turned their attention to Asia, leading to growing competition among lenders. Property-related financing has traditionally been an important element of CIB’s business. With tighter government regulation in the property sector both in Hong Kong and on the Mainland, CIB took steps to diversify its revenue base, leveraging its strong customer relationships and good industry sector knowledge to capitalise on new business opportunities created by the growing demand for cross-border financial services.
CIB’s advances to customers and customer deposits grew by 32.4% and 34.5% respectively compared with a year earlier.
Operating profit excluding loan impairment charges was HK$1,264m, an increase of HK$285m, or 29.1%. Operating profit was up 40.0% at HK$1,261m.
Treasury (“TRY”) recorded a profit before tax of HK$3,361m, in line with 2009. With increased loan demand from business customers, a substantial proportion of the commercial surplus was redeployed to support commercial lending. Operating profit was down 24.3% at HK$2,207m.
Trading income increased 10.2% to HK$1,162m and disposal gains rose by 162.5% to HK$95m, but these increases were more than offset by the 35.1% decline in net interest income to HK$1,403m.
With abundant market liquidity and the fragile nature of the global economic recovery, interest rates remained at low levels. Yield curves were also relatively flat, particularly in the first half of the year. Net interest income fell to HK$609m in the first half of the year, but TRY’s active management of the balance sheet management portfolio saw net interest income rebound by 30.4% to HK$794m in the second half of the year.
TRY placed more emphasis on high-quality debt securities, particularly government-guaranteed papers and high-quality corporate debt securities, and capitalised on market opportunities to dispose of selected securities. These actions helped improve the investment mix of the balance sheet management portfolio and generated a disposal gain of HK$95m, while remaining in line with the Bank’s prudent risk management strategy.
Trading income increased by HK$108m, or 10.2%, to HK$1,162m, mainly contributed by the improvement in foreign exchange income and derivatives trading, boosted in part by strong demand for renminbi-denominated products and derivatives following the further liberalisation of renminbi business in Hong Kong.
Mainland Business
Hang Seng Bank (China) Limited (“Hang Seng China”) opened two cross-location sub-branches under CEPA VI during the year, bringing its mainland network to 38 outlets across Beijing, Shanghai, Guangzhou, Dongguan, Shenzhen, Fuzhou, Nanjing, Hangzhou, Ningbo, Tianjin, Kunming, Foshan and Zhongshan. The Bank also has a branch in Shenzhen for foreign currency wholesale business and a representative office in Xiamen.
ANNUAL REPORT 2010 75

Hang Seng China continued to further enrich and diversify its wealth management product offerings and enhance its Commercial Banking capabilities to capture good growth opportunities. Close collaboration between Commercial Banking teams on the Mainland and in Hong Kong helped to support solid growth in both the personal and commercial customer bases – which increased by 15.3% and 14.4% respectively compared with a year earlier.
Customer advances recorded growth of 28.4% to HK$36.4bn compared with 2009 year-end. Customer deposits grew by 76.1%, underpinned by the increase in the mainland customer base.
Hang Seng China’s profit before tax (excluding exchange losses on US dollar capital funds) recorded a growth of 139.8% compared with 2009, with growth in both net interest income and non-interest income offsetting increases in operating expenses and loan impairment charges.
The purchase of headquarters premises in Shanghai in 2010 demonstrated the Group’s long-term commitment to the
mainland market and is supporting the continued development of Hang Seng China.
The Bank’s strategic alliance with Industrial Bank continued to generate good results. The Bank took up its full share entitlement under a rights issue by Industrial Bank and increased its equity interest in the mainland bank from 12.78% to 12.80% at 31 December 2010.
Economic Profit
Economic profit is calculated from post-tax profit, adjusted for any surplus/deficit arising from property revaluation, depreciation attributable to the revaluation surplus and impairment of purchased goodwill and takes into account the cost of capital invested by the Bank’s shareholders.
For the year 2010, economic profit was HK$9,408m, an increase of HK$1,036m, or 12.4%, compared with 2009. Return on invested capital (post-tax profit, adjusted for the property revaluation surplus net of deferred tax, depreciation attributable to the revaluation and impairment of purchased goodwill), rose by HK$1,541m.
2010 2009
HK$m % HK$m %
Average invested capital 57,616 52,937
Return on invested capital* 14,690 25.5 13,149 24.8
Cost of capital (5,282) (9.2) (4,777) (9.0)
Economic profit 9,408 16.3 8,372 15.8
* Return on invested capital is based on post-tax profit excluding any surplus/deficit arising from property revaluation, depreciation attributable to the revaluation surplus and impairment of purchased goodwill.
Balance Sheet
Total assets rose by HK$86.2bn, or 10.4%, to HK$916.9bn. Customer advances increased by HK$128.0bn, or 37.1%, with strong growth in trade financing, corporate and retail lending and mainland loans. Despite the keen market competition, the Bank’s residential mortgage business continued to record good growth and sustained its market share in terms of total mortgage lending. Customer deposits and certificates of deposit and other debt securities in issue increased by HK$46.7bn, or 7.0%, to HK$710.3bn, driven in part by strong growth in renminbi deposits. At 31 December 2010, the advances-to-deposits ratio was 66.5%, compared with 51.9% at 31 December 2009, reflecting the faster pace of loan growth in 2010. Financial investments and trading assets decreased by 17.5% and 60.9% respectively, attributable primarily to the redeployment of the commercial surplus to support loan growth.
300
200
100
0
500
400
700
600
800HK$bn
70
60
50
40
%
Advances to Customers and Customer Deposits
Customer deposits
Advances to customers
Advances-to-deposits ratio
06 07 08 09 10
HANG SENG BANK76
MANAGEMENT DISCuSSION AND ANALYSISFINANCIAL REVIEW

Assets Deployment
Figures in HK$m2010 % 2009
(restated)%
Cash and balances with banks and other financial institutions 44,411 4.8 22,086 2.7
Placings with and advances to banks and other financial institutions 110,564 12.1 104,551 12.6
Trading assets 26,055 2.8 66,597 8.0
Financial assets designated at fair value 7,114 0.8 5,450 0.6
Advances to customers 472,637 51.6 344,621 41.5
Financial investments 199,359 21.7 241,502 29.1
Other assets 56,771 6.2 45,861 5.5
Total assets 916,911 100.0 830,668 100.0
Advances to Customers
At 31 December 2010, gross advances to customers were up HK$127.9bn, or 36.9%, at HK$474.5bn compared with the previous year-end. Riding on the improved economic conditions and the increased scope of renminbi business in Hong Kong, the Bank leveraged its balance sheet strength to record encouraging lending growth in all core market sectors.
Loans for use in Hong Kong increased by HK$76.2bn, or 26.2%. Riding in part on the buoyancy of property and investment markets, the Bank achieved strong growth in lending to the property development and property investment sectors. The Bank continued to actively participate in the Hong Kong government’s SME Loan Guarantee and Special Loan Guarantee schemes. Lending to customers in the manufacturing and wholesale and retail trade sectors grew by 40.6% and 46.4% respectively. The increase in lending to transport and transport equipment and information technology sectors was mainly due to new drawdowns by a number of large Commercial Banking customers. Growth in lending to “Other” was attributable to new working capital financing for several large corporations.
Lending to individuals rose by HK$19.7bn, or 14.3%. Residential mortgage lending to individuals grew by 16.3% and the Bank maintained its position as one of the leading providers of residential mortgages in Hong Kong amid intense market competition.
Against a backdrop of robust domestic consumption, card advances grew by 13.9%, supported by an 11.2% rise in the number of cards in issue and an 18.4% increase in cardholder spending. Lending to the “Other” sector, including mainly personal loans and overdrafts, rose by 15.2%, due in part to a series of successful promotional initiatives.
Commercial Banking strengthened its cross-border service proposition to offer a full range of renminbi commercial banking services and serve the growing demand from customers for renminbi-related financial solutions. This largely underpinned the 231.3% growth in trade financing.
Loans for use outside Hong Kong increased by 20.0%, due largely to the 28.4% expansion in the mainland loan portfolio, which stood at HK$36.4bn at 2010 year-end. The Group remained vigilant in assessing credit risk in increasing lending on the Mainland.
Assets Deployment for 2010
Advances to customers
Financial investments
Placings with and advances to banks
Other assets
Cash and balances with banks
Trading assets
Financial assets designated at fair value
51.6%
12.1%
6.2%
21.7%
4.8%0.8%2.8%
Assets Deployment for 2009
Advances to customers
Financial investments
Placings with and advances to banks
Other assets
Cash and balances with banks
Trading assets
Financial assets designated at fair value
41.5%12.6%
5.5%
29.1%
2.7%
0.6%8.0%
ANNUAL REPORT 2010 77

Customer Deposits
Customer deposits and certificates of deposit and other debt securities in issue stood at HK$710.3bn at 31 December 2010, an increase of 7.0% over the end of 2009. Growth was recorded in savings and current account balances. The increase in time and other deposits mainly reflects the 76.1% growth in customer deposits with Hang Seng China.
Shareholders’ funds
Figures in HK$m2010 2009
(restated)
Share capital 9,559 9,559
Retained profits 42,966 37,752
Premises revaluation reserve 9,426 7,885
Cash flow hedging reserve 72 174
Available-for-sale investment reserve
– on debt securities (25) (496)
– on equity securities 227 239
Capital redemption reserve 99 99
Other reserves 4,055 3,303
Total reserves 56,820 48,956
66,379 58,515
Proposed dividends 3,633 3,633
Shareholders’ funds 70,012 62,148
Return on average shareholders’ funds 22.8% 22.9%
Subordinated Liabilities
The outstanding subordinated notes, which qualify as supplementary capital, serve to help the Bank maintain a more balanced capital structure and support business growth.
Customer Deposits for 2010
Savings accounts
Time and other deposits
Demand and current accounts
Certificates of deposit and other debt securities in issue
65.6%
25.3%
8.3%0.8%
Customer Deposits for 2009
Savings accounts
Time and other deposits
Demand and current accounts
Certificates of deposit and other debt securities in issue
65.9%
25.3%
8.0%0.8%
HANG SENG BANK78
MANAGEMENT DISCuSSION AND ANALYSISFINANCIAL REVIEW

Shareholders’ funds (excluding proposed dividends) grew by HK$7,864m, or 13.4%, to HK$66,379m at 31 December 2010. Retained profits rose by HK$5,214m, mainly reflecting the growth in 2010 profit after the appropriation of interim dividends. The premises revaluation reserve increased by HK$1,541m, or 19.5%, compared with 2009, boosted by the robust property market. The premises revaluation reserve for 2010 and 2009 includes leasehold land held under a long lease for the Bank’s headquarters building after adopting the amendments to HKAS 17 “Leases” in 2010.
The available-for-sale investment reserve for debt securities recorded a deficit of HK$25m compared with a deficit of HK$496m at 2009 year-end, reflecting the improvement in global credit markets and the disposal of high-risk assets under the Bank’s prudent risk management strategy. The Group assessed that there were no impaired debt securities during the year, and accordingly, no impairment loss has been recognised.
The return on average shareholders’ funds was 22.8%, compared with 22.9% for 2009.
Excluding the redemption of all the (1) Series A – HK$1,000m 4.125% subordinated notes due 2015 and (2) Series B – HK$1,500m floating rate subordinated notes due 2015, both at par on 24 June 2010, there was no purchase, sale or redemption by the Bank, or any of its subsidiaries, of the Bank’s securities during 2010.
RISK MANAGEMENT
The effectiveness of the Group’s risk management policies and strategies is a key success factor. Operating in the financial services industry, the most important types of risks the Group is exposed to are credit, liquidity, market, legal, operational, reputational and strategic. The Group has established policies and procedures to identify, measure, analyse and actively manage the risks and to set appropriate risk limits to control this broad spectrum of risks. In line with best practices, the Bank’s Risk Management Committee exercises oversight of the risk management framework for the Bank. The Risk Management Committee is constituted by the Board and accountable to the Executive Committee. Its main functions are to review, analyse, evaluate, recognise and manage various risks of the Bank
and is responsible for approval of all risk management related policies and major control limits. Risk limits are monitored and controlled continually by dedicated departments by means of reliable and up-to-date management information systems. The management of various types of risks is well coordinated at the level of the Bank’s Board and various Management committees, such as, the Executive Committee, Risk Management Committee and Asset and Liability Management Committee.
Note 61 “Financial risk management” to the financial statements provides a detailed discussion and analysis of the Group’s credit risk, liquidity risk, market risk, insurance risk, operational risk and capital management. The management of reputational risk is set out as follows:
Reputational risks can arise from social, ethical or environmental issues, or as a consequence of operational risk events. Standards are set and policies and procedures are established in all areas of reputational risk and are communicated to staff at all levels. These include fair and transparent dealings with customers, conflicts of interest, money laundering deterrence, environmental impact and anti-corruption measures. The reputational downside to the Group is fully appraised before any strategic decision is taken.
The Group is a socially and environmentally responsible organisation. Its corporate responsibility policies and practices are discussed in the corporate responsibility section of this annual report.
ANNUAL REPORT 2010 79

* Dr Raymond CH’IEN Kuo Fung GBS, CBE, JP
Chairman Aged 59 Joined the Board since August 2007
Other position held within Hang Seng Group^ Hang Seng Bank Limited – Member of the Remuneration
Committee (Note 1)
Other major appointments^ CDC Corporation – Chairman^ CDC Software Corporation – Director^ China.com Inc – Chairman^ China Resources Power Holdings Company Limited – INED^ Convenience Retail Asia Limited – INED Federation of Hong Kong Industries – Honorary President Hong Kong Mercantile Exchange Limited – INED^ MTR Corporation Limited – Non-executive Chairman^ Swiss Reinsurance Company Limited – INED The Hongkong and Shanghai Banking Corporation Limited
– INED The Hong Kong/European Union Business Cooperation
Committee – Chairman The Tianjin Municipal Committee of the Chinese People’s Political
Consultative Conference – Member of Standing Committee^ The Wharf (Holdings) Limited – INED University of Pennsylvania, USA – Trustee
Past major appointments The APEC Business Advisory Council – Hong Kong Member
(2004-2009)^ Inchcape plc – INED (1997-2009)^ HSBC Holdings plc – INED (1998-2007) HSBC Private Equity (Asia) Limited – Chairman
(1997-2010) (Note 1) Independent Commission Against Corruption –
Chairman of Advisory Committee on Corruption (1998-2006) Executive Council of HKSAR Government –
Member (1997-2002) Executive Council of Hong Kong, then under British
Administration – Member (1992-1997)
Qualification Doctoral Degree in Economics – University of Pennsylvania, USA
Major awards Chevalier de l’Ordre du Merite Agricole of France (2008) Gold Bauhinia Star (1999) Commander in the Most Excellent Order of
the British Empire (1994) Justice of the Peace (1993)
Mrs Margaret LEuNG KO May Yee JP
Vice-Chairman and Chief Executive Aged 58 Joined the Board since April 2009
Other positions held within Hang Seng Group^ Hang Seng Bank Limited – Chairman of Executive Committee Hang Seng Bank (China) Limited – Chairman Hang Seng Indexes Company Limited – Chairman of
Hang Seng Index Advisory Committee Hang Seng Insurance Company Limited – Chairman Chairman of other subsidiaries in Hang Seng Group
Other major appointments Chinese Bankers Club, Hong Kong – Honorary President (Note 1) Hang Seng Management College Limited – Chairman of
the Board of Governors Hang Seng School of Commerce – Chairman of the Board;
Supervisor HKSAR Commission on Strategic Development – Member Ho Leung Ho Lee Foundation – Member of Board of Trustees Hong Kong Baptist University – Member of the Court Hong Kong University Alumni Association –
Honorary Vice-President^ HSBC Holdings plc – Group General Manager^ Hutchison Whampoa Limited – INED Securities and Futures Commission – Member of
Advisory Committee^ Swire Pacific Limited – INED
HANG SENG BANK80
BIOGRAPHICAL DETAILS OF DIRECTORS

The Community Chest of Hong Kong – Board Member; Second Vice President; Chairman of Campaign Committee
The Guangzhou Municipal Committee of the Chinese People’s Political Consultative Conference – Member
The Henan Provincial Committee of the Chinese People’s Political Consultative Conference – Member of Standing Committee
The Hongkong and Shanghai Banking Corporation Limited – Director
The University of Hong Kong – Member of the Council
Past major appointments Hong Kong Export Credit Insurance Corporation –
Member of Advisory Board (2005-2010) (Note 1) HSBC Group – Global Co-Head Commercial Banking
(2003-2009) Wells Fargo HSBC Trade Bank, NA – Director
(2007 – February 2010)
Qualification Bachelor’s Degree in Economics, Accounting and Business
Administration – The University of Hong Kong
Major award Justice of the Peace (2009)
* Dr John CHAN Cho Chak GBS, JP
Director Aged 67 Joined the Board since August 1995
Other position held within Hang Seng Group^ Hang Seng Bank Limited – Chairman of
Remuneration Committee
Other major appointments^ Guangdong Investment Limited – INED Long Win Bus Company Limited – NED^ RoadShow Holdings Limited – Chairman and NED Swire Properties Limited – INED Sir Edward Youde Memorial Fund – Chairman of the Council The Community Chest of Hong Kong – Vice Patron The Hong Kong Monetary Authority – Member of The Exchange
Fund Advisory Committee
The Hong Kong University of Science and Technology – Chairman of the Court
The Kowloon Motor Bus Company (1933) Limited – NED^ Transport International Holdings Limited – NED
Past major appointments HKSAR Commission on Strategic Development –
Non-Official Member (2005-2009)^ Hong Kong Exchanges and Clearing Limited – INED
(2000-2003) Hong Kong Civil Service – Private Secretary to the Governor;
Deputy Secretary (General Duties); Director of Information Services; Deputy Chief Secretary; Secretary for Trade and Industry; Secretary for Education and Manpower (1964-1978; 1980-1993)
The Hong Kong Jockey Club – Chairman (2006-2010) (Note 1)
Qualifications Degree of Doctor of Social Sciences (honoris causa) –
The Hong Kong University of Science and Technology Degree of Doctor of Business Administration (honoris causa) –
International Management Centres Diploma in Management Studies – The University of Hong Kong Honours Degree in English Literature – The University of
Hong Kong
Major awards Gold Bauhinia Star (1999) Justice of the Peace (1994)
* Dr Marvin CHEuNG Kin Tung GBS, OBE, JP
Director Aged 63 Joined the Board since May 2004
Other position held within Hang Seng Group^ Hang Seng Bank Limited – Member of Audit Committee
Other major appointments Airport Authority Hong Kong – Chairman Barristers Disciplinary Tribunal – Member Executive Council of HKSAR Government – Non-official Member^ HKR International Limited – INED
ANNUAL REPORT 2010 81

^ Hong Kong Exchanges and Clearing Limited – INED Hong Kong University of Science and Technology –
Chairman of the Council^ HSBC Holdings plc – INED; Audit Committee member The Tracker Fund of Hong Kong – Chairman of the
Supervisory Committee
Past major appointments^ Sun Hung Kai Properties Limited – INED (2007-2009) Independent Commission Against Corruption – Member of
Operations Review Committee (2004-2009) KPMG Hong Kong – Chairman and Chief Executive Officer
(1996-2003)
Qualifications Fellow – Hong Kong Institute of Certified Public Accountants Fellow – Institute of Chartered Accountants in England and Wales Doctor of Business Administration (Honours) –
Hong Kong Baptist University
Major awards Gold Bauhinia Star (2008) Silver Bauhinia Star (2000) Officer of the Most Excellent Order of the British Empire (1993) Justice of the Peace (1991)
* Ms CHIANG Lai Yuen Director
Aged 45 Joined the Board since September 2010
Other major appointments^ Chen Hsong Holdings Limited – Executive Director;
Chief Executive Officer Chen Hsong Investments Limited – Director China Shenzhen Machinery Association – Vice-President Directorate Salaries and Conditions of Service of
HKSAR Government – Member of Standing Committee Shenzhen Federation of Industrial Economics – Vice-Chairman The Hong Kong University of Science and Technology –
Member of the Council The Open University of Hong Kong – Member of the Council The Shenzhen Committee of the Chinese People’s Political
Consultative Conference – Member of Standing Committee The Toys Manufacturers’ Association of Hong Kong –
Vice-President
Past major appointment Disciplined Services Salaries and Conditions of Service of
HKSAR Government – Member of Standing Committee (retired in December 2010) (Note 1)
Qualification Bachelor Degree of Arts – Wellesley College, USA
Major award “Young Industrialist Awards of Hong Kong” by the Federation of
Hong Kong Industries (2004)
* Mr Jenkin HuI Director Aged 67
Joined the Board since August 1994 Other position held within Hang Seng Group^ Hang Seng Bank Limited – Member of Remuneration Committee
Other major appointments Central Development Limited – Director Hongkong Land Holdings Limited – Director Jardine Matheson Holdings Limited – Director Jardine Strategic Holdings Limited – Director Pointpiper Investment Limited – Chief Executive
# Ms Sarah Catherine LEGG Director
Aged 43 Joined the Board since February 2011
Other major appointments The Hongkong and Shanghai Banking Corporation Limited –
Chief Financial Officer HSBC Bank Bahamas Limited – President (subject to approval of
The Central Bank of Bahamas) HSBC Markets (Bahamas) Limited – President HSBC Securities Investments (Asia) Limited – Director The Hong Kong Society for Rehabilitation – Honorary Treasurer Director of other subsidiaries in HSBC Group
Past major appointments The Hongkong and Shanghai Banking Corporation Limited –
Chief Accounting Officer (2006-2010)^ HSBC Holdings plc – Senior Manager, Finance Transformation
(2003-2006) HSBC Bank plc – Head of Product Control, Global Banking
and Markets (1999-2003)
Qualifications Master of Arts – King’s College, Cambridge University Fellow – Chartered Institute of Management Accountants Member – Association of Corporate Treasurers
Mr William LEuNG Wing Cheung BBS, JP
Executive Director and Head of Personal Banking Aged 56 Joined the Board since August 2009
Other positions held within Hang Seng Group^ Hang Seng Bank Limited – Head of Personal Banking (responsible
for the Bank’s branch network and all businesses and services for personal accounts); member of Executive Committee
Hang Seng General Insurance (Hong Kong) Company Limited – Chairman
Hang Seng Insurance Company Limited – Director Chairman or Director of other subsidiaries in Hang Seng Group
Other major appointments EPS Company (Hong Kong) Limited – Director Hang Seng Management College Limited – Member of the Board
of Governors Hang Seng School of Commerce – Director Hong Kong Academy for Performing Arts – Chairman of
the Council Hong Kong Baptist University – Treasurer of the Council and
the Court; Chairman of Finance Committee Hong Kong Creative Arts Centre Limited – Chairman HSBC Global Asset Management (Hong Kong) Limited – Director^ Industrial Bank Co., Ltd. – Member of Management Committee of
Credit Card Centre
HANG SENG BANK82
BIOGRAPHICAL DETAILS OF DIRECTORS

MasterCard Asia/Pacific, Middle East & Africa Regional Advisory Board – Director
TransUnion Limited – Director West Kowloon Cultural District Authority – Member of
Consultation Panel Yantai Bank Co., Ltd. – Director
Past major appointments^ Hang Seng Bank Limited
General Manager, Personal Financial Services and Wealth Management (2005-2009)General Manager and Head of Wealth Management (2005)Deputy General Manager and Deputy Head of Commercial Banking (2003-2005) Deputy General Manager and Deputy Head of Retail Banking (2000-2003)Assistant General Manager and Head of Credit Card Centre (1994-2000)
Hong Kong Baptist University – Honorary Associate of School of Business (2005-2010) (Note 1)
Securities and Futures Commission – Member of Investor Education Advisory Committee (2008-2010)
Qualification Diploma of Arts in English Language and Literature –
Hong Kong Baptist College
Major awards Bronze Bauhinia Star (2009) Justice of the Peace (2005)
* Dr Eric LI Ka Cheung GBS, OBE, JP
Director Aged 57 Joined the Board since February 2000
Other position held within Hang Seng Group^ Hang Seng Bank Limited – Chairman of Audit Committee
Other major appointments^ Bank of Communications Co., Ltd. – INED; Chairman of
Audit Committee^ China Resources Enterprise, Limited – INED; Chairman of
Audit Committee HKSAR Commission on Strategic Development – Member Hong Kong Monetary Authority – Chairman of Process
Review Committee Li, Tang, Chen & Co, Certified Public Accountants –
Senior Partner Long Win Bus Company Limited – INED^ RoadShow Holdings Limited – INED; Chairman of
Audit Committee^ SmarTone Telecommunications Holdings Limited – INED;
Chairman of Audit Committee^ Sun Hung Kai Properties Limited – INED; Chairman of
the Audit Committee The Financial Reporting Council – Convenor of Financial Reporting
Review Committee The Hong Kong Jockey Club – Steward (Note 1) The Hong Kong Institute of Education – Treasurer of the Council The Kowloon Motor Bus Company (1933) Limited – INED;
Chairman of Audit Committee The Eleventh National Committee of the Chinese People’s Political
Consultative Conference – Member
^ Transport International Holdings Limited – INED; Chairman of Audit Committee
^ Wong’s International (Holdings) Limited – INED; Chairman of Audit Committee
Past major appointments The International Federation of Accountants – Board Member
(2004-2006) The Legislative Council of Hong Kong – Member (1991-2004);
Chairman of Public Accounts Committee (1995-2004) Meadville Holdings Limited – INED; Chairman of Remuneration
Committee (2007-2010)
Qualifications BA (Economics) Honours Degree – University of Manchester, UK Fellow – Hong Kong Institute of Certified Public Accountants
(Practising) Hon Doctor of Laws – University of Manchester, UK Hon Doctor of Social Sciences – Hong Kong Baptist University Hon Fellow – The Chinese University of Hong Kong Hon Fellow – The Hong Kong Polytechnic University
Major awards Gold Bauhinia Star (2003) Officer of the Most Excellent Order of the British Empire (1996) Justice of the Peace (1991)
# Dr Vincent LO Hong Sui GBS, JP
Director Aged 62 Joined the Board since February 1999
Other major appointments APEC Business Advisory Council – Hong Kong’s Representative Business and Professionals Federation of Hong Kong –
Honorary Life President Chongqing Municipal Government – Economic Adviser^ Great Eagle Holdings Limited – NED Shanghai-Hong Kong Council for the Promotion and Development
of Yangtze – President Shanghai Tongji University; Shanghai University –
Advisory Professorship ^ Shui On Construction and Materials Limited – Chairman Shui On Group – Chairman^ Shui On Land Limited – Chairman and Chief Executive Officer The Eleventh National Committee of the Chinese People’s Political
Consultative Conference – Member The Hong Kong University of Science and Technology –
Honorary Court Chairman
Past major appointments^ China Telecom Corporation Limited – INED (retired in 2008)^ New World China Land Limited – NED (retired in 2004)
Qualification Doctorate in Business Administration (honoris causa) –
The Hong Kong University of Science and Technology
Major awards “Ernst & Young Entrepreneur Of The Year 2009” in the China Real
Estate Category (2009) “Ernst & Young Entrepreneur Of The Year 2009 China” country
award winner (2009) Chevalier des Arts et des Lettres by the French Government
(2005)
ANNUAL REPORT 2010 83

Director of the Year in the category of Listed Company Executive Directors by The Hong Kong Institute of Directors in 2002 (2002)
Businessman of the Year award in the Hong Kong Business Awards 2001 (2001)
Justice of the Peace (1999) Gold Bauhinia Star (1998)
# Mr Mark Seumas MCCOMBE OBE
Director Aged 44 Joined the Board since February 2011
Other major appointments^ HSBC Holdings plc – Group General Manager The Hongkong and Shanghai Banking Corporation Limited –
Chief Executive Officer, Hong Kong HSBC Global Asset Management (Hong Kong) Limited –
Chairman and Director HSBC Insurance (Asia) Limited – Director HSBC Jintrust Fund Management Company Limited –
Vice-Chairman and Director HSBC Life (International) Limited – Director HKICL Services Limited – Chairman and Director Hong Kong Association of Banks – Member of the Committee^ Hong Kong Exchanges and Clearing Limited – Member of
the Risk Management Committee Hong Kong Interbank Clearing Limited – Chairman and Director Hong Kong Monetary Authority – Member of
Banking Advisory Committee
Past major appointments HSBC Trinkaus & Burkhardt AG – Director and Audit Committee
Member (2009-2010) HSBC Global Asset Management – Global Chief Executive Officer
(2007-2010) HSBC Private Bank, UK, Channel Islands and Luxembourg –
Chief Executive Officer (2006-2007) HSBC Private Bank (UK) Limited – Chief Executive (2005-2006) HSBC Turkey – Deputy Chief Executive Officer (2003-2005) HSBC Republic Bank, France – Chief Executive Officer
(2000-2003)
Qualification Master of Arts – Aberdeen University
Major award Officer of the Most Excellent Order of the British Empire (2006)
# Mrs Dorothy SIT KWAN Yin Ping Director
Aged 59 Joined the Board since August 2009
Other positions held within Hang Seng Group Hang Seng Bank (China) Limited – Vice Chairman;
Chief Executive; Chairman of Executive Committee
Past major appointments The Banking Industry Training Advisory Committee –
Member (2006-2009); Ex-officio Member of its Sub-committee on Specification of Competency Standards Development (2007-2009)
^ Hang Seng Bank Limited – General Manager (2005-2009); Chief Operating Officer (2006-2009)
The Hongkong and Shanghai Banking Corporation Limited – Joined as management trainee and held various managerial positions in retail banking, operations and systems, mainland China project finance, internal audit, marketing, channel development and management, wealth management and retail investments (1976-2003) and was Head of Personal Financial Services, Hong Kong (2004-2005)
Bank of Shanghai – Director (2004-2005) EPS Company (Hong Kong) Limited – Chairman (2004-2005)
Qualification Master’s Degree in Business Administration –
The Chinese University of Hong Kong
* Mr Richard TANG Yat Sun BBS, JP
Director Aged 58 Joined the Board since August 1995
Other positions held within Hang Seng Group^ Hang Seng Bank Limited – Member of Audit Committee Hang Seng Bank (China) Limited – Supervisor
Other major appointments Correctional Services Children’s Education Trust Investment
Advisory Board – Chairman Customs and Excise Service Children’s Education Trust Fund
Committee – Chairman Hong Kong Commercial Broadcasting Company Limited –
Director Hong Kong Institute of Certified Public Accountants –
Member of Disciplinary Panel A^ King Fook Holdings Limited – Vice Chairman^ Miramar Hotel & Investment Company, Limited – Director Richcom Company Limited – Chairman and Managing Director Tang Shiu Kin and Ho Tim Charitable Fund – Advisor
Qualifications Bachelor of Science Degree in Business Administration –
Menlo College, California, USA Master’s Degree in Business Administration – University of
Santa Clara, California, USA
Major awards Bronze Bauhinia Star (2000) Justice of the Peace (1997)
# Mr Peter WONG Tung Shun JP
Director Aged 59 Joined the Board since May 2005
Other major appointments^ Bank of Communications Co., Ltd. – NED^ Cathay Pacific Airways Limited – INED Greater Pearl River Delta Business Council – Member Hong Kong General Chamber of Commerce – Director;
member of General Committee Hong Kong Institute for Monetary Research – Member of
the Board of Directors (Note 1)
HANG SENG BANK84
BIOGRAPHICAL DETAILS OF DIRECTORS

Hong Kong Monetary Authority – Member of Exchange Fund Advisory Committee
HSBC Bank (China) Company Limited – Deputy Chairman and NED
HSBC Bank Malaysia Berhad – Chairman and NED HSBC Bank (Vietnam) Ltd – Vice-Chairman and NED^ HSBC Holdings plc – Group Managing Director; member of
Group Management Board^ Ping An Insurance (Group) Company of China, Ltd. – NED The Hongkong and Shanghai Banking Corporation Limited –
Chief Executive; Executive Director The Hong Kong Institute of Bankers – President The Tenth Hubei Provincial Committee of the Chinese People’s
Political Consultative Conference – Member
Past major appointments^ Hong Kong Exchanges and Clearing Limited – Member of
Risk Management Committee (2010) Hong Kong Monetary Authority – Member of Banking
Advisory Committee (2005-2010) Hong Kong Trade Development Council – Chairman of
Financial Services Advisory Committee (2006-2010) HSBC Bank Australia Limited – NED (2010-2011) (Note 1) The Hong Kong Association of Banks – Chairman (2009)
Qualifications Bachelor’s Degree in Computer Science; MBA in Marketing and
Finance; MSc in Computer Science – Indiana University, USA
Major award Justice of the Peace (2002)
* Mr Michael Wu Wei Kuo Director
Aged 40 Joined the Board since September 2010
Other major appointments Hongkong Caterers Limited – Executive Director and
Company Secretary Hong Kong Retail Management Association –
Executive Committee Member Maxim’s Caterers Limited – Chairman and Managing Director The Community Chest of Hong Kong – Board Member
Qualification Bachelor of Science in Applied Mathematics and Economics –
Brown University, USA
Major Award “Executive Award” of the DHL/SCMP Hong Kong Business
Awards (2008)
* Independent Non-executive Directors (“INED”)# Non-executive Directors (“NED”)^ The securities of these companies are listed on a securities
market in Hong Kong or overseas.
Notes:
1 New appointments or cessation of appointments since the date of the Bank’s 2010 Interim Report or (as the case may be) the date(s) of announcement(s) for the appointment of Director(s) issued by the Bank subsequent to the date of the Bank’s 2010 Interim Report.
2 The interests of Directors in shares of the Bank, if any, within the meaning of Part XV of the Securities and Futures Ordinance (“SFO”) as at 31 December 2010 are disclosed in the section “Directors’ and Alternate Chief Executives’ Interests” of the Report of the Directors attached to the Bank’s 2010 Annual Report.
3 Some Directors (as disclosed in the section “Biographical Details of Directors” of the Bank’s 2010 Annual Report) are also Directors of HSBC Holdings plc (“HSBC”) and/or its subsidiaries. HSBC, through its wholly owned subsidiaries, has an interest in the shares of the Bank under the provisions of Divisions 2 and 3 of Part XV of the SFO, the details of which are disclosed in the section “Substantial Interests in Share Capital” of the Report of the Directors attached to the Bank’s 2010 Annual Report.
4 Save as disclosed in the section “Biographical Details of Directors” of the Bank’s 2010 Annual Report, the Directors (a) have not held any directorships in other publicly listed companies, whether in Hong Kong or overseas, during the last 3 years; (b) do not hold any other positions in the Bank and its subsidiaries; and (c) do not have any other relationships with any Directors, senior management or substantial or controlling shareholders of the Bank, except that Mr Michael W K Wu’s spouse is the niece of Dr Vincent H S Lo, a Non-executive Director of the Bank.
5 All Directors (except those Directors who are full time employees of the Bank or its subsidiaries) will receive Directors’ fees in the amounts approved from time to time by shareholders at the Annual General Meetings of the Bank. The current amounts of Directors’ fees have been determined with reference to market rates, directors’ workload and required commitment. A Director will also receive a fee for duties assigned to and services provided by him/her as Chairman or member of various Committees of the Bank. Such fees have been determined with reference to the remuneration policy of the Bank.
6 Commencing from 1 January 2008, no Directors’ fees will be paid to those Directors who are full time employees of the Bank or its subsidiaries. The salary packages of such Directors have been determined with reference to the remuneration policy of the Bank. Such Directors are also entitled to discretionary bonus.
7 The details of the emoluments of the Directors on a named basis are disclosed in Note 19 of the Bank’s Financial Statements as contained in the Bank’s 2010 Annual Report.
8 None of the Directors, except Mr William W Leung has signed service contracts with the Bank. However, the Bank’s Articles of Association provide that each Director is required to retire by rotation once every three years and that one-third (or the number nearest to one-third) of the Directors shall retire from office every year at the Bank’s Annual General Meeting. A Director’s specific term of appointment, therefore, cannot exceed three years. Every retiring Director shall be eligible for re-election at the Annual General Meetings of the Bank.
9 Biographical details of Directors of the Bank are also available on the website of the Bank (www.hangseng.com).
ANNUAL REPORT 2010 85

From left to right: Mr Nixon L S Chan, Mrs Dorothy K Y P Sit (Vice-Chairman and Chief Executive of Hang Seng Bank (China) Limited),
Mrs Margaret Leung, Mr Andrew H C Fung, Mr William W Leung
Mrs Margaret LEuNG KO May YeeJP
Vice-Chairman and Chief Executive
(Biographical details are set out on pages 80 and 81)
Mr William LEuNG Wing CheungBBS, JP
Executive Director and Head of Personal Banking
(Biographical details are set out on pages 82 and 83)
Mr Andrew FuNG Hau ChungGeneral Manager and Head of Treasury and InvestmentAged 53Joined the Bank since May 2006
Major positions held within Hang Seng GroupHang Seng Bank Limited – General Manager and Head of Treasury
and Investment; member of Executive CommitteeHang Seng Insurance Company Limited – DirectorHang Seng Investment Management Limited – Director and
General Manager
Other major appointmentsBusiness Facilitation Advisory Committee – Non-official memberThe Federation of Hong Kong Industries – Member of
General CommitteeIndustrial Bank Co., Ltd. – Director; member of
Executive Committee; member of Remuneration and Examination Committee
Securities and Futures Commission – Member of Process Review Panel; Member of Products Advisory Committee
The Hong Kong Mortgage Corporation Limited – Director
HANG SENG BANK86
BIOGRAPHICAL DETAILS OF SENIOR MANAGEMENT
Past major positionsHang Seng Bank Limited General Manager and Head of Investment and Insurance
(2008-2009) Deputy General Manager and Head of Investment and Insurance
(2006-2008)DBS Bank Limited – Managing Director, Advisory Sales,
Greater China, Wholesale Banking – Global Financial Markets (2002-2006)
QualificationsBachelor of Arts Degree – The University of Hong KongHonorary Fellowship – Lingnan University
Mr Nixon CHAN Lik SangHead of Corporate and Commercial BankingAged 58Joined the Bank since October 2009
Major positions held within Hang Seng GroupHang Seng Bank Limited – Head of Corporate and Commercial
Banking; member of Executive CommitteeHang Seng Indexes Company Limited – Member of Hang Seng
Index Advisory CommitteeHang Seng Insurance Company Limited – Director
Other major appointmentsHang Seng Management College Limited – Member of
the Board of GovernorsHang Seng School of Commerce – DirectorSmall and Medium Enterprises Committee – Member
Past major positionsThe Hongkong and Shanghai Banking Corporation Limited Senior Executive, Commercial Banking (2005-2009) Held various senior positions in commercial banking and
personal financial services (1993-2005)
QualificationBachelor Degree in Business Administration –
University of Hawaii, USA
Mr Joseph CHO Tak ChiHead of Branch Network and Direct BankingAged 53Joined the Bank in June 1995 (left in 1997) and rejoined in October 2004
Major position held within Hang Seng GroupHang Seng Bank Limited – Head of Branch Network and
Direct Banking
Other major appointmentsHong Kong Deposit Protection Board – Member of Consultative
Committee on Deposit Protection SchemeThe Hong Kong Association of Banks – Member of Task Force
on Financial Service Delivery Channels; member of Renminbi Services Working Group
Education Bureau of HKSAR Government – Member of Banking Industry Training Advisory Committee
Past major positionsHang Seng Bank Limited Assistant General Manager and Head of Branch Network and
Direct Banking (2006-2008) Senior Manager and Head of Branch Network and Direct Banking
(2005-2006) Senior Manager and Head of Customer Management and
Marketing (2004-2005) Senior Retail Planning Manager (1995-1997)
QualificationsCertified Financial Management Planner – The Hong Kong Institute
of BankersCertified Manager of Financial Advisors and Chartered Insurance
Agency Manager – LIMRA InternationalCertified Management Consultant – Institute of Management
Consultants Hong KongFellow – Financial Services Institute of Australasia, AustraliaFellow, Life Management Institute – LOMAGraduate Diploma in Management Consulting and Change –
The University of Hong KongMaster of Science Degree in Management Sciences –
University of Manchester, UK
Mr Christopher HO Hing NinChief Technology and Services OfficerAged 58Joined the Bank since July 2009
Major positions held within Hang Seng GroupHang Seng Bank Limited – Chief Technology and Services Officer;
member of Executive CommitteeHang Seng Real Estate Management Limited – DirectorHang Seng Security Management Limited – Director
Other major appointmentsUrban Renewal Authority – Member of Central Oasis Community
Advisory CommitteeEducation Bureau of HKSAR Government – Member of Banking
Industry Training Advisory Committee
Past major positionsThe Hongkong and Shanghai Banking Corporation Limited Head of Service Delivery Asia Pacific (2009) Held various senior positions in banking operations and personal
financial services (1992-2008)
QualificationMSc in Management Information Systems –
Sheffield Hallam University, UK
Mr Andrew LEuNG Wing LokChief Financial OfficerAged 48Joined the Bank in July 1997 (left in 2006) and rejoined in July 2009
Major positions held within Hang Seng GroupHang Seng Bank Limited – Chief Financial Officer; member of
Executive Committee Hang Seng Bank (China) Limited – DirectorHang Seng Insurance Company Limited – Director
ANNUAL REPORT 2010 87

Other major appointmentIndustrial Bank Co., Ltd. – Member of Credit Card Centre
Management Committee
Past major positionsHang Seng Bank Limited Senior Manager and Deputy Head of China Business (2005-2006) Senior Manager and Deputy Head of Greater China Business
(2003-2005) Senior Manager of Corporate Banking (2001-2003) Senior Manager and Deputy Head of Financial Control
(1997-2001)
QualificationsAssociate – The Hong Kong Institute of Chartered SecretariesAssociate – The Institute of Chartered Secretaries and
AdministratorsBachelor of PRC Law – Peking University, PRCBachelor of Social Sciences (Major in Management) –
The University of Hong KongCertified Member – Certified Management Accountants Society of
British Columbia, CanadaFellow – Chartered Association of Certificated AccountantsFellow – Hong Kong Institute of Certified Public AccountantsMaster of Science, Data processing – University of Ulster, UKMaster of Science in Electronic Commerce and
Internet Computing – The University of Hong Kong
Mr NG Yuen TinHead of Corporate BankingAged 59Joined the Bank since July 1971 (will retire in May 2011)
Major positions held within Hang Seng GroupHang Seng Bank Limited – Head of Corporate BankingHang Seng Finance Limited – Director and Chief ExecutiveHang Seng Indexes Company Limited – DirectorHSI International Limited – Director
Other major appointmentThe Hong Kong Institute of Bankers – Member of
Executive Committee
Past major positionsHang Seng Bank Limited Assistant General Manager and Head of Corporate and
Institutional Banking Division (1999-2000) Assistant General Manager and Deputy Head of Corporate
Banking Division (1994-1999)
QualificationFellow – The Hong Kong Institute of Bankers
Mr David TAM Wai HungChief Risk OfficerAged 61Joined the Bank since March 1999
Major positions held within Hang Seng GroupHang Seng Bank Limited – Chief Risk Officer; member of
Executive Committee
Other major appointmentsBusiness and Professionals Federation of Hong Kong –
Vice-Chairman and Member of the Executive CommitteeHong Kong St John Ambulance – Council Member & Chairman of
Finance CommitteeReSource The Counselling Centre Limited – Chairman of the Council
Past major positionsHang Seng Bank Limited Deputy General Manager and Head of Commercial Banking,
Greater China (2007-2008) Deputy General Manager and Head of Commercial Banking
(2003-2006) Assistant General Manager and Head of Commercial Banking
(2002-2003) Assistant General Manager, Corporate Banking – Trade Finance
(1999-2002)The Hongkong and Shanghai Banking Corporation Limited Senior Executive, Payments and Cash Management, Asia-Pacific
(1998-1999) Senior Executive, Corporate and Institutional Banking (1997-1998)
QualificationsFellow – The Hong Kong Institute of BankersFellow – Chartered Institute of Bankers, UKMaster of Business Administration – University of Toronto
Mr Thomas TSuI Chun ManHead of Corporate Banking DesignateAged 49Joined the Bank in October 1994 (left in 1996) and re-joined
in June 1997
Major positions held within Hang Seng GroupHang Seng Bank Limited – Head of Corporate Banking Designate Hang Seng Investment Services Limited – DirectorHang Seng Securities Limited – Director
Past major positionsHang Seng Bank Limited Assistant General Manager and Head of Business Banking
(2002 – January 2011) Assistant General Manager and Head of Retail Services and Sales
(1999-2002) Senior Manager and Head of Retail Sales and Services
(1998-1999)
QualificationsAssociate – The Hong Kong Institute of BankersMember – Institute of Financial Planners of Hong Kong Master of Business Administration – Brunel University, UKBachelor of Social Science – The University of Hong Kong
HANG SENG BANK88
BIOGRAPHICAL DETAILS OF SENIOR MANAGEMENT

The Directors have pleasure in presenting their report together with the audited financial statements for the year ended 31 December 2010.
Principal Activities
The Bank and its subsidiaries and associates are engaged in the provision of banking and related financial services.
Profits
The consolidated profit of the Bank and its subsidiaries and associates for the year and the particulars of dividends which have been paid or declared are set out on pages 98 and 135 of this Annual Report respectively.
Major Customers
The Directors believe that the five largest customers of the Bank accounted for less than 30% of the total interest income and other operating income of the Bank for the year.
Subsidiaries
Particulars of the Bank’s principal subsidiaries as at 31 December 2010 are set out in note 37 to the financial statements for the year ended 31 December 2010.
Share Capital
No change in either the authorised or issued share capital took place during the year.
Donations
Charitable donations made by the Bank and its subsidiaries during the year amounted to HK$13.1m. For further details of the Bank’s corporate social responsibility activities and expenditures, please refer to the section “Corporate Responsibility” of this Annual Report.
Reserves
Profit attributable to shareholders, before dividends, of HK$14,917m (2009 restated: HK$13,138m) have been transferred to reserves. Distributable reserve of the Bank as at 31 December 2010 amounted to HK$20,556m (2009: HK$19,568m). Other movements in reserves are set out in the consolidated statement of changes in equity.
Directors
The Directors of the Bank who were in office as at the end of the year were Dr Raymond K F Ch’ien, Mrs Margaret Leung, Dr John C C Chan, Dr Marvin K T Cheung, Ms L Y Chiang, Mr Alexander A Flockhart, Mr Jenkin Hui, Mr William W Leung, Dr Eric K C Li, Dr Vincent H S Lo, Mr Iain J Mackay, Mrs Dorothy K Y P Sit, Mr Richard Y S Tang, Mr Peter T S Wong and Mr Michael W K Wu.
Both Mr Alexander A Flockhart and Mr Iain J Mackay resigned from the Board with effect from the close of business on 31 December 2010.
Ms L Y Chiang and Mr Michael W K Wu were appointed Directors of the Bank with effect from 20 September 2010. Mr Mark S McCombe and Ms Sarah C Legg were appointed Directors of the Bank with effect from 14 February 2011. They will retire under the provisions of the Bank’s Articles of Association and, being eligible, offer themselves for election at the forthcoming Annual General Meeting (“AGM”).
The Directors retiring by rotation in accordance with the Bank’s Articles of Association are Dr Raymond K F Ch’ien, Dr Marvin K T Cheung and Mr Jenkin Hui, who, being eligible, offer themselves for re-election at the forthcoming AGM.
No Director proposed for re-election or election, as the case may be, at the forthcoming AGM has a service contract with the Bank which is not determinable by the Bank within one year without payment of compensation (other than statutory compensation).
The biographical details of the Directors of the Bank are set out in the section “Biographical Details of Directors” of this Annual Report.
ANNUAL REPORT 2010 89
REPORT OF THE DIRECTORS

Status Of Independent
Non-executive Directors
The Bank has received from each Independent Non-executive Director an annual confirmation of his/her independence pursuant to Rule 3.13 of the Rules Governing the Listing of Securities on The Stock Exchange of Hong Kong Limited (“Stock Exchange”) (“the Listing Rules”) and the Bank still considers the Independent Non-executive Directors to be independent.
Directors’ And Alternate
Chief Executives’ Interests
Interests in shares
As at 31 December 2010, the interests of the Directors and Alternate Chief Executives in the shares, underlying shares of equity derivatives and debentures of the Bank and its associated corporations (all within the meaning of Part XV of the Securities and Futures Ordinance (“SFO”)) disclosed in accordance with the Listing Rules were detailed below.
PersonalInterests(held as
beneficialowner)
FamilyInterests(interestsof spouse
or childunder 18)
CorporateInterests
(interests ofcontrolled
corporation)Other
InterestsTotal
Interests
TotalInterests
as % of therelevant
issuedshare
capital
Number of Ordinary Shares of HK$5 each in the BankDirectors:Mrs Margaret Leung 21,000 – – – 21,000 0.00
Dr John C C Chan – – – 1,000(1) 1,000 0.00
Number of Ordinary Shares of uS$0.50 each in HSBC Holdings plcDirectors:Dr Raymond K F Ch’ien 55,988 – – – 55,988 0.00
Mrs Margaret Leung 97,532 – – 400,471(6) 498,003 0.00
Dr John C C Chan 20,234 – – 4,371(1) 24,605 0.00
Ms L Y Chiang 12,000 – 6,000(2) – 18,000 0.00
Mr Alexander A Flockhart – – – 1,231,453(3)&(6) 1,231,453 0.00
Mr Jenkin Hui 17,574 – 1,947,315(4) – 1,964,889 0.01
Mr William W Leung 37,845 – – 32,935(6) 70,780 0.00
Dr Eric K C Li – 39,490 – – 39,490 0.00
Mr Iain J Mackay 34,217 – – 255,033(6) 289,250 0.00
Mrs Dorothy K Y P Sit 41,585(5) 1,031 – 48,420(6) 91,036 0.00
Mr Peter T S Wong 249,925 17,599 – 308,025(6) 575,549 0.00
Alternate Chief Executives:Mr Nixon L S Chan 10,961 – – 34,496(6) 45,457 0.00
Mr Andrew H C Fung 4,064 – – 42,973(6) 47,037 0.00
Mr Christopher H N Ho 75,367 42,653 – 14,114(6) 132,134 0.00
Mr Andrew W L Leung 4,428 – – 848(6) 5,276 0.00
Mr David W H Tam 21,618 9,014 – 21,171(6) 51,803 0.00
HANG SENG BANK90
REPORT OF THE DIRECTORS

Notes:
(1) 1,000 shares in the Bank and 4,371 shares in HSBC Holdings plc were held by a trust of which Dr John C C Chan and his wife were beneficiaries.
(2) Ms L Y Chiang was entitled to fully control the voting power at general meetings of Happy Boom Enterprises Limited, a private company, which beneficially held all of those shares referred to above as her corporate interests.
(3) 230,112 shares were held by a trust of which Mr Alexander A Flockhart was one of the trustees.
(4) Mr Jenkin Hui was entitled to fully control the voting power at general meetings of Parc Palais Incorporated, a private company, which beneficially held all of those shares referred to above as his corporate interests.
(5) 8,046 shares were jointly held by Mrs Dorothy K Y P Sit and her husband.
(6) These represented interests in (i) options granted to Directors and Alternate Chief Executives under the HSBC Share Option Plans to acquire ordinary shares of US$0.50 each in HSBC Holdings plc and (ii) conditional awards of ordinary shares of US$0.50 each in HSBC Holdings plc under the HSBC Share Plans made in favour of Directors and Alternate Chief Executives, as set against their respective names below:
Options(please refer to
the options tablebelow for details)
Conditional awards of shares under the
HSBC Share Plans(please refer to the
awards table belowfor further information) Total
Directors:Mrs Margaret Leung 4,197 396,274 400,471Mr Alexander A Flockhart 4,529 996,812 1,001,341Mr William W Leung 8,051 24,884 32,935Mr Iain J Mackay 1,531 253,502 255,033Mrs Dorothy K Y P Sit 5,818 42,602 48,420Mr Peter T S Wong – 308,025 308,025
Alternate Chief Executives:Mr Nixon L S Chan 16,888 17,608 34,496Mr Andrew H C Fung 4,197 38,776 42,973Mr Christopher H N Ho 5,961 8,153 14,114Mr Andrew W L Leung – 848 848Mr David W H Tam 19,508 1,663 21,171
Options
As at 31 December 2010, the Directors and Alternate Chief Executives mentioned below held unlisted physically settled options to acquire the number of ordinary shares of US$0.50 each in HSBC Holdings plc set against their respective names. These options were granted for nil consideration by HSBC Holdings plc.
Optionsheld
as at31 December
2010
Optionsexercised/cancelledduring the
Director’s/Alternate Chief
Executive’sterm of office
in 2010
Exerciseprice
per shareDate
grantedExercisable
fromExercisable
until
Directors:Mrs Margaret Leung 4,197 – HK$37.8797 29 Apr 2009 1 Aug 2014 31 Jan 2015
Mr Alexander A Flockhart 4,529 – £3.3116 29 Apr 2009 1 Aug 2014 31 Jan 2015
ANNUAL REPORT 2010 91

Optionsheld
as at31 December
2010
Optionsexercised/cancelledduring the
Director’s/Alternate Chief
Executive’sterm of office
in 2010
Exerciseprice
per shareDate
grantedExercisable
fromExercisable
until
Directors:Mr William W Leung – 6,885(1) £6.0216 2 May 2003 2 May 2006 1 May 2013
7,459 – £7.2181 30 Apr 2004 30 Apr 2007 29 Apr 2014
– 839(2) HK$37.8797 29 Apr 2009 1 Aug 2010 31 Oct 2010
592(3) – HK$62.9770 21 Apr 2010 1 Aug 2011 31 Oct 2011
8,051
Mr Iain J Mackay 1,531 – US$11.8824 30 Apr 2008 1 Aug 2011 31 Jan 2012
Mrs Dorothy K Y P Sit 3,443 – £7.5919 23 Apr 2001 23 Apr 2004 22 Apr 2011
2,375 – HK$37.8797 29 Apr 2009 1 Aug 2012 31 Jan 2013
5,818
Alternate Chief Executives:Mr Nixon L S Chan – 5,738(4) £6.5009 3 Apr 2000 3 Apr 2003 2 Apr 2010
4,820 – £7.5919 23 Apr 2001 23 Apr 2004 22 Apr 2011
3,328 – £7.3244 7 May 2002 7 May 2005 6 May 2012
3,615 – £6.0216 2 May 2003 2 May 2006 1 May 2013
4,533 – £7.2181 30 Apr 2004 30 Apr 2009 29 Apr 2014
592(3) – HK$62.9770 21 Apr 2010 1 Aug 2011 31 Oct 2011
16,888
Mr Andrew H C Fung 4,197 – HK$37.8797 29 Apr 2009 1 Aug 2014 31 Jan 2015
Mr Christopher H N Ho 3,443 – £7.2181 30 Apr 2004 30 Apr 2009 29 Apr 2014
2,518 – HK$37.8797 29 Apr 2009 1 Aug 2012 31 Jan 2013
5,961
Mr David W H Tam 5,738 – £7.5919 23 Apr 2001 23 Apr 2004 22 Apr 2011
6,311 – £7.3244 7 May 2002 7 May 2005 6 May 2012
7,459 – £7.2181 30 Apr 2004 30 Apr 2009 29 Apr 2014
19,508
Notes:
(1) At the date of exercise, 13 October 2010, the market value per share was £6.7110.
(2) At the date of exercise, 6 October 2010, the market value per share was £6.6370.
(3) Notifications that Mr William W Leung and Mr Nixon L S Chan held these unlisted physically settled options to acquire shares of US$0.50 each in HSBC Holdings plc were given by them in January 2011 on their becoming aware of the same.
(4) At the date of exercise, 26 March 2010, the market value per share was £6.8770.
HANG SENG BANK92
REPORT OF THE DIRECTORS

Conditional Awards of Shares
As at 31 December 2010, the interests of the Directors and Alternate Chief Executives in the conditional awards of ordinary shares of US$0.50 each in HSBC Holdings plc made in favour of them under the HSBC Share Plans were as follows:
Awardsheld as at1 January
2010
Awards made during the
Director’s/AlternateChief Executive’s
term of office in 2010
Awards released during the
Director’s/AlternateChief Executive’s
term of office in 2010
Awardsheld as at
31 December 2010
Directors:Mrs Margaret Leung 303,469 100,117 19,938 396,274(1)
Mr Alexander A Flockhart 878,274 297,746 122,605 996,812(1)&(2)
Mr William W Leung 31,192 2,442 9,678 24,884(1)
Mr Iain J Mackay 233,624 57,700 46,899 253,502(1)
Mrs Dorothy K Y P Sit 37,307 15,984 12,173 42,602(1)
Mr Peter T S Wong 240,639 89,323 31,941 308,025(1)
Alternate Chief Executives:Mr Nixon L S Chan 18,976 3,225 5,232 17,608(1)
Mr Andrew H C Fung 22,280 19,353 4,064 38,776(1)
Mr Christopher H N Ho 4,682 3,225 – 8,153(1)
Mr Andrew W L Leung – 826 – 848(1)
Mr David W H Tam 7,621 1,620 5,713 1,663(1)&(2)
Notes:
(1) This includes additional shares arising from scrip dividends.
(2) This takes into account the forfeiture of shares under the relevant Share Plan(s).
All the interests stated above represent long positions. As at 31 December 2010, no short positions were recorded in the Register of Directors’ and Alternate Chief Executives’ Interests and Short Positions required to be kept under section 352 of the SFO.
Save as disclosed in the preceding paragraphs, at no time during the year was the Bank or any of its holding companies or its subsidiaries or fellow subsidiaries a party to any arrangement to enable the Directors of the Bank to acquire benefits by means of the acquisition of shares in or debentures of the Bank or any other body corporate.
No right to subscribe for equity or debt securities of the Bank has been granted by the Bank to, nor have any such rights been exercised by, any person during the year ended 31 December 2010.
Directors’ Interests In Contracts
No contract of significance, to which the Bank or any of its holding companies or any of its subsidiaries or fellow subsidiaries was a party and in which a Director of the Bank had a material interest, subsisted as at the end of the year or at any time during the year.
ANNUAL REPORT 2010 93

Directors’ Interests In
Competing Businesses
Pursuant to Rule 8.10 of the Listing Rules, as at the date of this report, the following Directors had declared interests in the following entities which compete or are likely to compete, either directly or indirectly, with the businesses of the Bank:
Ms Sarah C Legg is the Chief Financial Officer of The Hongkong and Shanghai Banking Corporation Limited and a Director of various HSBC Group subsidiaries.
Mrs Margaret Leung is a Group General Manager of HSBC Holdings plc and a Director of The Hongkong and Shanghai Banking Corporation Limited.
Mr William W Leung is a Director of Yantai Bank Co., Ltd. (“Yantai Bank”), in which the Bank holds a 20.0% stake, and HSBC Global Asset Management (Hong Kong) Limited, a subsidiary of The Hongkong and Shanghai Banking Corporation Limited. Yantai Bank conducts general banking business in mainland China.
Mr Mark S McCombe is a Group General Manager of HSBC Holdings plc. He is also the Chief Executive Officer, Hong Kong of The Hongkong and Shanghai Banking Corporation Limited and a Director of various HSBC Group subsidiaries.
Mr Peter T S Wong is a Group Managing Director of HSBC Holdings plc. He is also the Chief Executive and Executive Director of The Hongkong and Shanghai Banking Corporation Limited; Chairman and Non-executive Director of HSBC Bank Malaysia Berhad; Deputy Chairman and Non-executive Director of HSBC Bank (China) Company Limited; and Vice-Chairman and Non-executive Director of HSBC Bank (Vietnam) Ltd. He is a Non-executive Director of Bank of Communications Co., Ltd., which conducts general banking business. He is also a Non-executive Director of Ping An Insurance (Group) Company of China, Ltd., which conducts life insurance, property and casualty insurance and other financial services.
HSBC Holdings plc, through its subsidiaries and associated undertakings, including The Hongkong and Shanghai Banking Corporation Limited, the immediate holding company of the Bank, is engaged in providing a comprehensive range of banking, insurance and related financial services.
The entities in which the Directors have declared interests are managed by separate Boards of Directors and management, which are accountable to their respective shareholders.
Further, Yantai Bank has an Audit and Related Party Transactions Control Committee which is responsible for considering all matters concerning connected party transactions to be entered into by Yantai Bank as required by the laws of mainland China. The majority of members of Yantai Bank’s Audit and Related Party Transactions Control Committee are Non-executive Directors.
The Board of the Bank includes eight Independent Non-executive Directors whose views carry significant weight in the Board’s decisions. The Audit Committee of the Bank, which consists of three Independent Non-executive Directors, meets regularly to assist the Board of Directors in reviewing the financial performance, internal control and compliance systems of the Bank and its subsidiaries. The Bank is, therefore, capable of carrying on its businesses independently of, and at arm’s length from, the businesses in which Directors have declared interests.
Directors’ Emoluments
The emoluments of the Directors of the Bank (including Executive Directors and Independent Non-executive Directors) on a named basis are set out in note 19 to the financial statements for the year ended 31 December 2010.
HANG SENG BANK94
REPORT OF THE DIRECTORS

Substantial Interests In Share Capital
The register maintained by the Bank pursuant to the SFO recorded that, as at 31 December 2010, the following corporations had interests or short positions in the shares or underlying shares (as defined in the SFO) in the Bank set opposite their respective names:
Name of Corporation
Number of Ordinary Sharesof HK$5 each in the Bank
(Percentage of total)
The Hongkong and Shanghai Banking Corporation Limited 1,188,057,371 (62.14%)
HSBC Asia Holdings BV 1,188,057,371 (62.14%)
HSBC Asia Holdings (UK) Limited 1,188,057,371 (62.14%)
HSBC Holdings BV 1,188,057,371 (62.14%)
HSBC Finance (Netherlands) 1,188,057,371 (62.14%)
HSBC Holdings plc 1,188,057,371 (62.14%)
The Hongkong and Shanghai Banking Corporation Limited is a subsidiary of HSBC Asia Holdings BV, which is a wholly-owned subsidiary of HSBC Asia Holdings (UK) Limited, which in turn is a wholly-owned subsidiary of HSBC Holdings BV. HSBC Holdings BV is a wholly-owned subsidiary of HSBC Finance (Netherlands), which in turn is a wholly-owned subsidiary of HSBC Holdings plc. Accordingly, The Hongkong and Shanghai Banking Corporation Limited's interests are recorded as the interests of HSBC Asia Holdings BV, HSBC Asia Holdings (UK) Limited, HSBC Holdings BV, HSBC Finance (Netherlands) and HSBC Holdings plc.
The Directors regard HSBC Holdings plc to be the beneficial owner of 1,188,057,371 ordinary shares in the Bank (62.14%).
All the interests stated above represent long positions. As at 31 December 2010, no short positions were recorded in the Register of Interests in Shares and Short Positions required to be kept under section 336 of the SFO.
Purchase, Sale Or Redemption Of
The Bank’s Listed Securities
Save for the redemption of all the (1) Series A HK$1,000m 4.125% subordinated notes due 2015 and (2) Series B HK$1,500m floating rate subordinated notes due 2015, both at par on 24 June 2010, there was no purchase, sale or redemption by the Bank, or any of its subsidiaries, of the Bank’s listed securities during the year.
Public Float
As at the date of this report, the Bank has maintained the prescribed public float under the Listing Rules, based on the information that is publicly available to the Bank and within the knowledge of the Directors of the Bank.
Code On Corporate Governance
Practices
Details of the Bank’s corporate governance practices are set out in the “Corporate Governance and Other Information” section in this Annual Report.
Auditor
KPMG retire and, being eligible, offer themselves for re-appointment. A resolution for the re-appointment of KPMG as auditor of the Bank will be proposed at the forthcoming Annual General Meeting.
On behalf of the Board
Raymond Ch’ienChairmanHong Kong, 28 February 2011
ANNUAL REPORT 2010 95

2010financial statements

98 CONSOLIDATED INCOME
STATEMENT
99 CONSOLIDATED STATEMENT
OF COMPREHENSIVE
INCOME
100 CONSOLIDATED BALANCE
SHEET
101 BALANCE SHEET
102 CONSOLIDATED STATEMENT
OF CHANGES IN EQuITY
103 CONSOLIDATED CASH FLOW
STATEMENT
104 NOTES TO THE FINANCIAL
STATEMENTS
1 Basis of preparation
2 Nature of business
3 Basis of consolidation
4 Principal accounting policies
5 Changes in accounting policies
6 Accounting estimates and
judgements
7 Possible impact of amendments,
new standards and interpretations
issued but not yet effective for the
year ended 31 December 2010
8 Interest income/interest expense
9 Net fee income
10 Trading income
11 Net income/(loss) from financial
instruments designated at fair
value
12 Dividend income
13 Net earned insurance premiums
14 Other operating income
15 Net insurance claims incurred
and movement in policyholders’
liabilities
16 Loan impairment charges and
other credit risk provisions
17 Operating expenses
18 The emoluments of the five
highest paid individuals
19 Directors’ emoluments
20 Auditors’ remuneration
21 Gains less losses from financial
investments and fixed assets
22 Net surplus on property
revaluation
23 Tax expense
24 Profit attributable to shareholders
25 Earnings per share
26 Dividends per share
27 Segmental analysis
28 Analysis of assets and liabilities by
remaining maturity
29 Accounting classifications
30 Cash and balances with banks
and other financial institutions
31 Placings with and advances
to banks and other financial
institutions
32 Trading assets
33 Financial assets designated at
fair value
34 Derivative financial instruments
35 Advances to customers
36 Financial investments
37 Investments in subsidiaries
38 Interest in associates
39 Investment properties
40 Premises, plant and equipment
41 Intangible assets
42 Other assets
43 Current, savings and other
deposit accounts
44 Trading liabilities
45 Financial liabilities designated at
fair value
46 Certificates of deposit and other
debt securities in issue
47 Other liabilities
48 Liabilities to customers under
insurance contracts
49 Current tax and deferred tax
50 Subordinated liabilities
51 Share capital
52 Reserves
53 Reconciliation of cash flow
statement
54 Contingent liabilities and
commitments
55 Assets pledged as security for
liabilities
56 Capital commitments
57 Lease commitments
58 Employee retirement benefits
59 Share-based payments
60 Material related-party transactions
61 Financial risk management
62 Fair value of financial instruments
63 Comparative figures
64 Immediate and ultimate holding
companies
65 Approval of financial statements
250 INDEPENDENT AuDITOR’S
REPORT
251 SuPPLEMENTARY NOTES TO
THE FINANCIAL STATEMENTS
(unaudited)
273 ANALYSIS OF SHAREHOLDERS
274 SuDSIDIARIES
275 CORPORATE INFORMATION
AND CALENDAR

CONSOLIDATED INCOME STATEMENTfor the year ended 31 December 2010 (Expressed in millions of Hong Kong dollars)
The notes on pages 104 to 249 form part of these financial statements.
2010 2009(restated)
note
Interest income 8 16,507 16,390
Interest expense 8 (2,207) (2,367)
Net interest income 14,300 14,023
Fee income 5,895 5,190
Fee expense (998) (869)
Net fee income 9 4,897 4,321
Trading income 10 2,059 1,923
Net income/(loss) from financial instruments designated at fair value 11 282 (75)
Dividend income 12 14 16
Net earned insurance premiums 13 11,307 11,519
Other operating income 14 1,558 1,089
Total operating income 34,417 32,816
Net insurance claims incurred and movement in policyholders’ liabilities 15 (12,587) (12,004)
Net operating income before loan impairment charges and other credit risk provisions 21,830 20,812
Loan impairment charges and other credit risk provisions 16 (390) (812)
Net operating income 21,440 20,000
Employee compensation and benefits (3,717) (3,378)
General and administrative expenses (2,917) (2,733)
Depreciation of premises, plant and equipment (619) (591)
Amortisation of intangible assets (102) (84)
Total operating expenses 17 (7,355) (6,786)
Operating profit 14,085 13,214
Gains less losses from financial investments and fixed assets 21 112 186
Net surplus on property revaluation 22 487 252
Share of profits from associates 2,661 1,748
Profit before tax 17,345 15,400
Tax expense 23 (2,428) (2,262)
Profit for the year 14,917 13,138
Profit attributable to shareholders 14,917 13,138
(Figures in HK$)
Earnings per share 25 7.80 6.87
HANG SENG BANK98

CONSOLIDATED STATEMENT OF COMPREHENSIVE INCOMEfor the year ended 31 December 2010 (Expressed in millions of Hong Kong dollars)
2010 2009(restated)
Profit for the year 14,917 13,138
Other comprehensive income
Premises:
– unrealised surplus on revaluation of premises 2,102 1,475
– deferred taxes (343) (182)
Available-for-sale investment reserve:
– fair value changes taken to/(from) equity:
– on debt securities 774 3,908
– on equity shares (5) 80
– fair value changes transferred (to)/from income statement:
– on impairment – 4
– on hedged items (272) 81
– on disposal (105) (9)
– share of changes in equity of associates:
– fair value changes 120 (26)
– deferred taxes (53) (472)
Cash flow hedging reserve:
– fair value changes taken to equity 291 407
– fair value changes transferred to income statement (414) (864)
– deferred taxes 21 69
Defined benefit plans:
– actuarial gains on defined benefit plans 11 1,877
– deferred taxes (2) (309)
Exchange differences on translation of:
– financial statements of overseas branches, subsidiaries and associates 687 3
– others 13 10
Other comprehensive income for the year, net of tax 2,825 6,052
Total comprehensive income for the year 17,742 19,190
Total comprehensive income for the year attributable to shareholders 17,742 19,190
ANNUAL REPORT 2010 99

CONSOLIDATED BALANCE SHEETat 31 December 2010 (Expressed in millions of Hong Kong dollars)
2010 2009(restated)
note
ASSETS
Cash and balances with banks and other financial institutions 30 44,411 22,086
Placings with and advances to banks and other financial institutions 31 110,564 104,551
Trading assets 32 26,055 66,597
Financial assets designated at fair value 33 7,114 5,450
Derivative financial instruments 34 5,593 5,050
Advances to customers 35 472,637 344,621
Financial investments 36 199,359 241,502
Interest in associates 38 15,666 10,226
Investment properties 39 3,251 2,872
Premises, plant and equipment 40 14,561 12,414
Intangible assets 41 5,394 4,214
Other assets 42 12,306 11,069
Deferred tax assets 49 – 16
Total assets 916,911 830,668
LIABILITIES AND EQuITY
Liabilities
Current, savings and other deposit accounts 43 683,628 636,369
Deposits from banks 15,586 4,870
Trading liabilities 44 42,581 38,391
Financial liabilities designated at fair value 45 457 1,456
Derivative financial instruments 34 4,683 4,251
Certificates of deposit and other debt securities in issue 46 3,095 1,826
Other liabilities 47 17,018 15,285
Liabilities to customers under insurance contracts 48 64,425 54,240
Current tax liabilities 49 344 52
Deferred tax liabilities 49 3,234 2,460
Subordinated liabilities 50 11,848 9,320
Total liabilities 846,899 768,520
Equity
Share capital 51 9,559 9,559
Retained profits 42,966 37,752
Other reserves 13,854 11,204
Proposed dividends 26 3,633 3,633
Shareholders’ funds 70,012 62,148
Total equity and liabilities 916,911 830,668
Raymond K F Ch’ien Chairman
Margaret Leung Vice-Chairman and Chief Executive
Eric K C Li Director
Andrew W L Leung Chief Financial Officer
The notes on pages 104 to 249 form part of these financial statements.
HANG SENG BANK100

BALANCE SHEETat 31 December 2010 (Expressed in millions of Hong Kong dollars)
2010 2009(restated)
note
ASSETS
Cash and balances with banks and other financial institutions 30 41,062 18,461
Placings with and advances to banks and other financial institutions 31 52,131 65,624
Trading assets 32 25,232 65,288
Financial assets designated at fair value 33 148 174
Derivative financial instruments 34 5,026 4,916
Advances to customers 35 423,074 299,179
Amounts due from subsidiaries 93,445 87,360
Financial investments 36 103,106 156,715
Investments in subsidiaries 37 11,584 11,584
Interest in associates 38 5,172 2,546
Investment properties 39 2,100 1,883
Premises, plant and equipment 40 10,588 9,434
Intangible assets 41 442 399
Other assets 42 8,787 8,236
Deferred tax assets 49 – 2
Total assets 781,897 731,801
LIABILITIES AND EQuITY
Liabilities
Current, savings and other deposit accounts 43 649,144 612,014
Deposits from banks 15,585 4,469
Trading liabilities 44 30,106 35,071
Financial liabilities designated at fair value 45 – 1,003
Derivative financial instruments 34 4,528 4,180
Certificates of deposit and other debt securities in issue 46 3,095 1,826
Amounts due to subsidiaries 8,899 9,960
Other liabilities 47 15,434 14,333
Current tax liabilities 49 320 10
Deferred tax liabilities 49 1,617 1,345
Subordinated liabilities 50 11,848 9,320
Total liabilities 740,576 693,531
Equity
Share capital 51 9,559 9,559
Retained profits 52 19,637 17,894
Other reserves 52 8,492 7,184
Proposed dividends 26 3,633 3,633
Shareholders’ funds 41,321 38,270
Total equity and liabilities 781,897 731,801
Raymond K F Ch’ien Chairman
Margaret Leung Vice-Chairman and Chief Executive
Eric K C Li Director
Andrew W L Leung Chief Financial Officer
The notes on pages 104 to 249 form part of these financial statements.
ANNUAL REPORT 2010 101

CONSOLIDATED STATEMENT OF CHANGES IN EQuITYfor the year ended 31 December 2010(Expressed in millions of Hong Kong dollars)
2010 2009(restated)
Share capital
At beginning and end of the year 9,559 9,559
Retained profits (including proposed dividends)
At beginning of the year 41,385 38,260
Dividends to shareholders
– dividends approved in respect of the previous year (3,633) (5,736)
– dividends declared in respect of the current year (6,309) (6,309)
Transfer 218 455
Total comprehensive income for the year 14,938 14,715
46,599 41,385
Other reserves
Premises revaluation reserve
At beginning of the year 7,885 7,047
Transfer (218) (455)
Total comprehensive income for the year 1,759 1,293
9,426 7,885
Available-for-sale investment reserve
At beginning of the year (257) (3,823)
Total comprehensive income for the year 459 3,566
202 (257)
Cash flow hedging reserve
At beginning of the year 174 562
Total comprehensive income for the year (102) (388)
72 174
Foreign exchange reserve
At beginning of the year 1,382 1,379
Total comprehensive income for the year 687 3
2,069 1,382
Other reserve
At beginning of the year 2,020 1,984
Cost of share-based payment arrangements 64 35
Total comprehensive income for the year 1 1
2,085 2,020
Total equity
At beginning of the year 62,148 54,968
Dividends to shareholders (9,942) (12,045)
Cost of share-based payment arrangements 64 35
Total comprehensive income for the year 17,742 19,190
70,012 62,148
HANG SENG BANK102

2010 2009
note
Net cash (outflow)/inflow from operating activities 53(a) (30,098) 65,815
Cash flows from investing activities
Dividends received from associates 424 380
Increase in interest in an associate (2,626) (3)
Purchase of available-for-sale investments (27,401) (49,642)
Purchase of held-to-maturity debt securities (1,113) (513)
Proceeds from sale or redemption of available-for-sale investments 43,356 48,615
Proceeds from redemption of held-to-maturity debt securities 260 182
Purchase of fixed assets and intangible assets (915) (312)
Proceeds from sale of fixed assets and assets held for sale 19 443
Interest received from available-for-sale investments 1,632 4,429
Dividends received from available-for-sale investments 12 13
Net cash inflow from investing activities 13,648 3,592
Cash flows from financing activities
Dividends paid (9,942) (12,045)
Interest paid for subordinated liabilities (63) (126)
Proceeds from subordinated liabilities 6,025 –
Repayment of subordinated liabilities (4,516) –
Net cash outflow from financing activities (8,496) (12,171)
(Decrease)/increase in cash and cash equivalents (24,946) 57,236
Cash and cash equivalents at 1 January 136,759 76,116
Effect of foreign exchange rate changes 6,747 3,407
Cash and cash equivalents at 31 December 53(b) 118,560 136,759
CONSOLIDATED CASH FLOW STATEMENTfor the year ended 31 December 2010(Expressed in millions of Hong Kong dollars)
The notes on pages 104 to 249 form part of these financial statements.
ANNUAL REPORT 2010 103

NOTES TO THE FINANCIAL STATEMENTSyear ended 31 December 2010(Figures expressed in millions of Hong Kong dollars unless otherwise indicated)
1. BASIS OF PREPARATION(a) The consolidated financial statements comprise the statements of Hang Seng Bank Limited (“the Bank”) and all its subsidiaries
made up to 31 December. The consolidated financial statements include the attributable share of the results and reserves of
associates, based on the financial statements made up to dates not earlier than three months prior to 31 December. All significant
intra-group transactions have been eliminated on consolidation. The Bank and its subsidiaries and associates are collectively referred as
“the Group”.
(b) These financial statements have been prepared in accordance with all applicable Hong Kong Financial Reporting Standards (“HKFRSs”),
which is a collective term that includes all applicable individual Hong Kong Financial Reporting Standards, Hong Kong Accounting
Standards (“HKASs”), and interpretations (“Ints”) issued by the Hong Kong Institute of Certified Public Accountants (“HKICPA”), accounting
principles generally accepted in Hong Kong and the requirements of the Hong Kong Companies Ordinance. In addition, these financial
statements comply with the applicable disclosure provisions of the Rules Governing the Listing of Securities on Hong Kong Exchanges
and Clearing Limited. A summary of the principal accounting policies adopted by the Group is set out in note 4.
The HKICPA has issued certain new and revised HKFRSs that are first effective or available for early adoption for the current accounting
period of the Group and the Bank. Note 5 provides information on the changes in accounting policies resulting from initial application
of these developments to the extent that they are relevant to the Group for the current and prior accounting periods reflected in these
financial statements.
(c) The measurement basis used in the preparation of the financial statements is historical cost except that the following assets and
liabilities are stated at fair value as explained in the accounting policies set out below:
– financial instruments classified as trading, designated at fair value and available-for-sale (see note 4(g));
– investment property (see note 4(r));
– leasehold land and buildings held for own use, where the value of the land cannot be reliably separated from the value of the building
at inception of the lease and the entire lease is therefore classified as a finance lease (see note 4(s)); and
– leasehold land and buildings held for own use, where the value of the land can be reliably separated from the value of the building at
inception of the lease and the term of the lease is not less than 50 years (see note 4(s)).
(d) The preparation of financial statements in conformity with HKFRSs requires management to make judgements, estimates and
assumptions that affect the application of policies and reported amounts of assets and liabilities, income and expenses. The estimates
and associated assumptions are based on historical experience and various other factors that are believed to be reasonable under the
circumstances, the results of which form the basis of making the judgements about carrying values of assets and liabilities that are not
readily apparent from other sources. Actual results may differ from these estimates. The Group believes that the assumptions that have
been made are appropriate and that the financial statements therefore present the financial position and results fairly, in all material
respects.
The estimates and underlying assumptions are reviewed on an ongoing basis. Revisions to accounting estimates are recognised in the
period in which the estimate is revised if the revision affects only that period, or in the period of the revision and future periods if the revision
affects both current and future periods.
Judgements made by management in the application of HKFRSs that have significant effect on the financial statements and major
sources of estimation uncertainty are discussed in note 6.
Disclosures under HKFRS 4 “Insurance Contract” and HKFRS 7 “Financial Instrument: Disclosure” relating to the nature and extent of risks
have been included in note 61 “Financial risk management”.
HANG SENG BANK104

2. NATuRE OF BuSINESSThe Group is engaged primarily in the provision of banking and related financial services.
3. BASIS OF CONSOLIDATIONThe consolidated financial statements cover the consolidated positions of Hang Seng Bank Limited and all its subsidiaries, unless otherwise
stated, and include the attributable share of results and reserves of its associates. For regulatory reporting, the bases of consolidation are
different from the basis of consolidation for accounting purposes. They are set out in notes 34, 54 and 61 to the financial statements.
4. PRINCIPAL ACCOuNTING POLICIES(a) Interest income and expenseInterest income and expense for all interest-bearing financial instruments are recognised in “Interest income” and “Interest expense”
respectively in the income statement using the effective interest rates of the financial assets or financial liabilities to which they relate.
The effective interest rate is the rate that exactly discounts estimated future cash payments or receipts through the expected life of the
financial asset or financial liability or, where appropriate, a shorter period, to the net carrying amount of the financial asset or financial
liability. When calculating the effective interest rate, the Group estimates cash flows considering all contractual terms of the financial
instrument but not future credit losses. The calculation includes all amounts paid or received by the Group that are an integral part of the
effective interest rate, including transaction costs and all other premiums or discounts. Such transaction costs (for example, mortgage
rebates) are incremental to the Group and are directly attributable to a transaction.
For impaired loans, the accrual of interest income based on the original terms of the loan is discounted to arrive at the net present
value of impaired loans. Subsequent increase of such net present value of impaired loans due to the passage of time is recognised as
interest income.
(b) Non-interest income(i) Fee incomeThe Group earns fee income from a diverse range of services it provides to its customers. Fee income is accounted for as follows:
– if the income is earned on the execution of a significant act, it is recognised as revenue when the significant act has been completed
(for example, fees arising from negotiating, or participating in the negotiation of, a transaction for a third party, such as the arrangement
for the acquisition of shares or other securities);
– if the income is earned as services are provided, it is recognised as revenue as the services are provided (for example, asset
management, portfolio and other management advisory and service fees); and
– if the income is an integral part of the effective interest rate of a financial instrument, it is recognised as an adjustment to the effective
interest rate (for example, loan commitment fees) and reported in “Interest income” (see note 4(a)).
(ii) Rental income from operating leaseRental income received under an operating lease is recognised in “Other operating income” in equal instalments over the accounting
periods covered by the lease term. Lease incentives granted are recognised in the income statement as an integral part of the aggregate
net lease payments receivable. Contingent rentals receivable are recognised as income in the accounting period in which they are
earned.
(iii) Dividend incomeDividend income from unlisted investments is recognised when the shareholder’s right to receive payment is established. Dividend income
from listed investments is recognised when the share price of the investment is quoted ex-dividend.
ANNUAL REPORT 2010 105

NOTES TO THE FINANCIAL STATEMENTS
4. PRINCIPAL ACCOuNTING POLICIES (continued)
(b) Non-interest income (continued)
(iv) Trading incomeTrading income comprises all gains and losses from changes in the fair value of financial assets and financial liabilities held for trading and
dividend income from equities held for trading. Gains or losses arising from changes in fair value of derivatives are recognised in “Trading
income” to the extent as described in the accounting policy set out in notes 4(h) and 4(i). Gains and losses on foreign exchange trading
and other transactions are also reported as “Trading income” except for those gains and losses on translation of foreign currencies
recognised in other comprehensive income and accumulated separately in equity in the foreign exchange reserve in accordance with the
accounting policy set out in note 4(z).
(v) Net income from financial instruments designated at fair valueNet income from financial instruments designated at fair value comprises all gains and losses from changes in the fair value of financial
assets/liabilities designated at fair value and dividends arising on those financial instruments and the changes in fair value of the derivatives
managed in conjunction with the financial assets and liabilities designated at fair value.
(c) Segment reportingThe Group’s operating segments are determined to be customer group segment because the chief operating decision maker uses
customer group information in order to make decisions about allocating resources and assessing performance.
(d) Cash and cash equivalentsFor the purpose of the cash flow statement, cash and cash equivalents include highly liquid investments that are readily convertible into
known amounts of cash and which are subject to an insignificant risk of change in value. Such investments are normally those with less
than three months’ maturity from the date of acquisition. Cash and cash equivalents include cash and balances at central banks, treasury
bills and other eligible bills, loans and advances to banks, and certificates of deposit.
(e) Loans and advances to banks and customersLoans and advances to banks and customers include loans and advances originated or acquired by the Group, which have not been
classified either as held for trading or designated at fair value. Loans and advances are recognised when cash is advanced to borrowers.
They are derecognised when borrowers repay their obligations, the loans are sold or written off, or substantially all the risks and rewards
of ownership are transferred. They are initially recorded at fair value plus any directly attributable transaction costs and are subsequently
measured at amortised cost using the effective interest rate method, less impairment allowances.
(f) Loan impairmentThe Group will recognise losses for impaired loans promptly where there is objective evidence that impairment of a loan or portfolio of
loans has occurred. Impairment allowances are assessed either individually for individually significant loans or collectively for loan portfolios
with similar credit risk characteristics.
(i) Individually assessed loansImpairment losses on individually significant accounts are assessed by an evaluation of the exposures on a case-by-case basis. The
Group assesses at each reporting date whether there is any objective evidence that a loan is impaired. This procedure is applied to all
accounts that are considered individually significant.
The criteria used by the Group to determine that there is such objective evidence include, inter alia:
– known cash flow difficulties experienced by the borrower;
– past due contractual payments of either principal or interest;
– breach of loan covenants or conditions;
– the probability that the borrower will enter bankruptcy or other financial restructuring; and
– a significant downgrading in credit rating by an external rating agency.
HANG SENG BANK106

4. PRINCIPAL ACCOuNTING POLICIES (continued)
(f) Loan impairment (continued)
(i) Individually assessed loans (continued)
In determining impairment losses on individually assessed loans, the following factors are considered:
– the Group’s aggregate exposure to the borrower;
– the viability of the borrower’s business model and capability to trade successfully out of financial difficulties and generate cash flow to
service their debt obligations;
– the amount and timing of expected receipts and recoveries;
– the likely dividend available on liquidation or bankruptcy;
– the extent of other creditors’ commitments ranking ahead of, or pari passu with, the Group and the likelihood of other creditors
continuing to support the borrower;
– the complexity of determining the aggregate amount and ranking of all creditor claims and the extent to which legal and insurance
uncertainties are evident;
– the realisable value of collateral (or other credit mitigants) and likelihood of successful repossession;
– the likely deduction of any costs involved in recovery of amounts outstanding;
– the ability of the borrower to obtain and make payments in the relevant foreign currency if loans are not in local currency; and
– where available, the secondary market price for the debt.
Impairment allowances of an individually assessed loan are measured as the difference between the carrying value and the present value
of estimated future cash flows discounted at the original effective interest rate of the individual loan. Any loss is charged in the income
statement. The carrying amount of impaired loans on the balance sheet is reduced through the use of an allowance account.
(ii) Collectively assessed loansImpairment allowances are calculated on a collective basis for the following:
– in respect of losses which have been incurred but have not yet been identified as loans subject to individual assessment for impairment
(see section (i)); and
– for homogeneous groups of loans that are not considered individually significant.
Incurred but not yet identified impairmentWhere loans have been individually assessed and no evidence of loss has been identified individually, these loans are grouped together on
the basis of similar credit risk characteristics for the purpose of calculating a collective impairment allowance. This allowance covers loans
that are impaired at the balance sheet date but which will not be individually identified as such until some time in the future. The collective
impairment allowance is determined after taking into account:
– historical loss experience in portfolios of similar risk characteristics (for example, by industry sector, loan grade or product);
– the estimated period between a loss occurring and that loss being identified and evidenced by the establishment of an allowance
against the loss on an individual loan; and
– management’s judgement as to whether the current economic and credit conditions are such that the actual level of inherent losses
is likely to be greater or less than that suggested by historical experience.
Homogeneous groups of loansPortfolios of small homogeneous loans are collectively assessed using roll rate or historical loss rate methodologies.
ANNUAL REPORT 2010 107
NOTES TO THE FINANCIAL STATEMENTS
4. PRINCIPAL ACCOuNTING POLICIES (continued)
(f) Loan impairment (continued)
(iii) Loan write-offsLoans (and the related impairment allowance accounts) are normally written off, either partially or in full, when there is no realistic prospect of
recovery of these amounts and, for collateralised loans, when the proceeds from the realisation of security have been received.
(iv) Reversals of impairmentIf, in a subsequent period, the amount of an impairment loss decreases and the decrease can be related objectively to an event occurring
after the impairment was recognised, the previously recognised impairment loss is reversed to the extent it is now excessive by reducing
the loan impairment allowance account. The amount of any reversal is recognised in the income statement.
(v) Repossessed assetsNon-financial assets acquired in exchange for loans in order to achieve an orderly realisation are reported under “Assets held for sale”. The
asset acquired is recorded at the lower of its fair value less costs to sell and the carrying amount of the loan, net of impairment allowance
amounts, at the date of exchange. No depreciation is provided in respect of assets held for sale. Any subsequent write-down of the
acquired asset to fair value less costs to sell is recorded as an impairment loss and included in the income statement. Any subsequent
increase in the fair value less costs to sell, to the extent this does not exceed the cumulative impairment loss, is recognised in the income
statement.
Financial assets acquired in exchange for loans are classified and reported in accordance with the relevant accounting policies.
(vi) Renegotiated loansLoans subject to collective impairment assessment whose terms have been renegotiated are no longer considered past due, but are
treated as new loans for measurement purposes once the minimum number of payments required under the new arrangements has been
received. Loans subject to individual impairment assessment, whose terms have been renegotiated, are subject to ongoing review to
determine whether they remain impaired or should be considered past due. The carrying amounts of loans that have been classified as
renegotiated retain this classification until maturity or derecognition.
(g) Financial instrumentsOther than loans and advances to banks and customers, the Group classifies its financial instruments into the following categories at
inception, depending on the purpose for which the assets were acquired or the liabilities were incurred.
(i) Trading assets and trading liabilitiesFinancial instruments and short positions thereof which have been acquired or incurred principally for the purpose of selling or repurchasing
in the near term, or are part of a portfolio of identified financial instruments that are managed together and for which there is evidence of
a recent actual pattern of short-term profit-taking, are classified as held-for-trading. Trading liabilities also include customer deposits and
certificates of deposit with embedded options or other derivatives, the market risk of which was managed in the trading book. Trading
assets and liabilities are recognised initially at fair value with transaction costs taken to the income statement, and are subsequently
remeasured at fair value. All subsequent gains and losses from changes in the fair value of these assets and liabilities and dividends, are
recognised in the income statement within “Trading income” as they arise. Upon disposal or repurchase, the difference between the net
sale proceeds or the net payment and the carrying value is included in the income statement.
HANG SENG BANK108

4. PRINCIPAL ACCOuNTING POLICIES (continued)
(g) Financial instruments (continued)
(ii) Financial instruments designated at fair valueA financial instrument is classified in this category if it meets any one of the criteria set out below, and is so designated by management.
The Group may designate financial instruments at fair value where the designation:
– eliminates or significantly reduces a measurement or recognition inconsistency that would otherwise arise from measuring financial
assets or financial liabilities or recognising the gains and losses on them on different bases. Under this criterion, the main classes of
financial instruments designated by the Group are:
Long-term debt issues – The interest payable on certain fixed rate long-term debt securities in issue and subordinated liabilities
has been matched with the interest on “receive fixed/pay variable” interest rate swaps as part of a documented interest rate risk
management strategy.
Fixed rate bonds and related derivatives for economic hedge – The interest receivable on certain fixed rate bonds has been matched
with the interest on “receive variable/pay fixed” interest rate swaps as part of a documented interest rate risk management strategy.
An accounting mismatch would arise if the long-term debt issues and fixed rate bonds were accounted for at amortised cost because
the related derivatives are measured at fair value with changes in the fair value taken through the income statement. By designating the
long-term debt issues and fixed rate bonds at fair value, their movement in the fair value will be recorded in the income statement.
– applies to a group of financial assets, financial liabilities or both that is managed and its performance evaluated on a fair value basis,
in accordance with a documented risk management or investment strategy, and where information about that group of financial
instruments is provided internally on that basis to key management personnel. Under this criterion, certain liabilities under investment
contracts and financial assets held to meet liabilities under insurance and investment contracts are the main classes of financial
instrument so designated. The Group has documented risk management and investment strategies designed to manage such assets
at fair value, taking into consideration the relationship of assets to liabilities in a way that mitigates market risks. Reports are provided
to management on the fair value of the assets. Fair value measurement is also consistent with the regulatory reporting requirements
under the appropriate regulations for these insurance operations.
– relates to financial instruments containing one or more embedded derivatives that significantly modify the cash flows resulting from
those financial instruments.
Financial assets and financial liabilities so designated are recognised initially at fair value, with transaction costs taken directly to the
income statement, and are subsequently remeasured at fair value. This designation, once made, is irrevocable in respect of the financial
instruments to which it is made.
Gains and losses from changes in the fair value of such assets and liabilities and dividends are recognised in the income statement as
they arise, within “Net income from financial instruments designated at fair value”. Gains and losses arising from changes in the fair value
of derivatives that are managed in conjunction with financial assets or financial liabilities designated at fair value are also included in “Net
income from financial instruments designated at fair value”.
ANNUAL REPORT 2010 109

NOTES TO THE FINANCIAL STATEMENTS
4. PRINCIPAL ACCOuNTING POLICIES (continued)
(g) Financial instruments (continued)
(iii) Available-for-sale financial assetsFinancial instruments intended to be held on a continuing basis are classified as available-for-sale, unless they are designated at fair value
(see note 4(g)(ii)) or classified as held-to-maturity (see note 4(g)(iv)).
Available-for-sale financial assets are initially measured at fair value plus direct and incremental transaction costs. They are subsequently
remeasured at fair value, and changes therein are recognised in other comprehensive income and accumulated separately in equity in
the “Available-for-sale investment reserve” until the financial assets are either sold or become impaired. When available-for-sale financial
assets are sold, cumulative gains or losses which are previously recognised in other comprehensive income shall be reclassified from
equity to the income statement as “Gains less losses from financial investments and fixed assets”.
(iv) Held-to-maturity investmentsHeld-to-maturity investments are non-derivative financial assets with fixed or determinable payments and fixed maturities that the Group
has the positive intention and ability to hold until maturity. Held-to-maturity investments are initially recorded at fair value plus any directly
attributable transaction costs, and are subsequently measured at amortised cost using the effective interest rate method, less any
impairment allowances.
(h) Derivative financial instrumentsDerivative financial instruments (“derivatives”) are initially recognised at fair value and carried as assets when the fair value is positive and
as liabilities when the fair value is negative.
In the normal course of business, the fair value of a derivative on initial recognition is considered to be the transaction price (i.e. the fair
value of the consideration given or received). However, in certain circumstances the fair value of an instrument will be evidenced by
comparison with other observable current market transactions in the same instrument (i.e. without modification or repackaging) or based
on a valuation technique whose variables include only data from observable markets, including interest rate yield curves, option volatilities
and currency rates. When such evidence exists and results in a value which is different from the transaction price, the Group recognises
a trading profit or loss on inception of the derivative. If observable market data are not available, the initial change in fair value indicated
by the valuation model, but based on unobservable inputs, is not recognised immediately in the income statement but is recognised over
the life of the transaction on an appropriate basis, or recognised in the income statement when the inputs become observable, or when
the transaction matures or is closed out.
Certain derivatives embedded in other financial instruments, such as the conversion option in a convertible bond, are treated as separate
derivatives when their economic characteristics and risks are not clearly and closely related to those of the host contract, the terms of the
embedded derivatives are the same as those of a stand-alone derivative, and the combined contract is not designated at fair value. These
embedded derivatives are measured at fair value with changes in the fair value recognised in “Trading income”.
Derivative assets and liabilities on different transactions are only netted if the transactions are with the same counterparty, a legal right of
set-off exists, and the cash flows are intended to be settled on a net basis.
The method of recognising the resulting fair value gains or losses depends on whether the derivative is held for trading, or is designated
as a hedging instrument, and if so, the nature of the risk being hedged.
(i) Hedge accountingThe Group designates certain derivatives as either (i) hedges of the change in fair value of recognised assets or liabilities or firm commitments
(“fair value hedge”); (ii) hedges of highly probable future cash flows attributable to a recognised asset or liability, or a forecast transaction
(“cash flow hedge”). Hedge accounting is applied to derivatives designated as hedging instruments in fair value or cash flow hedge
provided certain criteria are met.
It is the Group’s policy to document, at the inception of a hedging relationship, the relationship between the hedging instruments and hedged
items, as well as its risk management objective and strategy for undertaking the hedge. Such policies also require documentation of the
assessment, both at hedge inception and on an ongoing basis, of whether the derivatives that are used in hedging transactions are highly
effective in offsetting changes in fair values or cash flows of hedged items attributable to the hedged risks.
HANG SENG BANK110

4. PRINCIPAL ACCOuNTING POLICIES (continued)
(i) Hedge accounting (continued)
(i) Fair value hedgeChanges in the fair value of derivatives that are designated and qualify as fair value hedging instruments are recorded in the income
statement within “Trading income”, together with changes in the fair value of the hedged asset or liability or group thereof that are
attributable to the hedged risk.
If the hedging relationship no longer meets the criteria for hedge accounting, the adjustment to the carrying amount of a hedged item is
amortised to the income statement based on a recalculated effective interest rate over the residual period to maturity.
(ii) Cash flow hedgeThe effective portion of changes in the fair value of derivatives that are designated and qualified as cash flow hedge are recognised in other
comprehensive income and accumulated separately in equity. Any gain or loss relating to an ineffective portion is recognised immediately
in the income statement within “Trading income”.
For cash flow hedge of a recognised asset or liability, the associated cumulative gain or loss is reclassified from equity to the income
statement in the same periods during which the hedged cash flow affect profit and loss.
When a hedging instrument expires or is sold, or when a hedge no longer meets the criteria for hedge accounting, any cumulative gain
or loss at that time remains in equity until the forecast transaction is ultimately recognised in the income statement. When a forecast
transaction is no longer expected to occur, the cumulative gain or loss that was recognised in other comprehensive income is immediately
reclassified to the income statement.
(iii) Hedge effectiveness testingIn order to qualify for hedge accounting, the Group carries out prospective effectiveness testing to demonstrate that it expects the
hedge to be highly effective at the inception of the hedge and throughout its life. Actual effectiveness (retrospective effectiveness) is also
demonstrated on an ongoing basis.
The documentation of each hedging relationship sets out how the effectiveness of the hedge is assessed. The method the Group adopts
for assessing hedge effectiveness will depend on its risk management strategy.
For fair value hedge relationships, the Group utilises the cumulative dollar offset method or regression as effectiveness testing methodology.
For cash flow hedge relationships, the Group utilises the change in variable cash flow method or capacity test or the cumulative dollar
offset method using the hypothetical derivative approach.
For prospective effectiveness, the hedging instrument is expected to be highly effective in achieving offsetting changes in fair value or cash
flows attributable to the hedged risk during the period for which the hedge is designated. For actual effectiveness, the change in fair value
or cash flows must offset each other in the range of 80 per cent to 125 per cent for the hedge to be deemed effective.
(iv) Derivatives that do not qualify for hedge accountingAll gains and losses from changes in the fair values of derivatives that do not qualify for hedge accounting are recognised immediately in
the income statement. These gains and losses are reported in “Trading income”, except where derivatives are managed in conjunction
with financial instruments designated at fair value, in which case gains and losses are reported in “Net income from financial instruments
designated at fair value”.
(j) Sale and repurchase agreementsWhere securities are sold subject to commitment to repurchase them at a pre-determined price, they remain on the balance sheet
and a liability is recorded in respect of the consideration received in “Deposits from banks” where the counterparty is a bank, or in
“Current, savings and other deposit accounts” where the counterparty is a non-bank. Conversely, securities purchased under analogous
commitments to resell are not recognised on the balance sheet and the consideration paid is recorded in “Placings with and advances to
banks and other financial institutions” where the counterparty is a bank, or in “Advance to customers” where the counterparty is a non-
bank. The difference between the sale and repurchase price is treated as interest and recognised over the life of the agreement.
ANNUAL REPORT 2010 111

NOTES TO THE FINANCIAL STATEMENTS
4. PRINCIPAL ACCOuNTING POLICIES (continued)
(k) Offsetting financial instrumentsFinancial assets and liabilities are offset and the net amount reported in the balance sheet when there is a legally enforceable right to offset
the recognised amounts and there is an intention to settle on a net basis, or realise the asset and settle the liability simultaneously.
(l) Application of trade date accountingExcept for loans and advances and deposits, all financial assets, liabilities and instruments are accounted for on trade date basis.
(m) Derecognition of financial assets and liabilitiesFinancial assets are derecognised when the rights to receive cash flows from the assets have expired; or where the Group has transferred
its contractual rights to receive the cash flows of the financial assets and has transferred substantially all the risks and rewards of
ownership; or where control is not retained. Financial liabilities are derecognised when they are extinguished, i.e. when the obligation is
discharged or cancelled or expires.
(n) Determination of fair valueThe fair value of financial instruments is based on their quoted market prices at the balance sheet date, without any deduction for estimated
future selling costs. Financial assets are priced at current bid prices while financial liabilities are priced at current asking prices.
If a quoted market price is not available on a recognised stock exchange or from a broker/dealer for non-exchange-traded financial
instruments, the fair value of the instrument is estimated using valuation techniques, including use of recent arm’s-length market
transactions, reference to the current fair value of another instrument that is substantially the same, discounted cash flow techniques,
option pricing models or any other valuation technique that provides a reliable estimate of prices obtained in actual market transactions.
Where discounted cash flow techniques are used, estimated future cash flows are based on management’s best estimates, and the
discount rate used is a market rate at the balance sheet date applicable for an instrument with similar terms and conditions. Where other
pricing models are used, inputs are based on market data at the balance sheet date. Fair values for unquoted equity investments are
estimated, if possible, using applicable price/earnings ratios for similar listed companies adjusted to reflect the specific circumstances of
the issuer.
Investments in other unlisted open-ended investment funds are recorded at the net asset value per share as reported by the managers
of such funds.
(o) SubsidiariesA subsidiary is a corporate entity in which the Group, directly or indirectly, holds more than half of the issued share capital or controls
more than half of the voting power or controls the composition of the board of directors, or a non-corporate entity the Group otherwise
controls, directly or indirectly, by way of having the power to govern its financial and operating policies so that the Group obtains benefits
from these activities.
A subsidiary is fully consolidated into the consolidated financial statements from the date that control commences until the date that
control ceases.
In the Bank’s balance sheet, an investment in subsidiary is stated at cost less impairment allowances.
HANG SENG BANK112

4. PRINCIPAL ACCOuNTING POLICIES (continued)
(p) AssociatesAn associate is an entity over which the Group or the Bank has the ability to significantly influence, but not control over its management,
including participation in the financial and operating policy decision.
An interest in an associate is accounted for in the consolidated financial statements under the equity method and is initially recorded at
cost and adjusted thereafter for the post acquisition change in the Group’s share of the associate’s net assets. The consolidated income
statement includes the Group’s share of the post-acquisition, post tax results of the associate and any impairment losses for the year,
whereas the Group’s share of the post-acquisition post-tax items of the associate’s other comprehensive income is recognised in the
consolidated statement of comprehensive income.
Unrealised gains on transactions between the Group and its associate are eliminated to the extent of the Group’s interest in the associate.
Unrealised losses are also eliminated to the extent of the Group’s interest in the associate unless the transaction provides evidence of an
impairment of the asset transferred.
In the Bank’s balance sheet, interest in associate is stated at cost less impairment allowances.
(q) Goodwill and intangible assets(i) Goodwill arises on business combinations, including the acquisition of subsidiaries or associates when the cost of acquisition exceeds
the fair value of the Group’s share of the identifiable assets, liabilities and contingent liabilities acquired and is reported in the consolidated
balance sheet. Goodwill on acquisitions of associates is included in “Interest in associates”. Goodwill is allocated to cash-generating units
for the purpose of impairment testing, which is undertaken at the lowest level at which goodwill is monitored for internal management
purposes. Goodwill is tested for impairment annually by comparing the recoverable amount from a cash-generating unit with the carrying
value of its net assets, including attributable goodwill. The recoverable amount of an asset is the higher of, its fair value less cost to sell, and
its value in use. Value in use is the present value of the expected future cash flows from a cash-generating unit. If the recoverable amount
is less than the carrying value, an impairment loss is charged to the income statement. Goodwill is stated at cost less any accumulated
impairment losses.
Any excess of the Group’s interest in the fair value of the identifiable assets, liabilities and contingent liabilities of an acquired business over
the cost to acquire is recognised immediately in the income statement.
At the date of disposal of a business, attributable goodwill is included in the Group’s share of net assets in the calculation of the gain or
loss on disposal.
(ii) Intangible assets include the value of in-force long-term insurance business, acquired software licences and capitalised development
costs of computer software programmes. The value of in-force long-term insurance business is stated at a valuation determined annually
in consultation with actuaries using the methodology as described in note 4(ac). Computer software acquired is stated at cost less
amortisation and impairment allowances. Amortisation of computer software is charged to the income statement over its useful life. Costs
incurred in the development phase of a project to produce application software for internal use are capitalised and amortised over the
software’s estimated useful life, usually five years. A periodic review is performed on intangible assets to confirm that there has been no
impairment.
ANNUAL REPORT 2010 113

NOTES TO THE FINANCIAL STATEMENTS
4. PRINCIPAL ACCOuNTING POLICIES (continued)
(r) Investment propertyInvestment properties are land and/or buildings which are owned or held under a leasehold interest to earn rental income and/or for
capital appreciation. Investment properties are stated in the balance sheet at fair value. Any gain or loss arising from a change in fair
value is recognised in the income statement. Fair values are determined by independent professional valuers, primarily on the basis
of capitalization of net incomes with due allowance for outgoings and reversionary income potential. Property interests which are held
under operating leases to earn rentals, or for capital appreciation or, both, are classified and accounted for as investment property on a
property-by-property basis. Such property interests are accounted for as if they were held under finance leases (see note 4(u)).
(s) Premises, plant and equipment(i) The following land and buildings held for own use are stated in the balance sheet at their revalued amount, being their fair value at the
date of the revaluation less any subsequent accumulated depreciation and impairment losses:
– leasehold land and buildings where the fair value of the land cannot be reliably separated from the value of the building at inception of
the lease and the premises are not clearly held under an operating lease; and
– leasehold land and buildings where the value of the land can be reliably separated from the value of the building at inception of the
lease and the term of the lease is not less than 50 years.
Revaluations are performed by professionally qualified valuers, on a market basis, with sufficient regularity to ensure that the net carrying
amount does not differ materially from the fair value at the end of balance sheet date. Surpluses arising on revaluation are credited firstly to
the income statement to the extent of any deficits arising on revaluation previously charged to the income statement in respect of the same
land and buildings, and are thereafter taken to other comprehensive income and are accumulated separately in the “Premises revaluation
reserve”. Deficits arising on revaluation, are firstly set off against any previous revaluation surpluses included in the “Premises revaluation
reserve” in respect of the same land and building, and are thereafter recognised in the income statement.
Depreciation is calculated to write-off the valuation of the land and building over their estimated useful lives as follows:
– freehold land is not depreciated;
– leasehold land is depreciated over the unexpired terms of the leases; and
– buildings and improvements thereto are depreciated at the greater of 2 per cent per annum on the straight-line basis or over the
unexpired terms of the leases.
On revaluation of the property, depreciation accumulated during the year will be eliminated. Depreciation charged on revaluation surplus
of the properties is transferred from “Premises revaluation reserve” to “Retained profits”.
On disposal of the property, the profit and loss is calculated as the difference between the net sales proceeds and the net carrying amount
and recognised in the income statement. Surpluses relating to the property disposed of included in the “Premises revaluation reserve” are
transferred as movements in reserves to “Retained profits”.
(ii) Furniture, plant and other equipment, is stated at cost less depreciation calculated on the straight-line basis to write off the assets over
their estimated useful lives, which are generally between 3 and 10 years. On disposal, the profit and loss is calculated as the difference
between the net sales proceeds and the net carrying amount.
Premises, plant and equipment are subject to review for impairment if there are events or changes in circumstances that indicate that the
carrying amount may not be recoverable.
HANG SENG BANK114

4. PRINCIPAL ACCOuNTING POLICIES (continued)
(t) Interest in leasehold land held for own use under operating leaseThe Government of Hong Kong owns all the land in Hong Kong and permits its use under leasehold arrangements. Similar arrangements
exist in mainland China. At inception of the lease, where the cost of land is known or can be reliably determined and the term of the
lease is less than 50 years, the Group records its interest in leasehold land and land use rights separately as operating leases.
These leases are stated at cost less amortization and impairment losses. Amortization is calculated to write off the cost of the land on
a straight-line basis over the terms of the lease. Where the cost of the land is unknown, or cannot be reliably determined, the land and
buildings are accounted for together, as discussed above in 4(s)(i).
(u) Finance and operating leasesLeases which transfer substantially all the risks and rewards of ownership to the lessees are classified as finance leases. Leases which do
not transfer substantially all the risks and rewards of ownership to the lessees are classified as operating leases, with the exceptions of
land and building held under a leasehold interest as set out in notes 4(r) & 4(s).
(i) Finance leasesWhere the Group is a lessor under finance leases, an amount representing the net investment in the lease is included in the balance sheet
as loans and advances to customers. Hire purchase contracts having the characteristics of a finance lease are accounted for in the same
manner as finance leases. Impairment allowances are accounted for in accordance with the accounting policies set out in note 4(f).
Where the Group acquires the use of assets under finance leases, the amount representing the fair value of the leased asset, or, if lower,
the present value of the minimum payments of such assets is included in fixed assets and the corresponding liabilities, net of finance
charges, are recorded as obligations under finance leases. Depreciation is provided at rates which write off the cost or valuation of the
assets over the term of the relevant lease or, where it is likely the Group will obtain ownership of the asset, the life of the asset, as set out
in note 4(s). Impairment allowances are accounted for in accordance with the accounting policy as set out in note 4(v). Finance charges
implicit in the lease payments are charged to the income statement over the period of the leases so as to produce an approximately
constant periodic rate of charge on the remaining balance of the obligations for each accounting period. Contingent rentals are written off
as an expense of the accounting period in which they are incurred.
(ii) Operating leasesWhere the Group leases out assets under operating leases, the assets are included in the balance sheet according to their nature and,
where applicable. Rental revenue arising from operating lease is recognised in accordance with the Group’s revenue recognition policies
as set out in note 4(b)(ii).
(v) Impairment of assetsThe carrying amount of the Group’s assets are reviewed at each balance sheet date to determine whether there is objective evidence of
impairment. If any such evidence exists, the carrying amount is reduced to the estimated recoverable amount by means of a charge to
the income statement.
The accounting policies on impairment losses on loans and receivables and goodwill are set out in notes 4(f) and 4(q) respectively.
(i) Held-to-maturity investmentsFor held-to-maturity investments, the impairment loss is measured as the difference between the asset’s carrying amount and the
present value of estimated future cash flows discounted at the financial asset’s original effective interest rate (i.e. the effective interest rate
computed at initial recognition of these assets) on an individual basis.
If in a subsequent period the amount of an impairment loss decreases and the decrease can be linked objectively to an event occurring
after the impairment loss was recognised, the impairment loss is reversed through the income statement. The reversal of impairment is
limited to the asset’s carrying amount that would have been determined had no impairment loss been recognised in prior years.
ANNUAL REPORT 2010 115

NOTES TO THE FINANCIAL STATEMENTS
4. PRINCIPAL ACCOuNTING POLICIES (continued)
(v) Impairment of assets (continued)
(ii) Available-for-sale financial assetsAt each balance sheet date, an assessment is made of whether there is any objective evidence of impairment in the value of a financial
asset or group of assets. Impairment losses are recognised if, and only if, there is objective evidence of impairment as a result of one or
more events that occurred after the initial recognition of the financial asset (a “loss event”) and that loss event (or events) has an impact
on the estimated future cash flows of the financial asset that can be reliably estimated.
If the available-for-sale financial asset is impaired, the difference between the financial asset’s acquisition cost (net of any principal
repayments and amortisation) and the current fair value, less any previous impairment loss recognised in the income statement, is
reclassified from equity to the income statement.
Impairment losses on available-for-sale debt securities are recognised within “Loan impairment charges and other credit risk provisions” in
the income statement and impairment losses on available-for-sale equity securities are recognised within “Gains less losses from financial
investments and fixed assets” in the income statement.
Once an impairment loss has been recognised on an available-for-sale financial asset, the subsequent accounting treatment for changes
in the fair value of that asset differs depending on the nature of the available-for-sale financial asset concerned:
– for an available-for-sale debt security, a subsequent decline in the fair value of the instrument is recognised in the income statement
if, and only if there is further objective evidence of impairment. Further objective evidence of impairment occurs when as a result of
one or more loss events, the estimated future cash flows of the financial asset are further impacted that can be reliably measured.
Where there is no further objective evidence of impairment, the decline in the fair value of the financial asset is recognised in other
comprehensive income and accumulated separately in equity. If the fair value of a debt security increases in a subsequent period, and
the increase can be objectively related to an event occurring after the impairment loss was recognised in the income statement, the
impairment loss is reversed through the income statement to the extent of the increase in fair value; and
– for an available-for-sale equity security, all subsequent increases in the fair value of the instrument are treated as a revaluation and
are recognised in other comprehensive income and accumulated separately in equity. Impairment losses recognised on the equity
security are not reversed through the income statement. Subsequent decreases in the fair value of the available-for-sale equity
security are recognised in the income statement, only to the extent that further cumulative impairment losses have been incurred in
relation to the acquisition cost of the equity security.
(iii) Other assetsInternal and external sources of information are reviewed at each balance sheet date to identify indications that the following types of
assets may be impaired or an impairment loss previously recognised no longer exists or may have decreased:
– premises and equipment (other than properties carried at revalued amounts);
– pre-paid interests in leasehold land classified as “Interest in leasehold land held for own use under operating lease”;
– investments in subsidiaries and associates; and
– intangible assets.
If any such indication exists, the asset’s recoverable amount is estimated and impairment losses recognised.
HANG SENG BANK116

4. PRINCIPAL ACCOuNTING POLICIES (continued)
(v) Impairment of assets (continued)
(iii) Other assets (continued)
Calculation of recoverable amountThe recoverable amount of an asset is the greater of its net selling price and value in use. In assessing value in use, the estimated future
cash flows are discounted to their present value using a pre-tax discount rate that reflects current market assessments of the time value
of money and the risks specific to the assets. Where an asset does not generate cash inflows largely independent of those from other
assets, the recoverable amount is determined for the smallest group of assets that generates cash inflows independently (i.e. a cash-
generating unit).
Recognition of impairment lossesAn impairment loss is recognised in the income statement whenever the carrying amount of an asset, or the cash-generating unit to which
it belongs, exceeds its recoverable amount. Impairment losses recognised in respect of cash-generating units are allocated first to reduce
the carrying amount of any goodwill allocated to the cash-generating unit (or group of units) and then, to reduce the carrying amount of
the other assets in the unit (or group of units) on a pro rata basis, except that the carrying value of an asset will not be reduced below its
individual fair value less costs to sell, or value in use, if determinable.
Reversals of impairment lossesIn respect of assets other than goodwill, an impairment loss is reversed if there has been a favourable change in the estimates used to
determine the recoverable amount. An impairment loss in respect of goodwill is not reversed.
A reversal of impairment losses is limited to the asset’s carrying amount that would have been determined had no impairment loss been
recognised in prior years. Reversals of impairment losses are credited to the income statement in the year in which the reversals are
recognised.
(w) Income taxIncome tax for the year comprises current tax and movements in deferred tax assets and liabilities. Current tax and movements in
deferred tax assets and liabilities are recognised in the income statement except to the extent that they relate to items recognised in other
comprehensive income or directly in equity, in which case the relevant amounts of tax are recognised in other comprehensive income or
directly in equity, respectively. Current tax balances and deferred tax balances, and movements therein, are presented separately from
each other and are not offset.
Current tax is the expected tax payable on the taxable profits for the year, using tax rates enacted or substantively enacted at the balance
sheet date, and any adjustment to tax payable in respect of previous years. Current tax assets and liabilities are settled on an individual
taxable entity basis.
Deferred tax assets and liabilities arise from deductible and taxable temporary differences respectively, being the differences between the
carrying amounts of assets and liabilities for financial reporting purpose and their tax bases. Deferred tax assets also arise from unused
tax losses and unused tax credits.
Deferred tax liabilities are generally recognised for all taxable temporary differences. Deferred tax assets are recognised to the extent that
it is probable that taxable profits will be available, against which deductible temporary differences can be utilised.
Deferred tax is calculated using the tax rates that are expected to apply in the periods in which the assets will be realised or the liabilities
settled. Deferred tax assets and liabilities are not discounted. Deferred tax assets and liabilities are offset when they arise in the same tax
reporting group and relate to income taxes levied by the same taxation authority, and when a legal right to offset exists in the entity.
The carrying amount of deferred tax assets/liabilities is reviewed at each balance sheet date and is reduced to the extent that it is no longer
probable that sufficient taxable profit will be available to allow the related tax benefit to be utilised.
ANNUAL REPORT 2010 117

NOTES TO THE FINANCIAL STATEMENTS
4. PRINCIPAL ACCOuNTING POLICIES (continued)
(x) Employee benefits(i) Salaries, annual bonuses, paid annual leave, leave passage and the cost to the Group of non-monetary benefits are accrued in the
year in which the associated services are rendered by the employees. Provision is made in respect of paid leave entitlement accumulated
during the year, which can be carried forward into future periods for compensated absence or payment in lieu if the employee leaves
employment.
(ii) The Group provides retirement benefits for staff members and operates defined benefit and defined contribution schemes and
participates in mandatory provident fund schemes in accordance with the relevant laws and regulations.
The retirement benefit costs of defined benefit schemes charged to the income statement are determined by calculating the current service
cost, interest cost and expected return on scheme assets in accordance with a set of actuarial assumptions. Any actuarial gains and losses
are fully recognised in shareholders’ equity and presented in the statement of changes in equity in the period in which they arise.
The Group’s net obligation in respect of defined benefit schemes is calculated separately for each scheme by estimating the amount of
future benefit that employees have earned in return for their service in the current and prior years; that benefit is discounted to determine
the present value, and the fair value of any scheme assets is deducted. The discount rate is the yield at the balance sheet date on high
quality corporate bonds that have maturity dates approximating the terms of the Group’s obligation. The calculation is performed by a
qualified actuary using the Projected Unit Credit Method.
Where the calculation of the Group’s net obligation results in a negative amount, the asset recognised is limited to the present value of
any future refunds from the scheme or reductions in future contributions to the scheme less past service cost.
The retirement benefit costs of defined contribution schemes and mandatory provident fund schemes are the contributions made in
accordance with the relative scheme rules and are charged to the income statement of the year.
(y) Share-based paymentsThe cost of share-based payment arrangements with employees is measured by reference to the fair value of equity instruments on the
date they are granted, and recognised as an expense on a straight-line basis over the vesting period, with a corresponding credit to the
“Other reserves”. The fair value of equity instruments that are made available immediately, with no vesting period attached to the award,
are expensed immediately.
Fair value is determined by using market prices or appropriate valuation models, taking into account the terms and conditions upon
which the equity instruments were granted. Market performance conditions are taken into account when estimating the fair value of
equity instruments at the date of grant, so that an award is treated as vesting irrespective of whether the market performance condition is
satisfied, provided all other conditions are satisfied.
Vesting conditions, other than market performance conditions, are not taken into account in the initial estimate of the fair value at the grant
date. They are taken into account by adjusting the number of equity instruments included in the measurement of the transaction, so that
the amount recognised for services received as consideration for the equity instruments granted shall be based on the number of equity
instruments that eventually vest. On a cumulative basis, no expense is recognised for equity instruments that do not vest because of a
failure to satisfy non-market performance or service conditions.
A cancellation that occurs during the vesting period is treated as an acceleration of vesting, and recognised immediately for the amount
that would otherwise have been recognised for services over the vesting period.
HANG SENG BANK118

4. PRINCIPAL ACCOuNTING POLICIES (continued)
(z) Translation of foreign currenciesForeign currency transactions during the year are translated at the foreign exchange rates ruling at the transaction dates. Monetary assets
and liabilities denominated in foreign currencies are translated at the foreign exchange rates ruling at the balance sheet date. Exchange
gains and losses are recognised in the income statement. Non-monetary assets and liabilities that are measured in terms of historical cost
in a foreign currency are translated using the foreign exchange rates ruling at the transaction dates. Non-monetary assets and liabilities
denominated in foreign currencies that are stated at fair value are translated using the foreign exchange rates ruling at the dates the fair
value was determined.
Exchange differences arising from the re-translation of opening foreign currency net investments and the related cost of hedging, if
any, and exchange differences arising from re-translation of the result for the year from the average rate to the exchange rate ruling at
the year-end, are recognised in other comprehensive income and accumulated separately in equity in the foreign exchange reserve.
Exchange differences on a monetary item that is part of a net investment in a foreign operation are recognised in the income statement
of separate subsidiary financial statements. In the consolidated financial statements, these exchange differences are recognised in other
comprehensive income and accumulated separately in equity in the foreign exchange reserve.
(aa) ProvisionsProvisions are recognised when it is probable that an outflow of economic benefits will be required to settle a present legal or constructive
obligation as a result of past events and a reliable estimate can be made as to the amount of the obligation.
(ab) Financial guaranteesFinancial guarantees are contracts that require the Group to make specified payments to reimburse the holder for a loss it incurs because
a specified debtor fails to make payment when due in accordance with the terms of the loans or debt instruments.
Financial guarantee liabilities are initially recognised at their fair value, and the initial fair value is amortised over the life of the financial
guarantee. The guarantee liability is subsequently carried at the higher of this amortised amount and the present value of any expected
payment (when a payment under the guarantee has become probable). Financial guarantees are included within other liabilities.
(ac) Insurance contractsThrough its insurance subsidiaries, the Group issues contracts to customers that contain insurance risk, financial risk or a combination thereof.
An insurance contract may also transfer financial risk, but is accounted for as an insurance contract if the insurance risk is significant.
A contract issued by the Group that transfers financial risk, without significant insurance risk, is classified as an investment contract, and
is accounted for as a financial instrument. The financial assets held by the Group for the purpose of meeting liabilities under insurance and
investment contracts are classified and accounted for based on their classifications as set out in notes 4(d) to 4(i).
Insurance contracts are accounted for as follows:
Net earned insurance premiumsGross insurance premiums for general insurance business are accounted for in the period in which the amount is determined, which is
generally the period in which the risk commences. The proportion of premiums written in the accounting year relating to the period of risk
after the balance sheet date is carried forward as a provision for unearned premium and is calculated on a daily pro rata basis.
Premiums for life insurance are accounted for when receivable, except in linked business where premiums are accounted for when
liabilities are recognised.
Reinsurance premiums, netted by the reinsurers’ share of provision for unearned premiums, are accounted for in the same accounting
year as the premiums for the direct insurance to which they relate.
ANNUAL REPORT 2010 119
NOTES TO THE FINANCIAL STATEMENTS
4. PRINCIPAL ACCOuNTING POLICIES (continued)
(ac) Insurance contracts (continued)
Claims and reinsurance recoveriesGross insurance claims for general insurance business include paid claims and movements in outstanding claims reserves. Full provision
for outstanding claims is made for the estimated cost of all claims notified but not settled at the balance sheet date, and claims incurred
but not reported by that date. Provision is also made for the estimated cost of servicing claims notified but not settled at the balance
sheet date, reduced by estimates of salvage and subrogation recoveries, and to meet expenses on claims incurred but not reported.
Reinsurance recoveries are assessed in a manner similar to the assessment of provision for outstanding claims.
Gross insurance claims for life insurance reflect the total cost of claims arising during the year, including policyholder cash dividend payment
upon policy anniversary. The technical reserves for non-linked liabilities (long-term business provision) are calculated based on actuarial
principles. The technical reserves for linked liabilities are at least the element of any surrender or transfer value which is calculated by reference
to the relevant fund or funds or index. Reinsurance recoveries are accounted for in the same period as the related claims.
Deferred acquisition costsThe deferred acquisition costs related to insurance contract, such as initial commission, are amortised over the period in which the related
revenues are earned.
Value of long-term insurance businessA value is placed on insurance contracts that are classified as long-term insurance business, and are in force at the balance sheet date.
The value of the in-force long-term insurance business is determined by discounting future earnings expected to emerge from business
currently in force, using appropriate assumptions in assessing factors such as future mortality, lapse rates, levels of expenses and a risk
discount rate that reflects the risk premium attributable to the respective long-term insurance business. Movements in the value of in-
force long-term insurance business are included in other operating income on a pre-tax basis. The value of in-force long-term insurance
business is reported under “Intangible assets” in the balance sheet.
(ad) Investment contractsCustomer liabilities under linked investment contracts are measured at fair value and reported under “Financial liabilities designated at fair
value”. The linked financial assets are measured at fair value and the movements in fair value are recognised in the income statement in
“Net income from financial instruments designated at fair value”.
Premiums receivable and amounts withdrawn are accounted for as increases or decreases in the liability recorded in respect of investment
contracts.
Investment management fee receivables are recognised in the income statement over the period of the provision of the investment
management services.
The incremental costs directly related to the acquisition of new investment contracts or renewing existing investment contracts are
capitalised and amortised over the period the investment management services are provided.
(ae) Debt securities in issue and subordinated liabilitiesDebt securities in issue and subordinated liabilities are measured at amortised cost using the effective interest rate method, and are reported
under “Debt securities in issue” or “Subordinated liabilities”, except for those issued for trading or designated at fair value, which are carried
at fair value and reported under the “Trading liabilities” and “Financial liabilities designated at fair value” in the balance sheet.
(af) Assets held for saleNon-current assets that are expected to be recovered primarily through sale rather than through continuing use are classified as held for
sale. Immediately before classification as held for sale, the assets are remeasured in accordance with the Group’s accounting policies set
out elsewhere in note 4. Thereafter generally the assets are measured at the lower of their carrying amount and fair value less cost to sell.
Impairment losses on initial classification as held for sale and subsequent gains or losses on remeasurement are recognised in profit or
loss. Gains are not recognised in excess of any cumulative impairment loss.
HANG SENG BANK120

4. PRINCIPAL ACCOuNTING POLICIES (continued)
(ag) Related partiesFor the purposes of these financial statements, parties are considered to be related to the Group if the Group has the ability, directly or
indirectly, to control the party or exercise significant influence over the party in making financial and operating decisions, or vice versa, or
where the Group and the party are subject to common control or common significant influence. Related parties may be individuals (being
members of key management personnel, significant shareholders and/or their close family members) or other entities which are under the
significant influence of related parties of the Group and post employment benefit scheme. Key management personnel are those persons
having authority and responsibility for planning, directing and controlling the activities of the Bank and its holding companies, directly
or indirectly, including any directors (whether executive or otherwise) and Executive Committee members of the Bank and its holding
companies.
(ah) DividendsDividends proposed or declared after the balance sheet date are disclosed as a separate component of shareholders’ equity.
5. CHANGES IN ACCOuNTING POLICIESThe Group adopted a number of HKFRSs or amendments to HKFRSs which had an insignificant or no effect on the consolidated financial
statements. These are:
– Amendment to HKFRS 3 “Business Combinations” and HKAS 27 “Consolidated and Separate Financial Statements”.
– Amendment to HKAS 39 “Financial Instruments: Recognition and Measurement” – “Eligible Hedged Items”;
– Amendments to HKFRS 2 “Share-based Payment” – “Group Cash-settled Share-based Payment Transactions”;
– Hong Kong (IFRIC) Interpretation 17 “Distributions of Non-cash Assets to Owners”;
– HKFRS 1 (Revised) “First-time Adoption of Hong Kong Financial Reporting Standards”;
– Amendments to HKFRS 1 “First-time Adoption of Hong Kong Financial Reporting Standards” – “Additional Exemptions for First-time
Adopters”;
– Amendment to HKFRS 1 “First-time Adoption of Hong Kong Financial Reporting Standards” – “Limited Exemption from Comparative
HKFRS 7 Disclosures for First-time Adopters”;
– Hong Kong (IFRIC) Interpretation 18 “Transfer of Assets from Customers”; and
– Other amendments made under “Improvements to HKFRSs” in May 2009, except the amendment to leases as discussed below.
During the year the Group adopted the following HKFRSs and amendments to HKFRSs:
Hong Kong Accounting Standard 17, “Leases” (HKAS 17) has been amended with effect from 1 January 2010 (“the amendment”) as
part of the “Improvements to HKFRS” issued in May 2009. Since 2005, and prior to the amendment, a number of significant interests in
long-term leasehold land owned by the Group have been recorded as operating leases, measured at historical cost less amortisation in
the balance sheet. Following the application of the amendment in 2010, such interests are reclassified as finance leases, included within
“Premises, plant and equipment” in the balance sheet and carried at valuation (as discussed in note 4(s)). The amendment has been
applied retrospectively and the corresponding prior-year comparatives have been adjusted accordingly.
ANNUAL REPORT 2010 121

NOTES TO THE FINANCIAL STATEMENTS
5. CHANGES IN ACCOuNTING POLICIES (continued)
The following primary statement lines have been impacted by the adoption of HKAS 17:
(i) For the Group
Figures in HK$m As reported Adjustment Restated
Year ended 31 December 2009
Profit for the year 13,221 (83) 13,138
Total comprehensive income 18,608 582 19,190
Earnings per share (HK$) 6.92 (0.05) 6.87
As at 31 December 2009
Premises, plant and equipment 7,178 5,236 12,414
Interest in leasehold land held for own use under operating lease 536 (536) –
Deferred tax liabilities 1,684 776 2,460
Other reserves 7,313 3,891 11,204
Retained profits 37,719 33 37,752
As at 31 December 2008
Premises, plant and equipment 7,090 4,553 11,643
Interest in leasehold land held for own use under operating lease 551 (551) –
Deferred tax assets 201 (175) 26
Deferred tax liabilities 711 485 1,196
Other reserves 3,813 3,336 7,149
Retained profits 32,518 6 32,524
(ii) For the Bank
Figures in HK$m As reported Adjustment Restated
As at 31 December 2009
Premises, plant and equipment 4,198 5,236 9,434
Interest in leasehold land held for own use under operating lease 536 (536) –
Deferred tax liabilities 569 776 1,345
Other reserves 3,293 3,891 7,184
Retained profits 17,861 33 17,894
As at 31 December 2008
Premises, plant and equipment 4,294 4,553 8,847
Interest in leasehold land held for own use under operating lease 551 (551) –
Deferred tax assets 187 (175) 12
Deferred tax liabilities – 485 485
Other reserves 1,195 3,336 4,531
Retained profits 15,563 6 15,569
HANG SENG BANK122

6. ACCOuNTING ESTIMATES AND JuDGEMENTSKey sources of estimation uncertainty and critical judgements in applying the Group’s accounting policies which have significant effect on
the financial statements are set out below.
(a) Key sources of estimation uncertainty(i) Impairment allowances on loans and advancesThe Group periodically reviews its loan portfolios to assess whether impairment allowances exist. In determining whether impairment
allowances should be recorded in the income statement, the Group makes judgements as to whether there is any observable data
indicating that there is a measurable decrease in the estimated future cash flows from a portfolio of loans before the decrease can be
identified with an individual loan in that portfolio. This evidence may include observable data indicating that there has been an adverse
change in the payment status of borrowers in a group, or national or local economic conditions that correlate with defaults on assets
in the Group. Management uses estimates based on historical loss experience for assets with credit risk characteristics and objective
evidence of impairment similar to those in the portfolio when scheduling its future cash flows. The methodology and assumptions used
for estimating both the amount and timing of future cash flows are reviewed regularly to reduce any differences between loss estimates
and actual loss experience.
(ii) Valuation of financial instrumentsThe Group’s accounting policy for valuation of financial instruments is included in note 4(n) and is discussed further within note 62 “Fair
value of financial instruments”.
When fair values are determined by using valuation techniques which refer to observable market data because independent prices are not
available, management will consider the following when applying a valuation model:
– the likelihood and expected timing of future cash flows on the instrument. These cash flows are usually governed by the terms of
the instrument, although management judgement may be required when the ability of the counterparty to service the instrument in
accordance with the contractual terms is in doubt;
– an appropriate discount rate for the instrument. Management determines this rate based on its assessment of the appropriate spread
of the rate for the instrument over the risk-free rate; and
– judgement to determine what model to use to calculate fair value in areas where the choice of valuation model is particularly subjective,
for example, when valuing complex derivatives.
When valuing instruments by reference to comparable instruments, management takes into account the maturity, structure and rating
of the instrument with which the position held is being compared. When valuing instruments on a model basis using the fair value of
underlying components, management also considers the need for adjustments to take into account of factors such as bid-offer spread,
credit profile and model limitation. These adjustments are based on defined policies which are applied consistently across the Group.
When unobservable market data have a significant impact on the valuation of derivatives, the entire initial change in fair value indicated
by the valuation model is recognised on one of the following bases: over the life of the transaction on an appropriate basis; in the income
statement when the inputs become observable; or when the transaction matures or is closed out.
Financial instruments measured at fair value through profit or loss comprise of financial instruments held for trading and financial instruments
designated at fair value. Changes in their fair value directly impact the Group’s income statement in the period in which they occur.
A change in the fair value of a financial asset which is classified as “available-for-sale” is recorded directly in equity until the financial
asset is sold, when the cumulative change in fair value is charged or credited to the income statement. When a decline in the fair value
of an available-for-sale financial asset has been recognised directly in equity and there is objective evidence that the asset is impaired,
the cumulative loss that had been recognised directly in equity is reclassified from equity to the income statement, reducing the Group’s
operating profit.
ANNUAL REPORT 2010 123

NOTES TO THE FINANCIAL STATEMENTS
6. ACCOuNTING ESTIMATES AND JuDGEMENTS (continued)
(a) Key sources of estimation uncertainty (continued)
(iii) Insurance contractsClassificationHKFRS 4 – Insurance Contracts (“HKFRS 4”) requires the Group to determine whether an insurance contract that transfers both insurance
risk and financial risk is classified as an insurance contract, or as a financial instrument under HKAS 39, or whether the insurance and
non-insurance elements of the contract should be accounted for separately. This process involves judgement and estimation of the
amounts of different types of risks that are transferred or assumed under a contract. The estimation of such risks often involves the use
of assumptions about future events and is thus subject to a degree of uncertainty.
Present value of in-force long-term insurance business (“PVIF”)The value of PVIF, which is recorded as an intangible asset, depends upon assumptions regarding future events. These are described in
more detail in note 41(a). The assumptions are reassessed at each reporting date and changes in the estimates which affect the value of
PVIF are reflected in the income statement.
Insurance liabilitiesThe estimation of insurance claims liabilities involves selecting statistical models and making assumptions about future events which need
to be frequently calibrated against experience and forecasts. The sensitivity of insurance liabilities to potential changes in key assumptions
is set out in note 61(d).
(b) Critical accounting judgements in applying the Group’s accounting policies(i) Impairment of available-for-sale financial assetsFor available-for-sale financial assets, a significant or prolonged decline in fair value below cost is considered to be objective evidence
of impairment. Judgement is required when determining whether a decline in fair value has been significant or prolonged. In making this
judgement, the historical data on market volatility as well as the price of the specific investment are taken into account. The Group also
takes into account other factors, such as industry and sector performance and financial information regarding the issuer/investee.
(ii) Held-to-maturity investmentsNon-derivative financial assets with fixed or determinable payments and fixed maturity are classified as held-to-maturity investments if
the Group has the intention and ability to hold them until maturity. In evaluating whether the requirements to classify a financial asset as
held-to-maturity are met, management makes significant judgements. Failure in correctly assessing the Group’s intention and ability to
hold specific investments until maturity may result in reclassification of the whole portfolio as available-for-sale.
(iii) Income taxesDetermining income tax provisions involves judgement on the future tax treatment of certain transactions. The Group carefully evaluates tax
implications of transactions and tax provisions are set up accordingly. The tax treatment of such transactions is reconsidered periodically
to take into account all changes in tax legislations.
7. POSSIBLE IMPACT OF AMENDMENTS, NEW STANDARDS AND INTERPRETATIONS ISSuED BuT NOT YET EFFECTIVE FOR THE YEAR ENDED 31 DECEMBER 2010
The HKICPA has issued a number of amendments to HKFRSs and Interpretations which are not yet effective for the year ended
31 December 2010 and which have not been adopted in these financial statements.
HKFRS 9 “Financial Instruments” (“HKFRS 9”) was issued in November 2009 and establishes new principles for the classification and
measurement of financial assets. In November 2010, the HKICPA issued additions to HKFRS 9 dealing with financial liabilities. The main
changes to the requirements of HKAS 39 are summarised below.
– All financial assets are classified into two measurement categories: amortised cost or fair value. These two categories replace the four
categories under the current HKAS 39 “Financial Instruments: Recognition and Measurement”.
– Financial assets are classified on the basis of both an entity’s business model for managing groups of financial assets and the
contractual cash flow characteristics of the individual assets.
HANG SENG BANK124

7. POSSIBLE IMPACT OF AMENDMENTS, NEW STANDARDS AND INTERPRETATIONS ISSuED BuT NOT YET EFFECTIVE FOR THE YEAR ENDED 31 DECEMBER 2010 (continued)
– Financial assets are measured at fair value through profit or loss, if they do not meet the criteria specified for measurement at
amortised cost or if doing so significantly reduces or eliminates an accounting mismatch. An entity has the option to designate all
subsequent changes in fair value of an equity instrument not held for trading at fair value through other comprehensive income with
no recycling of gains or losses to the income statement. Dividend income would continue to be recognised in the income statement.
– Financial assets which contain embedded derivatives are to be classified in their entirety either at fair value or amortised cost depending
on whether the contracts as a whole meet the relevant criteria under HKFRS 9.
– HKFRS 9 retains all the existing requirements for derecognition of financial instruments and most of the requirements for financial
liabilities, except that for financial liabilities designated under the fair value option other than loan commitments and financial guarantee
contracts, fair value changes attributable to changes in own credit risk are to be presented in the statement of other comprehensive
income, and are not subsequently reclassified to income statement but may be transferred within equity.
HKFRS 9 is mandatory for annual periods beginning on or after 1 January 2013 with earlier application permitted. It is required to be
applied retrospectively, but if adopted prior to 1 January 2012, an entity will be exempt from the requirement to restate prior period
comparative information. The Group is presently studying the implications of applying HKFRS 9. It is impracticable to quantify the impact
of HKFRS 9 as at the date of publication of these financial statements.
The HKICPA issued HKAS 24 (Revised 2009) “Related Party Disclosures” in November 2009, which is effective for annual periods
beginning on or after 1 January 2011. The revised standard simplifies the disclosure requirements for government-related entities and
clarifies the definition of a related party. The Group does not expect adoption of the amendments to have a significant effect on the
consolidated financial statements.
The HKICPA issued Hong Kong (IFRIC) Interpretation 19 “Extinguishing Financial Liabilities with Equity Instruments” in December 2009,
which is effective for annual periods beginning on or after 1 July 2010. This interpretation provides guidance on how to account for the
extinguishment of a financial liability by the issue of equity instruments. The Group does not expect adoption of this amendment to have
a significant effect on the consolidated financial statements.
The HKICPA issued an Amendment to Hong Kong (IFRIC) Interpretation 14 “HKAS 19 The Limit on a Defined Benefit Asset, Minimum
Funding Requirements and their Interaction” – “Prepayments of a Minimum Funding Requirement” in December 2009, which is effective
for annual periods beginning on or after 1 January 2011. The amendment applies in the limited circumstances when an entity is subject
to minimum funding requirements and makes an early payment of contributions to cover those requirements. The amendment permits
such an entity to treat the benefit of such an early payment as an asset. The Group does not expect adoption of the amendments to have
a significant effect on the consolidated financial statements.
The HKICPA issued “Improvements to HKFRSs” in May 2010, which comprises a collection of necessary, but not urgent, amendments to
HKFRSs. The amendments are primarily effective for annual periods beginning on or after 1 January 2011, with earlier application permitted.
The Group does not expect adoption of these amendments to have a significant effect on the consolidated financial statements.
The HKICPA issued an amendment to HKFRS 7 “Financial Instruments: Disclosures” in October 2010 which requires additional disclosures
for risk exposures arising from transferred financial assets. The amendment will be effective for annual periods beginning on or after 1 July
2011, with earlier application permitted. No disclosures are required for prior periods. The Group is presently studying the implications of
applying this amendment to HKFRS 7.
The HKICPA issued an amendment to HKAS 12 “Income Taxes” in December 2010 whereby deferred taxes on an investment property,
carried under the fair value model in IAS 40, will be measured presuming that an investment property is recovered entirely through sale.
The presumption is rebutted if the investment property is held within a business model whose objective is to consume substantially all
of the economic benefits embodied in the investment property over time, rather than through sale. The amendments will be effective for
annual periods beginning on or after 1 January 2012 with earlier application permitted.
ANNUAL REPORT 2010 125

NOTES TO THE FINANCIAL STATEMENTS
8. INTEREST INCOME/INTEREST EXPENSE(a) Interest income
2010 2009
Interest income arising from:
– financial assets that are not at fair value through profit or loss 16,228 15,950
– trading assets 197 320
– financial assets designated at fair value 82 120
16,507 16,390
of which:
– interest income from listed investments 1,436 1,801
– interest income from unlisted investments 3,072 3,569
– interest income from impaired financial assets 48 46
(b) Interest expense
2010 2009
Interest expense arising from:
– financial liabilities that are not at fair value through profit or loss 1,769 1,799
– trading liabilities 435 554
– financial liabilities designated at fair value 3 14
2,207 2,367
of which:
– interest expense from debt securities in issue maturing after five years – –
– interest expense from customer accounts maturing after five years – –
– interest expense from subordinated liabilities 63 126
HANG SENG BANK126

9. NET FEE INCOME
2010 2009
– stockbroking and related services 1,468 1,566
– retail investment funds 1,039 604
– structured investment products 19 28
– insurance agency 256 190
– account services 349 291
– private banking service fee 160 129
– remittances 259 217
– cards 1,462 1,413
– credit facilities 195 135
– trade services 452 379
– other 236 238
Fee income 5,895 5,190
Fee expense (998) (869)
4,897 4,321
of which:
Net fee income, other than amounts included in determining the effective interest rate, arising from financial assets or financial liabilities that are not held for trading nor designated at fair value 1,810 1,658
– fee income 2,452 2,217
– fee expense (642) (559)
Net fee income on trust and other fiduciary activities where the Group holds or invests on behalf of its customers 773 383
– fee income 973 557
– fee expense (200) (174)
10. TRADING INCOME
2010 2009
Foreign exchange 1,768 1,792
(Losses)/gains from hedging activities:
– fair value hedge
– on hedging instruments (261) 74
– on the hedged items attributable to the hedged risk 272 (81)
– cash flow hedge
– net hedging income – 16
Securities, derivatives and other trading activities 280 122
2,059 1,923
ANNUAL REPORT 2010 127

NOTES TO THE FINANCIAL STATEMENTS
11. NET INCOME/(LOSS) FROM FINANCIAL INSTRuMENTS DESIGNATED AT FAIR VALuE
2010 2009
Net income/(loss) on assets designated at fair value which back insurance and investment contracts 297 (54)
Net change in fair value of other financial instruments designated at fair value (15) (21)
282 (75)
of which dividend income from:
– listed investments 3 1
– unlisted investments 1 1
4 2
12. DIVIDEND INCOME
2010 2009
Dividend income:
– listed investments 2 3
– unlisted investments 12 13
14 16
13. NET EARNED INSuRANCE PREMIuMS
Non-lifeinsurance
Lifeinsurance
(non-linked)
Lifeinsurance
(linked) Total
2010
Gross written premiums 470 11,031 11 11,512
Movement in unearned premiums (33) – – (33)
Gross earned premiums 437 11,031 11 11,479
Gross written premiums ceded to reinsurers (122) (76) – (198)
Reinsurers’ share of movement in unearned premiums 26 – – 26
Reinsurers’ share of gross earned premiums (96) (76) – (172)
Net earned insurance premiums 341 10,955 11 11,307
2009
Gross written premiums 422 11,237 15 11,674
Movement in unearned premiums (18) – – (18)
Gross earned premiums 404 11,237 15 11,656
Gross written premiums ceded to reinsurers (93) (59) – (152)
Reinsurers’ share of movement in unearned premiums 15 – – 15
Reinsurers’ share of gross earned premiums (78) (59) – (137)
Net earned insurance premiums 326 11,178 15 11,519
HANG SENG BANK128

14. OTHER OPERATING INCOME
2010 2009
Rental income from investment properties 155 149
Movement in present value of in-force long-term insurance business 1,126 760
Other 277 180
1,558 1,089
15. NET INSuRANCE CLAIMS INCuRRED AND MOVEMENT IN POLICYHOLDERS’ LIABILITIES
Non-lifeinsurance
Lifeinsurance
(non-linked)
Lifeinsurance
(linked) Total
2010
Claims, benefits and surrenders paid 113 2,402 24 2,539
Movement in provisions 21 10,085 4 10,110
Gross claims incurred and movement in policyholders’ liabilities 134 12,487 28 12,649
Reinsurers’ share of claims, benefits and surrenders paid (26) (22) – (48)
Reinsurers’ share of movement in provisions – (14) – (14)
Reinsurers’ share of claims incurred and movement in policyholders’ liabilities (26) (36) – (62)
Net insurance claims incurred and movement in policyholders’ liabilities 108 12,451 28 12,587
2009
Claims, benefits and surrenders paid 119 1,811 19 1,949
Movement in provisions (16) 10,066 35 10,085
Gross claims incurred and movement in policyholders’ liabilities 103 11,877 54 12,034
Reinsurers’ share of claims, benefits and surrenders paid (10) (18) – (28)
Reinsurers’ share of movement in provisions (1) (1) – (2)
Reinsurers’ share of claims incurred and movement in policyholders’ liabilities (11) (19) – (30)
Net insurance claims incurred and movement in policyholders’ liabilities 92 11,858 54 12,004
ANNUAL REPORT 2010 129

NOTES TO THE FINANCIAL STATEMENTS
16. LOAN IMPAIRMENT CHARGES AND OTHER CREDIT RISK PROVISIONSGroup Bank
2010 2009 2010 2009
Loan impairment charges (note 35(b)):
– individually assessed (186) (310) (97) (285)
– collectively assessed (204) (502) (185) (503)
(390) (812) (282) (788)
of which:
– new and additional (609) (1,104) (475) (1,028)
– releases 157 230 142 194
– recoveries 62 62 51 46
(390) (812) (282) (788)
Other credit risk provisions – – – –
(390) (812) (282) (788)
There was no impairment charge (2009: Nil) provided for available-for-sale debt securities by the Group and the Bank. There was also no
impairment loss made in relation to held-to-maturity investments in 2010 (2009: Nil).
17. OPERATING EXPENSES
2010 2009(restated)
Employee compensation and benefits:
– salaries and other costs* 3,448 3,091
– retirement benefit costs
– defined benefit scheme (note 58(a)) 191 213
– defined contribution scheme (note 58(b)) 78 74
3,717 3,378
General and administrative expenses:
– rental expenses 464 430
– other premises and equipment 902 900
– marketing and advertising expenses 470 382
– other operating expenses 1,081 1,021
2,917 2,733
Depreciation of business premises and equipment (note 40(a)) 619 591
Amortisation of intangible assets (note 41(c)) 102 84
7,355 6,786
* of which:
share based payments (note 59(e)) 100 101
Cost efficiency ratio 33.7% 32.6%
Included in operating expenses are minimum lease payments under operating leases of HK$493 million (2009: HK$461 million).
HANG SENG BANK130

18. THE EMOLuMENTS OF THE FIVE HIGHEST PAID INDIVIDuALS(a) The aggregate emoluments
2010 2009
Salaries, allowances and benefits in kind 20 17
Retirement scheme contributions 2 2
Discretionary bonuses 10 10
Share-based payments 7 6
39 35
(b) The numbers of the five highest paid individuals whose emoluments fell within the following bands were:
2010Number ofIndividuals
2009Number ofIndividuals
HK$
4,000,001 – 4,500,000 1 –
5,000,001 – 5,500,000 1 1
5,500,001 – 6,000,000 – 1
6,000,001 – 6,500,000 – 1
6,500,001 – 7,000,000 2 1
10,500,001 – 11,000,000 – 1
16,000,001 – 16,500,000 1 –
5 5
The emoluments of the five highest paid individuals set out above include the emoluments of two (2009: three) Executive Directors and
one non-executive director (2009: one). Their respective directors’ emoluments are included in note 19.
ANNUAL REPORT 2010 131

NOTES TO THE FINANCIAL STATEMENTS
19. DIRECTORS’ EMOLuMENTSThe emoluments of the Directors of the Bank calculated in accordance with section 161 of the Hong Kong Companies Ordinance were:
Fees’000
Salaries,allowances
and benefitsin kind
’000
Pension andPension
contribution(4)
’000
DiscretionaryBonuses
’000
Share-basedpayments(5)
’000
Total2010’000
Total2009’000
Executive Directors
Ms Margaret Leung (1) (Appointed on 6 May 09) – 5,981 825 5,380 4,089 16,275 4,834
Mr William W C Leung (2) (Appointed on 7 Aug 09) – 3,538 405 454 807 5,204 1,874
Mr Raymond C F Or (Resigned on 6 May 09) – – – – – – 10,700
Mr Joseph C Y Poon (Resigned on 30 Sep 09) – – – – – – 6,038
Mr Patrick K W Chan (Resigned on 6 May 09) – – – – – – 2,841
Non-Executive Directors
Dr Raymond K F Ch’ien (3) 367 – – – – 367 360
Mr Edgar D Ancona (1) (Resigned on 31 Aug 09) – – – – – – 187
Mr Iain J Mackay (1) (Appointed on 1 Sep 09) 280 – – – – 280 93
Ms Dorothy K Y P Sit (2) (Appointed on 7 Aug 09) – 3,868 387 1,183 1,281 6,719 2,091
Mr Alexander A Flockhart (1) 280 – – – – 280 280
Dr John C C Chan (3) 340 – – – – 340 340
Dr Y T Cheng (3) (Resigned on 6 May 09) – – – – – – 117
Dr Marvin K T Cheung (3) 360 – – – – 360 360
Mr Jenkin Hui (3) 320 – – – – 320 320
Mr Peter T C Lee (3) (Deceased on 17 Oct 09) – – – – – – 267
Dr Eric K C Li (3) 400 – – – – 400 400
Dr Vincent H S Lo 280 – – – – 280 280
Dr David W K Sin (3) (Resigned on 6 May 09) – – – – – – 117
Mr Richard Y S Tang (3) 478 – – – – 478 473
Mr Peter T S Wong (1) 280 – – – – 280 280
Ms L Y Chiang (3) (Appointed on 20 Sep 10) 93 – – – – 93 –
Mr Michael W K Wu (3) (Appointed on 20 Sep 10) 93 – – – – 93 –
Past Directors – – 2,169 – – 2,169 2,169
3,571 13,387 3,786 7,017 6,177 33,938 34,421
2009 3,901 14,859 3,871 7,399 4,391
Notes :
(1) Fees receivable as a Director of Hang Seng Bank Limited were surrendered to The Hongkong and Shanghai Banking Corporation Limited in accordance with the HSBC Group’s internal policy.
(2) Fee receivable as a Director of Hang Seng Bank Limited were waived by the Directors in 2010.
(3) Independent Non-Executive Director.
(4) The aggregate amount of pensions received by the past Directors of the Bank under the relevant pension schemes amounted to HK$2.2 million in 2010. The Bank made contributions during 2010 into the pension schemes of which the Bank’s past Directors are among their members. The contributions serve to maintain the funding positions of these schemes in respect of liabilities to all scheme members, including but not limited to the past Directors. The amount of contribution attributable to any specific scheme member is not determinable.
(5) These represent the estimated fair value of share option granted to certain directors under the HSBC Group share option plan and the purchase cost of restricted share and performance share under the HSBC Group share plan, which is measured according to the Group’s accounting policies for share-based payment as set out in note 4(y). The details of these benefits in kind are also set out in note 59.
HANG SENG BANK132

20. AuDITORS’ REMuNERATIONGroup Bank
2010 2009 2010 2009
Statutory audit services 13 13 8 9
Non-statutory audit services and others 6 6 5 5
19 19 13 14
21. GAINS LESS LOSSES FROM FINANCIAL INVESTMENTS AND FIXED ASSETS
2010 2009
Net gains from disposal of available–for–sale equity securities:
– reclassified from reserve 9 165
– net gains/(losses) arising in the year 1 (4)
10 161
Net gains/(losses) from disposal of available-for-sale debt securities 95 (152)
Impairment of available-for-sale equity securities – (4)
Gains less losses on disposal of assets held for sale 12 187
Gains less losses on disposal of fixed assets (5) (6)
112 186
There was no impairment losses or gains less losses on disposal of held-to-maturity debt securities, loans and receivables and financial
liabilities measured at amortised cost for 2010 and 2009.
22. NET SuRPLuS ON PROPERTY REVALuATION
2010 2009(restated)
Surplus of revaluation on investment properties (note 39(a)) 474 250
Surplus of revaluation on assets held for sale 10 –
Reversal of revaluation deficit on premises (note 40(a)) 3 2
487 252
ANNUAL REPORT 2010 133

NOTES TO THE FINANCIAL STATEMENTS
23. TAX EXPENSE(a) Taxation in the consolidated income statement represents:
2010 2009(restated)
Current tax – provision for Hong Kong profits tax
Tax for the year 1,967 1,844
Adjustment in respect of prior year (19) (3)
1,948 1,841
Current tax – taxation outside Hong Kong
Tax for the year 38 50
Deferred tax (note 49(b))
Origination and reversal of temporary differences 442 371
Total tax expense 2,428 2,262
The current tax provision is based on the estimated assessable profit for 2010, and is determined for the Bank and its subsidiaries
operating in the Hong Kong SAR by using the Hong Kong profits tax rate of 16.5 per cent (2009: 16.5 per cent). For subsidiaries and
branches operating in other jurisdictions, the appropriate tax rates prevailing in the relevant countries are used. Deferred tax is calculated
at the tax rates that are expected to apply in the year when the liability is settled or the asset is realised.
(b) Reconciliation between taxation charge and accounting profit at applicable tax rates:
2010 2009(restated)
Profit before tax 17,345 15,400
Notional tax on profit before tax, calculated at Hong Kong tax rate of 16.5% (2009: 16.5%) 2,862 2,541
Tax effect of:
– different tax rates in other countries/areas (172) (139)
– non-taxable income and non-deductible expenses (41) (89)
– share of results of associates (439) (288)
– others 218 237
Actual charge for taxation 2,428 2,262
24. PROFIT ATTRIBuTABLE TO SHAREHOLDERSOf the profit attributable to shareholders, HK$10,914 million (2009: HK$10,258 million) has been dealt with in the financial statements of
the Bank.
Reconciliation of the above amount to the Bank’s profit for the year:
2010 2009(restated)
Amount of consolidated profit attributable to shareholders dealt with in the Bank’s financial statements 10,914 10,258
Dividends declared during the year by subsidiaries from retained profits 565 5
The Bank’s profit for the year 11,479 10,263
HANG SENG BANK134

25. EARNINGS PER SHAREThe calculation of earnings per share for 2010 is based on earnings of HK$14,917 million (HK$13,138 million in 2009) and on the weighted
average number of ordinary shares in issue of 1,911,842,736 shares (unchanged from 2009).
26. DIVIDENDS PER SHARE(a) Dividends attributable to the year:
2010 2009
per shareHK$
HK$ million per shareHK$
HK$ million
First interim 1.10 2,103 1.10 2,103
Second interim 1.10 2,103 1.10 2,103
Third interim 1.10 2,103 1.10 2,103
Fourth interim 1.90 3,633 1.90 3,633
5.20 9,942 5.20 9,942
The fourth interim dividend proposed after the balance sheet date has not been recognised as a liability at the balance sheet date.
(b) Dividends attributable to the previous year, approved and paid during the year:
2010 2009
Fourth interim dividend in respect of the previous year, approved and paid during the year, of HK$1.90 per share (2009: HK$3.00 per share) 3,633 5,736
27. SEGMENTAL ANALYSISThe Group’s business comprises five customer groups. To be consistent with the way in which information is reported internally for the
purposes of resource allocation and performance assessment, the Group identified the following five reportable segments.
Personal Financial Services provides banking (including deposits, credit cards, mortgages and other retail lending) and wealth management
services (including private banking, investment and insurance) to personal customers. Commercial Banking manages middle market and
smaller corporate relationships and specialises in trade-related financial services. Corporate Banking handles relationships with large
corporate and institutional customers. Treasury engages in balance sheet management and proprietary trading. Treasury also manages
the funding and liquidity positions of the Group and other market risk positions arising from banking activities. “Other” mainly represents
management of shareholders’ funds and investments in premises, investment properties and equity shares.
(a) Segment resultFor the purpose of segmental analysis, the allocation of revenue reflects the benefits of capital and other funding resources allocated to
the customer groups by way of internal capital allocation and fund transfer-pricing mechanisms. Cost allocation is based on the direct
costs incurred by the respective customer groups and apportionment of management overheads. Rental charges at market rates for
usage of premises are reflected in other operating income for the “Other” customer group and total operating expenses for the respective
customer groups.
ANNUAL REPORT 2010 135

NOTES TO THE FINANCIAL STATEMENTS
27. SEGMENTAL ANALYSIS (continued)
(a) Segment result (continued)
PersonalFinancialServices
CommercialBanking
CorporateBanking Treasury Other
Totalreportablesegments
Inter-segment
elimination Total
2010
Net interest income 8,485 2,709 1,440 1,403 263 14,300 – 14,300
Net fee income/(expense) 3,423 1,209 188 (29) 106 4,897 – 4,897
Trading income/(loss) 630 334 11 1,162 (78) 2,059 – 2,059
Net income/(loss) from financial instruments designated at fair value 297 – – (1) (14) 282 – 282
Dividend income – 5 – – 9 14 – 14
Net earned insurance premiums 11,059 246 2 – – 11,307 – 11,307
Other operating income 1,271 23 1 (1) 712 2,006 (448) 1,558
Total operating income 25,165 4,526 1,642 2,534 998 34,865 (448) 34,417
Net insurance claims incurred and movement in policyholders’ liabilities (12,436) (152) 1 – – (12,587) – (12,587)
Net operating income before loan impairment charges and other credit risk provisions 12,729 4,374 1,643 2,534 998 22,278 (448) 21,830
Loan impairment charges and other credit risk provisions (209) (178) (3) – – (390) – (390)
Net operating income 12,520 4,196 1,640 2,534 998 21,888 (448) 21,440
Total operating expenses* (4,864) (1,703) (379) (327) (530) (7,803) 448 (7,355)
Operating profit 7,656 2,493 1,261 2,207 468 14,085 – 14,085
Gains less losses from financial investments and fixed assets – – 5 95 12 112 – 112
Net surplus on property revaluation – – – – 487 487 – 487
Share of profits from associates 216 1,255 – 1,059 131 2,661 – 2,661
Profit before tax 7,872 3,748 1,266 3,361 1,098 17,345 – 17,345
Share of profit before tax 45.4% 21.6% 7.3% 19.4% 6.3% 100.0% – 100.0%
Operating profit excluding loan impairment charges and other credit risk provisions 7,865 2,671 1,264 2,207 468 14,475 – 14,475
* Depreciation/amortisation included in total operating expenses (175) (34) (5) (4) (503) (721) – (721)
Total assets 264,827 180,013 130,148 304,898 37,025 916,911 – 916,911
Total liabilities 581,118 141,518 50,862 39,268 34,133 846,899 – 846,899
Interest in associates 1,384 6,197 – 5,626 2,459 15,666 – 15,666
Non-current assets incurred during the year 128 39 5 4 739 915 – 915
HANG SENG BANK136

27. SEGMENTAL ANALYSIS (continued)
(a) Segment result (continued)
PersonalFinancialServices
CommercialBanking
CorporateBanking Treasury Other
Totalreportablesegments
Inter-segment
elimination Total
2009 (restated)
Net interest income 8,195 2,011 1,158 2,162 497 14,023 – 14,023
Net fee income/(expense) 3,000 1,114 145 (35) 97 4,321 – 4,321
Trading income/(loss) 662 245 8 1,054 (46) 1,923 – 1,923
Net (loss)/income from financial instruments designated at fair value (54) – – 5 (26) (75) – (75)
Dividend income 2 6 – – 8 16 – 16
Net earned insurance premiums 11,293 225 1 – – 11,519 – 11,519
Other operating income 898 29 1 – 632 1,560 (471) 1,089
Total operating income 23,996 3,630 1,313 3,186 1,162 33,287 (471) 32,816
Net insurance claims incurred and movement in policyholders’ liabilities (11,868) (134) (2) – – (12,004) – (12,004)
Net operating income before loan impairment charges and other credit risk provisions 12,128 3,496 1,311 3,186 1,162 21,283 (471) 20,812
Loan impairment charges and other credit risk provisions (454) (278) (78) (2) – (812) – (812)
Net operating income 11,674 3,218 1,233 3,184 1,162 20,471 (471) 20,000
Total operating expenses* (4,671) (1,507) (332) (268) (479) (7,257) 471 (6,786)
Operating profit 7,003 1,711 901 2,916 683 13,214 – 13,214
Gains less losses from financial investments and fixed assets 96 53 14 (152) 175 186 – 186
Net surplus on property revaluation – – – – 252 252 – 252
Share of profits from associates 159 873 – 629 87 1,748 – 1,748
Profit before tax 7,258 2,637 915 3,393 1,197 15,400 – 15,400
Share of profit before tax 47.1% 17.1% 5.9% 22.0% 7.9% 100.0% – 100.0%
Operating profit excluding loan impairment charges and other credit risk provisions 7,457 1,989 979 2,918 683 14,026 – 14,026
* Depreciation/amortisation included in total operating expenses (173) (31) (7) (4) (460) (675) – (675)
Total assets 234,723 96,490 88,135 377,561 33,759 830,668 – 830,668
Total liabilities 554,357 123,996 37,477 21,503 31,187 768,520 – 768,520
Interest in associates 847 4,284 – 2,707 2,388 10,226 – 10,226
Non-current assets incurred during the year 181 34 5 – 92 312 – 312
ANNUAL REPORT 2010 137

NOTES TO THE FINANCIAL STATEMENTS
27. SEGMENTAL ANALYSIS (continued)
(b) Geographic informationThe geographical regions in this analysis are classified by the location of the principal operations of the subsidiary companies or, in the
case of the Bank itself, by the location of the branches responsible for reporting the results or advancing the funds.
2010 2009(restated)
% %
Total operating income
– Hong Kong 32,124 93 30,923 94
– Americas 1,047 3 885 3
– Mainland and others 1,246 4 1,008 3
34,417 100 32,816 100
Profit before tax
– Hong Kong 13,722 79 12,825 83
– Americas 996 6 799 5
– Mainland and others 2,627 15 1,776 12
17,345 100 15,400 100
Total assets
– Hong Kong 752,206 82 710,167 85
– Americas 68,216 7 63,808 8
– Mainland and others 96,489 11 56,693 7
916,911 100 830,668 100
Total liabilities
– Hong Kong 786,304 93 734,618 96
– Americas 1,187 – 1,109 –
– Mainland and others 59,408 7 32,793 4
846,899 100 768,520 100
Interest in associates
– Hong Kong 989 6 916 9
– Americas – – – –
– Mainland and others 14,677 94 9,310 91
15,666 100 10,226 100
Non-current assets*
– Hong Kong 22,262 96 19,183 98
– Americas – – – –
– Mainland and others 944 4 317 2
23,206 100 19,500 100
Contingent liabilities and commitments
– Hong Kong 223,659 83 198,996 92
– Americas – – – –
– Mainland and others 44,589 17 18,038 8
268,248 100 217,034 100
* Non-current assets consist of properties, plant and equipment, goodwill and other intangible assets.
HANG SENG BANK138

28. ANALYSIS OF ASSETS AND LIABILITIES BY REMAINING MATuRITYThe maturity analysis is based on the remaining contractual maturity at the balance sheet date, with the exception of the trading portfolio
that may be sold before maturity and is accordingly recorded as “Trading”.
Group
Repayableon
demand
One monthor lessbut not
on demand
Over onemonth but
within threemonths
Over threemonths
but withinone year
Overone year
but withinfive years
Over fiveyears Trading
Nocontractual
maturity Total
2010
Assets
Cash and balances with banks and other financial institutions 44,411 – – – – – – – 44,411
Placings with and advances to banks and other financial institutions 4,730 51,706 48,475 5,185 – 468 – – 110,564
Trading assets – – – – – – 26,055 – 26,055
Financial assets designated at fair value – 50 7 384 3,951 48 – 2,674 7,114
Derivative financial instruments – 20 74 113 288 16 5,082 – 5,593
Advances to customers 10,198 65,179 34,733 71,444 151,430 139,653 – – 472,637
Financial investments:
– available-for-sale investments – 8,957 12,112 56,453 63,465 1,216 – 855 143,058
– held-to-maturity debt securities – 226 521 2,936 21,101 31,517 – – 56,301
Interest in associates – – – – – – – 15,666 15,666
Investment properties – – – – – – – 3,251 3,251
Premises, plant and equipment – – – – – – – 14,561 14,561
Intangible assets – – – – – – – 5,394 5,394
Other assets 4,980 2,765 2,390 1,708 74 18 – 371 12,306
Deferred tax assets – – – – – – – – –
64,319 128,903 98,312 138,223 240,309 172,936 31,137 42,772 916,911
Liabilities
Current, savings and other deposit accounts 536,363 78,218 37,862 29,611 1,574 – – – 683,628
Deposits from banks 6,387 7,688 1,394 – 117 – – – 15,586
Trading liabilities – – – – – – 42,581 – 42,581
Financial liabilities designated at fair value 2 – – – – 455 – – 457
Derivative financial instruments – – – 99 819 56 3,709 – 4,683
Certificates of deposit and other debt securities in issue:
– certificates of deposit in issue – 96 447 112 2,440 – – – 3,095
Other liabilities 6,954 3,293 2,597 1,598 97 25 – 2,454 17,018
Liabilities to customers under insurance contracts – – – – – – – 64,425 64,425
Current tax liabilities – – – 344 – – – – 344
Deferred tax liabilities – – – – – – – 3,234 3,234
Subordinated liabilities – – – 3,495 2,328 6,025 – – 11,848
549,706 89,295 42,300 35,259 7,375 6,561 46,290 70,113 846,899
of which:
Certificates of deposit included in:
– trading assets – – – – – – 18 – 18
– financial assets designated at fair value – – – – – – – – –
– available-for-sale investments – 120 700 1,813 1,246 – – 43 3,922
– held-to-maturity debt securities – 20 79 259 861 1,572 – – 2,791
– 140 779 2,072 2,107 1,572 18 43 6,731
Debt securities included in:
– trading assets – – – – – – 25,305 – 25,305
– financial assets designated at fair value – 50 7 384 3,951 48 – – 4,440
– available-for-sale investments – 8,837 11,412 54,640 62,219 1,216 – 486 138,810
– held-to-maturity debt securities – 206 442 2,677 20,240 29,945 – – 53,510
– 9,093 11,861 57,701 86,410 31,209 25,305 486 222,065
Certificates of deposit in issue included in:
– trading liabilities – – – – – – 26 – 26
– financial liabilities designated at fair value – – – – – – – – –
– issue at amortised cost – 96 447 112 2,440 – – – 3,095
– 96 447 112 2,440 – 26 – 3,121
ANNUAL REPORT 2010 139

NOTES TO THE FINANCIAL STATEMENTS
28. ANALYSIS OF ASSETS AND LIABILITIES BY REMAINING MATuRITY (continued)
Group
Repayableon
demand
One monthor lessbut not
on demand
Over onemonth but
within threemonths
Over threemonths
but withinone year
Overone year
but withinfive years
Over fiveyears Trading
Nocontractual
maturity Total
2009 (restated)
Assets
Cash and balances with banks and other financial institutions 22,086 – – – – – – – 22,086
Placings with and advances to banks and other financial institutions 4,352 72,226 25,557 2,416 – – – – 104,551
Trading assets – – – – – – 66,597 – 66,597
Financial assets designated at fair value – – 20 646 4,201 58 – 525 5,450
Derivative financial instruments – 7 34 232 118 – 4,659 – 5,050
Advances to customers 9,254 22,927 25,005 51,673 121,394 114,368 – – 344,621
Financial investments:
– available-for-sale investments – 18,050 16,426 48,560 108,360 628 – 809 192,833
– held-to-maturity debt securities – 31 282 1,395 21,538 25,423 – – 48,669
Interest in associates – – – – – – – 10,226 10,226
Investment properties – – – – – – – 2,872 2,872
Premises, plant and equipment – – – – – – – 12,414 12,414
Intangible assets – – – – – – – 4,214 4,214
Other assets 4,558 2,682 1,838 1,511 126 14 – 340 11,069
Deferred tax assets – – – – – – – 16 16
40,250 115,923 69,162 106,433 255,737 140,491 71,256 31,416 830,668
Liabilities
Current, savings and other deposit accounts 494,026 81,129 38,108 22,427 679 – – – 636,369
Deposits from banks 2,964 1,737 28 25 116 – – – 4,870
Trading liabilities – – – – – – 38,391 – 38,391
Financial liabilities designated at fair value 3 – – 1,000 – – – 453 1,456
Derivative financial instruments – – 6 21 630 13 3,581 – 4,251
Certificates of deposit and other debt securities in issue:
– certificates of deposit in issue – 159 171 1,177 319 – – – 1,826
Other liabilities 6,044 3,158 1,955 1,452 150 116 – 2,410 15,285
Liabilities to customers under insurance contracts – – – – – – – 54,240 54,240
Current tax liabilities – – – 52 – – – – 52
Deferred tax liabilities – – – – – – – 2,460 2,460
Subordinated liabilities – – – 3,516 5,804 – – – 9,320
503,037 86,183 40,268 29,670 7,698 129 41,972 59,563 768,520
of which:
Certificates of deposit included in:
– trading assets – – – – – – – – –
– financial assets designated at fair value – – – 130 – – – (1) 129
– available-for-sale investments – – 1,493 2,061 2,026 116 – 38 5,734
– held-to-maturity debt securities – – 23 161 941 806 – – 1,931
– – 1,516 2,352 2,967 922 – 37 7,794
Debt securities included in:
– trading assets – – – – – – 66,590 – 66,590
– financial assets designated at fair value – – 20 516 4,201 58 – 3 4,798
– available-for-sale investments – 18,050 14,933 46,499 106,334 512 – 424 186,752
– held-to-maturity debt securities – 31 259 1,234 20,597 24,617 – – 46,738
– 18,081 15,212 48,249 131,132 25,187 66,590 427 304,878
Certificates of deposit in issue included in:
– trading liabilities – – – – – – 478 – 478
– financial liabilities designated at fair value – – – – – – – – –
– issue at amortised cost – 159 171 1,177 319 – – – 1,826
– 159 171 1,177 319 – 478 – 2,304
HANG SENG BANK140

28. ANALYSIS OF ASSETS AND LIABILITIES BY REMAINING MATuRITY (continued)
Bank
Repayableon
demand
One monthor lessbut not
on demand
Over onemonth but
within threemonths
Over threemonths
but withinone year
Overone year
but withinfive years
Over fiveyears Trading
Nocontractual
maturity Total
2010
Assets
Cash and balances with banks and other financial institutions 41,062 – – – – – – – 41,062
Placings with and advances to banks and other financial institutions 2,120 16,999 28,875 4,137 – – – – 52,131
Trading assets – – – – – – 25,232 – 25,232
Financial assets designated at fair value – – – – 148 – – – 148
Derivative financial instruments – 19 72 92 55 16 4,772 – 5,026
Advances to customers 10,187 61,578 25,706 62,337 134,127 129,139 – – 423,074
Amounts due from subsidiaries 66,716 1,577 13,028 6,494 5,630 – – – 93,445
Financial investments:
– available-for-sale investments – 7,321 6,918 47,381 39,857 1,047 – 582 103,106
Investments in subsidiaries – – – – – – – 11,584 11,584
Interest in associates – – – – – – – 5,172 5,172
Investment properties – – – – – – – 2,100 2,100
Premises, plant and equipment – – – – – – – 10,588 10,588
Intangible assets – – – – – – – 442 442
Other assets 4,652 2,176 1,298 538 17 – – 106 8,787
Deferred tax assets – – – – – – – – –
124,737 89,670 75,897 120,979 179,834 130,202 30,004 30,574 781,897
Liabilities
Current, savings and other deposit accounts 526,103 73,458 32,405 16,145 1,033 – – – 649,144
Deposits from banks 6,386 7,688 1,394 – 117 – – – 15,585
Trading liabilities – – – – – – 30,106 – 30,106
Derivative financial instruments – – – 95 587 44 3,802 – 4,528
Certificates of deposit and other debt securities in issue:
– certificates of deposit in issue – 96 447 112 2,440 – – – 3,095
Amounts due to subsidiaries 4,222 4,337 338 2 – – – – 8,899
Other liabilities 6,704 2,912 1,739 805 26 18 – 3,230 15,434
Current tax liabilities – – – 320 – – – – 320
Deferred tax liabilities – – – – – – – 1,617 1,617
Subordinated liabilities – – – 3,495 2,328 6,025 – – 11,848
543,415 88,491 36,323 20,974 6,531 6,087 33,908 4,847 740,576
of which:
Certificates of deposit included in:
– trading assets – – – – – – 18 – 18
– financial assets designated at fair value – – – – – – – – –
– available-for-sale investments – 120 75 1,444 1,246 – – 43 2,928
– held-to-maturity debt securities – – – – – – – – –
– 120 75 1,444 1,246 – 18 43 2,946
Debt securities included in:
– trading assets – – – – – – 24,482 – 24,482
– financial assets designated at fair value – – – – 148 – – – 148
– available-for-sale investments – 7,201 6,843 45,937 38,611 1,047 – 418 100,057
– held-to-maturity debt securities – – – – – – – – –
– 7,201 6,843 45,937 38,759 1,047 24,482 418 124,687
Certificates of deposit in issue included in:
– trading liabilities – – – – – – 26 – 26
– financial liabilities designated at fair value – – – – – – – – –
– issue at amortised cost – 96 447 112 2,440 – – – 3,095
– 96 447 112 2,440 – 26 – 3,121
ANNUAL REPORT 2010 141

NOTES TO THE FINANCIAL STATEMENTS
28. ANALYSIS OF ASSETS AND LIABILITIES BY REMAINING MATuRITY (continued)
Bank
Repayableon
demand
One monthor lessbut not
on demand
Over onemonth but
within threemonths
Over threemonths
but withinone year
Overone year
but withinfive years
Over fiveyears Trading
Nocontractual
maturity Total
2009 (restated)
Assets
Cash and balances with banks and other financial institutions 18,461 – – – – – – – 18,461
Placings with and advances to banks and other financial institutions 1,326 45,657 17,809 832 – – – – 65,624
Trading assets – – – – – – 65,288 – 65,288
Financial assets designated at fair value – – – 20 144 – – 10 174
Derivative financial instruments – 7 24 227 101 – 4,557 – 4,916
Advances to customers 9,248 20,461 20,035 42,646 105,426 101,363 – – 299,179
Amounts due from subsidiaries 61,771 1,783 18,373 3,449 1,984 – – – 87,360
Financial investments:
– available-for-sale investments – 15,619 11,365 39,353 89,143 629 – 606 156,715
Investments in subsidiaries – – – – – – – 11,584 11,584
Interest in associates – – – – – – – 2,546 2,546
Investment properties – – – – – – – 1,883 1,883
Premises, plant and equipment – – – – – – – 9,434 9,434
Intangible assets – – – – – – – 399 399
Other assets 4,464 2,210 1,013 389 74 – – 86 8,236
Deferred tax assets – – – – – – – 2 2
95,270 85,737 68,619 86,916 196,872 101,992 69,845 26,550 731,801
Liabilities
Current, savings and other deposit accounts 485,929 78,600 33,958 13,177 350 – – – 612,014
Deposits from banks 2,963 1,337 28 25 116 – – – 4,469
Trading liabilities – – – – – – 35,071 – 35,071
Financial liabilities designated at fair value – – – 1,000 – – – 3 1,003
Derivative financial instruments – – 6 21 568 13 3,572 – 4,180
Certificates of deposit and other debt securities in issue:
– certificates of deposit in issue – 159 171 1,177 319 – – – 1,826
Amounts due to subsidiaries 4,749 4,974 237 – – – – – 9,960
Other liabilities 5,834 3,046 1,431 708 82 17 – 3,215 14,333
Current tax liabilities – – – 10 – – – – 10
Deferred tax liabilities – – – – – – – 1,345 1,345
Subordinated liabilities – – – 3,516 5,804 – – – 9,320
499,475 88,116 35,831 19,634 7,239 30 38,643 4,563 693,531
of which:
Certificates of deposit included in:
– trading assets – – – – – – – – –
– financial assets designated at fair value – – – – – – – – –
– available-for-sale investments – – 621 1,194 1,158 116 – 37 3,126
– held-to-maturity debt securities – – – – – – – – –
– – 621 1,194 1,158 116 – 37 3,126
Debt securities included in:
– trading assets – – – – – – 65,281 – 65,281
– financial assets designated at fair value – – – 20 144 – – 10 174
– available-for-sale investments – 15,619 10,744 38,159 87,985 513 – 422 153,442
– held-to-maturity debt securities – – – – – – – – –
– 15,619 10,744 38,179 88,129 513 65,281 432 218,897
Certificates of deposit in issue included in:
– trading liabilities – – – – – – 478 – 478
– financial liabilities designated at fair value – – – – – – – – –
– issue at amortised cost – 159 171 1,177 319 – – – 1,826
– 159 171 1,177 319 – 478 – 2,304
HANG SENG BANK142

29. ACCOuNTING CLASSIFICATIONSThe tables below set out the Group’s classification of financial assets and liabilities:
Group
TradingDesignatedat fair value
Available-for-sale/hedging
Held-to-maturity
Loans andreceivables
Otheramortised
cost Total
2010
Cash and balances with banks and other financial institutions – – – – – 44,411 44,411
Placings with and advances to banks and other financial institutions – – – – 110,564 – 110,564
Derivative financial instruments 5,082 – 511 – – – 5,593
Advances to customers – – – – 472,637 – 472,637
Investment securities 25,331 7,114 143,058 56,301 – – 231,804
Acceptances and endorsements – – – – – 3,751 3,751
Other financial assets 724 – – – – 7,881 8,605
Total financial assets 31,137 7,114 143,569 56,301 583,201 56,043 877,365
Non-financial assets 39,546
Total assets 916,911
Current, savings and other deposit accounts 20,852 – – – – 683,628 704,480
Deposits from banks – – – – – 15,586 15,586
Derivative financial instruments 3,697 12 974 – – – 4,683
Certificates of deposit and other debt securities in issue 2,738 – – – – 3,095 5,833
Other financial liabilities 18,991 – – – – 10,716 29,707
Subordinated liabilities – – – – – 11,848 11,848
Liabilities to customers under investment contracts – 457 – – – – 457
Acceptances and endorsements – – – – – 3,751 3,751
Total financial liabilities 46,278 469 974 – – 728,624 776,345
Non-financial liabilities 70,554
Total liabilities 846,899
ANNUAL REPORT 2010 143

NOTES TO THE FINANCIAL STATEMENTS
29. ACCOuNTING CLASSIFICATIONS (continued)
Group
TradingDesignatedat fair value
Available-for-sale/hedging
Held-to-maturity
Loans andreceivables
Otheramortised
cost Total
2009 (restated)
Cash and balances with banks and other financial institutions – – – – – 22,086 22,086
Placings with and advances to banks and other financial institutions – – – – 104,551 – 104,551
Derivative financial instruments 4,641 18 391 – – – 5,050
Advances to customers – – – – 344,621 – 344,621
Investment securities 66,596 5,450 192,833 48,669 – – 313,548
Acceptances and endorsements – – – – – 3,584 3,584
Other financial assets 1 – – – – 7,142 7,143
Total financial assets 71,238 5,468 193,224 48,669 449,172 32,812 800,583
Non-financial assets 30,085
Total assets 830,668
Current, savings and other deposit accounts 22,212 – – – – 636,369 658,581
Deposits from banks – – – – – 4,870 4,870
Derivative financial instruments 3,568 13 670 – – – 4,251
Certificates of deposit and other debt securities in issue 3,247 – – – – 1,826 5,073
Other financial liabilities 12,932 – – – – 9,242 22,174
Subordinated liabilities – 1,003 – – – 9,320 10,323
Liabilities to customers under investment contracts – 453 – – – – 453
Acceptances and endorsements – – – – – 3,584 3,584
Total financial liabilities 41,959 1,469 670 – – 665,211 709,309
Non-financial liabilities 59,211
Total liabilities 768,520
HANG SENG BANK144

29. ACCOuNTING CLASSIFICATIONS (continued)
Bank
TradingDesignatedat fair value
Available-for-sale/hedging
Held-to-maturity
Loans andreceivables
Otheramortised
cost Total
2010
Cash and balances with banks and other financial institutions – – – – – 41,062 41,062
Placings with and advances to banks and other financial institutions – – – – 52,131 – 52,131
Derivative financial instruments 4,772 – 254 – – – 5,026
Advances to customers – – – – 423,074 – 423,074
Investment securities 24,508 148 103,106 – – – 127,762
Amounts due from subsidiaries – – – – – 93,445 93,445
Acceptances and endorsements – – – – – 2,363 2,363
Other financial assets 724 – – – – 6,026 6,750
Total financial assets 30,004 148 103,360 – 475,205 142,896 751,613
Non-financial assets 30,284
Total assets 781,897
Current, savings and other deposit accounts 8,377 – – – – 649,144 657,521
Deposits from banks – – – – – 15,585 15,585
Derivative financial instruments 3,793 9 726 – – – 4,528
Certificates of deposit and other debt securities in issue 2,738 – – – – 3,095 5,833
Amounts due to subsidiaries – – – – – 8,899 8,899
Other financial liabilities 18,991 – – – – 10,672 29,663
Subordinated liabilities – – – – – 11,848 11,848
Acceptances and endorsements – – – – – 2,363 2,363
Total financial liabilities 33,899 9 726 – – 701,606 736,240
Non-financial liabilities 4,336
Total liabilities 740,576
ANNUAL REPORT 2010 145

NOTES TO THE FINANCIAL STATEMENTS
29. ACCOuNTING CLASSIFICATIONS (continued)
Bank
TradingDesignatedat fair value
Available-for-sale/hedging
Held-to-maturity
Loans andreceivables
Otheramortised
cost Total
2009 (restated)
Cash and balances with banks and other financial institutions – – – – – 18,461 18,461
Placings with and advances to banks and other financial institutions – – – – 65,624 – 65,624
Derivative financial instruments 4,540 17 359 – – – 4,916
Advances to customers – – – – 299,179 – 299,179
Investment securities 65,287 174 156,715 – – – 222,176
Amounts due from subsidiaries – – – – – 87,360 87,360
Acceptances and endorsements – – – – – 2,435 2,435
Other financial assets 1 – – – – 5,606 5,607
Total financial assets 69,828 191 157,074 – 364,803 113,862 705,758
Non-financial assets 26,043
Total assets 731,801
Current, savings and other deposit accounts 18,892 – – – – 612,014 630,906
Deposits from banks – – – – – 4,469 4,469
Derivative financial instruments 3,559 13 608 – – – 4,180
Certificates of deposit and other debt securities in issue 3,247 – – – – 1,826 5,073
Amounts due to subsidiaries – – – – – 9,960 9,960
Other financial liabilities 12,932 – – – – 9,525 22,457
Subordinated liabilities – 1,003 – – – 9,320 10,323
Acceptances and endorsements – – – – – 2,435 2,435
Total financial liabilities 38,630 1,016 608 – – 649,549 689,803
Non-financial liabilities 3,728
Total liabilities 693,531
HANG SENG BANK146

30. CASH AND BALANCES WITH BANKS AND OTHER FINANCIAL INSTITuTIONS
Group Bank
2010 2009 2010 2009
Cash in hand 6,101 4,299 5,857 4,079
Balances with central banks 6,591 3,397 4,250 924
Balances with banks and other financial institutions 31,719 14,390 30,955 13,458
44,411 22,086 41,062 18,461
31. PLACINGS WITH AND ADVANCES TO BANKS AND OTHER FINANCIAL INSTITuTIONSGroup Bank
2010 2009 2010 2009
Placings with and advances to banks and other financial institutions maturing within one month 56,437 76,579 19,119 46,984
Placings with and advances to banks and other financial institutions maturing after one month but less than one year 53,659 27,972 33,012 18,640
Placings with and advances to banks and other financial institutions maturing after one year 468 – – –
110,564 104,551 52,131 65,624
There were no overdue advances, impaired advances and rescheduled advances to banks and other financial institutions at 31 December
2010 by the Group and the Bank (2009: Nil).
ANNUAL REPORT 2010 147

NOTES TO THE FINANCIAL STATEMENTS
32. TRADING ASSETSGroup Bank
2010 2009 2010 2009
Treasury bills 20,204 62,028 20,204 62,028
Certificates of deposit 18 – 18 –
Other debt securities 5,101 4,562 4,278 3,253
Debt securities 25,323 66,590 24,500 65,281
Equity shares 8 6 8 6
Total trading securities 25,331 66,596 24,508 65,287
Other* 724 1 724 1
Total trading assets 26,055 66,597 25,232 65,288
Debt securities:
– listed in Hong Kong 3,876 2,712 3,876 2,712
– listed outside Hong Kong 170 157 170 157
4,046 2,869 4,046 2,869
– unlisted 21,277 63,721 20,454 62,412
25,323 66,590 24,500 65,281
Equity shares:
– listed in Hong Kong 8 6 8 6
– unlisted – – – –
8 6 8 6
Total trading securities 25,331 66,596 24,508 65,287
Debt securities
Issued by public bodies:
– central governments and central banks 24,905 65,817 24,129 64,508
– other public sector entities 101 369 101 369
25,006 66,186 24,230 64,877
Issued by other bodies:
– banks and other financial institutions 149 292 102 292
– corporate entities 168 112 168 112
317 404 270 404
25,323 66,590 24,500 65,281
Equity shares
Issued by corporate entities 8 6 8 6
Total trading securities 25,331 66,596 24,508 65,287
* This represents amount receivable from counterparties on trading transactions not yet settled.
HANG SENG BANK148

33. FINANCIAL ASSETS DESIGNATED AT FAIR VALuEGroup Bank
2010 2009 2010 2009
Certificates of deposit – 129 – –
Other debt securities 4,440 4,798 148 174
Debt securities 4,440 4,927 148 174
Equity shares 583 21 – –
Investment funds 2,091 502 – –
7,114 5,450 148 174
Debt securities:
– listed in Hong Kong 11 3 – –
– listed outside Hong Kong 184 194 148 154
195 197 148 154
– unlisted 4,245 4,730 – 20
4,440 4,927 148 174
Equity shares:
– listed in Hong Kong 583 21 – –
Investment funds:
– listed in Hong Kong 23 – – –
– listed outside Hong Kong 65 69 – –
88 69 – –
– unlisted 2,003 433 – –
2,091 502 – –
7,114 5,450 148 174
Debt securities
Issued by public bodies:
– central governments and central banks 148 154 148 154
– other public sector entities 105 168 – –
253 322 148 154
Issued by other bodies:
– banks and other financial institutions 4,113 4,464 – –
– corporate entities 74 141 – 20
4,187 4,605 – 20
4,440 4,927 148 174
Equity shares
Issued by banks and other financial institutions 69 – – –
Issued by corporate entities 514 21 – –
583 21 – –
Investment funds
Issued by corporate entities 2,091 502 – –
7,114 5,450 148 174
ANNUAL REPORT 2010 149

NOTES TO THE FINANCIAL STATEMENTS
34. DERIVATIVE FINANCIAL INSTRuMENTSDerivatives are financial contracts whose values and characteristics are derived from underlying assets, exchange and interest rates, and
indices. Derivative instruments are subject to both credit risk and market risk. The credit risk relating to a derivative contract is principally
the replacement cost of the contract when it has a positive mark-to-market value and the estimated potential future change in value
over the residual maturity of the contract. The nominal value of the contracts does not represent the amount of the Group's exposure
to credit risk. All activities relating to derivatives are subject to the same credit approval and monitoring procedures used for other credit
transactions. Market risk from derivative positions is controlled individually and in combination with on-balance sheet market risk positions
within the Group’s market risk limits regime as described in note 61(c).
The Group transacts derivatives for three primary purposes: to create risk management solutions for clients, for proprietary trading
purposes, and to manage and hedge its own risks. For accounting purposes, derivative financial instruments are held for trading, or
financial instruments designated at fair value, or designated as either fair value hedge or cash flow hedge. The Group primarily traded
over-the-counter derivatives and also participated in exchange traded derivatives.
Trading derivativesMost of the Group’s trading derivative transactions relate to sales and trading activities. Sales activities include the structuring and
marketing of derivative products to customers to enable them to take, transfer, modify or reduce current or expected risks. Trading
activities in derivatives are entered into principally for the purpose of generating profits from short-term fluctuations in price or margin.
Positions may be traded actively or be held over a period of time to benefit from expected changes in currency rates, interest rates, equity
prices or other market parameters.
Trading derivatives also include non-qualifying hedging derivatives, ineffective hedging derivatives and the components of hedging
derivatives that are excluded from assessing hedge effectiveness. Non-qualifying hedging derivatives are entered into for risk management
purposes but do not meet the criteria for hedge accounting. These include derivatives managed in conjunction with financial instruments
designated at fair value.
Hedging instrumentsThe Group uses derivatives (principally interest rate swaps) for hedging purposes in the management of its own asset and liability portfolios
and structural positions. This enables the Group to optimise the cost of accessing debt capital markets, and to mitigate the market risk
which would otherwise arise from structural imbalances in the maturity and other profiles of its assets and liabilities.
(a) Fair value hedgeThe Group’s fair value hedge principally consists of interest rate swaps that are used to protect against changes in the fair value of
fixed-rate long-term financial instruments due to movements in market interest rates.
HANG SENG BANK150

34. DERIVATIVE FINANCIAL INSTRuMENTS (continued)
(b) Cash flow hedgeThe Group is exposed to variability in future interest cash flows on non-trading assets and liabilities which bear interest at variable rates or
which are expected to be re-funded or reinvested in the future. The amounts and timing of future cash flows, representing both principal
and interest flows, are projected for each portfolio for financial assets and liabilities on the basis of their contractual terms and other
relevant factors, including estimates of prepayments and defaults. The aggregate principal balances and interest cash flows across all
portfolios over time form the basis for identifying gains and losses on the effective portions of derivatives designated as cash flow hedge
of forecast transactions.
Gains and losses are initially recognised in equity, in the cash flow hedging reserve, and are transferred to the income statement when
the forecast cash flows affect the income statement. During the year to 31 December 2010, the amount of cash flow hedging reserve
transferred to the income statement comprised HK$414 million (2009: HK$848 million) included in net interest income and nil balance
included in net trading income (2009: HK$16 million) .
There was insignificant ineffectiveness recognised in the Group's income statement arising from cash flow hedge during the years of 2010
and 2009. During the years of 2010 and 2009, there were forecast transactions for which hedge accounting had previously been used
but which were no longer expected to occur. In 2010, there was no gain recognised due to termination of such forecast transactions
(2009: HK$16 million).
The schedules of forecast principal balances on which the expected interest cash flows associated with derivatives that are cash flow
hedge were as follows:
Group
Threemonthsor less
Over threemonths
but withinone year
Overone year
but withinfive years
At 31 December 2010
Cash inflows from assets 78,389 40,443 21,869
Cash outflows from liabilities – – –
Net cash inflows 78,389 40,443 21,869
At 31 December 2009
Cash inflows from assets 45,526 39,564 20,587
Cash outflows from liabilities – – –
Net cash inflows 45,526 39,564 20,587
ANNUAL REPORT 2010 151

NOTES TO THE FINANCIAL STATEMENTS
34. DERIVATIVE FINANCIAL INSTRuMENTS (continued)
(c) The following table shows the nominal contract amounts and marked-to-market value of assets and liabilities by each class
of derivatives.
Group
2010 2009
Contractamounts
Derivativeassets
Derivativeliabilities
Contractamounts
Derivativeassets
Derivativeliabilities
Derivatives held for trading
Exchange rate contracts:
– spot and forward foreign exchange 495,913 2,471 1,802 382,260 2,289 608
– currency swaps 17,366 190 139 20,837 261 132
– currency options purchased 41,183 59 – 30,561 83 –
– currency options written 46,657 – 87 40,105 – 197
– other exchange rate contracts 101 1 3 226 3 1
601,220 2,721 2,031 473,989 2,636 938
Interest rate contracts:
– interest rate swaps 234,425 1,748 1,557 162,662 1,552 1,622
– interest rate options purchased 25 – – 143 – –
– interest rate options written 25 – – 142 – –
– other interest rate contracts 1,555 – – 407 – 1
236,030 1,748 1,557 163,354 1,552 1,623
Equity and other contracts:
– equity swaps 5,980 32 99 5,706 29 994
– equity options purchased 5,503 168 – 1,705 91 –
– equity options written 1,731 – 8 1,317 – 13
– other equity contracts 8 – – 6 – –
– spot and forward contracts and others 3,669 413 2 2,651 333 –
16,891 613 109 11,385 453 1,007
Total derivatives held for trading 854,141 5,082 3,697 648,728 4,641 3,568
Derivatives embedded in financial assets designated at fair value
Exchange rate contracts:
– spot and forward foreign exchange 769 – 3 89 1 –
Interest rate contracts:
– interest rate swaps 140 – 9 1,160 17 13
909 – 12 1,249 18 13
Cash flow hedge derivatives
Interest rate contracts:
– interest rate swaps 78,389 256 19 45,526 366 13
Fair value hedge derivatives
Interest rate contracts:
– interest rate swaps 27,122 255 955 21,028 25 657
Total derivatives 960,561 5,593 4,683 716,531 5,050 4,251
HANG SENG BANK152

34. DERIVATIVE FINANCIAL INSTRuMENTS (continued)
Bank
2010 2009
Contractamounts
Derivativeassets
Derivativeliabilities
Contractamounts
Derivativeassets
Derivativeliabilities
Derivatives held for trading
Exchange rate contracts:
– spot and forward foreign exchange 496,363 2,379 1,880 381,799 2,275 602
– currency swaps 17,366 190 139 20,837 260 132
– currency options purchased 41,220 60 – 30,606 83 –
– currency options written 46,694 – 127 40,105 – 199
– other exchange rate contracts 101 1 3 226 3 1
601,744 2,630 2,149 473,573 2,621 934
Interest rate contracts:
– interest rate swaps 227,205 1,662 1,509 166,030 1,543 1,612
– interest rate options purchased 25 – – 143 – –
– interest rate options written 25 – – 142 – –
– other interest rate contracts 1,554 – – 407 – 1
228,809 1,662 1,509 166,722 1,543 1,613
Equity and other contracts:
– equity swaps 7,997 59 125 7,366 29 998
– equity options purchased 1,732 8 – 1,296 13 –
– equity options written 1,731 – 8 1,317 – 13
– other equity contracts 8 – – 6 – –
– spot and forward contracts and others 3,695 413 2 2,808 334 1
15,163 480 135 12,793 376 1,012
Total derivatives held for trading 845,716 4,772 3,793 653,088 4,540 3,559
Derivatives embedded in financial assets designated at fair value
Interest rate contracts:
– interest rate swaps 140 – 9 1,160 17 13
Cash flow hedge derivatives
Interest rate contracts:
– interest rate swaps 76,495 232 19 43,898 351 13
Fair value hedge derivatives
Interest rate contracts:
– interest rate swaps 14,976 22 707 16,634 8 595
Total derivatives 937,327 5,026 4,528 714,780 4,916 4,180
The above derivative assets and liabilities, being the positive or negative marked-to-market value of the respective derivative contracts,
represent gross replacement costs, as none of these contracts are subject to any bilateral netting arrangements.
ANNUAL REPORT 2010 153

NOTES TO THE FINANCIAL STATEMENTS
34. DERIVATIVE FINANCIAL INSTRuMENTS (continued)
(d) Contract amounts, credit equivalent amounts and risk-weighted amountsThe table below gives the contract amounts, credit equivalent amounts and risk-weighted amounts of derivatives. The information
is consistent with that in the “Capital Adequacy Ratio” return submitted to the Hong Kong Monetary Authority by the Group. The return
is prepared on a consolidated basis as specified by the Hong Kong Monetary Authority under the requirement of section 98(2) of the
Banking Ordinance.
Derivatives arise from futures, forward, swap and option transactions undertaken by the Group in the foreign exchange, interest rate,
equity, credit and commodity markets. The contract amounts of these instruments indicate the volume of transactions outstanding at the
end of the balance sheet date, they do not represent amounts at risk.
The credit equivalent amounts are calculated for the purposes of deriving the risk-weighted amounts. These are assessed in accordance
with the Banking (Capital) Rules (“the Capital Rules”) and depend on the status of the counterparty and maturity characteristics of
the instrument.
The netting adjustments represent amounts where the Group has in place legally enforceable rights of offset with individual counterparties
to offset the gross amount of positive marked-to-market assets with any negative marked-to-market liabilities with the same customer.
These offsets are recognised by the Hong Kong Monetary Authority in the calculation of risk assets for the capital adequacy ratio.
The Group uses the approaches approved by the Hong Kong Monetary Authority to calculate the capital adequacy ratio in accordance
with the Capital Rules. The risk-weighted assets at 31 December 2010 and 2009 were calculated based on the advanced internal
ratings-based approach.
Group Bank
Contractamounts
Creditequivalent
amounts
Risk-weightedamounts
Contractamounts
Creditequivalent
amounts
Risk-weightedamounts
2010
Exchange rate contracts:
– spot and forward foreign exchange 431,732 2,738 1,417 428,192 2,599 1,337
– currency swaps 17,366 433 70 17,366 433 70
– currency options purchased 41,755 820 642 41,762 820 642
– other exchange rate contracts 101 5 – 101 5 –
490,954 3,996 2,129 487,421 3,857 2,049
Interest rate contracts:
– interest rate swaps 340,076 2,522 602 318,816 2,084 472
– interest rate options purchased 25 – – 25 – –
– other interest rate contracts – – – – – –
340,101 2,522 602 318,841 2,084 472
Equity and other contracts:
– equity swaps 5,980 391 65 7,997 525 72
– equity options purchased 1,732 112 72 1,732 112 72
– others 17 2 – 33 4 –
7,729 505 137 9,762 641 144
HANG SENG BANK154

34. DERIVATIVE FINANCIAL INSTRuMENTS (continued)
(d) Contract amounts, credit equivalent amounts and risk-weighted amounts (continued)
Group Bank
Contractamounts
Creditequivalent
amounts
Risk-weightedamounts
Contractamounts
Creditequivalent
amounts
Risk-weightedamounts
2009
Exchange rate contracts:
– spot and forward foreign exchange 334,133 5,573 689 332,869 5,546 649
– currency swaps 20,837 1,090 250 20,837 1,090 250
– currency options purchased 30,561 548 239 30,591 549 239
– other exchange rate contracts 226 6 – 226 6 –
385,757 7,217 1,178 384,523 7,191 1,138
Interest rate contracts:
– interest rate swaps 230,376 2,640 413 221,751 2,575 396
– interest rate options purchased 143 – – 143 – –
– other interest rate contracts – – – – – –
230,519 2,640 413 221,894 2,575 396
Equity and other contracts:
– equity swaps 5,706 383 31 5,706 383 31
– equity options purchased 1,296 91 61 1,296 91 61
7,002 474 92 7,002 474 92
35. ADVANCES TO CuSTOMERS(a) Advances to customers
Group Bank
2010 2009 2010 2009
Gross advances to customers 474,473 346,586 424,506 300,842
Less: loan impairment allowances
– individually assessed (1,118) (1,151) (844) (957)
– collectively assessed (718) (814) (588) (706)
472,637 344,621 423,074 299,179
Total loan impairment allowances as a percentage of gross advances to customers are as follows:
Group Bank
2010 2009 2010 2009
% % % %
Loan impairment allowances:
– individually assessed 0.24 0.33 0.20 0.32
– collectively assessed 0.15 0.23 0.14 0.23
Total loan impairment allowances 0.39 0.56 0.34 0.55
ANNUAL REPORT 2010 155

NOTES TO THE FINANCIAL STATEMENTS
35. ADVANCES TO CuSTOMERS (continued)
(b) Loan impairment allowances against advances to customers
Group
Individuallyassessed
Collectivelyassessed Total
2010
At 1 January 1,151 814 1,965
Amounts written off (227) (345) (572)
Recoveries of advances written off in previous years 18 44 62
New impairment allowances charged to income statement (note 16) 296 313 609
Impairment allowances released to income statement (note 16) (110) (109) (219)
Unwinding of discount of loan impairment allowances recognised as “interest income” (16) (3) (19)
Exchange 6 4 10
At 31 December 1,118 718 1,836
2009
At 1 January 1,241 802 2,043
Amounts written off (394) (526) (920)
Recoveries of advances written off in previous years 24 38 62
New impairment allowances charged to income statement (note 16) 564 540 1,104
Impairment allowances released to income statement (note 16) (254) (38) (292)
Unwinding of discount of loan impairment allowances recognised as “interest income” (30) (2) (32)
At 31 December 1,151 814 1,965
Bank
Individuallyassessed
Collectivelyassessed Total
2010
At 1 January 957 706 1,663
Amounts written off (211) (344) (555)
Recoveries of advances written off in previous years 7 44 51
New impairment allowances charged to income statement (note 16) 162 313 475
Impairment allowances released to income statement (note 16) (65) (128) (193)
Other movement – – –
Unwinding of discount of loan impairment allowances recognised as “interest income” (6) (3) (9)
At 31 December 844 588 1,432
2009
At 1 January 1,046 695 1,741
Amounts written off (349) (526) (875)
Recoveries of advances written off in previous years 9 37 46
New impairment allowances charged to income statement (note 16) 488 540 1,028
Impairment allowances released to income statement (note 16) (203) (37) (240)
Other movement (16) – (16)
Unwinding of discount of loan impairment allowances recognised as “interest income” (18) (3) (21)
At 31 December 957 706 1,663
HANG SENG BANK156

35. ADVANCES TO CuSTOMERS (continued)
(c) Impaired advances and allowances
Group Bank
2010 2009 2010 2009
Gross impaired advances 1,990 2,508 1,462 1,761
Individually assessed allowances (1,118) (1,151) (844) (957)
Net impaired advances 872 1,357 618 804
Individually assessed allowances as a percentage of gross impaired advances 56.2% 45.9% 57.7% 54.3%
Gross impaired advances as a percentage of gross advances to customers 0.4% 0.7% 0.3% 0.6%
Impaired advances are those advances where objective evidence exists that full repayment of principal or interest is considered unlikely.
Group Bank
2010 2009 2010 2009
Gross individually assessed impaired advances 1,886 2,434 1,358 1,687
Individually assessed allowances (1,118) (1,151) (844) (957)
768 1,283 514 730
Gross individually assessed impaired advances as a percentage of gross advances to customers 0.4% 0.7% 0.3% 0.6%
Amount of collateral which has been taken into account in respect of individually assessed impaired advances to customers 682 1,024 464 569
Collateral includes any tangible security that has a determinable fair market value and is readily marketable. This includes (but is not limited to)
cash and deposits, stocks and bonds, mortgages over properties and charges over other fixed assets such as plant and equipment. Where
collateral values are greater than gross advances, only the amount of collateral up to the gross advance was included.
ANNUAL REPORT 2010 157

NOTES TO THE FINANCIAL STATEMENTS
35. ADVANCES TO CuSTOMERS (continued)
(d) Overdue advancesAdvances to customers that are more than three months overdue and their expression as a percentage of gross advances to customers
are as follows:
Group Bank
% %
2010
Gross advances to customers which have been overdue with respect to either principal or interest for periods of:
– more than three months but not more than six months 137 – 126 –
– more than six months but not more than one year 89 – 88 –
– more than one year 1,147 0.3 904 0.3
1,373 0.3 1,118 0.3
of which:
– individually impaired allowances (994) (805)
– covered portion of overdue loans and advances 354 291
– uncovered portion of overdue loans and advances 1,019 827
– current market value held against the covered portion of overdue loans and advances 586 514
2009
Gross advances to customers which have been overdue with respect to either principal or interest for periods of:
– more than three months but not more than six months 241 0.1 204 0.1
– more than six months but not more than one year 353 0.1 333 0.1
– more than one year 864 0.2 539 0.2
1,458 0.4 1,076 0.4
of which:
– individually impaired allowances (984) (879)
– covered portion of overdue loans and advances 553 231
– uncovered portion of overdue loans and advances 905 845
– current market value held against the covered portion of overdue loans and advances 1,095 580
Advances with a specific repayment date are classified as overdue when the principal or interest is overdue and remains unpaid at
year-end. Advances repayable by regular instalments are treated as overdue when an instalment payment is overdue and remains unpaid
at year-end. Advances repayable on demand are classified as overdue either when a demand for repayment has been served on the
borrower but repayment has not been made in accordance with the demand notice, or when the advances have remained continuously
outside the approved limit advised to the borrower for more than the overdue period in question.
HANG SENG BANK158

35. ADVANCES TO CuSTOMERS (continued)
(e) Rescheduled advancesRescheduled advances and their expression as a percentage of gross advances to customers are as follows:
Group Bank
% %
2010 194 – 95 –
2009 703 0.2 423 0.1
Rescheduled advances are those that have been rescheduled or renegotiated for reasons related to the borrower’s financial difficulties.
This will normally involve the granting of concessionary terms and resetting the overdue account to non-overdue status.
Rescheduled advances to customers are stated net of any advances which have subsequently become overdue for more than three
months and which are included in “Overdue advances” (note 35(d)).
(f) Segmental analysis of advances to customers by geographical areaAdvances to customers by geographical area are classified according to the location of the counterparties after taking into account the
transfer of risk. In general, risk transfer applies when an advance is guaranteed by a party located in an area that is different from that of
the counterparty.
Group
Grossadvances to
customers
Individuallyimpaired
advances tocustomers
Overdueadvances to
customers
Individuallyassessed
allowances
Collectivelyassessed
allowances
At 31 December 2010
Hong Kong 392,836 1,452 1,112 838 545
Rest of Asia-Pacific 76,308 345 257 234 162
Others 5,329 89 4 46 11
474,473 1,886 1,373 1,118 718
At 31 December 2009
Hong Kong 308,457 1,842 1,076 915 695
Rest of Asia-Pacific 30,872 565 380 225 101
Others 7,257 27 2 11 18
346,586 2,434 1,458 1,151 814
Bank
Grossadvances to
customers
Individuallyimpaired
advances tocustomers
Overdueadvances to
customers
Individuallyassessed
allowances
Collectivelyassessed
allowances
At 31 December 2010
Hong Kong 374,776 1,308 1,094 831 528
Rest of Asia-Pacific 46,404 32 20 12 56
Others 3,326 18 4 1 4
424,506 1,358 1,118 844 588
At 31 December 2009
Hong Kong 288,474 1,588 1,029 898 682
Rest of Asia-Pacific 7,265 82 45 58 14
Others 5,103 17 2 1 10
300,842 1,687 1,076 957 706
ANNUAL REPORT 2010 159

NOTES TO THE FINANCIAL STATEMENTS
35. ADVANCES TO CuSTOMERS (continued)
(g) Gross advances to customers by industry sectorThe analysis of gross advances to customers by industry sector based on categories and definitions used by the Hong Kong Monetary
Authority is as follows:
Group
2010 2009
% of grossadvances
covered bycollateral
% of grossadvances
covered bycollateral
Gross advances to customers for use in Hong Kong
Industrial, commercial and financial sectors
– property development 41,818 34.6 23,618 36.1
– property investment 99,023 84.1 75,264 82.3
– financial concerns 3,047 32.1 2,720 33.9
– stockbrokers 165 82.1 480 42.9
– wholesale and retail trade 11,439 43.3 7,812 49.5
– manufacturing 16,988 30.7 12,080 30.4
– transport and transport equipment 7,938 69.2 6,503 83.3
– recreational activities 532 99.6 37 41.4
– information technology 1,957 0.7 1,247 2.4
– other 27,815 43.1 24,405 43.9
210,722 60.3 154,166 61.8
Individuals
– advances for the purchase of flats under the Government Home Ownership Scheme, Private Sector Participation Scheme and Tenants Purchase Scheme 14,834 100.0 14,647 99.9
– advances for the purchase of other residential properties 112,394 100.0 96,651 99.7
– credit card advances 15,735 – 13,818 –
– other 13,776 30.9 11,961 45.3
156,739 83.9 137,077 84.9
Total gross advances for use in Hong Kong 367,461 70.4 291,243 72.7
Trade finance 63,660 18.3 19,215 35.6
Gross advances for use outside Hong Kong 43,352 57.4 36,128 55.4
Gross advances to customers 474,473 62.2 346,586 68.8
HANG SENG BANK160

35. ADVANCES TO CuSTOMERS (continued)
(g) Gross advances to customers by industry sector (continued)
Bank
2010 2009
% of grossadvances
covered bycollateral
% of grossadvances
covered bycollateral
Gross advances to customers for use in Hong Kong
Industrial, commercial and financial sectors
– property development 41,818 34.6 23,618 36.1
– property investment 97,994 84.5 74,128 82.8
– financial concerns 3,047 32.1 2,720 33.9
– stockbrokers 165 82.1 480 42.9
– wholesale and retail trade 11,439 43.3 7,812 49.5
– manufacturing 16,987 30.7 12,079 30.4
– transport and transport equipment 7,102 65.9 4,841 77.6
– recreational activities 532 99.6 37 41.4
– information technology 1,957 0.7 1,247 2.4
– other 27,796 43.1 24,335 44.1
208,837 60.2 151,297 61.5
Individuals
– advances for the purchase of flats under the Government Home Ownership Scheme, Private Sector Participation Scheme and Tenants Purchase Scheme 5,695 100.0 3,446 99.6
– advances for the purchase of other residential properties 109,776 100.0 93,028 99.7
– credit card advances 15,735 – 13,818 –
– other 13,773 30.9 11,954 45.3
144,979 82.6 122,246 83.1
Total gross advances for use in Hong Kong 353,816 69.4 273,543 71.2
Trade finance 63,660 18.3 19,215 35.6
Gross advances for use outside Hong Kong 7,030 22.4 8,084 17.2
Gross advances to customers 424,506 61.0 300,842 67.4
ANNUAL REPORT 2010 161

NOTES TO THE FINANCIAL STATEMENTS
35. ADVANCES TO CuSTOMERS (continued)
(h) Net investments in finance leasesAdvances to customers include net investments in equipment leased to customers under finance leases and hire purchase contracts
having the characteristics of finance leases. The contracts usually run for an initial period of 5 to 20 years, with an option for acquiring by
the lessee the leased asset at nominal value at the end of the lease period. The total minimum lease payments receivable and their present
value at the year-end are as follows:
Group Bank
2010 2009 2010 2009
Finance leases 9 24 9 24
Hire purchase contracts 5,751 5,630 4,918 3,963
5,760 5,654 4,927 3,987
Group
Presentvalue of
minimumlease
paymentsreceivable
Interestincomerelating
to futureperiods
Totalminimum
leasepaymentsreceivable
2010
Amounts receivable:
– within one year 260 54 314
– after one year but within five years 1,026 166 1,192
– after five years 4,500 1,029 5,529
5,786 1,249 7,035
Loans impairment allowances (26)
Net investments in finance leases and hire purchase contracts 5,760
2009
Amounts receivable:
– within one year 371 93 464
– after one year but within five years 1,486 312 1,798
– after five years 3,813 614 4,427
5,670 1,019 6,689
Loans impairment allowances (16)
Net investments in finance leases and hire purchase contracts 5,654
HANG SENG BANK162

35. ADVANCES TO CuSTOMERS (continued)
(h) Net investments in finance leases (continued)
Bank
Presentvalue of
minimumlease
paymentsreceivable
Interestincomerelating
to futureperiods
Totalminimum
leasepaymentsreceivable
2010
Amounts receivable:
– within one year 189 36 225
– after one year but within five years 766 111 877
– after five years 3,994 977 4,971
4,949 1,124 6,073
Loans impairment allowances (22)
Net investments in finance leases and hire purchase contracts 4,927
2009
Amounts receivable:
– within one year 250 57 307
– after one year but within five years 1,053 196 1,249
– after five years 2,696 462 3,158
3,999 715 4,714
Loans impairment allowances (12)
Net investments in finance leases and hire purchase contracts 3,987
ANNUAL REPORT 2010 163

NOTES TO THE FINANCIAL STATEMENTS
36. FINANCIAL INVESTMENTSGroup Bank
2010 2009 2010 2009
Financial investments:
– which may be repledged or resold by counterparties 207 141 207 141
– which may not be repledged or resold or are not subject to repledge or resale by counterparties 199,152 241,361 102,899 156,574
199,359 241,502 103,106 156,715
Held-to-maturity debt securities at amortised cost 56,301 48,669 – –
Available-for-sale at fair value:
– debt securities 142,732 192,486 102,985 156,568
– equity shares 326 347 121 147
199,359 241,502 103,106 156,715
Treasury bills 18,010 53,973 17,225 49,277
Certificates of deposit 6,713 7,665 2,928 3,126
Other debt securities 174,310 179,517 82,832 104,165
Debt securities 199,033 241,155 102,985 156,568
Equity shares 326 347 121 147
199,359 241,502 103,106 156,715
There was no overdue debt securities at 31 December 2010 (31 December 2009: Nil).
(a) Held-to-maturity debt securities
Group Bank
2010 2009 2010 2009
Listed in Hong Kong 997 634 – –
Listed outside Hong Kong 9,822 5,627 – –
10,819 6,261 – –
Unlisted 45,482 42,408 – –
56,301 48,669 – –
Issued by public bodies:
– central governments and central banks 272 244 – –
– other public sector entities 7,563 7,235 – –
7,835 7,479 – –
Issued by other bodies:
– banks and other financial institutions 36,225 32,145 – –
– corporate entities 12,241 9,045 – –
48,466 41,190 – –
56,301 48,669 – –
Fair value of held-to-maturity debt securities:
– listed 11,189 6,384 – –
– unlisted 47,138 43,421 – –
58,327 49,805 – –
There was no held-to-maturity debt securities determined to be impaired at 31 December 2010 for the Group and the Bank (31 December
2009: Nil).
HANG SENG BANK164

36. FINANCIAL INVESTMENTS (continued)
(b) Available-for-sale debt securities
Group Bank
2010 2009 2010 2009
Listed in Hong Kong 8,786 6,973 8,780 6,960
Listed outside Hong Kong 57,317 60,991 43,528 45,769
66,103 67,964 52,308 52,729
Unlisted 76,629 124,522 50,677 103,839
142,732 192,486 102,985 156,568
Issued by public bodies:
– central governments and central banks 38,735 64,532 28,757 58,372
– other public sector entities 15,478 17,830 10,371 14,974
54,213 82,362 39,128 73,346
Issued by other bodies:
– banks and other financial institutions 83,075 101,167 60,100 77,782
– corporate entities 5,444 8,957 3,757 5,440
88,519 110,124 63,857 83,222
142,732 192,486 102,985 156,568
At 31 December 2010 and 2009, there were no available-for-sale debt securities individually determined to be impaired on the basis that
there was objective evidence of impairment in the value of the debt securities for the Group and the Bank.
(c) Available-for-sale equity shares
Group Bank
2010 2009 2010 2009
Listed in Hong Kong 47 60 – 5
Listed outside Hong Kong 64 85 64 85
111 145 64 90
Unlisted 215 202 57 57
326 347 121 147
Issued by corporate entities 326 347 121 147
There were no available-for-sale equity securities individually determined to be impaired during the year of 2010 for the Group and the
Bank. For the year of 2009, certain available-for-sale equity securities of the Group and the Bank were individually determined to be
impaired. Impairment losses on these investments were recognised in the income statement in accordance with the accounting policy
set out in note 4(v)(ii).
ANNUAL REPORT 2010 165

NOTES TO THE FINANCIAL STATEMENTS
37. INVESTMENTS IN SuBSIDIARIESBank
2010 2009
Unlisted shares, at cost 11,584 11,584
The principal subsidiaries of the Bank are:
Name of companyPlace of incorporation Principal activities Issued equity capital
Hang Seng Bank (China) Limited People’s Republic of China
Banking RMB4,500,000,000
Hang Seng Finance Limited Hong Kong SAR Lending HK$1,000,000,000
Hang Seng Credit Limited Hong Kong SAR Lending HK$200,000,000
Hang Seng Bank (Bahamas) Limited Bahamas Banking US$1,000,000
Hang Seng Finance (Bahamas) Limited Bahamas Finance US$5,000
Hang Seng Bank (Trustee) Limited Hong Kong SAR Trustee service HK$3,000,000
Hang Seng (Nominee) Limited Hong Kong SAR Nominee service HK$100,000
Hang Seng Life Limited Hong Kong SAR Retirement benefits and life assurance
HK$970,000,000
Hang Seng Insurance Company Limited Hong Kong SAR Retirement benefits and life assurance
HK$4,626,184,570
Hang Seng General Insurance (Hong Kong) Company Limited
Hong Kong SAR General insurance HK$620,000,000
Hang Seng Asset Management Pte Ltd Singapore Fund management SG$2,000,000
Hang Seng Investment Management Limited Hong Kong SAR Fund management HK$10,000,000
Haseba Investment Company Limited Hong Kong SAR Investment holding HK$6,000
Hang Seng Securities Limited Hong Kong SAR Stockbroking HK$26,000,000
Yan Nin Development Company Limited Hong Kong SAR Investment holding HK$100,000
Hang Seng Indexes Company Limited Hong Kong SAR Compilation and dissemination of the Hang Seng share index
HK$10,000
Hang Seng Real Estate Management Limited Hong Kong SAR Property management HK$10,000
All the above companies are wholly-owned subsidiaries and unlisted. All subsidiaries are held directly by the Bank except for Hang Seng
Life Limited and Hang Seng Indexes Company Limited. The principal places of operation are the same as the places of incorporation.
Some principal subsidiaries are regulated banking and insurance entities and as such, are required to maintain certain minimum levels
of capital and liquid assets to support their operations. The effect of these regulatory requirements is to limit the extent to which the
subsidiaries may transfer funds to the Bank in the form of repayment of certain shareholder loans or cash dividends.
HANG SENG BANK166

38. INTEREST IN ASSOCIATESGroup Bank
2010 2009 2010 2009
Unlisted investments, at cost – – 912 912
Listed investments, at cost – – 4,260 1,634
Share of net assets 15,119 9,691 – –
Intangible asset 84 106 – –
Goodwill 463 429 – –
15,666 10,226 5,172 2,546
The associates are:
Name of company
Place ofincorporationand operation Principal activity
Group’s interest inequity capital Issued equity capital
unlisted
Barrowgate Limited Hong Kong SAR Property investment 24.64% HK$10,000
Yantai Bank Co., Ltd. (Formerly known as Yantai City Commercial Bank)
People’s Republic of China
Banking 20.00% RMB2,000,000,000
Listed
Industrial Bank Co., Ltd. People’s Republic of China
Banking 12.80% RMB5,992,000,000
Interest in associates included listed investment of HK$13,752 million (2009: HK$8,406 million). At the balance sheet date, the fair value
of these investments, based on quoted market prices was HK$21,753 million (2009: HK$29,261 million).
In accordance with Hong Kong Accounting Standard 28 “Investments in Associates”, an associate is an entity over which the investor has
significant influence, including the power to participate in the financial and operating policy decisions without controlling the management
of the investee. Usually a holding of less than 20 per cent is presumed not to have significant influence, unless such influence can be
clearly demonstrated. The interests are recognised at cost and dividends accounted for as declared.
The interest in Barrowgate Limited is owned by a subsidiary of the Bank. The interest in Industrial Bank Co., Ltd. (“IB”) and Yantai Bank
Co., Ltd. (“Yantai Bank”) are owned directly by the Bank.
The Group’s interest in IB has been accounted for as an associate using the equity method as the Group has representation in both the
Board and Executive Committee of IB, and the ability to participate in the decision making process.
For the year ended 31 December 2010, the financial results of IB and Yantai Bank were included in the financial statements based on
financial statements drawn up to 30 September 2010, but taking into account any changes in the subsequent period from 1 October 2010
to 31 December 2010 that would materially affect the results. The Group has taken advantage of the provision contained in Hong Kong
Accounting Standard 28 “Investments in Associates” whereby it is permitted to include the attributable share of associates’ results based
on accounts drawn up to a non-coterminous period end where the difference must be no greater than three months.
ANNUAL REPORT 2010 167

NOTES TO THE FINANCIAL STATEMENTS
38. INTEREST IN ASSOCIATES (continued)
The Bank participated IB rights issue in the first half of 2010 at an investment cost of RMB2.3 billion. This increased the Bank’s equity interest
in IB from 12.78 per cent to 12.80 per cent as at 31 December 2010. As there has been no change in the composition of major shareholders
in IB or in the Bank’s representation on its Board of Directors or Executive Committee, the Bank will continue to have the power to participate
in the financial and operating policy decisions of IB, and will continue to account for its results using the equity method.
The following table shows the summarised financial information of the associates with the aggregated amounts in which the Group’s
interests have been accounted for:
Assets Liabilities Equity Revenue Expenses Profit
2010
100 per cent 2,173,920 2,061,507 112,413 49,336 29,003 20,333
Group’s effective interest 281,332 266,213 15,119 6,462 3,801 2,661
2009
100 per cent 1,473,189 1,402,699 70,490 34,418 21,038 13,380
Group’s effective interest 191,044 181,353 9,691 4,496 2,748 1,748
There was no impairment loss on our interest in associates for the years ended 31 December 2010 and 2009.
39. INVESTMENT PROPERTIESThe Group’s investment properties were revalued by DTZ Debenham Tie Leung Limited, an independent professional valuer,
at 30 November 2010, and were updated for any material changes in the valuation as at 31 December 2010. The valuations were carried
out by qualified persons who are members of the Hong Kong Institute of Surveyors. The basis of the valuation for investment properties
was open market value.
(a) Movement of investment properties
Group Bank
2010 2009 2010 2009
At 1 January 2,872 2,593 1,883 1,714
Surplus on revaluation credited to income statement (note 22) 474 250 291 153
Transfer (to)/from assets held for sale (78) 16 (78) 16
Transfer (to)/from premises (note 40(a)) (17) 13 4 –
At 31 December 3,251 2,872 2,100 1,883
(b) Terms of lease
Group Bank
2010 2009 2010 2009
Leaseholds
Held in Hong Kong:
– long leases (over 50 years unexpired) 1,086 1,272 533 506
– medium leases (10 to 50 years unexpired) 2,165 1,600 1,567 1,377
Held outside Hong Kong:
– medium leases (10 to 50 years unexpired) – – – –
3,251 2,872 2,100 1,883
HANG SENG BANK168

39. INVESTMENT PROPERTIES (continued)
(c) The Group leases out investment properties under operating leases. The leases typically run for an initial period of 2 years,
and may contain an option to renew the lease after that date at which time all terms are renegotiated. None of the leases includes
contingent rentals.
The direct operating expenses arising from investment properties were HK$21 million in 2010 (2009: HK$21 million) for the Group and the
Bank. Of this amount, HK$19 million (2009: HK$20 million) was the direct operating expenses from investment properties that generated
rental income.
The Group’s total future minimum lease payments receivable under non–cancellable operating leases are as follows:
Group Bank
2010 2009 2010 2009
Less than one year 120 107 72 67
Over one year but within five years 91 54 59 35
211 161 131 102
40. PREMISES, PLANT AND EQuIPMENTThe Group’s premises were revalued by DTZ Debenham Tie Leung Limited, an independent professional valuer, at 30 November 2010,
and were updated for any material changes in the valuation as at 31 December 2010. The valuations were carried out by qualified
persons who are members of the Hong Kong Institute of Surveyors. The basis of the valuation of premises was open market value for
existing use.
(a) Movement of premises, plant and equipment
Group
PremisesPlant and
equipment Total
2010
Cost or valuation:
At 1 January 11,638 3,387 15,025
Exchange adjustments 20 15 35
Additions 585 175 760
Disposals – (75) (75)
Elimination of accumulated depreciation on revalued premises (329) – (329)
Surplus on revaluation:
– credited to premises revaluation reserve 2,102 – 2,102
– credited to income statement (note 22) 3 – 3
Transfer to assets held for sale (137) – (137)
Transfer from investment property (note 39(a)) 17 – 17
At 31 December 13,899 3,502 17,401
Accumulated depreciation:
At 1 January – (2,611) (2,611)
Exchange adjustments – (9) (9)
Charge for the year (note 17) (330) (289) (619)
Written off on disposal – 70 70
Elimination of accumulated depreciation on revalued premises 329 – 329
At 31 December (1) (2,839) (2,840)
Net book value at 31 December 13,898 663 14,561
ANNUAL REPORT 2010 169

NOTES TO THE FINANCIAL STATEMENTS
40. PREMISES, PLANT AND EQuIPMENT (continued)
(a) Movement of premises, plant and equipment (continued)
Group
PremisesPlant and
equipment Total
(restated) (restated)
2009
Cost or valuation:
At 1 January 10,714 3,421 14,135
Exchange adjustments – – –
Additions – 160 160
Disposals – (192) (192)
Elimination of accumulated depreciation on revalued premises (287) – (287)
Surplus on revaluation:
– credited to premises revaluation reserve 1,475 – 1,475
– credited to income statement (note 22) 2 – 2
Transfer to assets held for sale (253) – (253)
Transfer to investment property (note 39(a)) (13) – (13)
Other – (2) (2)
At 31 December 11,638 3,387 15,025
Accumulated depreciation:
At 1 January – (2,492) (2,492)
Charge for the year (note 17) (287) (304) (591)
Written off on disposal – 185 185
Elimination of accumulated depreciation on revalued premises 287 – 287
At 31 December – (2,611) (2,611)
Net book value at 31 December 11,638 776 12,414
HANG SENG BANK170

40. PREMISES, PLANT AND EQuIPMENT (continued)
(a) Movement of premises, plant and equipment (continued)
Bank
PremisesPlant and
equipment Total
2010
Cost or valuation:
At 1 January 8,837 3,006 11,843
Additions – 114 114
Disposals – (66) (66)
Elimination of accumulated depreciation on revalued premises (259) – (259)
Surplus on revaluation:
– credited to premises revaluation reserve 1,667 – 1,667
– credited to income statement 3 – 3
Transfer to assets held for sale (137) – (137)
Transfer to investment property (note 39(a)) (4) – (4)
At 31 December 10,107 3,054 13,161
Accumulated depreciation:
At 1 January – (2,409) (2,409)
Charge for the year (259) (226) (485)
Written off on disposal – 62 62
Elimination of accumulated depreciation on revalued premises 259 – 259
At 31 December – (2,573) (2,573)
Net book value at 31 December 10,107 481 10,588
Bank
PremisesPlant and
equipment Total
(restated) (restated)
2009
Cost or valuation:
At 1 January 8,144 3,050 11,194
Additions – 142 142
Disposals – (186) (186)
Elimination of accumulated depreciation on revalued premises (225) – (225)
Surplus on revaluation:
– credited to premises revaluation reserve 1,170 – 1,170
– credited to income statement 2 – 2
Transfer to assets held for sale (254) – (254)
At 31 December 8,837 3,006 11,843
Accumulated depreciation:
At 1 January – (2,347) (2,347)
Charge for the year (225) (243) (468)
Written off on disposal – 181 181
Elimination of accumulated depreciation on revalued premises 225 – 225
At 31 December – (2,409) (2,409)
Net book value at 31 December 8,837 597 9,434
ANNUAL REPORT 2010 171

NOTES TO THE FINANCIAL STATEMENTS
40. PREMISES, PLANT AND EQuIPMENT (continued)
(b) Terms of leaseThe net book value of premises comprises:
Group Bank
2010 2009(restated)
2010 2009(restated)
Leaseholds
Held in Hong Kong:
– long leases (over 50 years unexpired) 1,031 1,583 759 796
– medium leases (10 to 50 years unexpired) 12,099 9,906 9,311 8,009
– short leases (under 10 years unexpired) 36 31 36 31
Held outside Hong Kong:
– long leases (over 50 years unexpired) 8 7 – –
– medium leases (10 to 50 years unexpired) 725 111 1 1
13,899 11,638 10,107 8,837
(c) The carrying amount of all premises which have been stated in the balance sheet would have been as follows had they been stated
at cost less accumulated depreciation:
Group Bank
2010 2009(restated)
2010 2009(restated)
Cost less accumulated depreciation at 31 December 2,923 2,358 1,209 1,237
41. INTANGIBLE ASSETSGroup Bank
2010 2009 2010 2009
Present value of in-force long-term
insurance business 4,593 3,466 – –
Internally developed software 429 385 428 384
Acquired software 43 34 14 15
Goodwill 329 329 – –
5,394 4,214 442 399
(a) Movement of present value of in-force long-term insurance business
Group
2010 2009
At 1 January 3,466 2,707
Addition from current year new business 803 747
Movement from in-force business 324 12
At 31 December 4,593 3,466
HANG SENG BANK172

41. INTANGIBLE ASSETS (continued)
(a) Movement of present value of in-force long-term insurance business (continued)
The key assumptions used in the computation of present value of in-force long-term insurance business (“PVIF”) are as follows:
2010 2009
Risk discount rate 11.0% 11.0%
Expenses inflation 3.0% 3.0%
Average lapse rate:
– 1st year 3.4% 3.4%
– 2nd year onwards 1.3% 1.4%
The sensitivity of PVIF valuation to changes in individual assumptions at the balance sheet dates is shown in note 61(d).
(b) Goodwill
Group Bank
2010 2009 2010 2009
At 1 January and at 31 December 329 329 – –
Goodwill arising from acquisition of the remaining 50 per cent of Hang Seng Life Limited from HSBC Insurance (Asia-Pacific) Holdings
Limited amounted to HK$329 million is allocated to cash-generating units of Personal Financial Services (Life Insurance) – Hang Seng
Insurance Company Limited (“HSIC”) for the purpose of impairment testing.
During 2010, there was no impairment of goodwill (2009: Nil). Impairment testing in respect of goodwill is performed annually by
comparing the recoverable amount of cash-generating unit based on appraisal value with the carrying amount of its net assets, including
attributable goodwill.
The appraisal value comprises HSIC’s net assets (other than value of business acquired and goodwill) as at 31 December 2010, the present
value of in-force long-term insurance business and the expected value of future business. The present value of the in-force long-term
insurance business is determined by discounting future earnings expected from the current business, taking into account factors such as
future mortality, lapse rates, levels of expenses and risk discount rate. The above details are shown in notes 41(a) and 61(d).
(c) Movement of internally developed application software and acquired software
Group Bank
2010 2009 2010 2009
Cost:
At 1 January 666 532 641 522
Additions 155 152 140 138
Disposals (5) (20) (5) (19)
Exchange and others 1 2 – –
At 31 December 817 666 776 641
Accumulated amortisation:
At 1 January (247) (183) (242) (180)
Charge for the year (note 17) (102) (84) (96) (81)
Written off on disposals 5 20 4 19
Exchange and others (1) – – –
At 31 December (345) (247) (334) (242)
Net book value at 31 December 472 419 442 399
During 2010, there was no impairment on internally developed application software and acquired software (2009: Nil).
ANNUAL REPORT 2010 173

NOTES TO THE FINANCIAL STATEMENTS
42. OTHER ASSETSGroup Bank
2010 2009 2010 2009
Items in the course of collection from other banks 4,673 4,343 4,673 4,343
Prepayments and accrued income 2,259 1,835 835 804
Assets held for sale*
– repossessed assets 12 47 7 30
– other assets held for sale 206 – 206 –
Acceptances and endorsements 3,751 3,584 2,363 2,435
Retirement benefit assets 95 86 95 86
Other accounts 1,310 1,174 608 538
12,306 11,069 8,787 8,236
* There was no accumulated loss recognised directly in equity relating to assets held for sale for 2010 and 2009.
There are no significant impaired, overdue or rescheduled other assets at the year-end.
43. CuRRENT, SAVINGS AND OTHER DEPOSIT ACCOuNTSGroup Bank
2010 2009 2010 2009
Current, savings and other deposit accounts:
– as stated in balance sheet 683,628 636,369 649,144 612,014
– structured deposits reported as trading liabilities (note 44) 20,852 22,212 8,377 18,892
704,480 658,581 657,521 630,906
By type:
– demand and current accounts 59,116 53,450 59,104 53,409
– savings accounts 466,158 437,440 456,818 429,062
– time and other deposits 179,206 167,691 141,599 148,435
704,480 658,581 657,521 630,906
44. TRADING LIABILITIESGroup Bank
2010 2009 2010 2009
Structured certificates of deposit in issue (note 46) 26 478 26 478
Other debt securities in issue (note 46) 2,712 2,769 2,712 2,769
Structured deposits (note 43) 20,852 22,212 8,377 18,892
Short positions in securities and others 18,991 12,932 18,991 12,932
42,581 38,391 30,106 35,071
HANG SENG BANK174

45. FINANCIAL LIABILITIES DESIGNATED AT FAIR VALuEGroup Bank
2010 2009 2010 2009
4.125% callable fixed rate subordinated notes (note 50) – 1,003 – 1,003
Liabilities to customers under investment contracts 457 453 – –
457 1,456 – 1,003
The Bank has exercised its option to redeem the callable fixed rate notes at par of HK$1,000 million in June 2010. At 31 December 2009, the
difference between the carrying amount and the contractual amount of subordinated notes payable at maturity for the Group and the Bank
amounted to HK$3 million. The accumulated amount of the change in fair value attributable to change in credit risk for the Group and the
Bank was HK$46 million and the change for the year ended 31 December 2009 was HK$8 million for the Group and the Bank.
46. CERTIFICATES OF DEPOSIT AND OTHER DEBT SECuRITIES IN ISSuEGroup Bank
2010 2009 2010 2009
Certificates of deposit and other debt securities in issue:
– as stated in balance sheet 3,095 1,826 3,095 1,826
– structured certificates of deposit in issue reported as trading liabilities (note 44) 26 478 26 478
– other structured debt securities in issue reported as trading liabilities (note 44) 2,712 2,769 2,712 2,769
5,833 5,073 5,833 5,073
By type:
– certificates of deposit in issue 3,121 2,304 3,121 2,304
– other debt securities in issue 2,712 2,769 2,712 2,769
5,833 5,073 5,833 5,073
47. OTHER LIABILITIESGroup Bank
2010 2009 2010 2009
Items in the course of transmission to other banks 7,208 6,304 7,208 6,303
Accruals 2,385 2,039 1,783 1,668
Acceptances and endorsements 3,751 3,584 2,363 2,435
Retirement benefit liabilities 1,718 1,712 1,718 1,712
Other 1,956 1,646 2,362 2,215
17,018 15,285 15,434 14,333
ANNUAL REPORT 2010 175

NOTES TO THE FINANCIAL STATEMENTS
48. LIABILITIES TO CuSTOMERS uNDER INSuRANCE CONTRACTSGroup
2010 2009
Gross Reinsurance Net Gross Reinsurance Net
Non-life insurance
Unearned premiums 227 (75) 152 192 (52) 140
Notified claims 160 (18) 142 146 (19) 127
Claims incurred but not reported 41 (9) 32 43 (8) 35
Other 49 (1) 48 47 (1) 46
477 (103) 374 428 (80) 348
Policyholders’ liabilities
Life (non-linked) 63,722 (35) 63,687 53,588 (19) 53,569
Life (linked) 226 – 226 224 – 224
63,948 (35) 63,913 53,812 (19) 53,793
64,425 (138) 64,287 54,240 (99) 54,141
Amounts recoverable from reinsurance of liabilities under insurance contracts issued are included in the consolidated balance sheet in
“Other assets”.
The movement of liabilities under insurance contracts was as follows:
(a) Non-life insurance
Group
Gross Reinsurance Net
2010
unearned premiums
At 1 January 192 (52) 140
Gross written premiums 470 (122) 348
Gross earned premiums (437) 96 (341)
Exchange and other movements 2 3 5
At 31 December 227 (75) 152
Notified and incurred but not reported claims
At 1 January
– notified claims 146 (19) 127
– claims incurred but not reported 43 (8) 35
189 (27) 162
Claims paid (113) 26 (87)
Claims incurred 134 (26) 108
21 – 21
Exchange and other movements (9) – (9)
At 31 December
– notified claims 160 (18) 142
– claims incurred but not reported 41 (9) 32
201 (27) 174
Other 49 (1) 48
477 (103) 374
HANG SENG BANK176
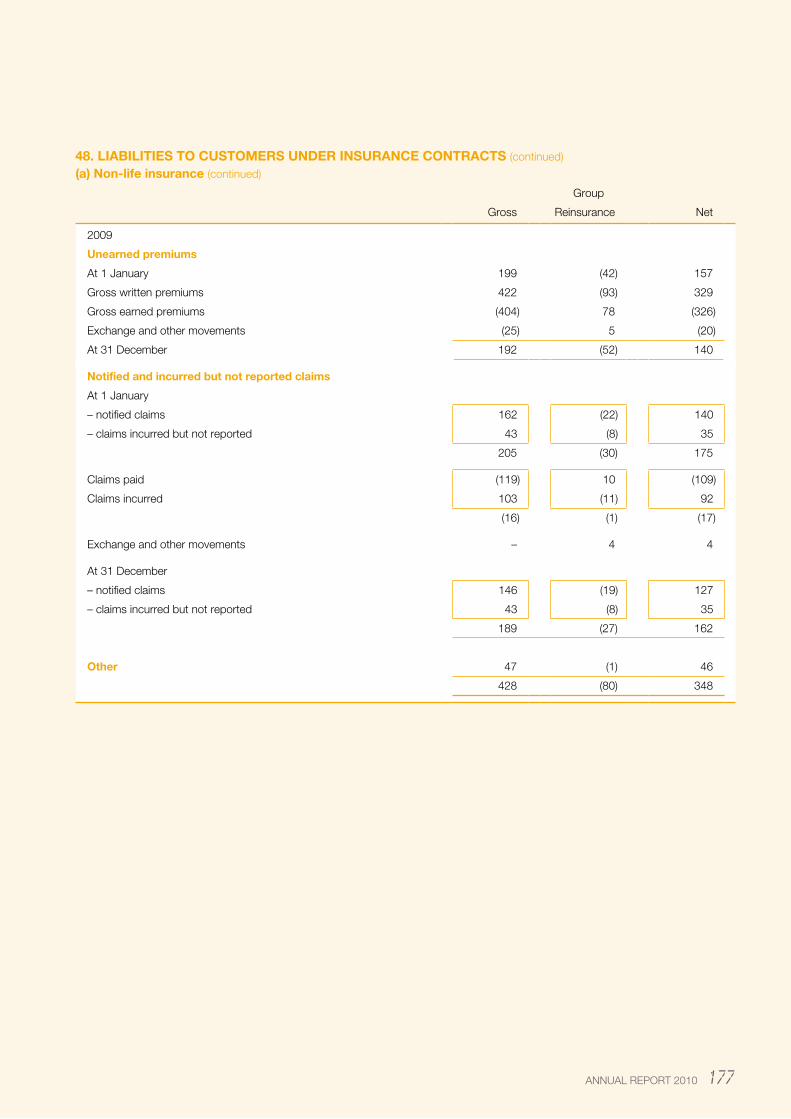
48. LIABILITIES TO CuSTOMERS uNDER INSuRANCE CONTRACTS (continued)
(a) Non-life insurance (continued)
Group
Gross Reinsurance Net
2009
unearned premiums
At 1 January 199 (42) 157
Gross written premiums 422 (93) 329
Gross earned premiums (404) 78 (326)
Exchange and other movements (25) 5 (20)
At 31 December 192 (52) 140
Notified and incurred but not reported claims
At 1 January
– notified claims 162 (22) 140
– claims incurred but not reported 43 (8) 35
205 (30) 175
Claims paid (119) 10 (109)
Claims incurred 103 (11) 92
(16) (1) (17)
Exchange and other movements – 4 4
At 31 December
– notified claims 146 (19) 127
– claims incurred but not reported 43 (8) 35
189 (27) 162
Other 47 (1) 46
428 (80) 348
ANNUAL REPORT 2010 177

NOTES TO THE FINANCIAL STATEMENTS
48. LIABILITIES TO CuSTOMERS uNDER INSuRANCE CONTRACTS (continued)
(b) Policyholders’ liabilities
Group
Gross Reinsurance Net
2010
Life (non-linked)
At 1 January 53,588 (19) 53,569
Benefits paid (2,402) 22 (2,380)
Claims incurred and movement in policyholders’ liabilities 12,487 (36) 12,451
Exchange and other movements 49 (2) 47
At 31 December 63,722 (35) 63,687
Life (linked)
At 1 January 224 – 224
Benefits paid (24) – (24)
Claims incurred and movement in policyholders’ liabilities 28 – 28
Exchange and other movements (2) – (2)
At 31 December 226 – 226
63,948 (35) 63,913
Group
Gross Reinsurance Net
2009
Life (non-linked)
At 1 January 43,211 (18) 43,193
Benefits paid (1,811) 18 (1,793)
Claims incurred and movement in policyholders’ liabilities 11,877 (19) 11,858
Exchange and other movements 311 – 311
At 31 December 53,588 (19) 53,569
Life (linked)
At 1 January 194 – 194
Benefits paid (19) – (19)
Claims incurred and movement in policyholders’ liabilities 54 – 54
Exchange and other movements (5) – (5)
At 31 December 224 – 224
53,812 (19) 53,793
HANG SENG BANK178

49. CuRRENT TAX AND DEFERRED TAX(a) Current tax and deferred tax assets and liabilities are represented in the balance sheet:
Group Bank
2010 2009(restated)
2010 2009(restated)
Current taxation recoverable (included in “Other assets”) 12 5 – –
Deferred tax assets – 16 – 2
12 21 – 2
Current tax liabilities:
Provision for Hong Kong profits tax 337 41 316 2
Provision for taxation outside Hong Kong 7 11 4 8
344 52 320 10
Deferred tax liabilities 3,234 2,460 1,617 1,345
3,578 2,512 1,937 1,355
(b) Deferred tax assets and liabilities recognisedThe major components of deferred tax (assets)/liabilities recognised in the balance sheet and the movements during the year are
as follows:
Group
Depreciationallowances
in excessof related
depreciation
Revaluationof
properties
Loanimpairmentallowances
Fair valueadjustments
for available-for-sale
financialassets
Cash flowhedge Other Total
2010
At 1 January 119 1,964 (99) 5 35 420 2,444
(Credited)/charged to income statement (note 23(a)) (13) 40 14 – – 401 442
Charged/(credited) to reserves – 344 – 23 (21) 2 348
At 31 December 106 2,348 (85) 28 14 823 3,234
2009 (restated)
At 1 January 124 1,758 (99) (476) 104 (241) 1,170
(Credited)/charged to income statement (note 23(a)) (5) 24 – – – 352 371
Charged/(credited) to reserves – 182 – 481 (69) 309 903
At 31 December 119 1,964 (99) 5 35 420 2,444
ANNUAL REPORT 2010 179
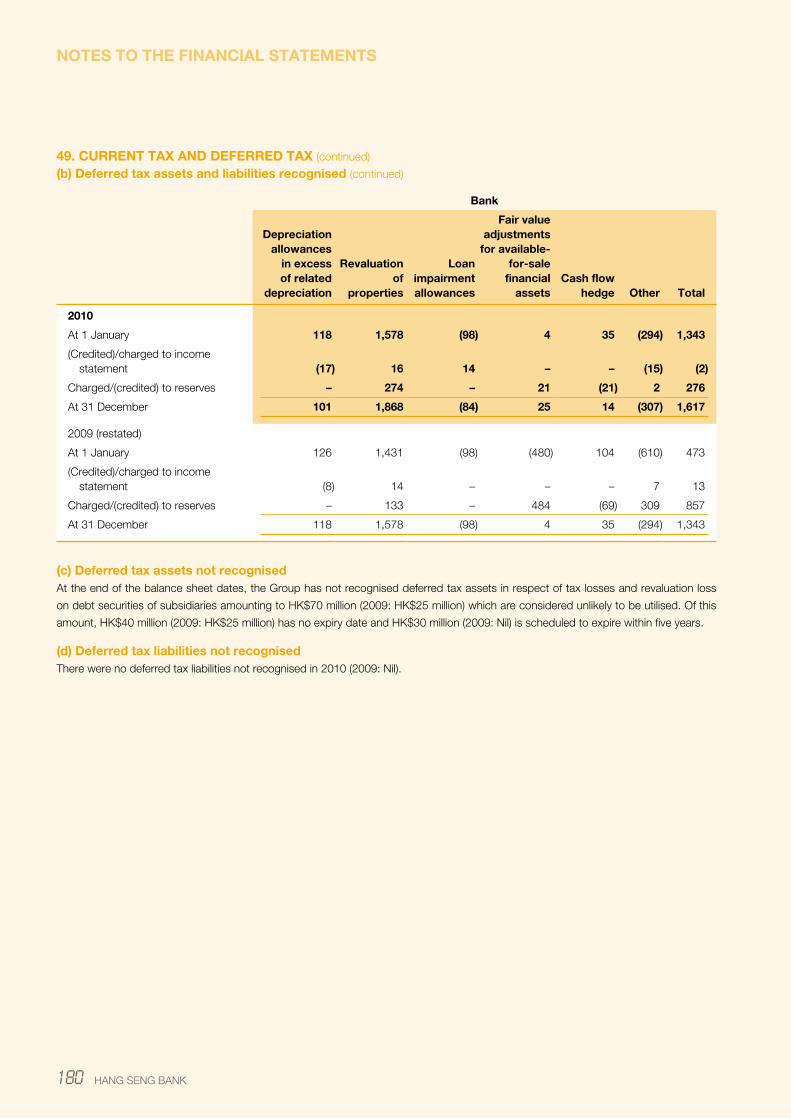
NOTES TO THE FINANCIAL STATEMENTS
49. CuRRENT TAX AND DEFERRED TAX (continued)
(b) Deferred tax assets and liabilities recognised (continued)
Bank
Depreciationallowances
in excessof related
depreciation
Revaluationof
properties
Loanimpairmentallowances
Fair valueadjustments
for available-for-sale
financialassets
Cash flowhedge Other Total
2010
At 1 January 118 1,578 (98) 4 35 (294) 1,343
(Credited)/charged to income statement (17) 16 14 – – (15) (2)
Charged/(credited) to reserves – 274 – 21 (21) 2 276
At 31 December 101 1,868 (84) 25 14 (307) 1,617
2009 (restated)
At 1 January 126 1,431 (98) (480) 104 (610) 473
(Credited)/charged to income statement (8) 14 – – – 7 13
Charged/(credited) to reserves – 133 – 484 (69) 309 857
At 31 December 118 1,578 (98) 4 35 (294) 1,343
(c) Deferred tax assets not recognisedAt the end of the balance sheet dates, the Group has not recognised deferred tax assets in respect of tax losses and revaluation loss
on debt securities of subsidiaries amounting to HK$70 million (2009: HK$25 million) which are considered unlikely to be utilised. Of this
amount, HK$40 million (2009: HK$25 million) has no expiry date and HK$30 million (2009: Nil) is scheduled to expire within five years.
(d) Deferred tax liabilities not recognisedThere were no deferred tax liabilities not recognised in 2010 (2009: Nil).
HANG SENG BANK180

50. SuBORDINATED LIABILITIESGroup Bank
2010 2009 2010 2009
Nominal value Description
Amount owed to third parties
HK$1,500 million Callable floating rate subordinated notes due June 2015 (1) – 1,499 – 1,499
HK$1,000 million 4.125% callable fixed rate subordinated notes due June 2015 (1) – 1,003 – 1,003
US$450 million Callable floating rate subordinated notes due July 2016 (2) 3,495 3,483 3,495 3,483
US$300 million Callable floating rate subordinated notes due July 2017 (3) 2,328 2,321 2,328 2,321
Amount owed to HSBC Group undertakings
US$260 million Callable floating rate subordinated loan debt due December 2015 (4) – 2,017 – 2,017
US$775 million Floating rate subordinated loan debt due December 2020 (4) 6,025 – 6,025 –
11,848 10,323 11,848 10,323
Representing:
– measured at amortised cost 11,848 9,320 11,848 9,320
– designated at fair value (note 45) – 1,003 – 1,003
11,848 10,323 11,848 10,323
The above subordinated notes (excluding the subordinated loan debt due December 2020) each carries a one-time call option exercisable
by the Group on a day falling five years plus one day after the relevant date of issue/drawdown.
(1) The Bank has exercised its option to redeem these subordinated notes at par of HK$2,500 million in aggregate in June 2010.
(2) Interest rate at three-month US dollar LIBOR plus 0.30 per cent, payable quarterly, to the call option date. Thereafter, it will be reset to three-month US dollar LIBOR
plus 0.80 per cent, payable quarterly.
(3) Interest rate at three-month US dollar LIBOR plus 0.25 per cent, payable quarterly, to the call option date. Thereafter, it will be reset to three-month US dollar LIBOR
plus 0.75 per cent, payable quarterly.
(4) The Bank has exercised its option to redeem this subordinated loan debt at par of US$260 million and replenished by a new issue of US$775 million subordinated
loan debt in December 2010.
The outstanding subordinated notes, which qualify as supplementary capital, serve to help the Bank maintain a more balanced capital
structure and support business growth.
51. SHARE CAPITALAuthorised:
The authorised share capital of the Bank is HK$11,000 million (2009: HK$11,000 million) divided into 2,200 million shares (2009: 2,200
million shares) of HK$5 each.
2010 2009
Issued and fully paid:
1,911,842,736 shares (2009: 1,911,842,736 shares) of HK$5 each 9,559 9,559
During the year, the Bank made no repurchase of its own shares (2009: Nil).
ANNUAL REPORT 2010 181

NOTES TO THE FINANCIAL STATEMENTS
52. RESERVESThe reconciliation between the opening and closing balances of each component of the Group’s consolidated equity is set out in the
consolidated statement of changes in equity. Details of the changes in the Bank’s individual components of equity between the beginning
and the end of the year are set out below:
Bank
2010 2009(restated)
Retained profits (including proposed dividends) 23,270 21,527
Premises revaluation reserve 7,654 6,447
Cash flow hedging reserve 72 180
Available-for-sale investment reserve:
– on debt securities 109 (51)
– on equity securities 34 50
Capital redemption reserve 99 99
Other reserves 524 459
Total reserves (including proposed dividends) 31,762 28,711
Retained profits (including proposed dividends)
At beginning of the year 21,527 21,305
Dividends to shareholders:
– dividends approved in respect of the previous year (3,633) (5,736)
– dividends declared in respect of the current year (6,309) (6,309)
Transfer 185 429
Total comprehensive income for the year 11,500 11,838
23,270 21,527
Premises revaluation reserve
At beginning of the year 6,447 5,839
Transfer (185) (429)
Total comprehensive income for the year 1,392 1,037
7,654 6,447
Cash flow hedging reserve
At beginning of the year 180 528
Total comprehensive income for the year (108) (348)
72 180
Available-for-sale investment reserve
At beginning of the year (1) (2,355)
Total comprehensive income for the year 144 2,354
143 (1)
Capital redemption reserve
At beginning of the year 99 99
Total comprehensive income for the year – –
99 99
Other reserve
At beginning of the year 459 420
Costs of share-based payment arrangements 64 35
Total comprehensive income for the year 1 4
524 459
Total reserves (including proposed dividends) 31,762 28,711
HANG SENG BANK182

52. RESERVES (continued)
The Bank and its banking subsidiaries operate under regulatory jurisdictions which require the maintenance of minimum capital adequacy
ratios and which could therefore potentially restrict the amount of realised profits which can be distributed to shareholders.
Regulatory reserveTo satisfy the provisions of the Hong Kong Banking Ordinance and local regulatory requirements for prudential supervision purposes, the
Group has earmarked a “regulatory reserve” from retained profits. Movements in the reserve are made directly through retained earnings.
As at 31 December 2010, the effect of this requirement is to restrict the amount of reserves which can be distributed by the Group to
shareholders by HK$1,654 million (2009: HK$920 million).
Retained profitsRetained profits are the cumulative net earnings of the Group that have not been paid out as dividends, but retained to be reinvested in
the business.
Premises revaluation reserveThe premises revaluation reserve represents the difference between the current fair value of the premises and its original depreciated cost.
The premises revaluation reserve included HK$117 million in relation to a premise classified as assets held for sale, included in “Other
assets” in the consolidated balance sheet at 31 December 2010 (31 December 2009: Nil).
Cash flow hedging reserveThe cash flow hedging reserve comprises the effective portion of the cumulative net change in the fair value of cash flow hedging
instruments related to hedged transactions.
Available-for-sale investment reserveThe available-for-sale investment reserve includes the cumulative net change in the fair value of available-for-sale investments other than
impairments which have been recognised in the income statement.
Capital redemption reserveCapital redemption reserve represents the difference between the capital payment and the nominal value of the redeemed share capital.
Other reservesOther reserves mainly comprise foreign exchange reserve and share-based payment reserve. The foreign exchange reserve comprises
all foreign exchange differences arising from the translation of the financial statements of foreign operations. The share-based payment
reserve is used to record the corresponding amount of share options granted by ultimate holding company to the Group’s employees
and other cost of share-based payment arrangement. Other reserves also included the gain on dilution of investment in an associate of
HK$1,465 million transferred from retained profits.
At 31 December 2010, the aggregate amount of reserves available for distribution to equity shareholders of the Bank as calculated under
the provision of section 79B of the Hong Kong Companies Ordinance amounted to HK$20,556 million (2009: HK$19,568 million). After
considering regulatory capital requirement and business development needs, an amount of HK$3,633 million has been declared as the
proposed fourth interim dividends in respect of the financial year ended 31 December 2010 (2009: HK$3,633 million). The difference
between the aggregate distributable reserves of HK$20,556 million and the Bank’s retained profit of HK$23,270 million as reported above
mainly represents the exclusion of unrealised revaluation gain on investment properties and the above regulatory reserve of the Bank.
ANNUAL REPORT 2010 183

NOTES TO THE FINANCIAL STATEMENTS
53. RECONCILIATION OF CASH FLOW STATEMENT(a) Reconciliation of operating profit to net cash flow from operating activities
2010 2009(restated)
Operating profit 14,085 13,214
Net interest income (14,300) (14,023)
Dividend income (14) (16)
Loan impairment charges and other credit risk provisions 390 812
Impairment of available-for-sale equity securities – 4
Depreciation 619 591
Amortisation of intangible assets 102 84
Amortisation of available-for-sale investments 80 76
Amortisation of held-to-maturity debt securities 5 1
Advances written off net of recoveries (510) (858)
Interest received 15,219 11,126
Interest paid (2,301) (1,478)
Operating profit before changes in working capital 13,375 9,533
Change in treasury bills and certificates of deposit with original maturity more than three months 32,409 (41,353)
Change in placings with and advances to banks maturing after one month (26,155) (5,418)
Change in trading assets 24,451 77,386
Change in financial assets designated at fair value 501 797
Change in derivative financial instruments (111) (8,640)
Change in advances to customers (127,906) (15,454)
Change in other assets (15,680) (4,416)
Change in financial liabilities designated at fair value (2) 8
Change in current, savings and other deposit accounts 47,259 74,186
Change in deposits from banks 10,716 (6,566)
Change in trading liabilities 4,190 (9,891)
Change in certificates of deposit and other debt securities in issue 1,269 (946)
Change in other liabilities 15,448 4,048
Elimination of exchange differences and other non-cash items (8,158) (5,538)
Cash (used in)/generated from operating activities (28,394) 67,736
Taxation paid (1,704) (1,921)
Net cash (outflow)/inflow from operating activities (30,098) 65,815
(b) Analysis of the balances of cash and cash equivalents
2010 2009
Cash and balances with banks and other financial institutions 44,411 22,086
Placings with and advances to banks and other financial institutions maturing within one month 53,457 74,459
Treasury bills 20,692 40,214
118,560 136,759
The balances of cash and cash equivalents included cash balances with central banks and financial institutions that are subject to
exchange control and regulatory restrictions, amounting to HK$13,331 million at 31 December 2010 (2009: HK$8,410 million).
HANG SENG BANK184

54. CONTINGENT LIABILITIES AND COMMITMENTSa) Off-balance sheet contingent liabilities and commitmentsThe tables below give the contract amounts, credit equivalent amounts and risk-weighted amounts of off-balance sheet transactions. The
information is consistent with that in the “Capital Adequacy Ratio” return submitted to the Hong Kong Monetary Authority by the Group.
The return is prepared on a consolidated basis as specified by the Hong Kong Monetary Authority under the requirement of section 98(2)
of the Banking Ordinance.
For the purposes of these financial statements, acceptances and endorsements are recognised on the balance sheet in “Other assets”
and “Other liabilities” in accordance with HKAS 39. For the purpose of the Banking (Capital) Rules (“the Capital Rules”), acceptances and
endorsements are included in the capital adequacy calculation as if they were contingencies. The contract amount of acceptances and
endorsements included in the below tables for the Group and the Bank were HK$3,751 million (2009: HK$3,584 million) and HK$2,363
million (2009: HK$2,435 million) respectively.
Contingent liabilities and commitments are credit-related instruments. The contract amounts represent the amounts at risk should the
contracts be fully drawn upon and the customers default. Since a significant portion of guarantees and commitments is expected to expire
without being drawn upon, the total of the contract amounts is not representative of future liquidity requirements.
The credit equivalent amounts are calculated for the purposes of deriving the risk-weighted amounts. These are assessed in accordance
with the Capital Rules and depend on the status of the counterparty and maturity characteristics of the instrument.
The risk-weighted assets at balance sheet dates were calculated based on the “Advanced internal ratings-based approach”.
Group Bank
Contractamounts
Creditequivalent
amounts
Risk-weightedamounts
Contractamounts
Creditequivalent
amounts
Risk-weightedamounts
2010
Direct credit substitutes 4,365 4,220 3,231 3,263 3,118 2,129
Transaction-related contingencies 455 337 168 351 300 134
Trade-related contingencies 10,593 3,516 2,008 8,935 2,737 1,530
Forward asset purchases 51 51 51 51 51 51
Undrawn formal standby facilities, credit lines and other commitments to lend:
– not unconditionally cancellable* 38,273 17,788 7,479 34,363 15,191 5,767
– unconditionally cancellable 198,724 66,852 20,649 170,333 60,379 15,042
252,461 92,764 33,586 217,296 81,776 24,653
ANNUAL REPORT 2010 185

NOTES TO THE FINANCIAL STATEMENTS
54. CONTINGENT LIABILITIES AND COMMITMENTS (continued)
a) Off-balance sheet contingent liabilities and commitments (continued)
Group Bank
Contractamounts
Creditequivalent
amounts
Risk-weightedamounts
Contractamounts
Creditequivalent
amounts
Risk-weightedamounts
2009
Direct credit substitutes 3,121 2,987 1,785 3,121 2,987 1,785
Transaction-related contingencies 550 289 155 328 244 101
Trade-related contingencies 9,451 2,465 1,466 8,144 2,096 1,172
Forward asset purchases 36 36 36 36 36 36
Undrawn formal standby facilities, credit lines and other commitments to lend:
– not unconditionally cancellable* 29,069 16,447 7,720 26,796 14,330 5,957
– unconditionally cancellable 158,817 53,514 15,036 147,079 50,369 12,603
201,044 75,738 26,198 185,504 70,062 21,654
* The contract amount for undrawn formal standby facilities, credit lines and other commitments to lend with original maturity of “not more than one year” and “more
than one year” as at 31 December 2010 were HK$13,264 million and HK$25,009 million respectively (2009: HK$13,371 million and HK$15,698 million).
b) ContingenciesThere is no material litigation expected to result in a significant adverse effect on the financial position of the Group, either collectively or
individually. Management believes that adequate provisions have been made in respect of such litigation.
55. ASSETS PLEDGED AS SECuRITY FOR LIABILITIESAt 31 December 2010, liabilities of the Group and the Bank which were secured by the deposit of assets, including assets subject to sale and
repurchase arrangements for the Group and the Bank amounted to HK$18,971 million (Group and Bank in 2009: HK$12,929 million). The
amounts of assets pledged to secure these liabilities by the Group and the Bank amounted to HK$19,270 million (Group and Bank in 2009:
HK$13,153 million) and mainly comprised items included in “Trading assets” and “Financial investments”.
These transactions are conducted under terms that are usual and customary to standard lending activities.
56. CAPITAL COMMITMENTSGroup Bank
2010 2009 2010 2009
Expenditure authorised and contracted for 162 73 121 65
Expenditure authorised but not contracted for – – – –
57. LEASE COMMITMENTSThe Group leases certain properties and equipment under operating leases. The leases typically run for an initial period of one to five years
and may include an option to renew the lease when all terms are renegotiated. None of these leases includes contingent rentals.
The total future minimum lease payments payable under non-cancellable operating leases are as follows:
Group Bank
2010 2009 2010 2009
Within one year 454 414 338 296
Between one and five years 717 360 611 256
Over five years 14 – – –
1,185 774 949 552
HANG SENG BANK186

58. EMPLOYEE RETIREMENT BENEFITS(a) Defined benefit schemesThe Group operates three defined benefit schemes, the Hang Seng Bank Limited Defined Benefit Scheme (“HSBDBS”), which is the
principal scheme which covers about 40 per cent of the Group’s employees, and two other schemes, the Hang Seng Bank Limited
Pension Scheme (“HSBPS”) and the Hang Seng Bank Limited Non-contributory Terminal Benefits Scheme (“HSBNTBS”). HSBDBS
was closed to new entrants with effect from 1 April 1999, and HSBPS and HSBNTBS were closed to new entrants with effect from
31 December 1986.
These schemes are funded defined benefit schemes and are administered by trustees with assets held separately from those of the
Group. The latest annual actuarial valuations at 31 December 2010 were performed by E Chiu, fellow of the Society of Actuaries of the
United States of America, of HSBC Life (International) Ltd, a fellow subsidiary company of the Bank, using the Projected Unit Credit
Method. The amounts recognised in the balance sheet at year-end and retirement benefits costs recognised in the income statement for
the year in respect of these defined benefit schemes are set out below.
(i) The amounts recognised in the balance sheet are as follows:
Group and Bank
HSBDBS HSBPS HSBNTBS
2010
Present value of funded obligations (note 58(a)(iii)) (5,710) (157) (2)
Fair value of scheme assets (note 58(a)(iv)) 3,992 222 32
Net (liabilities)/assets recognised in the balance sheet (note 58(a)(v)) (1,718) 65 30
Reported as “Assets” – 65 30
Reported as “Liabilities” (1,718) – –
(1,718) 65 30
Obligations covered by scheme assets (%) 70 141 1,600
2009
Present value of funded obligations (note 58(a)(iii)) (5,557) (170) (2)
Fair value of scheme assets (note 58(a)(iv)) 3,845 225 33
Net (liabilities)/assets recognised in the balance sheet (note 58(a)(v)) (1,712) 55 31
Reported as “Assets” – 55 31
Reported as “Liabilities” (1,712) – –
(1,712) 55 31
Obligations covered by scheme assets (%) 69 132 1,650
The Occupational Retirement Schemes Ordinance (Cap.426 of the laws of Hong Kong) (“the Ordinance”) requires that registered retirement
benefit schemes shall at all time be fully funded to meet its aggregate vested liability (i.e. on a wind-up basis) in accordance with the
recommendations contained in an actuarial certificate supplied under the Ordinance. Any shortfall must be made up within the specified
time under the Ordinance. Any deficits to meet the aggregate past service liability (i.e. on an on-going basis) can however be eliminated
over a period of time in accordance with the funding recommendations of an actuary.
On an on-going basis, the actuarial value of the principal scheme assets of HSBDBS represented 97 per cent (2009: 100 per cent) of the
benefits accrued to scheme members, after allowing for expected future increases in salaries, and the resulting deficit amounted to HK$109
million (surplus in 2009: HK$14 million). On a wind-up basis, the actuarial value of the scheme assets represented 102 per cent (2009: 100
per cent) of the members’ vested benefits, based on salaries at that date, and the resulting surplus amounted to HK$71 million (surplus in
2009: HK$19 million).
ANNUAL REPORT 2010 187

NOTES TO THE FINANCIAL STATEMENTS
58. EMPLOYEE RETIREMENT BENEFITS (continued)
(a) Defined benefit schemes (continued)
(ii) The composition of the scheme assets are as follows:
Group and Bank
HSBDBS HSBPS HSBNTBS
2010
Equity 1,297 29 –
Bonds 2,570 170 –
Certificates of deposit issued by the Bank – – –
Ordinary shares issued by ultimate holding company 45 – –
Other 80 23 32
3,992 222 32
2009
Equity 945 28 –
Bonds 2,724 171 –
Certificates of deposit issued by the Bank – – –
Ordinary shares issued by ultimate holding company 48 – –
Other 128 26 33
3,845 225 33
(iii) Change in the present value of scheme obligations
Group and Bank
HSBDBS HSBPS HSBNTBS
2010
At 1 January 5,557 170 2
Current service cost 267 – –
Interest cost 141 4 –
Actuarial losses/(gains) 51 (3) 1
Benefits paid (306) (14) (1)
At 31 December 5,710 157 2
2009
At 1 January 6,961 219 3
Current service cost 349 – –
Interest cost 82 3 –
Actuarial gains (1,491) (37) (1)
Benefits paid (344) (15) –
At 31 December 5,557 170 2
HANG SENG BANK188

58. EMPLOYEE RETIREMENT BENEFITS (continued)
(a) Defined benefit schemes (continued)
(iv) Change in the fair value of scheme assets
Group and Bank
HSBDBS HSBPS HSBNTBS
2010
At 1 January 3,845 225 33
Contributions by the Bank 183 – –
Expected return on scheme assets 212 8 1
Experience gains/(losses) 58 3 (1)
Benefits paid (306) (14) (1)
At 31 December 3,992 222 32
2009
At 1 January 3,430 218 33
Contributions by the Bank 212 – –
Expected return on scheme assets 211 9 1
Experience gains/(losses) 336 13 (1)
Benefits paid (344) (15) –
At 31 December 3,845 225 33
The Group and the Bank expect to make HK$231 million of contributions to defined benefit schemes during the following year
(2009: HK$188 million).
(v) Movements in the net (liabilities)/assets recognised in the balance sheet are as follows:
Group and Bank
HSBDBS HSBPS HSBNTBS
2010
At 1 January (1,712) 55 31
Contributions by the Bank 183 – –
Net (expense)/income recognised in the income statement (note 58(a)(vi)) (196) 4 1
Net actuarial gains/(losses) 7 6 (2)
At 31 December (1,718) 65 30
Experience losses on scheme liabilities (14) (1) (1)
Experience gains/(losses) on scheme assets 58 3 (1)
(Losses)/gains from change in actuarial assumptions (37) 4 –
Net actuarial gains/(losses) 7 6 (2)
2009
At 1 January (3,531) (1) 30
Contributions by the Bank 212 – –
Net (expense)/income recognised in the income statement (note 58(a)(vi)) (220) 6 1
Net actuarial gains 1,827 50 –
At 31 December (1,712) 55 31
Experience gains on scheme liabilities 288 5 –
Experience gains/(losses) on scheme assets 336 13 (1)
Gains from change in actuarial assumptions 1,203 32 1
Net actuarial gains 1,827 50 –
ANNUAL REPORT 2010 189

NOTES TO THE FINANCIAL STATEMENTS
58. EMPLOYEE RETIREMENT BENEFITS (continued)
(a) Defined benefit schemes (continued)
(vi) Amounts recognised in the income statement are as follows:
Group
HSBDBS HSBPS HSBNTBS
2010
Current service cost (267) – –
Interest cost (141) (4) –
Expected return on scheme assets 212 8 1
Net (expense)/income for the year (note 17) (196) 4 1
Actual return on scheme assets 270 11 –
2009
Current service cost (349) – –
Interest cost (82) (3) –
Expected return on scheme assets 211 9 1
Net (expense)/income for the year (note 17) (220) 6 1
Actual return on scheme assets 547 22 –
The net actuarial gains recognised in the Group’s retained profit during 2010 in respect of defined benefit schemes were HK$9 million
(net actuarial gains of HK$1,568 million during 2009). The total cumulative amount of actuarial losses recognised in the retained profit
was HK$1,902 million (2009: the cumulative amount of actuarial losses was HK$1,911 million). The total effect of the limit on schemes
surpluses in 2010 and 2009 in respect of defined benefit schemes was nil.
(vii) The principal actuarial assumptions used as at 31 December (expressed as weighted averages) are as follows:
Group and Bank
HSBDBS%
HSBPS%
HSBNTBS%
2010
Discount rate 2.9 2.9 2.9
Expected rate of return on scheme assets 4.5 4.0 2.5
Expected rate of salary increases 5.0 5.0 5.0
Expected rate of pension increases – 1.0 –
2009 % % %
Discount rate 2.6 2.6 2.6
Expected rate of return on scheme assets 5.5 4.0 3.0
Expected rate of salary increases 5.0 5.0 5.0
Expected rate of pension increases – 1.0 –
The expected rate of return on scheme assets represents the best estimate of long-term future asset returns, which takes into account
historical market returns plus additional factors such as the current rate of inflation and interest rates.
HANG SENG BANK190

58. EMPLOYEE RETIREMENT BENEFITS (continued)
(a) Defined benefit schemes (continued)
(viii) Amounts for the current and previous years
Group and Bank
2010 2009 2008 2007 2006
Defined benefit obligations 5,869 5,729 7,183 5,913 3,905
Plan assets 4,246 4,103 3,681 5,388 4,728
Net (deficits)/surpluses (1,623) (1,626) (3,502) (525) 823
Experience (losses)/gains on scheme liabilities (16) 293 260 (212) (36)
Experience gains/(losses) on scheme assets 60 348 (1,989) 416 413
(Losses)/gains from change in actuarial assumptions (33) 1,236 (1,287) (1,711) (113)
(b) Defined contribution schemesThe principal defined contribution scheme for Group employees joining on or after 1 April 1999 is the HSBC Group Hong Kong Local Staff
Defined Contribution Scheme. The Group also operates three other defined contribution schemes, the Hang Seng Bank Provident Fund
Scheme which was closed to new entrants since 31 December 1986, the Hang Seng Insurance Company Limited Employees’ Provident
Fund and the Hang Seng Bank (Bahamas) Limited Defined Contribution Scheme for employees of the respective subsidiaries. The Bank
and relevant Group entities also participated in mandatory provident fund schemes (“MPF schemes”) registered under the Hong Kong
Mandatory Provident Fund Ordinance, which are also defined contribution schemes.
Contributions made in accordance with the relevant scheme rules to these defined contribution schemes (including MPF schemes) are
charged to the income statement as below:
2010 2009
Amounts charged to the income statement (note 17) 78 74
Under the schemes, the Group’s contributions are reduced by contributions forfeited by those employees who leave the schemes prior
to the contributions vesting fully. There was no forfeited contributions utilised during the year or available at the year-end to reduce future
contributions (2009: Nil).
59. SHARE-BASED PAYMENTSThe Group participated in various share compensation plans operated by the HSBC Group for acquiring of HSBC Holdings plc shares.
They are the Savings-Related Share Option Plan, Executive/Group Share Option Plan and Restricted Share Plan/Performance Share
Awards/Achievement Share Awards. These are to be settled by the delivery of shares of HSBC Holdings plc.
(a) Savings-Related Share Option PlanThe Savings-Related Share Option Plan, invites eligible employees to enter into savings contracts to save Hong Kong dollar equivalent of up
to £250 per month, with the option to use the savings to acquire shares. The options are exercisable within three months following the first
anniversary of the commencement of a one-year savings contract or within six months following either the third or the fifth anniversary of the
commencement of three-year or five-year savings contract depending on conditions set at grant. There is generally one Savings-Related
Share Option Plan grant each year (in April or May). The exercise price is at a 20 per cent (2009: 20 per cent) discount to the market value
at the date of grant.
The employee has the right to withdraw their accumulated savings and withdraw from the plan at any time. Upon voluntary withdrawal,
any remaining unamortised compensation expense is recognised in the current period.
ANNUAL REPORT 2010 191

NOTES TO THE FINANCIAL STATEMENTS
59. SHARE-BASED PAYMENTS (continued)
(a) Savings-Related Share Option Plan (continued)
The number of options, weighted average exercise price, and the weighted average remaining contractual life for options outstanding at
the date of balance sheet, are as follows:
(i) Option scheme with exercise price set in pounds sterling
2010 2009
Weightedaverageexercise
price£
Number(’000)
Weightedaverageexercise
price£
Number(’000)
Outstanding at 1 January 5.82 29 6.55 543
Exercised in the year 5.82 (23) 5.64 (171)
Lapsed in the year 5.82 (6) 6.55 (387)
Adjustment for rights issue – – 5.69 44
Outstanding at 31 December – – 5.82 29
Exercisable at 31 December – – – –
The weighted average share price at the date of exercise for share options exercised during the year was £6.53 (2009: £6.56).
There was no option outstanding at the end of the year 2010. The option outstanding at 31 December 2009 had an exercise price of £5.82
with a weighted average remaining contractual life of 1.08 years.
(ii) Option scheme with exercise price set in Hong Kong dollars
2010 2009
Weightedaverageexercise
priceHK$
Number(’000)
Weightedaverageexercise
priceHK$
Number(’000)
Outstanding at 1 January 38.30 12,193 106.14 2,296
Granted in the year 62.97 1,561 37.88 12,292
Exercised in the year 37.98 (1,749) 90.14 (11)
Lapsed in the year 38.30 (713) 102.99 (2,526)
Adjustment for rights issue – – 92.30 142
Outstanding at 31 December 41.18 11,292 38.30 12,193
Exercisable at 31 December – – – –
The weighted average share price at the date of exercise for share options exercised during the year was HK$79.38 (2009: HK$83.33).
The options outstanding at the year end of 2010 had an exercise price in the range of HK$37.88 to HK$94.51 (2009: HK$37.88 to
HK$94.51), and a weighted average remaining contractual life of 2.82 years (2009: 3.50 years).
The weighted average fair value of options granted during 2010 was HK$18.80 (2009: HK$15.74).
HANG SENG BANK192

59. SHARE-BASED PAYMENTS (continued)
(b) Executive/Group Share Option PlanExecutive Share Option Plan (for options granted in 1999 and 2000) and Group Share Option Plan (for options granted in 2001 to 2004),
were issued by the HSBC Holdings plc and awarded to high performing employees of the Group on a discretionary basis. Options were
granted at market value and are normally exercisable between the third and tenth anniversaries of the date of grant, subject to vesting
conditions. Exercise of the options, is also subject to the attainment of a corporate performance condition. The Group Share Option Plan
has been closed since 2004.
The number of options, weighted average exercise price, and the weighted average remaining contractual life for options outstanding at
balance sheet date, are as follows:
2010 2009
Weightedaverageexercise
price£
Number(’000)
Weightedaverageexercise
price£
Number(’000)
Outstanding at 1 January 7.04 2,652 7.93 2,747
Exercised in the year 7.35 (145) 7.55 (60)
Lapsed in the year 7.04 (256) 7.93 (441)
Adjustment for rights issue – – 6.99 406
Outstanding at 31 December 7.10 2,251 7.04 2,652
Exercisable at 31 December 7.10 2,251 7.04 2,652
The weighted average share price at the date of exercise for share options exercised during the year was £6.65 (2009: £5.86).
The options outstanding at the year end of 2010 had an exercise price in the range of £6.02 to £7.59 (2009: £6.02 to £7.59), and a
weighted average remaining contractual life of 2.15 years (2009: 2.89 years).
(c) Calculation of fair valueThe recognition of compensation cost of share option is based on the fair value of the options on grant date. The calculation of the fair
value of HSBC share option is centrally managed by HSBC Holdings plc. Fair values of share options, measured at the date of grant of
the options are calculated using a binomial lattice model methodology that is based on the underlying assumptions of the Black-Scholes
model. Expected dividends are incorporated into the valuation model for share options and awards where applicable. The expected life of
options depends on the behaviour of option holders, which is incorporated into the option model consistent with historic observable data.
The fair values calculated are inherently subjective and uncertain due to the assumptions made and the limitations of the model used.
ANNUAL REPORT 2010 193

NOTES TO THE FINANCIAL STATEMENTS
59. SHARE-BASED PAYMENTS (continued)
(c) Calculation of fair value (continued)
The significant weighted average assumptions used to estimate the fair value of the options granted during the year were as follows:
1-yearSavings-Related
ShareOption Plan
3-yearSavings-Related
ShareOption Plan
5-yearSavings-Related
ShareOption Plan
2010
Risk-free interest rate (%) 0.7 1.9 2.9
Expected life (years) 1 3 5
Expected volatility (%) 30 30 30
Share price at grant date (HK$) 82.05 82.05 82.05
2009
Risk-free interest rate (%) 0.7 2.1 2.4
Expected life (years) 1 3 5
Expected volatility (%) 50 35 30
Share price at grant date (HK$) 53.34 53.34 53.34
The risk-free rate was determined from the UK gilts yield curve for Savings-Related Share Option Plan. Expected life is not a single input
parameter but a function of various behavioural assumptions. Expected volatility is estimated by considering both historic average share
price volatility and implied volatility derived from traded options over HSBC shares of similar maturity to those of the employee options.
Expected dividend yield was based on historic levels of dividend growth.
(d) Restricted Share Plan / Performance Share Awards/Achievement Share AwardsRestricted share awards are made to eligible employees for retention purposes or as part of deferral of annual bonus. According to the terms of
the share scheme, the shares awarded has a vesting period of three years, commencing from the first anniversary of the date of award.
Since 2005, performance share awards are made to the Group’s most senior executives taking into account individual performance in
the year. The share awards are divided into two criteria for testing attainment against pre-determined benchmarking. One half is subject
to a Total Shareholder Return measure and the other half of the award is subject to an Earnings Per Share target. Shares will be released
after three years to the extent that the performance conditions are satisfied. These awards are forfeited in total if the minimum criteria are
failed to meet.
Achievement shares were launched in 2005 and are awarded to eligible employees after taking into account of the employee’s performance
in the year. Shares are awarded without corporate performance conditions and are released to employees after three years provided the
employees have remained employed by the Group for this period. The fair value of the shares awarded is charged to the income statement
as share compensation cost over the period from issue date to release date.
2010Number
(’000)
2009Number
(’000)
Outstanding at 1 January 957 917
Additions during the year 28 181
Released in the year (182) (141)
Outstanding at 31 December 803 957
The closing price of the HSBC Holdings plc share at 31 December 2010 was £6.51 (2009: £7.09).
The weighted average remaining vesting period as at 31 December 2010 was 1.21 years (2009: 1.33 years).
HANG SENG BANK194

59. SHARE-BASED PAYMENTS (continued)
(e) Employee expensesDuring 2010, HK$100 million was charged to the income statement in respect of share-based payment transactions settled in equity
(2009: HK$101 million). This expense, which was computed from the fair values of the share-based payment transactions when granted,
arose under employee share awards made in accordance with the Group’s reward structures.
60. MATERIAL RELATED-PARTY TRANSACTIONS(a) Immediate holding company and its subsidiaries, fellow subsidiary companies, subsidiaries and
associatesIn 2010, the Group entered into transactions with its immediate holding company and its subsidiaries and fellow subsidiary companies in
the ordinary course of its interbank activities including lending activities, acceptance and placement of interbank deposits, correspondent
banking transactions, off-balance sheet transactions and the provision of other banking and financial services. The activities were on
substantially the same terms, including interest rates and security, as for comparable transactions with third party counterparties.
The Group used the IT service of, and shared an automated teller machine network with, its immediate holding company. The Group also
shared certain IT projects with and used certain processing services of fellow subsidiaries on a cost recovery basis. The Group maintained
a staff retirement benefit scheme for which a fellow subsidiary company acts as insurer and administrator. A fellow subsidiary company
was appointed as fund manager to manage the Group’s investment portfolios. The Bank acted as agent for the marketing of Mandatory
Provident Fund products and the distribution of retail investment funds for two fellow subsidiary companies.
There was an arrangement whereby a fellow subsidiary provided certain management services, being services related to risk management,
back office processing and administration, development and pricing of selected products, information technology and business recovery,
financial control and actuarial services, to Hang Seng Insurance Company Limited. The premiums, commissions and other fees on these
transactions are determined on an arm’s length basis.
In May 2010, Hang Seng Bank (China) Limited entered into a conditional agreement with HSBC Bank (China) Company Limited to
purchase a property situated in Shanghai, PRC for a total consideration of RMB510 million. The transaction was completed in November
2010 after obtaining regulatory and government approvals.
ANNUAL REPORT 2010 195

NOTES TO THE FINANCIAL STATEMENTS
60. MATERIAL RELATED-PARTY TRANSACTIONS (continued)
(a) Immediate holding company and its subsidiaries, fellow subsidiary companies, subsidiaries and associates (continued)
The aggregate amount of income and expenses arising from these transactions during the year, the balances of amounts due to and from
the relevant related parties, and the total contract sum of off-balance sheet transactions at the year-end are as follows:
Group
Immediate holdingcompany and its
subsidiaries Fellow subsidiaries Associates
2010 2009 2010 2009 2010 2009
Interest income 84 245 – – 11 2
Interest expense (39) (43) (3) (3) – (3)
Other operating income 104 17 – 1 1 2
Operating expenses* (740) (736) (442) (415) (14) (12)
Amounts due from:
Cash and balances with banks and other financial institutions 463 1,495 2,081 758 5 13
Placings with and advances to banks and other financial institutions 8,915 10,841 – – 1,141 –
Derivative financial instruments 586 373 19 10 – –
Financial assets designated at fair value 3,541 3,346 – – – –
Advances to customers – – – – 233 233
Financial investments 334 412 – – – –
Other assets 64 55 – 10 3 3
13,903 16,522 2,100 778 1,382 249
Amounts due to:
Current, savings and other deposit accounts 332 1,527 – 126 68 63
Deposits from banks 2,484 1,309 8 4 117 116
Derivative financial instruments 494 1,238 59 76 – –
Subordinated liabilities 6,025 2,017 – – – –
Other liabilities 326 246 67 84 – –
9,661 6,337 134 290 185 179
Derivative contracts:
Contract amount 75,230 46,180 15,780 18,280 – –
Guarantees:
Guarantees issued 2 – – – 116 116
Committed facilities:
Committed facilities from 826 – – – – –
Committed facilities to – – – – – –
* 2010 Operating expenses included payment of HK$97 million (2009: HK$107 million) of software costs which were capitalised as intangible assets in the balance
sheet of the Group.
HANG SENG BANK196

60. MATERIAL RELATED-PARTY TRANSACTIONS (continued)
(a) Immediate holding company and its subsidiaries, fellow subsidiary companies, subsidiaries and associates (continued)
Bank
Immediate holdingcompany and its
subsidiaries Fellow subsidiaries Subsidiaries Associates
2010 2009 2010 2009 2010 2009 2010 2009
Amounts due from:
Cash and balances with banks and other financial institutions 390 1,397 2,018 701 – – – –
Placings with and advances to banks and other financial institutions 4,683 5,196 – – – – 552 –
Derivative financial instruments 418 280 19 10 88 1 – –
Financial assets designated at fair value – – – – – – – –
Advances to customers – – – – – – – –
Amounts due from subsidiaries – – – – 93,445 87,360 – –
Financial investments – – – – – – – –
Other assets 18 17 – 5 – – 3 3
5,509 6,890 2,037 716 93,533 87,361 555 3
Amounts due to:
Current, savings and other deposit accounts 233 1,527 – 126 – – 68 63
Deposits from banks 2,484 1,309 8 4 – – 117 116
Derivative financial instruments 334 1,230 59 75 298 18 – –
Subordinated liabilities 6,025 2,017 – – – – – –
Amounts due to subsidiaries – – – – 8,899 9,960 – –
Other liabilities 276 194 65 82 – – – –
9,352 6,277 132 287 9,197 9,978 185 179
Derivative contracts:
Contract amount 57,371 40,975 15,780 18,280 33,333 12,220 – –
Guarantees:
Guarantees issued 2 – – – 559 543 116 116
Guarantees received – – – – 159 142 – –
Committed facilities:
Committed facilities from – – – – – – – –
Committed facilities to – – – – 2,332 – – –
ANNUAL REPORT 2010 197

NOTES TO THE FINANCIAL STATEMENTS
60. MATERIAL RELATED-PARTY TRANSACTIONS (continued)
(b) Key management personnel remunerationRemuneration for key management personnel, including amounts paid to the Bank’s directors as disclosed in note 19 and highest paid
employees as disclosed in note 18, is as follows:
Group Bank
2010 2009 2010 2009
Employee benefits 30 39 30 39
Post-employment benefits 4 5 4 5
Share-based payments 7 6 7 6
41 50 41 50
(c) Material transactions with key management personnelDuring the year, the Group provided credit facilities to and accepted deposits from key management personnel of the Bank and its holding
companies, their close family members and companies controlled or significantly influenced by them. The credit facilities extended and
deposit taken were provided in the ordinary course of business and on substantially the same terms as for comparable transactions with
persons of a similar standing or, where applicable, with other employees.
Material transactions conducted with key management personnel of the Bank and its holding companies and parties related to them are
as follows:
Group Bank
2010 2009 2010 2009
Interest received 173 232 173 230
Interest paid 4 5 4 5
Fees and exchange income received 18 16 18 16
Loans and advances 12,153 9,834 11,361 9,254
Deposits 2,906 2,096 2,906 2,085
Undrawn commitments 1,969 3,206 1,670 3,167
Maximum aggregate amount of loans and advances during the year 14,539 21,401 13,398 19,836
The Group adheres to section 83 of the Hong Kong Banking Ordinance regarding lending to related parties; this includes unsecured lending to
key management personnel, their relatives and companies that may be directly or indirectly influenced or controlled by such individuals.
No impairment losses have been recorded against balances outstanding during the year with key management personnel, and there is no
specific impairment allowances on balances with key management personnel at the year-end.
HANG SENG BANK198

60. MATERIAL RELATED-PARTY TRANSACTIONS (continued)
(d) Loans to officersLoans to officers of the Bank disclosed pursuant to section 161B of the Hong Kong Companies Ordinance are as follows:
Group Bank
2010 2009 2010 2009
Aggregate amount of relevant transactions outstanding at 31 December 11 73 11 69
Maximum aggregate amount of relevant transactions during the year 20 132 20 127
(e) AssociatesInformation relating to associates and transactions with associates can be found in notes 38 and 60(a).
The Group maintains a shareholders’ loan to an associate. The shareholders’ loan is unsecured, interest free and with no fixed term of
repayment. The balance at 31 December 2010 was HK$233 million (2009: HK$233 million).
The Bank has been assisting Industrial Bank Co., Ltd. in managing and growing the credit card business.
The Bank has entered into Technical Support Agreement with Yantai Bank Co., Ltd. (“Yantai Bank”) to provide technical support and
assistance in relation to various banking operations and businesses of Yantai Bank.
(f) ultimate holding companyThe Group participates in various share option and share plans operated by HSBC Holdings plc whereby share options or shares of
HSBC Holdings plc are granted to employees of the Group. As disclosed in note 59, the Group recognises an expense in respect of
these share options and share awards. The cost borne by the ultimate holding company in respect of these share options and share
awards is treated as a capital contribution and is recorded under “Other reserves”. The balance of this reserve as at 31 December
2010 amounted to HK$510 million comprising HK$514 million relating to share option schemes and negative reserve amounted to
HK$4 million relating to share award schemes (2009: HK$446 million comprising HK$445 million relating to share option schemes and
HK$1 million relating to share award schemes).
(g) Employee retirement benefitsAt 31 December 2010, defined benefit scheme assets amounted to HK$1,269 million (2009: HK$1,341 million) were under management
by fellow subsidiary companies. The amount of management fee paid to these companies amounted to HK$10 million (2009:
HK$10 million).
ANNUAL REPORT 2010 199
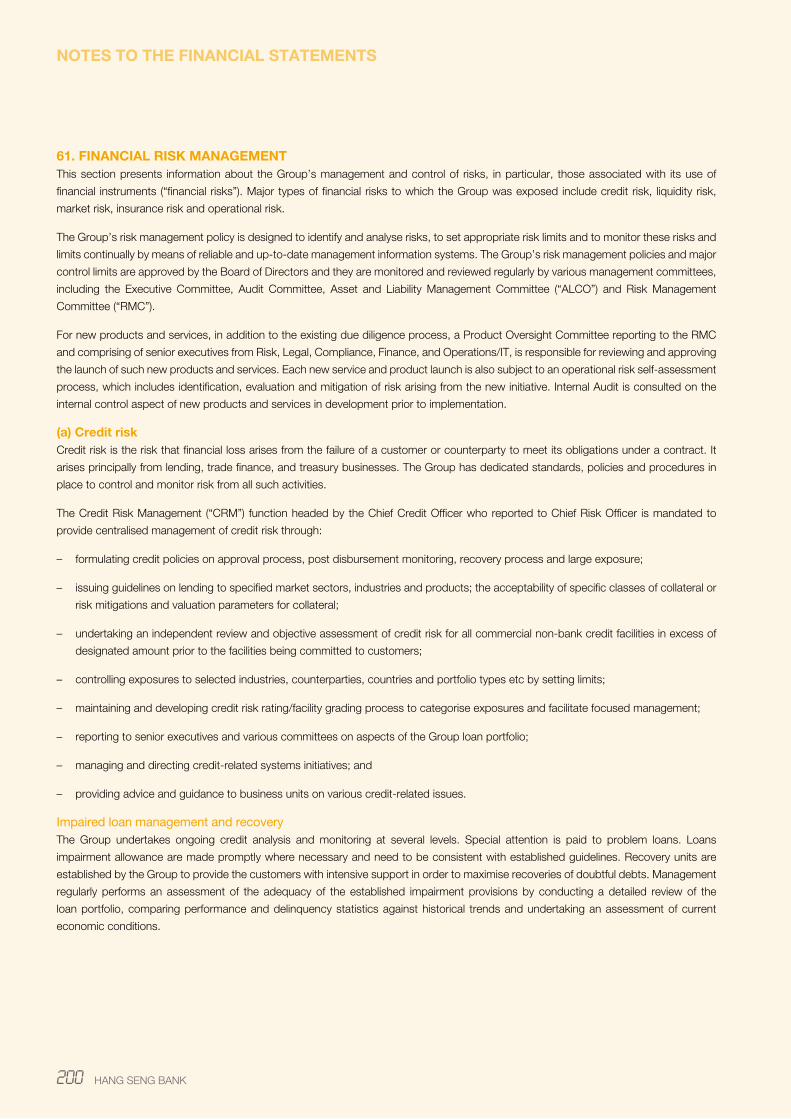
NOTES TO THE FINANCIAL STATEMENTS
61. FINANCIAL RISK MANAGEMENTThis section presents information about the Group’s management and control of risks, in particular, those associated with its use of
financial instruments (“financial risks”). Major types of financial risks to which the Group was exposed include credit risk, liquidity risk,
market risk, insurance risk and operational risk.
The Group’s risk management policy is designed to identify and analyse risks, to set appropriate risk limits and to monitor these risks and
limits continually by means of reliable and up-to-date management information systems. The Group’s risk management policies and major
control limits are approved by the Board of Directors and they are monitored and reviewed regularly by various management committees,
including the Executive Committee, Audit Committee, Asset and Liability Management Committee (“ALCO”) and Risk Management
Committee (“RMC”).
For new products and services, in addition to the existing due diligence process, a Product Oversight Committee reporting to the RMC
and comprising of senior executives from Risk, Legal, Compliance, Finance, and Operations/IT, is responsible for reviewing and approving
the launch of such new products and services. Each new service and product launch is also subject to an operational risk self-assessment
process, which includes identification, evaluation and mitigation of risk arising from the new initiative. Internal Audit is consulted on the
internal control aspect of new products and services in development prior to implementation.
(a) Credit riskCredit risk is the risk that financial loss arises from the failure of a customer or counterparty to meet its obligations under a contract. It
arises principally from lending, trade finance, and treasury businesses. The Group has dedicated standards, policies and procedures in
place to control and monitor risk from all such activities.
The Credit Risk Management (“CRM”) function headed by the Chief Credit Officer who reported to Chief Risk Officer is mandated to
provide centralised management of credit risk through:
– formulating credit policies on approval process, post disbursement monitoring, recovery process and large exposure;
– issuing guidelines on lending to specified market sectors, industries and products; the acceptability of specific classes of collateral or
risk mitigations and valuation parameters for collateral;
– undertaking an independent review and objective assessment of credit risk for all commercial non-bank credit facilities in excess of
designated amount prior to the facilities being committed to customers;
– controlling exposures to selected industries, counterparties, countries and portfolio types etc by setting limits;
– maintaining and developing credit risk rating/facility grading process to categorise exposures and facilitate focused management;
– reporting to senior executives and various committees on aspects of the Group loan portfolio;
– managing and directing credit-related systems initiatives; and
– providing advice and guidance to business units on various credit-related issues.
Impaired loan management and recoveryThe Group undertakes ongoing credit analysis and monitoring at several levels. Special attention is paid to problem loans. Loans
impairment allowance are made promptly where necessary and need to be consistent with established guidelines. Recovery units are
established by the Group to provide the customers with intensive support in order to maximise recoveries of doubtful debts. Management
regularly performs an assessment of the adequacy of the established impairment provisions by conducting a detailed review of the
loan portfolio, comparing performance and delinquency statistics against historical trends and undertaking an assessment of current
economic conditions.
HANG SENG BANK200

61. FINANCIAL RISK MANAGEMENT (continued)
(a) Credit risk (continued)
Risk rating frameworkA sophisticated risk rating framework on counterparty credit risk based on default probability and loss estimates is implemented across
the Group. The rating methodology of this framework is based upon a wide range of financial analytics. This approach will allow a more
granular analysis of risk and trends. The information generated from the risk rating framework is mainly, but not exclusively, applied to
credit approval, credit monitoring, pricing, loan classification and capital adequacy assessment. The Bank also has control mechanisms
in place to validate the performance and accuracy of the risk rating framework.
To measure and manage the risk in these exposures, both to individually assessed customers and to those aggregated into portfolios, the
Group employs diverse risk rating systems and methodologies.
Collateral and other credit enhancementsThe Group has implemented guidelines on the acceptability of specific classes of collateral or credit risk mitigation, and determined the
valuation parameters. Such parameters are established prudently and are reviewed regularly in light of changing market environment and
empirical evidence. Security structures and legal covenants are subject to regular review to ensure that they continue to fulfill their intended
purpose and remain in line with local market practice. While collateral is an important mitigant to credit risk, it is the Group’s policy to
establish that loans are within the customer’s capacity to repay rather than to rely excessively on security. Facilities may be granted on
unsecured basis depending on the customer’s standing and the type of product. The principal collateral types are as follows:
– in the personal sector, charges over the properties, securities, investment funds and deposits;
– in the commercial and industrial sector, charges over business assets such as properties, stock, debtors, investment funds, deposits
and machinery;
– in the commercial real estate sector, charges over the properties being financed.
Repossessed assets are non-financial assets acquired in exchange for loans in order to achieve an orderly realisation, and are reported
in the balance sheet within “Other assets” at the lower of fair value (less costs to sell) and the carrying amount of the loan (net of any
impairment allowance). If excess funds arise after the debt has been repaid, they are made available either to repay other secured lenders
with lower priority or are returned to the customer. The Group does not generally occupy repossessed properties for its business use.
Collateral held as security for financial assets other than loans and advances is determined by the nature of the instrument. Debt securities,
treasury and other eligible bills are generally unsecured with the exception of asset backed securities and similar instruments, which are
secured by pools of financial assets.
Settlement riskSettlement risk arises where a payment in cash, securities or equities is made in the expectation of a corresponding receipt in cash,
securities or equities. Daily Settlement Limits are established to cover the settlement risk arising from the Group’s trading transactions on
any single day. Settlement risk on many transactions, particularly those involving securities and equities, is substantially mitigated when
effected via Assured Payment Systems, or on a delivery versus payment basis.
The ISDA Master Agreement is the Group’s preferred agreement for documenting derivative activities. It provides the contractual framework
that a full range of over-the-counter (“OTC”) products is conducted and contractually binds both parties to apply close-out netting across all
outstanding transactions covered by an agreement, if either party defaults or following other pre-agreed termination events.
Concentration of credit riskConcentration of credit risk exists when changes in geographic, economic or industry factors similarly affect groups of counterparties
whose aggregate credit exposure is material in relation to the Group’s total exposures. The Group’s portfolio of financial instrument is
diversified along geographic, industry and product sectors. Analysis of geographical concentration of the Group’s assets is disclosed in
note 27 to the financial statements and credit risk concentration of respective financial assets is disclosed in notes 32, 33, 35 and 36.
ANNUAL REPORT 2010 201

NOTES TO THE FINANCIAL STATEMENTS
61. FINANCIAL RISK MANAGEMENT (continued)
(a) Credit risk (continued)
The below analysis shows the exposures to credit risk in accordance with HKFRS 7 “Financial Instruments: Disclosures”.
(i) Maximum exposure to credit risk before collateral held or other credit enhancements
Group Bank
2010 2009 2010 2009
Cash and balances with banks and other financial institutions 44,411 22,086 41,062 18,461
Placings with and advances to banks and other financial institutions 110,564 104,551 52,131 65,624
Trading assets 26,047 66,591 25,224 65,282
Financial assets designated at fair value 4,440 4,927 148 174
Derivative financial instruments 5,593 5,050 5,026 4,916
Advances to customers 472,637 344,621 423,074 299,179
Financial investments 199,033 241,155 102,985 156,568
Amounts due from subsidiaries – – 93,445 87,360
Other assets 11,754 10,726 8,419 8,040
Financial guarantees and other credit related contingent liabilities 11,392 9,137 9,916 9,294
Loan commitments and other credit related commitments 347,019 295,084 314,108 280,093
1,232,890 1,103,928 1,075,538 994,991
(ii) Credit qualityFour broad classifications describe the credit quality of the Group’s lending and debt securities portfolios. These classifications each
encompass a range of more granular, internal credit rating grades assigned to wholesale and retail lending business, as well as the
external ratings attributed by external agencies to debt securities.
There is no direct correlation between the internal and external ratings at granular level, except insofar as both fall within one of the
four classifications.
Quality classificationWholesale lending and derivatives Retail lending Debt securities/other
Strong CRR 1 to CRR 2 EL 1 to EL 2* A- and above
Medium CRR 3 to CRR 5 EL 3 to EL 5* B+ to BBB+ and unrated
Sub-standard CRR 6 to CRR 8 EL 6 to EL 8* B and below
Impaired CRR 9 to CRR 10 EL 9 to EL 10 Individually identified
and all EL 1 to EL 8 exposures past due 90 days and above
* All retail exposures past due 90 days and above are classified as “impaired”.
HANG SENG BANK202

61. FINANCIAL RISK MANAGEMENT (continued)
(a) Credit risk (continued)
(ii) Credit quality (continued)
Quality classification definitions:– Strong: Exposures demonstrate a strong capacity to meet financial commitments, with low probability of default and/or low levels of
expected loss. Retail accounts operate within product parameters and only exceptionally show any period of delinquency.
– Medium: Exposures require closer monitoring, with satisfactory to moderate default risk. Retail accounts typically show only short
periods of delinquency, with losses expected to be minimal following the adoption of recovery process.
– Sub-standard: Exposures require varying degrees of special attention and default risk of greater concern. Retail accounts show longer
delinquency periods of up to 90 days past due and/or expected losses are higher due to a reduced ability to mitigate through security
realisation or other recovery processes.
– Impaired: Exposures have been assessed, individually or collectively, as impaired. The Group observes the conservative disclosure
convention, reflected in the quality classification definitions above, that all retail accounts delinquent by 90 days or more are considered
impaired. Such accounts may occur in any retail EL (“Expected loss”) grade, whereby in the higher quality grades the grading
assignment will reflect the offsetting impact by credit risk mitigation in one form or another.
The Group’s policy in respect of impairment on loans and advances and debt securities is set out in note 4 on the financial statements.
Analysis of impairment allowances as at 31 December 2010 and the movement of such allowances during the year are disclosed in
note 35.
Granular risk rating scales:The CRR (“Customer Risk Rating”) 10-grade scale maps to a more granular underlying 23-grade scale of obligor probability of default.
These scales are used Group-wide for all individually significant customers, depending on which Basel II approach is adopted for the assets
in question. The EL 10-grade scale for retail business summarises a more granular 29-grade scale combining obligor and facility/product
risk factors in a composite measure, used Group-wide. The external ratings cited above have for clarity of reporting been assigned to the
quality classifications defined for internally-rated exposures, although there is no fixed correlation between internal and external ratings.
Impairment is not measured for debt securities held in trading portfolios or designated at fair value, as assets in such portfolios are
managed according to movements in fair value, and the fair value movement is taken directly through income statement. Consequently,
all such balances are reported under “neither past due nor impaired”.
ANNUAL REPORT 2010 203

NOTES TO THE FINANCIAL STATEMENTS
61. FINANCIAL RISK MANAGEMENT (continued)
(a) Credit risk (continued)
(ii) Credit quality (continued)
Distribution of financial instruments by credit quality
Group
Neither past due nor impaired Past due not
impaired ImpairedImpairmentallowances TotalStrong Medium*
Sub-standard
2010
Items in the course of collection from other banks 4,589 84 – – – – 4,673
Trading assets:
– treasury and eligible bills 20,204 – – – – – 20,204
– debt securities 5,063 56 – – – – 5,119
– loans and advances to banks 700 – – – – – 700
– loans and advances to customers 24 – – – – – 24
25,991 56 – – – – 26,047
Financial assets designated at fair value:
– treasury and eligible bills – – – – – – –
– debt securities 4,438 2 – – – – 4,440
– loans and advances to banks – – – – – – –
– loans and advances to customers – – – – – – –
4,438 2 – – – – 4,440
Derivatives 4,235 1,284 74 – – – 5,593
Loans and advances held at amortised cost:
– loans and advances to banks 135,797 13,077 – – – – 148,874
– loans and advances to customers 271,974 194,139 2,990 3,380 1,990 (1,836) 472,637
407,771 207,216 2,990 3,380 1,990 (1,836) 621,511
Financial investments:
– treasury and similar bills 18,010 – – – – – 18,010
– debt securities 175,887 5,136 – – – – 181,023
193,897 5,136 – – – – 199,033
Other assets:
– acceptances and endorsements 1,034 2,688 29 – – – 3,751
– other 1,752 1,538 5 35 – – 3,330
2,786 4,226 34 35 – – 7,081
HANG SENG BANK204

61. FINANCIAL RISK MANAGEMENT (continued)
(a) Credit risk (continued)
(ii) Credit quality (continued)
Group
Neither past due nor impaired Past due not
impaired ImpairedImpairmentallowances TotalStrong Medium*
Sub-standard
2009
Items in the course of collection from other banks 4,343 – – – – – 4,343
Trading assets:
– treasury and eligible bills 62,028 – – – – – 62,028
– debt securities 4,562 – – – – – 4,562
– loans and advances to banks – – – – – – –
– loans and advances to customers – 1 – – – – 1
66,590 1 – – – – 66,591
Financial assets designated at fair value:
– treasury and eligible bills – – – – – – –
– debt securities 4,841 86 – – – – 4,927
– loans and advances to banks – – – – – – –
– loans and advances to customers – – – – – – –
4,841 86 – – – – 4,927
Derivatives 4,050 983 17 – – – 5,050
Loans and advances held at amortised cost:
– loans and advances to banks 115,838 6,500 – – – – 122,338
– loans and advances to customers 196,834 138,333 4,797 4,114 2,508 (1,965) 344,621
312,672 144,833 4,797 4,114 2,508 (1,965) 466,959
Financial investments:
– treasury and similar bills 53,973 – – – – – 53,973
– debt securities 177,926 9,256 – – – – 187,182
231,899 9,256 – – – – 241,155
Other assets:
– acceptances and endorsements 877 2,576 131 – – – 3,584
– other 1,792 968 34 5 – – 2,799
2,669 3,544 165 5 – – 6,383
ANNUAL REPORT 2010 205

NOTES TO THE FINANCIAL STATEMENTS
61. FINANCIAL RISK MANAGEMENT (continued)
(a) Credit risk (continued)
(ii) Credit quality (continued)
Bank
Neither past due nor impaired Past due not
impaired ImpairedImpairmentallowances TotalStrong Medium*
Sub-standard
2010
Items in the course of collection from other banks 4,589 84 – – – – 4,673
Trading assets:
– treasury and eligible bills 20,204 – – – – – 20,204
– debt securities 4,240 56 – – – – 4,296
– loans and advances to banks 700 – – – – – 700
– loans and advances to customers 24 – – – – – 24
25,168 56 – – – – 25,224
Financial assets designated at fair value:
– treasury and eligible bills – – – – – – –
– debt securities 148 – – – – – 148
– loans and advances to banks – – – – – – –
– loans and advances to customers – – – – – – –
148 – – – – – 148
Derivatives 3,744 1,220 62 – – – 5,026
Loans and advances held at amortised cost:
– loans and advances to banks 80,171 7,165 – – – – 87,336
– loans and advances to customers 247,256 171,341 1,984 2,463 1,462 (1,432) 423,074
327,427 178,506 1,984 2,463 1,462 (1,432) 510,410
Financial investments:
– treasury and similar bills 17,225 – – – – – 17,225
– debt securities 83,325 2,435 – – – – 85,760
100,550 2,435 – – – – 102,985
Other assets:
– acceptances and endorsements 681 1,666 16 – – – 2,363
– other 607 775 – 1 – – 1,383
1,288 2,441 16 1 – – 3,746
HANG SENG BANK206

61. FINANCIAL RISK MANAGEMENT (continued)
(a) Credit risk (continued)
(ii) Credit quality (continued)
Bank
Neither past due nor impaired Past due not
impaired ImpairedImpairmentallowances TotalStrong Medium*
Sub-standard
2009
Items in the course of collection from other banks 4,343 – – – – – 4,343
Trading assets:
– treasury and eligible bills 62,028 – – – – – 62,028
– debt securities 3,253 – – – – – 3,253
– loans and advances to banks – – – – – – –
– loans and advances to customers – 1 – – – – 1
65,281 1 – – – – 65,282
Financial assets designated at fair value:
– treasury and eligible bills – – – – – – –
– debt securities 174 – – – – – 174
– loans and advances to banks – – – – – – –
– loans and advances to customers – – – – – – –
174 – – – – – 174
Derivatives 3,930 971 15 – – – 4,916
Loans and advances held at amortised cost:
– loans and advances to banks 76,150 3,856 – – – – 80,006
– loans and advances to customers 170,878 122,500 2,779 2,924 1,761 (1,663) 299,179
247,028 126,356 2,779 2,924 1,761 (1,663) 379,185
Financial investments:
– treasury and similar bills 49,277 – – – – – 49,277
– debt securities 101,905 5,386 – – – – 107,291
151,182 5,386 – – – – 156,568
Other assets:
– acceptances and endorsements 763 1,641 31 – – – 2,435
– other 974 282 2 4 – – 1,262
1,737 1,923 33 4 – – 3,697
* Includes HK$1,623 million (2009: HK$3,006 million) and HK$283 million (2009: HK$1,557 million) of debt securities that have been classified as BBB- to BBB+ for
the Group and the Bank respectively in 2010, based on Standard and Poor’s ratings or their equivalent to the respective issues of the financial securities. If major
rating agencies have different ratings for the same debt securities, the securities are reported against the lower rating. In the absence of such issue ratings, the
ratings designated for the issuers are reported.
ANNUAL REPORT 2010 207

NOTES TO THE FINANCIAL STATEMENTS
61. FINANCIAL RISK MANAGEMENT (continued)
(a) Credit risk (continued)
(ii) Credit quality (continued)
Aging analysis of financial instruments which were past due but not impairedExamples of exposures designated past due but not impaired include loans that have missed the most recent payment date but on
which there is no evidence of impairment; loans fully secured by cash collateral; residential mortgages in arrears more than 90 days, but
where the value of collateral is sufficient to repay both the principal debt and all potential interest for at least one year; short-term trade
facilities past due more than 90 days for technical reasons such as delays in documentation, but where there is no concern over the
creditworthiness of the counterparty.
Group
up to29 days
30-59 days
60-89 days
90-180 days
Over180 days Total
2010
Items in the course of collection from other banks – – – – – –
Trading assets:
– treasury and eligible bills – – – – – –
– debt securities – – – – – –
– loans and advances to banks – – – – – –
– loans and advances to customers – – – – – –
– – – – – –
Financial assets designated at fair value:
– treasury and eligible bills – – – – – –
– debt securities – – – – – –
– loans and advances to banks – – – – – –
– loans and advances to customers – – – – – –
– – – – – –
Derivatives – – – – – –
Loans and advances held at amortised cost:
– loans and advances to banks – – – – – –
– loans and advances to customers# 2,892 419 51 13 5 3,380
2,892 419 51 13 5 3,380
Financial investments:
– treasury and similar bills – – – – – –
– debt securities – – – – – –
– – – – – –
Other assets:
– acceptances and endorsements – – – – – –
– other 17 5 2 5 6 35
17 5 2 5 6 35
HANG SENG BANK208

61. FINANCIAL RISK MANAGEMENT (continued)
(a) Credit risk (continued)
(ii) Credit quality (continued)
Group
Up to29 days
30-59 days
60-89 days
90-180 days
Over180 days Total
2009
Items in the course of collection from other banks – – – – – –
Trading assets:
– treasury and eligible bills – – – – – –
– debt securities – – – – – –
– loans and advances to banks – – – – – –
– loans and advances to customers – – – – – –
– – – – – –
Financial assets designated at fair value:
– treasury and eligible bills – – – – – –
– debt securities – – – – – –
– loans and advances to banks – – – – – –
– loans and advances to customers – – – – – –
– – – – – –
Derivatives – – – – – –
Loans and advances held at amortised cost:
– loans and advances to banks – – – – – –
– loans and advances to customers# 3,432 588 83 11 – 4,114
3,432 588 83 11 – 4,114
Financial investments:
– treasury and similar bills – – – – – –
– debt securities – – – – – –
– – – – – –
Other assets:
– acceptances and endorsements – – – – – –
– other 4 1 – – – 5
4 1 – – – 5
ANNUAL REPORT 2010 209

NOTES TO THE FINANCIAL STATEMENTS
61. FINANCIAL RISK MANAGEMENT (continued)
(a) Credit risk (continued)
(ii) Credit quality (continued)
Bank
up to29 days
30-59 days
60-89 days
90-180 days
Over180 days Total
2010
Items in the course of collection from other banks – – – – – –
Trading assets:
– treasury and eligible bills – – – – – –
– debt securities – – – – – –
– loans and advances to banks – – – – – –
– loans and advances to customers – – – – – –
– – – – – –
Financial assets designated at fair value:
– treasury and eligible bills – – – – – –
– debt securities – – – – – –
– loans and advances to banks – – – – – –
– loans and advances to customers – – – – – –
– – – – – –
Derivatives – – – – – –
Loans and advances held at amortised cost:
– loans and advances to banks – – – – – –
– loans and advances to customers# 2,173 236 39 13 2 2,463
2,173 236 39 13 2 2,463
Financial investments:
– treasury and similar bills – – – – – –
– debt securities – – – – – –
– – – – – –
Other assets:
– acceptances and endorsements – – – – – –
– other 1 – – – – 1
1 – – – – 1
HANG SENG BANK210

61. FINANCIAL RISK MANAGEMENT (continued)
(a) Credit risk (continued)
(ii) Credit quality (continued)
Bank
Up to29 days
30-59 days
60-89 days
90-180 days
Over180 days Total
2009
Items in the course of collection from other banks – – – – – –
Trading assets:
– treasury and eligible bills – – – – – –
– debt securities – – – – – –
– loans and advances to banks – – – – – –
– loans and advances to customers – – – – – –
– – – – – –
Financial assets designated at fair value:
– treasury and eligible bills – – – – – –
– debt securities – – – – – –
– loans and advances to banks – – – – – –
– loans and advances to customers – – – – – –
– – – – – –
Derivatives – – – – – –
Loans and advances held at amortised cost:
– loans and advances to banks – – – – – –
– loans and advances to customers# 2,540 331 52 1 – 2,924
2,540 331 52 1 – 2,924
Financial investments:
– treasury and similar bills – – – – – –
– debt securities – – – – – –
– – – – – –
Other assets:
– acceptances and endorsements – – – – – –
– other 3 1 – – – 4
3 1 – – – 4
# The majority of the loans and advances to customers that are operating within revised terms following restructuring are excluded from this table.
Impaired loans and advancesSpecial attention is paid to problem loans and appropriate action is initiated to protect the Group’s position on a timely basis and to ensure
that loan impairment methodologies result in losses being recognised when they are incurred.
The Group’s policy for recognising and measuring impairment allowances on both individually assessed advances and those which are
collectively assessed on a portfolio basis is described in note 4(f) to the financial statements.
Analyses of impairment allowances at 31 December 2010 and the movement of such allowances during the year are disclosed in note 35.
ANNUAL REPORT 2010 211

NOTES TO THE FINANCIAL STATEMENTS
61. FINANCIAL RISK MANAGEMENT (continued)
(a) Credit risk (continued)
(ii) Credit quality (continued)
Renegotiated loans that would otherwise be past due or impairedRenegotiated loans are those that have been restructured due to deterioration in the borrower’s financial position and where the Group
has made concessions that it would not otherwise consider. Once the loan is restructured it remains in this category independent of
satisfactory performance after restructuring.
Group Bank
2010 2009 2010 2009
Renegotiated loans that would otherwise be past due or impaired 695 1,110 424 801
(iii) Collateral and other credit enhancements obtainedDuring the years indicated, the Group obtained assets by taking possession of collateral held as security, or calling other credit
enhancement, as follows:
Group Bank
2010 2009 2010 2009
Nature of assets:
Residential properties 24 19 11 12
Commercial and industrial properties – – – –
Other – – – –
24 19 11 12
(b) Liquidity riskLiquidity relates to the ability of a company to meet its obligations as they fall due. The Group maintains a stable and diversified funding
base of core retail and corporate customer deposits as well as portfolios of highly liquid assets. The objective of the Group’s liquidity and
funding management is to ensure that all foreseeable funding commitments and deposit withdrawals can be met when due.
Management of liquidity is carried out both at Group and Bank level as well as in individual branches and subsidiaries. The Group requires
branches and subsidiaries to maintain a strong liquidity position and to manage the liquidity structure of their assets, liabilities and
commitments so that cash flows are approximately balanced and all funding obligations are met when due.
It is the responsibility of the Group’s management to ensure compliance with local regulatory requirements and limits set by Executive
Committee. Liquidity is managed on a daily basis by the Bank’s treasury functions and overseas treasury sites.
HANG SENG BANK212

61. FINANCIAL RISK MANAGEMENT (continued)
(b) Liquidity risk (continued)
Compliance with liquidity requirements is monitored by the Asset and Liability Management Committee (“ALCO”) and is reported to the
Risk Management Committee, Executive Committee and the Board of Directors. This process includes:
– projecting cash flows and considering the level of liquid assets necessary in relation thereto;
– monitoring balance sheet liquidity ratios against internal and regulatory requirements;
– maintaining a diverse range of funding sources with adequate back-up facilities;
– managing debt financing plans;
– monitoring of depositor concentration in order to avoid undue reliance on large individual depositors and ensuring a satisfactory overall
funding mix; and
– monitoring of depositor concentration contingency plans. These plans identify early indicators of stress conditions and describe
actions to be taken in the event of difficulties arising from systematic or other crises, while minimising adverse long-term implications
for the business.
Current accounts and savings deposits payable on demand or at short notice form a significant part of the Group’s overall funding. The
Group places considerable importance on the stability of these deposits, which is achieved through the Group’s retail banking activities
and by maintaining depositor confidence in the Group’s capital strength. Professional markets are accessed for the purposes of providing
additional funding, maintaining a presence in local money markets and optimising asset and liability maturities. Although the contractual
repayments of many customer accounts are on demand or short notice, in practice short-term deposit balances remain stable as inflows
and outflows broadly match.
The average liquidity ratio for the year, calculated in accordance with the Fourth Schedule of the Hong Kong Banking Ordinance, is
as follows:
Group
2010 2009
The Bank and its subsidiaries designated by the Hong Kong Monetary Authority 38.1% 48.1%
The below tables are an analysis of undiscounted cash flows on the Group’s financial liabilities including future interest payments on the
basis of their earliest possible contractual maturity.
ANNUAL REPORT 2010 213

NOTES TO THE FINANCIAL STATEMENTS
61. FINANCIAL RISK MANAGEMENT (continued)
(b) Liquidity risk (continued)
The balances in the below table will not agree with the balances in the balance sheet as the table incorporates, on an undiscounted
basis, all cash flows relating to principal and all future coupon payments (except for trading liabilities and trading derivatives). Also, loans
commitments are generally not recognised on the balance sheet. Trading liabilities and trading derivatives have been included in the
“On demand” time bucket, and not by contractual maturity, because trading liabilities are typically held for short periods of time. The
undiscounted cash flows on hedging derivative liabilities are classified according to their contractual maturity.
Cash flows payable in respect of customer accounts are primarily contractually repayable on demand or at short notice. However, in
practice, short-term deposit balances remain stable as inflows and outflows broadly match and a significant portion of loans commitments
expire without being drawn upon. The undiscounted cash flows potentially payable under loan commitments and financial guarantee
are classified on the basis of the earliest date they can be called instead of behaviour maturity as previous reported. Accordingly, the
comparative figures are restated to conform with current year presentation.
Group
Repayableon
demand
Threemonthsor less
but not ondemand
Overthree
monthsbut within
one year
Overone year
but withinfive years
Overfive
years Total
At 31 December 2010
Current, savings and other deposit accounts 536,442 116,288 29,956 1,660 – 684,346
Deposits from banks 6,387 9,084 – 117 – 15,588
Financial liabilities designated at fair value 2 – – – 455 457
Trading liabilities 42,581 – – – – 42,581
Derivative financial instruments 3,709 104 400 616 (18) 4,811
Certificates of deposit and other debt securities in issue – 553 135 2,489 – 3,177
Other financial liabilities 6,719 5,643 1,499 70 25 13,956
Subordinated liabilities – 54 3,609 2,843 6,655 13,161
595,840 131,726 35,599 7,795 7,117 778,077
Commitments 222,111 37,081 179 575 – 259,946
Financial guarantee contracts 4,094 – 2 – – 4,096
226,205 37,081 181 575 – 264,042
At 31 December 2009
Current, savings and other deposit accounts 494,372 119,462 22,508 753 – 637,095
Deposits from banks 2,964 1,771 25 117 – 4,877
Financial liabilities designated at fair value 3 10 1,010 – 451 1,474
Trading liabilities 38,391 – – – – 38,391
Derivative financial instruments 3,581 75 365 242 (8) 4,255
Certificates of deposit and other debt securities in issue – 344 1,214 328 – 1,886
Other financial liabilities 5,881 4,935 1,103 114 116 12,149
Subordinated liabilities – 12 3,547 5,846 – 9,405
545,192 126,609 29,772 7,400 559 709,532
Commitments 182,134 27,781 82 183 – 210,180
Financial guarantee contracts 2,719 2 4 2 – 2,727
184,853 27,783 86 185 – 212,907
HANG SENG BANK214

61. FINANCIAL RISK MANAGEMENT (continued)
(b) Liquidity risk (continued)
Bank
Repayableon
demand
Threemonthsor less
but not ondemand
Overthree
monthsbut within
one year
Overone year
but withinfive years
Overfive
years Total
At 31 December 2010
Current, savings and other deposit accounts 526,177 105,993 16,276 1,106 – 649,552
Deposits from banks 6,386 9,084 – 117 – 15,587
Financial liabilities designated at fair value – – – – – –
Trading liabilities 30,106 – – – – 30,106
Derivative financial instruments 3,803 91 280 381 (21) 4,534
Certificates of deposit and other debt securities in issue – 553 135 2,489 – 3,177
Amounts due to subsidiaries 4,222 4,675 2 – – 8,899
Other financial liabilities 6,596 4,514 770 1 910 12,791
Subordinated liabilities – 54 3,609 2,843 6,655 13,161
577,290 124,964 21,072 6,937 7,544 737,807
Commitments 190,235 36,455 75 1 – 226,766
Financial guarantee contracts 2,992 – 2 – – 2,994
193,227 36,455 77 1 – 229,760
At 31 December 2009
Current, savings and other deposit accounts 486,023 112,668 13,207 403 – 612,301
Deposits from banks 2,963 1,365 25 117 – 4,470
Financial liabilities designated at fair value – 10 1,010 – – 1,020
Trading liabilities 35,071 – – – – 35,071
Derivative financial instruments 3,572 71 324 217 (8) 4,176
Certificates of deposit and other debt securities in issue – 344 1,214 328 – 1,886
Amounts due to subsidiaries 4,749 4,973 238 – – 9,960
Other financial liabilities 5,794 4,053 646 50 909 11,452
Subordinated liabilities – 12 3,547 5,846 – 9,405
538,172 123,496 20,211 6,961 901 689,741
Commitments 169,270 26,463 69 2 – 195,804
Financial guarantee contracts 2,713 2 4 2 – 2,721
171,983 26,465 73 4 – 198,525
(c) Market riskMarket risk is the risk that foreign exchange rates, interest rates, equity and commodity prices and indices will move and result in profits
or losses for the Group. The objective of the Group’s market risk management is to manage and control market risk exposures in order
to optimise return on risk while maintaining a market profile consistent with the Group’s status as a premier provider of financial products
and services.
ANNUAL REPORT 2010 215

NOTES TO THE FINANCIAL STATEMENTS
61. FINANCIAL RISK MANAGEMENT (continued)
(c) Market risk (continued)
The Group separates exposures to market risk into either trading or non-trading portfolios. Trading portfolios include those positions
arising from market-making, customer-related business, proprietary position-taking and strategic foreign exchange. Non-trading portfolios
primarily arise from the effective interest rate management of the Group’s retail and commercial banking assets and liabilities.
The management of market risk is principally undertaken in Treasury using risk limits approved by the Risk Management Committee.
Limits are set for each portfolio, product and risk type, with market liquidity being a principal factor in determining the level of limits set.
The Group has dedicated standards, policies and procedures in place to control and monitor the market risk. An independent market
risk control function is responsible for measuring market risk exposures, monitoring and reporting these exposures against the prescribed
limits on a daily basis. The market risks which arise on each business are assessed and transferred to either Treasury for management,
or to separate books managed under the supervision of ALCO.
Value at risk (“VAR”)One of the principal tools used by the Group to monitor and limit market risk exposure is VAR. The Group has obtained approval from the
HKMA to use its VAR model for calculation of market risk capital charge.
VAR is a technique which estimates the potential losses that could occur on risk positions taken due to movements in market rates and
prices over a specified time horizon and to a given level of confidence. Historical simulation uses scenarios derived from historical market
rates and takes account of the relationships between different markets and rates, for example, interest rates and foreign exchange rates.
Movements in market prices are calculated by reference to market data from the last two years. The assumed holding period is a 1-day
period with a 99 per cent level of confidence, reflecting the way the risk positions are managed.
VAR is calculated daily. The Group validates the accuracy of its VAR models by back-testing the actual daily profit and loss results which
include both end of day market movements and intra-day trading outcomes, adjusted to remove non-modelled items such as fees and
commissions, against the corresponding VAR numbers. Statistically, the Group would expect to see losses in excess of VAR only one
per cent of the time over a 1-year period. The actual number of excesses over this period can therefore be used to gauge how well the
models are performing.
Although a valuable guide to risk, VAR should always be viewed in the context of its limitations. For example:
– the use of historical data as a proxy for estimating future events may not encompass all potential events, particularly those which are
extreme in nature;
– the use of a 1-day holding period assumes that all positions can be liquidated or hedged in one day. This may not fully reflect the market
risk arising at times of severe illiquidity, when a 1-day holding period may be insufficient to liquidate or hedge all positions fully;
– the use of a 99 per cent confidence level, by definition, does not take into account losses that might occur beyond this level of
confidence; and
– VAR is calculated on the basis of exposures outstanding at the close of business and therefore does not necessarily reflect intra-
day exposures.
The Group recognises these limitations by augmenting its VAR limits with other position and sensitivity limit structures. Additionally, the
Group applies a wide range of stress testing, both on individual portfolios and on the Group’s consolidated positions. The Group’s stress
testing regime provides senior management with an assessment of the financial impact of identified extreme events on the market risk
exposures of the Group.
HANG SENG BANK216
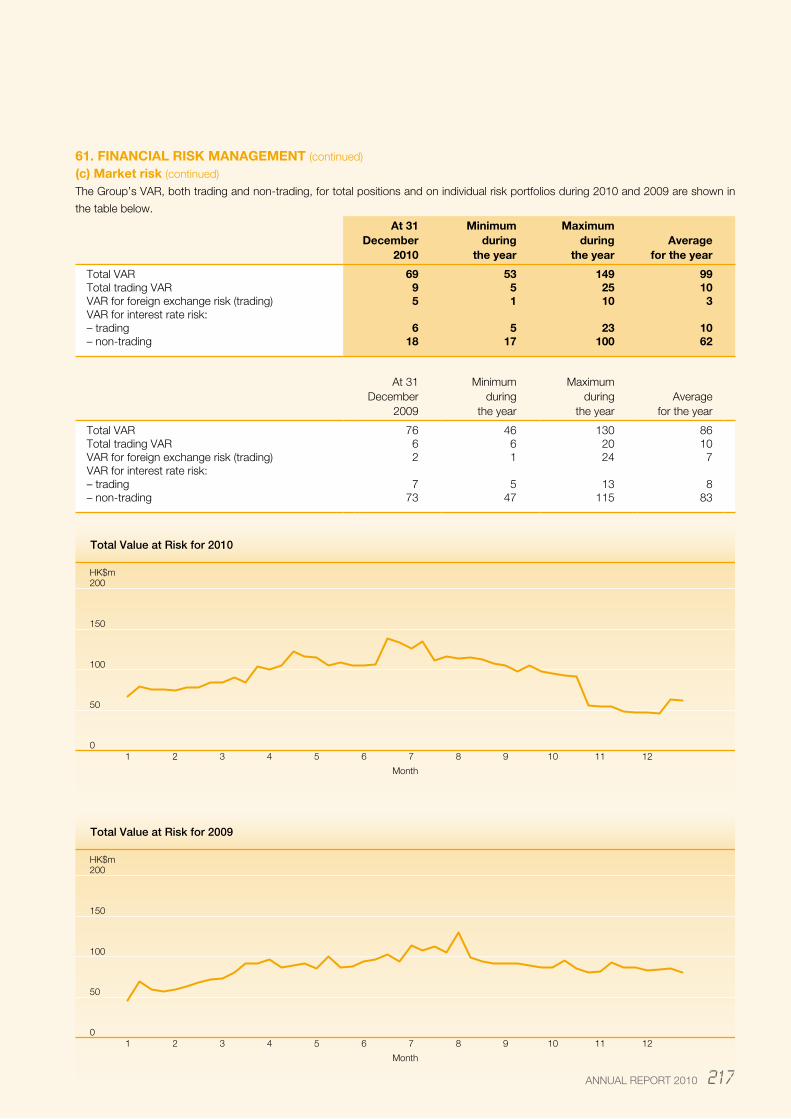
61. FINANCIAL RISK MANAGEMENT (continued)
(c) Market risk (continued)
The Group’s VAR, both trading and non-trading, for total positions and on individual risk portfolios during 2010 and 2009 are shown in
the table below.
At 31 December
2010
Minimumduring
the year
Maximumduring
the yearAverage
for the year
Total VAR 69 53 149 99Total trading VAR 9 5 25 10VAR for foreign exchange risk (trading) 5 1 10 3VAR for interest rate risk:– trading 6 5 23 10– non-trading 18 17 100 62
At 31 December
2009
Minimumduring
the year
Maximumduring
the yearAverage
for the year
Total VAR 76 46 130 86Total trading VAR 6 6 20 10VAR for foreign exchange risk (trading) 2 1 24 7VAR for interest rate risk:– trading 7 5 13 8– non-trading 73 47 115 83
50
0
100
150
200HK$m
Total Value at Risk for 2010
1 2 3 4 5 6 7 8 9 10 11 12
Month
50
0
100
150
200HK$m
Total Value at Risk for 2009
1 2 3 4 5 6 7 8 9 10 11 12
Month
ANNUAL REPORT 2010 217

NOTES TO THE FINANCIAL STATEMENTS
61. FINANCIAL RISK MANAGEMENT (continued)
(c) Market risk (continued)
The average daily revenue earned from market risk-related treasury activities in 2010, including non-trading book net interest income and
funding related to trading positions, was HK$11 million (2009: HK$12 million). The standard deviation of these daily revenues was HK$6
million, compared with HK$10 million for 2009.
An analysis of the frequency distribution of daily revenue shows that out of 249 trading days in 2010, losses were recorded on 3 days
(2009: 15 days) and the maximum daily loss was HK$35 million (2009: HK$24 million). The most frequent result was a daily revenue of
between HK$6 million and HK$18 million, with 191 occurrences (2009: 160 occurrences). The highest daily revenue was HK$32 million
(2009: HK$62 million).
60
40
20
0
80
100
120Number of Days
Daily Distribution of Market Risk Revenue for 2010
0.0 and below
3
0.0 to 3.0
1
3.0 to 6.0
22
6.0 to 9.0
75
9.0 to 12.0
58
12.0 to 15.0
33
15.0 to 18.0
25
18.0 to 21.0
15
21.0 to 24.0
10
24.0 to 27.0
4
27.0 to 33.0
333.0 to 39.0
039.0 to 45.0
045.0 and above
0
Revenue (HK$m)
Daily Distribution of Market Risk Revenue for 2009
0.0 and below
15
0.0 to 3.0
3
3.0 to 6.0
19
6.0 to 9.0
61
9.0 to 12.0
46
12.0 to 15.0
34
15.0 to 18.0
19
18.0 to 21.0
17
21.0 to 24.0
5
24.0 to 27.0
8
27.0 to 33.0
8
33.0 to 39.0
11
39.0 to 45.0
2
45.0 and above
1
Revenue (HK$m)
60
40
20
0
80
100
120Number of Days
HANG SENG BANK218

61. FINANCIAL RISK MANAGEMENT (continued)
(c) Market risk (continued)
Back-testing of the Trading VAR model for interest rate and foreign exchange uses cleaned profits and losses from trading operations and
compares these to total trading VAR, foreign exchange and interest rate level VAR on a daily basis.
The trading VAR model back-testing with actual profit and loss involves tracking the trading VAR with the next day actual profit and loss.
It will be regarded as a loss side exception if actual loss exceeds loss side trading VAR.
A comparison of the Group trading VAR with the actual profits and losses related to trading positions during 2010 and 2009 are shown
in the table below.
15
0
-15
-30
-45
-60
30
45
60HK$m
A Comparison of Trading VAR with Actual Trading Profit and Loss for 2010
1 2 3 4 5 6 7 8 9 10 11 12
MonthActural trading profit and loss
Trading VAR
15
0
-15
-30
-45
-60
30
45
60HK$m
A Comparison of Trading VAR with Actual Trading Profit and Loss for 2009
1 2 3 4 5 6 7 8 9 10 11 12
MonthActural trading profit and loss
Trading VAR
ANNUAL REPORT 2010 219

NOTES TO THE FINANCIAL STATEMENTS
61. FINANCIAL RISK MANAGEMENT (continued)
(c) Market risk (continued)
Interest rate exposureInterest rate risks comprise those originating from treasury activities, both trading and non-trading portfolios which include structural
interest rate exposures. Treasury manages interest rate risks within the limits approved by the Risk Management Committee and under
the monitoring of both ALCO and Risk Management Committee.
TradingThe Group’s control of market risk is based on restricting individual operations to trading within VAR and underlying sensitivity limits
including foreign exchange position limits, present value of a basis point (“PVBP”) limits and option limits, and a list of permissible
instruments authorised by the Risk Management Committee, and enforcing rigorous new product approval procedures. In particular,
trading in the derivative products is supported by robust control systems whereas more complicated derivatives are mainly traded on
back-to-back basis. Analysis of VAR for trading portfolio is disclosed in “Value at Risk” section.
Non-tradingThe principal objective of market risk management of non-trading portfolios is to optimise net interest income. Interest rate risk in non-
trading portfolios arises principally from mismatches between the future yield on assets and their funding cost, as a result of interest
rate changes. Structural interest rate risk arises from the differing repricing characteristics of commercial banking assets and liabilities,
including non-interest bearing liabilities, such as shareholders’ funds and some current accounts.
Analysis of these risks is complicated by having to make assumptions on optionality in certain product areas, for example, mortgage
prepayments, and from behavioural assumptions regarding the economic duration of liabilities which are contractually repayable on
demand, for example, current accounts. The prospective change in future net interest income from non-trading portfolios will be reflected
in the current realisable value of these positions, should they be sold or closed prior to maturity. In order to manage this risk optimally,
market risk in non-trading portfolios and structural interest rate risks are transferred to Treasury or to separate books managed under the
supervision of the ALCO.
The transfer of market risk to books managed by Treasury or supervised by ALCO is usually achieved by a series of internal deals
between the business units and these books. When the behavioural characteristics of a product differ from its contractual characteristics,
the behavioural characteristics are assessed to determine the true underlying interest rate risk. ALCO regularly monitor all such behavioural
assumptions and interest rate risk positions, to ensure they comply with interest rate risk limits established by the Risk Management
Committee.
Net interest income
A principal part of the Group’s management of interest rate risk in non-trading portfolios is to monitor the sensitivity of projected net
interest income under varying interest rate scenarios (simulation modelling). The Group aims, through its management of market risk in
non-trading portfolios, to mitigate the impact of prospective interest rate movements which could reduce future net interest income, whilst
balancing the cost of such hedging activities on the current net revenue stream.
The table below sets out the impact on future net interest income of a 100 basis points parallel fall or rise in all-in yield curves at the
beginning of year from 1 January 2011 and 25 basis points parallel fall or rise in all-in yield curves at the beginning of each quarter during
the 12 month period from 1 January 2011.
Assuming no management actions, such a series of incremental parallel rises in all-in yield curves would increase planned net interest income
for the year to 31 December 2011 by HK$1,303 million for 100 basis points case and by HK$762 million for 25 basis points case, while
such a series of incremental parallel falls in all-in yield curves would decrease planned net interest income by HK$1,706 million for 100 basis
points case and by HK$1,280 million for 25 basis points case. These figures incorporate the impact of any option features in the underlying
exposures and takes into account the change in pricing of retail products relative to change in market interest rates.
HANG SENG BANK220

61. FINANCIAL RISK MANAGEMENT (continued)
(c) Market risk (continued)
Projected Net Interest Income
The sensitivity of projected net interest income is described as follows:
100bpparallel
increase
100bpparallel
decrease
25bpincrease
at thebeginning
of eachquarter
25bpdecrease
at thebeginning
of eachquarter
Change in 2011 projected net interest income
– HKD 861 (1,113) 562 (963)
– US$ 309 (447) 113 (262)
– other 133 (146) 87 (55)
Total 1,303 (1,706) 762 (1,280)
Change in 2010 projected net interest income
– HKD 1,737 (1,949) 993 (1,426)
– US$ 214 (95) 72 143
– other 235 (116) 123 29
Total 2,186 (2,160) 1,188 (1,254)
The interest rate sensitivities set out in the table above are illustrative only and are based on simplified scenarios. The figures represent the
effect of the pro forma movements in net interest income based on the projected yield curve scenarios and the Group’s current interest
rate risk profile. This effect, however, does not incorporate actions that would be taken by Treasury or in the business units to mitigate the
impact of this interest rate risk. In reality, Treasury seeks proactively to change the interest rate risk profile to minimise losses and optimise
net revenues. The projections above also assume that interest rates of all maturities move by the same amount and, therefore, do not
reflect the potential impact on net interest income of some rates changing while others remain unchanged. The projections also make
other simplifying assumptions, including that all positions run to maturity.
It can be seen from the above that projecting the movement in net interest income from prospective changes in interest rates is a
complex interaction of structural and managed exposures. In a rising rate environment, the most critical exposures are those managed
within Treasury.
ANNUAL REPORT 2010 221

NOTES TO THE FINANCIAL STATEMENTS
61. FINANCIAL RISK MANAGEMENT (continued)
(c) Market risk (continued)
Sensitivity of reserves
The Group monitors the sensitivity of reported reserves to interest rate movements on a monthly basis by assessing the expected
reduction in valuation of available-for-sale portfolios and cash flow hedges due to parallel movements of plus or minus 100 basis points
in all-in yield curves. The table below describes the sensitivity to these movements at the balance sheet dates indicated below and the
maximum and minimum month figures during the year then ended:
At 31 December
2010Maximum
impactMinimum
impact
+ 100 basis points parallel move in all-in yield curves (803) (1,173) (803)
As a percentage of shareholders’ funds at 31 December 2010 (%) (1.1) (1.7) (1.1)
– 100 basis points parallel move in all-in yield curves 264 303 174
As a percentage of shareholders’ funds at 31 December 2010 (%) 0.4 0.4 0.2
At 31 December
2009Maximum
impactMinimum
impact
+ 100 basis points parallel move in all-in yield curves (975) (996) (729)
As a percentage of shareholders’ funds at 31 December 2009 (%) (1.7) (1.7) (1.3)
– 100 basis points parallel move in all-in yield curves 975 996 729
As a percentage of shareholders’ funds at 31 December 2009 (%) 1.7 1.7 1.3
The sensitivities included in the table are illustrative only and are based on simplified scenarios. Moreover, the table shows only those
interest rate risk exposures arising in available-for-sale portfolios and from cash flow hedges. These particular exposures form only a part
of the Group’s overall interest rate exposures.
Foreign exchange exposureThe Group’s foreign exchange exposures mainly comprise foreign exchange dealing by Treasury and currency exposures originated
by its banking business. The latter are transferred to Treasury where they are centrally managed within foreign exchange position limits
approved by the Risk Management Committee. Net option position is calculated on the basis of delta-weighted positions of all foreign
exchange options contract. Structural foreign exchange positions arising from capital investments in associate, subsidiaries and branches
outside Hong Kong, mainly in US dollar and Chinese renminbi as set out below, are managed by ALCO.
At 31 December 2010, the US dollar (“US$”), Chinese renminbi (“RMB”), Pound Sterling (“GBP”), Japanese Yen (“JPY”), Euro (“EUR”),
Canadian dollar (“CAD”), Swiss Francs (“CHF”), Australian dollar (“AUD”), New Zealand dollar (“NZD”) and Gold (“GOL”) were the currencies
in which the Group had non-structural foreign currency positions that were not less than 10 per cent of the total net position in all foreign
currencies. The Group also had a US$ and RMB structural foreign currency position, which was not less than 10 percent of the total net
structural position in all foreign currencies.
HANG SENG BANK222

61. FINANCIAL RISK MANAGEMENT (continued)
(c) Market risk (continued)
Foreign exchange exposure (continued)
The tables below summarise the net structural and non-structural foreign currency positions of the Group and the Bank.
Group
uS$ RMB GBP JPY EuR CAD CHF AuD NZD GOL
Other foreign
currencies
Totalforeign
currencies
2010
Non-structural position
Spot assets 246,638 93,067 13,026 8,985 11,068 13,933 191 43,643 9,017 2,169 974 442,711
Spot liabilities (155,377) (88,666) (15,470) (1,912) (12,393) (14,882) (549) (41,953) (11,658) (3,404) (3,034) (349,298)
Forward purchases 228,982 72,661 7,130 8,932 3,735 2,431 1,347 8,340 3,909 2,919 3,423 343,809
Forward sales (319,494) (77,799) (4,810) (16,151) (2,497) (1,449) (964) (9,885) (1,341) (1,559) (1,359) (437,308)
Net options position 133 (41) – (5) (55) (7) – (71) 60 – – 14
Net long/(short) non-structural position 882 (778) (124) (151) (142) 26 25 74 (13) 125 4 (72)
Structural position 206 20,124 – – – – – – – – 238 20,568
2009
Non-structural position
Spot assets 214,379 41,638 16,344 48,843 15,423 14,474 124 39,757 7,360 816 451 399,609
Spot liabilities (164,511) (41,564) (15,527) (1,694) (12,292) (14,412) (591) (47,508) (14,807) (2,387) (826) (316,119)
Forward purchases 169,349 29,483 2,215 3,728 6,885 1,607 832 14,293 9,586 2,430 764 241,172
Forward sales (219,453) (29,603) (2,995) (50,915) (10,103) (1,680) (371) (6,532) (2,083) (851) (490) (325,076)
Net options position (4) – – 1 (1) (4) 2 7 2 – – 3
Net (short)/long non-structural position (240) (46) 37 (37) (88) (15) (4) 17 58 8 (101) (411)
Structural position 285 14,550 – – – – – – – – 287 15,122
Bank
uS$ RMB GBP JPY EuR CAD CHF AuD NZD GOL
Other foreign
currencies
Totalforeign
currencies
2010
Non-structural position
Spot assets 203,809 41,067 7,591 8,883 8,411 7,568 129 23,618 5,993 2,169 864 310,102
Spot liabilities (117,702) (36,296) (10,022) (1,840) (9,529) (8,463) (504) (20,171) (8,544) (3,404) (2,924) (219,399)
Forward purchases 205,281 59,923 7,130 8,695 3,550 2,377 1,347 6,433 3,813 2,919 3,423 304,891
Forward sales (292,023) (64,330) (4,762) (15,805) (2,467) (1,449) (948) (9,782) (1,341) (1,559) (1,359) (395,825)
Net options position 133 (41) – (5) (55) (7) – (71) 60 – – 14
Net (short)/long non-structural position (502) 323 (63) (72) (90) 26 24 27 (19) 125 4 (217)
Structural position 206 20,124 – – – – – – – – 238 20,568
2009
Non-structural position
Spot assets 178,264 13,820 9,948 48,728 12,397 8,452 84 20,526 4,225 816 378 297,638
Spot liabilities (130,310) (12,730) (9,127) (1,661) (9,220) (8,389) (551) (27,941) (11,616) (2,387) (751) (214,683)
Forward purchases 165,452 27,274 2,188 3,640 6,815 1,607 832 13,944 9,530 2,430 764 234,476
Forward sales (215,240) (27,146) (2,971) (50,738) (10,078) (1,680) (371) (6,527) (2,083) (851) (490) (318,175)
Net options position (4) – – 1 (1) (4) 2 7 2 – – 3
Net (short)/long non-structural position (1,838) 1,218 38 (30) (87) (14) (4) 9 58 8 (99) (741)
Structural position 285 14,550 – – – – – – – – 287 15,122
ANNUAL REPORT 2010 223

NOTES TO THE FINANCIAL STATEMENTS
61. FINANCIAL RISK MANAGEMENT (continued)
(c) Market risk (continued)
Equities exposureThe Group’s equities exposures in 2010 and 2009 are mainly in long-term equity investments which are reported as “Financial investments”
set out in note 36. Equities held for trading purpose are included under “Trading assets” set out in note 32. These are subject to trading
limit and risk management control procedures and other market risk regime.
(d) Insurance riskRisk management objectives and policies for management of insurance riskThrough its insurance subsidiaries, the Group offers comprehensive insurance products, including life and non-life insurance, to both
personal and commercial customers. These insurance operating subsidiaries are subject to the supervision of the Office of the Commissioner
of Insurance (“OCI”) and are required to observe the relevant compliance requirements stipulated by the Insurance Commissioner.
The Group is exposed to the uncertainty surrounding the timing and severity of insurance claims under its insurance contracts. The Group
also has exposure to market risk through its insurance and investment activities.
The Group manages its insurance risk through underwriting limits, approval procedures for transactions that involve new products or that
exceed set limits, risk diversification, pricing guidelines, reinsurance and monitoring of emerging issues.
The Group uses several methods to assess and monitor insurance risk exposures both for individual types of risks insured and overall
risks. These methods include internal risk measurement models, sensitivity analyses, scenario analyses and stress testing.
The theory of probability is applied to the pricing and provisioning for a portfolio of insurance contracts. The principal risk is that the
frequency and severity of claims is greater than expected. Insurance events are, by their nature, random, and the actual number and size
of events during any one year may vary from those estimated using established statistical techniques.
Asset/liability managementThe Group actively manages its assets using an approach that considers asset quality, risk profile, diversification, asset/liability matching,
liquidity, volatility and target investment return. The goal of the investment process is to achieve the target level of investment return with
minimum volatility. The Market and Liquidity Risk Committee of the Group’s insurance subsidiaries review and approve target portfolios
on a periodic basis, establishes investment guidelines and limits, while Asset and Liability Management Committee provides oversight of
the asset/liability management process.
The Group establishes target asset portfolios for each major insurance product category according to specific product requirements
and local regulatory requirement. The investment strategy and asset allocations consider yield, duration, sensitivity, market risk, volatility,
liquidity, asset concentration, foreign exchange and credit quality. The estimates and assumptions used in determining the approximate
amounts and timing of payments to or on behalf of policyholders for insurance liabilities are regularly re-evaluated. Many of these
estimates and assumptions are inherently subjective and could impact the Group’s ability to achieve its asset/liability management goals
and objectives.
HANG SENG BANK224

61. FINANCIAL RISK MANAGEMENT (continued)
(d) Insurance risk (continued)
The following table shows the composition of assets and liabilities for each major insurance product category.
Balance sheet of insurance subsidiaries by type of contract
Lifelinked
contracts1
Lifenon-linkedcontracts2
Non-lifeinsurance3
Otherassets4 Total
2010
Financial assets:
– financial assets designated at fair value 237 6,586 – 142 6,965
– derivatives – 161 – – 161
– financial investments – 53,591 – 3,339 56,930
– other financial assets 125 3,270 421 657 4,473
Total financial assets 362 63,608 421 4,138 68,529
Reinsurance assets – 35 103 21 159
Present value of in-force long-term insurance contracts – – – 4,593 4,593
Other assets – 729 11 706 1,446
Total assets 362 64,372 535 9,458 74,727
Liabilities under investment contracts designated at fair value 136 321 – – 457
Liabilities under insurance contracts 226 63,722 477 – 64,425
Deferred tax – – – 733 733
Other liabilities – – 19 125 144
Total liabilities 362 64,043 496 858 65,759
Shareholders’ equity – – – 8,968 8,968
Total liabilities and shareholders’ equity 362 64,043 496 9,826 74,727
2009
Financial assets:
– financial assets designated at fair value 217 4,441 – 616 5,274
– derivatives – 78 – – 78
– financial investments – 46,791 – 2,329 49,120
– other financial assets 130 2,340 474 777 3,721
Total financial assets 347 53,650 474 3,722 58,193
Reinsurance assets – 17 81 23 121
Present value of in-force long-term insurance contracts – – – 3,466 3,466
Other assets – 607 7 713 1,327
Total assets 347 54,274 562 7,924 63,107
Liabilities under investment contracts designated at fair value 121 332 – – 453
Liabilities under insurance contracts 224 53,588 428 – 54,240
Deferred tax – – – 533 533
Other liabilities – – – 225 225
Total liabilities 345 53,920 428 758 55,451
Shareholders’ equity – – – 7,656 7,656
Total liabilities and shareholders’ equity 345 53,920 428 8,414 63,107
1 Comprises life linked insurance contracts and linked investment contracts
2 Comprises life non-linked insurance contracts and non-linked investment contracts
3 Comprises non-life insurance contracts
4 Comprises shareholder assets
ANNUAL REPORT 2010 225

NOTES TO THE FINANCIAL STATEMENTS
61. FINANCIAL RISK MANAGEMENT (continued)
(d) Insurance risk (continued)
Underwriting strategyThe Group’s underwriting strategy seeks diversity to ensure a balanced portfolio and is based on a large portfolio of similar risks over a
number of years and, as such, it is believed that this reduces the variability of the outcome.
Reinsurance strategyThe Group reinsures a portion of the insurance risks it underwrites in order to control its exposures to losses and protect capital resources.
These reinsurance agreements transfer part of the risk and limit the exposure from each life insured. The amount of each risk retained
depends on the Group’s evaluation of the specific risk, subject in certain circumstances, to maximum limits based on characteristics of
coverage. Under the terms of the reinsurance agreements, the reinsurer agrees to reimburse the ceded amount in the event the claim is
paid. However, the Group remains liable to its policyholders with respect to ceded insurance if any reinsurer fails to meet the obligations
it assumes. The Group buys a combination of proportionate and non-proportionate reinsurance to reduce the retained sum assured so
that it falls within specified insurance risk appetite. The Group uses non-affiliated reinsurers to control its exposure to losses resulting from
certain catastrophes.
Nature of risks coveredThe following gives an assessment of the nature of risks inherent in the Group’s main products.
(i) Long-term insurance contracts – non-linked productsThe basic feature of long-term non-linked insurance business is to provide guaranteed death benefit determined at the time of policy
issue. For non-linked insurance products with a savings element, guaranteed surrender benefit, guaranteed maturity benefit, crediting
rate guarantees and/or non-lapse guarantee features are usually provided. Discretionary participating features allow policyholders to
participate in the profits of the life fund by means of annual bonus. The Group has complete contractual discretion on the bonuses
declared. In practice the Group considers policyholders’ reasonable expectations when setting bonus levels. It is the Group’s intention
to maintain a smooth dividend scale based on the long-term rate of return. Annual reviews are performed to confirm whether the current
dividend scale is supportable taken into account the overall experience on investments, claims, operating expenses and lapses.
(ii) Long-term insurance contracts – linked productsThe Group writes linked life insurance policies, which typically provide policyholders with life insurance protection and investment in a
variety of funds. Premiums received are deposited into the chosen funds after deduction of premium fees. Other charges for the cost of
insurance and administration are deducted from the funds accumulated.
(iii) Long-term investment contracts – non-linked return guaranteed productsThe Group underwrites retirement fund business which gives rise to contracts that are classified as investment contracts. Under each
retirement scheme, employers and employees are given a choice of funds to place their contributions, on which the Group provides an
investment return guarantees for some specific funds. The guarantee risks are managed through investment in good quality fixed rate
bonds. Investment strategy is set with the objective of providing return that is sufficient to meet at least the minimum guarantee.
(iv) Long-term investment contracts – linked productsThe Group underwrites retirement fund business which gives rise to contracts that are classified as investment contracts. Under each
retirement scheme, employers and employees are given a choice of funds to place their contributions, on which the Group does not bear
investment risk for most of the funds. Although scheme members bear the market risk on the funds, the Group must manage the scheme
members’ exposure to market risk in a manner consistent with any parameters set out in the policy documents.
(v) Non-life insurance contractsThe Group assumes the risk of loss from persons and organisations that are directly subject to the risk. Such risk may relate to property,
liability, life, accident, health, financial or other perils that may arise from an insurable event. The Group manages the risks through
underwriting limits, approval procedures for transactions that involve new products or that exceed set authority limits, risk diversification,
underwriting guidelines, reinsurance and centralised management of reinsurance and monitoring of emerging issues. The Group also
assesses and monitors insurance risk exposures both for individual types of risks insured and overall risks.
HANG SENG BANK226
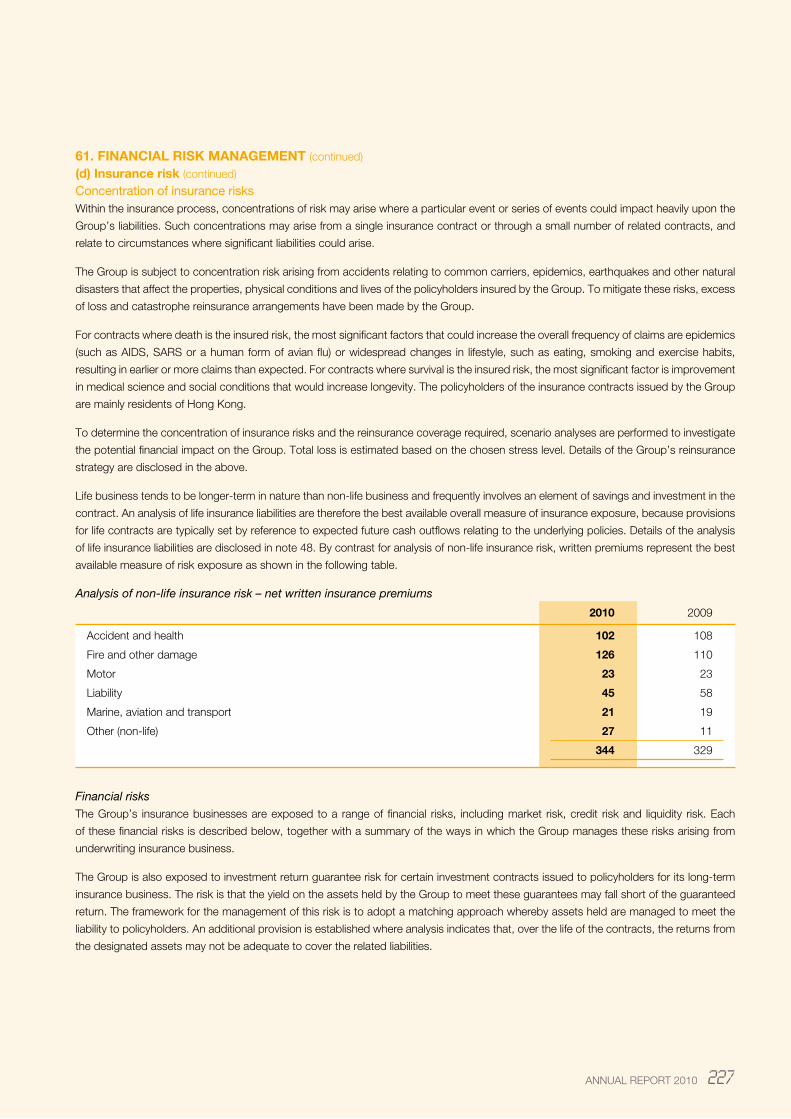
61. FINANCIAL RISK MANAGEMENT (continued)
(d) Insurance risk (continued)
Concentration of insurance risksWithin the insurance process, concentrations of risk may arise where a particular event or series of events could impact heavily upon the
Group’s liabilities. Such concentrations may arise from a single insurance contract or through a small number of related contracts, and
relate to circumstances where significant liabilities could arise.
The Group is subject to concentration risk arising from accidents relating to common carriers, epidemics, earthquakes and other natural
disasters that affect the properties, physical conditions and lives of the policyholders insured by the Group. To mitigate these risks, excess
of loss and catastrophe reinsurance arrangements have been made by the Group.
For contracts where death is the insured risk, the most significant factors that could increase the overall frequency of claims are epidemics
(such as AIDS, SARS or a human form of avian flu) or widespread changes in lifestyle, such as eating, smoking and exercise habits,
resulting in earlier or more claims than expected. For contracts where survival is the insured risk, the most significant factor is improvement
in medical science and social conditions that would increase longevity. The policyholders of the insurance contracts issued by the Group
are mainly residents of Hong Kong.
To determine the concentration of insurance risks and the reinsurance coverage required, scenario analyses are performed to investigate
the potential financial impact on the Group. Total loss is estimated based on the chosen stress level. Details of the Group’s reinsurance
strategy are disclosed in the above.
Life business tends to be longer-term in nature than non-life business and frequently involves an element of savings and investment in the
contract. An analysis of life insurance liabilities are therefore the best available overall measure of insurance exposure, because provisions
for life contracts are typically set by reference to expected future cash outflows relating to the underlying policies. Details of the analysis
of life insurance liabilities are disclosed in note 48. By contrast for analysis of non-life insurance risk, written premiums represent the best
available measure of risk exposure as shown in the following table.
Analysis of non-life insurance risk – net written insurance premiums
2010 2009
Accident and health 102 108
Fire and other damage 126 110
Motor 23 23
Liability 45 58
Marine, aviation and transport 21 19
Other (non-life) 27 11
344 329
Financial risksThe Group’s insurance businesses are exposed to a range of financial risks, including market risk, credit risk and liquidity risk. Each
of these financial risks is described below, together with a summary of the ways in which the Group manages these risks arising from
underwriting insurance business.
The Group is also exposed to investment return guarantee risk for certain investment contracts issued to policyholders for its long-term
insurance business. The risk is that the yield on the assets held by the Group to meet these guarantees may fall short of the guaranteed
return. The framework for the management of this risk is to adopt a matching approach whereby assets held are managed to meet the
liability to policyholders. An additional provision is established where analysis indicates that, over the life of the contracts, the returns from
the designated assets may not be adequate to cover the related liabilities.
ANNUAL REPORT 2010 227

NOTES TO THE FINANCIAL STATEMENTS
61. FINANCIAL RISK MANAGEMENT (continued)
(d) Insurance risk (continued)
The following table analyses the assets held in the Group’s insurance underwriting subsidiaries at balance sheet dates by type of liability,
and provides a view of the exposure to financial risk:
Financial assets held by insurance operations
Group
Lifelinked
contracts
Lifenon-linkedcontracts
Non-lifeinsurance
Otherassets Total
2010
Financial assets designated at fair value:
– debt securities – 4,150 – 142 4,292
– equity securities 237 2,436 – – 2,673
237 6,586 – 142 6,965
Financial investments
Held-to-maturity:
– debt securities – 53,591 – 2,710 56,301
– 53,591 – 2,710 56,301
Available-for-sale:
– debt securities – – – 616 616
– equity securities – – – 13 13
– – – 629 629
Derivatives – 161 – – 161
Other financial assets 125 3,270 421 657 4,473
362 63,608 421 4,138 68,529
Group
Lifelinked
contracts
Lifenon-linkedcontracts
Non-lifeinsurance
Otherassets Total
2009
Financial assets designated at fair value:
– debt securities – 4,136 – 616 4,752
– equity securities 217 305 – – 522
217 4,441 – 616 5,274
Financial investments
Held-to-maturity:
– debt securities – 46,791 – 1,878 48,669
– 46,791 – 1,878 48,669
Available-for-sale:
– debt securities – – – 445 445
– equity securities – – – 6 6
– – – 451 451
Derivatives – 78 – – 78
Other financial assets 130 2,340 474 777 3,721
347 53,650 474 3,722 58,193
HANG SENG BANK228

61. FINANCIAL RISK MANAGEMENT (continued)
(d) Insurance risk (continued)
The table demonstrates that for linked contracts, the Group typically designates assets at fair value. For non-linked contracts,
the classification of the assets is driven by the nature of the underlying contract. The assets held to support life linked liabilities represented
0.5% of the total financial assets of the Group’s insurance manufacturing subsidiaries at the end of 2010 (2009: 0.6%). The table also
shows that approximately 89.3% of financial assets was invested in debt securities at 31 December 2010 (2009: 92.6%) with 3.9%
(2009: 0.9%) invested in equity securities.
Market riskMarket risk can be described as the risk of change in fair value of a financial instrument due to change in interest rate, equity prices and
foreign currency rates. Each of these categories is discussed further below.
Interest rate risk
The insurance subsidiaries of the Group’s exposure to interest rate risk arises mainly from its debt securities holdings. The held-to-maturity
debt securities accounts for a significant portion of the debt securities holding which is managed to match expected liability payments. The
Group monitors this exposure through periodic reviews of its asset and liability positions. Estimates of cash flows, as well as the impact
of interest rate fluctuations relating to the investment portfolio and insurance reserves, are modelled and reviewed regularly. The overall
objective of these strategies is to limit the net changes in the value of assets and liabilities arising from interest rate movements.
For participating products, interest rate risk related to non-linked policies can also be mitigated through sharing of risk with policyholders
under the discretionary participation feature.
An immediate and permanent movement in interest yield curves as at 31 December 2010 in all territories in which the Group’s insurance
subsidiaries operate would have the following impact on the profit for the year and net assets at that date:
2010 2009
Impact onprofit forthe year
Impact onnet assets
Impact onprofit forthe year
Impact onnet assets
+ 100 basis points shift in yield curves 239 229 205 197
– 100 basis points shift in yield curves (161) (151) (128) (120)
The interest rate sensitivities set out above are illustrative only and employ simplified scenarios. It should be noted that the effects may not
be linear and therefore the results cannot be extrapolated. The sensitivities do not incorporate actions that could be taken by management
to mitigate the effect of the interest rate movements, nor do they take into account of any resultant changes in policyholder behaviour.
Equity risk
The portfolio of private equity securities, which the insurance subsidiaries of the Group carries on the balance sheet at fair value, has
exposure to price risk. This risk is defined as the potential loss in market value resulting from an adverse change in prices. The risk is
mainly mitigated through dynamic asset allocation and sharing the risk with policyholders through the discretionary participation feature.
The Group’s objective is to earn competitive relative returns by investing in a diversified portfolio of high quality, liquid securities. Portfolio
characteristics are analysed regularly and equity price risk is regularly reviewed. The Group’s investment portfolios are diversified across
countries and industries, and concentrations in any one company or industry are limited by parameters established by senior management,
as well as by statutory requirements.
ANNUAL REPORT 2010 229

NOTES TO THE FINANCIAL STATEMENTS
61. FINANCIAL RISK MANAGEMENT (continued)
(d) Insurance risk (continued)
The following table illustrates the impact on the aggregated profit for the year and net assets of a reasonably possible 10 per cent variance
in equity prices:
2010 2009
Impact onprofit forthe year
Impact onnet assets
Impact onprofit forthe year
Impact onnet assets
10 per cent increase in equity prices 205 205 26 26
10 per cent decrease in equity prices (205) (205) (26) (26)
These equity sensitivities are illustrative only and employ simplified scenarios. It should be noted that the effects may not be linear and
therefore the results cannot be extrapolated. They do not allow for the effect of management actions which may mitigate the equity price
decline, nor for any resultant changes, such as in policyholder behaviour, that might accompany such a fall.
Foreign currency risk
Substantial amounts of the assets and liabilities are denominated in two main currencies, United States dollar and Hong Kong dollar. The
Group adopts a policy of predominately matching the assets with liabilities in the same currency, effectively reducing the foreign currency
exchange rate exposure. Limits are set to ensure that the net foreign currency exposure is kept to an acceptable level. The Group uses
forward exchange contracts to manage its foreign currency risk.
Credit riskThe insurance subsidiaries of the Group’s portfolio of debt securities, and to a lesser extent short-term and other investments are subject
to credit risk. This risk is defined as the potential loss in market value resulting from adverse changes in a borrower’s ability to repay the
debt. The Group’s objective is to earn competitive relative returns by investing in a diversified portfolio of securities. Management has a
credit policy in place. Limits are established to manage credit quality and concentration risk. The following table presents the analysis of
treasury bills, other eligible bills and debt securities within the Group’s insurance operations.
HANG SENG BANK230

61. FINANCIAL RISK MANAGEMENT (continued)
(d) Insurance risk (continued)
Treasury bills, other eligible bills and debt securities in insurance operations
Neither past due nor impairedPast
due not impaired Impaired
Impairment allowances TotalStrong Medium
Sub-standard
2010
Supporting liabilities under non-linked insurance and investment contracts
Financial assets designated at fair value:
– treasury and other eligible bills – – – – – – –
– debt securities 4,148 2 – – – – 4,150
4,148 2 – – – – 4,150
Financial investments:
– treasury and other similar bills – – – – – – –
– debt securities 52,271 1,320 – – – – 53,591
52,271 1,320 – – – – 53,591
Supporting shareholders funds
Financial assets designated at fair value:
– treasury and other eligible bills – – – – – – –
– debt securities 142 – – – – – 142
142 – – – – – 142
Financial investments:
– treasury and other similar bills – – – – – – –
– debt securities 3,282 44 – – – – 3,326
3,282 44 – – – – 3,326
Total
Financial assets designated at fair value:
– treasury and other eligible bills – – – – – – –
– debt securities 4,290 2 – – – – 4,292
4,290 2 – – – – 4,292
Financial investments:
– treasury and other similar bills – – – – – – –
– debt securities 55,553 1,364 – – – – 56,917
55,553 1,364 – – – – 56,917
ANNUAL REPORT 2010 231

NOTES TO THE FINANCIAL STATEMENTS
61. FINANCIAL RISK MANAGEMENT (continued)
(d) Insurance risk (continued)
Neither past due nor impairedPast
due not impaired Impaired
Impairment allowances TotalStrong Medium
Sub-standard
2009
Supporting liabilities under non-linked insurance and investment contracts
Financial assets designated at fair value:
– treasury and other eligible bills – – – – – – –
– debt securities 4,051 85 – – – – 4,136
4,051 85 – – – – 4,136
Financial investments:
– treasury and other similar bills – – – – – – –
– debt securities 46,239 552 – – – – 46,791
46,239 552 – – – – 46,791
Supporting shareholders funds
Financial assets designated at fair value:
– treasury and other eligible bills – – – – – – –
– debt securities 616 – – – – – 616
616 – – – – – 616
Financial investments:
– treasury and other similar bills – – – – – – –
– debt securities 2,323 – – – – – 2,323
2,323 – – – – – 2,323
Total
Financial assets designated at fair value:
– treasury and other eligible bills – – – – – – –
– debt securities 4,667 85 – – – – 4,752
4,667 85 – – – – 4,752
Financial investments:
– treasury and other similar bills – – – – – – –
– debt securities 48,562 552 – – – – 49,114
48,562 552 – – – – 49,114
HANG SENG BANK232

61. FINANCIAL RISK MANAGEMENT (continued)
(d) Insurance risk (continued)
The Group also has insurance and other receivable amounts subject to credit risk. The most significant of these are reinsurance recoveries.
To mitigate the risk of the counterparties not paying the amounts due, the Group has established certain business and financial guidelines
for reinsurer approval, incorporating ratings by major agencies and considering currently available market information. The Group also
periodically reviews the financial stability of reinsurers and the settlement trend of amount due from reinsurers. The split of liabilities ceded
to reinsurers and outstanding reinsurance recoveries was as follows:
Reinsurers’ share of liabilities under insurance contracts
Neither past due nor impairedPast
due not impaired Impaired
Impairment allowances TotalStrong Medium
Sub-standard
2010
Linked insurance contracts – – – – – – –
Non-linked insurance contracts 108 30 – – – – 138
Total 108 30 – – – – 138
Reinsurance Debtors 7 3 – 11 – – 21
2009
Linked insurance contracts – – – – – – –
Non-linked insurance contracts 82 16 – – – – 98
Total 82 16 – – – – 98
Reinsurance Debtors 7 2 – 13 – – 22
Liquidity riskThe Group has to meet daily calls on its cash resources, notably from claims arising on its insurance and investment contracts and early
surrender of policies for surrender value. There is therefore a risk that cash will not be available to settle liabilities when due at a reasonable
cost. The Group manages this risk by monitoring and setting an appropriate level of operating funds to settle these liabilities. Investment
portfolios are also structured with regard to the liquidity requirement of each underlying fund, and early surrender penalties and market
adjustment clauses are used to defray costs of unexpected cash requirements.
The following table shows the expected maturity of insurance contract liabilities at balance sheet dates:
Expected maturity of insurance contract liabilities
Expected cash flows (undiscounted)
Within1 year
Over 1 yearbut within
5 years
Over 5 yearsbut within
15 yearsOver 15
years Total
2010
Non-life insurance 266 187 43 – 496
Life insurance (non-linked) 5,281 29,418 61,674 35,696 132,069
Life insurance (linked) 27 177 149 892 1,245
5,574 29,782 61,866 36,588 133,810
2009
Non-life insurance 249 160 33 – 442
Life insurance (non-linked) 3,985 26,231 56,760 32,549 119,525
Life insurance (linked) 28 183 158 973 1,342
4,262 26,574 56,951 33,522 121,309
ANNUAL REPORT 2010 233

NOTES TO THE FINANCIAL STATEMENTS
61. FINANCIAL RISK MANAGEMENT (continued)
(d) Insurance risk (continued)
Remaining contractual maturity of investment contract liabilities
Liabilities under investment contracts by insurance underwriting subsidiaries
Linkedinvestment
contracts
Non-linkedinvestment
contracts
Investmentcontractswith DPF Total
2010
Remaining contractual maturity:
– due within 1 year 2 – – 2
– due over 1 year but within 5 years – – – –
– due over 5 years but within 10 years – – – –
– due over 10 years – – – –
– undated 134 321 – 455
136 321 – 457
2009
Remaining contractual maturity:
– due within 1 year 2 – – 2
– due over 1 year but within 5 years – – – –
– due over 5 years but within 10 years – – – –
– due over 10 years – – – –
– undated 119 332 – 451
121 332 – 453
Present value of in-force long-term insurance business (“PVIF”)
The Group’s life insurance business is accounted for using the embedded value approach, which, inter alia, provides a comprehensive
framework for the evaluation of insurance and related risks. The value of the PVIF asset at 31 December 2010 was HK$4,593 million
(2009: HK$3,466 million). The present value of the shareholders’ interest in the profits expected to emerge from the book of in-force
policies at balance sheet dates can be stress-tested to assess the sensitivity of the value of life business to adverse movement of different
risk factors.
The following table shows the effect on the PVIF at balance sheet dates of reasonably possible changes in the main economic and
business assumptions:
2010 2009
+ 100 basis points shift in risk-free rate 635 548
– 100 basis points shift in risk-free rate (494) (375)
+ 100 basis points shift in risk discount rate (196) (181)
– 100 basis points shift in risk discount rate 220 204
+ 100 basis points shift in expenses inflation (18) (15)
– 100 basis points shift in expenses inflation 16 13
+ 100 basis points shift in lapse rate 824 853
– 100 basis points shift in lapse rate (769) (817)
HANG SENG BANK234

61. FINANCIAL RISK MANAGEMENT (continued)
(d) Insurance risk (continued)
The effects on PVIF shown above are illustrative only and employ simplified scenarios. The effects are calculated with taking into
account the sharing of investment returns with policyholders through the discretionary participation feature. Other than that, they do not
incorporate other actions that could be taken by management to mitigate effects nor do they take into account of consequential changes
in policyholder behaviour.
Non-economic assumptions
The sensitivity of profit for the year and net assets to reasonably possible changes in assumptions used in respect of insurance businesses
is as follows:
Impact on 2010 results Impact on 2009 results
Profit forthe year Net assets
Profit forthe year Net assets
20 per cent increase in claims costs (12) (12) (24) (24)
20 per cent decrease in claims costs 12 12 24 24
10 per cent increase in mortality and/or morbidity rates (27) (27) (22) (22)
10 per cent decrease in mortality and/or morbidity rates 27 27 21 21
50 per cent increase in lapse rates 520 520 535 535
50 per cent decrease in lapse rates (531) (531) (549) (549)
10 per cent increase in expense rates (40) (40) (36) (36)
10 per cent decrease in expense rates 40 40 36 36
(e) Operational riskOperational risk is the risk of loss arising through fraud, unauthorised activities, error, omission, inefficiency, system failure or from external
events. It is inherent to every business organisation and covers a wide spectrum of issues.
The Group manages its operational risk through a controls-based environment in which the processes and controls are documented,
authorisation is independent and transactions are reconciled and monitored. This is supported by periodic independent review of the
internal control systems by internal audit, and by monitoring external operational risk events, which ensure that the Group stays in line with
industry best practice and takes account of lessons learned from publicised operational failures within the financial services industry.
The Group has codified its operational risk management process by issuing a high level standard, supplemented by more detailed formal
guidance. This explains how the Group manages operational risk by identifying, assessing, monitoring, controlling and mitigating the risk,
rectifying operational risk events, and implementing any additional procedures required for compliance with local regulatory requirements.
The standard covers the following:
– operational risk management responsibility is assigned to senior management within the business operation;
– information systems are used to record the identification and assessment of operational risks and to generate appropriate, regular
management reporting;
– assessments are undertaken of the operational risks facing each business and the risks inherent in its processes, activities and
products. Risk assessment incorporates a regular review of identified risks to monitor significant changes;
– operational risk loss data is collected and reported to senior management. Aggregate operational risk losses are recorded and details
of incidents above a materiality threshold are reported to the Group’s Audit Committee; and
– risk mitigation, including insurance is considered where this is cost-effective.
ANNUAL REPORT 2010 235

NOTES TO THE FINANCIAL STATEMENTS
61. FINANCIAL RISK MANAGEMENT (continued)
(e) Operational risk (continued)
The Group maintains and tests contingency facilities to support operations in the event of disasters.
Additional reviews and tests are conducted in the event that any Group’s office is affected by a business disruption event, to incorporate
lessons learned in the operational recovery from those circumstances. Plans have been prepared for the continued operation of the
Group’s business, with reduced staffing levels, should a flu pandemic occur.
Operational risk is mitigated by adequate insurance coverage on assets and business losses. To reduce the impact and interruptions
to business activities caused by system failure or natural disaster, back-up systems and contingency business resumption plans are in
place for all business and critical operations functions. Operational risk management is coordinated by the Chief Technology and Services
Officer and monitored by the Operational Risk Management Committee.
(f) Capital managementThe Group’s objective for managing capital is to maintain a strong capital base to support the development of its business and to meet
regulatory capital requirements at all times. The Group recognises the impact on shareholder returns of the level of equity capital employed
within the Group and seeks to maintain a prudent balance between the advantages and flexibility afforded by a strong capital position and
the higher returns on equity possible with greater leverage.
An annual Group capital plan is prepared and approved by the Board with the objective of maintaining both the optimal amount of capital
and the mix between the different components of capital. The Group manages its own capital within the context of the approved annual
Group capital plan, which determines levels of risk-weighted asset growth and the optimal amount and mix of capital required to support
planned business growth. As part of the Group’s capital management policy, subsidiary with capital generated in excess of planned
requirement will return to the Bank, normally by way of dividends. The Group also raised its subordinated debt in accordance with HSBC
Group’s guidelines regarding market and investor concentration, cost, market conditions, timing and maturity profile.
The Bank is primarily a provider of equity capital to its subsidiaries. These investments are substantially funded by the Bank’s own capital
issuance and profit retentions. The Bank seeks to maintain a prudent balance between the composition of its capital and that of its
investment in subsidiaries.
The principal forms of capital are included in the following balances on the consolidated balance sheet: called up share capital, retained
profits, other reserves and subordinated liabilities. Capital also includes the collective impairment allowances held in respect of loans and
advances and the regulatory reserve.
Externally imposed capital requirements:The Hong Kong Monetary Authority supervises the Group on a consolidated and solo-consolidated basis and, as such, receives information
on the capital adequacy of, and set capital requirements for, the Group as a whole. Individual banking subsidiaries are directly regulated
by their local banking supervisors, who set and monitor their capital adequacy requirements. Certain non-banking financial subsidiaries
are also subject to the supervision and capital requirements of local regulatory authorities.
The Basel Committee on Banking Supervision has published a new capital adequacy framework, known as “Basel II”, for calculating
minimum capital requirements. With effect from 1 January 2007, the Hong Kong Monetary Authority adopted Basel II as set out in the
Banking (Capital) Rules made under the Banking Ordinances. The new Rules, which replace the Third Schedule to the Banking Ordinance,
stipulate the calculation methodology for capital adequacy ratio. Basel II is structured around three “pillars”: minimum capital requirements,
supervisory review process and market discipline. The supervisory objectives for Basel II are to promote safety and soundness in the
financial system and maintain at least the current overall level of capital in the system; enhance competitive equality; constitute a more
comprehensive approach to addressing risks; and focus on internationally active bank.
HANG SENG BANK236
61. FINANCIAL RISK MANAGEMENT (continued)
(f) Capital management (continued)
With respect to Pillar One minimum capital requirements, Basel II provides three approaches, of increasing sophistication, to the calculation
of credit risk regulatory capital. The most basic, the standardised approach, requires banks to use external credit ratings to determine
risk weightings applied to rated counterparties, and groups other counterparties into broad categories and applies standardised risk
weightings to these categories. In the next level, the foundation internal ratings-based approach, allows banks to calculate their credit
risk regulatory capital requirement on the basis of their internal assessment of the probability that a counterparty will default (“PD”), but
with quantification of exposure at default (“EAD”) and loss given default estimates (“LGD”) being subject to standard supervisory
parameters. Finally, the advanced internal ratings-based approach, will allow banks to use their own internal assessment of not only the
probability of default but also the quantification of exposure at default and loss given default.
Expected losses are calculated by multiplying EAD by PD and LGD. The capital resources requirement under the IRB approaches is
intended to cover unexpected losses and is derived from a formula specified in the regulatory rules, which incorporates these factors and
other variables such as maturity and correlation.
For credit risk, with the Hong Kong Monetary Authority approval, the Group has adopted the advanced internal ratings-based approach
for the majority of its business with effect from 1 January 2009, with the remainder on standardised approach.
Basel II also introduces capital requirements for operational risk and, again, contains three levels of sophistication. The capital required
under the basic indicator approach is a simple percentage of gross revenues, whereas under the standardised approach it is one of three
different percentage of gross revenues allocated to each of eight defined business lines. Finally, the advanced measurement approach
uses bank’s own statistical analysis and modelling of operational risk data to determine capital requirements. The Group has adopted the
standardised approach to the determination of operational risk capital requirements.
For market risk, the Group is required to use a variety of approaches to calculate its market risk capital requirement, including the internal
model approach and the standardised approach for different risk categories.
Under Pillar Two, the Group has initiated its internal capital adequacy assessment process (“ICAAP”) to comply with Hong Kong Monetary
Authority’s requirement set out in the Supervisory Policy Manual “Supervisory Review Process”. The Group will also align with HSBC
Group guidance in setting up its ICAAP.
To comply with Pillar Three requirements which focuses on disclosure requirements and policies as prescribed by the Banking (Disclosure)
Rules, the Group has formulated a disclosure policy which was approved by the Board with an aim of making relevant disclosures in
accordance with the disclosure rules.
During the year, the Group has complied with all of the externally imposed capital requirements by the Hong Kong Monetary Authority.
62. FAIR VALuE OF FINANCIAL INSTRuMENTS(a) Determination of fair valueFair value is the amount for which an asset could be exchanged, or a liability settled, between knowledgeable, willing parties in an arm’s
length transaction.
Financial instruments measured at fair value on an ongoing basis include trading assets and liabilities, instruments designated at fair
value, derivatives, and financial investments classified as available-for-sale (including treasury and other eligible bills, debt securities, and
equity securities).
ANNUAL REPORT 2010 237

NOTES TO THE FINANCIAL STATEMENTS
62. FAIR VALuE OF FINANCIAL INSTRuMENTS (continued)
(a) Determination of fair value (continued)
Control frameworkFair values are subject to a control framework that aims to ensure that they are either determined, or validated, by a function independent
of the risk-taker. To this end, ultimate responsibility for the determination of fair values lies with Finance. Finance establishes the accounting
policies and procedures governing valuation, and is responsible for ensuring that these comply with all relevant accounting standards.
For fair values determined using a valuation model, the control framework may include, as applicable, independent development or
validation of (i) valuation models; (ii) any inputs to those models; and (iii) any adjustments required outside of the valuation model, and,
where possible, independent validation of model outputs. For fair values determined without a valuation model, independent price
determination or validation is utilised.
Determination of fair value of financial instruments carried at fair valueFair value are determined according to the following hierarchy:(i) Level 1: Quoted market price
Financial instruments with quoted prices for identical instruments in active markets.
(ii) Level 2: Valuation technique using observable inputs
Financial instruments with quoted prices for similar instruments in active markets or quoted prices for identical or similar instruments
in inactive markets and financial instruments valued using models where all significant inputs are observable.
(iii) Level 3: Valuation technique with significant non-observable inputs
Financial instruments valued using models where one or more significant inputs are not observable.
The best evidence of fair value is a quoted price in an actively traded market. In the event that the market for a financial instrument is not
active, a valuation technique is used. The majority of valuation techniques employ only observable market data, and so the reliability of
the fair value measurement is high. However, certain financial instruments are valued on the basis of valuation techniques that feature
one or more significant market inputs that are not observable. For these instruments, the fair value derived is more judgemental. “Not
observable” in this context means that there is little or no current market data available from which to determine the level at which an arm’s
length transaction would likely occur, but it generally does not mean that there is absolutely no market data available upon which to base
a determination of fair value (historical data may, for example, be used).
Furthermore, the assessment of hierarchy level is based on the lowest level of input that is significant to the fair value of the financial
instrument. Consequently, the level of uncertainty in the determination of the unobservable inputs will generally give rise to valuation
uncertainty that is less than the fair value itself.
To assist in understanding the extent of this uncertainty, additional information is provided in respect of these instruments in the “Effect of
changes in significant non-observable assumptions to reasonably possible alternatives” section below.
In certain circumstances, the Group applies the fair value option to its own debt in issue. Where available, the fair value will be based
upon quoted prices in an active market for the specific instrument concerned. Where unavailable, the fair value will either be based upon
quoted prices in an inactive market for the specific instrument concerned, or estimated by comparison with quoted prices in an active
market for similar instruments. The fair value of these instruments therefore includes the effect of own credit spread. Gains and losses
arising from changes in the credit spread of liabilities issued by Group reverse over the contractual life of the debt, provided that the debt
is not repaid early.
Structured notes issued and certain other hybrid instrument liabilities are included within trading liabilities and are measured at fair value.
The credit spread applied to these instruments is derived from the spreads at which the Group issues structured notes. These market
spreads are significantly smaller than credit spreads observed for plain vanilla debt or in the credit default swap markets.
HANG SENG BANK238

62. FAIR VALuE OF FINANCIAL INSTRuMENTS (continued)
(a) Determination of fair value (continued)
All net positions in non-derivative financial instruments, and all derivative portfolios, are valued at bid or offer prices as appropriate. Long
positions are marked at bid prices; short positions are marked at offer prices.
The fair values of large holdings of non-derivative financial instruments are based on a multiple of the value of a single instrument, and do
not include block adjustments for the size of the holding.
The valuation models used where quoted market prices are not available incorporate certain assumptions that the Group anticipates
would be used by a market participant to establish fair value. Where the Group believes that there are additional considerations not
included within the valuation model, appropriate adjustments may be made. Examples of such adjustments are:
– Credit risk adjustment: an adjustment to reflect the credit worthiness of over-the-counter (“OTC”) derivative counterparties.
– Inception profit (“day 1 P&L reserves”): for financial instruments valued at inception, on the basis of one or more significant unobservable
inputs, the difference between transaction price and model value (as adjusted) at inception is not recognised in the consolidated
income statement, but is deferred and any unamortised balance is included as part of the fair value.
Transaction costs are not included in the fair value calculation. Trade origination costs such as brokerage fees and post-trade costs
are included in operating expenses. The future costs of administering the OTC derivative portfolio are also not included in fair value,
but are expensed as incurred.
– Debt securities, Treasury and eligible bills, and Equities
These instruments are valued based on quoted market prices from an exchange, dealer, broker, industry group or pricing service,
where available. Where unavailable, fair value is determined by reference to quoted market prices for similar instruments or, in the case
of certain mortgage-backed securities and unquoted equities, valuation techniques using inputs derived from observable market data,
and, where relevant, assumptions in respect of unobservable inputs.
– Derivatives
Over-the-counter (i.e. non-exchange traded) derivatives are valued using valuation models. Valuation models calculate the present
value of expected future cash flows, based upon “no-arbitrage” principles. For many vanilla derivative products, such as interest
rate swaps and European options, the modelling approaches used are standard across the industry. For more complex derivative
products, there may be some discrepancies in practice. Inputs to valuation models are determined from observable market data
wherever possible, including prices available from exchanges, dealers, brokers or providers of consensus pricing. Certain inputs may
not be observable in the market directly, but can be determined from observable prices via model calibration procedures. Finally,
some inputs are not observable, but can generally be estimated from historical data or other sources.
Examples of inputs that are generally observable include foreign exchange spot and forward rates, benchmark interest rate curves
and volatility surfaces for commonly traded option products. Examples of inputs that may be unobservable include volatility surfaces,
in whole or in part, for less commonly traded option products, and correlations between market factors.
– Private equity
The Group’s private equity positions are generally classified as available-for-sale and are not traded in an active market. In the absence
of an active market for the investment, fair value is estimated based upon an analysis of the investee’s financial position and results,
risk profile, prospects and other factors as well as reference to market valuations for similar entities quoted in an active market, or the
price at which similar companies have changed ownership. The exercise of judgement is required because of uncertainties inherent
in estimating fair value for private equity investments.
ANNUAL REPORT 2010 239

NOTES TO THE FINANCIAL STATEMENTS
62. FAIR VALuE OF FINANCIAL INSTRuMENTS (continued)
(a) Determination of fair value (continued)
Analysis of fair value determinationThe following table provides an analysis of the basis for valuing financial assets and financial liabilities measured at fair value in the
consolidated financial statements:
Group
Valuation techniques
quotedmarket
price
usingobservable
inputs
withsignificant
non-observable
inputs
Thirdpartytotal
Amountswith
HSBCentities* Total
2010
Assets
Trading assets 24,840 1,215 – 26,055 – 26,055
Financial assets designated at fair value 818 2,245 510 3,573 3,541 7,114
Derivative financial instruments 721 4,161 106 4,988 605 5,593
Available-for-sale financial investments 25,207 117,568 283 143,058 – 143,058
Liabilities
Trading liabilities 18,991 23,037 553 42,581 – 42,581
Financial liabilities designated at fair value – 457 – 457 – 457
Derivative financial instruments 96 4,034 – 4,130 553 4,683
2009
Assets
Trading assets 64,476 2,121 – 66,597 – 66,597
Financial assets designated at fair value 216 1,192 696 2,104 3,346 5,450
Derivative financial instruments 511 4,156 – 4,667 383 5,050
Available-for-sale financial investments 59,895 132,490 448 192,833 – 192,833
Liabilities
Trading liabilities 12,932 24,703 756 38,391 – 38,391
Financial liabilities designated at fair value – 1,456 – 1,456 – 1,456
Derivative financial instruments 92 2,845 – 2,937 1,314 4,251
HANG SENG BANK240

62. FAIR VALuE OF FINANCIAL INSTRuMENTS (continued)
(a) Determination of fair value (continued)
Bank
Valuation techniques
quotedmarket
price
usingobservable
inputs
withsignificant
non-observable
inputs
Thirdpartytotal
Amountswith
HSBCentities* Total
2010
Assets
Trading assets 24,840 392 – 25,232 – 25,232
Financial assets designated at fair value – 148 – 148 – 148
Derivative financial instruments 717 3,784 – 4,501 525 5,026
Available-for-sale financial investments 24,176 78,894 36 103,106 – 103,106
Liabilities
Trading liabilities 18,991 10,831 284 30,106 – 30,106
Financial liabilities designated at fair value – – – – – –
Derivative financial instruments 95 3,742 – 3,837 691 4,528
2009
Assets
Trading assets 64,476 812 – 65,288 – 65,288
Financial assets designated at fair value – 174 – 174 – 174
Derivative financial instruments 510 4,115 – 4,625 291 4,916
Available-for-sale financial investments 55,446 101,236 33 156,715 – 156,715
Liabilities
Trading liabilities 12,932 21,537 602 35,071 – 35,071
Financial liabilities designated at fair value – 1,003 – 1,003 – 1,003
Derivative financial instruments 92 2,765 – 2,857 1,323 4,180
* Included structured instrument and derivative contracts transacted with HSBC entities which were mainly classified within level 2 of the valuation hierarchy.
ANNUAL REPORT 2010 241

NOTES TO THE FINANCIAL STATEMENTS
62. FAIR VALuE OF FINANCIAL INSTRuMENTS (continued)
(a) Determination of fair value (continued)
Reconciliation of fair value measurements in Level 3 of the fair value hierarchyThe following table provides a reconciliation of the movement between opening and closing balances of Level 3 financial instruments,
measured at fair value using a valuation technique with significant unobservable inputs:
Group
Assets Liabilities
Available-for-sale
Held fortrading
Designatedat fair value
throughprofit
or loss DerivativesHeld fortrading
Designatedat fair value
throughprofit
or loss Derivatives
At 1 January 2010 448 – 696 – 756 – –
Total gains or losses recognised in profit and loss (1) – 47 14 14 – –
Total gains or losses recognised in other comprehensive income 12 – – – – – –
Purchases 20 – 165 – – – –
Issues/deposits taking – – – – 1,528 – –
Sales – – (21) – – – –
Settlements (9) – (80) 92 (2,110) – –
Transfers out (397) – (425) – (685) – –
Transfers in 210 – 128 – 1,044 – –
Exchange adjustments – – – – 6 – –
At 31 December 2010 283 – 510 106 553 – –
Total gains or losses recognised in profit or loss relating to those assets and liabilities held at the balance sheet date 16 – 52 13 8 – –
HANG SENG BANK242
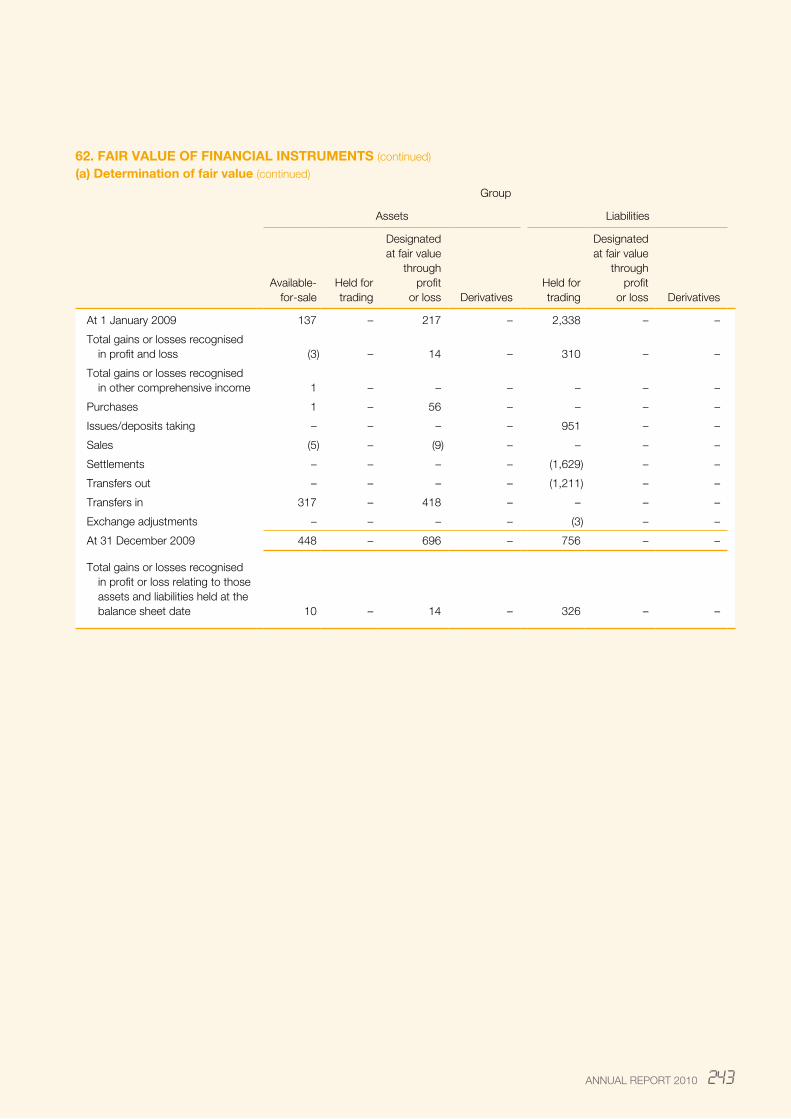
62. FAIR VALuE OF FINANCIAL INSTRuMENTS (continued)
(a) Determination of fair value (continued)
Group
Assets Liabilities
Available-for-sale
Held fortrading
Designatedat fair value
throughprofit
or loss DerivativesHeld fortrading
Designatedat fair value
throughprofit
or loss Derivatives
At 1 January 2009 137 – 217 – 2,338 – –
Total gains or losses recognised in profit and loss (3) – 14 – 310 – –
Total gains or losses recognised in other comprehensive income 1 – – – – – –
Purchases 1 – 56 – – – –
Issues/deposits taking – – – – 951 – –
Sales (5) – (9) – – – –
Settlements – – – – (1,629) – –
Transfers out – – – – (1,211) – –
Transfers in 317 – 418 – – – –
Exchange adjustments – – – – (3) – –
At 31 December 2009 448 – 696 – 756 – –
Total gains or losses recognised in profit or loss relating to those assets and liabilities held at the balance sheet date 10 – 14 – 326 – –
ANNUAL REPORT 2010 243

NOTES TO THE FINANCIAL STATEMENTS
62. FAIR VALuE OF FINANCIAL INSTRuMENTS (continued)
(a) Determination of fair value (continued)
Bank
Assets Liabilities
Available-for-sale
Held fortrading
Designatedat fair value
throughprofit
or loss DerivativesHeld fortrading
Designatedat fair value
throughprofit
or loss Derivatives
At 1 January 2010 33 – – – 602 – –
Total gains or losses recognised in profit and loss – – – – 11 – –
Total gains or losses recognised in other comprehensive income 3 – – – – – –
Purchases – – – – – – –
Issues/deposits taking – – – – 1,018 – –
Sales – – – – – – –
Settlements – – – – (1,662) – –
Transfers out – – – – (685) – –
Transfers in – – – – 1,000 – –
Exchange adjustments – – – – – – –
At 31 December 2010 36 – – – 284 – –
Total gains or losses recognised in profit or loss relating to those assets and liabilities held at the balance sheet date 5 – – – 9 – –
HANG SENG BANK244

62. FAIR VALuE OF FINANCIAL INSTRuMENTS (continued)
(a) Determination of fair value (continued)
Bank
Assets Liabilities
Available-for-sale
Held fortrading
Designatedat fair value
throughprofit
or loss DerivativesHeld fortrading
Designatedat fair value
throughprofit
or loss Derivatives
At 1 January 2009 34 – – – 2,338 – –
Total gains or losses recognised in profit and loss – – – – 309 – –
Total gains or losses recognised in other comprehensive income (1) – – – – – –
Purchases – – – – – – –
Issues/deposits taking – – – – 798 – –
Sales – – – – – – –
Settlements – – – – (1,629) – –
Transfers out – – – – (1,211) – –
Transfers in – – – – – – –
Exchange adjustments – – – – (3) – –
At 31 December 2009 33 – – – 602 – –
Total gains or losses recognised in profit or loss relating to those assets and liabilities held at the balance sheet date 5 – – – 325 – –
For available-for-sale securities and financial assets designated at fair value, the transfers into and out of Level 3 were due to change in
valuation observability of certain debt securities during the year.
For held-for-trading liabilities, transfers into and out of Level 3 were primarily due to change in valuation observability of equity correlation
during the year.
For assets and liabilities classified as held for trading, realised and unrealised gains and losses are presented in the income statement
under “Trading income”.
The income statement line item “Net income/(expense) from financial instruments designated at fair value” captures fair value movements
on all other financial instruments designated at fair value and related derivatives (including long-term subordinated notes issued).
Realised gains and losses from available-for-sale securities are presented under “Gains less losses from financial investments and fixed
assets” in the income statement while unrealised gains and losses are presented in “Fair value changes taken to/(from) equity” within
“Available-for-sale investment reserve” in other comprehensive income.
ANNUAL REPORT 2010 245

NOTES TO THE FINANCIAL STATEMENTS
62. FAIR VALuE OF FINANCIAL INSTRuMENTS (continued)
(a) Determination of fair value (continued)
Effects of changes in significant non-observable assumptions to reasonably possible alternativesAs discussed above, the fair value of financial instruments are, in certain circumstances, measured using valuation models that incorporate
assumptions that are not supported by prices from observable current market transactions in the same instrument and are not based on
observable market data. The following table shows the sensitivity of fair values to reasonably possible alternative assumptions.
Group
Reflected in profit/(loss) Reflected in equity
favourablechanges
unfavourablechanges
favourablechanges
unfavourablechanges
2010
Derivatives/trading assets/trading liabilities 1 (1) – –
Financial assets/liabilities designated at fair value 51 (51) – –
Available-for-sale financial investments – – 28 (28)
2009
Derivatives/trading assets/trading liabilities – – – –
Financial assets/liabilities designated at fair value 70 (70) – –
Available-for-sale financial investments – – 45 (45)
Bank
Reflected in profit/(loss) Reflected in equity
favourablechanges
unfavourablechanges
favourablechanges
unfavourablechanges
2010
Derivatives/trading assets/trading liabilities – – – –
Financial assets/liabilities designated at fair value – – – –
Available-for-sale financial investments – – 4 (4)
2009
Derivatives/trading assets/trading liabilities – – – –
Financial assets/liabilities designated at fair value – – – –
Available-for-sale financial investments – – 3 (3)
HANG SENG BANK246

62. FAIR VALuE OF FINANCIAL INSTRuMENTS (continued)
(a) Determination of fair value (continued)
Changes in fair value recorded in the income statementThe following table details changes in fair values recognised in profit or loss during the year, where the fair value is estimated using valuation
techniques that incorporate significant assumptions that are not supported by prices from observable current market transactions in the
same instrument, and are not based on observable market data:
– the table details the total change in fair value of these instruments; it does not isolate that component of the change that is attributable
to the non-observable component;
– instruments valued with significant non-observable inputs are frequently dynamically hedged with instruments valued using observable
inputs; the table does not include any changes in fair value of these hedges.
Group Bank
2010 2009 2010 2009
Recorded profit:
Derivatives/trading assets/trading liabilities 28 310 11 309
Financial assets/liabilities designated at fair value 47 14 – –
Fair value of financial instruments not carried at fair valueThe fair values of financial instruments that are not recognised at fair value on the balance sheet are calculated as described below.
The calculation of fair value incorporates the Group’s estimate of the amount at which financial assets could be exchanged, or financial
liabilities settled, between knowledgeable, willing parties in an arm’s length transaction. It does not reflect the economic benefits and costs
that the Group expects to flow from the instruments’ cash flows over their expected future lives. Other reporting entities may use different
valuation methodologies and assumptions in determining fair values for which no observable market prices are available, so comparisons
of fair values between entities may not be meaningful and users are advised to exercise caution when using this data.
The following types of financial instruments are measured at amortised cost unless they are held for trading or designated at fair value
through profit or loss. Where assets or liabilities are hedged by derivatives designated and qualifying as fair value hedges, the carrying
value of the assets or liabilities so hedged includes a fair value adjustment for the hedged risk only. Fair values at the date of balance sheet
of the assets and liabilities set out below are estimated for the purpose of disclosure as follows:
(i) Loans and advances to customers
The fair value of advances to customers is estimated using discounted cash flow models, using an estimate of the discount rate that
a market participant would use in valuing instruments with similar maturity, repricing and credit risk characteristics.
The fair value of a loan portfolio reflects both loan impairments at the date of balance sheet and estimates of market participants’
expectations of credit losses over the life of the loans.
ANNUAL REPORT 2010 247

NOTES TO THE FINANCIAL STATEMENTS
62. FAIR VALuE OF FINANCIAL INSTRuMENTS (continued)
(a) Determination of fair value (continued)
(ii) Financial investments
The fair values of listed financial investments are determined using bid market prices. The fair values of unlisted financial investments
are determined using valuation techniques that take into consideration either the prices of, or future earnings streams of, equivalent
quoted securities.
(iii) Deposits and customer accounts
The fair value of deposits and customers account is estimated using discounted cash flows, applying current rates offered for deposits
of similar remaining maturities. The fair value of deposits repayable on demand is assumed to be the amount payable on demand at
the balance sheet date.
(iv) Debt securities in issue and subordinated liabilities
Fair values are determined using quoted market prices at the balance sheet date where available, or by reference to quoted market
prices for similar instruments.
The fair values in this note are stated at a specific date and may be significantly different from the amounts which will actually be paid
on the maturity or settlement dates of the instruments. In many cases, it would not be possible to realise immediately the estimated fair
values given the size of the portfolios measured. Accordingly, these fair values do not represent the value of these financial instruments
to the Group as a going concern.
For all classes of financial instruments, fair value represents the product of the value of a single instrument, multiplied by the number of
instruments held. No block discount or premium adjustments are made.
The fair values of intangible assets, such as values placed on portfolios of core deposits, credit card and customer relationships, are not
included above because they are not financial instruments.
The following table lists financial instruments whose carrying amount is a reasonable approximation of fair value because, for example,
they are short-term in nature or reprice to current market rates frequently:
AssetsCash and balances at central banks
Items in the course of collection from other banks
Endorsements and acceptances
Short-term receivables within “Other assets”
Accrued income
LiabilitiesItems in the course of transmission to other banks
Endorsements and acceptances
Short-term payables within “Other liabilities”
Accruals
The methods and significant assumptions applied in determining the fair value of financial instruments are set out in note 4(n).
HANG SENG BANK248

62. FAIR VALuE OF FINANCIAL INSTRuMENTS (continued)
(b) Fair valueThe following table provides an analysis of the fair value of financial instruments not measured at fair value in the balance sheet. For all
other instruments, the fair value is equal to the carrying value:
Group
2010 2009
Carryingamount
Fairvalue
Carryingamount
Fairvalue
Financial Assets
Placings with and advances to banks and other financial institutions 110,564 110,570 104,551 104,551
Advances to customers 472,637 474,045 344,621 346,459
Held-to-maturity debt securities 56,301 58,327 48,669 49,805
Financial Liabilities
Current, savings and other deposit accounts 683,628 683,732 636,369 636,435
Deposits from banks 15,586 15,586 4,870 4,870
Certificates of deposit and other debt securities in issue 3,095 3,104 1,826 1,859
Subordinated liabilities 11,848 12,761 9,320 9,041
Bank
2010 2009
Carryingamount
Fairvalue
Carryingamount
Fairvalue
Financial Assets
Placings with and advances to banks and other financial institutions 52,131 52,136 65,624 65,624
Advances to customers 423,074 424,514 299,179 301,054
Financial Liabilities
Current, savings and other deposit accounts 649,144 649,249 612,014 612,080
Deposits from banks 15,585 15,585 4,469 4,469
Certificates of deposit and other debt securities in issue 3,095 3,104 1,826 1,859
Subordinated liabilities 11,848 12,761 9,320 9,041
63. COMPARATIVE FIGuRESAs a result of the adoption of the amendments to HKAS 17 “Leases”, certain comparative figures have been adjusted to conform with the
current year’s presentation and to provide comparative amounts in respect of items disclosed for the first time in 2010.
64. IMMEDIATE AND uLTIMATE HOLDING COMPANIESThe immediate and ultimate holding companies of the Bank are The Hongkong and Shanghai Banking Corporation Limited (incorporated
in Hong Kong) and HSBC Holdings plc (incorporated in England) respectively.
65. APPROVAL OF FINANCIAL STATEMENTSThe financial statements were approved and authorised for issue by the Board of Directors on 28 February 2011.
ANNUAL REPORT 2010 249

INDEPENDENT AuDITOR’S REPORT
TO THE SHAREHOLDERS OF HANG SENG BANK LIMITED(Incorporated in Hong Kong with limited liability)
We have audited the consolidated financial statements of Hang Seng Bank Limited (“the Bank”) and its subsidiaries (together “the Group”)
set out on pages 98 to 249, which comprise the consolidated and the Bank balance sheets as at 31 December 2010, the consolidated
income statement, the consolidated statement of comprehensive income, the consolidated statement of changes in equity and the
consolidated cash flow statement for the year then ended and a summary of significant accounting policies and other explanatory
information.
DIRECTORS’ RESPONSIBILITY FOR THE CONSOLIDATED FINANCIAL STATEMENTSThe directors of the Bank are responsible for the preparation of consolidated financial statements that give a true and fair view in
accordance with Hong Kong Financial Reporting Standards issued by the Hong Kong Institute of Certified Public Accountants and the
Hong Kong Companies Ordinance and for such internal control as the directors determine is necessary to enable the preparation of
consolidated financial statements that are free from material misstatement, whether due to fraud or error.
AuDITOR’S RESPONSIBILITYOur responsibility is to express an opinion on these consolidated financial statements based on our audit. This report is made solely to
you, as a body, in accordance with section 141 of the Hong Kong Companies Ordinance, and for no other purpose. We do not assume
responsibility towards or accept liability to any other person for the contents of this report.
We conducted our audit in accordance with Hong Kong Standards on Auditing issued by the Hong Kong Institute of Certified Public
Accountants. Those standards require that we comply with ethical requirements and plan and perform the audit to obtain reasonable
assurance about whether the consolidated financial statements are free from material misstatement.
An audit involves performing procedures to obtain audit evidence about the amounts and disclosures in the consolidated financial
statements. The procedures selected depend on the auditor’s judgement, including the assessment of the risks of material misstatement
of the consolidated financial statements, whether due to fraud or error. In making those risk assessments, the auditor considers internal
control relevant to the entity’s preparation of the consolidated financial statements that give a true and fair view in order to design audit
procedures that are appropriate in the circumstances, but not for the purpose of expressing an opinion on the effectiveness of the entity’s
internal control. An audit also includes evaluating the appropriateness of accounting policies used and the reasonableness of accounting
estimates made by the directors, as well as evaluating the overall presentation of the consolidated financial statements.
We believe that the audit evidence we have obtained is sufficient and appropriate to provide a basis for our audit opinion.
OPINIONIn our opinion, the consolidated financial statements give a true and fair view of the state of affairs of the Bank and of the Group as at 31
December 2010 and of the Group’s profit and cash flows for the year then ended in accordance with Hong Kong Financial Reporting
Standards and have been properly prepared in accordance with the Hong Kong Companies Ordinance.
KPMG
Certified Public Accountants
8th Floor, Prince’s Building
10 Chater Road
Central, Hong Kong
28 February 2011
HANG SENG BANK250

These notes set out on pages 251 to 272 are supplementary to and should be read in conjunction with the consolidated financial
statements set out on pages 98 to 249. The consolidated financial statements and these supplementary notes taken together comply with
the Banking (Disclosure) Rules (the “Disclosure Rules”) made under section 60A of the Banking Ordinance.
1. BASIS OF PREPARATION(a) Except where indicated otherwise, the financial information contained in these supplementary notes has been prepared on a consolidated
basis in accordance with Hong Kong Financial Reporting Standards. Some parts of these supplementary notes, however, are required by
the Disclosure Rules to be prepared on a different basis. In such cases, the Disclosure Rules require that certain information is prepared
on a basis which excluded some of the subsidiaries of the Bank.
Further information regarding subsidiaries that are not included in the consolidation for regulatory purpose is set out in note 2 to the
supplementary notes to the financial statements.
(b) The accounting policies applied in preparing these supplementary notes are the same as those applied in preparing the consolidated
financial statements for the year ended 31 December 2010 as set out in note 4 to the financial statements.
2. CAPITAL ADEQuACY(a) Capital adequacy ratiosThe capital adequacy ratios as at 31 December 2010 are computed on the consolidated basis of the Bank and certain of its subsidiaries
as specified by the Hong Kong Monetary Authority for its regulatory purposes, and are in accordance with the Banking (Capital) Rules
(“the Capital Rules”) of the Hong Kong Banking Ordinance.
From 1 January 2009, the Group has migrated to the advanced internal ratings-based approach to calculate its credit risk for the majority
of its non-securitisation exposures. The Group continued to use the standardised (operational risk) approach to calculate its operational
risk. For market risk, an internal model approach is adopted for calculating general market risk, while standardised (market risk) approach
is adopted for calculating specific interest rate risk and equity risk. There are no changes in the approaches used in 2010. In addition,
there is no relevant capital shortfall in any of the Group’s subsidiaries which are not included in its consolidation group for regulatory
purposes.
ANNUAL REPORT 2010 251
SuPPLEMENTARY NOTES TO THE FINANCIAL STATEMENTS (uNAuDITED)

2. CAPITAL ADEQuACY (continued)
(a) Capital adequacy ratios (continued)
The capital base after deductions used in the calculation of capital adequacy ratios as at 31 December and reported to Hong Kong
Monetary Authority is analysed as follows:
2010 2009
Core capital:
Paid-up ordinary share capital 9,559 9,559
– Reserves per balance sheet 56,820 45,032
– Unconsolidated subsidiaries (6,268) (5,251)
– Cash flow hedging reserve (72) (174)
– Regulatory reserve (1,654) (920)
– Reserves arising from revaluation of property and unrealized gains on available-for-sale equities and debt securities (13,585) (7,868)
– Own credit spread – (31)
Total reserves included in core capital 35,241 30,788
– Goodwill and intangible assets (1,019) (561)
– 50% of unconsolidated investments (9,725) (6,999)
– 50% of securitisation positions and other deductions (158) (331)
Deductions (10,902) (7,891)
Total core capital 33,898 32,456
Supplementary capital:
– Term subordinated debt 11,848 10,354
– Property revaluation reserves1 5,894 3,732
– Available-for-sale investments revaluation reserves2 396 498
– Regulatory reserve3 182 101
– Collective impairment allowances3 77 81
– Excess impairment allowances over expected losses4 306 –
Supplementary capital before deductions 18,703 14,766
– 50% of unconsolidated investments (9,725) (6,999)
– 50% per cent of securitisation positions and other deductions (158) (331)
Deductions (9,883) (7,330)
Total supplementary capital 8,820 7,436
Capital base5 42,718 39,892
Risk-weighted assets
– credit risk 274,969 212,434
– market risk 1,615 1,278
– operational risk 36,853 39,017
313,437 252,729
– Capital adequacy ratio5 13.6% 15.8%
– Core capital ratio5 10.8% 12.8%
Reserves and deductible items
Published reserves 31,741 29,034
Profit and loss account 3,500 1,754
Total reserves included in core capital5 35,241 30,788
Total of items deductible 50% from core capital and 50% from supplementary capital 19,766 14,660
HANG SENG BANK252
SuPPLEMENTARY NOTES TO THE FINANCIAL STATEMENTS (uNAuDITED)

2. CAPITAL ADEQuACY (continued)
(a) Capital adequacy ratios (continued)1 Includes the revaluation surplus on investment properties which is reported as part of retained profits and adjustments made in accordance with Banking
(Capital) rules.
2 Includes adjustments made in accordance with Banking (Capital) rules.
3 Total regulatory reserve and collective impairment allowances are apportioned between the standardised approach and internal ratings-based approach in
accordance with Banking (Capital) rules. Those apportioned to the standardised approach are included in supplementary capital. Those apportioned to the internal
ratings-based approach are excluded from supplementary capital.
4 Excess impairment allowances over expected losses are applicable to non-securitisation exposures calculated by using the internal ratings-based approach.
5 The 2009 capital base, risk-weighted assets and capital ratios have not been restated for the effects of HKAS 17 “Leases”.
(b) Basis of consolidationThe basis of consolidation for calculation of capital ratios under the Capital Rules follows the basis of consolidation for financial reporting
with the exclusion of subsidiaries which are “regulated financial entities” (e.g. insurance and securities companies) as defined by the
Capital Rules. Accordingly, the investment costs of these unconsolidated regulated financial entities are deducted from the capital base.
The unconsolidated regulated financial entities are:
Hang Seng Bank (Trustee) Limited
Hang Seng Bank Trustee International Limited
Hang Seng Futures Limited
Hang Seng General Insurance (Hong Kong) Company Limited
Hang Seng Insurance Company Limited
Hang Seng Insurance (Bahamas) Limited
Hang Seng Investment Management Limited
Hang Seng Investment Services Limited
Hang Seng Life Limited
Hang Seng (Nominee) Limited
Hang Seng Securities Limited
The Group operates subsidiaries in a number of countries and territories where capital will be governed by local rules and there may be
restrictions on the transfer of regulatory capital and funds between members of the banking group.
ANNUAL REPORT 2010 253

3. CREDIT RISK CAPITAL REQuIREMENTSThe table below shows the capital requirements for credit risk for each class and subclass of exposures as specified in the Capital Rules.
2010 2009
Subject to internal ratings-based approachSovereign exposures 294 128Bank exposures 2,592 2,270Corporate exposures 13,538 9,943Residential mortgages to individuals and property-holding shell companies 527 663Qualifying revolving retail exposures 970 825Small business retail exposures 9 8Other retail exposures to individuals 295 340Other exposures 1,184 969Securitisation exposures – –Equity exposures – –Total capital requirements for credit risk under internal ratings-based approach 19,409 15,146
Subject to standardised (credit risk) approachOn-balance sheetSovereign exposures – –Public sector entity exposures 174 89Multilateral development bank exposures – –Bank exposures 4 –Securities firm exposures – –Corporate exposures 938 312Collective investment scheme exposures 4 4Cash items – –Regulatory retail exposures 128 152Residential mortgage loans 671 701Other exposures which are not past due exposures 354 399Past due exposures 22 48Total capital requirements for on-balance sheet exposures 2,295 1,705
Off-balance sheetDirect credit substitutes 187 36Transaction-related contingencies 3 2Trade-related contingencies – 6Forward asset purchases 4 3Partly paid-up shares and securities – –Forward forward deposits placed – –Unconditionally cancellable commitments – –Other commitments 83 82Exchange rate contracts 10 11Interest rate contracts 1 –Equity contracts 5 4OTC derivative transactions and credit derivative contracts subject to valid bilateral netting agreements – –Other off-balance exposures which are not elsewhere specified – –Total capital requirements for off-balance sheet exposures 293 144
Total capital requirements for credit risk under standardised (credit risk) approach 2,588 1,849
Total capital requirements for credit risk 21,997 16,995
The capital requirement is made by multiplying the Group’s risk-weighted amount derived from the relevant calculation approach by
8 per cent. It does not reflect the Group’s actual regulatory capital.
HANG SENG BANK254
SuPPLEMENTARY NOTES TO THE FINANCIAL STATEMENTS (uNAuDITED)

4. CREDIT RISK uNDER THE INTERNAL RATINGS-BASED APPROACH(a) The internal rating system(i) Nature of exposures within each internal ratings-based (“IRB”) classThe Group adopted advanced IRB approach for the majority of its business with effect from 1 January 2009. The following exposures are
subject to IRB approach:
– Corporate exposures include exposures to global large corporates, local large corporates, middle market corporates and small
and medium-sized enterprises, non-bank financial institutions and specialised lending.
– Sovereign exposures include exposures to sovereign governments, central monetary institutions and relevant international
organisations.
– Bank exposures include exposures to banks and regulated securities firms.
– Retail exposures include residential mortgages, qualifying revolving retail exposures, small business retail exposures and other
retail exposures.
– Other exposures mainly include notes and coins, premises, plant and equipment and other fixed assets.
(ii) Structure of risk rating systems and control mechanismsThe Group’s exposure to credit risk arises from a wide range of asset classes, customers and product types. To measure and manage
the risk in these exposures, both to individually assessed customers and to those aggregated into portfolios, the Group employs diverse
risk rating systems and methodologies: judgmental, analytical, and hybrids of the two. The main characteristics of the Group’s credit risk
rating systems are set out below.
A fundamental principle of the Group’s policy and approach is that analytical risk rating systems and scorecards are tools at the disposal
of management, serving ultimately judgemental decisions for which individual approvers are accountable. In case of automated decision
marking process, accountability rests with those responsible for the parameters built into those processes/systems and the controls
surrounding their use. For individually assessed customers, the credit process provides for at least annual review of the facility granted.
Review may be more frequent, as required by circumstances.
The Group adopts a set of standards that govern the process through which risk rating systems are developed, judged fit for purpose,
approved and implemented, the conditions under which analytical risk model outcomes can be overridden by approvers and the process of
model performance monitoring and reporting. The framework ensures an effective dialogue between business line and risk management,
suitable independence of decision takers and a good understanding and robust challenge of senior management.
Analytical risk rating systems are not static and are subject to review and modification in light of the changing environment and the
availability or quality of data. Processes are established to capture the relevant data for continuous model improvement.
(iii) Application of IRB parametersThe Group-wide credit risk rating framework incorporates probability of default (“PD”, representing the likelihood of a default event in a
one-year horizon) of an obligor and loss severity expressed in terms of exposures at default (“EAD”, an estimate of exposures at time of
default) and loss given default (“LGD”, the estimates of loss that the Group may incur in the event of default expressed as a percentage of
EAD). These measures are used to calculate expected loss and capital requirements. They are also used in conjunction with other inputs
to form rating assessments for the purpose of credit approval and for risk management decisions.
For corporate and bank exposures, PD models are developed based on historical loss data, combining financial statistics and expert
inputs on various aspects such as industry environment, financial trend and quality assessment on the companies. PD model for sovereign
exposures incorporates both quantitative and qualitative data from a wide range of reference sources on economic, political, financial
and social conditions. For wholesale business (includes corporate, bank and sovereign exposures), obligor PD is estimated using a
Customer Risk Rating of 23 grades (for bank and sovereign) or 22 grades (for corporate), of which 21 and 20 are non-default ratings
representing varying degrees of strength of financial condition, and two are default ratings. Credit score generated by a model and/or a
scorecard for individual obligor is recommended to and reviewed by credit approver taking into account all relevant information to the risk
rating determination.
ANNUAL REPORT 2010 255

4. CREDIT RISK uNDER THE INTERNAL RATINGS-BASED APPROACH (continued)
(a) The internal rating system (continued)
(iii) Application of IRB parameters (continued)
LGD and EAD estimation for wholesale business is subject to Group framework of basic principles. EAD is estimated to a 12-month
horizon and broadly represents the current exposure plus an estimate for future draw down on undrawn facilities and the crystallization of
contingent exposures after default. LGD focuses on the facility and collateral structure which takes into account the priority/seniority of the
facility, the type and value of the collateral and past experience on the type of counterparty, which is expressed as a percentage of EAD.
The Group uses supervisory slotting criteria approach in rating its regulatory specialised lending exposure. Under this approach, rating will
be assigned based on the borrower and transaction characteristics.
For retail business including residential mortgage exposures, qualifying revolving retail exposures, small business retail exposures and other
retail exposures, a wide range of application and behavioural models used in the management of retail portfolios has been supplemented
to develop the credit models for measuring PD, EAD and LGD under the IRB approach. The PD models typically incorporates the
characteristics of the products and the borrower's account behaviour.
EAD models are developed for retail revolving exposures to predict additional drawdown at the time of default, plus current
outstanding balance. For non-revolving retail exposures such as residential mortgage, EAD is mainly estimated based on current
outstanding balance.
LGD models for retail exposures are developed based on the Group’s internal loss and default experience including recovery values for
different types of collaterals for secured retail exposures such as residential mortgage; For unsecured retail exposures such as qualifying
revolving retail exposures, LGD models are developed based on past recovery experiences, account behaviours and repayment ability.
(iv) Model governanceModel governance is under the Credit Risk Analytics Oversight Committee (CRAOC), whose responsibilities are to oversee the governance,
including development, validation and monitoring of risk rating models. The CRAOC is chaired by the Chief Risk Officer and its memberships
include heads of business groups and finance function.
Internal Audit conducts regular reviews of the risk rating model application by business groups.
(v) Use of internal ratingsWhile internal estimates derived from applying the IRB approach are employed in the calculation of risk-weighted exposure amounts for
the purpose of determining regulatory capital requirements, they are also used in a multitude of contexts within risk management and
business processes. Such uses continue to develop and become embedded as experience grows and the repository of quality data
improves. They include:
– credit approval: authorities, including those for specific counterparty types and transactions, are delegated to officers and executives
in the Group’s credit risk function and business division involving lending activities using a risk-based approach, tiered relative to
obligor customer risk rating;
– credit risk analytical tools: IRB measures are valuable tools deployed in the assessment of customer and portfolio risk; migration of
customer risk rating becomes an important indicator in credit monitoring process;
– pricing: customer relationship managers apply a risk adjusted return on capital methodology in risk-weighted assets and
profitability calculators;
– portfolio management: regular reports to Risk Management Committee, Audit Committee containing analyses of risk exposures
employing IRB risk metrics, e.g. by customer segment and credit quality grade;
– economic capital: IRB risk measures are essential components of the credit risk economic capital model, which are evaluated in the
capital adequacy assessment process of the Group; and
– stress testing: IRB risk measures are stressed to understand the sensitivities of the Group’s capital and business plans under adverse
economic environment.
HANG SENG BANK256
SuPPLEMENTARY NOTES TO THE FINANCIAL STATEMENTS (uNAuDITED)

4. CREDIT RISK uNDER THE INTERNAL RATINGS-BASED APPROACH (continued)
(a) The internal rating system (continued)
(vi) Credit risk mitigationThe Group’s approach when granting credit facilities is on the basis of capacity to repay, rather than primarily rely on credit risk mitigation.
Depending on a customer's standing and the type of product, facilities may be provided on unsecured basis. Nevertheless, mitigation of
credit risk is an important aspect of effective management and takes in many forms.
The Group’s general policy is to promote the use of credit risk mitigation, justified by commercial prudence and good practice as well as
capital efficiency. Policies covering the acceptability, structuring, control and valuation with regard to different types of collateral security
are established to ensure that they are supported by evidence and continue to fulfil their intended purpose.
The main types of recognised collateral taken by the Group are those as stated in section 80 of the Capital Rules, including (but not limited
to) cash on deposit, gold bullion, equities listed in a main index and/or a recognised exchange, collective investment schemes, various
recognised debt securities, residential, industrial and commercial property, etc.
The Group’s policy provides that netting is only to be applied where it has the legal right to do so. Consistent with the Capital Rules, only
bilateral netting arrangements are included for capital adequacy credit risk mitigation calculation.
In terms of the application within advanced IRB approach, credit risk mitigants are considered in two broad categories: first, those which
reduce the intrinsic probability of default of an obligor and therefore operate as adjustments to PD estimation, and second, those which
affect estimated recoverability of obligations and require adjustment of LGD. The first includes, for example, full parental or group company
guarantees; the second, collateral security of various kinds such as cash, equity, properties, fixed assets such as motor vehicles, plant
and machinery, stock and debtors, bank and sovereign guarantees, etc.
(b) Exposures subject to supervisory estimatesThe following table indicates the exposure classes and the respective exposure amounts that are subject to supervisory estimates as at
31 December:
2010 2009
IRB Exposure Class
Sovereign exposures – –
Bank exposures – –
Corporate exposures 28,609 19,468
Total EAD 28,609 19,468
ANNUAL REPORT 2010 257

4. CREDIT RISK uNDER THE INTERNAL RATINGS-BASED APPROACH (continued)
(c) Exposures by IRB calculation approachThe table below shows the Group’s exposures:
AdvancedIRB
approach
Supervisoryslottingcriteria
approach
RetailIRB
approach
Specificrisk-weight
approachTotal
exposures
2010
Sovereign exposures 52,338 – – – 52,338
Bank exposures 229,460 – – – 229,460
Corporate exposures 263,358 28,609 – – 291,967
Retail exposures:
– Residential mortgages to individuals and
property-holding shell companies – – 137,445 – 137,445
– Qualifying revolving retail exposures – – 60,551 – 60,551
– Small business retail exposures – – 4,100 – 4,100
– Other retail exposures to individuals – – 8,313 – 8,313
Other exposures – – – 22,418 22,418
545,156 28,609 210,409 22,418 806,592
2009
Sovereign exposures 76,116 – – – 76,116
Bank exposures 209,757 – – – 209,757
Corporate exposures 187,790 19,468 – – 207,258
Retail exposures:
– Residential mortgages to individuals and
property-holding shell companies – – 121,912 – 121,912
– Qualifying revolving retail exposures – – 50,321 – 50,321
– Small business retail exposures – – 3,398 – 3,398
– Other retail exposures to individuals – – 8,597 – 8,597
Other exposures – – – 15,023 15,023
473,663 19,468 184,228 15,023 692,382
(d) Exposures by credit risk mitigation usedThe table below shows the Group’s exposures (after the effect of any on-balance sheet or off-balance sheet recognised netting) which
are covered by recognised guarantees after the application of haircuts required under the Capital Rules. These exposures exclude OTC
derivative transactions.
2010 2009
Portfolio
Bank exposures 28,492 35,591
Corporate exposures 78,647 66,843
Retail exposures 16,314 15,722
123,453 118,156
For the class of sovereign exposures, there were no exposures covered by recognised guarantees.
HANG SENG BANK258
SuPPLEMENTARY NOTES TO THE FINANCIAL STATEMENTS (uNAuDITED)

4. CREDIT RISK uNDER THE INTERNAL RATINGS-BASED APPROACH (continued)
(e) Risk assessment for exposures under IRB approachThe tables below detail the total EAD of sovereign, bank and corporate exposures by exposure-weighted average risk-weight,
exposure-weighted average PD and exposure-weighted average LGD for each obligor grade as at 31 December.
(i) Sovereign, bank and corporate (other than specialised lending) exposures – analysis by obligor gradeThe exposure of default disclosed below in respect of sovereign, bank and corporate exposures have taken into account the effect of
recognised collateral and recognised guarantees.
2010
Exposure-weighted
averagePD%
Exposure-weighted
averageLGD
%
Exposure-weighted
averagerisk-weight
%
Exposureat default
Sovereign exposure
Minimal default risk 0.01 10.38 1.03 33,968
Low default risk 0.07 44.84 18.12 18,370
52,338
Bank exposure
Minimal default risk 0.03 22.45 4.80 45,397
Low default risk 0.10 31.20 13.27 158,272
Satisfactory default risk 0.30 32.62 29.18 21,799
Fair default risk 1.33 34.52 64.42 3,133
Moderate default risk 2.65 33.38 81.29 434
Significant default risk 5.79 30.55 98.13 365
High default risk 12.70 46.37 209.15 60
229,460
Corporate exposure (other than specialised lending)
Minimal default risk 0.04 40.86 14.89 19,419
Low default risk 0.11 42.82 27.66 89,764
Satisfactory default risk 0.38 45.15 55.26 79,364
Fair default risk 1.29 42.29 88.19 32,163
Moderate default risk 2.97 39.94 112.23 36,637
Significant default risk 6.98 43.59 160.10 1,779
High default risk 12.54 41.58 192.26 1,674
Special management 19.31 35.92 187.67 547
Default 100.00 53.01 – 2,011
263,358
ANNUAL REPORT 2010 259

4. CREDIT RISK uNDER THE INTERNAL RATINGS-BASED APPROACH (continued)
(e) Risk assessment for exposures under IRB approach (continued)
(i) Sovereign, bank and corporate (other than specialised lending) exposures – analysis by obligor grade (continued)
2009
Exposure-weightedaverage
PD%
Exposure-weightedaverage
LGD%
Exposure-weightedaverage
risk-weight%
Exposureat default
Sovereign exposure
Minimal default risk 0.01 10.08 0.93 68,919
Low default risk 0.06 44.60 13.30 7,197
76,116
Bank exposure
Minimal default risk 0.03 23.53 5.15 55,748
Low default risk 0.08 29.63 12.18 123,971
Satisfactory default risk 0.24 31.75 26.97 25,212
Fair default risk 1.02 42.32 74.49 4,620
Moderate default risk 2.58 31.18 73.69 136
Significant default risk 5.07 24.56 73.18 36
High default risk 12.83 20.53 92.89 34
209,757
Corporate exposure (other than specialised lending)
Minimal default risk 0.04 38.63 14.99 19,552
Low default risk 0.10 45.00 25.58 56,105
Satisfactory default risk 0.40 43.29 53.32 54,318
Fair default risk 1.22 42.79 87.93 26,202
Moderate default risk 2.99 40.86 116.44 20,468
Significant default risk 6.30 44.63 160.51 5,112
High default risk 12.74 49.13 235.09 2,431
Special management 26.51 41.82 214.06 1,364
Default 100.00 51.91 – 2,238
187,790
(ii) Corporate exposures (specialised lending) – analysis by supervisory rating grade
2010 2009
Exposure-weighted
averagerisk-weight
%
Exposureat default
Exposure-weightedaverage
risk-weight%
Exposureat default
Obligor Grade
Strong 66.15 22,532 64.32 14,460
Good 91.29 4,332 91.02 3,488
Satisfactory 121.90 1,745 121.90 1,520
Weak – – – –
28,609 19,468
HANG SENG BANK260
SuPPLEMENTARY NOTES TO THE FINANCIAL STATEMENTS (uNAuDITED)

4. CREDIT RISK uNDER THE INTERNAL RATINGS-BASED APPROACH (continued)
(e) Risk assessment for exposures under IRB approach (continued)
(iii) Retail exposures – analysis by credit qualityThe table below shows a breakdown of exposures (the EAD of on-balance sheet exposures and off-balance sheet exposures) on a pool
basis by credit quality classification:
Residentialmortgages
Qualifyingrevolving
retailexposures
Smallbusiness
retailexposures
Otherretail
exposuresTotal
exposures
2010
Strong 136,621 51,821 4,085 6,319 198,846
Medium 557 8,434 – 1,912 10,903
Sub-standard – 286 – 52 338
Impaired 267 10 15 30 322
137,445 60,551 4,100 8,313 210,409
2009
Strong 120,465 42,897 3,327 6,412 173,101
Medium 996 7,075 56 2,076 10,203
Sub-standard – 336 – 79 415
Impaired 451 13 15 30 509
121,912 50,321 3,398 8,597 184,228
(iv) Undrawn commitmentsThe table below shows the amount of undrawn commitments and exposure-weighted average EAD for sovereign, bank and corporate
exposures as at 31 December 2010:
2010 2009
undrawncommitments
Exposure-weighted
averageEAD
Undrawncommitments
Exposure-weightedaverage
EAD
Sovereign exposures – – – –
Bank exposures 738 378 803 303
Corporate exposures 109,653 39,456 81,348 32,029
110,391 39,834 82,151 32,332
ANNUAL REPORT 2010 261

4. CREDIT RISK uNDER THE INTERNAL RATINGS-BASED APPROACH (continued)
(f) Analysis of actual loss and estimatesThe table below shows the actual losses which represent the net charges (including write-offs and impairment loss allowances) made
during the year.
2010 2009
Exposure Class
Sovereign – –
Bank (10) 10
Corporate 346 413
Residential mortgage (45) (59)
Qualifying revolving retail 332 463
Other retail 51 131
674 958
The actual loss in 2010 improved since overall economic conditions further improved in 2010.
The table below shows the expected loss which is the estimated future loss over a one-year time horizon for different exposure classes
under IRB approach.
31 December2009
31 December2008
Exposure Class
Sovereign 3 2
Bank 77 191
Corporate 2,203 2,141
Residential mortgage 156 231
Qualifying revolving retail 347 301
Other retail 158 107
2,944 2,973
It should be noted that actual loss and expected loss are measured and calculated using different methodologies which may not be
directly comparable. The limitation arises mainly from the fundamental differences in the definition of “loss” under expected loss calculation
which is derived based on regulatory rules and actual loss includes write-offs and impairment loss allowances.
HANG SENG BANK262
SuPPLEMENTARY NOTES TO THE FINANCIAL STATEMENTS (uNAuDITED)

4. CREDIT RISK uNDER THE INTERNAL RATINGS-BASED APPROACH (continued)
(f) Analysis of actual loss and estimates (continued)
The tables below set out the comparison of the predicted risk estimates of the Group’s credit risk models against actual outcomes of the
wholesale and retail exposures.
(i) Wholesale exposuresRisk estimates as at 31 December 2009 against actual outcome for the year 2010
PD LGD EAD
Actual%
Estimated*%
Actual%
Estimated%
Actual%
Estimated%
Sovereign exposure – 0.04 – 13.34 – 100.00
Bank exposure – 0.71 – 28.55 – 98.22
Corporate exposure 0.23 1.54 34.95 44.75 80.22 79.08
* Remarks: Estimated PD has excluded default customers as of 31 Dec 2009
Risk estimates as at 31 December 2008 against actual outcome for the year 2009
PD LGD EAD
Actual%
Estimated%
Actual%
Estimated%
Actual%
Estimated%
Sovereign exposure – 0.07 – 15.95 – 100.00
Bank exposure – 0.56 76.35 30.53 100.00 99.84
Corporate exposure 1.38 4.10 46.82 45.21 72.66 83.34
The actual PD rate is measured by using the number of obligor defaulted during the reporting period whereas the estimated PD rate is the
long run average default rate estimated at the beginning of the reporting period. The PD estimated by internal model is calibrated to the
Group’s long run default experience. Hence, actual default rate in a particular year (“point-in-time”) will typically differ from the estimated
PD which is the “through the cycle” estimates as economies move above or below cyclical norms.
The predicted LGD is the exposure weighted average LGD for the portfolio, adjusted by a downturn factor, as of the beginning of the
reporting period whereas the actual LGD is computed using the resolved default cases accumulated in 2010 which covers cases defaulted
before 2010. No default and loss has been observed for Bank and Sovereign exposures during the reporting period.
The estimated EAD% represents the ratio of total model estimated exposure values to total limits for the portfolio at the beginning of the
reporting period. The actual EAD% compares the realised EAD of the defaulted and resolved cases in 2010 against the limits 1 year prior
to default.
ANNUAL REPORT 2010 263

4. CREDIT RISK uNDER THE INTERNAL RATINGS-BASED APPROACH (continued)
(f) Analysis of actual loss and estimates (continued)
(ii) Retail exposuresRisk estimates as at 31 December 2009 against actual outcome for the year 2010
PD LGD EAD
Actual%
Estimated*%
Actual%
Estimated%
Actual%
Estimated%
Residential mortgages to individuals and property-holding shell companies 0.20 0.66 0.61 10.39 89.46 100.00
Qualifying revolving retail exposures 0.36 0.61 89.82 85.40 87.90 95.26
Small business retail exposures 0.40 0.60 0.29 11.58 93.31 100.00
Other retail exposures to individuals 1.79 2.60 63.99 63.43 68.69 93.97
* Remarks: Estimated PD has excluded default customers as of 31 Dec 2009
Risk estimates as at 31 December 2008 against actual outcome for the year 2009
PD LGD EAD
Actual%
Estimated%
Actual%
Estimated%
Actual%
Estimated%
Residential mortgages to individuals and property-holding shell companies 0.34 1.68 3.34 11.24 93.33 100.00
Qualifying revolving retail exposures 0.70 0.73 89.56 86.17 89.35 85.00
Small business retail exposures 0.87 1.43 0.05 11.48 92.06 100.00
Other retail exposures to individuals 3.64 4.20 63.86 70.93 64.30 98.71
As there may be different portfolios reported under one retail asset class, portfolios with no default since model implementation are
excluded from the estimated and actual comparison of the asset class concerned to eliminate distortion.
The actual and estimated PD rate are measured in the same ways as wholesale exposure.
The actual LGD for the retail exposures takes into account the 24-months recovery period and represents the realised LGD for cases
defaulted during 2008 which were recovered within 24 months after default. The predicted LGD is the exposure weighted average LGD
for the defaulted cases estimated prior to default. The actual LGD for qualifying revolving retail exposures in 2010 are slightly higher than
the estimation since the recovery period covered the post-Financial Tsunami downturn period. The recent default data will be reflected in
the review of internal models going forward.
The estimated EAD% represents the ratio of total model estimated EAD to total limits for cases defaulted during 2010 whereas the
actual EAD% compares the exposure values of the cases defaulted in 2010 at the time of default against the maximum limit 1 year prior
to default.
HANG SENG BANK264
SuPPLEMENTARY NOTES TO THE FINANCIAL STATEMENTS (uNAuDITED)

5. CREDIT RISK uNDER THE STANDARDISED (CREDIT RISK) APPROACH(a) Ratings from External Credit Assessment Institutions (“ECAIs”)The Group uses the following ECAIs to calculate its capital adequacy requirements under the standardised (credit risk) approach prescribed
in the Capital Rules:
– Fitch Ratings
– Moody’s Investors Service
– Standard & Poor’s Ratings Services, and
– Rating and Investment Information, Inc.
Where exposures have been rated by the above-mentioned ECAIs, they are categorised under the following class of exposures:
– Sovereign exposures
– Public sector entity exposures
– Multilateral development bank exposures
– Bank exposures
– Securities firm exposures
– Corporate exposures
– Collective investment scheme exposures
The process used to map ECAIs issuer ratings or ECAIs issue specific ratings in the Group’s banking book is consistent with those
prescribed in the Capital Rules.
(b) Credit risk mitigationAs stated in sections 98 and 99 of the Capital Rules, certain guarantees and credit derivative contracts are recognised for credit risk
mitigation purposes. The main types of guarantees are from sovereigns, corporate and banks. With corporate guarantees, in order for it to
be recognised as a credit risk mitigants, it must have a credit rating of A- or better by Standard & Poor’s Ratings Services, Fitch Ratings
and Rating and Investment Information, Inc, or a credit rating of A3 or better by Moody’s Investors Service.
ANNUAL REPORT 2010 265

5. CREDIT RISK uNDER THE STANDARDISED (CREDIT RISK) APPROACH (continued)
(c) Credit risk exposures under the standardised (credit risk) approach
Total exposures
Exposures after recognised credit risk
mitigation Risk-weighted amountsTotal risk-weighted amounts
Total exposures
covered by recognised
collateral
Total exposures
covered by recognised guarantees
or recognised
credit derivative contracts* Rated unrated Rated unrated
2010 Class of exposures
On-balance sheet
Sovereign – – 1,147 – – – – –
Public sector entity 16,103 16,003 104 2,153 21 2,174 – –
Multilateral development bank 21,761 21,761 – – – – – –
Bank 185 – 185 – 46 46 – –
Securities firm – – – – – – – –
Corporate 13,959 16 11,726 3 11,726 11,729 1,098 1,119
Collective investment scheme 53 – 53 – 53 53 – –
Cash items – – – – – – – –
Regulatory retail 2,997 – 2,131 – 1,599 1,599 838 28
Residential mortgage loan 14,682 – 14,644 – 8,392 8,392 34 4
Other exposures which are not past due exposures 7,747 – 4,426 – 4,426 4,426 3,321 –
Past due exposures 188 – 188 – 272 272 11 –
77,675 37,780 34,604 2,156 26,535 28,691 5,302 1,151
Off-balance sheet
Off-balance sheet exposures other than OTC derivative transactions or credit derivative contracts 3,637 19 3,457 – 3,471 3,471 161 3
OTC derivative contracts 224 2 222 – 211 211 – –
Credit derivative contracts – – – – – – – –
Other off-balance sheet exposures not elsewhere specified – – – – – – – –
3,861 21 3,679 – 3,682 3,682 161 3
Total 81,536 37,801 38,283 2,156 30,217 32,373 5,463 1,154
Exposures deducted from capital base –
* Principal amount or credit equivalent amount, as applicable, net of specific provisions.
HANG SENG BANK266
SuPPLEMENTARY NOTES TO THE FINANCIAL STATEMENTS (uNAuDITED)

5. CREDIT RISK uNDER THE STANDARDISED (CREDIT RISK) APPROACH (continued)
(c) Credit risk exposures under the standardised (credit risk) approach (continued)
Total exposures
Exposures after recognised credit risk mitigation Risk-weighted amounts
Total risk-weighted amounts
Total exposures
covered by recognised
collateral
Total exposures
covered by recognised guarantees
or recognised credit
derivative contracts* Rated Unrated Rated Unrated
2009Class of exposures
On-balance sheet
Sovereign – – 2,002 – – – – –
Public sector entity 14,882 14,327 69 1,107 14 1,121 – 490
Multilateral development bank 16,094 16,094 – – – – – –
Bank 39 – 39 – 12 12 – –
Securities firm – – – – – – – –
Corporate 11,974 397 3,502 198 3,701 3,899 6,644 1,431
Collective investment scheme 48 – 48 – 48 48 – –
Cash items – – – – – – – –
Regulatory retail 2,721 – 2,529 – 1,896 1,896 111 81
Residential mortgage loan 14,256 – 14,239 – 8,753 8,753 13 4
Other exposures which are not past due exposures 5,435 – 4,987 – 4,987 4,987 448 –
Past due exposures 400 – 400 – 598 598 4 –
65,849 30,818 27,815 1,305 20,009 21,314 7,220 2,006
Off-balance sheet
Off-balance sheet exposures other than OTC derivative transactions or credit derivative contracts 2,070 129 1,602 26 1,573 1,599 339 14
OTC derivative contracts 196 3 193 1 183 184 – –
Credit derivative contracts – – – – – – – –
Other off-balance sheet exposures not elsewhere specified – – – – – – – –
2,266 132 1,795 27 1,756 1,783 339 14
Total 68,115 30,950 29,610 1,332 21,765 23,097 7,559 2,020
Exposures deducted from capital base –
* Principal amount or credit equivalent amount, as applicable, net of specific provisions.
ANNUAL REPORT 2010 267

6. COuNTERPARTY CREDIT RISK-RELATED EXPOSuRES(a) In respect of counterparty credit risk exposures which arises from over-the-counter (“OTC”) derivative transactions and repo-style
transactions (referred as “relevant transaction”) hereunder, credit limit to counterparty credit risk arising from the relevant transaction is
assigned, monitored and reported in accordance with the Group risk methodology. The credit limit established takes into account the
gross contract amount and the future potential exposure measured on the basis of 95 percentile potential worst case loss estimates for
the product involved. This method of calculating credit limit applies to all counterparties.
Credit equivalent amount and risk-weighted amount of relevant transaction is determined following the regulatory capital requirements.
Risk-weighted amount is calculated in accordance with the counterparty risk weighting as per internal ratings-based approach/standardised
(credit risk) approach under the Capital Rules.
The policy for secured collateral on derivatives is guided by the Group’s internal Best Practice Guidelines ensuring the due-diligence
necessary to fully understand the effectiveness of netting and collateralisation by jurisdiction, counterparty, product and agreement type
is fully assessed and that the due-diligence standards are high and consistently applied. The Group's policies for establishing provisions
are discussed in note 4(f) – Loan impairment.
(b) Counterparty credit risk exposuresThe following tables show the counterparty credit risk exposures under the internal-ratings based approach and standardised (credit risk)
approach. There was no outstanding repo-style transactions and credit derivative contracts at 31 December 2010 (2009: Nil).
(i) Counterparty credit risk exposures under the internal-ratings based approach
2010 2009
OTC derivative transactions:
Gross total positive fair value which are not repo-style transactions 4,589 4,398
Credit equivalent amount 6,799 10,135
Value of recognised collateral by type:
Debt securities – –
Others – –
– –
Credit equivalent amount or net credit exposures net of recognised collateral held 6,799 10,135
Risk-weighted amount 2,657 1,499
Notional amount of recognised credit derivative contracts which provide credit protection – –
(ii) Counterparty credit risk exposures under the standardised (credit risk) approach
2010 2009
OTC derivative transactions:
Gross total positive fair value which are not repo-style transactions 98 119
Credit equivalent amount 224 196
Value of recognised collateral by type:
Debt securities – –
Others – –
– –
Credit equivalent amount or net credit exposures net of recognised collateral held 224 196
Risk-weighted amount 211 184
Notional amount of recognised credit derivative contracts which provide credit protection – –
HANG SENG BANK268
SuPPLEMENTARY NOTES TO THE FINANCIAL STATEMENTS (uNAuDITED)

6. COuNTERPARTY CREDIT RISK-RELATED EXPOSuRES (continued)
(c) Major classes of exposures by counterparty type(i) Major classes of exposures under the internal ratings-based approach by counterparty type
2010 2009
Contract amount
Credit equivalent
amount
Risk-weighted
amountContract amount
Credit equivalent
amount
Risk-weighted
amount
Sovereign – – – – – –
Public sector entities – – – – – –
Banks 703,961 4,212 521 582,150 9,081 878
Corporates 125,370 2,587 2,136 37,478 1,054 621
829,331 6,799 2,657 619,628 10,135 1,499
(ii) Major classes of exposures under the standardised (credit risk) approach by counterparty type
2010 2009
Contract amount
Credit equivalent
amount
Risk-weighted
amountContract amount
Credit equivalent
amount
Risk-weighted
amount
Sovereign – – – – – –
Public sector entities 39 2 – 438 3 1
Banks – – – – – –
Corporates 9,414 222 211 3,212 193 183
9,453 224 211 3,650 196 184
7. ASSET SECuRITISATIONThere was no asset securitisation for which the Group is an originating institution or an investing institution at 31 December 2010 (2009: Nil).
8. MARKET RISKThe Hong Kong Monetary Authority has granted approval under section 18(2)(a) and 18(5) of the Capital Rules for the Group to use the
internal models approach to calculate its market risk for foreign exchange risk and general interest rate risk. Standardised approach is
used for the calculation of specific interest rate risk, equity risk and commodity risk.
2010 2009
Market risk calculated by:
– Internal models approach:
– foreign exchange exposures and general interest rate exposures 118 91
– Standardised approach:
– specific interest rate exposures 10 10
– equity exposures 1 1
Total capital charge for market risk 129 102
ANNUAL REPORT 2010 269

9. OPERATIONAL RISKThe Hong Kong Monetary Authority has granted approval under section 25(2) of the Capital Rules for the Group to use the standardised
approach to calculate its operational risk.
2010 2009
Capital charge for operational risk 2,948 3,121
10. EQuITY EXPOSuRES IN BANKING BOOKInvestments in equity shares which are intended to be held on a continuing basis, but which do not comprise investments in associates, jointly
controlled entities or subsidiaries, are classified as available-for-sale securities and are reported in the balance sheet as “Financial investments”.
Available-for-sale securities are measured at fair value as described in notes 4(g)(iii) and 4(n) on the financial statements. Included within this
category are investments made by the Group for strategic purposes, which are subject to additional internal procedures and approvals to ensure
that the investment is in accordance with the Group’s strategy and to ensure compliance with all relevant regulatory and legal restrictions. In
some cases, additional investments may be made later such that the investee becomes an associate, jointly controlled entity or subsidiary, at
which point the investment is reclassified in accordance with the Group’s accounting policies.
2010 2009
Cumulative realised gains on disposal 10 161
Unrealised gains:
– recognised in reserve but not through the income statement 188 199
– deducted from the supplementary capital – –
11. DISCLOSuRE FOR SELECTED EXPOSuRE(a) Holding of debt securities issued by Federal National Mortgage Association and the Federal Home Loan
Mortgage CorporationThe table below shows the Group’s exposures to the senior debt securities (AAA rated) issued by the Federal National Mortgage
Association and the Federal Home Loan Mortgage Corporation.
Grossprincipal
Fairvalue
At 31 December 2010 37 38
At 31 December 2009 45 47
The Group did not hold any asset-backed securities, mortgage-backed securities and collateralised debt obligations.
(b) Involvement with Special Purpose Entities (SPEs)From time to time, the Group enters into certain transactions with customers in the ordinary course of business which involve the
establishment of SPEs. The use of SPEs is not a significant part of the Group’s activities and the Group is not reliant on SPEs for any
material part of its business operations or profitability.
HANG SENG BANK270
SuPPLEMENTARY NOTES TO THE FINANCIAL STATEMENTS (uNAuDITED)

12. ANALYSIS OF GROSS ADVANCES TO CuSTOMERS BY CATEGORIES BASED ON INTERNAL CLASSIFICATION uSED BY THE GROuP
Gross advances, impaired advances, individually assessed and collectively assessed loan impairment allowances, the amount of new
impairment allowances charged to income statement, and the amount of impaired loans and advances written off during the year in
respect of industry sectors which constitute not less than 10 per cent of gross advances to customers are analysed as follows:
Group
Grossadvances
Impairedadvances
Individuallyassessed
loanimpairmentallowances
Collectivelyassessed
loanimpairmentallowances
Newimpairmentallowances
Advanceswritten off
duringthe year
2010
Residential mortgages 135,515 149 – (55) 1 1
Commercial, industrial and international trade 119,841 1,536 (1,086) (506) 447 100
Other property-related lending 94,060 84 (23) (36) 22 66
2009
Residential mortgages 116,746 308 (5) (87) 2 2
Commercial, industrial and international trade 61,676 1,615 (972) (484) 520 384
Other property-related lending 63,166 256 (70) (76) 25 2
13. NON-BANK MAINLAND EXPOSuRESThe analysis of non-bank Mainland exposures is based on the categories of non-bank counterparties and the type of direct exposures
defined by the Hong Kong Monetary Authority under the Banking (Disclosure) Rules with reference to the Hong Kong Monetary Authority
return for non-bank Mainland exposures, which includes the Mainland exposures extended by the Bank and its overseas branches and
overseas subsidiaries only.
On-balancesheet
exposure
Off-balancesheet
exposureTotal
exposures
Individuallyassessed
allowances
2010
Mainland entities 20,940 6,036 26,976 –
Companies and individuals outside Mainland where the credit is granted for use in Mainland 9,177 2,278 11,455 31
Other counterparties where the exposure is considered by the Bank to be non-bank Mainland exposure 738 28 766 –
30,855 8,342 39,197 31
Exposures incurred by the Bank’s mainland subsidiary 36,318 40,837 77,155 229
67,173 49,179 116,352 260
2009
Mainland entities 9,241 1,911 11,152 –
Companies and individuals outside Mainland where the credit is granted for use in Mainland 6,644 2,653 9,297 50
Other counterparties where the exposure is considered by the Bank to be non-bank Mainland exposure 45 – 45 –
15,930 4,564 20,494 50
Exposures incurred by the Bank’s mainland subsidiary 28,038 10,095 38,133 183
43,968 14,659 58,627 233
ANNUAL REPORT 2010 271

14. CROSS-BORDER CLAIMSCross-border claims include receivables and loans and advances, and balances due from banks and holdings of certificates of deposit,
bills, promissory notes, commercial paper and other negotiable debt instruments, as well as accrued interest and overdue interest on
these assets. Claims are classified according to the location of the counterparties after taking into account the transfer of risk. For a claim
guaranteed by a party situated in a country different from the counterparty, the risk will be transferred to the country of the guarantor. For
a claim on the branch of a bank or other financial institutions, the risk will be transferred to the country where its head office is situated.
Claims on individual countries or areas, after risk transfer, amounting to 10 per cent or more of the aggregate cross-border claims are
shown as follows:
Banks& other
financialinstitutions
Publicsector
entitiesSovereign
& other Total
2010
Asia-Pacific excluding Hong Kong:
– China 75,515 – 23,467 98,982
– Japan 4,750 – 5,174 9,924
– Other 24,331 1,506 8,886 34,723
104,596 1,506 37,527 143,629
The Americas:
– United States 40,199 38 5,405 45,642
– Other 2,975 1,458 12,920 17,353
43,174 1,496 18,325 62,995
Europe:
– United Kingdom 24,954 – 1,523 26,477
– Other 41,492 6,671 9,949 58,112
66,446 6,671 11,472 84,589
2009
Asia-Pacific excluding Hong Kong:
– China 24,034 – 16,124 40,158
– Japan 8,320 – 45,952 54,272
– Other 37,436 589 8,140 46,165
69,790 589 70,216 140,595
The Americas:
– United States 39,941 45 10,259 50,245
– Other 4,762 694 13,005 18,461
44,703 739 23,264 68,706
Europe:
– United Kingdom 37,510 – 4,066 41,576
– Other 47,799 12,454 7,990 68,243
85,309 12,454 12,056 109,819
HANG SENG BANK272
SuPPLEMENTARY NOTES TO THE FINANCIAL STATEMENTS (uNAuDITED)

Shareholders Shares of HK$5 each
As at 31 December 2010 NumberPercentage
of totalNumber in
millionsPercentage
of total
Number of shares held
1 – 500 6,506 33.18 1.6 0.08
501 – 2,000 6,247 31.84 7.6 0.40
2,001 – 5,000 3,271 16.68 11.2 0.59
5,001 – 20,000 2,733 13.94 27.9 1.46
20,001 – 50,000 549 2.80 17.1 0.89
50,001 – 100,000 168 0.86 12.3 0.64
100,001 – 200,000 77 0.39 10.9 0.57
Over 200,000 61 0.31 1,823.2 95.37
19,612 100.00 1,911.8 100.00
Geographical Distribution
Hong Kong 19,260 98.21 1,908.4 99.82
Malaysia 70 0.36 0.5 0.03
Singapore 47 0.24 2.0 0.11
Macau 31 0.16 0.1 0.01
Canada 61 0.31 0.2 0.01
United Kingdom 36 0.18 0.1 0.00
United States of America 39 0.20 0.3 0.01
Australia 37 0.19 0.1 0.00
Others 31 0.15 0.1 0.01
19,612 100.00 1,911.8 100.00
ANNUAL REPORT 2010 273
ANALYSIS OF SHAREHOLDERS
Everlasting International Limited
Fulcher Enterprises Company Limited
Full Wealth Investment Limited
Hang Seng Asset Management Pte Ltd
Hang Seng Bank (Bahamas) Limited
Hang Seng Bank (China) Limited
Hang Seng Bank (Trustee) Limited
Hang Seng Bank Trustee International Limited
Hang Seng Bullion Company Limited
Hang Seng Credit Limited
Hang Seng Credit (Bahamas) Limited
Hang Seng Data Services Limited
Hang Seng Finance Limited
Hang Seng Finance (Bahamas) Limited
Hang Seng Financial Information Limited
Hang Seng Futures Limited
Hang Seng General Insurance (Hong Kong) Company Limited
Hang Seng Indexes Company Limited
Hang Seng Insurance Company Limited
Hang Seng Insurance (Bahamas) Limited
Hang Seng Investment Management Limited
Hang Seng Investment Services Limited
Hang Seng Life Limited
Hang Seng (Nominee) Limited
Hang Seng Real Estate Management Limited
Hang Seng Security Management Limited
Hang Seng Securities Limited
Haseba Investment Company Limited
Hayden Lake Limited
High Time Investments Limited
HSI International Limited
Imenson Limited
Mightyway Investments Limited
Silver Jubilee Limited
Yan Nin Development Company Limited
* As defined in Section 2 of Hong Kong Companies Ordinance.
HANG SENG BANK274
SuBSIDIARIES*

CORPORATE INFORMATIONHonorary Senior Advisor to the BankThe Honourable Lee Quo-Wei GBM, JP
BOARD OF DIRECTORSChairmanRaymond K F Ch’ien GBS, CBE, JP
Vice-ChairmanMargaret Leung JP
DirectorsJohn C C Chan GBS, JP
Marvin K T Cheung GBS, OBE, JP
L Y Chiang
Jenkin Hui
Sarah C Legg
William W Leung BBS, JP
Eric K C Li GBS, OBE, JP
Vincent H S Lo GBS, JP
Mark S McCombe OBE
Dorothy K Y P Sit
Richard Y S Tang BBS, JP
Peter T S Wong JP
Michael W K Wu
SecretaryC C Li
REGISTERED OFFICE83 Des Voeux Road Central, Hong Kong
Telephone: (852) 2198 1111
Facsimile: (852) 2868 4047
Telex: 73311 73323
SWIFT: HASE HK HH
Website: www.hangseng.com
STOCK CODEThe Stock Exchange of Hong Kong Limited: 11
REGISTRARComputershare Hong Kong Investor Services Limited
Shops 1712-1716, 17th Floor, Hopewell Centre
183 Queen’s Road East, Wanchai, Hong Kong
DEPOSITARY *The Bank of New York Mellon
BNY Mellon Shareowner Services
PO Box 358516
Pittsburgh, PA 15252-8516, USA
Telephone: 1-201-680-6825
Toll free (domestic): 1-888-BNY-ADRS
Website: www.bnymellon.com\shareowner
Email: [email protected]
* The Bank offers investors in the United States a
Sponsored Level-1 American Depositary Receipts
Programme through The Bank of New York Mellon.
ANNuAL REPORT 2010This Annual Report 2010 in both English and Chinese is now
available in printed form and on the Bank’s website
(www.hangseng.com) and the website of Hong Kong
Exchanges and Clearing Limited (“HKEX”)
(www.hkexnews.hk).
Shareholders who:
A) browse this Annual Report 2010 on the Bank’s website
and wish to receive a printed copy; or
B) receive this Annual Report 2010 in either English or
Chinese and wish to receive a printed copy in the other
language version,
may send a request form, which can be obtained from the
Bank’s Registrar or downloaded from the Bank’s website
(www.hangseng.com) or HKEX’s website
(www.hkexnews.hk), to the Bank’s Registrar:
Computershare Hong Kong Investor Services Limited
17M Floor, Hopewell Centre
183 Queen’s Road East
Wanchai, Hong Kong
Facsimile: (852) 2529 6087
Email: [email protected]
If shareholders who have chosen (or are deemed to have
chosen) to read this Annual Report 2010 on the Bank’s
website have difficulty in reading or gaining access to this
Annual Report 2010 via the Bank’s website for any reason,
the Bank will promptly send this Annual Report 2010 in
printed form free of charge upon the shareholders’ request.
Shareholders may change their choice of means of receipt
or language of the Bank’s future corporate communications
at any time, free of charge, by giving the Bank c/o the
Bank’s Registrar reasonable notice in writing or by email to
ANNUAL REPORT 2010 275
CORPORATE INFORMATION AND CALENDAR

CALENDAR2010 Full Year ResultsAnnouncement date 28 February 2011
2010 Fourth Interim Dividend*Announcement date 28 February 2011
Book close and record date 15 March 2011
Payment date 30 March 2011
2010 Annual Reportto be posted to shareholders in late March 2011
Annual General Meetingto be held on 13 May 2011
2011 Half Year ResultsAnnouncement date 1 August 2011
2011 Interim Reportto be posted to shareholders in late August 2011
Proposed dates for 2011:2011 First Interim DividendAnnouncement date 3 May 2011
Book close and record date 19 May 2011
Payment date 2 June 2011
2011 Second Interim DividendAnnouncement date 1 August 2011
Book close and record date 17 August 2011
Payment date 1 September 2011
2011 Third Interim DividendAnnouncement date 7 November 2011
Book close and record date 23 November 2011
Payment date 8 December 2011
2011 Full Year ResultsAnnouncement date 27 February 2012
2011 Fourth Interim DividendAnnouncement date 27 February 2012
Book close and record date 14 March 2012
Payment date 29 March 2012
* The Register of Shareholders of the Bank will be closed on Tuesday,
15 March 2011, during which no transfer of shares can be registered.
To qualify for the fourth interim dividend, all transfers, accompanied
by the relevant share certificates, must be lodged with the Bank’s
Registrar, Computershare Hong Kong Investor Services Limited,
at Shops 1712-1716, 17th Floor, Hopewell Centre, 183 Queen’s Road
East, Wanchai, Hong Kong, for registration not later than 4:30 pm on
Monday, 14 March 2011. The fourth interim dividend will be payable
on Wednesday, 30 March 2011 to shareholders on the Register of
Shareholders of the Bank on Tuesday, 15 March 2011. Shares of the
Bank will be traded ex-dividend as from Friday, 11 March 2011.
HANG SENG BANK276
CORPORATE INFORMATION AND CALENDAR

© Copyright Hang Seng Bank Limited 2011 All rights reserved
No part of this publication may be reproduced, stored in a retrieval system, or transmitted, in any form or by any means, electronic, mechanical, photocopying, recording, or otherwise, without the prior written permission of Hang Seng Bank Limited.
Published by Hang Seng Bank Limited
Concept and design by YELLOW CREATIVE (HK) LIMITED
Photography by Ringo Tang and Cheung Man Wah
Printed in Hong Kong by Best Tri Printing Company Limited on FSCTM-certified Magno Satin paper using environmentally friendly soy-based inks. With the cover board made in the Netherlands and the text paper in Austria, pulps used are chlorine-free and acid-free.
The FSCTM logo identifies products which contain wood from well-managed forests certified in accordance with the rules of the Forest Stewardship Council.

HANG SENG BANK LIMITED83 Des Voeux Road Central, Hong Kong
HA
NG
SE
NG
BA
NK
LIMIT
ED
Annual R
epo
rt 2010
TAKING THE LEAD
ANNUAL REPORT