Myopic regret avoidance: Feedback avoidance and learning in repeated decision making
Upload
independentCategory
view
3download
0
Energy Conversion and Management 47 (2006) 2250–2259
www.elsevier.com/locate/enconman
Technoeconomic evaluation of IGCC power plantsfor CO2 avoidance
Guillermo Ordorica-Garcia a, Peter Douglas a, Eric Croiset a,*, Ligang Zheng b
a Department of Chemical Engineering, University of Waterloo, 200 University Ave. West, Waterloo, Ont., Canada N2L 3G1b CANMET Energy Technology Centre, Natural Resources Canada, 1 Haanel Rd., Ottawa, Ont., Canada K1A 1M1
Received 24 June 2005; accepted 28 November 2005Available online 9 February 2006
Abstract
Growing electricity demands within the next century imply an expansion in the current power plant fleet. The achieve-ment of the above, coupled with the need for significant reductions in greenhouse gas (GHG) emissions is a challengingtask. Cleaner, more efficient fossil fuel based power plant designs, combined with CO2 capture technologies constitutean attractive option to meet this challenge in the near to medium term. Integrated gasification combined cycle (IGCC)power plants have the lowest carbon dioxide emissions among coal power plants. When combined with a CO2 physicalabsorption system, substantial GHG emissions reductions can be attained. Depending on the degree of capture, the emis-sions can match or become less than those of natural gas fired combined cycle (NGCC) power plants.
This paper is a technical and economic comparison of the performance of five plant designs in the 500 MW outputrange: IGCC without CO2 capture, IGCC with 80% capture, IGCC with CO2 emissions equal to those of a NGCC, IGCCwith CO2 and H2S co-capture, and NGCC without capture. ASPEN PlusTM models of the above plants were developed andthe following plant performance results are discussed: net power output, efficiency, plant ancillary energy requirements andoverall CO2 emissions. Economic evaluations for all cases are presented, including the cost methodology and economicbasis. The capital investment, cost of electricity and carbon dioxide mitigation costs for all plants are detailed andcompared.
The simulation results show that the economics favour higher capture levels in new IGCC plants. The CO2 mitigationcosts corresponding to IGCC plants with 80% capture are slightly lower than those corresponding to IGCC plants withequal emissions to those of NGCC plants (28 vs. 30 US$/tonne CO2 avoided). The capital cost difference (per kW of netinstalled capacity) between the above plants is 7%, while the CO2 emissions of the former are almost half those of the latter.IGCC plants with CO2 and H2S co-capture have substantial technoeconomic advantages over IGCC plants that captureCO2 and H2S separately. Based on a 577 MW IGCC, the power output decreases only to 552 MW for the co-capture case,whereas it drops to 488 MW when CO2 and H2S are captured separately. The incremental capital cost of co-capture plants is6%, and their electricity production cost increase is less than half a cent, with respect to an IGCC without capture. The CO2
mitigation cost of co-capture plants is at least four times lower than their separate CO2 and H2S capture counterparts.� 2005 Elsevier Ltd. All rights reserved.
Keywords: IGCC; CO2 capture; CO2 emissions reduction; CO2/H2S co-capture
0196-8904/$ - see front matter � 2005 Elsevier Ltd. All rights reserved.
doi:10.1016/j.enconman.2005.11.020
* Corresponding author. Tel.: +1 519 888 4567x6472; fax: +1 519 746 4979.E-mail address: [email protected] (E. Croiset).
G. Ordorica-Garcia et al. / Energy Conversion and Management 47 (2006) 2250–2259 2251
1. Introduction
The numerous benefits of IGCC technology, high thermal efficiency, ultra-low NOx, SOx and solids emis-sions as well as marketable by products co-production, are driving it to become commercially competitiveagainst conventional coal fired power plants. Furthermore, IGCC plants can reliably produce hydrogenand carbon dioxide by incorporating a catalyzed water–gas shift reaction in the process. Numerous privatecompanies and research agencies worldwide are increasingly recognizing the above fact. For instance, theUS DOE’s FutureGen programme has recently committed US$1 billion to build a 275 MW advanced IGCCplant by 2008 [1]. The successful first year operation of Nippon Petroleum’s Negishi plant, the world’s latestcommercial IGCC, supports the global market’s positive attitude toward IGCC technology [2].
However, IGCC plants produce large amounts of CO2 that are discharged to the atmosphere, as is the casewith all fossil fuel power plants. Within the context of global greenhouse gas emissions reduction, the nearfuture answer to the above predicament is found in the development of more efficient coal based power plantdesigns with integrated CO2 capture technologies.
Carbon dioxide removal from fossil fuels by means of physical solvents has been practiced since the late1950s in North America. Newman [3] described a natural gas plant that employed Selexol for bulk CO2
removal. The Sarlux IGCC plant, which started commercial operations in 2001, is an example of glycol basedacid gas removal. More recently, O’Keefe et al. [4] studied an IGCC plant in which Selexol was employed forselective H2S and CO2 removal from coal syngas.
No commercial IGCC plant with CO2 capture has been built yet. However, all of the required technology isalready proven in ammonia production and other industrial processes [5]. Breckenridge et al. [6] described acommercial ammonia production plant employing Selexol for simultaneous capture of H2S and CO2 from coalsyngas. Riemer [7] and Newman [3] concluded that Selexol is the best physical solvent for CO2 removal fromIGCC fuel gases due to its relatively lower energy requirements and lower investment costs.
This paper presents a technical and economic comparison of the performance of four IGCC and oneNGCC power plant designs: IGCC without CO2 capture (Case 1), IGCC with 80% capture (Case 2), IGCCwith CO2 emissions equal to those of a NGCC (Case 3), IGCC with CO2 and H2S co-capture (Case 4) andNGCC without capture (Case 5). The modelling of each plant was done in ASPEN PlusTM.
2. Case description
Five cases of power plants fuelled by either Canadian sub-bituminous coal or Western Canadian naturalgas were studied. The coal is Prince coal with a high heating value of 29.4 MJ/kg, and a dry compositionof carbon 70.48%, hydrogen 4.84%, oxygen 7.83%, nitrogen 1.40%, sulphur 3.64% and ash 11.80%.
2.1. Case 1: IGCC without CO2 capture
The IGCC plant has two full size Texaco (now GE Energy) quench gasifiers each one feeding a syngas com-bustor equipped gas turbine. The combined cycle power plant employs two 7FA gas turbines, each oneexhausting to an unfired, free circulation heat recovery steam generator (HRSG). Steam at three pressure lev-els is produced in the HRSGs, and fed to a single, two flow, reheat, condensing GE D-11 steam turbine. Thegasification plant includes a cold gas cleanup section, glycol based sulphur removal and a Claus/SCOTsulphur recovery section. An external cryogenic air separation unit (ASU) supplies 95% purity oxygen, forgasification, and high pressure nitrogen that is injected in the gas turbines for NOx abatement. No air integra-tion exists between the gas turbines and the ASU. The plant’s net power output is 577 MW.
2.2. Case 2: IGCC with 80% CO2 capture
This plant also has two full size GE Energy (formerly Texaco) gasifiers, two gas turbines, each one withtheir respective HRSG, and one steam turbine. However, the syngas produced in the gasifiers, which consistsmostly of CO (39%) and H2 (29%), is steam shifted in two stages to convert most of the CO in the fuel gas toCO2 and H2. The shifted gas is scrubbed a glycol plant, yielding a hydrogen rich fuel and an acid gas stream
2252 G. Ordorica-Garcia et al. / Energy Conversion and Management 47 (2006) 2250–2259
that is processed in a Claus/SCOT section for sulphur recovery. In the glycol plant, 80% of the carbon dioxidecontained in the syngas is captured and compressed to 110 bar (1595 psi). The clean, hydrogen rich fuel gas isdiluted with nitrogen and moisturised with water before entering the gas turbines. The plant’s net power out-put is 488 MW.
2.3. Case 3: IGCC with equal CO2 emissions to those of A NGCC
This plant is identical to the one described in Case 2, but with 60% CO2 capture instead of 80%. This cap-ture level matches the overall plant CO2 emissions (per MW h) of a natural gas power plant of similar capacity(Case 5). The plant’s net power output is 514 MW.
2.4. Case 4: IGCC with CO2 and H2S co-capture
This plant is also based on the plant described in Case 2. The difference is that the CO2 and H2S areremoved from the fuel gas simultaneously in a single step, thereby eliminating the need for a sulphur recoverysection. The absorption plant design is simpler than that in the previous cases, consisting solely of one acid gasabsorber, two stage glycol flash and an acid gas stripper for concurrent CO2 and H2S recovery. These gases areremoved in the absorber and recovered downstream in the flash drums and acid gas stripper. The CO2 capturelevel remains at 80%, while the H2S removal is virtually complete. The acid gas, consisting mainly of CO2 withtraces of H2S (2 ppm), is compressed to an export pressure of 110 bar as in the previous cases. This plant’s netpower output is 552 MW.
2.5. Case 5: NGCC without CO2 capture
This plant is a commercial 60 MHz, GE STAG 207FA combined cycle natural gas power plant similar tothe one described by Chase and Kehoe [8]. The simulation model closely matches General Electric’s specifi-cations. The plant is in a multi-shaft configuration. It has two gas turbines, each one exhausting to an unfired,free circulation HRSG. Three pressure levels steam is produced in the HRSGs and feed a single, two flow,reheat, condensing GE D-11 steam turbine. The plant’s net power output is 528 MW.
3. Simulation results
3.1. CO2 emissions
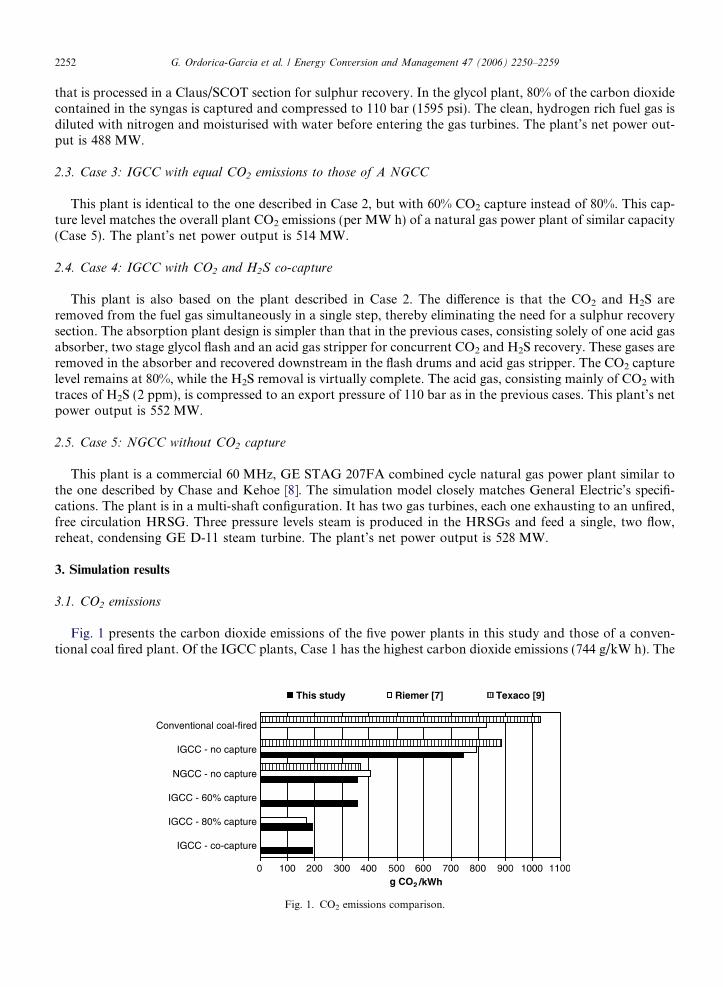
Fig. 1 presents the carbon dioxide emissions of the five power plants in this study and those of a conven-tional coal fired plant. Of the IGCC plants, Case 1 has the highest carbon dioxide emissions (744 g/kW h). The
Fig. 1. CO2 emissions comparison.
G. Ordorica-Garcia et al. / Energy Conversion and Management 47 (2006) 2250–2259 2253
calculated value is in close concordance with the one reported by Riemer [7] and smaller than the value pro-vided by Texaco [9]. From Fig. 1, it is evident that IGCC plants without CO2 capture (Case 1) emit 24% lesscarbon dioxide than a conventional coal fired power plant.
Cases 2 and 4 have the lowest average CO2 emissions of all the plants (193 g/kW h), followed by Cases 3and 5 (358 g/kW h). IGCC plants with 80% CO2 capture (Cases 2 and 4) can cut carbon dioxide emissions toroughly half of those corresponding to an NGCC (193 g CO2/kW h vs. 358 g CO2/kW h).
3.2. Power output
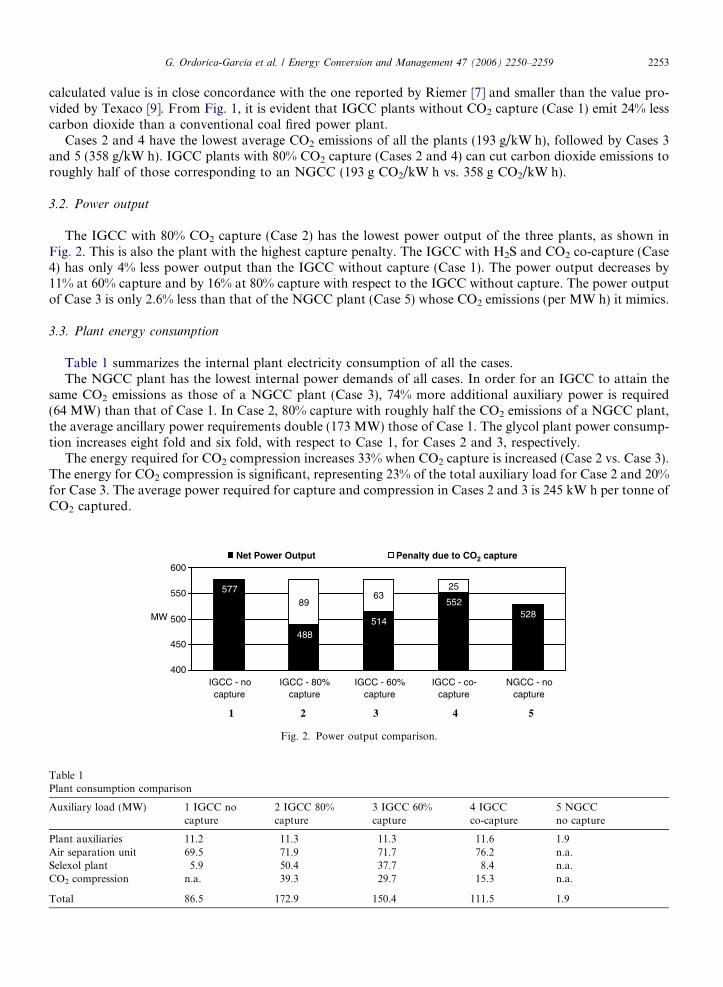
The IGCC with 80% CO2 capture (Case 2) has the lowest power output of the three plants, as shown inFig. 2. This is also the plant with the highest capture penalty. The IGCC with H2S and CO2 co-capture (Case4) has only 4% less power output than the IGCC without capture (Case 1). The power output decreases by11% at 60% capture and by 16% at 80% capture with respect to the IGCC without capture. The power outputof Case 3 is only 2.6% less than that of the NGCC plant (Case 5) whose CO2 emissions (per MW h) it mimics.
3.3. Plant energy consumption
Table 1 summarizes the internal plant electricity consumption of all the cases.The NGCC plant has the lowest internal power demands of all cases. In order for an IGCC to attain the
same CO2 emissions as those of a NGCC plant (Case 3), 74% more additional auxiliary power is required(64 MW) than that of Case 1. In Case 2, 80% capture with roughly half the CO2 emissions of a NGCC plant,the average ancillary power requirements double (173 MW) those of Case 1. The glycol plant power consump-tion increases eight fold and six fold, with respect to Case 1, for Cases 2 and 3, respectively.
The energy required for CO2 compression increases 33% when CO2 capture is increased (Case 2 vs. Case 3).The energy for CO2 compression is significant, representing 23% of the total auxiliary load for Case 2 and 20%for Case 3. The average power required for capture and compression in Cases 2 and 3 is 245 kW h per tonne ofCO2 captured.
577
488514
552528
6325
89
400
450
500
550
600
IGCC - nocapture
IGCC - 80%capture
IGCC - 60%capture
IGCC - co-capture
NGCC - nocapture
MW
Net Power Output Penalty due to CO2 capture
1 2 3 4 5
Fig. 2. Power output comparison.
Table 1Plant consumption comparison
Auxiliary load (MW) 1 IGCC nocapture
2 IGCC 80%capture
3 IGCC 60%capture
4 IGCCco-capture
5 NGCCno capture
Plant auxiliaries 11.2 11.3 11.3 11.6 1.9Air separation unit 69.5 71.9 71.7 76.2 n.a.Selexol plant 5.9 50.4 37.7 8.4 n.a.CO2 compression n.a. 39.3 29.7 15.3 n.a.
Total 86.5 172.9 150.4 111.5 1.9
2254 G. Ordorica-Garcia et al. / Energy Conversion and Management 47 (2006) 2250–2259
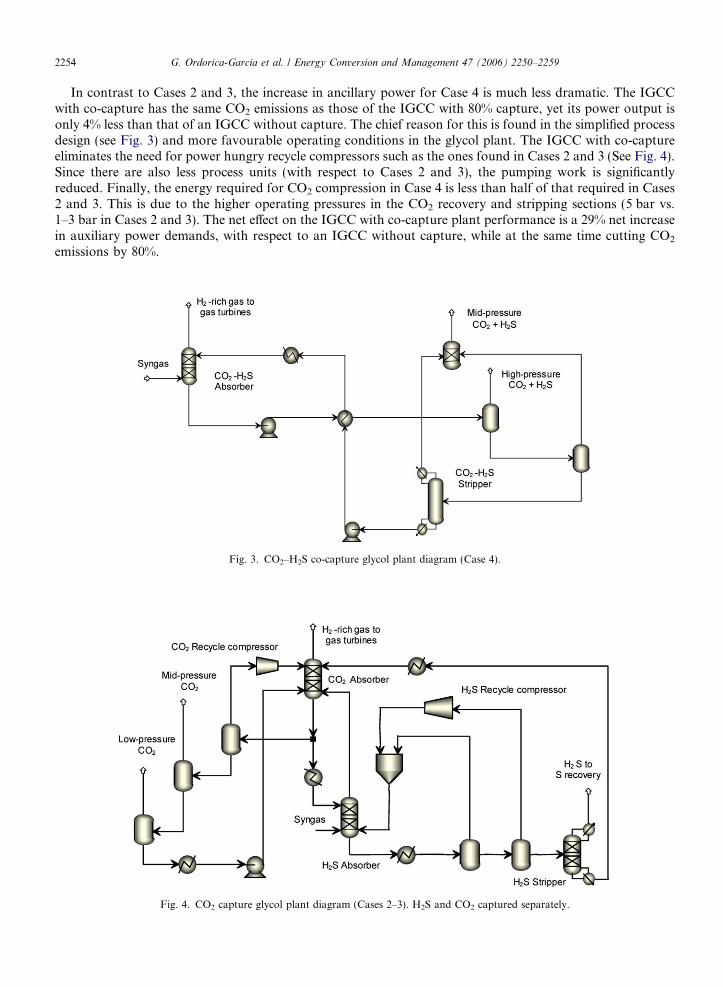
In contrast to Cases 2 and 3, the increase in ancillary power for Case 4 is much less dramatic. The IGCCwith co-capture has the same CO2 emissions as those of the IGCC with 80% capture, yet its power output isonly 4% less than that of an IGCC without capture. The chief reason for this is found in the simplified processdesign (see Fig. 3) and more favourable operating conditions in the glycol plant. The IGCC with co-captureeliminates the need for power hungry recycle compressors such as the ones found in Cases 2 and 3 (See Fig. 4).Since there are also less process units (with respect to Cases 2 and 3), the pumping work is significantlyreduced. Finally, the energy required for CO2 compression in Case 4 is less than half of that required in Cases2 and 3. This is due to the higher operating pressures in the CO2 recovery and stripping sections (5 bar vs.1–3 bar in Cases 2 and 3). The net effect on the IGCC with co-capture plant performance is a 29% net increasein auxiliary power demands, with respect to an IGCC without capture, while at the same time cutting CO2
emissions by 80%.
Fig. 3. CO2–H2S co-capture glycol plant diagram (Case 4).
Fig. 4. CO2 capture glycol plant diagram (Cases 2–3). H2S and CO2 captured separately.
34.4 36 35.4
52.6
35
41
0
10
20
30
40
50
60
IGCC - nocapture
IGCC - 80%capture
IGCC - 60%capture
IGCC - co-capture
NGCC - nocapture
Conventionalcoal-fired
%
Efficiency (HHV) Efficiency penalty due to CO2 capture
1 2 3 4 5
Fig. 5. Efficiency comparison.
G. Ordorica-Garcia et al. / Energy Conversion and Management 47 (2006) 2250–2259 2255
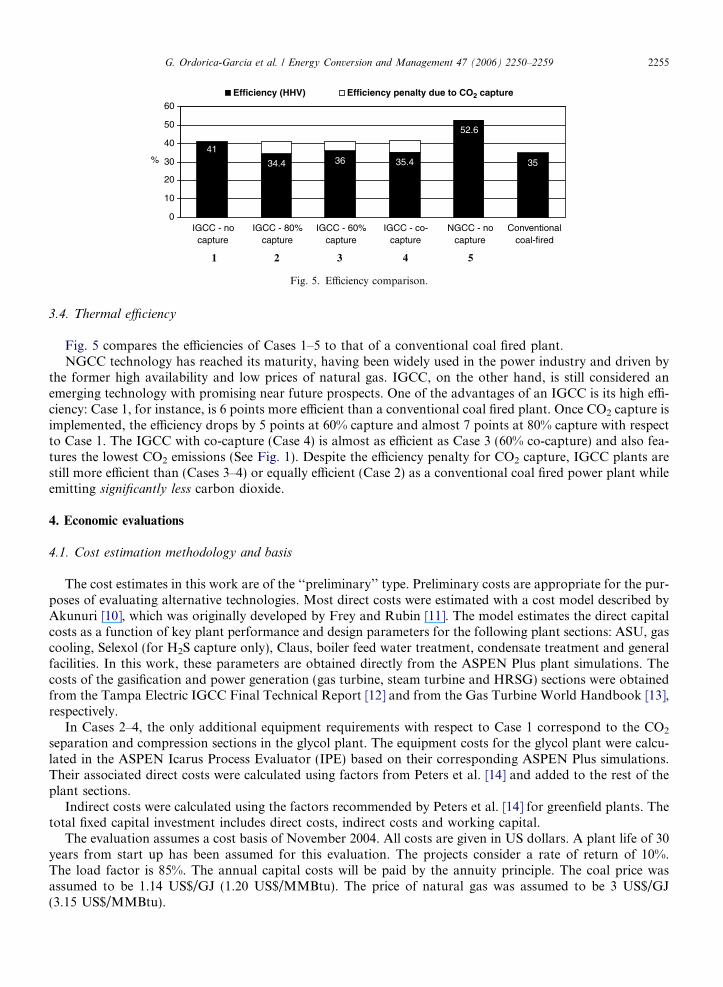
3.4. Thermal efficiency
Fig. 5 compares the efficiencies of Cases 1–5 to that of a conventional coal fired plant.NGCC technology has reached its maturity, having been widely used in the power industry and driven by
the former high availability and low prices of natural gas. IGCC, on the other hand, is still considered anemerging technology with promising near future prospects. One of the advantages of an IGCC is its high effi-ciency: Case 1, for instance, is 6 points more efficient than a conventional coal fired plant. Once CO2 capture isimplemented, the efficiency drops by 5 points at 60% capture and almost 7 points at 80% capture with respectto Case 1. The IGCC with co-capture (Case 4) is almost as efficient as Case 3 (60% co-capture) and also fea-tures the lowest CO2 emissions (See Fig. 1). Despite the efficiency penalty for CO2 capture, IGCC plants arestill more efficient than (Cases 3–4) or equally efficient (Case 2) as a conventional coal fired power plant whileemitting significantly less carbon dioxide.
4. Economic evaluations
4.1. Cost estimation methodology and basis
The cost estimates in this work are of the ‘‘preliminary’’ type. Preliminary costs are appropriate for the pur-poses of evaluating alternative technologies. Most direct costs were estimated with a cost model described byAkunuri [10], which was originally developed by Frey and Rubin [11]. The model estimates the direct capitalcosts as a function of key plant performance and design parameters for the following plant sections: ASU, gascooling, Selexol (for H2S capture only), Claus, boiler feed water treatment, condensate treatment and generalfacilities. In this work, these parameters are obtained directly from the ASPEN Plus plant simulations. Thecosts of the gasification and power generation (gas turbine, steam turbine and HRSG) sections were obtainedfrom the Tampa Electric IGCC Final Technical Report [12] and from the Gas Turbine World Handbook [13],respectively.
In Cases 2–4, the only additional equipment requirements with respect to Case 1 correspond to the CO2
separation and compression sections in the glycol plant. The equipment costs for the glycol plant were calcu-lated in the ASPEN Icarus Process Evaluator (IPE) based on their corresponding ASPEN Plus simulations.Their associated direct costs were calculated using factors from Peters et al. [14] and added to the rest of theplant sections.
Indirect costs were calculated using the factors recommended by Peters et al. [14] for greenfield plants. Thetotal fixed capital investment includes direct costs, indirect costs and working capital.
The evaluation assumes a cost basis of November 2004. All costs are given in US dollars. A plant life of 30years from start up has been assumed for this evaluation. The projects consider a rate of return of 10%.The load factor is 85%. The annual capital costs will be paid by the annuity principle. The coal price wasassumed to be 1.14 US$/GJ (1.20 US$/MMBtu). The price of natural gas was assumed to be 3 US$/GJ(3.15 US$/MMBtu).
2256 G. Ordorica-Garcia et al. / Energy Conversion and Management 47 (2006) 2250–2259
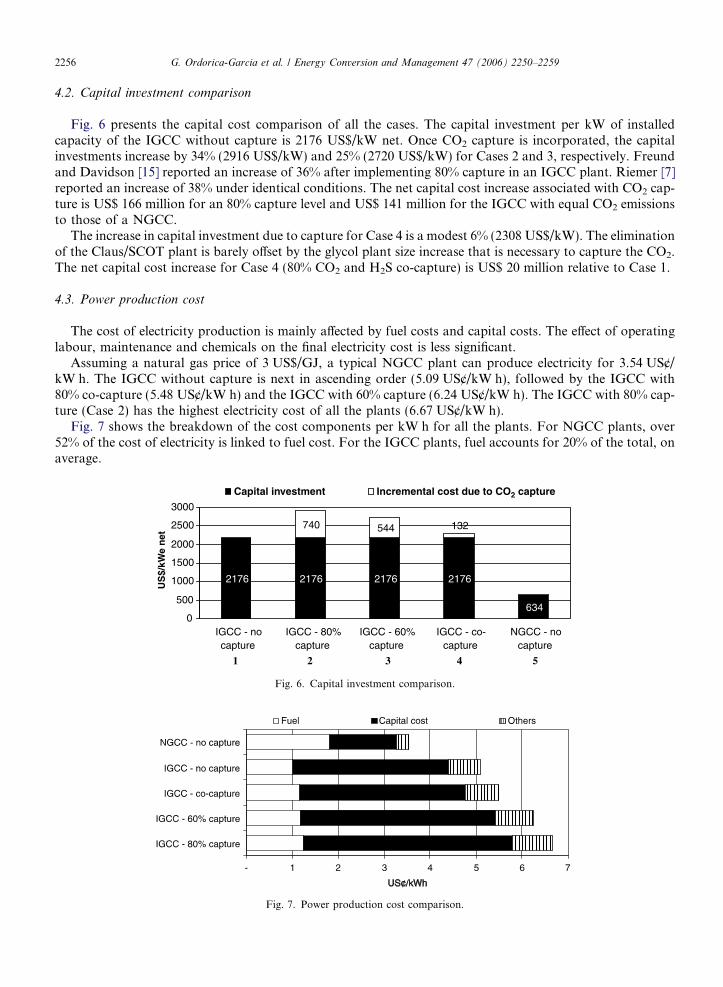
4.2. Capital investment comparison
Fig. 6 presents the capital cost comparison of all the cases. The capital investment per kW of installedcapacity of the IGCC without capture is 2176 US$/kW net. Once CO2 capture is incorporated, the capitalinvestments increase by 34% (2916 US$/kW) and 25% (2720 US$/kW) for Cases 2 and 3, respectively. Freundand Davidson [15] reported an increase of 36% after implementing 80% capture in an IGCC plant. Riemer [7]reported an increase of 38% under identical conditions. The net capital cost increase associated with CO2 cap-ture is US$ 166 million for an 80% capture level and US$ 141 million for the IGCC with equal CO2 emissionsto those of a NGCC.
The increase in capital investment due to capture for Case 4 is a modest 6% (2308 US$/kW). The eliminationof the Claus/SCOT plant is barely offset by the glycol plant size increase that is necessary to capture the CO2.The net capital cost increase for Case 4 (80% CO2 and H2S co-capture) is US$ 20 million relative to Case 1.
4.3. Power production cost
The cost of electricity production is mainly affected by fuel costs and capital costs. The effect of operatinglabour, maintenance and chemicals on the final electricity cost is less significant.
Assuming a natural gas price of 3 US$/GJ, a typical NGCC plant can produce electricity for 3.54 US¢/kW h. The IGCC without capture is next in ascending order (5.09 US¢/kW h), followed by the IGCC with80% co-capture (5.48 US¢/kW h) and the IGCC with 60% capture (6.24 US¢/kW h). The IGCC with 80% cap-ture (Case 2) has the highest electricity cost of all the plants (6.67 US¢/kW h).
Fig. 7 shows the breakdown of the cost components per kW h for all the plants. For NGCC plants, over52% of the cost of electricity is linked to fuel cost. For the IGCC plants, fuel accounts for 20% of the total, onaverage.
2176 2176 2176 2176
634
740 544 132
0
500
1000
1500
2000
2500
3000
IGCC - nocapture
IGCC - 80%capture
IGCC - 60%capture
IGCC - co-capture
NGCC - nocapture
US
$/kW
e n
et
Capital investment Incremental cost due to CO2 capture
1 2 3 4 5
Fig. 6. Capital investment comparison.
Fig. 7. Power production cost comparison.
G. Ordorica-Garcia et al. / Energy Conversion and Management 47 (2006) 2250–2259 2257
It is worth noting that the largest changes in the final cost of electricity for the IGCC plants are linked tocapital costs. The capital costs contribution remains essentially constant, representing around 65% of the costof electricity in Cases 1–4. The relative contribution of labour and maintenance is less significant, roughlytotalling 15%.
4.4. CO2 mitigation cost comparison
David and Herzog [16] have proposed a way to compare the CO2 mitigation costs of different plants using amitigation cost (MC, in $/tonne CO2 avoided), given in the following equation:
TableCO2 m
Plant
1. IGC2. IGC3. IGC4. IGC5. NG
a Wi
MC ¼ COEcap � COEref
Eref � Ecap
ð1Þ
where COE is the cost of electricity (US¢/kW h), E is the CO2 emissions (kg/kW h) and the indices ref and caprepresent the reference and capture plants, respectively.
The mitigation cost of all the plants is shown in Table 2. If Case 1 is used as the reference plant, the IGCCwith co-capture has the lowest CO2 mitigation cost of all the plants ($7/tonne CO2 avoided), followed by theIGCC with 80% capture and 60% capture ($28 and $30/tonne CO2 avoided, respectively). The cost differencebetween the latter two cases is 3.6%, yet the difference in CO2 emissions is significant; about 50%. Higher cap-ture levels are, therefore, more attractive, in economic terms, for IGCC plants with glycol based CO2 capture.
A number of factors contribute to make Case 4 the most advantageous in terms of mitigation costs: themajor ones are lower capital costs and minimal CO2 emissions. The former are directly correlated with thesimplified acid gas removal system design of this particular plant. The glycol plant requires less process unitsand yields a CO2–H2S stream at higher pressure than those in Cases 2–3, thus significantly reducing the overallcapital costs (including the CO2 compression train). An IGCC plant with CO2 and H2S co-capture has CO2
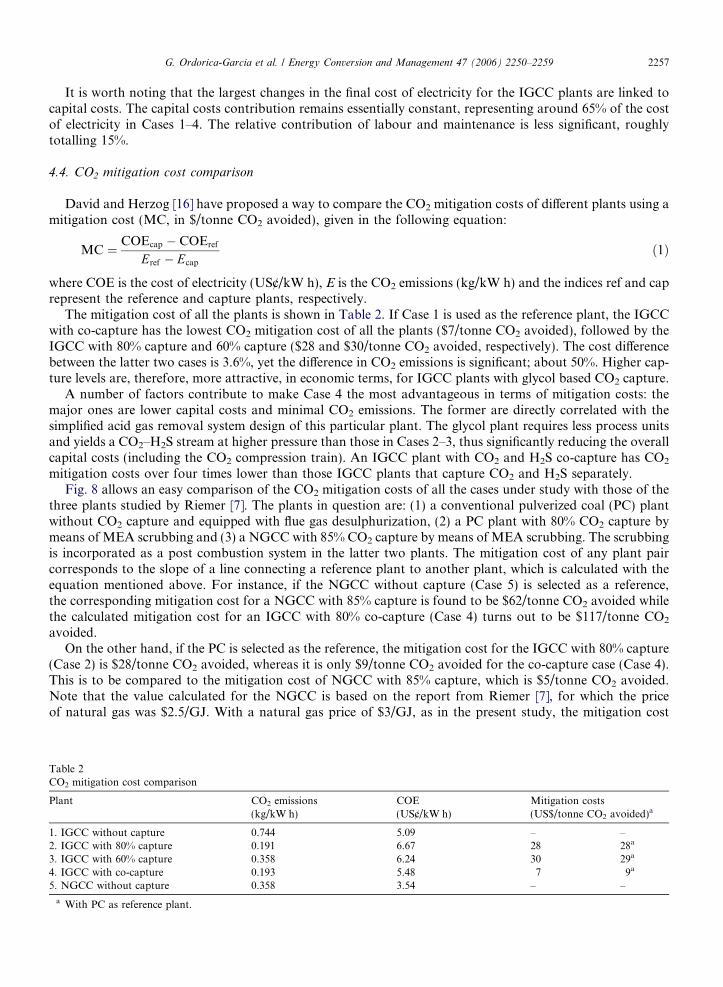
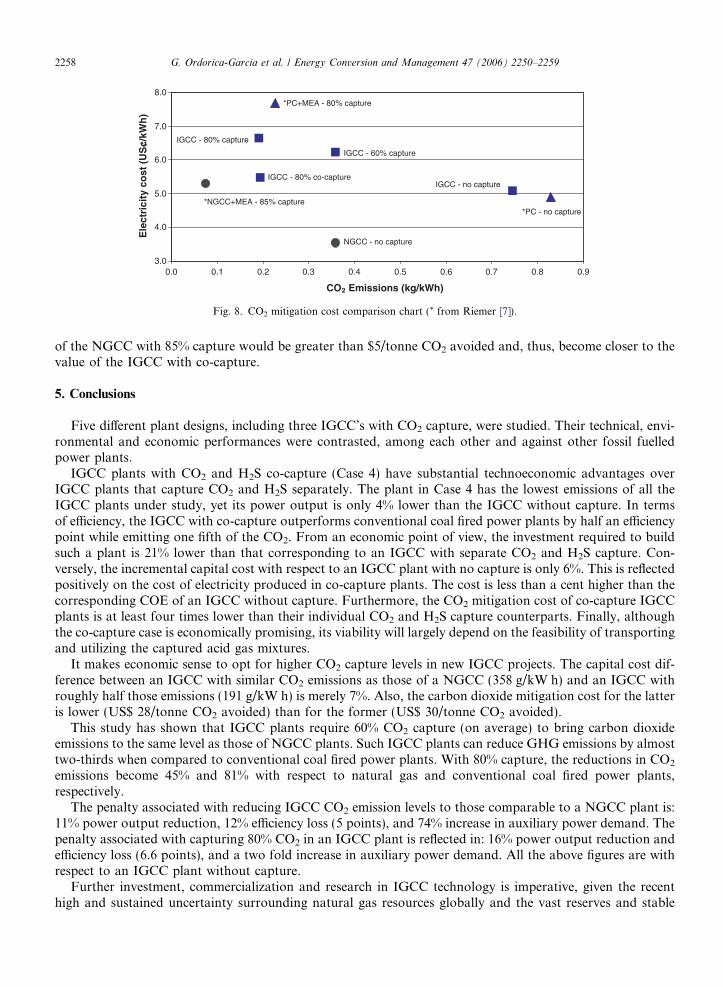
mitigation costs over four times lower than those IGCC plants that capture CO2 and H2S separately.Fig. 8 allows an easy comparison of the CO2 mitigation costs of all the cases under study with those of the
three plants studied by Riemer [7]. The plants in question are: (1) a conventional pulverized coal (PC) plantwithout CO2 capture and equipped with flue gas desulphurization, (2) a PC plant with 80% CO2 capture bymeans of MEA scrubbing and (3) a NGCC with 85% CO2 capture by means of MEA scrubbing. The scrubbingis incorporated as a post combustion system in the latter two plants. The mitigation cost of any plant paircorresponds to the slope of a line connecting a reference plant to another plant, which is calculated with theequation mentioned above. For instance, if the NGCC without capture (Case 5) is selected as a reference,the corresponding mitigation cost for a NGCC with 85% capture is found to be $62/tonne CO2 avoided whilethe calculated mitigation cost for an IGCC with 80% co-capture (Case 4) turns out to be $117/tonne CO2
avoided.On the other hand, if the PC is selected as the reference, the mitigation cost for the IGCC with 80% capture
(Case 2) is $28/tonne CO2 avoided, whereas it is only $9/tonne CO2 avoided for the co-capture case (Case 4).This is to be compared to the mitigation cost of NGCC with 85% capture, which is $5/tonne CO2 avoided.Note that the value calculated for the NGCC is based on the report from Riemer [7], for which the priceof natural gas was $2.5/GJ. With a natural gas price of $3/GJ, as in the present study, the mitigation cost
2itigation cost comparison
CO2 emissions(kg/kW h)
COE(US¢/kW h)
Mitigation costs(US$/tonne CO2 avoided)a
C without capture 0.744 5.09 – –C with 80% capture 0.191 6.67 28 28a
C with 60% capture 0.358 6.24 30 29a
C with co-capture 0.193 5.48 7 9a
CC without capture 0.358 3.54 – –
th PC as reference plant.
3.0
4.0
5.0
6.0
7.0
8.0
0.0 0.1 0.2 0.3 0.4 0.5 0.6 0.7 0.8 0.9
CO2 Emissions (kg/kWh)
Ele
ctri
city
co
st (
US
¢/kW
h)
NGCC - no capture
*NGCC+MEA - 85% capture
*PC+MEA - 80% capture
*PC - no capture
IGCC - no capture
IGCC - 60% capture
IGCC - 80% co-capture
IGCC - 80% capture
Fig. 8. CO2 mitigation cost comparison chart (* from Riemer [7]).
2258 G. Ordorica-Garcia et al. / Energy Conversion and Management 47 (2006) 2250–2259
of the NGCC with 85% capture would be greater than $5/tonne CO2 avoided and, thus, become closer to thevalue of the IGCC with co-capture.
5. Conclusions
Five different plant designs, including three IGCC’s with CO2 capture, were studied. Their technical, envi-ronmental and economic performances were contrasted, among each other and against other fossil fuelledpower plants.
IGCC plants with CO2 and H2S co-capture (Case 4) have substantial technoeconomic advantages overIGCC plants that capture CO2 and H2S separately. The plant in Case 4 has the lowest emissions of all theIGCC plants under study, yet its power output is only 4% lower than the IGCC without capture. In termsof efficiency, the IGCC with co-capture outperforms conventional coal fired power plants by half an efficiencypoint while emitting one fifth of the CO2. From an economic point of view, the investment required to buildsuch a plant is 21% lower than that corresponding to an IGCC with separate CO2 and H2S capture. Con-versely, the incremental capital cost with respect to an IGCC plant with no capture is only 6%. This is reflectedpositively on the cost of electricity produced in co-capture plants. The cost is less than a cent higher than thecorresponding COE of an IGCC without capture. Furthermore, the CO2 mitigation cost of co-capture IGCCplants is at least four times lower than their individual CO2 and H2S capture counterparts. Finally, althoughthe co-capture case is economically promising, its viability will largely depend on the feasibility of transportingand utilizing the captured acid gas mixtures.
It makes economic sense to opt for higher CO2 capture levels in new IGCC projects. The capital cost dif-ference between an IGCC with similar CO2 emissions as those of a NGCC (358 g/kW h) and an IGCC withroughly half those emissions (191 g/kW h) is merely 7%. Also, the carbon dioxide mitigation cost for the latteris lower (US$ 28/tonne CO2 avoided) than for the former (US$ 30/tonne CO2 avoided).
This study has shown that IGCC plants require 60% CO2 capture (on average) to bring carbon dioxideemissions to the same level as those of NGCC plants. Such IGCC plants can reduce GHG emissions by almosttwo-thirds when compared to conventional coal fired power plants. With 80% capture, the reductions in CO2
emissions become 45% and 81% with respect to natural gas and conventional coal fired power plants,respectively.
The penalty associated with reducing IGCC CO2 emission levels to those comparable to a NGCC plant is:11% power output reduction, 12% efficiency loss (5 points), and 74% increase in auxiliary power demand. Thepenalty associated with capturing 80% CO2 in an IGCC plant is reflected in: 16% power output reduction andefficiency loss (6.6 points), and a two fold increase in auxiliary power demand. All the above figures are withrespect to an IGCC plant without capture.
Further investment, commercialization and research in IGCC technology is imperative, given the recenthigh and sustained uncertainty surrounding natural gas resources globally and the vast reserves and stable
G. Ordorica-Garcia et al. / Energy Conversion and Management 47 (2006) 2250–2259 2259
long term prices for coal. Despite present mixed market perceptions of IGCC power, future energy pricingscenarios, such as the one presented by Stambler [17] provide a strong incentive for governments and utilitycompanies to make a decisive move toward IGCC implementation. According to the above source, over thecourse of the next two decades, the price of gas will increase by 85%, with a resulting COE nearing 5¢/kW h.At such level, IGCC plants without capture, and even with co-capture, could be competitive with NGCCplants. For IGCC plants, the forecasted power production cost rise due to increased coal prices over the sameperiod is less than 7%. Power produced by a NGCC is more sensitive to fuel cost fluctuations than that pro-duced by IGCC plants. While the current cost of producing electricity for a NGCC may be lower than thatcorresponding to IGCC plants, the contribution of natural gas to the final electricity cost is over 50%. Suchfigure is more than twice the contribution of coal to the cost of electricity from IGCC plants.
The chief short term challenge facing IGCC technology is finding approaches to reduce plant capital costs.IGCC plants are capital intensive compared to NGCC plants, the current preferred technology. The stage ofdevelopment of each one of the above technologies is a factor in explaining the cost differences. The NGCChas reached maturity, while the IGCC is still an emerging technology. Hence, cost reductions are anticipatedas IGCC techno-commercial developments progress. Evidence of this are recent plans by utility companies inAmerica, who anticipate building IGCC plants at costs nearing 1579 US$/MWe (installed) within the nextdecade [1]. Other sources [17] indicate that IGCC plants as economic as 1200 US$/MWe (installed) are viablewithin the same time frame. The addition of CO2 capture is expected to add about 25–36% to the capital cost,depending on the gasifier type and feedstocks.
References
[1] Stambler I. IGCC projects stressing carbon capture, lower costs, hydrogen. Gas Turb World 2004;33:5–15.[2] Farmer R. IGCC power generation plants in commercial stage of development. Gas Turb World 2004;34:5–16.[3] Newman SA. Acid and sour gas treating processes. Houston: Gulf Professional Publishing Company; 1985.[4] O’Keefe LF, Weissman RC, De Puy RA, Griffiths J, East N, Wainwright JM. An IGCC design for CO2 capture. In: Paper presented
at the 18th annual international Pittsburgh coal conference. Newcastle, Australia, December 2001.[5] Thambimuthu K, Davison J, Gupta M. CO2 capture and reuse. In: Paper presented at the intergovernmental panel on climate change
workshop on carbon capture and storage. Regina, Canada, November 2002.[6] Breckendridge W, Holiday A, Ong JOY, Sharp C. Use of selexol process in coke gasification to ammonia project. In: Paper presented
at the Laurance Reid gas conditioning conference, Norman, Oklahoma, February 2000.[7] Riemer P. The capture of carbon dioxide from fossil fuel fired power stations. IEA Green House Gas Research. Report IEAGHG/
SR2, London, UK, 1993.[8] Chase DL, Kehoe PT. GE combined-cycle product line and performance. Schenectady: GE Power Systems; 2000.[9] Texaco Power and Gasification. Coal gasification for power generation. A new role for coal in meeting America’s clean energy
challenge. New York: Texaco Inc.; 2001.[10] Akunuri N. Modeling the performance, emissions and costs of Texaco gasifier-based integrated gasification combined cycle systems.
Master’s Thesis. North Carolina, North Carolina State University, 1999.[11] Frey HC, Rubin ES. Stochastic modeling of coal gasification combined cycle systems: cost models for selected IGCC systems. Report
No. DOE/MC/24248-2901. West Virginia, Carnegie Mellon University, 1990.[12] McDaniel JE. Tampa Electric Polk Power Station integrated gasification combined cycle project. Final Technical Report. Florida,
Tampa Electric Company, 2002.[13] Gas Turbine World, 2001–2002 Handbook. Gas Turbine World 2002;22:43.[14] Peters MS, Timmerhaus KD, West RE. Plant design and economics for chemical engineers. 5th ed. New York: McGraw-Hill; 2003.[15] Freund P, Davidson J. General overview of costs. In: Paper presented at the intergovernmental panel on climate change workshop on
carbon capture and storage. Regina, Canada, November 2002.[16] David J, Herzog H. The cost of carbon capture. In: Paper presented at the fifth international conference on greenhouse gas control
technologies, Cairns, Australia, August 2000.[17] Stambler I. Calpine sees coal-based IGCC plants generating power for $40 per MW h. Gas Turb World 2002;32:4–20.
Copyright © 2022 FDOKUMEN