Cell, Volume 133 Supplemental Data Rapid Synthesis of Auxin via a New Tryptophan-Dependent Pathway...
13
Cell, Volume 133 Supplemental Data Rapid Synthesis of Auxin via a New Tryptophan-Dependent Pathway Is Required for Shade Avoidance in Plants Yi Tao, Jean-Luc Ferrer, Karin Ljung, Florence Pojer, Fangxin Hong, Jeff A. Long, Lin Li, Javier E. Moreno, Marianne E. Bowman, Lauren J. Ivans, Youfa Cheng, Jason Lim, Yunde Zhao, Carlos L. Ballaré, Göran Sandberg, Joseph P. Noel, and Joanne Chory Supplemental Experimental Procedures Detailed Growth Conditions For the greenhouse experiment described in Figure 1, seedlings were grown for 4 weeks on a greenhouse bench without supplemental lighting (peak photosynthetically active radiation at midday was 1200 μmol m -2 s -1 ). Seedlings were then aligned in front of banks of incandescent lamps covered with either opaque screens (-FR treatment) or FR filters (+FR treatment). Plants were irradiated with FR from 10:00 to 19:00 every day. The R:FR ratios, measured with a Skye SKR 100/SKR 110 radiometer pointed to the light sources (Skye Instruments), were 0.24 and 0.68 for +FR and -FR treatments, respectively (Izaguirre et al., 2006). The drop in R:FR caused by FR supplementation was equivalent to the effect of neighbor proximity in a canopy of leaf- area index = 0.5. For responses to picloram (Sigma), seedlings were grown on ½ MS supplemented with varying amounts of picloram for 3 days under Wc. The plates were then either left in Wc or transferred to simulated shade for 3 days before hypocotyl measurements were made. For microarray experiments, seedlings were grown under simulated white light condition (R: 13 μE·m -2 ·s -1 ; B: 1.23 μE·m -2 ·s -1 ; (R:FR ratio of 1.1)) for 7 days and were then
-
Upload
independent -
Category
Documents
-
view
3 -
download
0
Transcript of Cell, Volume 133 Supplemental Data Rapid Synthesis of Auxin via a New Tryptophan-Dependent Pathway...
Cell, Volume 133
Supplemental Data
Rapid Synthesis of Auxin
via a New Tryptophan-Dependent Pathway
Is Required for Shade Avoidance in Plants Yi Tao, Jean-Luc Ferrer, Karin Ljung, Florence Pojer, Fangxin Hong, Jeff A. Long, Lin Li, Javier E.
Moreno, Marianne E. Bowman, Lauren J. Ivans, Youfa Cheng, Jason Lim, Yunde Zhao, Carlos L.
Ballaré, Göran Sandberg, Joseph P. Noel, and Joanne Chory
Supplemental Experimental Procedures
Detailed Growth Conditions
For the greenhouse experiment described in Figure 1, seedlings were grown for 4 weeks
on a greenhouse bench without supplemental lighting (peak photosynthetically active radiation
at midday was 1200 μmol m-2 s-1). Seedlings were then aligned in front of banks of incandescent
lamps covered with either opaque screens (-FR treatment) or FR filters (+FR treatment). Plants
were irradiated with FR from 10:00 to 19:00 every day. The R:FR ratios, measured with a Skye
SKR 100/SKR 110 radiometer pointed to the light sources (Skye Instruments), were 0.24 and
0.68 for +FR and -FR treatments, respectively (Izaguirre et al., 2006). The drop in R:FR caused
by FR supplementation was equivalent to the effect of neighbor proximity in a canopy of leaf-
area index = 0.5. For responses to picloram (Sigma), seedlings were grown on ½ MS
supplemented with varying amounts of picloram for 3 days under Wc. The plates were then
either left in Wc or transferred to simulated shade for 3 days before hypocotyl measurements
were made. For microarray experiments, seedlings were grown under simulated white light
condition (R: 13 μE·m-2·s-1; B: 1.23 μE·m-2·s-1; (R:FR ratio of 1.1)) for 7 days and were then
treated with simulated white light or simulated shade for 1 hour. Whole seedlings were
collected. For 5-MT sensitivity tests, seedlings were grown for 9 days on ½ MS supplemented
with 20 μM of 5-MT (Sigma) in Wc.
Protein Sequence Alignment
Protein sequence alignment was carried out using clustalW program
(http://www.ebi.ac.uk/Tools/clustalw2/index.html ) and visualized as box shade alignment
(http://www.ch.embnet.org/software/BOX_form.html).
Constructs
For complementation experiments, genomic TAA1 DNA, including 2 Kb of upstream
sequence and 800 bp of downstream sequence, was PCR-amplified from Col-0 genomic DNA
and cloned into the pJHA212K vector using EcoRI and PstI sites (Yoo et al., 2005). For
expression pattern analysis of TAA1, the uidA gene was first cloned into pJHA212K using
SalI/BamHI; the 2 Kb promoter of TAA1 was PCR-amplified and cloned in pJHA212K-GUS
using KpnI/SacI; finally the genomic DNA of TAA1 and the 800bp DNA downstream region of
TAA1 was PCR-amplified and inserted using the SalI site. For TAA1 localization test, TAA1
cDNA was first amplified from a cDNA library from Col-0 and was then cloned into a modified
pPZP212 vector with YFP (Chen et al., 2005). For complementation tests with the mutant form
of TAA1, cDNA of TAA1 was cloned into a modified pPZP212 vector with 3X Flag tag (Wang et
al., 2005). This clone was then used as a template for DpnI-directed mutagenesis to generate
the indicated mutation using QuikChange® Site-Directed Mutagenesis Kit from Stratagene.
Quantification of free IAA and IAA biosynthesis rate
Col-0 and sav3-2 seedlings were grown under Wc for 7 days after germination. They
were then treated with or without simulated shade for one hour and the aerial parts of seedlings
were pooled, weighed and frozen in liquid nitrogen for quantification of free IAA content. Four
replicates were analyzed for samples without shade treatment and three replicates were
analyzed for samples with shade treatment. The frozen samples (15 mg of plant tissue (fresh
weight)) was homogenized in 0.5 ml 50 mM Na-phosphate buffer pH 7.0 containing 0.02%
diethyldithiocarbamic acid (antioxidant) and 500 pg 13C6-IAA internal standard, using the Retsch
vibration mill (Retsch GmbH & Co. KG) and a 3 mm tungsten carbide bead at a frequency of 30
Hz for 2 min. The pH was adjusted to 2.7 and the sample was then purified by solid phase
extraction on a 500 mg Isolute C8-EC column (International Sorbent Technology) conditioned
with 2 ml methanol and 2 ml 1% acetic acid. The column was washed with 2 ml 10% methanol
in 1% acetic acid, eluted with 2 ml 70% methanol in 1% acetic acid and the sample was
evaporated to dryness. The sample was dissolved in 0.2 ml 2-propanol and 1 ml
dichloromethane, and IAA was methylated by adding 5 μl 2 M trimethylsilyl-diazomethane in
hexane (Aldrich). The sample was then left at room temperature for 30 min. 5 μl of 2 M acetic
acid in hexane was added to destroy excess diazomethane and the sample was evaporated to
dryness. The sample was then trimethyl-silylated and analyzed by gas chromatography-
selected reaction monitoring–mass spectrometry as described (Edlund et al., 1995).
For IAA biosynthesis measurements, Col-0 and sav3-2 seedlings were grown under Wc
for 7 days after germination. Seedlings were pretreated with ½ MS containing 30% 2H2O for 0.5
hours. They were then treated with Wc or shade for 2 hours and the aerial parts of 10 seedlings
were collected and frozen in liquid nitrogen for each sample. Each treatment contains four
replicates. Samples were homogenized, extracted and purified as described above. IAA
synthesis rates were measured by GC-SRM-MS as described in Ljung et al.2005 (Ljung et al.,
2005). For calculation of the relative synthesis rate of IAA, enrichment is expressed as the ratio
of deuterium-labeled IAA (m/z 203+204+205) to unlabelled IAA (m/z 202), after correction for
natural isotope distribution to m/z 203, 204 and 205. Four replicates were analyzed for all
samples.
Supplemental Figure Legends
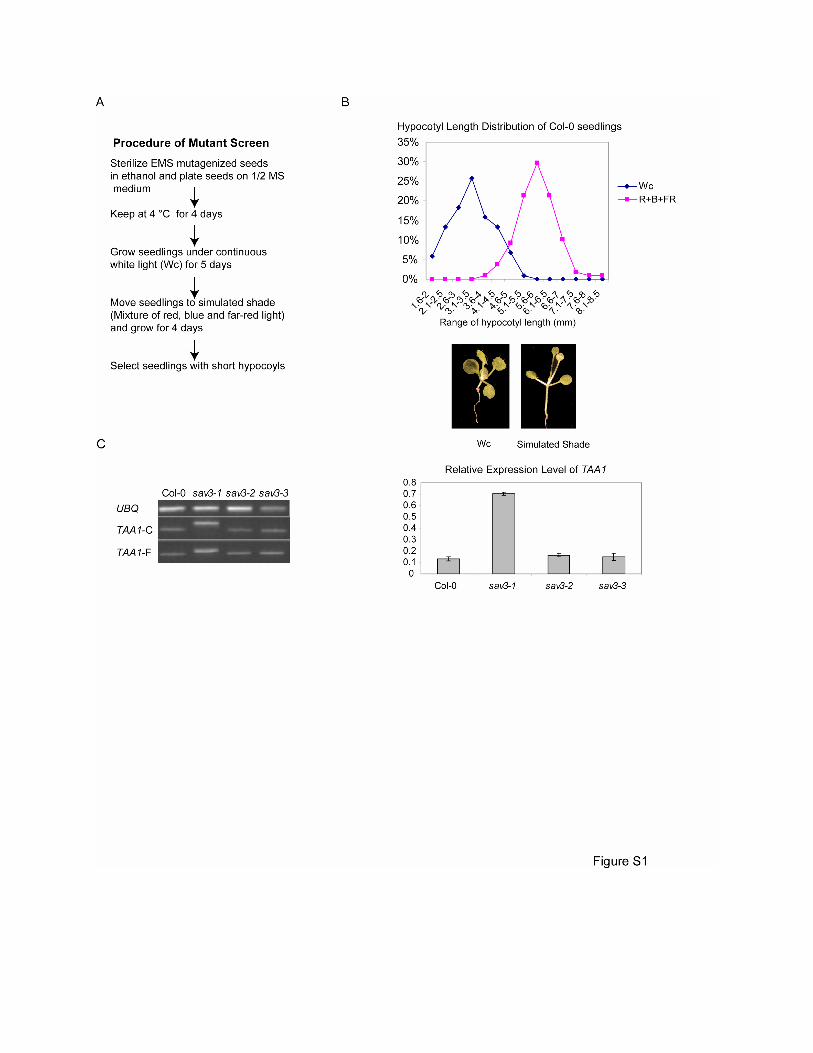
Figure S1. Description of the Mutant Screen and Molecular Characterization of the sav3 Alleles
(A) Schematic diagram of the mutant screen.
(B) Hypocotyl length distribution of wild-type seedlings grown under Wc or simulated shade.
Pictures of representative seedlings are also shown.
(C) DNA agarose gel picture of RT-PCR products of TAA1 (nucleotides 501 -1145 of the coding
region, TAA1-C), full-length TAA1 (TAA1-F) and ubiquitin control (UBQ) (left panel). In the right
panel, relative expression levels of TAA1 transcript were shown. Total RNAs were extracted
from 5-day old seedlings grown under Wc. The expression levels of TAA1 were measured using
quantitative RT-PCR (qRT-PCR) in triplicates and were normalized against a reference gene
(AT2G39960). Error bars represent standard error of means (SEM).
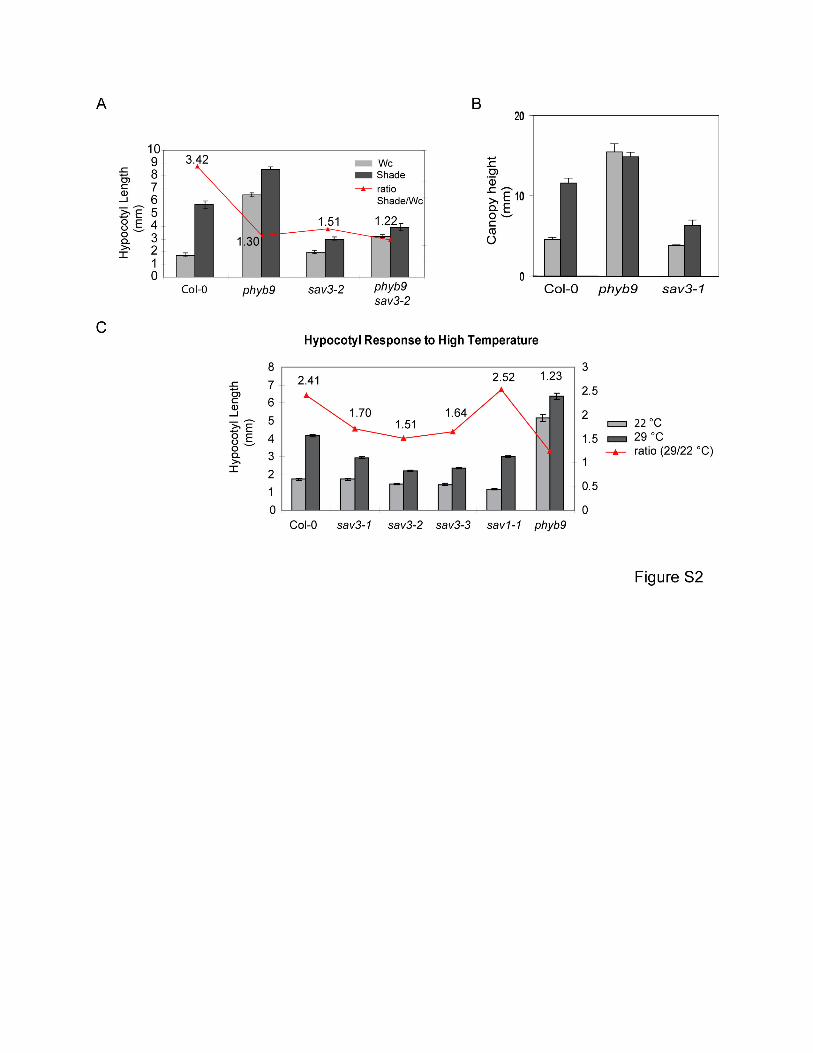
Figure S2. Phenotypes of sav3 Mutants
(A) sav3 partially suppresses the phenotype of phyb9, a null mutant of phyB. Hypocotyl
elongation in response to shade was quantitatively measured.
(B) Canopy height of sav3-1 grown in the greenhouse with or without supplementary FR light.
(C) Hypocotyl elongation in response to high temperature. Seedlings were grown under Wc at
22°C for 3 days. They were then left at 22°C or transferred to 29°C and allowed to grow for 4
more days.
Mean values of at least 12 seedlings are shown and error bars represent SEM.
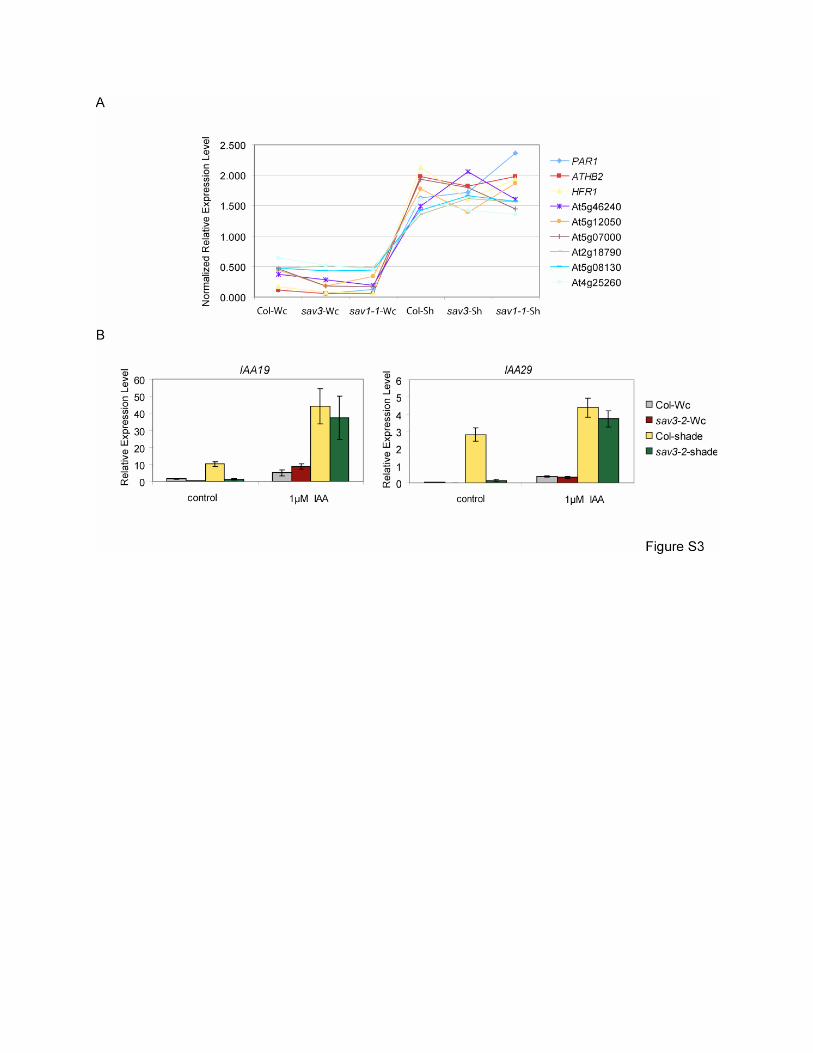
Figure S3. Expression Analysis of TAA1-dependent and Independent Early Response Genes
(A) Expression patterns of TAA1-independent early response genes. Expression values of
PAR1 ATHB2, HFR1 and several other TAA1-independent shade-induced genes were obtained
from our microarray data. For each gene, median expression value was set to one.
(B) Expression levels of TAA1-dependent early response genes, IAA19 and IAA29, under Wc or
shade, treated with or without 1μM IAA. 5-day-old, Wc-grown seedlings were soaked in control
(1/2 MS) or 1/2 MS plus 1μM IAA solution and were then treated with simulated Wc or shade for
1hour. Expression levels were quantified using qRT-PCR in triplicates and normalized by the
expression level of the reference gene. Error bars represent SEM.
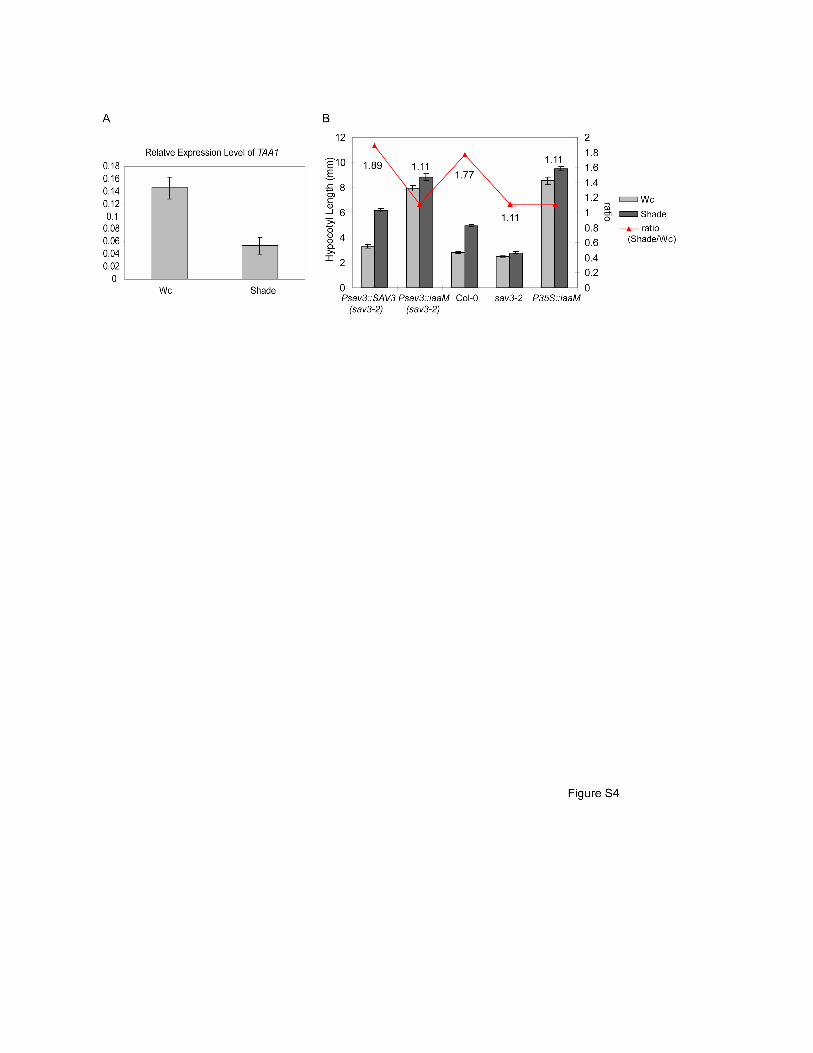
Figure S4. Expression Analysis of TAA1 and Rescue with iaaM
(A) Quantification of TAA1 mRNA levels. 5-day old WT seedlings were treated with Wc or shade
for 2 hours and relative expression levels of TAA1 were measured using qRT-PCR and were
normalized to the reference gene.
(B) Hypocotyl phenotypes of transgenic lines expressing the bacterial iaaM gene under the
control of the TAA1 promoter in sav3-2 background. 5-day old T2 seedlings were treated with
Wc or shade for 4 days. Transgenic lines (sav3-2) containing TAA1 cDNA driven by TAA1
promoter and iaaM gene driven by the 35S promoter were included as controls. Mean values of
at least 12 seedlings are shown.
Error bars represent SEM.
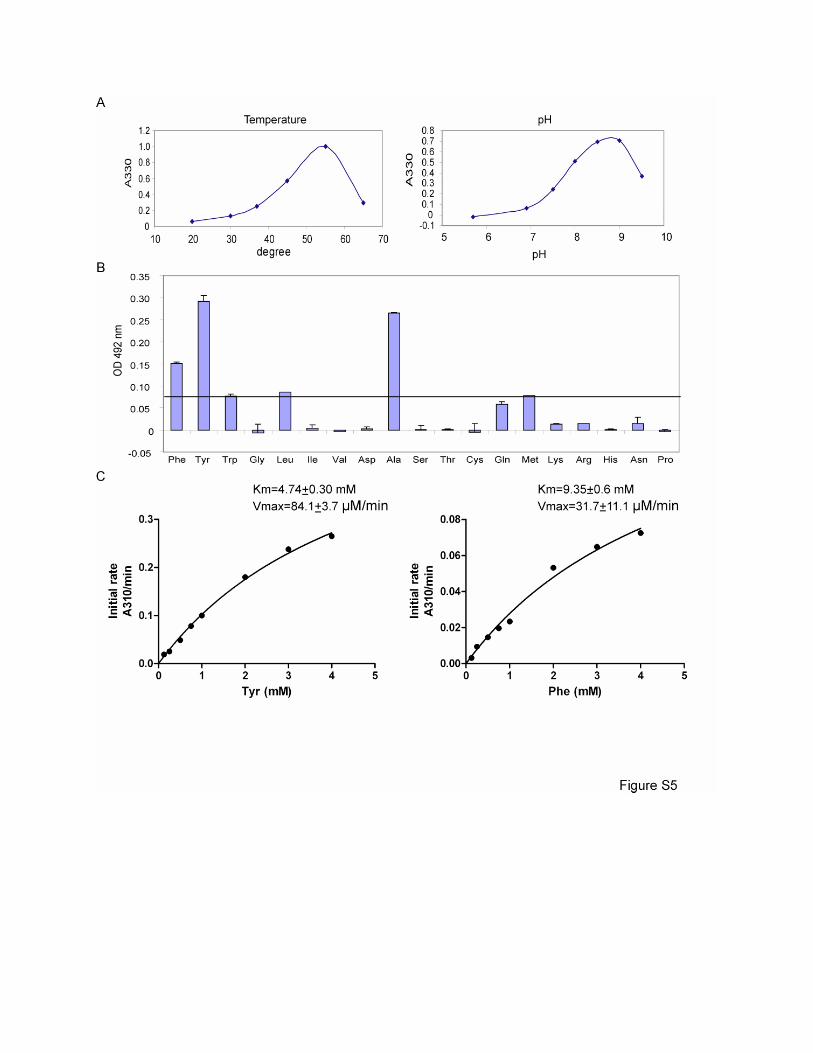
Figure S5. Biochemical Characterization of TAA1
(A) Optimal temperature and pH of TAA1. The borate buffer assay was employed to assay the
production of IPA. 100 µl of reaction buffer containing 0.5M borate buffer (pH8.5 or as
indicated), 10 µM of PLP, 1mM pyruvate and 1 µg of TAA1 was incubated at 55 ºC or indicated
temperature for 5 minutes. The production of IPA was monitored by absorption at 330nm.
(B) Aminotransferase activity of TAA1 towards various L- amino acids. 100 µl of reaction
mixtures containing 50 mM K2HPO4/KH2PO4 (pH 8.5), 10mM α-ketoglutarate, various amino
acids (5mM) and 3µg of TAA1 were incubated at 37℃ for 20 min. The reaction was stopped by
heat inactivation (95℃ for 5 min). Production of L-glutamate was measured using a kit from
Boehringer Mannheim/ R-Biophram, which is based on an L-glutamic acid colorimetric method.
The amount of L-glutamate was expressed as absorption at 492nm. The line marks the
production of L-glutamate by TAA1 using L-Trp as a substrate. Using this line as a cutoff, TAA1
can use at least 6 out of the 19 amino acids (Phe, Tyr, Trp, Leu, Ala and Met) (Glu is not
assayed due to the limit of the assay). Mean values of 3 measurements are shown. Error bars
represent SEM.
(C) Km and Vmax of TAA1 to L-Phe and L-Tyr. Initial velocities of TAA1 in buffers with various
concentrations of Phe or Tyr (0.125-4 mM) were measured using the borate buffer assay as
described above except that 20 mM sodium pyruvate was utilized. Production of β-
phenylpyruvate or p-hydroxyphenylpyruvate was measured by absorption at 310 nm. Km and
Vmax were determined as described in the Materials and Methods.
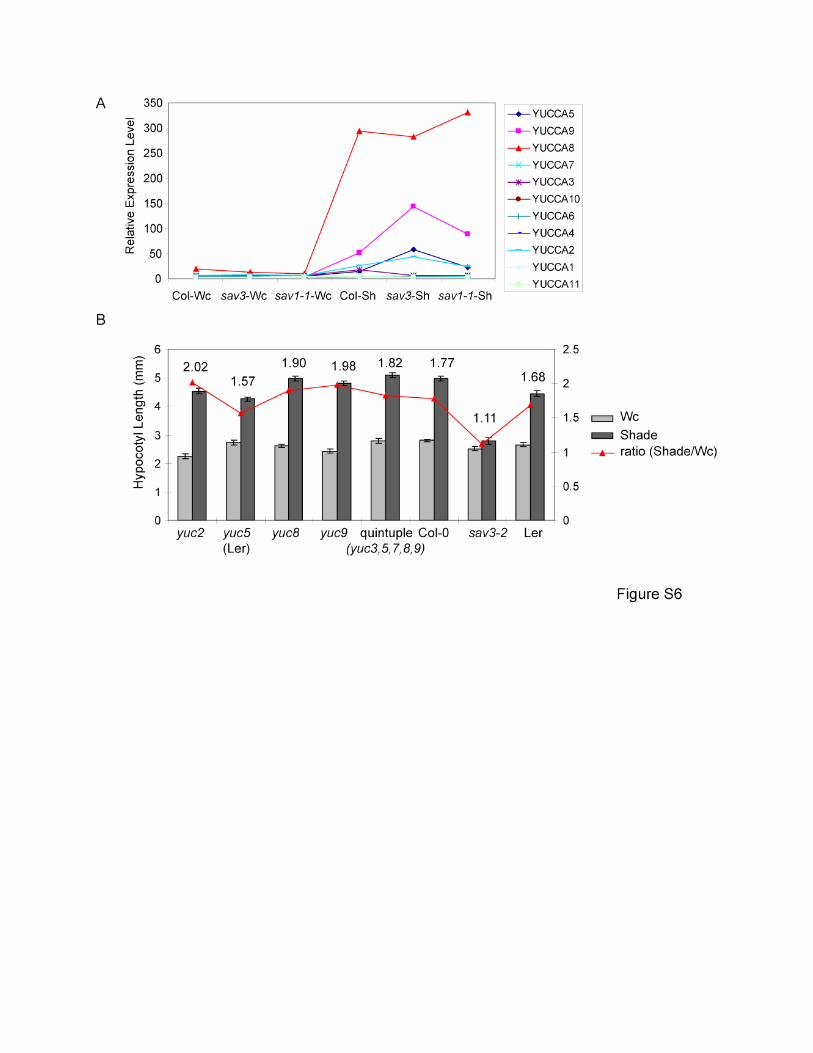
Figure S6. Analysis of Yucca Pathway
(A) A subset of Yucca genes are induced by shade. Yucca genes are the rate-limiting enzymes
for the tryptamine pathway of IAA biosynthesis (Zhao et al., 2001). Relative expression levels of
Yucca gene family members from the microarray experiment are shown.
(B) Hypocotyl phenotypes of yucca mutants in shade. 5-day old seedlings were treated with Wc
or shade (R:FR = 0.7) for 4 days before measurement. Mean values of at least 12 seedlings are
presented. Error bars represent SEM.
Supplemental References
Chen, M., Tao, Y., Lim, J., Shaw, A., and Chory, J. (2005). Regulation of phytochrome B nuclear localization through light-dependent unmasking of nuclear-localization signals. Curr Biol 15, 637-642. Edlund, A., Eklof, S., Sundberg, B., Moritz, T., and Sandberg, G. (1995). A Microscale Technique for Gas Chromatography-Mass Spectrometry Measurements of Picogram Amounts of Indole-3-Acetic Acid in Plant Tissues. Plant Physiol 108, 1043-1047. Ljung, K., Hull, A. K., Celenza, J., Yamada, M., Estelle, M., Normanly, J., and Sandberg, G. (2005). Sites and regulation of auxin biosynthesis in Arabidopsis roots. Plant Cell 17, 1090-1104. Wang, X., Li, X., Meisenhelder, J., Hunter, T., Yoshida, S., Asami, T., and Chory, J. (2005). Autoregulation and homodimerization are involved in the activation of the plant steroid receptor BRI1. Dev Cell 8, 855-865.

Yoo, S. Y., Bomblies, K., Yoo, S. K., Yang, J. W., Choi, M. S., Lee, J. S., Weigel, D., and Ahn, J. H. (2005). The 35S promoter used in a selectable marker gene of a plant transformation vector affects the expression of the transgene. Planta 221, 523-530. Zhao, Y., Christensen, S. K., Fankhauser, C., Cashman, J. R., Cohen, J. D., Weigel, D., and Chory, J. (2001). A role for flavin monooxygenase-like enzymes in auxin biosynthesis. Science 291, 306-309.