
Advanced IGCC - Alberta Innovates
30
Appendix A Advanced IGCC A Final Phase III Report Prepared by CCPC Technical Committee, June 2011 Canadian Clean Power Coalition: Appendix A A01 Table of Contents 1. Background _______________________ A02 1.1. FEED Stud y _______________________ A02 1.2. Jacobs Study______________________ A02 1.3. EPRI Roadmap Study ______________ A03 2. FEED Study and Jacobs Study_______ A03 2.1. Case Descriptions _________________ A03 2.2. Design B asis ______________________ A05 2.3. Process D escription ________________ A06 2.4. Key A ssumptions __________________ A10 2.5. Performance and Cost Summary ____ A11 3. EPRI Roadmap Study ______________ A22 3.1. Case Descriptions _________________ A22 3.2. Design B asis ______________________ A23 3.3. Process D escriptions _______________ A23 3.4. Performance and Cost Summary ____ A27 4. Discussion of Results ______________ A28 Figure and Tables Figure 1: IGCC Block Flow Diagram ______________________________ A07 Figure 2: IGSC Block Flow Diagram ______________________________ A08 Figure 3: Polygen Block Flow Diagram ____________________________ A08 Figure 4: 50% Capture SMR Block Flow Diagram __________________ A09 Figure 5: 90% Capture SMR Block Flow Diagram __________________ A09 Table 1: Summary of Costs and Plant Performance for the Power Cases _____________________________________________ A11 Figure 6: First Year Cost of Power for Power Cases ________________ A12 Table 2: First Year COE for Case 4 When Proportion of EOR Sales Changes ____________________________________________ A12 Figure 7: Total First Year Cost of Power for Power Cases____________ A13 Figure 8: Capture Costs for Power Cases _________________________ A13 Figure 9: Estimated SO 2 , NO X and PM Emissions __________________ A14 Table 3: Power Production in MW for Power Cases ________________ A14 Figure 10: Break Even Price of CO 2 and Power Sales for Case 4 _____ A15 Figure 11: % Increase in IGCC w CCS over SCPC wo CCS Capex ____ A16 Figure 12: % Increase in IGCC w CCS over SCPC wo CCS COE _____ A17 Table 4: Summary of Costs and Plant Performance for the Hydrogen Cases __________________________________________ A18 Figure 13: First Year Cost of Hydrogen for Hydrogen Cases _________ A19 Figure 14: Total Cost to Produce Hydrogen ________________________ A19 Figure 15: Cost of Capture for the Hydrogen Cases ________________ A20 Figure 16: The Break Even Price of Hydrogen and CO 2 Sales for Hydrogen Cases __________________________________________ A21 Figure 17: Net Cost to Produce Power and Hydrogen from Syngas ___ A22 Figure 18: Base Case Block Flow Diagram ________________________ A23 Figure 19: Oxygen Production Block Flow Diagram _________________ A24 Figure 20: HTPSR Block Flow Diagram ___________________________ A24 Figure 21: Hydrogen Membrane Block Flow Diagram _______________ A25 Figure 22: Advanced CO 2 Capture Case___________________________ A25 Figure 23: Long-Term Technology Case ___________________________ A26 Figure 24: Efficiency Improvements ______________________________ A27 Figure 25: Specific Total Plant Costs ______________________________ A27 Figure 26: Cost of Electricity Estimates ___________________________ A28 Table 5: Comparison of NETL and CCPC Costs for Similar IGCC Case _______________________________________________ A29 Figure 27: IGCC Costs Reported Recently _________________________ A29 Notice This report was prepared for the Canadian Clean Power Coalition and its participants and associates (collectively the “CCPC”). The information contained in this report maybe referenced by any other party for general information purposes only. No other party is entitled to rely on this report, in any manner whatsoever, without the prior written consent of the CCPC. Under no circumstances, including, but not limited to, negligence, shall the CCPC be liable for any direct, indirect, special, punitive, incidental or consequential damages arising out of the use of this report or the information contained herein by any other party.
-
Upload
khangminh22 -
Category
Documents
-
view
4 -
download
0
Transcript of Advanced IGCC - Alberta Innovates
Appendix
AAdvanced IGCCA Final Phase III report
Prepared by CCPC Technical Committee, June 2011
C a n a d i a n C l e a n P o w e r C o a l i t i o n : A p p e n d i x A A01
Table of Contents
1. Background _______________________ A02
1.1. FEED Stud y _______________________ A02
1.2. Jacobs Study______________________ A02
1.3. EPRI Roadmap Study ______________ A03
2. FEED Study and Jacobs Study_______ A03
2.1. Case Descriptions _________________ A03
2.2. Design Basis ______________________ A05
2.3. Process D escription ________________ A06
2.4. Key Assumptions __________________ A10
2.5. Performance and Cost Summary ____ A11
3. EPRI Roadmap Study ______________ A22
3.1. Case Descriptions _________________ A22
3.2. Design Basis ______________________ A23
3.3. Process D escriptions _______________ A23
3.4. Performance and Cost Summary ____ A27
4. Discussion of Results ______________ A28
Figure and Tables
Figure 1: IGCC Block Flow Diagram ______________________________ A07
Figure 2: IGSC Block Flow Diagram ______________________________ A08
Figure 3: Polygen Block Flow Diagram ____________________________ A08
Figure 4: 50% Capture SMR Block Flow Diagram __________________ A09
Figure 5: 90% Capture SMR Block Flow Diagram __________________ A09
Table 1: Summary of Costs and Plant Performance for the Power Cases _____________________________________________ A11
Figure 6: First Year Cost of Power for Power Cases ________________ A12
Table 2: First Year COE for Case 4 When Proportion of EOR Sales Changes ____________________________________________ A12
Figure 7: Total First Year Cost of Power for Power Cases ____________ A13
Figure 8: Capture Costs for Power Cases _________________________ A13
Figure 9: Estimated SO2, NOX and PM Emissions __________________ A14
Table 3: Power Production in MW for Power Cases ________________ A14
Figure 10: Break Even Price of CO2 and Power Sales for Case 4 _____ A15
Figure 11: % Increase in IGCC w CCS over SCPC wo CCS Capex ____ A16
Figure 12: % Increase in IGCC w CCS over SCPC wo CCS COE _____ A17
Table 4: Summary of Costs and Plant Performance for the Hydrogen Cases __________________________________________ A18
Figure 13: First Year Cost of Hydrogen for Hydrogen Cases _________ A19
Figure 14: Total Cost to Produce Hydrogen ________________________ A19
Figure 15: Cost of Capture for the Hydrogen Cases ________________ A20
Figure 16: The Break Even Price of Hydrogen and CO2 Sales for Hydrogen Cases __________________________________________ A21
Figure 17: Net Cost to Produce Power and Hydrogen from Syngas ___ A22
Figure 18: Base Case Block Flow Diagram ________________________ A23
Figure 19: Oxygen Production Block Flow Diagram _________________ A24
Figure 20: HTPSR Block Flow Diagram ___________________________ A24
Figure 21: Hydrogen Membrane Block Flow Diagram _______________ A25
Figure 22: Advanced CO2 Capture Case___________________________ A25
Figure 23: Long-Term Technology Case ___________________________ A26
Figure 24: Efficiency Improvements ______________________________ A27
Figure 25: Specific Total Plant Costs ______________________________ A27
Figure 26: Cost of Electricity Estimates ___________________________ A28
Table 5: Comparison of NETL and CCPC Costs for Similar IGCC Case _______________________________________________ A29
Figure 27: IGCC Costs Reported Recently _________________________ A29
Notice
This report was prepared for the Canadian Clean
Power Coalition and its participants and associates
(collectively the “CCPC”). The information contained
in this report maybe referenced by any other party for
general information purposes only. No other party is
entitled to rely on this report, in any manner whatsoever,
without the prior written consent of the CCPC. Under no
circumstances, including, but not limited to, negligence,
shall the CCPC be liable for any direct, indirect, special,
punitive, incidental or consequential damages arising out
of the use of this report or the information contained
herein by any other party.

Advanced IGCC Report
1. Background
The Canadian Clean Power Coalition (CCPC) is a consortium of Canadian and American power generators and coal suppliers representing of over 90% of Canada’s coal-fired power generation. CCPC’s mandate is to research technologies with the goal of developing and advancing commercially viable solutions that lower coal power plant emissions. The previous CCPC Gasification Optimization Study Phase 2, issued May 2006, focused on two IGCC technologies Future Energy (now Siemens) and a second IGCC technology being fed lignite and sub-bituminous coal respectively. The focus of the Phase II study was to evaluate the cost of carbon capture, looking at cases that were non-carbon capture, capture ready and capture cases for the two technologies. Additionally polygen cases with a coal / coke feed blend were also evaluated for the capture and capture ready configurations.
During Phase III of the CCPC’s study work, the CCPC was involved in three major studies related to Integrated Gasification Combined Cycle (IGCC).
1) The CCPC received $11 million in funding from Alberta Innovates and contributed this funding to Capital Power Corporation. Capital Power Corporation used this funding along with $11 million from Natural Resources Canada and $11 million of their own money to complete a $33 million Front End Engineering Design (FEED) study on IGCC (FEED Study).
2) The results of this FEED Study were used as the basis for completing a further $1.3 million study completed by Jacobs (Jacobs Study) on 10 gasification cases.
3) Late in 2010 the CCPC commissioned EPRI to complete a $250,000 study on advances outside the gasifier island that will lead to reductions in the costs of IGCC plants (EPRI Roadmap Study).
This report provides technical and financial results from these three studies. The FEED Study and Jacobs Study results are provided in section 2 while the EPRI Roadmap Study results are provided in section 3.
1.1. FEED Study
Between 2006 and 2010, Capital Power Corporation (CPC), on behalf of the Canadian Clean Power Coalition
(CCPC) and with funding from Alberta Innovates: Energy and Environment Solutions (AIEES) (formally the Alberta Energy Research Institute) and Natural Resources Canada (NRCan), performed a FEED study for an approximately 240 MWnet IGCC facility with carbon dioxide capture. The plant was designed to co-fire syngas and natural gas to completely load the power block. This design was chosen to reduce the capital cost of the system.
This study was aimed at discovering the true cost and viability of such a facility, which would be built at the existing Genesee Generating Station in Alberta, Canada, approximately 50 km west of the city of Edmonton. The facility was designed to provide baseload electric power to the Alberta electricity grid, with carbon capture of over 85%, and a significant reduction in all other criteria air emissions. However, only the CO2 derived from the syngas production was captured in this plant.
1.2. Jacobs Study
The purpose of the Jacobs Study was to evaluate multiple gasification technologies that are commercially available with licensor enhancements that are anticipated to be incorporated into their designs within the next 5 to 10 years. Licensors of other unit operations such as the acid gas recovery were also asked to incorporate enhancements to their processes.
The technology licensors that agreed to participate are:
• Siemens (participated in Phase 2),• Pratt & Whitney Rocketdyne (PWR),• Thermal Power Research Institute (TPRI), and• SES (GTI U-Gas process).
All of these technologies exhibit most if not all of the attributes of an “Ideal Gasifier” for low rank coals as previously identified by Jacobs in the Phase 2 study.
In addition a gasification process was desired that could be used to repower existing coal fired boilers. For this retrofit case Jacobs proposed using a process that it has been developing known as Integrated Gasification Steam Cycle (IGSC). This process takes a proprietary combustor technology developed by Clean Energy Systems, Inc. (CES) that fires the fuel with high purity oxygen and quenched with water to form an exhaust stream that is primarily CO2 and water vapour. The steam that is generated in this process is used to either repower an existing 400 MW steam turbine or is fed to a new 430 MW supercritical steam turbine.
C a n a d i a n C l e a n P o w e r C o a l i t i o n : A p p e n d i x AA02

The base case (Case 4 described below) was also used as the basis for the coal/coke fed polygen case similar to the polygen case in the Phase 2 work and is to be used to compare the process performance and cost escalation that has occurred over the past 5 years.
Finally there are two steam methane reformer (SMR) cases. These provide a comparison with the polygen case and existing hydrogen generation technology. The first SMR case recovers carbon dioxide in the syngas only while the second case attempts to recover 90% of the total carbon entering the plant.
1.3. EPRI Roadmap Study
The EPRI Roadmap Study included analysis of ten different technological improvements over current state of-the-art equipment as represented by the base case. The first eight cases were evaluated to show the incremental improvement only with that technology (with the exception of the hydrogen membrane case, which requires upstream sulphur removal to be effective).
The following cases were included in the EPRI Study to determine the benefits of individual technological advancements:
• Coal Beneficiation: technology that can remove 25% of the ash from low rank coal prior to feeding to the gasification process. (Information provided by Sherritt Technologies)
• Oxygen Production: technology to reduce the energy required to separate oxygen (O2) from air. (Air Products & Chemical ITM Technology)
• high Temperature and Pressure Sulphur recovery: technology capable of removing H2S and COS from syngas at high temperature and pressure to avoid thermodynamic losses associated with conventional gas cooling/cleaning technology. (Becthel Pressure Swing Claus)
• hydrogen Membrane: technology that can separate the main combustible constituent from sulphur-free syngas while providing CO2 to a purification and pressurization process. (Eltron R&D Hydrogen Transport Membrane)
• Advanced CO2 Capture: developmental technology to separate CO2 from syngas with reduced thermodynamic penalty. (Air Products & Chemicals Sour PSA)
• CO2 Purification and Pressurization: technology for the purification of CO2 and subsequent pressurization to pipeline conditions to meet downstream specifications. (Ramgen Shockwave CO2 Compression)
• Advanced Gas Turbines: higher firing temperature gas turbines for more efficient, thus lower carbon intensive, power generation.
• Supercritical Steam Turbine: elevated steam conditions for improved steam turbine efficiency.
Additionally, two cases were created to study the aggregate impacts of several technologies on advanced IGCC plants in the 2020 and 2030 time frames. The 2030 case included an advanced, compact gasifier under development by Pratt & Whitney Rocketdyne.
2. FEED Study and Jacobs Study
2.1. Case Descriptions
Power Cases
Case 1 Super Critical Pulverized Coal without Carbon Capture
This is a 450 MW net plant with costs and characteristics agreed to by the CCPC. It is used as a reference case in the calculations of the capture and avoided costs of CO2.
Case 2 CCPC II
This was the sub-bituminous IGCC case with CCS from Phase II.
Case 3 Siemens SFC Gasification Feed
It comprises one Siemens 500 MWth size gasifier, with water quench feeding one Siemens SCT6-5000F gas turbine and one steam turbine. The power block is fired with about 60% syngas and 40% natural gas. 87.9% of the CO2 generated in production of syngas is captured.
Case 4 Siemens SFG Gasification Base Case
Case 4 is the base case. It comprises three Siemens 500 MWth size gasifiers, with water quench feeding two General Electric 7FB gas turbines operating in combined cycle.
C a n a d i a n C l e a n P o w e r C o a l i t i o n : A p p e n d i x A A03

Case 5 Siemens SFG Gasification 1,200 MWth Size
Siemens is planning to offer the SFG technology in a larger size gasifier, capable of consuming 1,200 MWth of coal. This case comprises two Siemens 1,200 MWth size gasifiers feeding two General Electric 7FB gas turbines operating in combined cycle.
Case 6 SeS U-Gas Gasifier
SES is actively marketing its fluidized bed U-Gas gasification technology. The technology is different from the other technologies considered in that the gasifier is operated at below the ash melting temperature and therefore has a higher cold gas efficiency. However the potential to capture CO2 is reduced when compared with the entrained flow gasification technologies as more of the carbon is present in the syngas as hydrocarbons rather than oxides of carbon. This case comprises three U-Gas gasifiers feeding two General Electric 7FB gas turbines operating in combined cycle.
Case 7 PWr Gasification Process
PWR is developing a gasification technology based on its rocket engine technology. The largest size is envisioned to have a capacity of over 1,000 MWth. The plant design will also incorporate the PWR coal pump. This case comprises two PWR gasifiers feeding two GE 7FB gas turbines operating in combined cycle.
Case 8 TPrI Gasification with Solid Feed
TPRI is developing a dry feed up-flow gasification technology. A version of which is the basis for the GreenGen project at Tianjin, China. The largest size is envisioned to have a capacity of over 1,000 MWth. This case comprises two TPRI gasifiers fitted with a water quench feeding two GE 7FB gas turbines operating in combined cycle.
Case 9 Jacobs IGSC Process – retrofit Case
Jacobs Integrated Gasification Steam Cycle (IGSC) technology uses two PWR gasifiers and then combusts the syngas with high purity oxygen producing a “flue gas” containing 100% of the carbon in the coal as high purity CO2 at elevated pressure ready for compression for EOR or sequestration. Sulphur is recovered using hot gas clean-up rather than in a conventional AGR. This case retrofits the Keephills 2 coal-fired plant’s 400 MW steam turbine, using 3 PWR gasifiers feeding three fired expanders fitted with pressurised HRSG’s. This plant re-uses the coal handling, transformers, switchgear, cooling water, and the steam turbine of the existing plant.
Case 10 Jacobs IGSC Process – Greenfield Case
Jacobs Integrated Gasification Steam Cycle (IGSC) technology can also be built as a greenfield plant. This case comprises 2 PWR gasifiers feeding two fired expanders fitted with pressurised HRSG’s. The steam from these HRSG’s is fed to a nominal 430 MW supercritical steam turbine.
Hydrogen Cases
Case 11 Steam Methane reformer (SMr) without Carbon Capture
This case is used to compare the conventional cost of hydrogen production without capture to the cost of hydrogen produced in the polygen and SMR cases with capture.
Case 12 Polygen CCPC II
This was the sub-bituminous polygen case with CCSfrom Phase II.
Case 13 SMr to h2 with 50% Capture
The plant is designed to produce a nominal 170,000 Nm3/h of refinery grade H2. The process line-up includes sulphur removal, to prevent the sulphur compounds present in pipeline quality natural gas from poisoning the reforming catalyst in the SMR, SMR, sweet shift, CO2 removal, Pressure Swing Adsorption (PSA) and H2 compression. The off gas from the PSA is fired in the SMR furnace and additional natural gas is fired to meet the reformer duty. Any excess steam produced in the process is used in a steam turbine generator to produce power to meet the internal loads. No export power is generated. The SMR based hydrogen plant is of standard design which limits the carbon capture to less than 55%. This carbon is captured from the reformed syngas but not from the furnace exhaust gas.
Case 14 Siemens Polygen h2 and Power
The plant produces both power and H2. The facility is sized so that 50% of the thermal energy in the syngas feeds a single General Electric 7FB gas turbine operating in combined cycle; the other 50% is exported as refinery grade H2. The off-gas from the PSA is recompressed and used as fuel for the gas turbine. The plant design targets 90% CO2 capture. The feedstock for this case is a 50:50 blend of sub-bituminous coal and petcoke. This case comprises three Siemens 500 MWth size gasifiers with water quench, feeding a single General Electric 7FB gas turbine operating in combined cycle, and a PSA producing the refinery grade H2.
C a n a d i a n C l e a n P o w e r C o a l i t i o n : A p p e n d i x AA04
Case 15 SMr to h2 with high Carbon Capture
The plant is an SMR based H2 plant modified to capture over 90% of the carbon fed to the plant as CO2. This is achieved by reforming the entire natural gas stream and feeding a portion of the reformed gas, after CO2 removal, to the furnace as fuel. The plant is designed to produce a nominal 170,000 Nm3/h of refinery grade H2. The process line-up includes sulphur removal, to prevent the sulphur compounds present in pipeline quality natural gas from poisoning the reforming catalyst in the SMR, SMR, sweet shift, CO2 removal, PSA, and H2 compression. The off gas from the PSA is fired in the SMR furnace. A portion of the impure hydrogen from upstream of the PSA is fired to meet the reformer furnace duty. Any excess steam produced in the process is used in a steam turbine generator to produce power to meet the internal loads. No export power is generated.
Case 16 Polygen with 100% h2 Sales
This case was not modelled explicitly by Jacobs but was created based on reasonable adjustments. The values for Case 14 were adjusted so that 100% of the hydrogen produced is exported. The costs for the power block were removed and costs to account for a larger PSA were included. In addition, the power required by the system was purchased at the forecasted power price. This case was used to give an indication of whether it would be better to sell more hydrogen than power from a polygen.
2.2. Design Basis
All gasification plants use a sub-bituminous coal feed with the exception of the polygeneration plant, which is based on a 50:50 blend of sub-bituminous coal and petcoke to match the design already developed for the Phase 2 Stage 2 polygeneration case, and the SMR plants, which use pipeline natural gas. The IGCC plants are sized to produce sufficient syngas to feed two General Electric-7FB gas turbines at full load. However, case 3 is co-fired with natural gas to feed a single Siemens SGT6-5000F gas turbine to produce about 235 MW in combined cycle mode.
The polygeneration plant uses 50% of the syngas, on a heating value basis, to feed a single General Electric-7FB gas turbine operating in combined cycle, and the other 50% being used to generate refinery grade hydrogen for export. The SMR based hydrogen plants will be sized to produce the same amount of hydrogen as the polygeneration plant, and both the IGSC plant cases were designed to produce approximately 450 MWe net.
Given the nature of the site near Lake Wabamun in Alberta and the IGCC configurations, air side integration with the ASU was not recommended.
The IGCC plants are all greenfield, so no integration of the plant with existing facilities is included. Raw water is available, electricity and natural gas are available for start-up (natural gas is the main feedstock in the SMR case), and a connection to the grid is available for electricity export. All cases are zero liquid discharge. All other services and utilities are generated within the plant.
The percentage of CO2 removal is >90% for all IGCC cases, except for case 6 and the IGSC cases (9 and 10), which achieve >97% capture. However for case 3, none of the CO2 generated from the combustion of natural gas is captured. This leads to an overall capture rate of 62.7% for this case. Case 13 captures 90% of the CO2 from the process but none of the CO2 generated from the combustion of fuel gas in the SMR. Case 15 modifies the SMR design for case 13 such that 90% of the total carbon is captured as CO2.
The target availability for power from the IGCC cases is 85%. Sparing of the gasifier will only be used if necessary to meet this target.
CO2 production purity must be ≥ 95% CO2, ≤ 4% N2, ≤ 5% hydrocarbons, 10 to 200 ppmv H2S and supplied at the battery limit at 13.8 MPa and ≤ 50°C.
For Case 14, which co-produces hydrogen and power, it is expected that the minimum availability will be above 95% for hydrogen production. However, if syngas is diverted to the PSA to operate at 95% capacity factor then there may not be sufficient gas to run the power block at full capacity for long periods if the gasifiers have a capacity factor of just 85%. This issue was not addressed in the study. The SMR plants, Cases 11, 13 and 15, will target 8,332hr/yr (95%) availability of hydrogen.
All rotating equipment in the syngas treatment plant, except compressors, steam and gas turbines and generators, will have installed spares on a “plus one” basis, i.e., one 100% pump has a 100% spare; two 50% pumps have one 50% spare. Major rotating equipment such as the CO2 compressor and main air compressor are not spared.
C a n a d i a n C l e a n P o w e r C o a l i t i o n : A p p e n d i x A A05

Liquid oxygen storage provides enough oxygen to run the plant for 8 hours at 50% load to be able to maintain plant operation during short trips of the oxygen plant or perform an orderly shutdown of the gasification plant. Liquid nitrogen storage of 50 tonnes is also provided.
All new units are designed for an operating life of 30 years.
2.3. Process Description
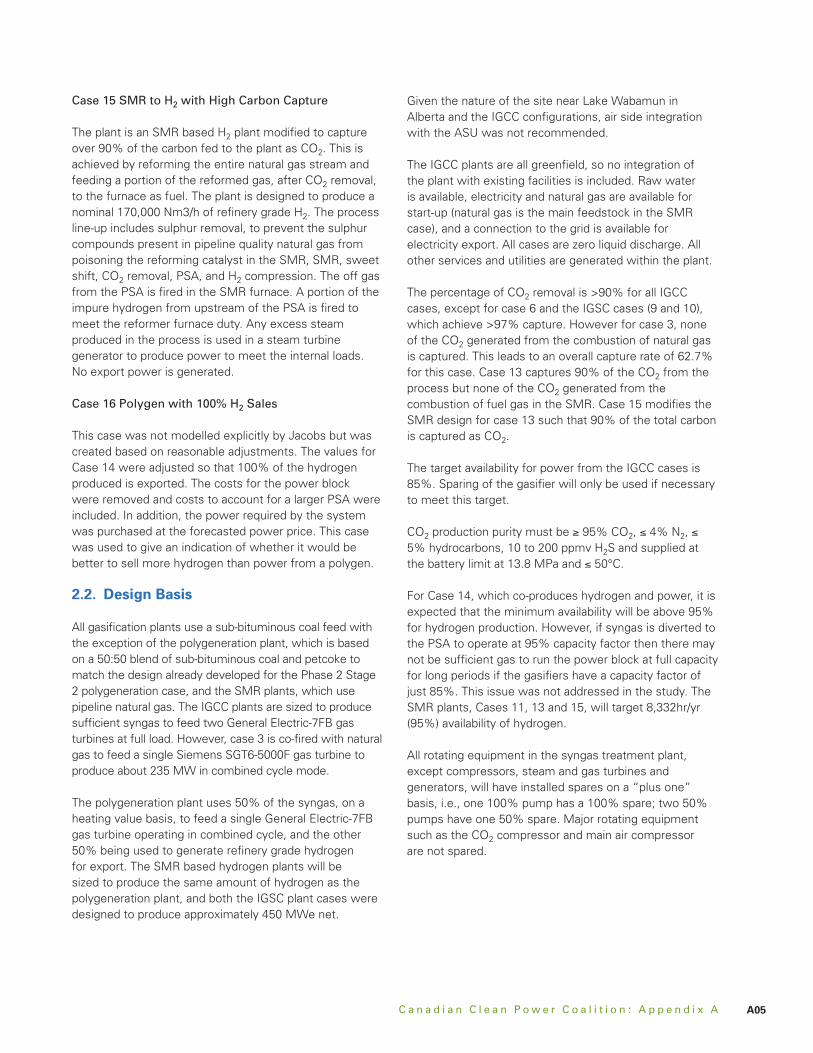
The base IGCC case is case 4 which gasifies sub-bituminous coal in three 500 MWth Siemens quench gasifiers. The produced syngas is reacted in a sour shift unit to maximize hydrogen content and to facilitate removal of more than 90% of the carbon content of the raw syngas from the gasifier as carbon dioxide. The desulphurized and decarbonized hydrogen fuel is blended with nitrogen and fired in a two-on-one combined cycle unit featuring two General Electric-7FB gas turbines and two, three pressure level heat recovery steam generators (HRSGs) providing steam to a single steam turbine. Nitrogen is also added in the combustor to reduce the combustion temperature so as to reduce the formation of thermal NOX.
Figure 1 is the block flow diagram that outlines the Siemens 500MWth plant configuration.
Sub-bituminous coal is received on site by truck and is stored in a covered storage area. The coal is then milled and dried in a conventional mill by passing air heated by direct combustion of high hydrogen syngas, through the mill during the milling process. Limestone, a fluxing agent which reduces ash fusion temperature, is added if necessary during coal milling. The coal feed is dried to 5 wt% moisture per licensor requirements for dense phase pneumatic conveying.
Pulverized coal is pneumatically conveyed to the top of the gasifier structure where it is pressurised in a lock hopper before being fed to the Siemens SFG-500 gasifier.
Oxygen at 95 vol% O2 for the gasifiers and the sulphur removal unit and nitrogen for the total facility are separated in a cryogenic Air Separation Unit (ASU). This unit is provided as a vendor package.
In the ASU atmospheric air is compressed, dried, and decarbonized. A portion of the dry air stream is sent to a booster compressor before being passed to the cold box. The remainder is fed directly to the ASU “cold box”. In the cold box, the dry air is cooled against the low temperature product streams. The cold air leaving the main heat exchanger is sent to a distillation column
arrangement typically consisting of a high pressure (HP) and low pressure (LP) column.
Liquid O2 from the sump of the LP column is pumped to the gasifier operating pressure and passed back to the main heat exchanger where it is vaporized, as it cools the incoming air. The gaseous O2 product stream is of 95 vol% purity and is at approximately 50 bar(g). Gaseous N2 leaves the top of the LP column and also passes back through the main heat exchanger to cool the incoming air.
Oxygen and nitrogen storage is provided to maintain operation of the IGCC during short outages of the ASU.
The coal reacts with a sub-stoichiometric quantity of oxygen which converts it to synthesis gas containing primarily carbon monoxide (CO), hydrogen (H2), with lesser amounts of steam (H2O), carbon dioxide (CO2), and nitrogen (N2), and small amounts of methane (CH4) and argon (Ar). The sulphur in the coal is converted primarily to hydrogen sulphide (H2S) and the remainder to carbonyl sulphide (COS). The small amount of chlorine in the coal is converted to hydrogen chloride (HCl). Small amounts of hydrogen cyanide (HCN) and ammonia (NH3) are also produced in the gasifiers. A small amount of unconverted carbon (soot) is entrained with the syngas. The temperature in the Siemens, PWR and TPRI gasifier is sufficient to melt all the ash to create slag.
The Siemens gasifier also consumes a small quantity of natural gas, approximately 1% of the thermal input, in the gasifier burner pilot.
Syngas, slag, and soot exit from the bottom of the gasifier and are cooled, in a deluge quench. Slag is removed from the bottom of the quench pool, dewatered and sent to disposal. A blowdown stream is taken from the quench which is treated in the primary black water treatment unit. A portion of the treated black water is recycled to the gasifier quench and the remaining water is sent to the waste water treatment unit.
The raw syngas stream from the gasifier, now saturated with water, is passed to the sour gas shift unit where the CO reacts with water vapour to produce additional H2 and CO2 in a two stage shift.
Heat liberated by the shift reaction is recovered by raising high pressure steam which is integrated into the steam cycle part of the combined cycle power generation to increase the output of electricity. The ‘shifted’ syngas is then cooled and passed to the acid gas removal unit which uses UOP’s Selexol process to selectively remove the sulphur compounds and CO2.
C a n a d i a n C l e a n P o w e r C o a l i t i o n : A p p e n d i x AA06
The CO2 stream from the Selexol unit is compressed and dried for export. The sulphur containing stream from the AGR unit is sent to a Claus sulphur recovery unit (SRU) to recover elemental sulphur. In addition to the sulphur compounds this stream also contains some CO2. The tail gas from the final stage of the Claus plant is passed to a tail gas treatment unit using Shell Claus offgas treatment (SCOT) technology to further reduce the sulphur emission from the plant.
The H2 rich syngas leaving the AGR is split into two streams. A small portion is sent to the coal milling and drying units as fuel gas to heat the circulating air. The majority of the H2 rich syngas is fed to the gas conditioning unit which blends the syngas with N2 and preheats the diluted fuel. The hot diluted syngas is then fed to the gas turbines. Additional N2 is added at the gas turbine to control the combustion temperature to reduce NOX.
Exhaust gas from the gas turbines provides the heat to raise steam in a 3-pressure HRSG with steam reheat. Steam from the HRSG drives the steam turbine generator.
Figure 1 below shows the block flow diagram for cases 2 to 8. For case 3 additional natural gas is used to co-fire the power block. For case 6 additional steam is added to the syngas before the shift unit. Also for case 6, natural gas is not added to the gasifier and ash rather than slag is removed from the gasifier. Fluxant is not required for case 6 since slag is not generated. For cases 7 and 8 no fluxant
is required because the gasifier operates at a very high temperature. Natural gas is also not required.
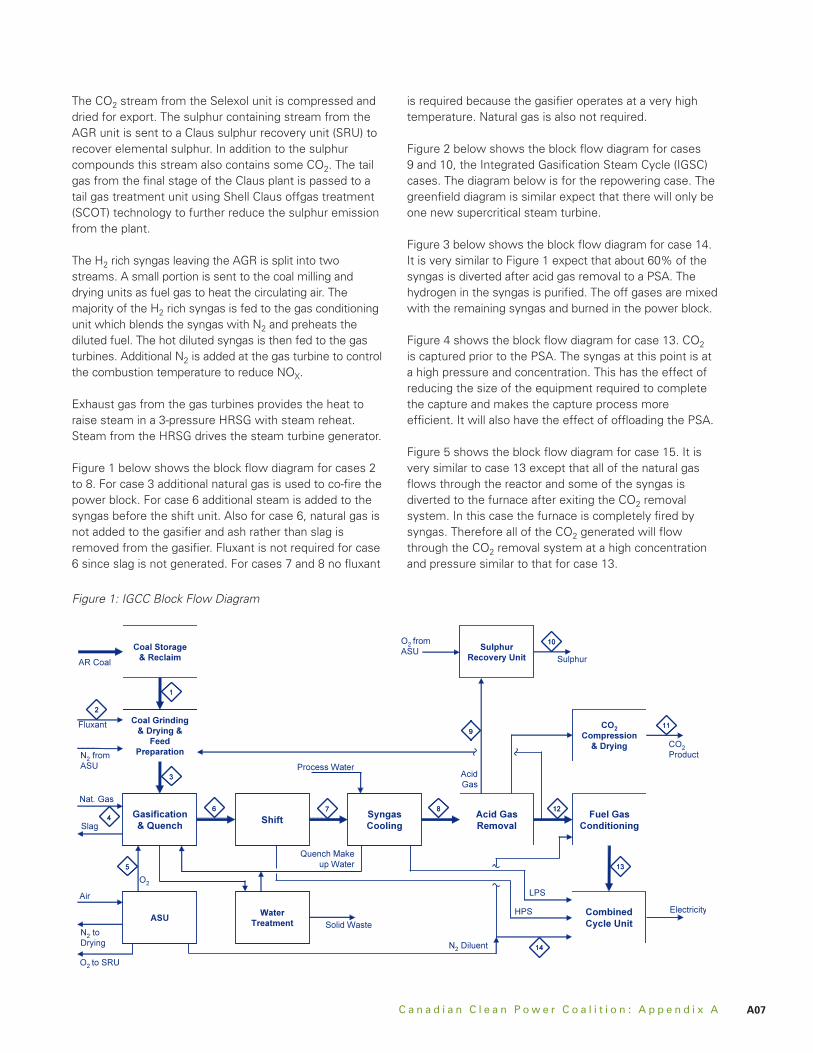
Figure 2 below shows the block flow diagram for cases 9 and 10, the Integrated Gasification Steam Cycle (IGSC) cases. The diagram below is for the repowering case. The greenfield diagram is similar expect that there will only be one new supercritical steam turbine.
Figure 3 below shows the block flow diagram for case 14. It is very similar to Figure 1 expect that about 60% of the syngas is diverted after acid gas removal to a PSA. The hydrogen in the syngas is purified. The off gases are mixed with the remaining syngas and burned in the power block.
Figure 4 shows the block flow diagram for case 13. CO2 is captured prior to the PSA. The syngas at this point is at a high pressure and concentration. This has the effect of reducing the size of the equipment required to complete the capture and makes the capture process more efficient. It will also have the effect of offloading the PSA.
Figure 5 shows the block flow diagram for case 15. It is very similar to case 13 except that all of the natural gas flows through the reactor and some of the syngas is diverted to the furnace after exiting the CO2 removal system. In this case the furnace is completely fired by syngas. Therefore all of the CO2 generated will flow through the CO2 removal system at a high concentration and pressure similar to that for case 13.
Figure 1: IGCC Block Flow Diagram
C a n a d i a n C l e a n P o w e r C o a l i t i o n : A p p e n d i x A A07
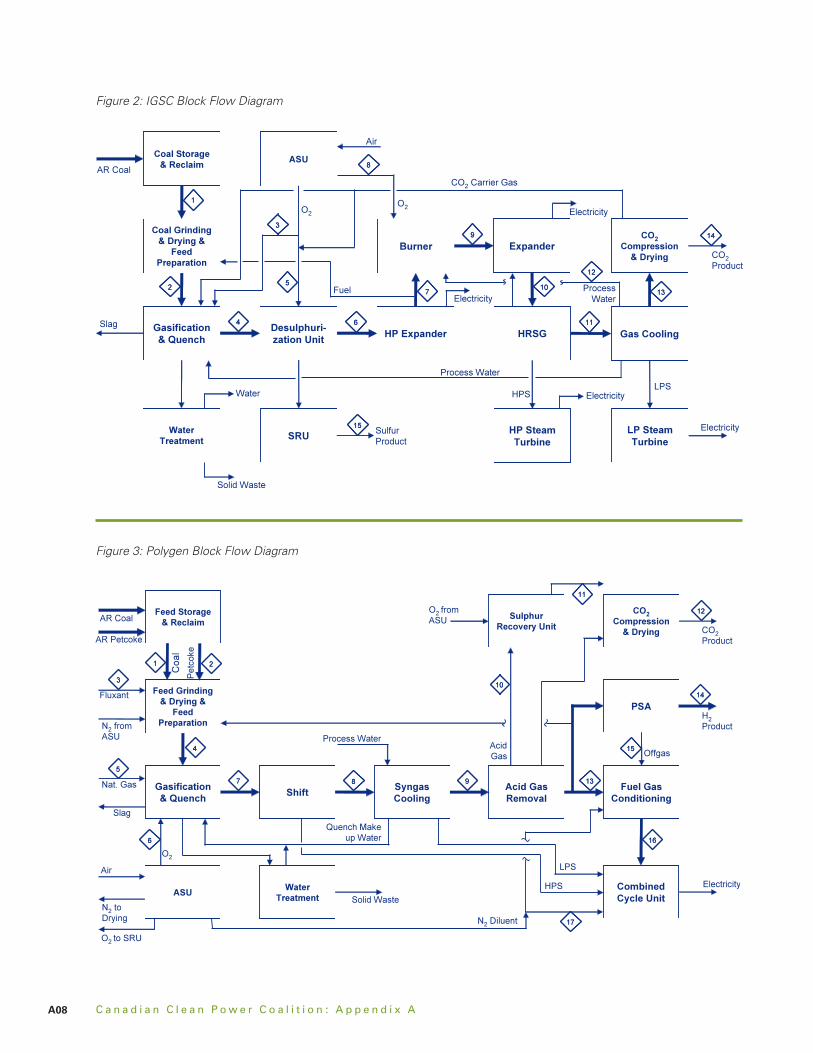
Figure 2: IGSC Block Flow Diagram
Figure 3: Polygen Block Flow Diagram
C a n a d i a n C l e a n P o w e r C o a l i t i o n : A p p e n d i x AA08

Figure 4: 50% Capture SMR Block Flow Diagram
Figure 5: 90% Capture SMR Block Flow Diagram
C a n a d i a n C l e a n P o w e r C o a l i t i o n : A p p e n d i x A A09

2.4. Key Assumptions
The cost estimate for case 3 was based on the FEED Study cost estimate which incorporated 200 quotes from licensers/vendors. The plant installed cost estimate for the other cases was developed by utilizing a combination of unit capacity factored and equipment factored estimating techniques, budget quotes from licensers/vendors and values from the FEED Study. These methods utilize historical data from plants with similar units or equipment.
The accuracy of the cost estimates in the FEED Study was estimated to be +15 to -20%. The accuracy of the cost estimates for cases 4 to 10 and 12 to 14 is estimated to be ± 35%.
For cases 2 to 15 the base estimates were developed on a United States Gulf Coast (USGC) basis, first quarter 2010 time frame, broken down into labour, equipment and materials. The USGC costs were then adjusted to a local site basis using location specific information. The site is near Edmonton, Alberta for all cases. The USGC to site adjustment factors include an efficiency factor applied to the construction labour hours, use of a local construction wage rate, a 10 % increase in equipment costs and a 17% increase in bulk material costs to account for winterization, and use of local factors for estimating indirect field costs. A US dollar to Canadian dollar exchange rate was also utilized. These adjustments were made for units where costs were developed by Jacobs as well as to the USGC cost data supplied by vendors.
The first year cost of power was determined by finding the first year power price, escalating by 2% each year thereafter, which sets the NPV of the project equal to zero. By definition when the NPV of a project is zero, the NPV of the revenue equals the NPV for the costs. This price profile can then be compared to a nominal power price forecast.
Only a portion of the CO2 captured is presumed to generate a GHG credit. The model assumed that an IGCC plant will be required to meet a CO2 intensity of 0.37 tonnes CO2/MWh similar to an NGCC unit. This limit defines a mass of CO2 which the plant is permitted to emit. The positive difference between the energy produced X 0.37 t/MWh and the mass of CO2 emitted by the plant determines the amount of credits generated for sale.
Assumptions used in the economic modeling:
• Costs were reported by Jacobs on a first quarter 2010 basis except for the CCPC II cases 2 and 12 for which
costs were provided in fourth quarter 2007 dollars. However, in this report capital costs were escalated during construction and are reported at Q1 2015 when the plants come into service. Likewise, capture costs and first year power costs are reported in this report at Q1 2015. The CCPC II values were based on an in-service date of Q1 2013.
• All costs are in Canadian dollars. The following exchange rate is used: CAD$/US$ 1.006
• For economic modeling purposes it was assumed that all plants would have an in-service date of January 1, 2015 and that construction would begin in 2010.
• 50% of the CO2 was sold for EOR at $27/tonne escalating by 2% per year.
• CO2 credits are priced at $15/tonne escalating by 2% per year. However, legislation may not allow for the generation of GHG credits for over complying with regulations.
• Transmission costs of 5% of power revenue were included.
• Costs were not included for transportation of H2 and CO2 or for storage of CO2.
• Sub-bituminous coal was priced at $1.25/GJ and petcoke was priced at $0.33/GJ.
• A capacity factor of 64% was used for the gasification cases in the first year and 85% was assumed thereafter. The SMRs were assumed to operate 95% of the time.
• A tax rate of 30% was included in the calculation of first year cost of power. Tax losses are carried forward as required.
• A return on equity of 15%, interest rate of 7%, debt to equity ratio of 60:40 was employed.
• In all cases hydrogen was assumed to be sold for $1,700/tonne firm and $1,000/tonne non-firm.
• The price for power was forecasted as $85/MWh in 2015 escalating by 2% per year.
• The price for natural gas was assumed to be $6.00/GJ in 2015 escalating by 2% per year.
C a n a d i a n C l e a n P o w e r C o a l i t i o n : A p p e n d i x AA10
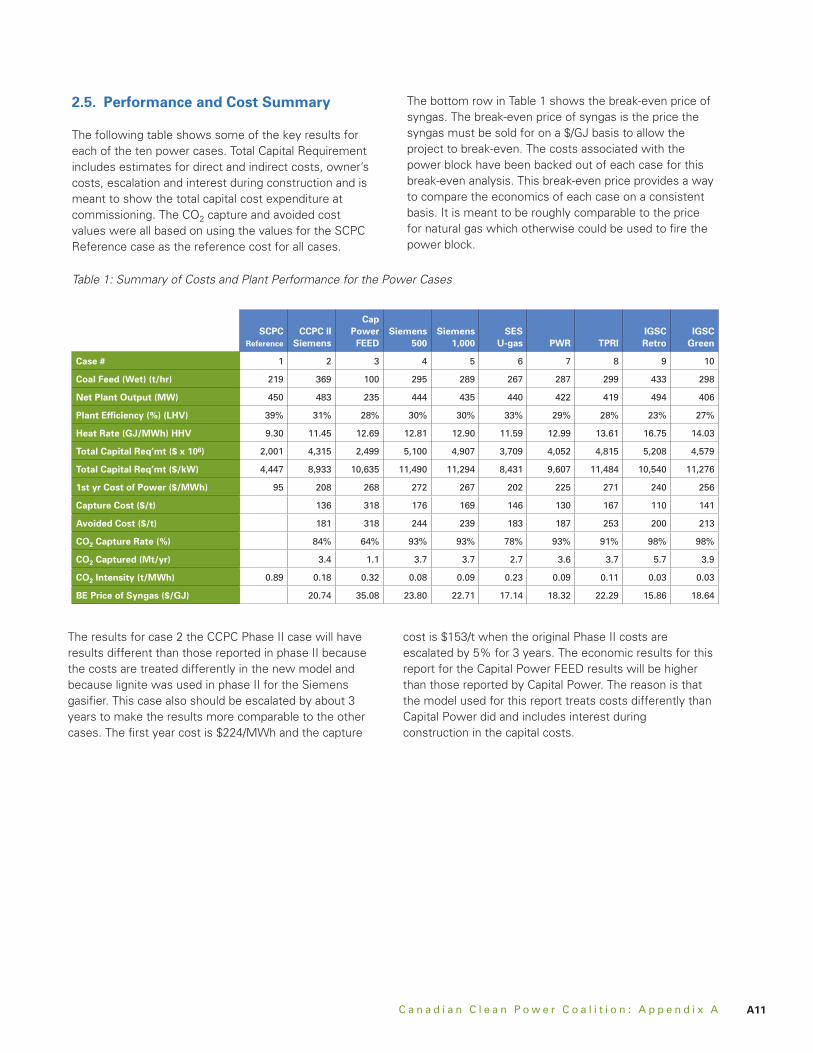
2.5. Performance and Cost Summary
The following table shows some of the key results for each of the ten power cases. Total Capital Requirement includes estimates for direct and indirect costs, owner’s costs, escalation and interest during construction and is meant to show the total capital cost expenditure at commissioning. The CO2 capture and avoided cost values were all based on using the values for the SCPC Reference case as the reference cost for all cases.
The bottom row in Table 1 shows the break-even price of syngas. The break-even price of syngas is the price the syngas must be sold for on a $/GJ basis to allow the project to break-even. The costs associated with the power block have been backed out of each case for this break-even analysis. This break-even price provides a way to compare the economics of each case on a consistent basis. It is meant to be roughly comparable to the price for natural gas which otherwise could be used to fire the power block.
Table 1: Summary of Costs and Plant Performance for the Power Cases
The results for case 2 the CCPC Phase II case will have results different than those reported in phase II because the costs are treated differently in the new model and because lignite was used in phase II for the Siemens gasifier. This case also should be escalated by about 3 years to make the results more comparable to the other cases. The first year cost is $224/MWh and the capture
cost is $153/t when the original Phase II costs are escalated by 5% for 3 years. The economic results for this report for the Capital Power FEED results will be higher than those reported by Capital Power. The reason is that the model used for this report treats costs differently than Capital Power did and includes interest during construction in the capital costs.
C a n a d i a n C l e a n P o w e r C o a l i t i o n : A p p e n d i x A A11
SCPC Reference
CCPC II Siemens
Cap Power FEED
Siemens
500
Siemens
1,000 SES
U-gas PWR TPRI IGSC Retro
IGSC Green
Case # 1 2 3 4 5 6 7 8 9 10
Coal Feed (Wet) (t/hr) 219 369 100 295 289 267 287 299 433 298
Net Plant Output (MW) 450 483 235 444 435 440 422 419 494 406
Plant Efficiency (%) (LHV) 39% 31% 28% 30% 30% 33% 29% 28% 23% 27%
Heat Rate (GJ/MWh) HHV 9.30 11.45 12.69 12.81 12.90 11.59 12.99 13.61 16.75 14.03
Total Capital Req’mt ($ x 106) 2,001 4,315 2,499 5,100 4,907 3,709 4,052 4,815 5,208 4,579
Total Capital Req’mt ($/kW) 4,447 8,933 10,635 11,490 11,294 8,431 9,607 11,484 10,540 11,276
1st yr Cost of Power ($/MWh) 95 208 268 272 267 202 225 271 240 256
Capture Cost ($/t) 136 318 176 169 146 130 167 110 141
Avoided Cost ($/t) 181 318 244 239 183 187 253 200 213
CO2 Capture Rate (%) 84% 64% 93% 93% 78% 93% 91% 98% 98%
CO2 Captured (Mt/yr) 3.4 1.1 3.7 3.7 2.7 3.6 3.7 5.7 3.9
CO2 Intensity (t/MWh) 0.89 0.18 0.32 0.08 0.09 0.23 0.09 0.11 0.03 0.03
BE Price of Syngas ($/GJ) 20.74 35.08 23.80 22.71 17.14 18.32 22.29 15.86 18.64

Figure 6: First Year Cost of Power for Power Cases
Table 2 shows the impact of changing the amount of CO2 sold to EOR rather than sequestered in a saline aquifer. For this study it was assumed that
50% of the CO2 would be sold long term for EOR. There is concern that supply of CO2 may outstrip demand for CO2 for EOR.
Table 2: First Year COE for Case 4 When Proportion of EOR Sales Changes
The figure below shows the cost components of the first year cost of power. Normally for a power project the levelized costs or first year costs include all costs incurred and these are often compared to a power price forecast to illustrate profitability. However, in many studies on IGCC taxes are excluded. Taxes are a legitimate cash out flow. The point of first year and levelized cost
calculation is to determine the power price required to pay for all costs. For this reason we have included taxes and all other costs expected to allow power and the high pressure and high purity hydrogen and carbon dioxide to be delivered to the plant gate. The values below zero are related to the sale of CO2 for EOR purposes and the value of CO2 credits.
C a n a d i a n C l e a n P o w e r C o a l i t i o n : A p p e n d i x AA12
-50
50
100
150
200
250
300
SCPC Ref
Cap FE
ED
Siemen
s 500
Siemen
s 1,00
0
SES U-G
as
PWR
TPRI
IGSC R
IGSC G
Firs
t Yea
r C
ost
($/
MW
h)
Taxes
Capital & WC
Transmission
O&M and Other
Coal & Gas Costs
CO2 Offset Sales
CO2 Commodity Sales
% of CO2 Sold for EOR 0 50% 100%
First Year Cost ($/MWh) 290.4 272.0 253.6
50
100
150
200
250
300
350
Cap FEED
Siemens 500
Siemens 1,000
SES U-Gas
PWR TPRI IGSC R IGSC G
Cap
ture
Co
st (
$/t)
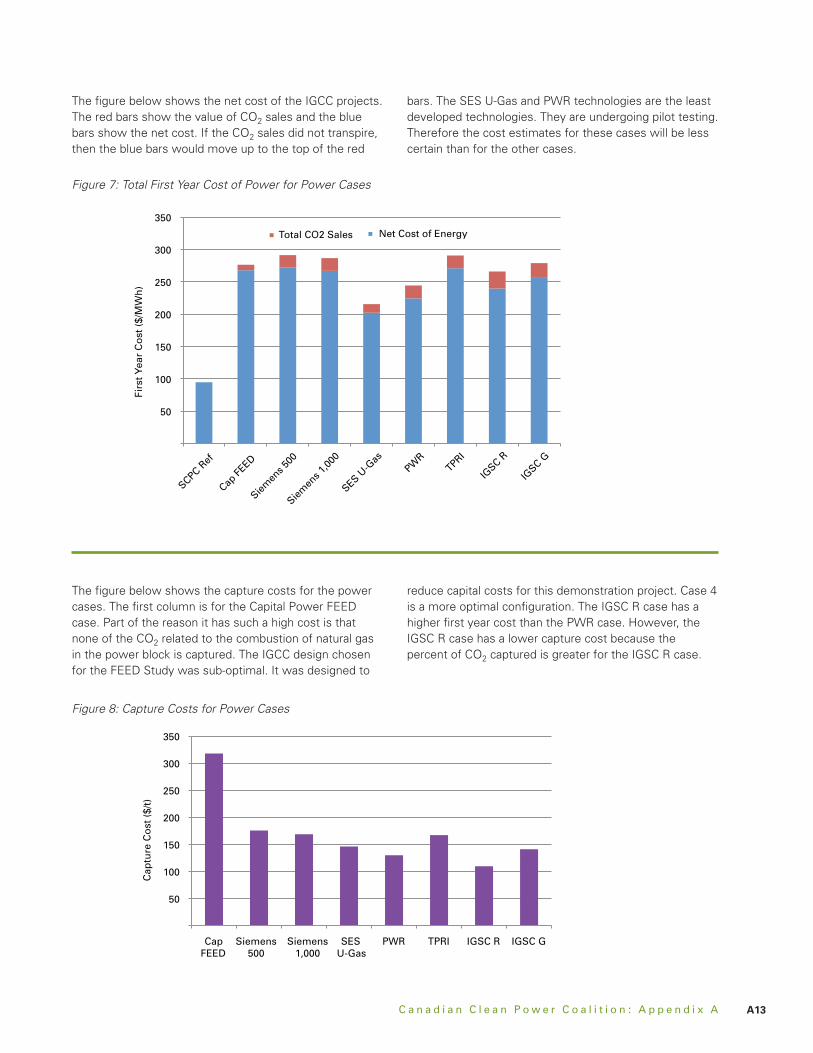
The figure below shows the net cost of the IGCC projects. The red bars show the value of CO2 sales and the blue bars show the net cost. If the CO2 sales did not transpire, then the blue bars would move up to the top of the red
bars. The SES U-Gas and PWR technologies are the least developed technologies. They are undergoing pilot testing. Therefore the cost estimates for these cases will be less certain than for the other cases.
Figure 7: Total First Year Cost of Power for Power Cases
The figure below shows the capture costs for the power cases. The first column is for the Capital Power FEED case. Part of the reason it has such a high cost is that none of the CO2 related to the combustion of natural gas in the power block is captured. The IGCC design chosen for the FEED Study was sub-optimal. It was designed to
reduce capital costs for this demonstration project. Case 4 is a more optimal configuration. The IGSC R case has a higher first year cost than the PWR case. However, the IGSC R case has a lower capture cost because the percent of CO2 captured is greater for the IGSC R case.
Figure 8: Capture Costs for Power Cases
C a n a d i a n C l e a n P o w e r C o a l i t i o n : A p p e n d i x A A13
50
100
150
200
250
300
350
SCPC Ref
Cap FE
ED
Siemen
s 500
Siemen
s 1,00
0
SES U-G
as
PWR
TPRI
IGSC R
IGSC G
Firs
t Yea
r C
ost
($/
MW
h)
Total CO2 Sales Net Cost of Energy

IGCC plants with CO2 capture not only reduce CO2 emissions compared to a coal plant, they will also have much lower emissions of sulphur (SO2), nitrogen oxides (NOX) and particulate matter (PM). The following figure shows that an IGCC plant will have significantly lower air
emissions than a new state of the art super-critical pulverized coal plant. This should be taken into account when considering the cost of capture. If a value were placed on the reduction in these emissions, the cost to capture CO2 would be lower than the reported values in this report.
Figure 9: Estimated SO2, NOX and PM Emissions
The table below shows the breakdown of power produced for each of the power cases. The expander referred to in cases 9 and 10 is the oxyfuel combustor used in the
configuration. The steam turbines for case 9 are the existing turbines. The steam turbine for case 10 is a new steam turbine.
Table 3: Power Production in MW for Power Cases
C a n a d i a n C l e a n P o w e r C o a l i t i o n : A p p e n d i x AA14
0.80
0.69
0.10
0.00
0.08 0.04
0.1
0.2
0.3
0.4
0.5
0.6
0.7
0.8
0.9
SO2 NO2 PM
Em
issi
on
Inte
nsi
ty (
kg/M
Wh
)
SCPC Reference
Siemens 500
SCPC Reference
CCPC II Siemens
Cap Power FEED
Siemens
500
Siemens
1,000 SES
U-gas PWR TPRI IGSC Retro
IGSC Green
Case # 1 2 3 4 5 6 7 8 9 10
Gas Turbine 431 421 421 421 421 421
Steam Turbine 258 254 250 184 225 243 528 433
Expander 14 381 262
Gross Power 703 325 675 671 605 646 663 908 695
Site Auxiliary Power 220 61 231 236 165 235 244 414 289
Net Power 450 483 264 444 434 440 412 419 494 406
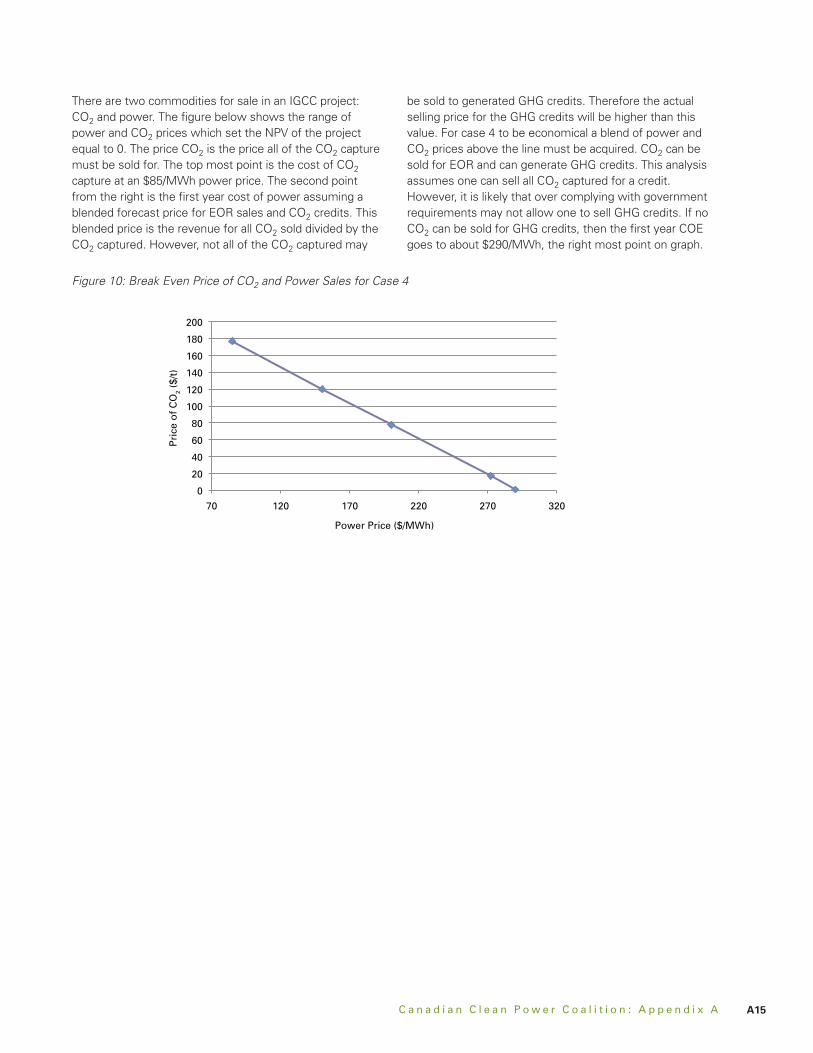
There are two commodities for sale in an IGCC project: CO2 and power. The figure below shows the range of power and CO2 prices which set the NPV of the project equal to 0. The price CO2 is the price all of the CO2 capture must be sold for. The top most point is the cost of CO2 capture at an $85/MWh power price. The second point from the right is the first year cost of power assuming a blended forecast price for EOR sales and CO2 credits. This blended price is the revenue for all CO2 sold divided by the CO2 captured. However, not all of the CO2 captured may
be sold to generated GHG credits. Therefore the actual selling price for the GHG credits will be higher than this value. For case 4 to be economical a blend of power and CO2 prices above the line must be acquired. CO2 can be sold for EOR and can generate GHG credits. This analysis assumes one can sell all CO2 captured for a credit. However, it is likely that over complying with government requirements may not allow one to sell GHG credits. If no CO2 can be sold for GHG credits, then the first year COE goes to about $290/MWh, the right most point on graph.
Figure 10: Break Even Price of CO2 and Power Sales for Case 4
C a n a d i a n C l e a n P o w e r C o a l i t i o n : A p p e n d i x A A15
0
20
40
60
80
100
120
140
160
180
200
70 120 170 220 270 320
Pri
ce o
f C
O2
($/t
)
Power Price ($/MWh)

C a n a d i a n C l e a n P o w e r C o a l i t i o n : A p p e n d i x AA16
0%
20%
40%
60%
80%
100%
120%
140%
160%
180%
MIT
1
EPRI2
NETL 103
IEA 11
4 IE
A5
Global
CCS6
Phase I
I
Phase I
II
% In
crea
se in
Cap
es $
/kW
The costs described in this report are generally higher than those reported in the literature even adjusted for location effects. The following chart shows the increase in capital costs on a $/kW basis for IGCC cases with capture compared to super-critical pulverized coal plants without capture.
Using this comparison normalized many of the location and cost estimation differences. The red line shows the
average increase for the values taken from the literature. The literature suggests that the IGCC plants with CCS cost about 64% more than a SCPC without capture on a $/kW basis. The Phase III results for case 4 are based on FEED level results. It shows that IGCC plants with capture are expected to be more than 150% more expensive than SCPC plants without capture.
Figure 11: % Increase in IGCC w CCS over SCPC wo CCS Capex
Notes
1 MIT – The Future of Coal, Massachusetts Institute of Technology, Massachusetts, United States, 2007.
2 EPRI – Engineering-Economic Evaluations of Advanced Coal Technologies with Carbon Capture and Storage – 2011. EPRI, Palo Alto, CA: 2011. 1022025.
3 NETL 2010 – National Energy Technology Laboratory, Cost and Performance Baseline for Fossil Energy Plants Volume 1: Bituminous Coal and Natural Gas to Electricity, Revision 2, November 2010.
4 IEA 11 – International Energy Agency, Cost and Performance of Carbon Dioxide Capture from Power Generation, 2011.
5 IEA – IEA Greenhouse Gas R&D Programme (IEA GHG), Co-production of electricity and hydrogen by coal gasification with CO2 capture updated economic analysis, report 2008-9, August 2008.
6 Global CCS – Economic Assessment of Carbon Capture and Storage Technologies, Global CCS Institute, 2011.

C a n a d i a n C l e a n P o w e r C o a l i t i o n : A p p e n d i x A A17
0%
20%
40%
60%
80%
100%
120%
140%
160%
% In
crea
se in
CO
E
MIT
1
EPRI2
NETL 103
IEA 11
4 IE
A5
Global
CCS9
Phase I
I
Phase I
II
Harva
rd8
CCS Tas
k7
DTI6
The following chart shows the reported increase in the cost of energy in $/MWh for IGCC plants with CCS compared to corresponding reference SCPC plants without CCS. The red line shows the average for values taken from the literature. The literature suggests that the
cost of power for IGCC plants with capture will be about 64% greater than that for SCPC plants without CCS. The Phase III values show that IGCC costs for power with CCS may be more than 130% greater than for SCPC plants without CCS.
Figure 12: % Increase in IGCC w CCS over SCPC wo CCS COE
Notes
1 MIT – The Future of Coal, Massachusetts Institute of Technology, Massachusetts, United States, 2007.
2 EPRI – Engineering-Economic Evaluations of Advanced Coal Technologies with Carbon Capture and Storage – 2011. EPRI, Palo Alto, CA: 2011. 1022025.
3 NETL 2010 – National Energy Technology Laboratory, Cost and Performance Baseline for Fossil Energy Plants Volume 1: Bituminous Coal and Natural Gas to Electricity, Revision 2, November 2010.
4 IEA 11 – International Energy Agency, Cost and Performance of Carbon Dioxide Capture from Power Generation, 2011.
5 IEA – IEA Greenhouse Gas R&D Programme (IEA GHG), Co-production of electricity and hydrogen by coal gasification with CO2 capture updated economic analysis, report 2008-9, August 2008.
6 DTI – The Energy Challenge, Energy Review Report 2006, Department of Trade and Industry, July 2006.
7 CCS Task – EcoEnergy Task Force – Economic and Policy Sub Group – Economic Analysis, November 30, 2007.
8 Harvard – “Realistic Costs of Carbon Capture” Discussion Paper 2009-08, Cambridge, Mass.: Belfer Center for Science and International Affairs, Al-Juaied, Mohammed A and Whitmore, Adam, July 2009.
9 Global CCS – Economic Assessment of Carbon Capture and Storage Technologies, Global CCS Institute, 2011.

C a n a d i a n C l e a n P o w e r C o a l i t i o n : A p p e n d i x AA18
The following table shows some of the physical and financial results for the hydrogen production cases. The first year cost of power for these cases is predicated on the assumption that firm and non-firm hydrogen is sold for a blended price of about $1,500/tonne. The break-even cost of hydrogen in 2015 from an SMR without CCS is shown in Figure 13 to be about $1,660/tonne. The CCPC II
polygen value may differ from the CCPC Phase II report because the Phase III model treats the costs differently and employs different assumptions. The CCPC II case should be escalated by 3 years to be more comparable to the Phase III cases. Clearly though the Phase III polygen case 14 has a higher cost than the case 12 estimate for Phase II.
Table 4: Summary of Costs and Plant Performance for the Hydrogen Cases
SMR no CCS
CCPC II Polygen
SMR 50% Cap
Polygen 50% H2
SMR 90% Cap
Poly 100% H2
Case # 11 12 13 14 15 16
Coal/Coke Feed (t/hr) 276 219 219
Net Plant Output (MW) 8 199 -2 148 -19
Total Capital Req'mt ($ x 106) 404 4,591 601 4,690 925 4,310
BE Cost of H2 ($/t) 1,661 3,781 1,875 5,665 2,558 3,776
Capture Cost ($/t) 113 59 147 104 148
CO2 Capture Rate (%) 78% 53% 90% 91% 90%
CO2 Captured (Mt/yr) 3.5 0.6 3.4 1.3 3.4
H2 Production (T/day) 370.1 529.9 369.0 365.5 368.8 695.7

C a n a d i a n C l e a n P o w e r C o a l i t i o n : A p p e n d i x A A19
The figure below shows the components of the first year cost to produce hydrogen for the hydrogen cases. For this analysis it is assumed that any power produced will be sold at the forecasted price of $85/MWh escalating by 2% per year. The values below zero are related the sale of power and CO2 for EOR purposes and CO2 credits. It is assumed reductions in CO2 emissions below 50% of the expected
emissions from an SMR without CO2 capture may be allowed to be sold to generated credits. Clearly the polygen cases produce hydrogen at a cost greater than that for SMRs with capture. Also it appears that maximizing the amount of hydrogen produced and selling less power reduces the cost to produce hydrogen. The lowest cost CO2 capture case is the SMR case were 50% of the CO2 generated is captured.
-2,000
-1,000
1,000
2,000
3,000
4,000
5,000
6,000
7,000
SMR Ref no CCS SMR 50% Cap.
Polygen 50% H2
SMR 90% Cap. Polygen 100% H2
Firs
t Yea
r C
ost
($/
t H
2)
Taxes Capital & WC O&M and Other Fuel Costs Power Revenue CO2 Sales
Figure 13: First Year Cost of Hydrogen for Hydrogen Cases
The following figure shows the total cost to produce hydrogen. The red bar represents an estimate of the value
of CO2 sales. If there are no CO2 sales then the blue bars would extend to the top of the red bars.
Figure 14: Total Cost to Produce Hydrogen
1,000
2,000
3,000
4,000
5,000
6,000
SMR Ref no CCS
SMR 50% Cap.
SMR 90% Cap.
Polygen50% H2
Polygen100% H2
Firs
t Yea
r C
ost
($/
t H
2) EOR CO2 Sales Total

C a n a d i a n C l e a n P o w e r C o a l i t i o n : A p p e n d i x AA20
0
20
40
60
80
100
120
140
160
SMR 50% Cap. Polygen 50% H2 SMR 90% Cap. Polygen 100% H2
Cap
ture
Co
st (
$/t
CO
2)
The following figure shows the cost of CO2 capture for the hydrogen cases. As expected the SMR case with 50% capture has the lowest cost of capture.
Figure 15: Cost of Capture for the Hydrogen Cases
For the hydrogen cases, there are three commodities for sale: Power, CO2 and Hydrogen. If we assume that the price of power is determined by the assumed power price forecast there is a relationship between hydrogen and CO2 sales for each case which sets the NPV of a project equal to zero. Figure 16 shows this relationship between hydrogen and CO2 prices. The price of CO2 is the blended price one must sell all of the CO2 captured for. The left most values in the graph below, show the required hydrogen price to set the NPV of the project equal to 0 assuming the price of all CO2 sold is based on the forecasted values. The right most values assumes hydrogen is sold for a blended firm and non-firm price and the price of CO2 is varied to set the NPV equal to 0. For a plant to be economical a set of hydrogen and carbon dioxide prices above each line must be acquired. All of the hydrogen from the SMRs will be sold firm and command an assumed price of $1,700/t. For the 50% polygen case
one gasifier worth of hydrogen is assumed to be sold firm and about half of one gasifier will be sold non-firm. For the 100% polygen case one gasifier worth of hydrogen will be sold firm and two gasifiers worth of hydrogen will be sold non-firm with much lower capacity factors. Since non-firm hydrogen is assumed to be sold for slightly less than the fuel cost for an SMR of $1,000/t, selling more non-firm hydrogen will cause the required selling price for CO2 to increase. However, for the forecasted CO2 price, the price of H2 will decrease as more H2 is sold. The operating income for the polygen 100% case will decrease as less power is sold, more hydrogen is sold and power is purchased. Since the operating income goes down this should drive up the price for H2 but there is about twice as much being sold. Therefore the price of H2 decreases.
Clearly an SMR with 50% capture has a competitive advantage when compared to polygen.

C a n a d i a n C l e a n P o w e r C o a l i t i o n : A p p e n d i x A A21
Figure 16: The Break Even Price of Hydrogen and CO2 Sales for Hydrogen Cases
1,000
1,500
2,000
2,500
3,000
3,500
4,000
4,500
5,000
5,500
6,000
0 50 100 150 200
Pri
ce o
f H
2 ($
/t)
CO2 Price ($/t)
Polygen 50% H2
Polygen 100% H2
SMR @ 50% Cap.
One of the more difficult questions to answer is whether it is better to use the syngas to produce hydrogen for export or produce power and why. The syngas produced, once the CO2 is captured is mostly hydrogen. What is the best use of this hydrogen. The blue bars in Figure 17 shows the total revenue from power and hydrogen sales in a year divided by the mass of syngas produced in a year after CO2 capture. When syngas is converted into power it yields a value of about $1,330/t of syngas. For the 50% case one gasifier worth of syngas will be sold firm and half of one gasifier will be sold non-firm. The blended price of this hydrogen $1,550/t and is higher than that for power. Therefore, the blue bar for the polygen 50% case will be greater than for the IGCC case. However, for the polygen 100% case more non-firm hydrogen will be sold at $1,000/t. This is lower than for the power sales displaced and therefore the 100% bar will be lower than the 50% bar.
The red bars are based on the levelized cost for each case divided by the volume of syngas produced each year after CO2 is removed. The numerical values show the net cost of syngas production. Net cost is the cost less revenue. The middle red bar for polygen shows that reducing the size of the power block, compared to the IGCC case, and including a PSA to produce more hydrogen yields a lower cost of syngas production than the IGCC case. However, when 100% of the hydrogen is exported for sale, power must be purchased to operate the plant. The price for imported power is greater than the decreased capital cost associated with the removal of the power block.
It appears that the production of hydrogen from syngas is more economical than using it to produce power both because hydrogen generates more revenue per tonne of syngas than power and because the cost to produce hydrogen is lower than the cost to use syngas to produce power. However, it appears it is more cost effective to use non-firm H2 to produce power than to sell it as non-firm H2 at the assumed prices.

C a n a d i a n C l e a n P o w e r C o a l i t i o n : A p p e n d i x AA22
Figure 17: Net Cost to Produce Power and Hydrogen from Syngas
3. EPRI Roadmap Study
3.1. Case Descriptions
Coal Beneficiation: The Alberta sub-bituminous coal used in the study contains approximately 18% ash (as received). It was assumed that coal beneficiation technology could remove 25% of the ash in the coal used in the base case. Ash acts as a heat sink in the gasifier, taking heat away from the gasification reactions and reducing the efficiency of the gasifier. Reducing the ash content by 25% with a coal beneficiation process resulted in a 0.6% net plant efficiency gain, due primarily to higher gasification efficiency that resulted in lower thermal input to the plant.
Oxygen Production: The Air Products and Chemicals ITM oxygen technology produces very high purity O2 using perovskite materials at high temperature with a combination of properties sufficient to meet commercial IGCC requirements for performance and operating life. The system is designed to use natural gas and air to produce O2 and nitrogen (N2) diluent containing less than 2% O2, while offsetting approximately 80% of the auxiliary power required in the base case for the air separation unit area with a lower capital cost.
high Temperature and Pressure Sulphur recovery (hTPSr): The Bechtel Pressure Swing Claus (BPSC) sulphur-recovery system design replaces or eliminates the need for three process blocks in a conventional IGCC
system. The acid gas removal (AGR), conventional Claus sulphur recovery unit, and tail gas treating unit (TGTU) are replaced with two high-pressure sub-dew-point Claus reactors with a pressure swing reactor regeneration system. The sulphur-bearing compounds are removed at pressure prior to fuel gas cooling and condensate recovery, which eliminates the need for sour water stripping.
hydrogen Membrane: The Eltron hydrogen transport membrane system is a network of tubular membranes composed of a dense metal alloy with two thin catalyst layers deposited on either side. On the syngas feed side, an oxidation (that is, hydrogen disassociation) catalyst is used to disassociate molecular hydrogen into single hydrogen atoms. Atomic hydrogen diffuses through the dense membrane toward a second layer of catalyst (desorption catalyst) on the sweep side of the membrane. Pure hydrogen is produced. The remaining CO2 is then sent for purification.
Advanced CO2 Capture: Air Products has been developing a pressure swing adsorption (PSA) process (Sour PSA) that is specifically tailored to remove CO2 and sulphur constituents from syngas. The PSA can be designed to produce a range of hydrogen purities. The H2 product from the Sour PSA unit remains at pressure and can be fed directly into a gas turbine. The tail gas from the unit contains CO2, H2S, and residual CO and H2 and can be fed into a tail gas treatment unit where sulphur is removed as a concentrated H2S stream for treatment in a Claus process and subsequent disposition as elemental sulphur.
500
1,000
1,500
2,000
2,500
3,000
3,500
4,000
4,500
IGCC Polygen 50% H2 Polygen 100% H2
Val
ue
($/
t S
yng
as)
Ave Price of All Syngas Sold
BE Cost of All Syngas Produced
2,734 1,953 2,502
C a n a d i a n C l e a n P o w e r C o a l i t i o n : A p p e n d i x A A23
CO2 Purification and Pressurization: The Ramgen shock compression technology represents a potentially significant advancement in the state of the art for many compression applications and specifically for CO2 compression. The principal advantage of shock compression is that it can achieve exceptionally high compression efficiency at very high single-stage compression ratios, resulting in product simplicity and size that is expected to lower both manufacturing and operating costs. Additionally, heat is recovered between compression stages through production of low-pressure (LP) steam that is sent to the LP crossover in the steam turbine for increased power production.
Advanced Gas Turbines: The Japanese national project is called the X-class in this study. Each increase in frame size is driven by an increase in firing temperature. In this study, the H-class gas turbines were projected to have a 1,500°C (2,750°F) firing temperature; the J-class gas turbines were projected to have a 1,600°C (2,900°F) firing temperature; and the X-class gas turbines were projected to have a 1,700°C (3,100°F) firing temperature.
Supercritical Steam Turbine: As gas turbines evolve in frame size and firing temperature, the exhaust temperatures from these machines go up, providing sufficient conditions to produce supercritical steam. While it is currently not possible to make supercritical steam in a conventional heat recovery steam generator (HRSG) due to thermodynamic and materials limitations, it is expected to be possible in the future should the materials issues be resolved. This case evaluates the thermodynamic value of increasing steam pressure and temperature on the J-frame gas turbine case presented in the previous section to produce super critical steam.
Additionally, two cases were created to study the aggregate impacts of several technologies on advanced IGCC plants in the 2020 and 2030 time frames. The 2030 case included an advanced, compact gasifier under development by Pratt & Whitney Rocketdyne.
Mid-Term Technology Advancement: This case included technologies closest to commercialization that were analyzed in this study. They included coal beneficiation, Air Products Sour PSA and H-class gas turbine.
Long-Term Technology Advancement: This case included technologies, expected to be commercialized in the 2030 time frame that were analyzed in this study. They included coal beneficiation, a Pratt & Whitney Rocketdyne compact gasifier, the BPSC process, the Eltron hydrogen transport membrane, J-class turbine and supercritical steam turbine.
3.2. Design Basis
The design basis for the EPRI Roadmap Study was the same as that used for the Jacobs Study.
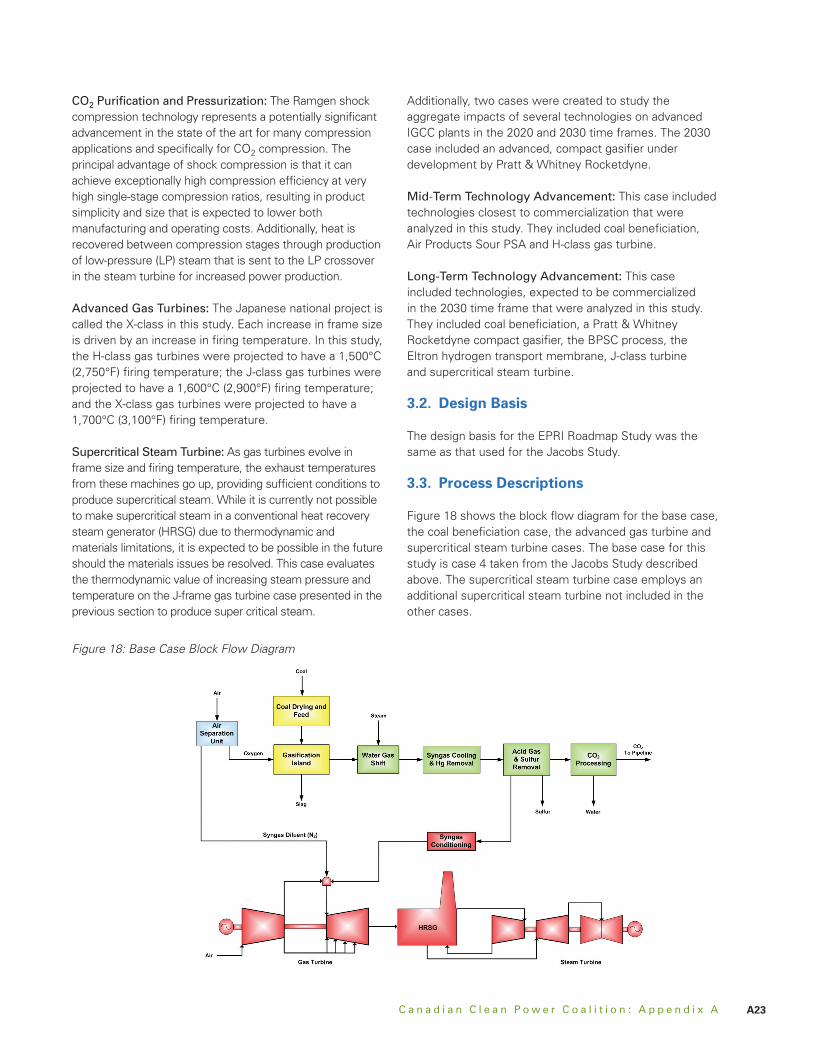
3.3. Process Descriptions
Figure 18 shows the block flow diagram for the base case, the coal beneficiation case, the advanced gas turbine and supercritical steam turbine cases. The base case for this study is case 4 taken from the Jacobs Study described above. The supercritical steam turbine case employs an additional supercritical steam turbine not included in the other cases.
Figure 18: Base Case Block Flow Diagram

C a n a d i a n C l e a n P o w e r C o a l i t i o n : A p p e n d i x AA24
Figure 19 shows the block flow diagram for the oxygen production case. This diagram is similar to the base case
expect for the addition of natural gas fuel to the ITM oxygen system.
Figure 19: Oxygen Production Block Flow Diagram
Figure 20 shows the block flow diagram for the high temperature and pressure sulphur removal (HTPSR) case. This single process replaces the acid gas removal, conventional Claus sulphur removal system and the tail gas treating unit for less capital costs with less power requirements. This system is also meant to clean syngas at a high temperature and pressure. However, because of
the high ammonia content in the syngas, the syngas is cooled to 38°C to facilitate ammonia removal and is then reheated. The resulting thermodynamic losses in cooling the syngas and condensing out water limit the improvement in plant efficiency. Higher efficiencies are expected if ammonia can be dealt with without cooling the syngas.
Figure 20: HTPSR Block Flow Diagram

C a n a d i a n C l e a n P o w e r C o a l i t i o n : A p p e n d i x A A25
Figure 21 shows the block flow diagram for the hydrogen membrane case. This system used the Bechtel Pressure Swing Clause system to deliver high pressure and
temperature sulphur free syngas to the hydrogen membrane. High purity hydrogen is delivered to the power block and high purity CO2 is sent for further processing.
Figure 21: Hydrogen Membrane Block Flow Diagram
Figure 22 shows the block flow diagram for the Advanced CO2 Capture case employing sour PSA. The hydrogen
produced in the PSA remains at pressure and can be sent directly to the power block.
Figure 22: Advanced CO2 Capture Case

C a n a d i a n C l e a n P o w e r C o a l i t i o n : A p p e n d i x AA26
The Mid-Term Technology case, employs coal beneficiation, sour PSA and a H-class turbine. Its block flow diagram is very similar to that in Figure 22 except that it includes air extraction from the gas turbine to supply high pressure air to the air separation unit.
Figure 23 shows the block flow diagram for the long-term technology case expected to be available in 2030. It includes coal beneficiation, a Pratt & Whitney Rocketdyne compact gasifier, the Bechtel pressure swing Claus process and the Eltron membrane process.
Figure 23: Long-Term Technology Case

C a n a d i a n C l e a n P o w e r C o a l i t i o n : A p p e n d i x A A27
3.4. Performance and Cost Summary
EPRI completed a high level thermodynamic assessment of the impact of the technology improvements. Figure 24
shows the expected net plant efficiency improvements for each case. The use of hydrogen membranes seems to offer the best improvement in efficiency beside the turbine advancements.
Figure 24: Efficiency Improvements
A series of cost targets was established for each of the technologies, in some cases with advice from the technology developers. These cost targets are not based on rigorous costs estimates. The following figure shows a rough
estimate of the specific total plant costs for each case based on these cost targets. The value for the base case will not match the values for Case 4 described above because EPRI did not include costs associated with owner’s costs.
Figure 25: Specific Total Plant Costs
PWRReduction in

C a n a d i a n C l e a n P o w e r C o a l i t i o n : A p p e n d i x AA28
Figure 26: Cost of Electricity Estimates
4. Discussion of Results
The National Energy Technology Laboratory (NETL) recently completed a similar study entitled Current and Future Technologies for Gasification-Based Power Generation, on October 7, 2010. They considered advanced turbines, increases in capacity factor, warm gas clean-up, warm gas clean-up with hydrogen membranes, ITM oxygen production and the use of solid oxide fuel cells. NETL reached conclusions similar to those in this study. However, their advancements lead to greater overall reductions in the cost of electricity compared to this study. The NETL study also reported capital costs which were much lower than those reported here.
Table 27 shows data for a Siemens IGCC case which was taken from the recent Cost and Performance Baseline for Fossil Energy Plants, Volume 3a: Low Rank Coal to Electricity: IGCC Cases, DOE/NETL-201/1399, May 2011. Transmission or taxes have been removed from the CCPC data in Figure 27 to make the numbers more comparable to the NETL numbers. It shows that the CCPC values for all cases are substantially higher than those reported by NETL. The NETL TASC values are in 2007$. The CCPC data is in 2015$. The capital costs in the CCPC case were escalated during the construction period to an in-service date of 2015. The capital costs in the NETL cases were escalated during a five year construction period beginning in 2007. Escalation may account for some of the difference, but there are clearly other fundamental cost differences besides location and escalation.
Many of the technologies studied may offer a reduction in capital cost for the equipment provided. They may also have the effect of increasing net output. These effects account for the reduction in specific total plant costs. In some cases one might be willing to pay more for a given technology than the components it replaces and still have a lower cost of electricity because the technology may reduce other costs or have the effect of increasing net output. The long-term case incorporates a PWR gasifier. The blue bracket on the right shows the capital cost reduction expected for the PWR gasifier compared to the Siemens gasifier.
The following figure shows a range for the cost of electricity for the cases. The top of each bar is the cost of electricity
for the base case. The base case value is based on Case 4 described above. EPRI used a slightly different cost estimate for Case 4 than those used in the Jacobs Study and a completely difference method for calculating the cost of electricity. For these reasons the cost of electricity for Case 4 from the Jacob Study cannot be compared to the base case in EPRI Roadmap Study. The bottom value in each bar shows the cost of electricity assuming the cost targets for these technologies are met. These cost targets are not based on rigorous costs estimates. The ITM oxygen production process and the hydrogen membrane process may provide significant reductions in the cost of electricity.
The brackets on the right side indicate how the various technology improvements contribute to the cost reductions.
HTPSP/H2Membrane
SC ST (w/J GT)
PWR
C a n a d i a n C l e a n P o w e r C o a l i t i o n : A p p e n d i x A A29
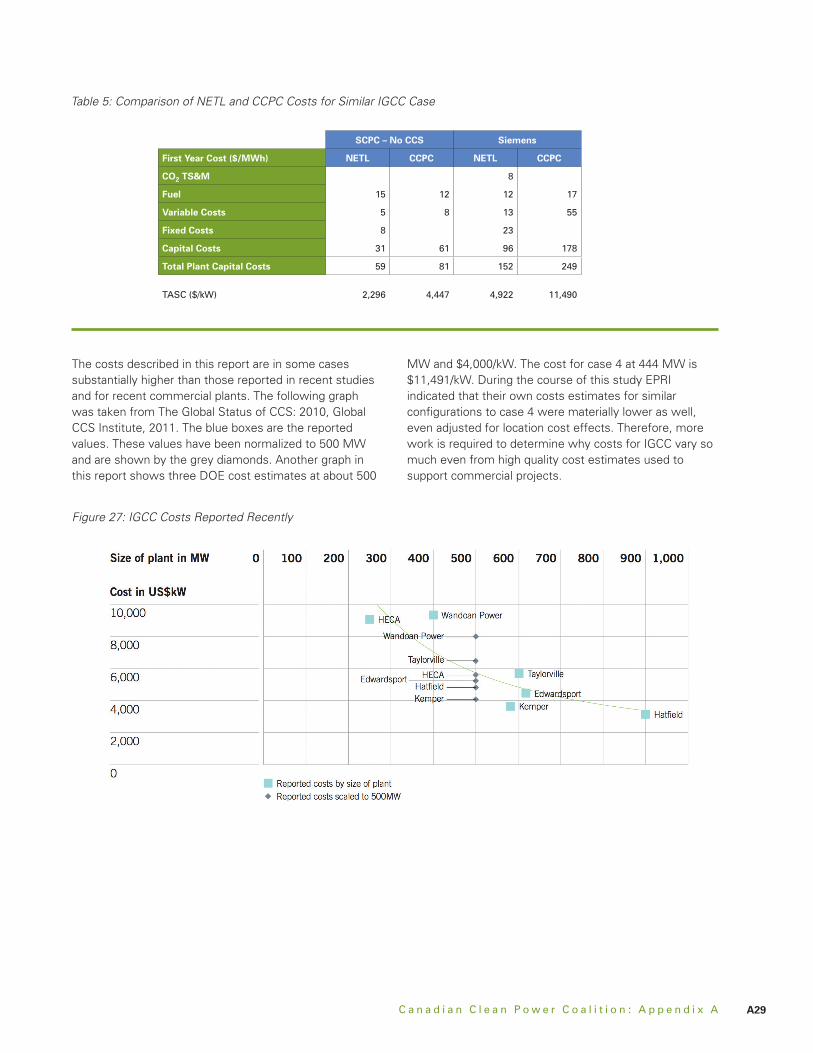
Table 5: Comparison of NETL and CCPC Costs for Similar IGCC Case
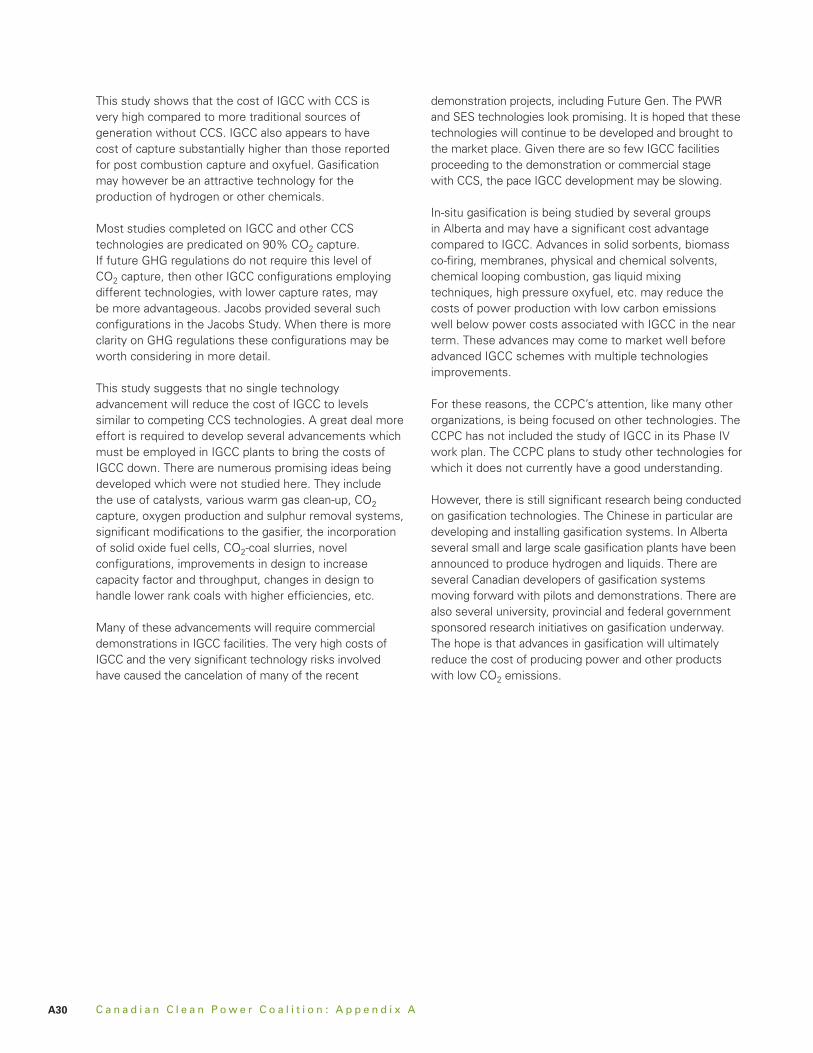
The costs described in this report are in some cases substantially higher than those reported in recent studies and for recent commercial plants. The following graph was taken from The Global Status of CCS: 2010, Global CCS Institute, 2011. The blue boxes are the reported values. These values have been normalized to 500 MW and are shown by the grey diamonds. Another graph in this report shows three DOE cost estimates at about 500
MW and $4,000/kW. The cost for case 4 at 444 MW is $11,491/kW. During the course of this study EPRI indicated that their own costs estimates for similar configurations to case 4 were materially lower as well, even adjusted for location cost effects. Therefore, more work is required to determine why costs for IGCC vary so much even from high quality cost estimates used to support commercial projects.
Figure 27: IGCC Costs Reported Recently
SCPC – No CCS Siemens
First Year Cost ($/MWh) NETL CCPC NETL CCPC
CO2 TS&M 8
Fuel 15 12 12 17
Variable Costs 5 8 13 55
Fixed Costs 8 23
Capital Costs 31 61 96 178
Total Plant Capital Costs 59 81 152 249
TASC ($/kW) 2,296 4,447 4,922 11,490
C a n a d i a n C l e a n P o w e r C o a l i t i o n : A p p e n d i x AA30
This study shows that the cost of IGCC with CCS is very high compared to more traditional sources of generation without CCS. IGCC also appears to have cost of capture substantially higher than those reported for post combustion capture and oxyfuel. Gasification may however be an attractive technology for the production of hydrogen or other chemicals.
Most studies completed on IGCC and other CCS technologies are predicated on 90% CO2 capture. If future GHG regulations do not require this level of CO2 capture, then other IGCC configurations employing different technologies, with lower capture rates, may be more advantageous. Jacobs provided several such configurations in the Jacobs Study. When there is more clarity on GHG regulations these configurations may be worth considering in more detail.
This study suggests that no single technology advancement will reduce the cost of IGCC to levels similar to competing CCS technologies. A great deal more effort is required to develop several advancements which must be employed in IGCC plants to bring the costs of IGCC down. There are numerous promising ideas being developed which were not studied here. They include the use of catalysts, various warm gas clean-up, CO2 capture, oxygen production and sulphur removal systems, significant modifications to the gasifier, the incorporation of solid oxide fuel cells, CO2-coal slurries, novel configurations, improvements in design to increase capacity factor and throughput, changes in design to handle lower rank coals with higher efficiencies, etc.
Many of these advancements will require commercial demonstrations in IGCC facilities. The very high costs of IGCC and the very significant technology risks involved have caused the cancelation of many of the recent
demonstration projects, including Future Gen. The PWR and SES technologies look promising. It is hoped that these technologies will continue to be developed and brought to the market place. Given there are so few IGCC facilities proceeding to the demonstration or commercial stage with CCS, the pace IGCC development may be slowing.
In-situ gasification is being studied by several groups in Alberta and may have a significant cost advantage compared to IGCC. Advances in solid sorbents, biomass co-firing, membranes, physical and chemical solvents, chemical looping combustion, gas liquid mixing techniques, high pressure oxyfuel, etc. may reduce the costs of power production with low carbon emissions well below power costs associated with IGCC in the near term. These advances may come to market well before advanced IGCC schemes with multiple technologies improvements.
For these reasons, the CCPC’s attention, like many other organizations, is being focused on other technologies. The CCPC has not included the study of IGCC in its Phase IV work plan. The CCPC plans to study other technologies for which it does not currently have a good understanding.
However, there is still significant research being conducted on gasification technologies. The Chinese in particular are developing and installing gasification systems. In Alberta several small and large scale gasification plants have been announced to produce hydrogen and liquids. There are several Canadian developers of gasification systems moving forward with pilots and demonstrations. There are also several university, provincial and federal government sponsored research initiatives on gasification underway. The hope is that advances in gasification will ultimately reduce the cost of producing power and other products with low CO2 emissions.