Dividend policy, corporate control and the tax status of the controlling shareholder
Upload
khangminh22Category
view
0download
0
Corporate tax avoidance, shareholder dividend tax policy,
and manager-shareholder alignment
Dan Amiram
Columbia Business School Columbia University
Andrew M. Bauer
Department of Accountancy University of Illinois at Urbana-Champaign
Mary Margaret Frank
Darden School of Business The University of Virginia
Draft from: December 28, 2012
Keywords: principal-agent, managerial incentives, imputation, corporate tax avoidance, dividend taxation, tax policy
Corresponding author: Mary Margaret Frank, Darden School of Business, The University of Virginia, 100 Darden Boulevard, Charlottesville, VA 22903, tel: +1-434-924-4432, email: [email protected]. We thank Rosanne Altshuler (discussant), Razi Avram, Jenny Brown (discussant), James Chyz (discussant), Trevor Harris, Shane Heitzman, Justin Hopkins, Glenn Hubbard, Dimitra Koutsantoni, Pete Lisowsky, Chris Mayer, Jake Thornock, Jaron Wilde (discussant) and Jerry Zimmerman for helpful discussions and comments. We appreciate the comments received from conference participants at the UNC Tax Symposium, the University of Rochester, the American Accounting Association Annual conference, the American Taxation Association Mid-Year Meeting and the CAAA Annual Conference. We gratefully acknowledge the financial support provided by the University of Virginia Darden School Foundation.

Corporate tax avoidance, shareholder dividend tax policy, and manager-shareholder alignment
Abstract
This study uses a unique international setting to examine managerial incentives to avoid corporate taxes. We exploit changes in a country’s shareholder dividend tax policy, which are exogenous to the firm, to examine if managers engage in corporate tax avoidance to increase shareholder value, consistent with manager-shareholder alignment. Specifically, we examine changes in corporate tax avoidance after the elimination, as well as enhancement, of imputation systems around the world. Our results are consistent with managers engaging in corporate tax avoidance to benefit shareholders. In cross-sectional tests, we find evidence consistent with higher corporate tax avoidance for closely-held firms in countries where a shareholder benefit exists. Our findings have implications for our understanding of the effect of manager-shareholder alignment on corporate tax avoidance and the debate over tax reform.

[1]
Corporate tax avoidance, shareholder dividend tax policy, and manager-shareholder
alignment
I. Introduction
Corporate tax avoidance is widely discussed in the press, around the business community,
among policymakers, and within academia. Scandals involving corporate tax shelters have hurt
the public’s trust in the business community, and countries facing financial instability are
proposing to eliminate corporate tax “loopholes”. Many journalists in the press, public interest
groups and politicians vilify corporations that proactively lower their tax liabilities. However,
these corporate actions, which generate this public unrest, are likely a product of the incentives
that managers face.
Influenced by research on individual tax evasion, early research on corporate tax
avoidance simply assumes that the manager and the owner are the same decision maker who
trades off corporate tax savings with the costs of tax avoidance. While this assumption may be
true for small businesses, the corporate tax avoidance that generates much of the public unrest is
concentrated among large, widely-held corporations where principal-agent conflicts exist
(Crocker and Slemrod, 2005). The limited research that explicitly addresses the effect of the
principal-agent dilemma on corporate tax avoidance provides conflicting predictions. Consistent
with much of the finance literature on agency conflicts, one stream of research predicts firms use
incentives to encourage managers to engage in corporate tax avoidance on behalf of
shareholders. However, Desai and Dharamapala (2006) incorporate managers’ private benefits
from diverting corporate resources, as well as the shareholders’ benefits from corporate tax
avoidance, into their principal-agent model and find the effect of incentives on corporate tax

[2]
avoidance is ambiguous. Their empirical results suggest that aligning managers with
shareholders’ interests through equity compensation leads to lower corporate tax avoidance for
the average firms from the United States. However, other empirical research on corporate tax
avoidance, which examines the manager-shareholder alignment through equity compensation,
finds conflicting results (Hanlon, Mills and Slemrod, 2005; Armstrong, Blouin and Larcker,
2012; Rego and Wilson, 2012).
In this study, we move away from equity compensation as a measure of manager-
shareholder alignment and exploit a unique setting exogenous to the firm to assess the effect that
agency conflicts have on managers’ willingness to engage in corporate tax avoidance. Our
setting capitalizes on variation in the benefits to shareholders from corporate tax avoidance,
which is driven by a country’s shareholder dividend tax policy. Firms in the United States, such
as the ones examined in the prior literature, are subject to a classical tax system. Corporate
earnings are taxed at the firm level and then again at the shareholder level when they are
distributed as a dividend (i.e., double taxation). Therefore, corporate tax avoidance increases
after-tax cash flows creating either more private benefits for managers or higher after-tax cash
flows to shareholders. Other countries around the world employ an imputation tax system. In
contrast to a classical system, an imputation system imposes taxes on corporate earnings at the
firm level, but these corporate taxes paid are credited against the shareholders’ taxes when
earnings are distributed as dividends. This credit causes the total tax paid on earnings to be equal
to the shareholders’ tax (i.e., single taxation), so corporate tax avoidance increases after-tax cash
flows available for managers’ private benefits but does not increase the after-tax cash flows to
[3]
shareholders. Because corporate tax avoidance is costly, it actually reduces the after-tax cash
flows to shareholders under an imputation system and makes them worse off.1
The difference between the effects of corporate tax avoidance on shareholders’ after-tax
cash flows in imputation countries as compared to classical countries creates a unique setting to
examine the role of the manager in corporate tax avoidance. For managers of firms residing in
countries with imputation systems as compared to a classical system, corporate tax avoidance
provides the private benefits assumed in Desai and Dharmapala (2006), but reduced, if any,
benefits to shareholders. If managers engage in corporate tax avoidance because of manager-
shareholders alignment, we will find corporate tax avoidance is higher for firms residing in
countries with classical tax systems as compared to imputation tax systems.2
We use a sample of 52,895 firm-year observations from 1994 through 2008 across 28
OECD countries to examine the effect of countries’ shareholder dividend tax policies on
corporate tax avoidance. To minimize the effect of confounding variables, we use difference-in-
differences estimations to examine the effect of changes in countries’ imputation systems on
corporate tax avoidance. As predicted, we find that in the years after a country eliminates its
imputation system, firms from these countries increase their corporate tax avoidance activities
relative to firms from countries that did not change their shareholder dividend tax policy. We
extend this analysis by examining the differential impact of the elimination of the imputation
systems on firms, based on dividend payout and multinational operations and find results
consistent with shareholder alignment driven avoidance. Moreover, we find evidence of decrease
in corporate tax avoidance for firms from Australia as compared to other countries beginning in
1 Costs of tax avoidance include but are not limited to, advisors fees, the incorporation and maintenance of offshore subsidiaries, operational changes and the risk of reputation loss. 2 This prediction assumes that the firms’ ability to motivate managers through incentives is constant across countries.

[4]
2003, following an exogenous increase in the availability of imputation credits in Australia. Our
results are robust to the use of different common measures of corporate tax avoidance and the
inclusion of controls shown to affect corporate tax avoidance in an international setting.
Results from sensitivity tests using pooled, cross-sectional analyses confirm that
corporate tax avoidance for firms from countries with full imputation systems is lower than for
firms from partial imputation systems; both are lower than firms from non-imputation systems.
Moreover, within imputation countries, corporate tax avoidance is lower for firms with a greater
percentage of closely-held shares, while firms with more closely-held shares from classical
systems exhibit more corporate tax avoidance. These results suggest firm characteristics that
create a stronger alignment between managers and shareholders accentuate the shareholders’
interest (or disinterest) in corporate tax avoidance created by a country’s tax system.
The main contribution of the study is that our findings provide evidence that corporate
tax avoidance by managers is driven by the alignment of their interest with shareholders.
Furthermore, when the shareholders’ incentive for lower corporate taxes is eliminated, corporate
tax avoidance falls. This evidence contributes to the debate on corporate tax avoidance in the
media, policy circles and the academic literature.
This study also contributes to the finance and economic policy literature. First, it shows
that in the equilibrium contracting environment around the world, managers act as if they are
well aligned with shareholders by reducing tax avoidance activities when it is against
shareholders’ benefit but still increase managers’ benefits. How well managers and shareholders
are aligned is still an open question in the finance literature. Second, the findings of the paper
suggest that it may be possible to design a policy that reduces tax avoidance by taking advantage
of the alignment between managers and shareholders.

[5]
This study makes further contribution by connecting two streams of literature on
corporate tax avoidance. The literature on the effect of managerial incentives on corporate tax
avoidance focuses exclusively on firms from the United States and ignores the variation in
managerial incentives for corporate tax avoidance around the world, which is driven by country-
level tax policies. On the other hand, Atwood et al. (2012) is the first study to analyze the effect
of country-specific tax system characteristics on corporate tax avoidance, but ignores the agency
conflicts inherent in corporate tax avoidance. Specifically, they examine the effects of a
country’s international tax system (worldwide versus territorial) and corporate statutory tax rates,
as well as a country’s level of enforcement and book-tax conformity, on corporate tax
avoidance.3 They implicitly assume manager-shareholder alignment across countries in their
analysis of the effect of a country’s tax system on corporate tax avoidance. Our results provide
evidence that their implicit assumption is descriptive.
This study also sheds light on potential unintended consequences of the European
Union’s effort to harmonize the tax consequences of its residents. In 2004 and 2005, the
European Court of Justice (ECJ) ruled that several imputation systems in place throughout
Europe were discriminatory. That is, the countries’ imputation systems favored their residents
over non-residents. To avoid discrimination, many European countries began to eliminate their
imputation systems, but at what cost? While the objective of the ECJ’s ruling is well-intended, it
may have unknowingly increased corporate tax avoidance in Europe. Our evidence speaks to
concerns over the ECJ’s attempts to harmonize tax policy, through its rulings at the expense of
3 These four tax system characteristics are included in current corporate tax reform proposals in the United States. In October 2011, House Ways and Means Committee Chairman, David Camp, proposed tax reforms, which include a reduction of the corporate tax rate and implementation of a territorial tax system, to increase the global competitiveness of U.S. businesses. The Business Roundtable and the National Foreign Trade Council, among others, welcomed the proposal. However, many groups, including Citizens for Tax Justice, labor unions and small business coalitions wrote letters urging the members of the Joint Select Committee of Deficit Reduction to oppose a move to a territorial system because it favors multinationals, which generally already enjoy lower corporate effective tax rates due to their overseas operations.

[6]
its member states, through the potential negative impact on members’ tax revenues (Graetz and
Warren 2006).4
While the findings in this study have important policy implications, we offer a word of
caution. Our study speaks to one aspect of tax policy; however, tax policy is a complex issue in a
global economy with many competing objectives. For example, Amiram and Frank (2012) show
that imputation systems deter foreign equity portfolio investors. In addition, any declines in
corporate tax avoidance under an imputation system may increase the shareholders’ incentives to
avoid personal taxes.
The remainder of this paper is organized as follows. Section II briefly discusses the
different taxation of dividends around the world and develops our research design. Section III
describes the data, sample selection, and descriptive statistics. Section IV presents the results of
our analyses. Section V concludes.
II. Background, predictions and research design
A. The debate over corporate tax avoidance
For the purpose of this study, we define corporate tax avoidance as any corporate activity,
legal or illegal, designed to reduce the corporate tax burden relative to the statutory rate. In a
heavily cited and debated study, the Citizens for Tax Justice (CTJ) reports that 280 of the largest
U.S. publicly-traded companies have an effective tax rate during 2009 - 2010 that is less than
half of the U.S. corporate statutory tax rate.5 The CTJ argues that the companies in their study are
not paying their “fair share” of tax, stating that a quarter of the companies pay tax on less than
4 Our evidence also provides support for prior research that finds that imputation is associated with lower tax minimization in New Zealand (Wilkinson et al. 2001) and higher capital investment in Australia (Jugurnath et al. 2008). Whereas these prior studies have relatively small sample sizes (N < 310) and focus on one imputation country, our study uses an extensive sample of firms – both imputation and classical - in a uniquely international setting. 5 “Corporate Taxpayers & Corporate Tax Dodgers 2008-2010” by R. McIntyre, M. Gardner, R. Wilkins, and R. Phillips, published in November 2011 by the Citizens for Tax Justice and the Institute for Taxation and Economic Policy.

[7]
10% of profits and thirty companies pay no tax at all. The CTJ also advocates that “closing
corporate tax loopholes will have real benefits, including a fairer system, reduced federal budget
deficits, and more resources to improve roads and schools – things that are really important for
economic development here in the United States.” 6
While corporate tax avoidance has social costs and is met with negative press and
government scrutiny,7 not engaging in tax avoidance potentially reduces the after-tax cash flows
to the U.S. firm’s shareholders. With international tax competition increasing as countries lower
their corporate tax rates to attract mobile capital (Avi-Yonah 2000), some stakeholders in the
debate argue that managers of U.S. firms are incentivized and even have the fiduciary duty to
avoid taxes if it increases their shareholders’ value.8,9 However, there is no consensus in the
empirical research that managers of U.S. firms engage in corporate tax avoidance because it
benefits shareholders. Imputation systems do not provide shareholders’ benefits to corporate tax
avoidance, thus comparing corporate tax avoidance across country-level shareholder dividend
tax policies creates a unique setting to determine if increasing shareholder value motivates
managers to engage in corporate tax avoidance. If managers engage in corporate tax avoidance
for the benefit of shareholders, we expect to see lower corporate tax avoidance by firms in
imputation countries.
B. The taxation of dividends
Each country’s tax system comprises different policies that affect taxpayer behavior and
government revenue. This study focuses on the policy applicable to the taxation of corporate
6 “Biggest Public Firms Paid Little in U.S. Tax Study Says” by D. Kocieniewski published in The New York Times on November 3, 2011. 7 Other examples include a story aired March 27, 2011 on 60 Minutes entitled “The New Tax Havens” and a story on ABC World News aired October 21, 2010 building on an article entitled “Google 2.4% Rate Shows How $60 Billion Lost to Tax Loopholes” by Jesse Drucker published by Bloomberg. 8 “U.S. Corporations Suffer High Effective Tax Rates by International Standards” by P. Dittmer and published by the Tax Foundation on September 2011. 9 “Who Could Blame G.E.?” by Joe Nocera in the New York Times on April 4, 2011.

[8]
income paid from a corporation to its shareholders through dividends. The taxation of corporate
income can be split into two major categories: classical and imputation. These major categories
lead to very different incentives for managers to engage in corporate tax avoidance. The United
States and many other countries have some version of a “classical” tax system for corporate
income. A classical system imposes tax on income at the corporate level and then again at the
shareholder level on the dividend distributed. This tax system results in economic double
taxation: different taxpayers are taxed on the same income.
In a classical tax system, a dollar saved through corporate tax avoidance reduces the
overall tax burden, increases the after-tax cash flows to shareholders and gives managers an
incentive to avoid taxes on the shareholders’ behalf. Modified classical systems, which have
preferential shareholder tax rates on dividends relative to interest, provide managers with the
same incentive for corporate tax avoidance.10 While the shareholder-level tax burden is reduced
by the preferential tax rate, the corporate-level tax burden is not, and a dollar saved through
corporate tax avoidance still reduces the overall tax burden and increases after-tax cash flow to
shareholders. Another tax system, an inclusion system, also lowers shareholder-level taxes but
not corporate-level taxes. Rather than having preferential shareholder tax rates for dividends like
the modified classical system, shareholders receive a preferential tax base in an inclusion system
because only a portion of the dividend is included in their taxable income. As a result, inclusion
systems, modified classical and classical tax systems, incentivize managers to engage in
corporate tax avoidance in order to return more after-tax cash to their shareholders. For the
remainder of the study we refer to all of these tax systems as classical systems unless otherwise
noted.
10 The United States has a modified classical system.

[9]
Other countries impose only a single layer of taxation on corporate income through an
imputation system, also known as an integrated system. An imputation system imposes a tax on
corporate income, but the shareholder receives credits for the taxes paid by the corporation such
that the shareholder pays only the difference between the corporate tax rate and the shareholder’s
tax rate on dividends. As a result, the overall tax burden on dividends in an imputation system is
equivalent to the shareholder’s tax burden and corporate tax avoidance simply shifts the tax
payments from the corporation to the shareholder.11 Conceptually, corporate tax avoidance is
costly, so under an imputation system corporate tax avoidance makes shareholders worse off
relative to no tax avoidance. Australia, Chile, Mexico, and New Zealand have a full imputation
system where a tax credit is given to shareholders for the full corporate tax. Canada, the United
Kingdom and South Korea have partial imputation systems where shareholders receive a tax
credit for only a portion of the corporate tax. The United Kingdom is the only member of the EU
that has maintained some form of an imputation system. France, Germany, Spain, Italy, Ireland
and Finland have all had imputation systems at one time, but between 1999 and 2007 they
eliminated their imputation systems.
C. An illustration of the taxation of dividends
To demonstrate the incentives for corporate tax avoidance under classical and imputation
systems of taxation, we develop the following example. A corresponding numerical illustration
of this example can be found in Appendix A. Assume that two identical “all equity” firms exist
in two different countries. One operates under a classical system (Firm C) and one operates
under an imputation system (Firm I).12 Both countries have a corporate tax rate of 30% and the
11 For a more detailed example, see the illustration in the next subsection. 12 Alternatively, assume that a firm operates in a country with an imputation system and then exogenously the country shifts to a classical system. This scenario is consistent with the strategy we implement in our empirical analysis.

[10]
shareholders of the firm in each country face a dividend tax rate of 50%. We also assume that
each firm earns $100 in taxable income annually, pays all taxes in cash and distributes any
remaining after-tax income as cash dividends.13
C.1 Scenario 1 – Without corporate tax avoidance
In our first scenario, we assume that firms cannot engage in tax avoidance. Both firms
earn $100 of taxable income and pay $30 in corporate taxes. Thus each firm distributes a $70
cash dividend to their respective shareholders. In the country with a classical system,
Shareholder C pays $35 in individual taxes on that $70 dividend. In total, the government with
the classical system receives $65 in taxes ($30 corporate, $35 individual) and Shareholder C
receives $35 after all taxes are paid. In the country with an imputation system, Shareholder I
receives the same $70 cash dividend but pays a different amount of individual taxes. First,
Shareholder I’s taxes are determined based on Firm I’s taxable income (i.e. the entire $100 of
taxable income). In other words, Shareholder I pays tax on the dividend, which is “grossed-up”
to account for the corporate taxes. The tax owed on the grossed-up dividend is $50 ($100*50%)
before any imputation credits. Second, Shareholder I receives imputation credits equal to the
corporate taxes paid ($30) which reduces Shareholder I’s tax burden from $50 to $20. In total,
the government with the imputation system receives only $50 in taxes ($30 corporate, $20
individual), which is equivalent to the shareholder tax burden and Shareholder I receives $50
after-taxes. In the absence of corporate tax avoidance, Shareholder I receives more after-tax cash
than Shareholder C because the imputation system avoids the double-taxation penalty of a
classical system.
13 As we will demonstrate, most of the assumptions in this paragraph are only to make the calculations tractable. Alternative assumptions do not change the spirit of this illustration.
[11]
C.2 Scenario 2 - With corporate tax avoidance
We assume that managers from Firm C and Firm I chose to engage in corporate tax
avoidance that costs $10 and generate a non-cash deduction of $90 for tax purposes. At the
corporate-level, Firm C and Firm I continue to be identical. Each firm still earns $100, but now
spends $10 to engage in corporate tax avoidance. The $10 is deductible and yields an additional
$90 deduction for tax purposes with no additional cash outflow. Therefore, taxable income is
zero for both firms ($100-$10-$90), but after-tax cash flow is $90 to each firm. Under the
classical system, Shareholder C receives a cash dividend of $90 and pays taxes of $45. Under the
imputation system, Shareholder I also receives a $90 cash dividend and pays the same $45 in
taxes as Shareholder C. The dividend gross-up is not needed and the imputation credit is not
available to Shareholder I because Firm I did not pay any corporate taxes. In this tax avoidance
scenario, both firms reduce the corporate tax rate from 30% to 0% and report higher after-tax
cash flow but only Shareholder C is better off relative to Scenario 1 ( $45- 35 = $10);
Shareholder I is worse off ($45-50 = -$5). If the managers of Firm I are strongly aligned with
Shareholder I’s interests, they will not engage in the corporate tax avoidance. Conversely, the
managers of Firm C have incentives to engage in corporate tax avoidance to benefit Shareholder
C. Thus, firms in imputation countries have lower incentives for corporate tax avoidance than
firms in classical countries.
D. Difference-in-differences
Based on the difference between country-level shareholder dividend tax policies, we
predict that firms from countries with imputation systems have less corporate tax avoidance than
firms from classical systems. To test this prediction, while controlling for confounding
variables, we employ two difference-in-differences analyses as our primary research designs.
[12]
First, we examine whether countries that eliminate their imputation systems have increased
levels of corporate tax avoidance after the change relative to countries that do not change their
shareholder dividend tax policies. We examine this prediction using the equation (1):
TAX_AVOIDANCEit = γ0 + γ1*IMPi + γ2*POSTit + γ3*IMP_POSTit + γ4-k Xit + ψi + ξt + μit (1)
where
TAX_AVOIDANCEit is the amount of corporate tax avoidance. IMPi equals one if a firm’s
country of residence has ever had an imputation system in any year of the sample, zero
otherwise.14 POSTit equals one for every year after a firm’s country of residence eliminates its
imputation system, and zero otherwise. For firms that reside in countries that never change their
shareholder dividend tax policy POSTit equals one in each year after a randomly selected year,
and zero otherwise. We randomly chose a year for POST for these firms because POST and
IMP_POST, the interaction of IMP and POST, are collinear for these observations. We cannot
use one year as a simple partition for all firms in the sample as done in a typical pre-post analysis
because countries eliminate their imputation systems in different years. IMP_POSTit is an
interaction variable that represents the years after the countries eliminate their imputation system
and is our main variable of interest. We expect corporate tax avoidance to increase after
countries eliminate their imputation systems (γ3 > 0). Xit represents a set of firm-year control
variables, and ψi and ξt represent industry and year fixed-effects, respectively.
One concern with the difference-in-differences design in equation (1) is that it only
captures increases in managerial incentives to avoid corporate taxes because it examines the
elimination of imputation systems. However, a policy change that implements an imputation
14 If a country has a non-zero and non-missing imputation rate in our OECD data, then we consider that country to have ever had an imputation system and IMP equals one.
[13]
system may not reduce managerial incentives to avoid corporate taxes if managers have already
made the investment in corporate tax avoidance, and the investment is more costly to unwind
than keep in place. Therefore, we implement a second difference-in-differences design to test the
effect of a reduction in managerial incentives to avoid corporate taxation by examining
legislation enacted in Australia. During 2002, Australia passed legislation to simplify and
enhance the availability of imputation credits in its current system for shareholders. The
increased availability of the imputations credits potentially reduces managers’ incentives for
corporate tax avoidance in Australia after the change in 2002 relative to firms in other countries.
We examine this prediction using equation (2):
TAX_AVOIDANCEit = γ0 + γ1* IMP_YRt + γ2* AUSi + γ3*POST03it + γ4*AUS_POST03it
+ γ5-k*Xit + ψi + ξt + μit (2)
where
IMP_YRit equals one if the country of a firm in year t has an imputation system, and zero
otherwise. We expect γ1 < 0 if managers of firms incorporated in countries with imputation
systems have less incentive to avoid corporate taxes. AUSi equals one if a firm resides in
Australia, and zero otherwise. POST03it equals one for the period following the legislative action
in 2002, and zero otherwise. Our variable of interest, AUS_POST03it is the interaction between
AUSi and POST03it. We expect corporate tax avoidance to decrease in Australia beginning in
2003 after the enactment of the Australian simplified imputation system (γ4 < 0). All the
remaining variables are as defined in equation (1).

[14]
III. Data and Sample
A. Data sources
To construct the tax-related variables in our empirical models, we require data on three
tax policies of each country: the shareholder dividend tax policy, the corporate statutory tax rate
and the imputation rate. We obtain these data from the OECD and, when necessary, hand
collection. The system for corporate taxation includes categories such as classical, full and
partial imputation, inclusion, etc. The remainder of our independent variables are constructed
from data available in Datastream. Finally, for brevity we provide Appendices B and C to
summarize the details and individual sources of data needed to construct our variables.
B. Sample
We begin by collecting data available from the Thompson Reuters Datastream Advance
Database. We rely primarily on accounting data from Worldscope (WC), although market-level
data is available through Datastream. We restrict our selection to securities that contain primary
quotes, but we allow for all major security types, equity instruments and American or Global
Depository Receipts. Next, we eliminate observations that have missing fiscal year-end dates
(WC05350) and thus missing accounting data. Further, we restrict our sample to the fiscal years
1993 through 2008. These criteria result in 479,376 firm-year observations.
Following a match of our country-level tax data from the OECD to our Datastream
sample of firm-years, we have 362,930 observations remaining. After eliminating observations
where CSTR or the type of tax system is missing, we have 336,816 observations. Finally, in order
to use a consistent sample across our empirical tests, we eliminate observations with missing
values in any of our variables or with missing industry values. Because we require one-year lag
values of total assets to scale our continuous variables, the year 1993 is effectively removed from

[15]
our dataset. Our final sample includes 52,895 firm-year observations from 1994 through 2008.15
We attempt to minimize the undue influence of outlier observations by winsorizing all
continuous variables in the 1st and 99th percentiles of their respective distribution.
C. Measures of Tax Avoidance
We use four measures of corporate tax avoidance (TAX_AVOIDANCE) based on
variations of Cash ETR from Dyreng et al. (2008). Cash ETRs are less sensitive to home-country
financial accounting standards than other tax avoidance measures such as effective tax rates
reported in the financial statements. In our main analyses, we use measures of annual Cash ETR,
instead of the long run measures recommended by Dyreng at al. (2008) because of data
restrictions that substantially reduce the size of the sample. In sensitivity tests, we examine the
effects of other corporate tax avoidance measures.16 Finally, we winsorize the Cash ETR
measures before we calculate our spreads and ratios discussed below.
The first variable, SPREAD_INC, subtracts a firm’s annual Cash ETR from the corporate
statutory tax rate (CSTR) of the country in which it resides. In this specification, Cash ETR
equals cash taxes paid divided by pre-tax income adjusted for special items. The second variable,
SPREAD_CF, also subtracts a firm’s annual Cash ETR from the CSTR of the country in which it
resides. However in SPREAD_CF, Cash ETR equals cash taxes paid divided by net operating
cash flows with cash taxes paid added back. Therefore, the first set of tax constructs,
SPREAD_INC and SPREAD_CF, represent the spread between what a benchmark firm would
pay in tax in its resident country and what a firm actually pays in tax. We interpret that larger
15 Not all countries require that taxes paid be reported on the cash flow statement, leading to missing values for the Cash ETR measure and the potential for self-selection issues. However, as we identify subsequently in our robustness checks, we obtain similar inferences from our models if we use a more readily available dependent variable like ETR rather than Cash ETR. 16 In Section IV D, we report results using measures of long-term Cash ETR (Dyreng et al. 2008) and other non-cash based measures of tax avoidance. Inferences are unchanged using these measures.
[16]
spreads imply more corporate tax avoidance relative to the corporate statutory tax rate
benchmark.
As an alternative to tax spreads, the second set of measures consists of tax ratios.
RATIO_INC (RATIO_CF) divides Cash ETR, calculated with income (cash flows) in the
denominator, by CSTR. We interpret that larger ratios imply less corporate tax avoidance relative
to the corporate statutory tax rate benchmark. We adjust all of these measures for the firm’s
respective corporate statutory tax rate because countries that implement imputation systems
could have lower corporate statutory tax rates and thus less incentive to avoid corporate taxes
driven simply by the tax rate. Thus, our dependent variables implicitly control for this country-
level characteristic and are algebraically similar to Atwood et al. (2012).17
D. Definition of Control Variables
Consistent with prior studies in the tax avoidance literature (e.g. Gupta and Newberry,
1997; Mills et al., 1998; Rego, 2003; Dyreng et al,. 2008; Frank et al., 2009; Wilson, 2009; Chen
et al., 2010), we include an extensive list of additional variables in our models to control for
other factors that are associated with various types of tax avoidance. ROA is measured using pre-
tax income and captures the profitability of firms while LEV represents financial leverage.
Profitable firms and firms with greater leverage or complex financing arrangements have greater
incentives and opportunities, respectively, to avoid taxes. However, Graham and Tucker (2006)
find that leverage is negatively related to tax shelters suggesting that corporate tax avoidance and
leverage are substitutes.
The natural log of total assets (SIZE) controls for the influence of firm size while
FOROPS captures the presence of operations in foreign jurisdictions. Book-market ratio (BM)
17 Our SPREAD measures are algebraically identical to the proxy used in Atwood et al. (2012), at the annual level. Our exposition differs in that we illustrate each individual element as a tax rate.

[17]
controls for a firm’s growth opportunities. Although larger firms can have greater incentives to
tax plan (Rego, 2003), they can face higher political costs also (Zimmerman, 1983), and thus we
do not predict a direction of association between TAX_AVOIDANCE and SIZE. Firms taking
advantage of foreign tax rate differentials in their locations of their foreign operations (FOROPS)
as well as those firms with stable growth (i.e. higher BM) should avoid more tax on average.
Firms that perform poorly have fewer financial resources to allocate to their various
functions, often because their primary concern is to remain in business. Such firms will likely
allocate fewer resources to their tax function and have a rate closer to the prevailing statutory tax
rate while they attempt to return the business to profitability. Consistent with Bauer (2012), we
control for consecutive accounting losses (AGGR_LOSS) and constrained operating cash flow
resources (COCF).18
We include INTANG and R&D to control for intangible asset and R&D intensity. We
would expect that the more intensely a firm’s business model is driven by intangible assets,
which are easier to shift to low tax rate jurisdictions, the higher the level of tax avoidance. R&D
and PPE are also expected to lead to lower taxes relative to the statutory tax rate benchmark and
create a positive relation for SPREAD_INC and SPREAD_CF (a negative relation for
RATIO_INC and RATIO_CF) because these assets generate large tax deductions which decrease
the tax base in OECD countries. Finally, we control for financial reporting aggressiveness and
include the performance-adjusted discretionary accruals variable DAP in our models. Frank et al.
(2009) show that financial reporting aggressiveness and tax aggressiveness are positively related,
thus we expect DAP to be positively associated with tax avoidance. We provide more details on
variable construction in Appendices B and C.
18 Tax loss carryovers represent an additional control that would be appropriate in this setting. Tax losses can be used to reduce tax payments in subsequently profitable periods. However, such data is not separately identifiable in Datastream.

[18]
E. Descriptive statistics
Table 1 presents the various countries in our dataset and whether or not they have an
imputation system. Our sample is comprised of 14,389 firm-year observations from imputation
countries (27% of the sample). Twelve countries have an imputation system during our sample,
including Finland, France, Germany, Italy, Mexico, Norway and Spain, all of which eliminated
their imputation system during our sample period.19 Australia, Canada, Chile, New Zealand and
the United Kingdom have imputation systems throughout the sample period and no country
implemented an imputation system during our sample period.
Table 2, Panels A and B provide descriptive statistics for our sample of firm-years. As a
reference, Panel A reports statistics for the entire sample. Panel B compares the mean and
median values of our dependent and independent variables across imputation and non-imputation
countries. For all four of our dependent variables, the differences in mean and median values are
significant at the 1% level. Firms in non-imputation countries have a mean (median)
SPREAD_INC value of 0.031 (0.087) while firms in imputation countries have a mean (median)
SPREAD_INC value of 0.016 (0.062). Likewise, mean (median) SPREAD_CF values are higher
in non-imputation countries, 0.135 (0.187), than imputation countries, 0.085 (0.128). Higher
spreads in non-imputation countries are consistent with higher tax avoidance in those countries.
When we examine the ratios, we find the mean (median) RATIO_INC of 0.922 (0.768) in non-
imputation countries is lower than the mean (median) RATIO_INC of 0.957 (0.796) in
imputation countries. The differences in the mean and median values of RATIO_CF are also
significantly lower. Consistent with the conclusions from the spreads, lower ratios in non-
imputation countries also suggest higher corporate tax avoidance in those countries.
19 Table 1 reveals that certain countries are more strongly represented in our sample compared to others. As we report in section IV, choosing 50 observations randomly from each country and repeating our analysis using the randomly selected observations yields similar inferences.

[19]
Reviewing the independent variables in Panel B of Table 2, we see significant variation
in most of the mean and median values. Mean ROA and LEV values are lower in non-imputation
countries, suggesting less profitability and leverage on average in these countries. Firms tend to
be larger in non-imputation countries; however, there is no difference in the presence of foreign
operations (FOROPS) across shareholder dividend tax systems. Non-imputation countries also
have more stable growth, but resources (AGGR_LOSS and COCF) appear to be more constrained
in non-imputation countries. Imputation countries appear to use intangible assets and capital
assets more intensely than non-imputation countries, but the opposite is true of R&D.20 FOROPS
and DAP are not significantly different across the two tax systems. The significant differences in
most of these independent variables support the importance of controlling for these factors in our
empirical models.
IV. Results
A. Corporate tax avoidance following the elimination of an imputation system
We take advantage of the presence of several countries that eliminated their imputation
systems during our sample period in our first difference-in-differences analysis. We predict that
firms, which are residents of countries that eliminated their imputation systems, will have more
corporate tax avoidance after the elimination of the imputation system.21
Table 3 reports the results of the difference-in-differences estimation represented by
equation (1). The table contains four columns for each measure of TAX_AVOIDANCE used as
the dependent variable. In Models 1 and 2, when SPREAD_INC and SPREAD_CF are the
20 The difference in intangible assets could also be driven by differences in financial accounting standards across countries. 21 In sensitivity tests, we remove observations from Spain and Italy because these countries eliminated imputations systems and had a significant tax rate reduction after the elimination of the imputation system. Our results are robust to removing these observations.
[20]
dependent variables, the coefficients on IMP are negative and statistically significant at the 1%
level as predicted in the cross-section. In Models 3 and 4, when RATIO_INC and RATIO_CF are
the dependent variables, the coefficients on IMP are positive and statistically significant at the
1% level, as expected. These coefficients imply that the difference between the country’s
corporate statutory tax rate and the cash taxes paid by firms residing in that country is smaller on
average when the firm resides in a country with an imputation system. Thus, firms, which are
residents of countries with imputation systems, appear to avoid less tax than firms in countries
without an imputation system, consistent with our predictions. Across all four models, POST is
not statistically significant. More importantly for our research question, the coefficients on
IMP_POST represent our key variable of interest in the difference-in-differences design. Across
all four models, the coefficients are as predicted. More specifically, the coefficients on
IMP_POST are positive and statistically significant in Models 1 and 2 and negative and
statistically significant in Models 3 and 4 at 1% levels, as predicted. Therefore, the evidence
across the four models is consistent with corporate tax avoidance increasing in countries
following the elimination of their imputation system.
Our results suggest that the average spread between a country’s corporate statutory tax
rate and the firm’s tax rate is 2.8% to 5.8% lower in countries with imputations systems,
depending on the dependent variable. For those countries that eliminate their imputation
systems, the average spread increases 4.0% to 4.6%, completely eliminating the difference in
corporate tax avoidance in the pre-elimination period. The significance of the combined
coefficients on IMP, POST and IMP_POST is no longer significantly different from zero.
Similarly, the average ratio is 7.2% to 10.1% higher for firms from imputation countries

[21]
depending on the dependent variable, and the elimination of the imputation system removes the
positive differential.
Table 3 shows that the coefficients for SIZE, COCF, PPE, R&D and DAP are statistically
significant across Models 1 through 4 in the directions predicted. Therefore, we conclude that
robust evidence exists that corporate tax avoidance is associated with larger firms with more
capital and R&D intensity, lower cash flow constraints and larger discretionary accruals. The
conclusions drawn from the coefficients on ROA, LEV, AGGR_LOSS, BM, FOROPS and BM
depend on the model. The coefficients on ROA, LEV, AGGR_LOSS, and BM are in the
predicted direction and statistically significant in Model 1 and 3 only, while the coefficient on
FOROPS is in the predicted direction and statistically significant in Models 2 and 4 only. Given
the difference in the dependent variables in Model 1 (Model 3) as compared to Model 2 (Model
4) is the denominator, we conclude that using net income versus cash flow from operations
affects the interpretation of some of the firm-level independent variables but not the country-
level variables of interest. The coefficient on INTANG varies across all four models and is
significant and in the predicted direction in only Model 2.
A.1 Cross-section difference in corporate tax avoidance following the elimination of an
imputation system
Our illustration in Section II C demonstrates that the manager of a firm, which generates
earnings domestically and pays them out currently as dividends, has more incentive to engage in
corporate tax planning if the firm is located in a country with a classical system relative to an
imputation system. We examine this prediction in Table 3 by examining the effect of the
elimination of imputations systems on corporate tax avoidance. As an extension of this

[22]
difference-in-differences analysis, we consider the effect of relaxing the assumptions of 100%
dividend payout and 100% domestic earnings in the Section II illustration.
In these additional analyses, we assume that firms have optimal dividend payouts,
multinational operations and corporate tax avoidance before countries eliminate their imputation
systems. While the change from an imputation system to a classical system provides a shock to
firms that could affect dividend payouts, multinational operations and corporate tax avoidance,
we assume that changes in dividend payouts and multinational operations have higher costs that
limit the responses to the change relative to corporate tax avoidance. For example, firms that
reduce dividends in response to a country’s move to a classical system have to address signalling
costs, and firms that change operational locations have strategic, political and infrastructure
costs.
First, we relax the 100% dividend payout assumption. In imputation countries, firms with
high dividend payouts distribute more of their accumulated imputation credits to their
shareholders compared to low dividend payout firms. Therefore, a shift from an imputation
system to a classical system creates more immediate incentives to avoid corporate taxes for high
dividend payout firms. The more immediate incentives for high dividend payout firms arise
because firms with low dividend payouts are more likely to have retained earnings associated
with undistributed imputation credits after a shift to a classical system. Assuming countries that
eliminate their imputation system provide transitional rules similar to Germany, low dividend
payout firms will be able to use the undistributed imputation credits to mitigate the impact of
double taxation resulting from the change to a classical system. The undistributed imputation
credits reduce the immediate need for corporate tax avoidance relative to high dividend payout
firms in countries that eliminate their imputation system.
[23]
To test this prediction, we split our sample into low and high dividend payout firms and
estimate separate regressions of equation (1) on each subsample. Firms that do not pay dividends
are considered to be low dividend payout firms while firms that pay any dividends are
considered high dividend payout firms. We expect that high dividend payout firms will have the
most dramatic increase in tax avoidance after the elimination of the imputations system because
they have fewer remaining imputation credits available to offset double taxation under the new
classical system. For brevity, we present the results with respect to SPREAD_INC only.
As reported in Table 4 Panel A, we find that high dividend payout firms in countries that
eliminate an imputation system have higher levels of tax avoidance after the change. More
specifically, the coefficient on IMP_POST is positive and statistically significant for high
dividend payout firms. In our low dividend payout subsample, we generally do not find a
statistically significant association between the change in tax system and corporate tax
avoidance. Using a non-parametric Monte-Carlo simulation test of IMP_POST coefficients, we
find the difference across the subsamples is significant at the 1% level. Such findings are
consistent with our expectations.
Second, our illustration in Section II C demonstrates that the shareholder of a firm in an
imputation country receives a higher after-tax dividend relative to a classical country. This
analysis assumes that the operations of the firm earn income domestically. However as firms
invest abroad for non-tax reasons, imputation and classical countries provide more equivalent
incentives to tax plan because foreign corporate taxes do not generate imputation credits. Thus, a
country with an imputation system for domestic earnings is in essence a classical system for
foreign earnings. Therefore, the more a firm’s earnings are foreign-sourced, the less impact a
change from an imputation system to a classical system will have on the incentives for tax

[24]
planning. To examine this prediction, we examine the association between corporate tax
avoidance and the elimination of imputation systems for firms based on multinational operations.
Again, we split our sample into two respective groups and estimate separate regressions
of equation (1) on each subsample. The first subsample consists of firms with no foreign assets.
Firms that have any foreign assets are considered to be relatively more multinational. For
brevity, we present the results with respect to SPREAD_INC only.
In Table 4 Panel B, our low and high multinational subsamples have a significant
coefficient on IMP_POST. However, the coefficient for the domestic subsample is significantly
larger than the coefficient for the multinational subsample at the 5% level. We conclude that
firms with domestic operations have the greatest increase of corporate tax avoidance after the
elimination of the country’s imputation system, consistent with expectations.
B. Corporate tax avoidance following an increase in imputation benefits in Australia
Through equation (2) we implement the second difference-in-differences model to
examine the implementation of enhanced imputation credits for Australian firms. We expect to
see a decrease in tax avoidance for firms incorporated in Australia beginning in 2003 after a
2002 change in legislation, relative to firms from other countries during the same period. Table 5
reports the results. Of particular interest, AUS_POST03 is negative and statistically significant,
which is consistent with our prediction. Australian firms appear to have decreased the spread
between the corporate statutory tax rate and the firm’s tax rate by 35% beginning in 2003
following the legislative changes in 2002. This evidence suggests that implementing an
imputation system could provide incentives to reduce corporate tax avoidance despite the prior
use of tax planning structures. The negative coefficient on IMP_YR is consistent with less tax
avoidance by firms residing in other imputation countries.
[25]
C. Additional tests
C.1Cross-sectional: Partial and full imputation systems
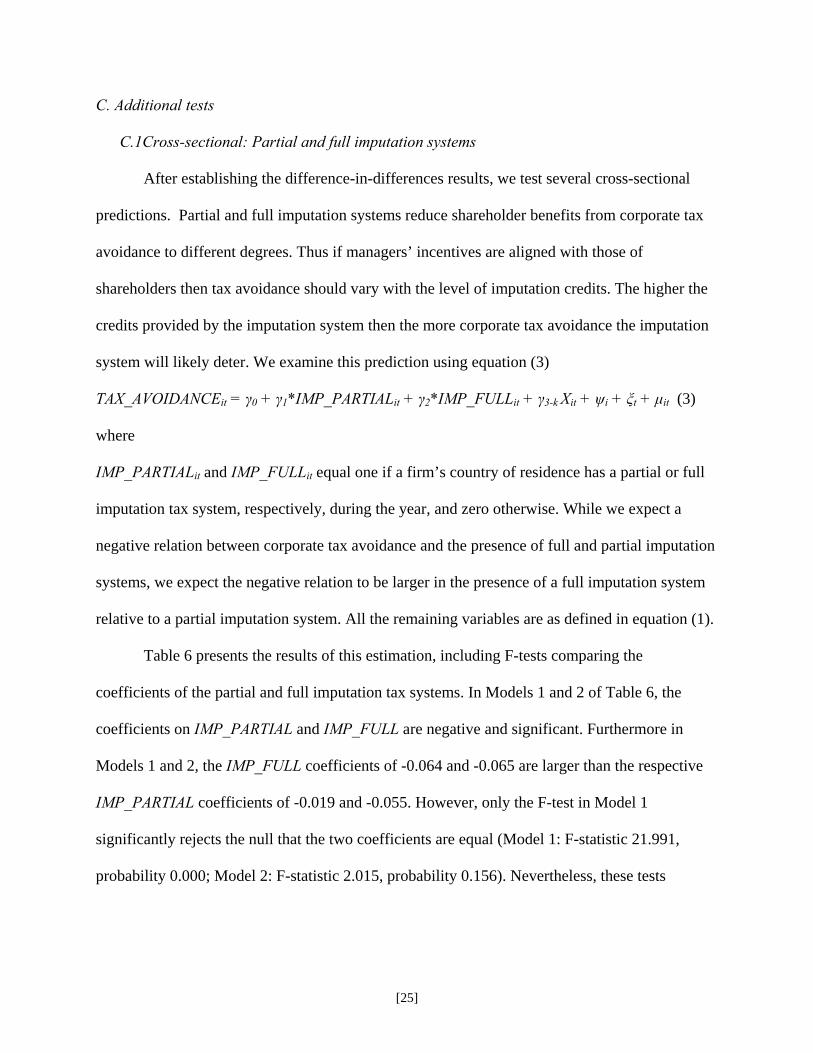
After establishing the difference-in-differences results, we test several cross-sectional
predictions. Partial and full imputation systems reduce shareholder benefits from corporate tax
avoidance to different degrees. Thus if managers’ incentives are aligned with those of
shareholders then tax avoidance should vary with the level of imputation credits. The higher the
credits provided by the imputation system then the more corporate tax avoidance the imputation
system will likely deter. We examine this prediction using equation (3)
TAX_AVOIDANCEit = γ0 + γ1*IMP_PARTIALit + γ2*IMP_FULLit + γ3-k Xit + ψi + ξt + μit (3)
where
IMP_PARTIALit and IMP_FULLit equal one if a firm’s country of residence has a partial or full
imputation tax system, respectively, during the year, and zero otherwise. While we expect a
negative relation between corporate tax avoidance and the presence of full and partial imputation
systems, we expect the negative relation to be larger in the presence of a full imputation system
relative to a partial imputation system. All the remaining variables are as defined in equation (1).
Table 6 presents the results of this estimation, including F-tests comparing the
coefficients of the partial and full imputation tax systems. In Models 1 and 2 of Table 6, the
coefficients on IMP_PARTIAL and IMP_FULL are negative and significant. Furthermore in
Models 1 and 2, the IMP_FULL coefficients of -0.064 and -0.065 are larger than the respective
IMP_PARTIAL coefficients of -0.019 and -0.055. However, only the F-test in Model 1
significantly rejects the null that the two coefficients are equal (Model 1: F-statistic 21.991,
probability 0.000; Model 2: F-statistic 2.015, probability 0.156). Nevertheless, these tests

[26]
provide some evidence that the higher the level of imputation within a country, the less tax firms
avoid.
Models 3 and 4 of Table 6 provide similar evidence. The coefficients on IMP_PARTIAL
and IMP_FULL are positive and statistically significant. Furthermore, like Models 1 and 2, the
coefficients of IMP_FULL (0.178 and 0.115, respectively) are larger than the coefficients of
IMP_PARTIAL (0.045 and 0.097, respectively) in Models 3 and 4. The F-statistic of 18.142
(probability 0.000) rejects the null for Model 3, but the F-statistic of 0.697 (probability 0.404)
does not reject the null for Model 4. Overall, our expectations about the relation between tax
avoidance and the type of imputation system are supported, regardless of whether the dependent
measure is a spread or a ratio. This evidence also provides support that tax avoidance on average
is lowest in full imputation countries.
C.2 Cross-sectional analysis: Closely-held shares
We also consider the differential effect that the proportion of closely-held shares of a firm
has on corporate tax avoidance depending on the country’s shareholder dividend tax policy.
Firms that are closely-held by shareholders have better alignment between managers and
shareholders; therefore, we expect that firms in imputation (classical) countries with a higher
proportion of closely-held shares will have lower (higher) levels of tax avoidance. We consider
firms that have an above-median proportion of closely-held shares to have relatively more
alignment between managers and shareholders. CLSHLD is equal to one if firms have an above-
median proportion of closely-held shares, 0 otherwise. IMP_CLHD is the interaction variable
between IMP_YR and CLSHLD, which represents closely-held firms in imputation countries.
Table 7 presents evidence consistent with our expectations. The coefficients on
IMP_CLSHD are negative (positive) and significant at conventional levels in Models 1 and 2 (3

[27]
and 4) with our SPREAD (RATIO) measures. This evidence is consistent with closely-held firms
that reside in imputation countries engaging in less tax avoidance than other firms in imputation
countries. In contrast, the coefficients on CHSLD are positive (negative) and significant at
conventional levels in Models 1 and 2 (3 and 4) with our SPREAD (RATIO) measures. This
evidence is consistent with closely-held firms that reside in classical countries engaging in more
tax avoidance than other firms in classical countries. Combining these results, we conclude that
stronger manager-shareholder alignment accentuates the corporate tax avoidance incentives
created by a country’s shareholder dividend policy.
C.3 Inclusion of additional control variables
Our models control for two country-level factors examined by Atwood et al. (2012) by
estimating DAP at the year-industry-country level and by benchmarking our dependent variables
against country-level statutory tax rates. However, to examine the sensitivity of our results to
additional country-level control variables that may influence our inferences, we include an
extensive set of variables that are included in prior literature, specifically Atwood et al. (2012).
We do not include these variables in our main tests because doing so significantly reduces the
number of countries in our sample and thus reduces the generalizability of our results. We also
include CHG_CSTR as an additional control to further mitigate concerns regarding bias in our
results from changes in corporate statutory tax rates during our sample period. As discussed
below, inclusion of these variables does not change any of our inferences.
In addition to CHG_CSTR, the results in Table 8 include the variables BTAXC (country-
level book-tax conformity), WW (worldwide tax system), TAXENF (tax enforcement index),
COMLAW (common law legal system), INVRIGHTS (investor rights index), OWNCON
(ownership concentration index), POPGRT (population growth) and GDP (index in constant

[28]
$2005). While these variables are generally statistically significant and have the expected signs,
our main variables of interest also remain statistically significant and have the expected signs.
Specifically, Table 8 replicates the analysis of Table 3, and we continue to find that the
interaction variable IMP_POST is associated with less tax avoidance. In summary, increasing the
internal validity of our results relative to their external validity yields consistent evidence.
C.4 Long-run cash ETR
Our main analyses use firm-year Cash ETRs in the construction of the SPREAD_INC,
SPREAD_CF, RATIO_INC and RATIO_CF measures, which are noisy approximations of tax
avoidance. However, we use them to preserve the size of the rich international sample of firm-
years. To address the measurement error in firm-year Cash ETRs, Dyreng et al. (2008) use five-
year averages. Therefore, we also conduct our cross-sectional analysis using long-run Cash ETR,
which we calculate as the five-year average Cash ETR subsequently subtracted from or divided
by the respective five-year average corporate statutory tax rate in each country. We also
construct five-year averages for all of our independent variables. In this analysis, our sample size
is reduced from 52,895 observations to as few as 18,355 observations, but the untabulated results
are consistent with the main findings in Table 6.
C.5 Effective tax rate (ETR)
Given our international setting, it is difficult to identify tax avoidance measures that can
be consistently estimated across countries. One reason is that the financial statement data
reported for our global sample in Datastream is not as readily available as it is for U.S.
companies reported in Compustat. Therefore, the calculation of common measures of tax
avoidance, such as book-tax differences, requires several variables to be ignored in their
estimation or the observations must be dropped from the analysis.

[29]
The data to calculate effective tax rates (ETR) is readily available, but the differences in
accounting standards across countries create inconsistencies in reported tax expense, limiting the
suitability of ETRs. However, to be complete we replicate our analysis in Tables 3 using ETR in
place of Cash ETR. In untabulated tests, we find that our results hold in general. The coefficients
of -0.008 for IMP and 0.032 for IMP_POST are statistically significant (at the 5% level or above)
with a SPREAD tax avoidance variable while the coefficient of -0.077 for IMP_POST is
statistically significant (at the 1% level) when we use a RATIO variable.
C.6 Additional country-level influences
All of our empirical models include year and industry fixed effects, and the estimation of
these models relies on standard errors clustered by firm. Our empirical models do not include
country fixed effects. Inclusion of these fixed effects would subsume the influence of country-
level imputation systems that we are interested in. Our imputation variables are generally static
and resemble fixed effects by construction, except for the relatively small subset of countries that
change their tax system. Estimation of a model that includes country-level fixed effects
effectively removes the influence of countries with imputation systems that never change. Thus,
IMP_YR becomes a variable which captures only the influence of countries that change
imputation systems. Consistent with our analysis in Section IV C, untabulated analysis shows
that positive and significant coefficients for IMP_YR are estimated when country-level fixed
effects are included in Models 1 and 2. These coefficients reflect that firms in countries that
eliminate imputation avoid more tax on average than firms that do not change tax systems.
In addition, to mitigate concerns that our results stem from an imbalance between the
numbers of observations within each country, we replicate our main findings with a randomly-
selected set of 50 firms (at maximum) from each country. Our untabulated results are consistent

[30]
with our primary difference-in-differences analysis. On average, firms from imputation countries
demonstrate lower levels of tax avoidance but then demonstrate higher levels of tax avoidance
following the elimination of imputation. For example, with SPREAD_INC (RATIO_INC) as the
dependent variable, IMP is negative (positive) at the 1% (5%) level and IMP_POST is positive
(negative) at the 1% (1%) level.
Finally, we conduct one additional sensitivity analysis to ensure that our difference-in-
differences evidence is not the result of other unobserved changes during our sample period. We
restrict our sample to firm-year observations that occur during the window from t-2 to t+2,
where t is either the year a country changes its imputation system or the randomly-determined
year for countries that never change their tax system. Again, the untabulated results are
consistent with our primary difference-in-differences analysis. For example, with SPREAD_INC
as the dependent variable, IMP is negative and IMP_POST is positive (both significant at the 1%
level).
V. Conclusions
This study adds to the debate and growing empirical research on managers’ incentives to
engage in corporate tax avoidance. Managers could engage in corporate tax avoidance to benefit
the firm’s shareholders or to divert rents for their own benefits. Imputation systems remove the
shareholders’ incentive for corporate tax avoidance without affecting managers’ private benefits.
Our findings provide evidence consistent with shareholders’ incentives driving managers to
avoid corporate taxes. Firms, which reside in countries with an imputation system, where the
shareholders do not have the incentive to avoid corporate tax, have less corporate tax avoidance.
This differential in corporate tax avoidance between imputation and classical tax systems is

[31]
accentuated in closely-held companies where the manager-shareholder alignment is stronger.
Furthermore, our evidence suggests that firms in countries that switch from an imputation to
classical system experience an increase in corporate tax avoidance – potentially an unintended
consequence of the rulings made by the ECJ to encourage tax harmonization among its members.
Our finding of a decrease in tax avoidance in Australia following the increased availability of
imputation credits to shareholders implies that tax avoidance could decrease as a result of the
implementation of an imputation system.
Our study is the first to provide evidence that shareholder dividend tax policy, which has
been the focus of extensive research for its effects on firm value and investment, significantly
relates to corporate-level tax planning. While the results suggest benefits to an imputation system
and have important policy implications, more research is needed to consider the trade-offs with
other consequences of implementing an imputation system. We leave for future research the
potential effect of this reduction of corporate tax avoidance on firm value.

[32]
Appendix A Imputation Tax Policy vs. Classical Tax Policy: Illustrative Examples
For purposes of the following illustrative examples, we assume that two identical “all equity” firms exist in two different countries. One operates under a classical system of dividend taxation and one operates under an imputation system of dividend taxation. Both countries have a corporate tax rate of 30% and the shareholder of each firm faces a dividend tax rate of 50%. Annually, each firm earns $100 in pre-tax income, pays all taxes in cash and fully distributes any after-tax income as dividends. In Panel A, we assume that neither firm engages in a tax avoidance/minimization strategy. In Panel B, we extend the example and assume that a tax minimization strategy exists that both firms purchase. A tax promoter will sell the strategy at a cost of $10 and the strategy will generate a tax deduction on pre-tax income of $90. Panel A: The Baseline Case Corporate Level Imputation Classical Pre-tax corporate-level income (before tax planning) 100 100 Less: Tax planning cost 0 0 Pre-tax corporate-level income 100 100 Less: Company tax (see tax return) 30 30 After-tax income 70 70
Corporate Tax Return Pre-tax corporate-level income 100 100 Less: Tax deduction bought 0 0 Taxable income 100 100 Company tax 30% 30 30
Individual/Shareholder Level Dividend received by individual 70 70 Gross-up for corporate tax 30 - Individual taxable income 100 70 Individual tax before credit 50% 50 35 Less: Imputation credit 30 - Net shareholder-level tax 20 35 Total tax: corporate and shareholder 50 65 Net shareholder income after-tax 50 35
Comparison Corporate tax rate paid 30% 30% Statutory rate 30% 30% Corporate tax minimization 0% 0%

[33]
Appendix A – continued Panel B: The Tax Minimization Strategy Case Corporate Level Imputation Classical Pre-tax corporate-level income (before tax planning) 100 100 Less: Tax planning cost 10 10 Pre-tax corporate-level income 90 90 Less: Company tax (see tax return) 0 0 After-tax income 90 90
Corporate Tax Return Pre-tax corporate-level income 90 90 Less: Tax deduction bought 90 90 Taxable income 0 0 Company tax 30% 0 0
Individual/Shareholder Level Dividend received by individual 90 90 Gross-up for corporate tax 0 - Individual taxable income 90 90 Individual tax before credit 50% 45 45 Less: Imputation credit 0 - Net shareholder-level tax 45 45 Total tax: corporate and shareholder 45 45 Net shareholder income after-tax 45 45
Comparison Corporate tax rate paid 0% 0% Statutory rate 30% 30% Corporate tax minimization 30% 30% Net income available to shareholder: Baseline 50 35 Net income available to shareholder: Tax strategy 45 45 Net benefit to shareholder: tax strategy vs. no tax strategy -5 10

[34]
Appendix B Definition of Variables
Tax Avoidance Description and/or Data Details and Source SPREAD_INC
CSTRjt - CASH_ETR_INCijt
Annual tax avoidance spread, calculated as the corporate statutory tax rate in country j less the annual income-based Cash ETR value for firm i in country j.
SPREAD_CF
CSTRjt - CASH_ETR_CFijt
Annual tax avoidance spread, calculated as the corporate statutory tax rate in country j less the annual cash flow-based Cash ETR value for firm i in country j.
RATIO_INC
CASH_ETR_INCijt / CSTRjt Annual tax avoidance ratio, calculated as the annual income-based Cash ETR value for firm i in country j divided by the corporate statutory tax rate in country j.
RATIO_CF
CASH_ETR_CFijt / CSTRjt Annual tax avoidance ratio, calculated as the annual cash flow-based Cash ETR value for firm i in country j divided by the corporate statutory tax rate in country j.
CASH_ETR_INC TXPDijt / (PINCijt – DOPSCFijt – XITEMSijt)
Annual Cash ETR, calculated as taxes paid (WC04150) divided by [pre-tax income (WC01401) less discontinued operations (WC04054) & extraordinary items (WC04225)]. Set to missing if denominator <= 0. Source: Datastream (DS) / Worldscope (WC)
CASH_ETR_CF TXPDijt / (NCFOijt + TXPDijt) Alternative annual Cash ETR, calculated as taxes paid divided by [net cash flow from operations (WC04860) plus taxes paid]. Set to missing if denominator <= 0. Source: Datastream (DS) / Worldscope (WC)
CSTR Corporate statutory tax rate Collected as reported by source. Source: OECD and hand collection
Tax System Description and/or Data Details and Source IMP Indicator variable for a country
that has ever had an imputation system
Equal to 1 if country j has ever had an imputation system at any time during the sample period, 0 otherwise. Source: OECD and hand collection
POST Indicator variable for the period after an actual or “induced” elimination of an imputation system
Equal to 1 if year t is after or includes the year country j eliminates its imputation system or if year t is after or includes the randomly selected year for all countries that never change their imputation system, 0 otherwise. Source: OECD and hand collection
IMP_POST Interaction variable: Countries that eliminate imputation* POST
Equal to 1 if year t is after or includes the year country j changes its imputation system, 0 otherwise. Source: OECD and hand collection
AUS Indicator variable for Australia
Equal to 1 if country j is Australia, 0 otherwise. Source: OECD and hand collection
POST03 Indicator variable for the period after and including 2003
Equal to 1 if year t is after or includes 2003, which corresponds to the inclusion of an additional imputation credit for public companies in Australia, 0 otherwise. Source: OECD and hand collection
[35]
AUS_POST03 Interaction variable: AUS * POST03
Equal to 1 if country j is Australia and year t is after or includes 2003, 0 otherwise. Source: OECD and hand collection
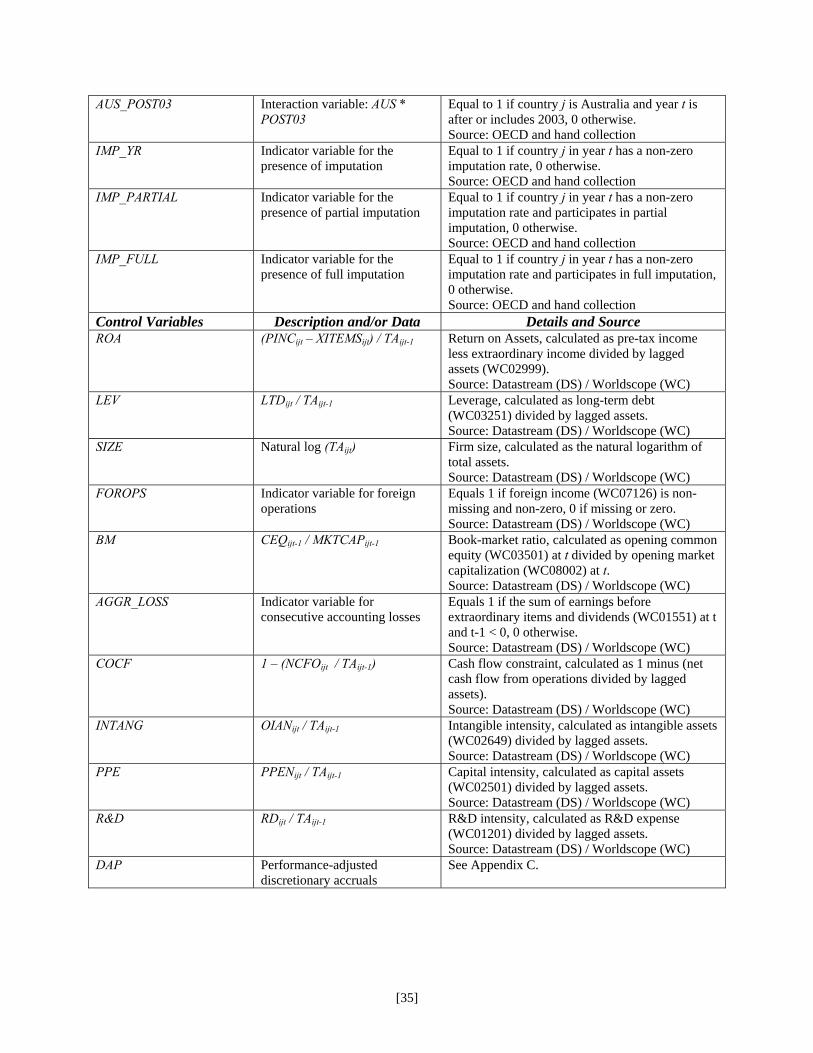
IMP_YR Indicator variable for the presence of imputation
Equal to 1 if country j in year t has a non-zero imputation rate, 0 otherwise. Source: OECD and hand collection
IMP_PARTIAL Indicator variable for the presence of partial imputation
Equal to 1 if country j in year t has a non-zero imputation rate and participates in partial imputation, 0 otherwise. Source: OECD and hand collection
IMP_FULL Indicator variable for the presence of full imputation
Equal to 1 if country j in year t has a non-zero imputation rate and participates in full imputation, 0 otherwise. Source: OECD and hand collection
Control Variables Description and/or Data Details and Source ROA (PINCijt – XITEMSijt) / TAijt-1 Return on Assets, calculated as pre-tax income
less extraordinary income divided by lagged assets (WC02999). Source: Datastream (DS) / Worldscope (WC)
LEV LTDijt / TAijt-1 Leverage, calculated as long-term debt (WC03251) divided by lagged assets. Source: Datastream (DS) / Worldscope (WC)
SIZE Natural log (TAijt) Firm size, calculated as the natural logarithm of total assets. Source: Datastream (DS) / Worldscope (WC)
FOROPS Indicator variable for foreign operations
Equals 1 if foreign income (WC07126) is non-missing and non-zero, 0 if missing or zero. Source: Datastream (DS) / Worldscope (WC)
BM CEQijt-1 / MKTCAPijt-1 Book-market ratio, calculated as opening common equity (WC03501) at t divided by opening market capitalization (WC08002) at t. Source: Datastream (DS) / Worldscope (WC)
AGGR_LOSS Indicator variable for consecutive accounting losses
Equals 1 if the sum of earnings before extraordinary items and dividends (WC01551) at t and t-1 < 0, 0 otherwise. Source: Datastream (DS) / Worldscope (WC)
COCF 1 – (NCFOijt / TAijt-1) Cash flow constraint, calculated as 1 minus (net cash flow from operations divided by lagged assets). Source: Datastream (DS) / Worldscope (WC)
INTANG OIANijt / TAijt-1 Intangible intensity, calculated as intangible assets (WC02649) divided by lagged assets. Source: Datastream (DS) / Worldscope (WC)
PPE PPENijt / TAijt-1 Capital intensity, calculated as capital assets (WC02501) divided by lagged assets. Source: Datastream (DS) / Worldscope (WC)
R&D RDijt / TAijt-1 R&D intensity, calculated as R&D expense (WC01201) divided by lagged assets. Source: Datastream (DS) / Worldscope (WC)
DAP Performance-adjusted discretionary accruals
See Appendix C.
[36]
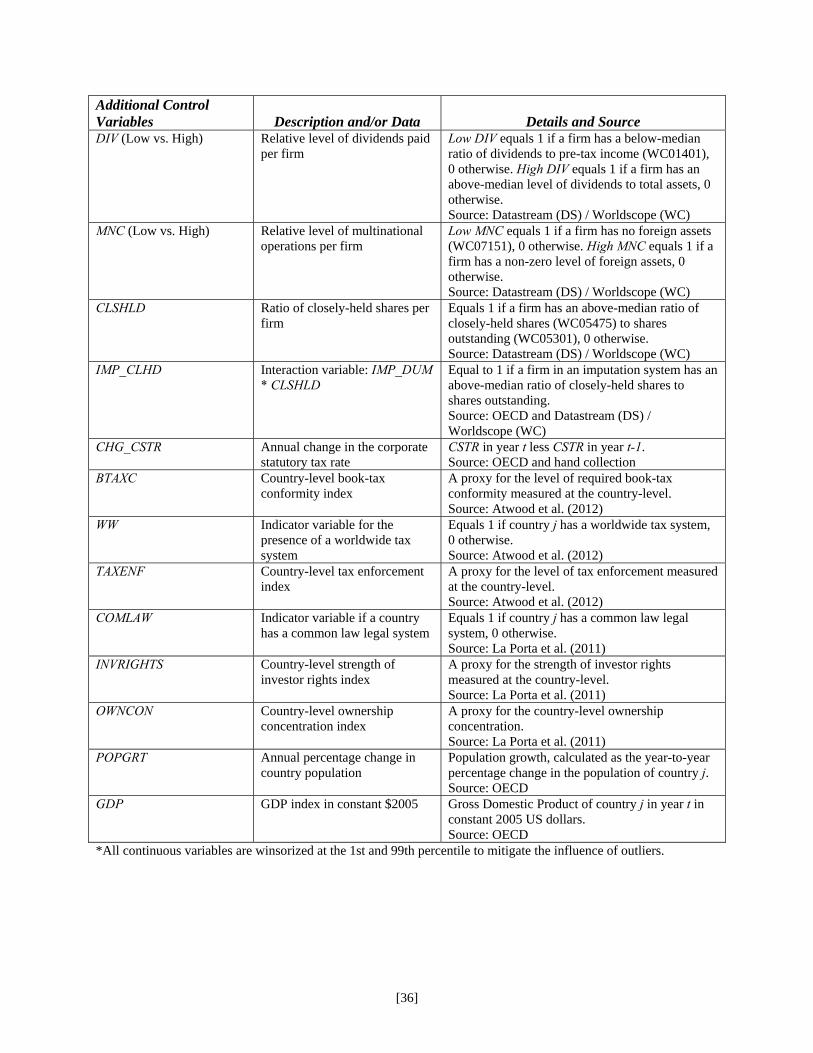
Additional Control Variables Description and/or Data Details and Source DIV (Low vs. High) Relative level of dividends paid
per firm Low DIV equals 1 if a firm has a below-median ratio of dividends to pre-tax income (WC01401), 0 otherwise. High DIV equals 1 if a firm has an above-median level of dividends to total assets, 0 otherwise. Source: Datastream (DS) / Worldscope (WC)
MNC (Low vs. High) Relative level of multinational operations per firm
Low MNC equals 1 if a firm has no foreign assets (WC07151), 0 otherwise. High MNC equals 1 if a firm has a non-zero level of foreign assets, 0 otherwise. Source: Datastream (DS) / Worldscope (WC)
CLSHLD Ratio of closely-held shares per firm
Equals 1 if a firm has an above-median ratio of closely-held shares (WC05475) to shares outstanding (WC05301), 0 otherwise. Source: Datastream (DS) / Worldscope (WC)
IMP_CLHD Interaction variable: IMP_DUM * CLSHLD
Equal to 1 if a firm in an imputation system has an above-median ratio of closely-held shares to shares outstanding. Source: OECD and Datastream (DS) / Worldscope (WC)
CHG_CSTR Annual change in the corporate statutory tax rate
CSTR in year t less CSTR in year t-1. Source: OECD and hand collection
BTAXC Country-level book-tax conformity index
A proxy for the level of required book-tax conformity measured at the country-level. Source: Atwood et al. (2012)
WW Indicator variable for the presence of a worldwide tax system
Equals 1 if country j has a worldwide tax system, 0 otherwise. Source: Atwood et al. (2012)
TAXENF Country-level tax enforcement index
A proxy for the level of tax enforcement measured at the country-level. Source: Atwood et al. (2012)
COMLAW Indicator variable if a country has a common law legal system
Equals 1 if country j has a common law legal system, 0 otherwise. Source: La Porta et al. (2011)
INVRIGHTS Country-level strength of investor rights index
A proxy for the strength of investor rights measured at the country-level. Source: La Porta et al. (2011)
OWNCON Country-level ownership concentration index
A proxy for the country-level ownership concentration. Source: La Porta et al. (2011)
POPGRT Annual percentage change in country population
Population growth, calculated as the year-to-year percentage change in the population of country j. Source: OECD
GDP GDP index in constant $2005 Gross Domestic Product of country j in year t in constant 2005 US dollars. Source: OECD
*All continuous variables are winsorized at the 1st and 99th percentile to mitigate the influence of outliers.

[37]
Appendix C Performance-Adjusted Discretionary Accruals
We calculate the independent variable DAP as the performance-adjusted discretionary accruals measure of financial reporting aggressiveness consistent with Kothari et al. (2005) and Frank et al. (2009). This measure requires calculation of discretionary accruals, which we base on the modified-Jones model (Dechow et al. 1995). First, we estimate total accruals (TACC) using the following model by two-digit ICB code (from Worldscope), fiscal year and country, where all variables (including the intercept) are scaled by lagged total assets.
TACCijt = β0 + β1(ΔREVijt – ΔARijt) + β2PPEijt + μijt (C.1)
Where: TACCijt = [NICFijt + TXijt – (NCFOijt + TXPDijt – DOPSCFijt – XITEMSijt)]; NICFijt = income before extraordinary items from the statement of cash flows (WC04001) for firm i of country j in year t; TXijt = total tax expense (WC01451) for firm i of country j in year t; NCFOijt = net cash flows from operations as detailed in Appendix B; TXPDijt = taxes paid as detailed in Appendix B; DOPSCFijt = discontinued operations from the cash flow statements as detailed in Appendix B; XITEMSijt = extraordinary items from the statement of cash flows as detailed in Appendix B; ΔREVijt = sales (WC01001) of firm i of country j in year t less its sales in year t-1; ΔARit = total receivables (WC02051) of firm i of country j in year t less its total receivables in year t-1; PPEit = capital assets as detailed in Appendix B; μit = the unadjusted discretionary accruals measure of firm i in year t, a residual value. Second, after estimating the discretionary accruals residual μ from Equation (C.1) we rank ROA by industry-year-country put them into ROA deciles and determine the median discretionary accrual value. Individual values of μ are set to missing if less than 10 observations exist for a particular industry-year-country decile. We then subtract the median industry-year-country-ROA_decile discretionary accrual value from each observation’s residual value to get the performance-adjusted discretionary accrual measure DAP. We adjust the median values of each industry-year-country-ROA_decile group such that no median value is calculated while including the specific observation for which we are estimating DAP. Overall, DAP is an annual value calculated for each firm-year-country observation in our sample (where data is available). DAP is winsorized after estimation at the 1st and 99th percentile to mitigate any undue influence of outlier observations.

[38]
References
Amiram, D. and M.M. Frank. 2012. “The Effects of the Taxation of Dividends on the Allocation of
Foreign Portfolio Investment around the World.” Working paper, Columbia University.
Armstrong, C., J. Blouin, and D. Larcker. 2012. “The Incentives for Tax Planning”. Journal of
Accounting and Economics. 53(1–2): 391.
Atwood, T., M. Drake, J. Myers and L. Myers. 2012. “Home Country Tax System Characteristics and
Corporate Tax Avoidance: International Evidence.” The Accounting Review. 87 (6): 1831
Avi-Yonah, R. S. 2000. “Globalization, Tax Competition and the Fiscal Crisis of the Welfare State.”
Harvard Law Review 113 (7): 1573.
Babcock, J. 2000. “The Effects of Imputation Systems on Multinational Investment, Financing, and
Income-Shifting Strategies.” Journal of the American Taxation Association 22(2): 1.
Bauer, A. 2012. “Are Internal Control Weaknesses a Signal of Tax Avoidance?” Working paper,
University of Illinois.
Chen, S., X. Chen, Q. Cheng and T. Shevlin. 2010. "Are family firms more tax aggressive than non-
family firms?" Journal of Financial Economics 95(1):41.
Citizens for Tax Justice. 2011. "Corporate Taxpayers and Corporate Tax Dodgers 2008-2010".
Crocker and Slemrod 2005. “Corporate tax evasion with agency costs” Journal of Public Economics
89(9): 1593-1610
Dechow, P. M., R. G. Sloan and A. P. Sweeney. 1995. “Detecting earnings management.” The
Accounting Review 70(2):193.
Desai, M.A. and D. Dharmapala. 2006. “Corporate tax avoidance and high-powered incentives.” Journal
of Financial Economics 79(1): 145.
Dittmer, P., “U.S. Corporations Suffer High Effective Tax Rates by International Standards” The Tax Foundation (September 2011).
Drucker, J. “Google 2.4% Rate Shows How $60 Billion Lost to Tax Loopholes” Bloomberg

[39]
Dyreng, S., M. Hanlon and E. Maydew. 2008. "Long-Run Corporate Tax Avoidance." The Accounting
Review 83(1):61.
Dyreng, S., M. Hanlon and E. Maydew. 2010. “The Effects of Executives on Corporate Tax Avoidance.”
The Accounting Review 85(4): 1163.
Frank, M., L. Lynch and S. Rego. 2009. "Tax Reporting Aggressiveness and Its Relation to Aggressive
Financial Reporting." The Accounting Review 84(2):467.
Frank, M., L. Lynch., R, Zhao, and S. Rego. 2011. "Are Aggressive Reporting Practices Indicative of an
Aggressive Corporate Culture?” Working paper, Indiana University.
Graetz, M. and A. Warren. 2006. “Income Tax Discrimination and the Political and Economic Integration of Europe.” Yale Law Journal 115 (April): 1186
Graham, J. and A. Tucker, 2006, “Tax shelters and corporate debt policy” Journal of Financial
Economics 81 (3): 563–594.
Gupta, S. and K. Newberry. 1997. "Determinants of the variability in corporate effective tax rates:
Evidence from longitudinal data." Journal of Accounting and Public Policy 16(1):1.
Hanlon Mills and Slemrod 2005. “An empirical examination of corporate tax noncompliance”. Working
Paper University of Michigan
Jugurnath, B., M. Stewart and R. Brooks. 2008. “Dividend taxation and corporate investment: a
comparative study between the classical system and imputation system of dividend taxation in the
United States and Australia.” Review of Quantitative Finance and Accounting 31(2): 209.
Kim, J., Y. Li, and L. Zhang. 2011, “Corporate Tax Avoidance and Stock Price Crash Risk: Firm-Level
Analysis.” Journal of Financial Economics 100: 639.
Kocieniewski. D., “Biggest Public Firms Paid Little in U.S. Tax Study Says”. The New York Times
(November 3, 2011)
Kothari, S. P., A. J. Leone and C. E. Wasley. 2005. “Performance matched discretionary accrual
measures.” Journal of Accounting & Economics 39(1):163.

[40]
McIntyre, R., M. Gardner, R. Wilkins, and R. Phillips. “Corporate Taxpayers & Corporate Tax Dodgers
2008-2010” The Citizens for Tax Justice and the Institute for Taxation and Economic Policy
(November 2011)
Mills, L., M. Erickson and E. Maydew. 1998. "Investments in tax planning." The Journal of the American
Taxation Association 20(1):1.
Nocera, J., “Who Could Blame G.E.?” The New York Times (April 4, 2011)
Rego, S. 2003. "Tax-Avoidance Activities of U.S. Multinational Corporations." Contemporary
Accounting Research 20(4):805.
Rego, S. and R.J. Wilson. 2012. “Equity Risk Incentives and Corporate Tax Aggressiveness.” Journal of
Accounting Research 50(3): 775
Wilkinson, B. R., S.F. Cahan and G. Jones. 2001. “Strategies and dividend imputation: the effect of
foreign and domestic ownership on average effective tax rates.” Journal of International Accounting,
Auditing and Taxation 10(2): 157.
Wilson, R. 2009. "An Examination of Corporate Tax Shelter Participants." The Accounting Review 84(3):
969.

[41]
Table 1 Country Composition by Imputation System
The table presents the 52,895 firm-year observations used in the analyses by country and presence of an imputation tax system. Observations span the years 1994 through 2008 and are limited to the OECD countries for which tax data is available.
IMPUTATION FIRM-YEARS COUNTRY NO YES TOTAL FIRM-YEARS Australia 0 2,393 2,393 Austria 54 0 54 Belgium 46 0 46 Canada 0 2,225 2,225 Chile 0 169 169 Czech Republic 4 0 4 Denmark 268 0 268 Finland 161 194 355 France 822 24 846 Germany 977 63 1,040 Greece 137 0 137 Ireland 9 0 9 Israel 53 0 53 Italy 223 10 233 Japan 11,059 0 11,059 Korea (South) 2 0 2 Mexico 14 2 16 Netherlands 265 0 265 New Zealand 0 27 27 Norway 78 150 228 Poland 27 0 27 Portugal 22 0 22 Spain 10 4 14 Sweden 861 0 861 Switzerland 925 0 925 Turkey 158 0 158 United Kingdom 0 9,128 9,128 United States 22,331 0 22,331 TOTAL 38,506 14,389 52,895

[42]
Table 2 Descriptive Statistics
The table presents descriptive statistics for the 52,895 firm-year observations from year 1994 through 2008 used in the analyses. Panel A reports the descriptive statistics for the entire pooled sample. Panel B compares the mean and median values for firm-years with and without an imputation tax system. The last two columns in Panel B report the two-sided p-values for the difference between the mean and medians of the two groups, respectively. T-tests are used to test the difference in means and Wilcoxon rank tests, with continuity correction, are used to test the difference in medians. See Appendix B for detailed variable definitions. Panel A: Full Sample
N = 52,895
Mean Median Std Dev Min Max
Dependent Variables Tax Avoidance Spreads SPREAD_INC 0.027 0.080 0.415 -3.046 0.676SPREAD_CF 0.121 0.170 0.313 -2.302 0.625Tax Avoidance Ratios RATIO_INC 0.932 0.777 1.161 -0.984 16.232RATIO_CF 0.674 0.526 0.876 -0.933 12.511 Independent Variables IMP 0.315 0.000 0.464 0 1IMP_YR 0.272 0.000 0.445 0 1IMP_PARTIAL 0.215 0.000 0.411 0 1IMP_FULL 0.057 0.000 0.232 0 1ROA 0.115 0.088 0.101 0.000 0.590LEV 0.177 0.119 0.214 0.000 1.616SIZE 13.574 13.318 2.440 4.288 24.701FOROPS 0.336 0.000 0.472 0 1BM 5.657 0.543 19.723 -3.096 149.374AGGR_LOSS 0.063 0.000 0.243 0 1COCF 0.880 0.900 0.094 0.466 1.404INTANG 0.162 0.055 0.247 0.000 1.649PPE 0.339 0.274 0.284 0.000 1.854R&D 0.022 0.000 0.049 0.000 0.629DAP -0.010 -0.002 0.176 -1.182 1.129

[43]
Table 2 – continued
Panel B: Comparison of firm-years across the presence of an imputation system
Non-Imputation Imputation P-value of difference
Dependent Variables N Mean Median N Mean Median Mean
Median
Tax Avoidance Spreads SPREAD_INC 38,506 0.031 0.087 14,389 0.016 0.062 0.00 0.00SPREAD_CF 38,506 0.135 0.187 14,389 0.085 0.128 0.00 0.00Tax Avoidance Ratios RATIO_INC 38,506 0.922 0.768 14,389 0.957 0.796 0.00 0.00RATIO_CF 38,506 0.652 0.507 14,389 0.734 0.581 0.00 0.00 Independent Variables ROA 38,506 0.111 0.084 14,389 0.127 0.098 0.00 0.00LEV 38,506 0.173 0.117 14,389 0.186 0.126 0.00 0.00SIZE 38,506 13.841 13.547 14,389 12.860 12.525 0.00 0.00FOR_OPS 38,506 0.336 0.000 14,389 0.337 0.000 0.70 0.71BM 38,506 6.625 0.562 14,389 3.066 0.488 0.00 0.00AGGR_LOSS 38,506 0.065 0.000 14,389 0.060 0.000 0.04 0.04COCF 38,506 0.884 0.903 14,389 0.868 0.893 0.00 0.00INTANG 38,506 0.156 0.057 14,389 0.180 0.048 0.00 0.00PPE 38,506 0.313 0.260 14,389 0.410 0.326 0.00 0.00R&D 38,506 0.025 0.001 14,389 0.013 0.000 0.00 0.00DAP 38,506 -0.010 -0.002 14,389 -0.010 -0.002 0.89 0.83
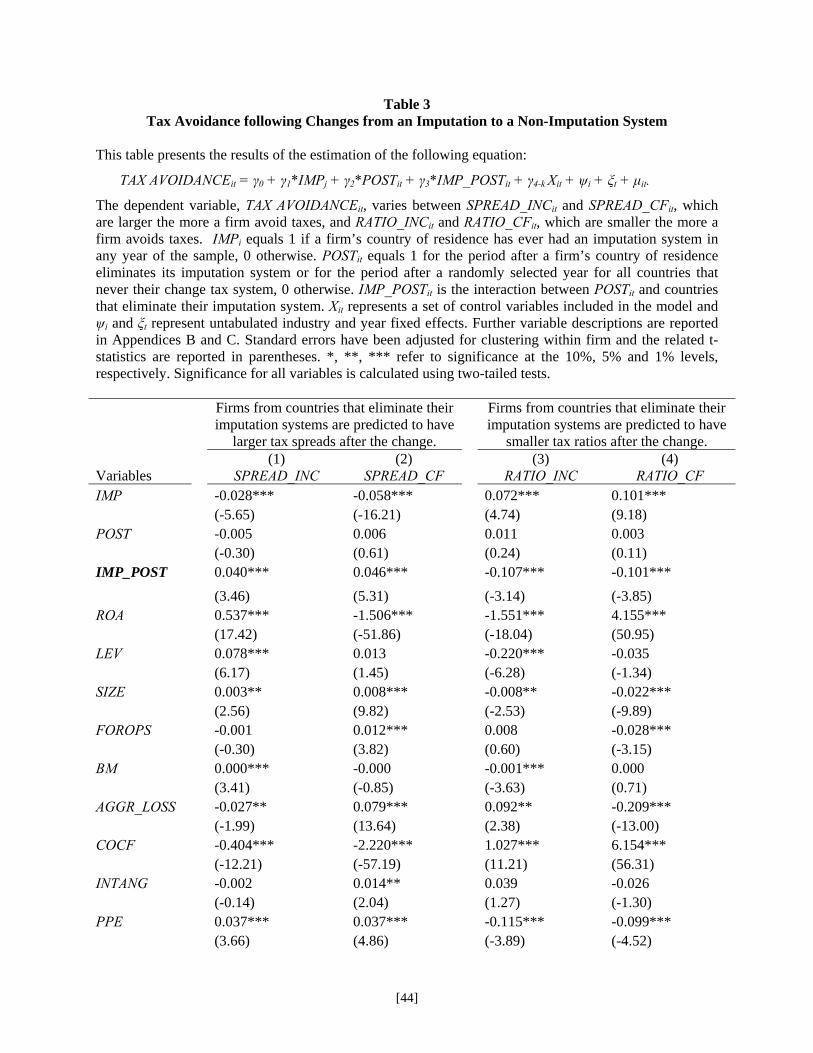
[44]
Table 3 Tax Avoidance following Changes from an Imputation to a Non-Imputation System
This table presents the results of the estimation of the following equation:
TAX AVOIDANCEit = γ0 + γ1*IMPj + γ2*POSTit + γ3*IMP_POSTit + γ4-k Xit + ψi + ξt + μit.
The dependent variable, TAX AVOIDANCEit, varies between SPREAD_INCit and SPREAD_CFit, which are larger the more a firm avoid taxes, and RATIO_INCit and RATIO_CFit, which are smaller the more a firm avoids taxes. IMPi equals 1 if a firm’s country of residence has ever had an imputation system in any year of the sample, 0 otherwise. POSTit equals 1 for the period after a firm’s country of residence eliminates its imputation system or for the period after a randomly selected year for all countries that never their change tax system, 0 otherwise. IMP_POSTit is the interaction between POSTit and countries that eliminate their imputation system. Xit represents a set of control variables included in the model and ψi and ξt represent untabulated industry and year fixed effects. Further variable descriptions are reported in Appendices B and C. Standard errors have been adjusted for clustering within firm and the related t-statistics are reported in parentheses. *, **, *** refer to significance at the 10%, 5% and 1% levels, respectively. Significance for all variables is calculated using two-tailed tests.
Firms from countries that eliminate their imputation systems are predicted to have
larger tax spreads after the change.
Firms from countries that eliminate their imputation systems are predicted to have
smaller tax ratios after the change.
Variables (1)
SPREAD_INC (2)
SPREAD_CF (3)
RATIO_INC (4)
RATIO_CF IMP -0.028*** -0.058*** 0.072*** 0.101*** (-5.65) (-16.21) (4.74) (9.18) POST -0.005 0.006 0.011 0.003 (-0.30) (0.61) (0.24) (0.11) IMP_POST 0.040*** 0.046*** -0.107*** -0.101***
(3.46) (5.31) (-3.14) (-3.85) ROA 0.537*** -1.506*** -1.551*** 4.155*** (17.42) (-51.86) (-18.04) (50.95) LEV 0.078*** 0.013 -0.220*** -0.035 (6.17) (1.45) (-6.28) (-1.34) SIZE 0.003** 0.008*** -0.008** -0.022*** (2.56) (9.82) (-2.53) (-9.89) FOROPS -0.001 0.012*** 0.008 -0.028*** (-0.30) (3.82) (0.60) (-3.15) BM 0.000*** -0.000 -0.001*** 0.000 (3.41) (-0.85) (-3.63) (0.71) AGGR_LOSS -0.027** 0.079*** 0.092** -0.209*** (-1.99) (13.64) (2.38) (-13.00) COCF -0.404*** -2.220*** 1.027*** 6.154*** (-12.21) (-57.19) (11.21) (56.31) INTANG -0.002 0.014** 0.039 -0.026 (-0.14) (2.04) (1.27) (-1.30) PPE 0.037*** 0.037*** -0.115*** -0.099*** (3.66) (4.86) (-3.89) (-4.52)

[45]
RND 0.181*** 0.125*** -0.501*** -0.271** (3.34) (3.02) (-3.45) (-2.28) DAP 0.135*** 0.051*** -0.359*** -0.144*** (10.12) (6.73) (-10.24) (-7.01) Intercept 0.235*** 2.097*** 0.443*** -4.820*** (5.90) (54.91) (4.01) (-44.86) Observations 52,895 52,895 52,895 52,895
Adjusted R2 0.059 0.276 0.058 0.266

[46]
Table 4 Cross-Sectional Differences in the Reaction to the Elimination of an Imputation System
This table presents the results from several unpooled regression estimates of the following equation:
TAX AVOIDANCEit = γ0 + γ1*IMPj + γ2*POSTit + γ3*IMP_POSTit + γ4-k Xit + ψi + ξt + μit.
The first two columns of results contain estimates for Low DIV and High DIV, split according to the median ratio of dividends to pre-tax income across the sample. The second two columns of results contain estimates for Low MNC and High MNC, split according to the absence or presence of foreign assets within a firm. The dependent variable, TAX AVOIDANCEit, varies between SPREAD_INCit (larger the more a firm avoid taxes) and RATIO_INCit, (smaller the more a firm avoids taxes). IMPi equals 1 if a firm’s country of residence has ever had an imputation system in any year of the sample, 0 otherwise. POSTit equals 1 for the period after a firm’s country of residence eliminates its imputation system or for the period after a randomly selected year for all countries that never their change tax system, 0 otherwise. IMP_POSTit is the interaction between POSTit and countries that eliminate their imputation system. Xit represents a set of control variables included in the model and ψi and ξt represent untabulated industry and year fixed effects. Further variable descriptions are reported in Appendices B and C. Standard errors have been adjusted for clustering within firm and the related t-statistics are reported in parentheses. *, **, *** refer to significance at the 10%, 5% and 1% levels, respectively. Significance for all variables is calculated using two-tailed tests. Non-parametric tests of the difference between IMP_POSTit in low and high subsamples are reported at the bottom of the table.
Firms from countries that eliminate their imputation systems are predicted to have
larger tax spreads after the change.
Firms from countries that eliminate their imputation systems are predicted to have
larger tax spreads after the change.
Variables (1) Low DIV
SPREAD_INC (2) High DIV SPREAD_INC
(1) Low MNC SPREAD_INC
(2) High MNC SPREAD_INC
IMP -0.030*** -0.001 -0.015** -0.048*** (-2.78) (-0.19) (-2.39) (-5.95) POST -0.034 0.009 -0.027 0.010 (-0.77) (0.54) (-1.06) (0.44) IMP_POST 0.011 0.033*** 0.052*** 0.032* (0.43) (2.75) (3.69) (1.82) ROA 0.431*** 0.688*** 0.430*** 0.804*** (10.15) (15.56) (11.87) (14.11) LEV 0.057*** 0.065*** 0.098*** 0.040** (3.20) (3.89) (6.07) (2.04) SIZE -0.001 0.013*** 0.003* 0.002 (-0.72) (8.58) (1.91) (1.34) FOROPS -0.006 0.001 0.000** 0.001*** (-0.75) (0.27) (2.27) (3.37) BM 0.001*** -0.000 0.041** -0.128*** (4.04) (-0.18) (2.49) (-5.62) AGGR_LOSS -0.058*** -0.048** -0.490*** -0.179*** (-3.35) (-2.13) (-12.21) (-3.16) COCF -0.386*** -0.308*** -0.003 0.002

[47]
(-8.31) (-6.52) (-0.26) (0.15) INTANG -0.043*** -0.013 0.037*** 0.040** (-3.02) (-0.90) (2.98) (2.35) PPE 0.010 0.068*** 0.192*** 0.098 (0.59) (5.70) (2.82) (1.14) R&D 0.122* -0.056 0.152*** 0.100*** (1.82) (-0.66) (9.24) (4.58) DAP 0.113*** 0.164*** 0.325*** 0.037 (6.60) (8.31) (6.46) (0.55) Intercept 0.386*** -0.067 0.430*** 0.804***
(5.79) (-1.24) (11.87) (14.11)
Observations 19,332 33,563 32,278 20,617
Adjusted R2 0.047 0.076 0.058 0.073
(Prob > F) (0.009) (0.036)

[48]
Table 5 Tax Avoidance Following Changes in the Australian Imputation System
This table presents the results of the estimation of the following equation:
TAX AVOIDANCEit = γ0 + γ1*IMP_YRit + γ2*AUSj + γ3*POST03it + γ4*AUS_POST03it
+ γ5-k Xit + ψi + ξt + μit.
The dependent variable, TAX AVOIDANCEit, varies between SPREAD_INCit and SPREAD_CFit, which are larger the more a firm avoid taxes, and RATIO_INCit and RATIO_CFit, which are smaller the more a firm avoids taxes. IMP_NOAUSit equals one if a firm’s country of residence has an imputation tax system and is not Australia during the year, 0 otherwise. AUSj equals 1 if a firm’s country of residence is Australia, 0 otherwise. POST03it equals 1 for the period after and including 2003, which corresponds to the inclusion of an additional imputation credit for public companies in Australia, 0 otherwise. AUS_POST03it is the interaction between AUSi and POST03it. Xit represents a set of control variables included in the model and ψi and ξt represent untabulated industry and year fixed effects. Further variable descriptions are reported in Appendices B and C. Standard errors have been adjusted for clustering within firm and the related t-statistics are reported in parentheses. *, **, *** refer to significance at the 10%, 5% and 1% levels, respectively. Significance for all variables is calculated using two-tailed tests.
Firms from Australia, where enhanced imputation credits
are available starting in 2003, are predicted to have smaller tax spreads after the change.
Firms from Australia, where enhanced imputation credits are available starting in 2003, are
predicted to have larger tax ratios after the change.
(1) (2) (3) (4)
VARIABLES SPREAD_INC SPREAD_CF RATIO_INC RATIO_CF IMP_YR -0.019*** -0.055*** 0.044*** 0.094***
(-3.63) (-14.59) (2.77) (7.95) AUS 0.005 0.034*** 0.018 -0.083***
(0.32) (3.69) (0.35) (-3.02) POST03 -0.054*** -0.035*** 0.158*** 0.088***
(-3.89) (-3.77) (4.25) (3.57) AUS_POST03 -0.099*** -0.071*** 0.244*** 0.193***
(-5.19) (-6.44) (4.05) (5.66) ROA 0.548*** -1.501*** -1.582*** 4.140***
(17.75) (-51.66) (-18.36) (50.75) LEV 0.080*** 0.014 -0.227*** -0.037
(6.34) (1.52) (-6.45) (-1.41) SIZE 0.003** 0.008*** -0.008** -0.022***
(2.29) (9.62) (-2.27) (-9.73) FOROPS -0.002 0.012*** 0.011 -0.026***
(-0.51) (3.71) (0.80) (-2.99) BM 0.000*** -0.000 -0.001*** 0.000
(3.52) (-0.77) (-3.74) (0.64) AGGR_LOSS -0.027** 0.079*** 0.092** -0.210***
(-1.97) (13.70) (2.37) (-13.05) COCF -0.406*** -2.221*** 1.031*** 6.155***

[49]
(-12.28) (-57.25) (11.27) (56.36) INTANG 0.000 0.015** 0.033 -0.028
(0.04) (2.12) (1.10) (-1.41) PPE 0.036*** 0.036*** -0.110*** -0.098***
(3.52) (4.82) (-3.74) (-4.48) R&D 0.170*** 0.122*** -0.470*** -0.262**
(3.14) (2.95) (-3.24) (-2.21) DAP 0.136*** 0.051*** -0.360*** -0.145***
(10.15) (6.74) (-10.27) (-7.04) Intercept 0.293*** 2.141*** 0.271*** -4.914***
(7.77) (56.99) (2.62) (-46.23)
Observations 52,895 52,895 52,895 52,895 Adjusted R-squared 0.061 0.276 0.059 0.266

[50]
Table 6 The Relation between Tax Avoidance and the Type of Country-Level Imputation System
This table presents the results of the estimation of the following equation:
TAX AVOIDANCEit = γ0 + γ1*IMP_PARTIALit + γ2*IMP_FULLit + γ3-k Xit + ψi + ξt + μit.
The dependent variable, TAX AVOIDANCEit, varies between SPREAD_INCit and SPREAD_CFit, which are larger the more a firm avoid taxes, and RATIO_INCit and RATIO_CFit, which are smaller the more a firm avoids taxes. IMP_PARTIALit and IMP_FULLit equal one if a firm’s country of residence has a partial or full imputation tax system, respectively, during the year, 0 otherwise. Xit represents a set of control variables included in the model and ψi and ξt represent untabulated industry and year fixed effects. Further variable descriptions are reported in Appendices B and C. Standard errors have been adjusted for clustering within firm and the related t-statistics are reported in parentheses. *, **, *** refer to significance at the 10%, 5% and 1% levels, respectively. Significance for all variables is calculated using two-tailed tests. F-tests of the difference between IMP_PARTIALit and IMP_FULLit are reported at the bottom of the table.
Firms from countries with full imputation systems are predicted to
have smaller tax spreads.
Firms from countries with full imputation systems are predicted to
have larger tax ratios.
Variables
(1) SPREAD_INC
(2) SPREAD_CF
(3)
RATIO_INC (4)
RATIO_CF
IMP_PARTIAL -0.019*** -0.055*** 0.045*** 0.097*** (-3.56) (-14.20) (2.77) (8.00) IMP_FULL -0.064*** -0.065*** 0.178*** 0.115*** (-7.20) (-10.48) (6.17) (5.93) ROA 0.541*** -1.505*** -1.565*** 4.153*** (17.57) (-51.77) (-18.19) (50.83) LEV 0.080*** 0.014 -0.226*** -0.036 (6.32) (1.50) (-6.43) (-1.37) SIZE 0.003** 0.008*** -0.008** -0.022*** (2.55) (9.77) (-2.52) (-9.90) FOROPS -0.003 0.012*** 0.011 -0.027*** (-0.54) (3.83) (0.85) (-3.11) BM 0.000*** -0.000 -0.001*** 0.000 (3.53) (-0.80) (-3.76) (0.69) AGGR_LOSS -0.028** 0.079*** 0.093** -0.209*** (-2.01) (13.63) (2.41) (-12.98) COCF -0.405*** -2.221*** 1.030*** 6.154*** (-12.26) (-57.23) (11.26) (56.34) INTANG -0.002 0.014** 0.039 -0.026 (-0.15) (2.00) (1.27) (-1.29) PPE 0.036*** 0.036*** -0.110*** -0.099*** (3.51) (4.80) (-3.74) (-4.49) R&D 0.176*** 0.124*** -0.486*** -0.269** (3.24) (2.99) (-3.35) (-2.27) DAP 0.136*** 0.051*** -0.360*** -0.145***

[51]
(10.16) (6.74) (-10.29) (-7.02) Intercept 0.233*** 2.103*** 0.445*** -4.817*** (6.45) (57.49) (4.44) (-46.69) Observations 52,895 52,895 52,895 52,895 Adjusted R2 0.060 0.276 0.058 0.266 F-test 21.991 2.015 18.142 0.697 (Prob > F) 0.000 0.156 0.000 0.404

[52]
Table 7 The Relation between Tax Avoidance and Closely-Held Firms in Imputation Systems
This table presents the results of the estimation of the following equation:
TAX AVOIDANCEit = γ0 + γ1*IMP_YRj + γ2*CLSHLDit + γ3*IMP_CLHDit + γ4-k Xit + ψi + ξt + μit.
The dependent variable, TAX AVOIDANCEit, varies between SPREAD_INCit and SPREAD_CFit, which are larger the more a firm avoid taxes, and RATIO_INCit and RATIO_CFit, which are smaller the more a firm avoids taxes. IMP_YRi equals one if a firm’s country of residence has an imputation tax system during the year, 0 otherwise. CLSHLDit equals 1 if a firm has an above-median ratio of closely-held shares to shares outstanding, 0 otherwise. IMP_CLHDit is the interaction between IMP_DUMi and CLSHLDit. Xit represents a set of control variables included in the model and ψi and ξt represent untabulated industry and year fixed effects. Further variable descriptions are reported in Appendices B and C. Standard errors have been adjusted for clustering within firm and the related t-statistics are reported in parentheses. *, **, *** refer to significance at the 10%, 5% and 1% levels, respectively. Significance for all variables is calculated using two-tailed tests.
Closely-held firms from countries with imputation systems are predicted to have
smaller tax spreads.
Closely-held firms from countries with imputation systems are predicted to have
larger tax ratios.
Variables (1)
SPREAD_INC (2)
SPREAD_CF
(3) RATIO_INC
(4) RATIO_CF
IMP_DUM 0.022*** -0.040*** -0.050*** 0.059*** (3.47) (-9.03) (-2.68) (4.40) CLSHLD 0.086*** 0.029*** -0.212*** -0.071*** (16.16) (8.43) (-14.83) (-7.70) IMP_CLHD -0.051*** -0.019*** 0.112*** 0.043* (-5.16) (-2.70) (3.66) (1.93)
ROA 0.522*** -1.521*** -1.514*** 4.193***
(16.93) (-52.90) (-17.59) (51.89)
LEV 0.066*** 0.009 -0.191*** -0.023
(5.30) (0.95) (-5.51) (-0.89)
SIZE 0.005*** 0.009*** -0.014*** -0.024***
(4.45) (10.69) (-4.19) (-10.67)
FOROPS -0.003 0.012*** 0.013 -0.026***
(-0.70) (3.70) (0.95) (-2.99)
BM 0.000*** -0.000 -0.001*** 0.000
(2.67) (-1.32) (-2.94) (1.15)
AGGR_LOSS -0.027** 0.079*** 0.093** -0.210***
(-1.97) (13.66) (2.39) (-12.99)
COCF -0.381*** -2.223*** 0.969*** 6.162***
(-11.53) (-57.24) (10.57) (56.36)
INTANG -0.021** 0.008 0.086*** -0.012
(-1.98) (1.18) (2.85) (-0.60)

[53]
PPE 0.041*** 0.038*** -0.124*** -0.102***
(4.10) (5.01) (-4.26) (-4.65)
R&D 0.163*** 0.118*** -0.457*** -0.253**
(3.04) (2.85) (-3.18) (-2.13)
DAP 0.135*** 0.052*** -0.359*** -0.147***
(10.17) (6.88) (-10.28) (-7.16)
Intercept 0.116*** 2.074*** 0.738*** -4.746***
(3.16) (55.62) (7.26) (-45.22)
Observations 52,771 52,771 52,771 52,771
Adjusted R2 0.066 0.278 0.063 0.267
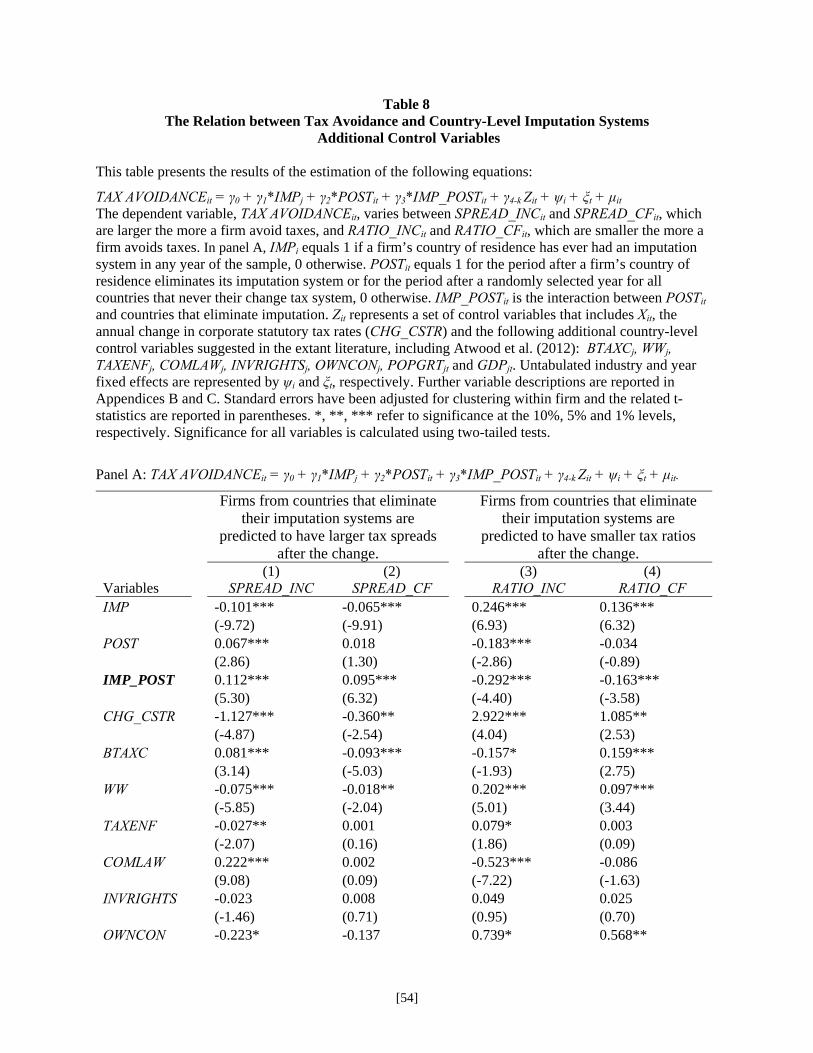
[54]
Table 8 The Relation between Tax Avoidance and Country-Level Imputation Systems
Additional Control Variables
This table presents the results of the estimation of the following equations:
TAX AVOIDANCEit = γ0 + γ1*IMPj + γ2*POSTit + γ3*IMP_POSTit + γ4-k Zit + ψi + ξt + μit The dependent variable, TAX AVOIDANCEit, varies between SPREAD_INCit and SPREAD_CFit, which are larger the more a firm avoid taxes, and RATIO_INCit and RATIO_CFit, which are smaller the more a firm avoids taxes. In panel A, IMPi equals 1 if a firm’s country of residence has ever had an imputation system in any year of the sample, 0 otherwise. POSTit equals 1 for the period after a firm’s country of residence eliminates its imputation system or for the period after a randomly selected year for all countries that never their change tax system, 0 otherwise. IMP_POSTit is the interaction between POSTit and countries that eliminate imputation. Zit represents a set of control variables that includes Xit, the annual change in corporate statutory tax rates (CHG_CSTR) and the following additional country-level control variables suggested in the extant literature, including Atwood et al. (2012): BTAXCj, WWj, TAXENFj, COMLAWj, INVRIGHTSj, OWNCONj, POPGRTjt and GDPjt. Untabulated industry and year fixed effects are represented by ψi and ξt, respectively. Further variable descriptions are reported in Appendices B and C. Standard errors have been adjusted for clustering within firm and the related t-statistics are reported in parentheses. *, **, *** refer to significance at the 10%, 5% and 1% levels, respectively. Significance for all variables is calculated using two-tailed tests.
Panel A: TAX AVOIDANCEit = γ0 + γ1*IMPj + γ2*POSTit + γ3*IMP_POSTit + γ4-k Zit + ψi + ξt + μit.
Firms from countries that eliminate their imputation systems are
predicted to have larger tax spreads after the change.
Firms from countries that eliminate their imputation systems are
predicted to have smaller tax ratios after the change.
Variables (1)
SPREAD_INC (2)
SPREAD_CF (3)
RATIO_INC (4)
RATIO_CF IMP -0.101*** -0.065*** 0.246*** 0.136*** (-9.72) (-9.91) (6.93) (6.32) POST 0.067*** 0.018 -0.183*** -0.034 (2.86) (1.30) (-2.86) (-0.89) IMP_POST 0.112*** 0.095*** -0.292*** -0.163*** (5.30) (6.32) (-4.40) (-3.58) CHG_CSTR -1.127*** -0.360** 2.922*** 1.085** (-4.87) (-2.54) (4.04) (2.53) BTAXC 0.081*** -0.093*** -0.157* 0.159*** (3.14) (-5.03) (-1.93) (2.75) WW -0.075*** -0.018** 0.202*** 0.097*** (-5.85) (-2.04) (5.01) (3.44) TAXENF -0.027** 0.001 0.079* 0.003 (-2.07) (0.16) (1.86) (0.09) COMLAW 0.222*** 0.002 -0.523*** -0.086 (9.08) (0.09) (-7.22) (-1.63) INVRIGHTS -0.023 0.008 0.049 0.025 (-1.46) (0.71) (0.95) (0.70) OWNCON -0.223* -0.137 0.739* 0.568**

[55]
(-1.76) (-1.57) (1.71) (2.00) POPGRT -1.828** -1.215** 5.385** 3.269* (-2.14) (-2.16) (2.02) (1.91) GDP -0.014*** 0.001 0.030*** -0.001 (-5.85) (0.44) (4.33) (-0.37) ROA 0.550*** -1.593*** -1.610*** 4.360*** (14.23) (-48.32) (-14.93) (48.02) LEV 0.048*** 0.001 -0.147*** 0.004 (3.41) (0.06) (-3.73) (0.12) SIZE 0.007*** 0.009*** -0.020*** -0.023*** (5.81) (10.18) (-5.54) (-9.79) FOROPS -0.006 0.009*** 0.020 -0.025*** (-1.26) (2.64) (1.42) (-2.62) BM 0.000* -0.000 -0.001** 0.000 (1.96) (-1.24) (-2.04) (1.11) AGGR_LOSS -0.076*** 0.072*** 0.219*** -0.198*** (-3.93) (9.86) (4.03) (-9.82) COCF -0.301*** -2.291*** 0.746*** 6.320*** (-7.14) (-49.14) (6.45) (48.93) INTANG -0.055*** 0.002 0.171*** -0.005 (-4.36) (0.22) (4.65) (-0.20) PPE 0.060*** 0.051*** -0.181*** -0.143*** (5.34) (5.93) (-5.61) (-5.69) R&D 0.141** 0.095* -0.408** -0.186 (2.40) (1.92) (-2.56) (-1.31) DAP 0.127*** 0.049*** -0.336*** -0.136*** (8.95) (6.10) (-9.11) (-6.30) Intercept 1.647*** 2.129*** -2.648*** -5.120*** (6.02) (13.32) (-3.19) (-10.72) Observations 41,424 41,424 41,424 41,424 Adjusted R2 0.079 0.295 0.074 0.283
Copyright © 2022 FDOKUMEN