The Dividend Disconnect1 - Brandes Investment Partners
20
The Dividend Disconnect 1 by Dr. Samuel M. Hartzmark and Dr. David Solomon Dr. Samuel Hartzmark (Associate Professor of Finance at the University of Chicago) and Dr. David Solomon (Assistant Professor of Finance at Boston College) won the 2017 Brandes Institute Prize; the Prize is awarded to members of the academic community for original research on aspects of value investing, behavioral finance or other related topics. This version of their prize-winning paper has been condensed. The full paper is available here: https://papers.ssrn.com/sol3/papers.cfm?abstract_id=2876373. The paper has been accepted at The Journal of Finance. As of December 2018, it has yet to be published. The information provided does not necessarily represent the views of the Brandes Institute or Brandes Investment Partners. ABSTRACT We show that many individual investors, mutual funds and institutions trade as if dividends and capital gains are separate disconnected attributes, not fully appreciating that dividends come at the expense of price decreases. Behavioral trading patterns (e.g. the disposition effect) are driven by price changes excluding dividends. Investors treat dividends as a separate stable income stream, holding high dividend-yield stocks longer and displaying less sensitivity to their price changes. We term this mistake the free dividends fallacy. Demand for dividends is systematically higher in periods of low interest rates and poor market performance, leading to high valuations and lower future returns for dividend- paying stocks. Investors rarely reinvest dividends into the stocks from which they came, instead purchasing other stocks. is creates predictable marketwide price increases on days of large aggregate dividend payouts, concentrated in stocks not paying dividends. At the heart of the dividend irrelevance result from Miller and Modigliani (1961) 2 is the idea that money is fungible, implying that a value-maximizing investor should treat money equally regardless of its source. 3 Because of this, academic finance typically assumes that an investor in a frictionless world will be indifferent between receiving $1 worth of dividends (with the price declining by $1) and selling $1 worth of that position. Adding real-world frictions such as taxes and trading costs to the model can influence whether an investor prefers to receive a dividend or sell a given amount of stock. However, even with these frictions, investors are assumed to simply maximize the value of their position aſter subtracting costs, and otherwise treat the two sources of profits equally. is assumption (implicitly) underlies the vast majority of asset pricing research, as it justifies why a return that combines capital gains and dividends is the central variable of analysis. While the idea in Miller and Modigliani’s research is intuitive when explicitly laid out, some of its implications (e.g. the price declining to offset dividend payment) may not be salient to many investors. Dividend irrelevance runs counter to intuitions from other areas of life, whereby harvesting the fruit from a tree is viewed as fundamentally different to harvesting the tree itself. One oſten reads statements like the quote by James MacKintosh above, which may at first glance seem reasonable, but on reflection are difficult to reconcile with the Miller and Modigliani research framework. DECEMBER 2018 “The humble dividend is reclaiming its rightful place as the arbiter of stock-market value... To investors desperate for income, the argument for buying equities is, well, duh. Who wouldn’t want a higher income? Shares might swing around, but corporate managers go out of their way to preserve the dividend.” — James MacKintosh, The Wall Street Journal, May 9, 2016
-
Upload
khangminh22 -
Category
Documents
-
view
1 -
download
0
Transcript of The Dividend Disconnect1 - Brandes Investment Partners

The Dividend Disconnect1
by Dr. Samuel M. Hartzmark and Dr. David Solomon
Dr. Samuel Hartzmark (Associate Professor of Finance at the University of Chicago) and Dr. David Solomon (Assistant Professor of Finance at Boston College) won the 2017 Brandes Institute Prize; the Prize is awarded to members of the academic community for original research on aspects of value investing, behavioral finance or other related topics. This version of their prize-winning paper has been condensed. The full paper is available here: https://papers.ssrn.com/sol3/papers.cfm?abstract_id=2876373. The paper has been accepted at The Journal of Finance. As of December 2018, it has yet to be published. The information provided does not necessarily represent the views of the Brandes Institute or Brandes Investment Partners.
ABSTRACT
We show that many individual investors, mutual funds and institutions trade as if dividends and capital gains are separate disconnected attributes, not fully appreciating that dividends come at the expense of price decreases. Behavioral trading patterns (e.g. the disposition effect) are driven by price changes excluding dividends. Investors treat dividends as a separate stable income stream, holding high dividend-yield stocks longer and displaying less sensitivity to their price changes. We term this mistake the free dividends fallacy. Demand for dividends is systematically higher in periods of low interest rates and poor market performance, leading to high valuations and lower future returns for dividend-paying stocks. Investors rarely reinvest dividends into the stocks from which they came, instead purchasing other stocks. This creates predictable marketwide price increases on days of large aggregate dividend payouts, concentrated in stocks not paying dividends.
At the heart of the dividend irrelevance result from Miller and Modigliani (1961)2 is the idea that money is fungible, implying that a value-maximizing investor should treat money equally regardless of its source.3 Because of this, academic finance typically assumes that an investor in a frictionless world will be indifferent between receiving $1 worth of dividends (with the price declining by $1) and selling $1 worth of that position. Adding real-world frictions such as taxes and trading costs to the model can influence whether an investor prefers to receive a dividend or sell a given amount of stock. However, even with these frictions, investors are assumed to simply maximize the value of their position after subtracting costs, and otherwise treat the two sources of profits equally. This assumption (implicitly) underlies the vast majority of asset pricing research, as it justifies why a return that combines capital gains and dividends is the central variable of analysis.
While the idea in Miller and Modigliani’s research is intuitive when explicitly laid out, some of its implications (e.g. the price declining to offset dividend payment) may not be salient to many investors. Dividend irrelevance runs counter to intuitions from other areas of life, whereby harvesting the fruit from a tree is viewed as fundamentally different to harvesting the tree itself. One often reads statements like the quote by James MacKintosh above, which may at first glance seem reasonable, but on reflection are difficult to reconcile with the Miller and Modigliani research framework.
DECEMBER 2018
“The humble dividend is reclaiming its
rightful place as the arbiter of stock-market
value... To investors desperate for income,
the argument for buying equities is, well, duh.
Who wouldn’t want a higher income? Shares
might swing around, but corporate managers
go out of their way to preserve the dividend.”
— James MacKintosh, The Wall Street Journal,
May 9, 2016

BRANDES.COM/INSTITUTE
THE DIVIDEND DISCONNECT / PAGE 2
To value a stock for its income stream, like our initial quote claims, may speak to a sophisticated understanding of taxes and transaction costs, but the phrase “duh” does not immediately suggest such nuance. The last sentence of the quote implies that dividends are viewed as a safe hedge against the uncertain fluctuations in price, thereby ignoring that dividends come directly at the expense of the price level. We term this mistake the free dividends fallacy—unless the tradeoff between price changes and dividends is salient, dividends are apt to appear as a desirable free source of income. We examine whether evidence of such a mistake is present in the trading and pricing of securities. We find that the disconnect between price changes and dividends appears to be of considerable practical importance, affecting outcomes as varied as trading relating to gains and losses, prices of dividend-paying stocks, dividend reinvestment, and marketwide returns.
We begin by presenting evidence that investors separately track price changes and dividends, rather than combining them into returns. We show this for individual investors, as well as for a subset of mutual funds and institutional investors. This behavior is consistent with investors utilizing separate mental accounts (Thaler 1980, Thaler 1999, Frydman et al. 2015) for price changes and dividends, an idea first proposed by Shefrin and Statman (1984). If investors track each variable separately, price changes are likely to be more salient as a measure of stock performance, as prices have larger and more frequent moves than dividends.
To test this, we examine a number of trading behaviors based on the past performance of stocks, and show that the trading is driven primarily by past price changes rather than past returns. We examine the disposition effect (the tendency to sell winners more often than losers, as in Shefrin and Statman 1985). Furthermore, the behavioral basis for this pattern means that that the economic content of dividends is less likely to explain the results.
For our analysis, we decompose the drivers of performance into a price change component and a dividend component. As we will show, there is significantly less selling response to the dividend component, and in a number of cases dividends do not appear to be part of the performance evaluation at all. These results hold strongly for individual investors, where mental accounting effects are expected to be greatest. For mutual funds and institutions, there is more heterogeneity. However, among the 40% of mutual funds and 44% of institutions that display an overall disposition effect (and which thus appear to be using mental accounting more generally), the responses to dividends are similar to those of individual investors. When examining the disposition effect, perceptions of gains and losses seem to be largely driven by price changes, regardless of whether dividend payment has affected this price.
By evaluating stock performance in this manner, investors do not appear to be correcting for the impact of a dividend on the price level. In other words, if two stocks both have increased in price from $5 to $6, but one of them first rose to $7 then paid $1 of dividends, investors who only focus on price changes treat the two stocks as having equivalent performance. But importantly, the fact that investors appear to give dividends less weight when trading based on past performance does not mean that dividends are ignored in the decision-making process. Rather, if price changes and dividends are viewed as disconnected attributes of a stock, investors focusing separately on dividends will view the $1 as a small positive gain, distinct from the price level. Such an investor suffers from the free dividends fallacy in that dividends appear to be a small consistent gain with no apparent offsetting cost in price.
Investors focusing on the dividends, presumably for the perceived attractiveness of the income stream, are likely to pay less attention to the capital gains component of returns. Consistent with this, we show that investors (individuals, mutual funds and institutions) are less likely to sell stocks that pay more dividends, holding them for longer periods than other stocks. In addition, dividends make investors less sensitive to past price changes when selling stocks. This supports the prediction that investors do not view dividends and capital gains as equally important contributors to returns, but focus on one variable or the other.
If investors are subject to the free dividends fallacy, viewing dividends as a distinct source of income, they should place a higher value on that perceived income stream when other options for income are less attractive. For an investor exhibiting the free dividends fallacy, perhaps the closest substitute for dividend income is from bonds. We find that dividend demand is higher when the interest rate is low, consistent with the periodic payments from bonds appearing less attractive. In the cross-section, demand is higher for stocks whose dividends are more stable, and whose dividends have increased in the recent past. In addition, the demand for dividends is lower when recent past market returns have been higher.

BRANDES.COM/INSTITUTE
THE DIVIDEND DISCONNECT / PAGE 3
In these times, the smaller predictable stream of payments from dividends is apt to appear less attractive compared with the large recent capital gains, if the two components are evaluated as separate alternative ways to make money on a stock. Finally, if investors view dividend payments as being separate from the value of their position, they may not reinvest dividends into the stocks from which they came. This has been shown before for the case of individuals in Baker et al. (2007), who argued that dividends were financing consumption. We show that dividend reinvestment is also rare among mutual funds and institutions (similar to Kaustia and Rantapuska (2012) using Finnish data).
As well as being more sophisticated than retail investors, most mutual funds and institutions lack the consumption motive of individuals, meaning that there must be other motives for their behavior. Using quarterly holdings, we examine how often dividend-paying holdings increase by approximately the number of shares that could be purchased with the dividend on the payment date (when reinvestment requires a non-trivial number of shares). We compare this to another benchmark for passive investing—holding exactly the same number of shares in the subsequent quarter, and leaving the dividend in cash or investing it elsewhere. We show that dividend reinvestment is only about 2.3% as common as zero holdings changes for the case of mutual funds, and 9.6% as common for institutional investors. If revealed preference is to be believed, the low level of dividend reinvestment implies that these investors have a desire to marginally reduce their portfolio weights by the exact amount of the dividend starting on the ex-dividend date. It seems more likely that these sophisticated investors are either not directly tracking which dividends correspond to which stocks for reinvestment purposes, or do not care enough to maintain particular portfolio weights.
The reinvestment of dividends outside of the stocks from which they came has predictable effects upon market returns. Days with large dividend payouts in the market are associated with higher market returns—a day in the highest week of dividend payouts in a given year is associated with higher daily value-weighted market returns of 16 basis points (compared to a mean daily market return of 4 basis points). This price increase is consistent with the finding that uninformed shifts in demand can affect prices of individual stocks in the United States (Shleifer 1986, Hartzmark and Solomon 2013) and the market as a whole in the case of Chile (Da et al. 2014). When the market is decomposed into stocks that paid a dividend that day and stocks that did not, we find that the price increases are evident for firms that did not pay a dividend that day. This is consistent with the institutional and mutual fund results—the vast majority of dividends get reinvested outside the stock from which they were paid, leading to predictable price pressure in those stocks, even though the payments are entirely unrelated to those stocks. The marketwide returns also militate against other potential explanations for the lack of reinvestment. They suggest that the lack of dividend reinvestment is not just due to an inattention to dividend payments, because there are price effects when the payments are made. Further, the patterns in returns are inconsistent with funds retaining dividends as part of a cash management strategy, since the cash is being quickly reinvested.
Our results are consistent with investors evaluating their portfolio performance in a more naive manner than academic finance has generally assumed. We provide direct evidence that investors do not treat dividends and capital gains in the same manner, consistent with investors considering them in separate mental accounts. This leads to each variable receiving a different level of focus depending on context. A general disconnect between price changes and dividends, as our results suggest, would also explain why the popular discourse on dividends diverges so sharply from the academic literature.
For example, when US Airways called its frequent flier program “Dividend Miles,” the airline presumably had in mind a definition of “paying dividends” similar to that of the Macmillan Dictionary, “to bring you a lot of benefits.”4 It seems unlikely they were trying to convey messages like “tax-disadvantaged miles,” “irrelevant miles” or “signaling miles.” If investors do not accurately perceive the tradeoff between dividends and price changes, this stream of payments will seem like an unambiguously positive aspect of stocks. The fact that this apparent confusion exists even in the financial press is consistent with the market-wide impacts we document.
The disconnect between price changes and dividends also helps to unify a number of results that are puzzling under normal assumptions about returns. Baker et al. (2007) present evidence that individuals like to consume out of their dividends, consistent with the mental accounting distinctions between dividends and capital gains. Baker and Wurgler (2004b) argue for a catering theory whereby investors have a general demand for dividends due to psychological or institutional reasons, though the psychology behind this is not discussed at length. The free dividends fallacy not only explains psychologically why dividends may be desirable, but also why the shifting attractiveness of capital gains and dividends can generate time-varying demand for dividends which firms respond to (Baker and Wurgler 2004a). Valuing dividends purely as an income stream can also help to explain the observed

BRANDES.COM/INSTITUTE
THE DIVIDEND DISCONNECT / PAGE 4
preference that older investors have for dividends documented in Graham and Kumar (2006) and Becker et al. (2011), and the fact that investors do not perceive the risk-reward tradeoff inherent in the change in leverage associated with a dividend, as shown in Welch (2016). An overall demand for dividends is consistent with Hartzmark and Solomon (2013), who document abnormally positive returns during dividend months linked to price pressure from dividend-demanding investors.
Harris et al. (2015) show that mutual funds have a tendency to “juice” their dividend yield by trading in and out of dividend-paying stocks to increase the fund’s dividend yield at the expense of overall returns. These results all point to a generalized time-varying demand for dividends, but do not explain why dividends are desirable.5
Our research highlights how the framing of decisions and choice of reference point impacts behavior and market outcomes in large liquid financial markets. Viewing prices and dividends as separate attributes is related to how investors frame a position’s performance (e.g. Read et al. 1999 and Tversky and Kahneman 1985). By splitting attention between price changes (as large attention-grabbing measures of performance) and dividends (as small stable gains), investors are focusing on salient aspects of equities similar to the models of Bordalo et al. (2012) and Bordalo et al. (2015). The framing of salient attributes is an important aspect of why certain firms cater to investors in ways that are difficult to understand within the context of simple value maximizing frameworks (e.g. Celerier and Vallée 2016; Ellison and Ellison 2009 and Harris et al. 2015).
Our results suggest that the free dividends fallacy is costly to investors because of the systematic nature of time-varying dividend demand. In addition to the direct costs and benefits associated with dividend paying stocks (such as taxes, trading costs and reinvestments), if investors buy dividend paying stocks when they are relatively over-priced due to a general demand for dividends, they will earn predictably lower returns. We estimate that investors buying dividend-paying stocks during times of high demand earn roughly 2-4% less per year in expectation. Thus an investor whose preferences for dividends cause him to shift into and out of dividend-paying stocks at the same time as other investors would lose a significant portion of the equity premium by doing so.
I. Framework
The null hypothesis of the paper is that investors seek to maximize the monetary value of a position, consistent with Miller and Modigliani (1961). Absent frictions, a rational investor is indifferent between receiving a dividend or selling the equivalent value of cash because they can buy and sell positions without cost to achieve a desired breakdown of cash to equity.6 Introducing frictions such as taxes or trading costs may make an investor prefer to achieve a given cash level through dividends or share sales. This simply requires adding costs into the calculation of value and does not mean the investor fails to appreciate that the dividend comes at the expense of the price level.
The alternative hypothesis we explore is that investors treat price changes and dividends separately, consistent with placing each in separate mental accounts (Thaler 1999 and Shefrin and Statman 1984). This hypothesis is based on an implication of mental accounting not previously emphasized—if decisions about capital gains and dividends are made piecemeal, rather than combined together, then the two aspects of performance are likely to be considered separately, rather than combined into a single returns variable. We consider a number of associated predictions:
Prediction 1. Capital Gains and Dividends Viewed as Distinct Desirable Attributes
If investors view the price change and dividend as separate attributes of a stock, then they will make different trading decisions when focusing on one or the other. While the dividend income stream is likely to appear as a relatively stable source of small gains, it will not offer the opportunity for large gains (or the risk of large losses) that price changes do. As a result, price changes are likely to receive greater attention as a measure of a stock’s recent performance. Thus when trading based on a stock’s past recent performance we expect price changes rather than total returns to be a more important determinant of trading decisions. In addition, if price changes and dividends are viewed as independent ways to profit from a stock, then investors in dividend-paying assets are likely to be less sensitive to the price change component, as they will perceive that they have already made a profit through the dividend component.

BRANDES.COM/INSTITUTE
THE DIVIDEND DISCONNECT / PAGE 5
Prediction 2. The Free Dividends Fallacy: Separate Evaluation Leads to Neglect of the Tradeoff Between Price Changes and Dividends
If investors do not consider the two variables as part of a single evaluation, they will be less likely to appreciate that dividend payment results in a decrease in the price of the security. We describe in Section II how the tradeoff may not be readily apparent to an investor who only pays attention periodically to his portfolio. To such an investor, if the reduction in price associated with dividends is not salient, then dividends are apt to appear as free. This will make dividends an unambiguously positive aspect of stocks, causing investors to be less likely to sell them (in order to receive the ongoing dividend payments).
In addition, the relative attractiveness of dividends relative to capital gains is likely to vary over time according to how valuable the income stream appears. In particular, investors are likely to compare the income from stocks with the income they could receive on a fixed income asset like a bond. Thus, when interest rates are low, dividend paying stocks may be more attractive.
In addition, the relative attractiveness of a small regular dividend stream to capital gains is likely to vary according to whether the price change component has been delivering large gains recently, which would make price changes seem relatively more valuable (consistent with extrapolative beliefs from Greenwood and Shleifer 2014). Thus we also predict that the demand for dividends will be higher when market performance has been lower. If many investors systematically demand dividends for a similar reason this could impact the overall valuation of dividend paying stocks.
Prediction 3. Capital Gains and Dividends Spent Differently
If capital gains and dividends are evaluated in different mental accounts, then investors will use the proceeds differently. This has been argued in Thaler and Johnson (1990) in terms of how much risk people take on with gains and losses and in Baker et al. (2007) when explaining why individuals consume out of dividends. More broadly, if dividends are considered to be cash flows that are separate from the value of a position, then investors may not be inclined to reinvest them into the stocks from which they came. If dividends are viewed as income to be spent, even if this is reinvested, it may be invested in a different manner or asset, rather than reinvested into the original stock as if it were just part of the same position value.
Comparison With Other Behavioral Models
The idea that capital gains and dividends might be considered in separate mental accounts was first proposed by Shefrin and Statman (1984). In their model, segregating the two parts into different mental accounts creates a preference for dividends for a number of reasons. Dividends help investors solve self-control problems; prospect theory makes it preferable to split a gain or loss into multiple components, and consuming from dividends has lower regret possibilities than consuming from stock sales. Importantly, these effects all operate regardless of whether investors understand that dividends come at the expense of price drops. Some of the Shefrin and Statman (1984) concepts (such as hedonic editing, where investors choose to sometimes segregate dividends and price changes, and sometimes combine them) suggest that investors have a concept of total returns, and evaluate the two components together when it produces more utility. In this regard, Shefrin and Statman (1984) investors are relatively sophisticated, with heuristics regarding dividends being useful ways to circumvent other behavioral tendencies. By contrast, the free dividends fallacy is a more basic error, and one which does not seem to have been considered before—that investors simply do not understand the tradeoff between price changes and dividends.
While Shefrin and Statman (1984) present a number of compelling reasons why investors may like dividends, a number of our results are difficult to explain without the free dividend fallacy. Mutual funds and institutions do not consume out of dividends, making both self-control and consumption based-regret unlikely as explanations of why dividends are not reinvested. In addition, it is not clear why an investor who understands the tradeoff between price changes and dividends should desire dividends more when the interest rate or market returns are lower, whereas the free dividend fallacy suggests that these are traded off as alternative ways to make money off a stock. The prediction of hedonic editing is that for small capital losses, investors will integrate dividends and capital gains to a single variable that is treated as a gain. By contrast, our results regarding the disposition effect suggest that for stocks where adding the dividend would turn the position into a gain, investors nonetheless trade as if they think of the stock as being at a loss.

BRANDES.COM/INSTITUTE
THE DIVIDEND DISCONNECT / PAGE 6
A different behavioral model relating to dividends is presented in Baker et al. (2016). They present a signaling model, where investors are loss averse (as under a prospect theory value function) over dividend cuts. This leads managers to be reluctant to cut dividends. Their model mostly focuses on the predictions for managers, and finds support for their predictions. However their model of investor preferences are quite different, as in their setup investors care only about the dividend stream over multiple periods. Because price changes do not feature in investors’ consideration in their model, it does not readily explain why demand for dividends changes with market price movements, or how investors evaluate price changes versus dividends for trading purposes.
It is worth noting that while we argue that such mental accounting is common, we are not arguing that it is true for all market participants. Clearly there are investors who recognize the tradeoff between prices and dividends and are trading based on total returns. Whether the disconnect between prices and dividends is sufficiently widespread as to be evident in trading patterns and market prices is ultimately an empirical question.
II. Data Sources and Summary Statistics
Information about prices, returns, dividends and market-wide indices are all from the Center for Research in Security Prices (CRSP). The individual trader data is the same as used in Barber and Odean (2000) and is processed for analysis as described in Hartzmark (2015) and Frydman et al. (2015). The sample includes trades from January 1991 through November 1996. Each observation is a position that could have been sold on a day that an investor sells at least one position in their portfolio (a sell day). Positions purchased on a sell day that were not previously held are not considered possible to be sold because the data lacks time stamps to know when the purchase occurred in a day. Positions held before the beginning of the sample are dropped as the initial purchase price is unknown. Short positions are excluded from the analysis, as are all positions that ever have a negative commission. Returns and percentage price changes are calculated from the purchase price to the closing price the day before the sell day. All returns are calculated using the cumulative dividend received over a period, assuming no reinvestment.7 If a position is purchased multiple times the value-weighted average of the multiple purchase prices is used to calculate returns.
The data covers 54,176 accounts over 313,625 days that included the sale of an equity position. There were 1,506,274 equity positions in total held on those days, with the median investor holding three stocks on a day when he sells a position. Out of these positions, 696,138 were of stocks that paid a dividend while the investor was holding them. In terms of the gain or loss status of these dividend-paying positions, 437,805 are gains regardless of whether the price change or the total return is used, 217,467 are losses regardless of whether the price change or the total return is used, and 40,866 are gains under a total return but losses under a price change measure.
Information about institutional holdings (13-Filings) and mutual fund holdings (s12 filings) are taken from Thomson Reuters. Data cover 1980 to 2015 and the filters from Frazzini (2006) are utilized to remove observations that appear to be errors in the data. The reinvestment analysis looks at changes in holdings from one report date to the next and the sample is limited to reports that occur between 60 and 120 calendar days from each other to focus on quarterly reports. For the selling analysis the data is treated similar to the individual investor analysis where report dates are treated equivalently to a sell date. The value-weighted price is used as the reference price if multiple purchases of a given position are made. If a given fund reports a holding on a given report day and does not report it in the subsequent filing the position is considered to be liquidated (change of shares of -100%).
For the mutual funds and institutions, we have 21,743 mutual funds with 279,018 report dates (over which we consider sales, which are a decrease in holding between consecutive report dates). This results in 24,570,258 holdings observations, of which 11,521,670 paid a dividend over the prior quarter. Similarly for institutions, we have observations for 6,761 institutions over 229,528 report dates, covering 57,040,527 holdings observations, of which 28,359,091 paid dividends over the prior quarter. Because part of our tests involve the question of whether investors perceive dividends as resulting in price decreases (as opposed to merely being free income), we examine summary statistics about how apparent this tradeoff might be to an investor who was merely observing the two variables. It bears emphasizing that we are not claiming that investors never perceive such a tradeoff. Rather, we seek to examine whether an investor would find the tradeoff in price decreases so readily apparent that he would be forced to notice it in the course of casual observation.

BRANDES.COM/INSTITUTE
THE DIVIDEND DISCONNECT / PAGE 7
Examining the daily correlation between return and dividend yield for individual stocks, conditional on a positive dividend yield, we see a positive correlation of about 0.09 (consistent with the ex-day price drop being somewhat less than the size of the dividend, leading to the positive ex-day returns documented in Elton and Gruber 1970). In many instances, an investor observes price changes when viewing an individual stock’s performance so the correlation between price change and dividend yield may be the more relevant number for a large number of investors. At the daily level, we see a robust negative correlation between daily price changes and dividend yields of -0.50 for individual stocks. The negative correlation is unsurprising as it is predicted by Miller and Modigliani (1961). However, it is noteworthy that even at the daily frequency this number is far away from -1 due to daily fluctuations in prices. Even though on average the price drops by roughly the value of the dividend, market movements and idiosyncratic price changes are a large portion of the daily stock return on dividend ex-dates.
As time increases (to a level that is probably closer to what most investors use to evaluate their portfolio), the correlation between price changes and dividend yield moves closer to 0. The correlation in monthly returns is -0.103 and by the annual level of this correlation is -0.067. The correlation moving toward zero as the horizon increases is also mechanical, as the price changes become more volatile over time, but the correlation still reflects what an investor would observe. Correlations around -0.1 are sufficiently low that the tradeoff between price changes and dividends is not likely to be salient to a casual observer without access to large datasets. In other words, an investor suffering from the free dividends fallacy who only observed the prices of stocks periodically in his portfolio would be unlikely to quickly be disabused of his mistake.
III. Trading Behavior Based on Capital Gains and Dividends
If investors are not aggregating price changes and dividends into a single performance measure, then this may be evident in their trading behavior. In particular, the literature has documented a number of patterns in how the propensity of investors to sell stocks is related to their past performance. In the papers describing these effects, performance was either measured using price changes or returns including dividends, but the role of dividends has been discussed mostly in the context of showing that similar results are ascertained using performance measures with or without dividends.8 However, this does not answer the question we are interested in—do investors actually respond to the return including dividends, or just the price change component of performance? In this section, we decompose the impact of returns into price changes and dividend yields, and find that investors respond mostly, and in some cases entirely, to the price change component. This is consistent with investors behaving as if a position’s performance does not include the dividend component.
III-1. Dividends and the Evaluation of Gains and Losses: The Disposition Effect
The disposition effect refers to the fact that investors are more likely to sell a position at a gain than at a loss (Shefrin and Statman 1985). The effect has been documented for a wide variety of assets—stocks (Odean 1998), executive stock options (Heath et al. 1999), real estate (Genesove and Mayer 2001), futures (Locke and Mann 2005), and online betting (Hartzmark and Solomon 2012).9 It has also been documented for different levels of investor sophistication, including futures traders (Locke and Mann 2005), mutual fund managers (Frazzini 2006), and individual investors (in the United States, Odean 1998; in Finland, Grinblatt and Keloharju 2001; in China, Feng and Seasholes 2005).
For many positions, either price changes or returns including dividends will yield the same category of gain or loss. However, some positions are at a gain when dividends are included, but at a loss without their inclusion. Do investors treat such positions as being
at a gain or at a loss when evaluating whether to sell the position? This is equivalent to asking whether investors adjust for the mechanical decrease in shares price that results from dividend payments. We examine three distinct cases of being at a gain or loss:
Unambiguous Loss Gain Only with Dividends Unambiguous Gain
The position is...at a loss regardless of whether dividends are included
at a gain when dividends are included, but at a loss when excluded
at a gain regardless of whether dividends are included

BRANDES.COM/INSTITUTE
THE DIVIDEND DISCONNECT / PAGE 8
In our sample of individual investors 40,866 positions are in the ambiguous category of being at a gain only after dividends are included, compared to 437,805 unambiguous gain cases and 217,467 unambiguous loss cases.
In Exhibit 1, we examine how the disposition effect varies across these three cases. Using the individual trader data, we examine positions in an investor’s portfolio on days when the investor sells a stock, and examine the propensity to sell each position in the portfolio. The dependent variable is a “Sell” dummy variable, equal to one if the position in question was sold that day. As independent variables, we consider variables corresponding to the different categories of gains, to see how their selling propensities compare with each other. In particular, we wish to know whether the category of gain only with dividends is traded as if it were a gain (as would be the case if investors are considering a standard returns variable that includes dividends), or traded as if it were a loss (as would be the case if investors only evaluated capital gains and ignored dividends).
To test this, in Column 1 of Exhibit 1, we include variables for the two categories under examination. First, unambiguous gains, represented by the “Unambiguous Gains” (UG) dummy variable which equals one if the stock is at a gain using price changes alone. Second, “Gain only with Dividends,” (G w/o D) is equal to one for the intermediate case where the stock is at a gain when dividends are included (as under a standard returns measure), but at a loss when dividends are excluded (as if investors only examine price changes). The omitted category is thus the “Unambiguous Loss” case.
The main variable of interest is “Gain only with Dividends.” Regardless of whether investors are examining returns with dividends or just price changes, the coefficient on “Unambiguous Gain”, should be positive and significant. This is consistent with the disposition effect, as regardless of measure these positions are at a gain. If investors are examining returns including dividends, then the coefficient on “Gain only with Dividends” should be positive, significant, and of a similar magnitude to “Unambiguous Gain.” This would indicate that such stocks are sold more than the “Unambiguous Loss” case and similar to the “Unambiguous Gain” case. By contrast, if investors are only examining price changes and are ignoring dividends for this calculation, then “Gain only with Dividends” is not expected to be significantly positive, as stocks in this category are treated like the omitted category of losses. Further, the coefficient on “Gain only with Dividends” will be significantly lower than the coefficient on “Unambiguous Gain,” as only the unambiguous gain stocks will be viewed as being at a gain for investors who are examining price changes.
In Column 1 of Exhibit 1, the coefficient on “Unambiguous Gain” is 0.0789 with a t-statistic of 16.47 (with standard errors clustered by account and date). This means that investors are 7.9% more likely to sell unambiguous gains than the omitted category of unambiguous losses. The coefficient on “Gain only with Dividends” is insignificant, meaning that the gain only with
Exhibit 1: The Disposition Effect With and Without Dividends
Individual Investors Mutual Funds Institutional Investors
1 2 1 2 1 2
UG .0789*** .0746*** .0488*** .0395*** .0321*** .0252***
(16.47) (20.63) (9.38) (10.81) (7.06) (8.97)
G w/o D .00549 .00997*** .0173*** .0246*** .0151*** .0146***
p: UG=G w/ D .0000 .0000 .0000 .0000 .0000 .0000
Account FE No Yes No Yes No Yes
Add. Controls No Yes No Yes No Yes
R2 .0115 .238 .00332 .164 .00124 .0703
Observations 1506274 1506274 10767599 10767599 16664828 16664828
The dependent variable is “Sell,” a dummy variable for whether a particular share was sold that day (for individuals) or between the two reporting dates (for funds and institutions), given that some sale occurred. The two main independent variables are UG or “Unambiguous Gain,” a dummy variable that equals one for any share at a gain relative to purchase price, computed using only the capital gain and excluding dividends, and G w/o D or “Gain Only With Dividends,” a dummy variable for a share at a gain relative to purchase price if dividends are included but at a loss when dividends are not included. All regressions include a Received Dividend dummy that equals one if the share has received any dividends since being purchased. Additional Controls include a portfolio size fixed effect, Gain, Gain*(% Price Change), Loss*(% Price Change), Gain*(% Price Change)*(√Holding Days), Loss*(% Price Change)*(√Holding Days), √Holding Days, Gain*Variance, and Loss*Variance, where Gain and Loss are defined based on % price change. p-values for the test of UG = G w D or “Unambiguous Gain=Gain Only With Dividends” are reported after the regression values. Individual investor data covers January 1991 to November 1996. Fund and institutional data covers 1980 to 2015 and only funds and institutions displaying a positive disposition effect (excluding the current day) are included. Standard errors are clustered by account/fund and date, and t -statistics are in parentheses. *, **, and *** indicate significance at the 10%, 5%, and 1% levels, respectively. Source: CRSP, Barber and Odean, Thomson Reuters.

BRANDES.COM/INSTITUTE
THE DIVIDEND DISCONNECT / PAGE 9
dividends case is roughly as likely to be sold as the “Unambiguous Loss” case. The “Gain only with Dividends” coefficient is also significantly less than the coefficient on “Unambiguous Gain” (p-value less than 0.001) confirming that the “Gain only with Dividends” case is sold at a significantly lower rate than the “Unambiguous Gain” case. These results are consistent with investors evaluating gains and losses using price changes; stocks which are at a loss when dividends are excluded, but at a gain when dividends are included are treated more like other losses than like other gains.
Column 2 in Exhibit 1 adds a number of additional controls. We control for the level of returns, which has been known to effect selling propensities, as in Ben-David and Hirshleifer (2012) who document a V-shape in selling propensity as returns get higher or lower. We include a number of controls from that paper—price changes in the positive domain (PriceChange*Gain) and price changes in the negative domain (PriceChange*Loss), the square root of the holding period, the volatility over the previous year interacted with gain and loss, and holding period interacted with positive price changes and with negative price changes. In addition we include a portfolio-size fixed effect and an account fixed effect to capture heterogeneity across investors.
With these additional controls in Column 2, investors are about 7.46% more likely to sell an “Unambiguous Gain” than an “Unambiguous Loss,” as seen in the coefficient on “Unambiguous Gain,” again highly significant. The coefficient on “Gain only with Dividends” is positive and significant (0.00997, with a t-statistic of 3.58). This means that after controlling for all the additional permutations of return levels, holding periods and variances, the “Gain only with Dividends” case is somewhat more likely to be sold than an “Unambiguous Loss” (by 1%). However, this effect is still significantly smaller than the coefficient on “Unambiguous Gain,” meaning the “Gain only with Dividends” category is sold at a significantly lower rate than the “Unambiguous Gains” case.
III-2. Dividends and the Reaction to Price Changes
The above analysis suggests that trading based on past performance is typically based on price appreciation alone. It is important to note that this does not mean that dividends do not have a role in trading decisions, but only that they do not get considered in the same category of performance as price changes. Dividend payment may still be considered as part of the trading decision if investors view dividend-paying assets as a perpetual stream of payments. Indeed, the premise of the prior argument is that investors are not clearly appreciating how price changes and dividends are related to each other. If investors do not fully internalize the fact that larger dividend payments mean larger price decreases, then dividend payment may make stocks appear more desirable and less likely to be sold. This is part of the free dividends fallacy—dividend payment is a positive attribute of stocks, which should increase investors’ willingness to hold the stock.
We test this possibility in Exhibit 2, Panel A. As before, the dependent variable is a dummy variable for whether a given stock got sold. The main independent variable is “Dividend Yield in Prior Year,” the total amount of dividends paid over the prior 12 months divided by the previous day’s price. This variable is a stock’s characteristic, rather than a measure based on investor specific performance examined elsewhere. Thus, it may capture investors using the dividend yield as an aspect of a trading strategy, such as viewing it as a measure of safety or value. To control for such a motive, and focus on behavior suggestive of the free dividend fallacy, we add a number of stock-specific controls including the age of the company, market capitalization, book-to-market, and volatility of earnings-per-assets over the prior five years.
In Panel A, regardless of the specification, and for all classes of investors (individual investors as a group, as well as mutual funds and institutions that display a disposition effect overall), the propensity to sell a stock decreases with the level of the dividend yield. This result holds even relative to the investor’s own average turnover level among all stocks in his portfolio. Recall that the regressions also control for attributes such as book-to-market, meaning that the effect is not simply arising due to price declines regardless of dividend status. The lower propensity to sell higher dividend yield stocks is consistent with individuals viewing dividend streams as a source of income that represents a distinct and independent aspect of performance from price appreciation. When the effects of dividend yield are measured using dummy variables for various levels of dividend yield, we see that all types of investors display a strong tendency to hold on to high dividend yield stocks.
BRANDES.COM/INSTITUTE
THE DIVIDEND DISCONNECT / PAGE 10
Exhibit 2, Panel A: Selling Based on Dividends
Individual Investors Mutual Funds Institutional Investors
1 2 3 4 5 6
Div. Yield in Prior Year -.393*** -.179*** -.285***
(-7.94) (-2.84) (-5.46)
Dividend in Prior Year -.00494** -.00136 .00743***
(-2.23) (-0.53) (2.68)
Dividend Yield (0,1] -.0104*** -.00448* .00571**
(-4.35) (-1.87) (2.08)
Dividend Yield (1,2] -.0111*** -.00127 .00402
(-3.98) (-0.49) (1.49)
Dividend Yield (2,3] -.00507* -.00317 .00173
(-1.82) (-1.32) (0.61)
Dividend Yield (3,4] -.0194*** -.00950*** -.00429
(-6.40) (-3.62) (-1.50)
Dividend Yield (4,5] -.0188*** -.0140*** -.00906***
(-4.03) (-4.60) (-3.01)
Dividend Yield 5+ -.0344*** -.0160*** -.0132***
(-10.01) (-4.93) (-3.73)
Stock Controls Yes Yes Yes Yes Yes Yes
Account FE Yes Yes Yes Yes Yes Yes
Add’l Controls Yes Yes Yes Yes Yes Yes
R2 .322 .322 .164 .164 .0694 .0694
Observations 1506274 1506274 10767599 10767599 16664828 16664828
Note: Exhibit 2 (Panels A and B) examine whether investors are more or less likely to sell stocks that pay dividends, and whether dividends are associated with less selling reaction to price changes. The dependent variable is “Sell,” a dummy variable for whether a particular share was sold. “Dividend Yield in Prior Year” is a stock’s dividend yield over the prior 12 months and “Dividend in Prior Year” is a dummy variable equal to one if this variable is positive. The following six variables are dummy variables equal to one if the dividend yield over the prior year is in the indicated range of values (e.g. Dividend Yield (0,1] is equal to 1 if Dividend Yield in Prior Year is greater than 0 and less than or equal to 1%). “Gain” is a dummy variable equal to one if the stock is at a gain based on price appreciation. “Received Dividend” is a dummy that equals one if the share has received any dividends since being purchased. “Stock Controls” include book-to-market, company age, annual earnings per asset volatility over the previous five years, a dummy variable equal to one if the company received a dividend in the prior 12 months and market capitalization as of the prior month. Additional Controls are listed in Exhibit 1. Standard errors are clustered by account/fund and date. The t-statistics are in parentheses. *, **, and *** indicate significance at the 10%, 5%, and 1% levels, respectively. Source: Source: CRSP, Barber and Odean, Thomson Reuters. January 1991 to November 1996 for Individual Investors; Thomson Reuters, 1980 to 2015 for mutual funds and institutional investors.

BRANDES.COM/INSTITUTE
THE DIVIDEND DISCONNECT / PAGE 11
If investors are more likely to evaluate the performance of dividend-paying stocks based on their dividend yield, then this may imply a lower sensitivity to the price change component as price changes and dividends are separate desirable ways to make money. In Exhibit 2, Panel B, we examine this in terms of the overall propensity to sell gains (measured using price changes).
The dependent variable is again a “Sell” dummy, while the independent variables are a “Gain” dummy, a “Received Dividend” dummy, and the interaction between the two. The main variable of interest is the “Gain*Received Dividend” interaction. This is large and significantly negative. In column 1, the base “Gain” coefficient of 0.109 means that non-dividend-paying stocks have a disposition effect of 10.9%. Meanwhile, the “Gain*Any Dividend” coefficient is -0.0693, with a t-statistic of -17.81. This means that dividend-paying stocks have a significantly lower disposition effect of 3.96% (0.109 - 0.0694). Adding account fixed effects and the additional controls reduces the “Gain*Received” coefficient to -0.0367, but the effect is still large and highly statistically significant. When evaluating dividend paying stocks, investors pay less attention to whether the stock is at a gain or a loss.10
Finally we explore the extent to which mutual funds and institutions respond less to the price changes of dividend-paying stocks. Mutual funds display a disposition effect 1.7% lower for dividend paying positions, roughly 40% less than the base rate of 4.4% in this sample for non-dividend paying positions. Institutions display a disposition effect that is -0.9% lower than non-dividend paying positions, roughly 30% of the 2.8% probability of sale for non-dividend paying positions. In other words, not only do investors fail to add dividends to capital gains when evaluating stock performance, but dividends actually appear to result in less attention being paid to capital gains.
Overall, the results from this section indicate that the disconnect between price changes and dividends is evident in individual traders as a group, and also in a significant fraction of mutual funds and institutions. While mutual funds and institutional investors are a less homogeneous group, for the fraction that exhibit the disposition effect, and thus who seem more likely to be using mental accounting, their responses to price changes and dividends are similar to those of individual investors.11 This suggests that such behavior is ubiquitous across a large number of different types of investors and time periods.
IV. Reinvestment of Dividends by Institutions and Mutual Funds
IV-1. Frequency of Dividend Reinvestment
We next examine the prediction relating to what investors do with dividends once they have received them. A key part of the dividend irrelevance theorem of Miller and Modigliani (1961) is the idea of dividend reinvestment; an investor who receives a dividend from a share and would prefer to maintain the size of his existing portfolio weight can simply reinvest the dividend. In the case of individual investors, Baker et al. (2007) show that individual investors rarely reinvest dividends and appear to consume out of dividend income. One possible explanation for such behavior is based on theories of dividend clientele, such as Graham and
Exhibit 2, Panel B: Disposition Effect Based on Dividends
Individual Investors Mutual Funds Institutional Investors
1 2 3 4 5 6
Gain .109*** .0834*** .0555*** .0443*** .0386*** .0281***
(20.22) (21.67) (10.45) (12.26) (7.75) (9.02)
Gain*Rec’d Dividend -.0693*** -.0367*** -.0136*** -.0165*** -.0125*** -.00883***
(-17.81) (-12.56) (-3.58) (-6.14) (-4.11) (-3.38)
Account FE No Yes No Yes No Yes
Add’l Controls No Yes No Yes No Yes
R2 .0131 .289 .00333 .164 .00125 .0703
Observations 1506274 1506274 10767599 10767599 16664828 16664828
See Note under Exhibit 2, Panel A. Source: CRSP, Barber and Odean, Thomson Reuters, January 1991 to November 1996.
BRANDES.COM/INSTITUTE
THE DIVIDEND DISCONNECT / PAGE 12
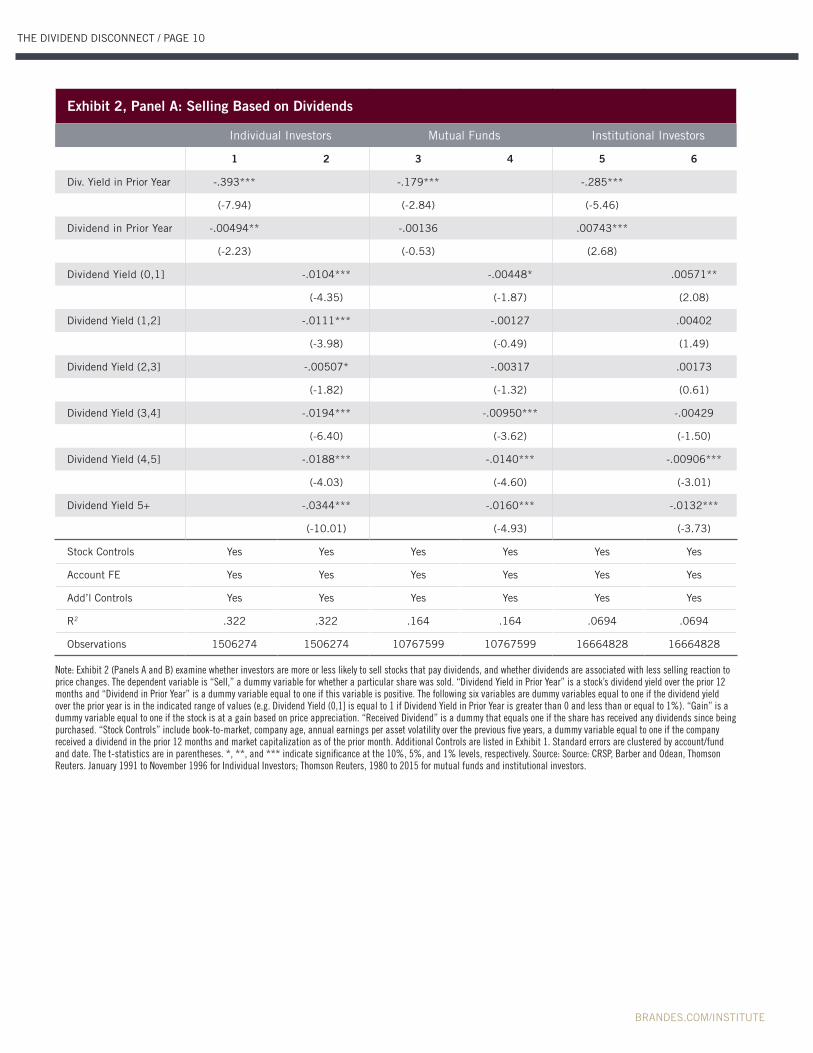
Kumar (2006). In this view, some investors have reasons such as trading or time costs to not want to regularly sell small amounts of stock, and use dividends as a way to generate a stream of cash flows for consumption at a lower cost. This seems likely to be part of the explanation, especially for individual investors. However, a lack of dividend reinvestment may occur for psychological reasons, if investors treat the dividend payments as belonging to a separate mental account to be used elsewhere. This is an idea consistent with the mental accounting literature. When investors view money as being in separate accounts, they are likely to spend the money from each account in different ways (such as in the house money phenomenon of Thaler and Johnson 1990). Reinvesting dividends outside of the stocks that paid them would be consistent with the general disconnect between dividends and price changes that we show in evaluating performance.12
To test this possibility, we examine the dividend reinvestment policies of investors for whom individual consumption motives seem less likely, namely mutual funds and institutions. In the case of mutual funds, there is no obvious consumption motive, as funds are legally required to distribute all dividends and capital gains they receive to the fund’s investors by the end of the year (known as the “pass-through rule”) in order to avoid paying corporate income taxes at the fund level.
However, the timing of the fund’s dividend receipts rarely affects the immediate short-term decision to reinvest, as many funds pay out their received dividends in a single amount, often toward the end of the year. As a result, any dividends received during the year are simply part of the fund value until the fund makes its own dividend payment, and hence in the meantime they can either be reinvested or left in cash. The fund’s choice of whether to reinvest dividends is thus more linked to investment policies, rather than consumption. Institutional investors will have different tax arrangements, but many of them also lack an equivalent of a consumption motive. Some, such as charities, may be constrained by the terms of their charters to not spend the principal in their endowment, but many institutional investors are large financial firms that (like mutual funds) similarly lack consumption needs.
To test the level of dividend reinvestment, we examine the changes in quarterly holdings for mutual funds and institutions. There are several possible benchmarks by which to evaluate how much funds reinvest dividends. Given trading costs and frictions, investors may not always reinvest exactly the amount of the dividend, or may wait some days (at which point the price of the share, and the amount of shares that the dividend can purchase, may have changed). However, one easy comparison is the frequency with which an investor holds exactly the same number of shares from one quarter to the next. Funds that hold exactly the same number of shares, when the stock in question has paid dividends, are either holding the payment as cash or reinvesting it elsewhere. If dividend reinvestment is reasonably common, then dividend-paying holdings should be less likely to have exactly the same number of shares held from one quarter to the next, relative to non-dividend paying holdings.
We examine this question in Exhibit 3. This shows the changes in shares from last quarter (the prior report) for positions that received dividends over that period (the left figure) and positions that did not (the right figure), for mutual funds (Exhibit 3, Panel A) and institutions (Exhibit 3, Panel B). The green and red bars represent the fraction of positions with exactly zero change in shares; each blue bar represents the fraction of positions with the indicated number of shares, binned in 50 share change increments.
Several aspects of this picture are noteworthy. First, both mutual funds and institutions are much more likely to hold exactly the same number of shares next quarter in a dividend-paying stock than they are to hold a small amount of shares more (as under reinvestment). Zero reinvestment is a very common outcome for both types of investors, as shown by the left figure in both panels. Second, a comparison of the left and right figures in each panel indicates that the likelihood of holding exactly the same number of shares next quarter is very similar regardless of whether the stock paid a dividend that quarter. For mutual funds, the fraction of dividend-paying holdings where the fund holds exactly the same number of shares next quarter is 31.7%, compared to non-dividend-paying holdings where the fraction is 32.2%, with the difference being insignificant. For institutions, the exact number of shares fraction is 18.2% for dividend-paying holdings, versus 19.0% for non-dividend-paying holdings. The presence of a dividend does not make a large difference in the likelihood that a fund changes the number of shares it holds, consistent with dividend reinvestment being rare.

BRANDES.COM/INSTITUTE
THE DIVIDEND DISCONNECT / PAGE 13
Exhibit 3, Panel A: Changes in Holdings for Dividend-Paying and Non-Dividend-Paying Stocks: Mutual Funds
Received Dividend No Dividend Received
Note: Exhibit 3, Panels A and B show the distribution of the change in number of shares of a given fund holding from one report date to the next, for holdings that paid a dividend be-tween the two report days (left graph) and those that did not (right graph). Panel A examines holdings changes for mutual funds, and Panel B examines holdings changes for institutions. The maroon and green bars represents the number of holdings with the exact same number of positions from quarter to quarter. The blue bars represent changes in number of position in 100s. Bars are centered at x and to the right of the maroon bar contain changes from (x - 50; x + 50] and to the left [x - 50; x + 50). Source: Thomson Reuters, 1980 to 2015.
Exhibit 3, Panel B: Changes in Holdings for Dividend-Paying and Non-Dividend-Paying Stocks: Institutional Investors
Received Dividend No Dividend Received
Source: Thomson Reuters, 1980 to 2015.

BRANDES.COM/INSTITUTE
THE DIVIDEND DISCONNECT / PAGE 14
These results (and other analysis we have done not addressed in this shortened report) indicate that dividend reinvestment is relatively uncommon among both mutual funds and institutions. To put these numbers in perspective, suppose that an investor is going to effectively leave their holding essentially unchanged over a quarter, either by just reinvesting the dividend on the payment date or by leaving their holding completely unchanged and doing something else with the dividend. By comparing the “reinvestment within 100 shares” rate (0.00719) to the exact same number of shares fraction (from column 1, 0.315-0.00483= 0.3102), a mutual fund is 43.1 times more likely to leave their holdings unchanged than they are to just reinvest the dividend.
For institutions, the corresponding rates are 0.0117 for reinvestment within 100 shares versus 0.1822 for the exact same number of shares. Thus an institution is 15.6 times more likely to leave their holdings unchanged than they are to just reinvest the dividend. The failure of funds and institutions to reinvest dividends into the shares that paid them may be part of a deliberate choice by such investors to change their portfolio weights for reasons other than dividend payment. However, the changes in weights thus implied are somewhat puzzling—under this alternative interpretation, these investors would need to have an explicit desire to reduce their portfolio weight by exactly the amount of the dividend payment, on exactly the dividend ex-date. This seems somewhat implausible. Simple inattention could potentially explain the result, if investors do not track the timing or source of dividend payments, or if the changes in weights or cash amounts are viewed as being too small to worry about. However, at a minimum, our results suggest that the same behavior documented for individual investors in other settings is also evident for funds and institutions. This raises the possibility that the actions have a single underlying rationale, which would militate against consumption needs as being the driving force as they do not as readily apply to funds and institutions. The lack of reinvestment is consistent with investors viewing the dividend payments as being somehow separate from the underlying value of the stocks that paid them. It is also possible to posit alternative explanations specific to funds and institutions, such as holding on to dividends as part of a cash management strategy to deal with investor redemptions. We consider these alternative explanations below.
IV-2. Market Impact of Dividend Reinvestment
If mutual funds and institutional investors rarely reinvest dividends into the stocks from which they came, then when these investors receive dividend payments they must either increase their cash balances or reinvest them elsewhere. While it is difficult to rule out all alternative reasons for the lack of reinvestment in the original stocks, some of these explanations have testable predictions at the aggregate level. In particular, if dividend payments are simply too small for funds to worry about, it seems unlikely that they should drive any significant investment decisions. If investors are inattentive to the timing or amount of dividends, then dividend payments should not be linked to immediate pricing outcomes, but rather will be acted upon in a gradual manner as the fund eventually notices an accumulation of cash balances. Finally, if the dividends are simply being retained by the investors as part of a cash management strategy (such as to deal with investor inflows and outflows), then the payments should not drive immediate purchases and sales of securities, as the primary impact will just be on cash holdings. By contrast, if investors view dividends as disconnected attributes and exhibit the free dividends fallacy, it is likely that they are attentive to dividends, they just treat them as being separate from the underlying value of the stocks and may spend the proceeds differently, such as by purchasing other securities. If investors are attentive to dividends, such purchasing is likely to be concentrated as soon as the dividends are paid. Because dividend payment occurs at the same time for all holders of a given stock, this may cause predictable price pressure. Second, if most dividend reinvestment is occurring outside the stocks that paid dividends, then we predict price pressure to be evident in these non-paying stocks, even though the payment event is even less economically relevant for these firms than for the dividend-payers. Recall that dividend payment dates and amounts are known in advance, so any price pressure is predictable and tradable. To test this, we first examine how daily market returns are related to the amount of dividends paid that day. As an independent variable, we calculate a daily dividend payout yield as the total dollar value of dividends that had a payment date that day, divided by the sum of market capitalizations on the previous day. We then test whether this explains variation in CRSP market returns, either value-weighted in the first four columns or equal-weighted in the last two.
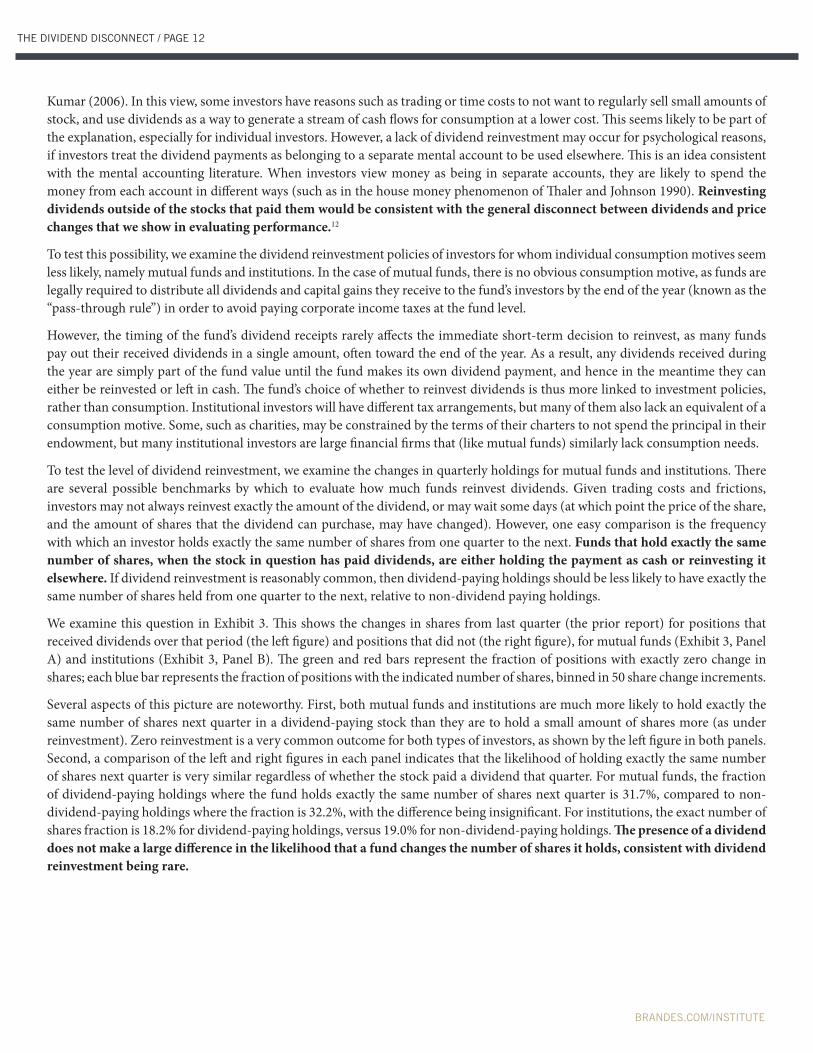
We present these results in Exhibit 4, Panels A-C. In Exhibit 4, Panel A, the dependent variable is the market returns, and higher daily dividend payouts positively predict daily market returns. In Column 1, using value-weighted returns, the coefficient on daily dividend yield is 66.70, with a t-statistic of 3.00. In column 2, we add year-by-month fixed effects, to ensure that we are not picking up something about the overall economic conditions when dividends are higher, and the effect becomes, if anything, slightly stronger. In terms of magnitude, a one standard deviation increase in dividend payment (0.0003084) is associated with higher
BRANDES.COM/INSTITUTE
THE DIVIDEND DISCONNECT / PAGE 15
market returns by 2.1 basis points (.0003084 * 66.70 = 0.021). This compares with a mean daily market return of 4 basis points, so the effect is economically large. The distribution of dividend payout on the market has a long right tail, where the median daily dividend payout is 0.2 basis points, but the highest week in a year of dividend payouts has a median value of 16 basis points.
Exhibit 4, Panel A: Market Returns Based on Aggregate Dividend Payments: Entire Market
Value Weighted Equal Weighted
1 2 3 4 5 6
Dividend Yield 66.70*** 72.88*** 106.6***
(3.00) (3.15) (4.66)
Highest Week .160*** .169*** .187***
(3.12) (3.23) (3.54)
Constant .0326*** .0318*** .0378*** .0376*** .0598*** .0693***
(4.42) (4.30) (5.45) (5.43) (7.88) (9.72)
Year Month FE No Yes No Yes No No
R2 .000377 .0485 .00408 .0485 .000911 .000526
Observations 23784 23784 23784 23784 23784 23784
Source: CRSP, January 1991 to November 1996.
Exhibit 4, Panel B: Market Returns Based on Aggregate Dividend Payments: Dividend Payers
Value Weighted Equal Weighted
1 2 3 4 5 6
Dividend Yield 39.62 61.64* 27.02
(1.17) (1.72) (0.91)
Highest Week .152** .170** .135**
(1.98) (2.16) (1.99)
Constant .0861*** .0830*** .0885*** .0881*** .116*** .116***
(7.08) (6.79) (7.84) (7.84) (10.84) (11.77)
Year Month FE No Yes No Yes No No
R2 .0000676 .0630 .000193 .0631 .0000410 .000196
Observations 20236 20236 20236 20236 20236 20236
Source: CRSP, January 1991 to November 1996.

BRANDES.COM/INSTITUTE
THE DIVIDEND DISCONNECT / PAGE 16
Thus, we would expect higher predicted returns in this rather extreme portion of the sample. To examine whether this is actually the case we re-run the analysis with a dummy variable equal to one if the dividend payment on a given day is in the top week worth of dividend payout in the past year. To avoid any look-ahead bias, we define our dummy variable “Highest Week” as equal to one if the dividend payout today is in the top five dividend payouts of the previous 252 trading days. In Column 3 we repeat the analysis with this dummy variable.
We find a coefficient of 16 basis points with a t-statistic of 3.12. Thus, the few days with a rather extreme dividend payout are associated with rather extreme predictable market returns. In Panel B and Panel C, we test whether, within the market portfolio, these price increases are concentrated among firms that actually paid a dividend that day, or those that did not. We split the overall market return into dividend payers (Panel B) and non-payers (Panel C), and repeat the same analysis. For the firms that actually paid a dividend that day, Column 3 shows a smaller coefficient of 39.62 and a statistically insignificant effect, while adding fixed effects results in a marginally significant (t -statistic of 1.72) coefficient of 61.64.13
When we examine the effect of dividend payment solely on the returns of firms that did not pay a dividend, in Panel C, the results are similar to the overall effect on market returns, but, if anything, larger in both magnitude and significance. The univariate coefficient is 73.59 (with a t-statistic of 3.28), increasing to 78.53 (with a t-statistic of 3.38) once year-by-month fixed effects are added. Examining the highest week dummy we see a similar effect to that found for the whole market of 16 basis points. The results are generally similar and somewhat larger for equal-weighted portfolios of returns. This is consistent with the finding in Hartzmark and Solomon (2013) that price-pressure effects are larger for smaller market capitalization companies which may have less liquidity. The way investors account for dividends has effects on market prices. Mutual funds and institutions, who make up large fractions of total ownership, tend to reinvest dividends when they are received, but do so mostly outside of the stock that paid the dividends. This creates predictable price pressure when dividend payments are larger among stocks without a payment. Moreover, this reinvestment has immediate, marketwide price effects. This is inconsistent with investors simply ignoring dividends because they are too small or retaining the dividends as part of a cash management strategy.
Exhibit 4, Panel C: Market Returns Based on Aggregate Dividend Payments: Non-Dividend Payers
Value Weighted Equal Weighted
1 2 3 4 5 6
Dividend Yield 73.59*** 78.53*** 98.43***
(3.28) (3.38) (4.44)
Highest Week .160*** .169*** .165***
(3.10) (3.21) (3.24)
Constant .0347*** .0341*** .0407*** .0405*** .0715*** .0804***
(4.68) (4.58) (5.84) (5.82) (9.74) (11.65)
Year Month FE No Yes No Yes No No
R2 .000453 .0499 .000405 .0499 .000829 .000441
Observations 23784 23784 23784 23784 23784 23784
Source: CRSP, January 1991 to November 1996.
BRANDES.COM/INSTITUTE
THE DIVIDEND DISCONNECT / PAGE 17
V. Conclusion
The idea that a value maximizing investor is indifferent between receiving value through capital gains or dividends is an economically sensible one—by combining the two into a single returns variable, an investor can measure the total profit he receives on a position. Nonetheless, the wedge between normative theories of how to account for investment profits (which provide sound measures of overall economic performance for an investor), and positive theories (which describe how investors actually think of their positions) may be considerable. In this paper, we document that investors behave as if they track capital gains and dividends as separate and largely independent variables. Their behavior does not suggest that these two components are conceived of as part of a single combined source of money, and this has important marketwide consequences.
This disconnect between dividends and price changes shows up in a number of ways. When considering whether to sell assets, the performance of stocks is mostly considered in terms of price changes, not returns. Dividend-paying stocks are sold less frequently, and the propensity to sell depends less on price changes. These results hold not only for individual investors, but also for the significant fraction of mutual funds and institutions who overall display behavior consistent with mental accounting. Additional research we conducted (not reflected in this shorter report) shows demand for dividend-paying assets increases when interest rates are low and when recent market returns are low, suggesting that investors value these stocks as an income stream, and compare them to income streams on bonds and the potential for price increases. When even sophisticated investors receive a dividend, they rarely reinvest it back into the asset from which it came. Rather, they reinvest it in other stocks, leading to predictable price pressure from aggregate dividend payments. These findings are best understood as showing that investors view price changes and dividends in separate mental accounts.
Absent considerations of taxes and transaction costs, dividends are merely another source of profit along with capital gains, and one which will mechanically reduce the price of the stock. However, popular discourse often discusses them as if they are a cost-free stream of income, largely independent of capital gains. Many investors and commentators, if pushed, will readily admit than any given dividend will result in a price drop. However, they will then make puzzling statements such as claiming that the reliability of dividend payments provides a good hedge against the possibility of uncertain fluctuations in prices, or that a high dividend yield is valuable when bond yields are low. A better understanding of the relation between dividends and price changes would help investors appropriately characterize their profits on each position. How best to teach investors about the proper role of dividends in finance remains an open and interesting question.

BRANDES.COM/INSTITUTE
THE DIVIDEND DISCONNECT / PAGE 18
End Notes1 We are grateful to Randy Cohen, Kent Daniel, Andrea Frazzini, Thomas Gilbert, Pete Hecht, Raife Giovinazzo, Markku Kaustia, Hersh Shefrin, Kelly Shue, Meir Statman, Paul Tetlock, and seminar participants at Arizona State University, Australian National University, the University of Florida, the University of Miami, Chicago Booth School of Business, UC Irvine, Fuller & Thaler Asset Management, Cubist Systematic Strategies, Massachusetts Institute of Technology, Tilburg University, Erasumus University, Maastricht University, Southern Methodist University, the University of Sydney, the University of Technology, Sydney, the MSUFCU Conference on Financial Institutions and Investments, the UC Davis GSM Behavioral Finance Conference, the Miami Behavioral Finance Conference, the Colorado Finance Summit and the NBER Behavioral Finance Meeting for helpful suggestions. We thank Terry Odean for giving us the data on individual investors.2 Miller, Merton H. and Franco Modigliani. “Dividend Policy, Growth, and the Valuation of Shares.” The Journal of Business, Vol. 34, No. 4 (Oct., 1961), pp. 411-433 3 The Modigliani-Miller theorem states that a firm’s financing structure (whether issuing equity or debt) does not affect its value. For example, a $1 billion firm financed exclusively by issuing stock and a $1 billion firm financed exclusively by issuing bonds should be valued identically. The theory is sometimes called “capital structure irrelevance” principle. The duo took their idea a step further when studying dividends. They asserted that investors should treat dividends and capital gains the same when considering return on investment—and they should not focus on dividends, but corporate earnings instead, when valuing a company. 4 http://www.macmillandictionary.com/us/dictionary/american/pay-dividends 5 In Section 1, we discuss other behavioral theories of dividends, such as Shefrin and Statman (1984) and Baker et al. (2016), and how they differ from the free dividend fallacy.6 The fact that financial markets have existed for hundreds of years, but this Nobel-Prize-winning insight was not made until 1961, suggests that this offsetting price decline may not in fact be immediately obvious to everybody.7 In untabulated results, we find similar results with alternative assumptions of dividend reinvestment frequency.8 For example, Odean (1998) does not include dividends in the calculation of returns as they are not relevant for the tax implications of selling a position. He notes that “The primary finding of the paper... is unaffected by the inclusion or exclusion of commissions or dividends.”9 The notable exception is delegated assets like mutual funds, where investors display a reverse disposition effect, as described in Chang et al. (2016). Those authors ascribe this difference to the role of delegation in helping investors resolve the cognitive dissonance of losing positions.10 One potential concern with the individual investor analysis is whether the differential treatment of dividends could be driven by tax considerations. In untabulated results, we have replicated all of the tables using individual investor data for the subsample of tax exempt accounts and find materially similar results.11 As with any analysis of such data, it is impossible to know for sure whether the behavior is driven by the preferences of mutual fund managers or by how they perceive their public disclosures will be interpreted. Regardless of the specific underlying cause of the behavior, these investors are exhibiting similar patterns to that of the individual investors trading their own accounts.12 It is true that investors as a whole cannot increase their exposure to the stock without the firm issuing more shares. However, if some investors desire to increase their exposure and push up the price, other investors may be expected to sell in response to the lower expected returns. We examine whether mutual funds or institutions are on net increasing their exposure during such periods.13 The positive and significant constant coefficient is consistent with the finding of positive returns on the payment date found in Berkman and Koch (2016). They find the results are driven by dividend reinvestment plans which have caps on reinvestment amount which effectively excludes most mutual funds and institutions.
ReferencesAn, Li, and Bronson Argyle, 2015, V-shaped disposition: Mutual fund trading behavior and price effects.
Baker, Malcolm, Brock Mendel, and Jeffrey Wurgler, 2016, Dividends as reference points: A behavioral signaling approach, Review of Financial Studies 29, 697-738.
Baker, Malcolm, Stefan Nagel, and Jeffrey Wurgler, 2007, The effect of dividends on consumption, Brookings Papers on Economic Activity 231-292.
Baker, Malcolm, and Jeffrey Wurgler, 2004a, Appearing and disappearing dividends: The link to catering incentives, Journal of Financial Economics 73, 271-288.
Baker, Malcolm, and Jeffrey Wurgler, 204b, A catering theory of dividends, Journal of Finance 59, 1125-1165.
Baker, Malcolm, and Jeffrey Wurgler, 2012, Comovement and predictability relationships between bonds and the cross-section of stocks, Review of Asset Pricing Studies 2, 57-87.
Barber, Brad M, and Terrance Odean, 2000, Trading is hazardous to your wealth: The common stock investment performance of individual investors, The Journal of Finance 55, 773-806.
Becker, Bo, Zoran Ivkovi¢, and Scott Weisbenner, 2011, Local dividend clienteles, The Journal of Finance 66, 655-683.

BRANDES.COM/INSTITUTE
THE DIVIDEND DISCONNECT / PAGE 19
Ben-David, Itzhak, and David Hirshleifer, 2012, Are investors really reluctant to realize their losses? Trading responses to past returns and the disposition effect, Review of Financial Studies 25, 2485-2532.
Berkman, Henk, and Paul D Koch, 2016, Drips and the dividend pay date effect, Journal of Financial and Quantitative Analysis (Forthcoming).
Bordalo, Pedro, Nicola Gennaioli, and Andrei Shleifer, 2012, Salience theory of choice under risk, The Quarterly Journal of Economics qjs018.
Bordalo, Pedro, Nicola Gennaioli, and Andrei Shleifer, 2015, Competition for attention, The Review of Economic Studies rdv048.
Celerier, Claire, and Boris Vallée, 2016, Catering to investors through security design: Headline rate and complexity, Quarterly Journal of Economics (Forthcoming).
Chang, Tom Y, David H Solomon, and Mark MWesterfield, 2016, Looking for someone to blame: Delegation, cognitive dissonance, and the disposition effect, The Journal of Finance 71, 267-302.
Cici, Gjergji, 2012, The prevalence of the disposition effect in mutual funds trades, Journal of Financial and Quantitative Analysis 47, 795-820.
Da, Zhi, Borja Larrain, Clemens Sialm, and Jose Tessada, 2014, Price pressure from coordinated noise trading: Evidence from pension fund reallocations, Working Paper.
Ellison, Glenn, and Sara Fisher Ellison, 2009, Search, obfuscation, and price elasticities on the internet, Econometrica 77, 427-452.
Elton, Edwin J, and Martin J Gruber, 1970, Marginal stockholder tax rates and the clientele effect, The Review of Economics and Statistics 68-74.
Feng, Lei, and Mark S Seasholes, 2005, Do investor sophistication and trading experience eliminate behavioral biases in financial markets? Review of Finance 9, 305-351.
Frazzini, Andrea, 2006, The disposition effect and underreaction to news, The Journal of Finance 61, 2017-2046.
Frydman, Cary, Samuel M Hartzmark, and David H Solomon, 2015, Rolling mental accounts, Review of Financial Studies (Forthcoming.)
Genesove, David, and Christopher Mayer, 2001, Loss aversion and seller behavior: Evidence from the housing market, Quarterly Journal of Economics 1233-1260.
Graham, John R, and Alok Kumar, 2006, Do dividend clienteles exist? Evidence on dividend preferences of retail investors, Journal of Finance 61, 1305-1336.
Greenwood, Robin, and Andrei Shleifer, 2014, Expectations of returns and expected returns, Review of Financial Studies 27, 714-746.
Grinblatt, Mark, and Matti Keloharju, 2001, What makes investors trade? The Journal of Finance 56, 589-616.
Harris, Lawrence E, Samuel M Hartzmark, and David H Solomon, 2015, Juicing the dividend yield: Mutual funds and the demand for dividends, Journal of Financial Economics 116, 433-451.
Hartzmark, Samuel M., 2015, The worst, the best, ignoring all the rest: The rank effect and trading behavior, Review of Financial Studies 28, 1024-1059.
Hartzmark, Samuel M, and David H Solomon, 2012, Efficiency and the disposition effect in nfl prediction markets, The Quarterly Journal of Finance 2, 1250013.
Hartzmark, Samuel M, and David H Solomon, 2013, The dividend month premium, Journal of Financial Economics 109, 640-660.
Heath, Chip, Steven Huddart, and Mark Lang, 1999, Psychological factors and stock option exercise, Quarterly Journal of Economics 601-627.
Jiang, Hao, and Zheng Sun, 2016, Equity duration: A puzzle on high dividend stocks, Working Paper.
Kaustia, Markku, and Elias Rantapuska, 2012, Rational and behavioral motives to trade: Evidence from reinvestment of dividends and tender offer proceeds, Journal of Banking & Finance 36, 2366-2378.
Locke, Peter R, and Steven C Mann, 2005, Professional trader discipline and trade disposition, Journal of Financial Economics 76, 401-444.
Miller, Merton H, and Franco Modigliani, 1961, Dividend policy, growth, and the valuation of shares, The Journal of Business 34, 411-433.
Odean, Terrance, 1998, Are investors reluctant to realize their losses? The Journal of Finance 53, 1775-1798.
Read, Daniel, George Loewenstein, Matthew Rabin, Gideon Keren, and David Laibson, 1999, Choice bracketing, in Elicitation of Preferences, 171-202 (Springer).
Shefrin, Hersh, and Meir Statman, 1985, The disposition to sell winners too early and ride losers too long: Theory and evidence, The Journal of Finance 40, 777-790.
Shefrin, Hersh M, and Meir Statman, 1984, Explaining investor preference for cash dividends, Journal of Financial economics 13, 253-282.
Shleifer, Andrei, 1986, Do demand curves for stocks slope down? The Journal of Finance 41, 579-590.
Thaler, Richard, 1980, Toward a positive theory of consumer choice, Journal of Economic Behavior & Organization 1, 39-60.

THE DIVIDEND DISCONNECT / PAGE 20
BRANDES.COM/INSTITUTE
Thaler, Richard H, 1999, Mental accounting matters, Journal of Behavioral Decision Making 12, 183.
Thaler, Richard H, and Eric J Johnson, 1990, Gambling with the house money and trying to break even: The effects of prior outcomes on risky choice, Management science 36, 643-660.
Tversky, Amos, and Daniel Kahneman, 1985, The framing of decisions and the psychology of choice, in Environmental Impact Assessment, Technology Assessment, and Risk Analysis, 107-129 (Springer).
Welch, Ivo, 2016, A quasi-experimental test of the risk-reward paradigm, Working Paper.