Removal of lead from contaminated water bodies using sea nodule as an adsorbent
13
Water Research 37 (2003) 3954–3966 Removal of lead from contaminated water bodies using sea nodule as an adsorbent S. Bhattacharjee*, S. Chakrabarty, S. Maity, S. Kar, P. Thakur, G. Bhattacharyya Analytical Chemistry Division, National Metallurgical Laboratory, C.S.I.R, Jamshedpur 831007, India Received 17 May 2002; received in revised form 3 April 2003; accepted 7 May 2003 Abstract Adsorption of water soluble lead on polymetallic sea nodule has been studied in detail. Complete decontamination of lead is possible by appropriate sea nodule dosing. Adsorption is also dependent on pH and best adsorption is achieved at pH 6. Beyond pH 6, the desorption of lead from sea nodule surface is practically zero. Residual metal concentrations in the filtrate after adsorption is negligible. Both Freundlich and Langmuir isotherms may reasonably explain adsorption of lead on sea nodule. Chemically bound moisture plays a very crucial role in lead adsorption. Lead adsorptive capability of sea nodule is practically destroyed when calcined at a temperature of 900 C. Lead loading capacity of sea nodule has been estimated at 440 mg of lead per gram of sea nodule. The performance of sea nodule as a lead adsorbent has been successfully tested over six simulated lead contaminated water systems. Lead loading capacity of sea nodule compares favorably with other adsorbents like activated carbon, ion exchange resin, anionic clay, granulated blast furnace slag and natural and treated zeolites. r 2003 Elsevier Ltd. All rights reserved. Keywords: Adsorption; Lead; Sea nodule; Chemically bound moisture; pH ZPC 1. Introduction Lead is a recognized environmental pollutant that acts as a cumulative poison. Inorganic Pb 2+ is an enzyme inhibitor, which also affects the nervous system. The major environmental sources of metallic lead and its salts and oxides are paints and pigments, battery industries, lead smelters, etc. Once mobile in the environment in ionic form, like many other toxic elements it finds its way into the human body through drinking water, food and air. Limit values of lead in drinking water and surface water intended for drinking, as set by EU, USEPA and WHO, are 10, 50 and 10 mg/l, respectively [1]. However, more recently an EPA document prescribes a zero lead value in national primary drinking water standard [2]. In India, limit value of lead in drinking water is 0.01 mg/l [3]. Removal of lead from contaminated water bodies has been attempted by several researchers employing a wide variety of techniques. Majority of these are adsorption on various surfaces like activated carbon [4–6], peat [7], goethite mineral [8], hydrated iron and aluminium oxide [9], granular iron oxide [10], synthetic anionic clay [11], biopolymers [12], industrial wastes like red mud [13], granulated blast furnace slag [14], naturally occurring and treated zeolites [15] and coral sand [16]. Other lead removal techniques include hydrocerrusite precipitation [17], precipitation with sodium di-(n-octyl) phosphinate [18], precipitation with recycled alum sludge [19], ion exchange [20], electrokinetic decontamination [21] and use of microorganism [22]. Polymetallic sea nodule is an exotic naturally occur- ring mineral found in the large stretches of Pacific, Atlantic and Indian Ocean. This mineral has been viewed by many as the future reserve for Cu, Co and Ni. ARTICLE IN PRESS *Corresponding author. Tel.: +91-657-271-709-14; fax: +91-657-270-527. E-mail address: [email protected], [email protected] (S. Bhattacharjee). 0043-1354/03/$ - see front matter r 2003 Elsevier Ltd. All rights reserved. doi:10.1016/S0043-1354(03)00315-4
-
Upload
independent -
Category
Documents
-
view
3 -
download
0
Transcript of Removal of lead from contaminated water bodies using sea nodule as an adsorbent
Water Research 37 (2003) 3954–3966
Removal of lead from contaminated water bodies using seanodule as an adsorbent
S. Bhattacharjee*, S. Chakrabarty, S. Maity, S. Kar, P. Thakur, G. Bhattacharyya
Analytical Chemistry Division, National Metallurgical Laboratory, C.S.I.R, Jamshedpur 831007, India
Received 17 May 2002; received in revised form 3 April 2003; accepted 7 May 2003
Abstract
Adsorption of water soluble lead on polymetallic sea nodule has been studied in detail. Complete decontamination of
lead is possible by appropriate sea nodule dosing. Adsorption is also dependent on pH and best adsorption is achieved
at pH 6. Beyond pH 6, the desorption of lead from sea nodule surface is practically zero. Residual metal concentrations
in the filtrate after adsorption is negligible. Both Freundlich and Langmuir isotherms may reasonably explain
adsorption of lead on sea nodule. Chemically bound moisture plays a very crucial role in lead adsorption. Lead
adsorptive capability of sea nodule is practically destroyed when calcined at a temperature of 900�C. Lead loading
capacity of sea nodule has been estimated at 440mg of lead per gram of sea nodule. The performance of sea nodule as a
lead adsorbent has been successfully tested over six simulated lead contaminated water systems. Lead loading capacity
of sea nodule compares favorably with other adsorbents like activated carbon, ion exchange resin, anionic clay,
granulated blast furnace slag and natural and treated zeolites.
r 2003 Elsevier Ltd. All rights reserved.
Keywords: Adsorption; Lead; Sea nodule; Chemically bound moisture; pHZPC
1. Introduction
Lead is a recognized environmental pollutant that acts
as a cumulative poison. Inorganic Pb2+ is an enzyme
inhibitor, which also affects the nervous system. The
major environmental sources of metallic lead and its
salts and oxides are paints and pigments, battery
industries, lead smelters, etc. Once mobile in the
environment in ionic form, like many other toxic
elements it finds its way into the human body through
drinking water, food and air. Limit values of lead in
drinking water and surface water intended for drinking,
as set by EU, USEPA and WHO, are 10, 50 and 10 mg/l,respectively [1]. However, more recently an EPA
document prescribes a zero lead value in national
primary drinking water standard [2]. In India, limit
value of lead in drinking water is 0.01mg/l [3].
Removal of lead from contaminated water bodies has
been attempted by several researchers employing a wide
variety of techniques. Majority of these are adsorption
on various surfaces like activated carbon [4–6], peat [7],
goethite mineral [8], hydrated iron and aluminium oxide
[9], granular iron oxide [10], synthetic anionic clay [11],
biopolymers [12], industrial wastes like red mud [13],
granulated blast furnace slag [14], naturally occurring
and treated zeolites [15] and coral sand [16]. Other lead
removal techniques include hydrocerrusite precipitation
[17], precipitation with sodium di-(n-octyl) phosphinate
[18], precipitation with recycled alum sludge [19], ion
exchange [20], electrokinetic decontamination [21] and
use of microorganism [22].
Polymetallic sea nodule is an exotic naturally occur-
ring mineral found in the large stretches of Pacific,
Atlantic and Indian Ocean. This mineral has been
viewed by many as the future reserve for Cu, Co and Ni.
ARTICLE IN PRESS
*Corresponding author. Tel.: +91-657-271-709-14; fax:
+91-657-270-527.
E-mail address: [email protected],
[email protected] (S. Bhattacharjee).
0043-1354/03/$ - see front matter r 2003 Elsevier Ltd. All rights reserved.
doi:10.1016/S0043-1354(03)00315-4

Our laboratory studies revealed that sea nodule is a
good adsorbent for a number of cations and anions. A
systematic study has been reported in the present
communication in which removal of lead from con-
taminated water bodies has been looked into using
polymetallic sea nodule as adsorbent. The objective of
the present study was to generate basic data on the
adsorptive capability of sea nodule with reference to
lead in aqueous medium.
2. Experimental
2.1. Adsorbent
Sea nodule used in the present study was collected
from the Non-Ferrous Processing Division of National
Metallurgical Laboratory, Jamshedpur. The material
was powdered and washed with de-ionised water to
remove foreign materials, dusts and fines.
2.2. Instrumental
JEOL JSM 840 A Scanning Electron Microscope with
CAVEX 8000 EDS was used for identifying the material
matrix. Trace elemental analyses such as Fe, Mn, Cu,
Co and Ni were carried out with GBC, Avanta atomic
absorption spectrometer (AAS). Silica, manganese and
iron were analysed by conventional wet chemical
methods [23–25]. Lead was analysed by GBC Avanta
atomic absorption spectrometer; detection limit of Pb in
flame AAS is 10 ppb [26]. X-ray diffractograms were
taken in a Siemens D-500 X-ray Diffractometer.
2.3. Reagents
The reagents used were all of analytical grade. Stock
lead solution (1000mg/l) for adsorption study was
always prepared fresh from AR grade lead nitrate
[Pb(NO3)2]. 18MO ASTM Grade 1 water was used for
making the solutions. AAS was calibrated with lead
standards prepared from Johnson Mathey specpure
lead.
2.4. Batch adsorption experiments
All adsorption experiments were carried out in
batches. A 100ml of synthetic Pb solution of predeter-
mined concentration was taken in a 250ml stoppered
conical flask. A quantity of adsorbent with a particular
particle size was added to this solution and shaken in a
mechanical shaker for a definite period of time.
Adsorption parameters, namely, adsorbent dose, parti-
cle size, shaking time, etc., were optimized by the
method of continuous variation. For optimization,
adsorbent dose was varied between 0 and 1 g, particle
size between 75 and 250 mm and shaking time between 0
and 300min. After shaking, the solution was allowed to
settle for 1 h, filtered and analysed for lead. The
difference in the lead content before and after adsorp-
tion represented the amount of Pb adsorbed by sea
nodule.
2.5. Optimization of adsorption parameters
Adsorption dose, particle size and shaking time were
optimized for maximum adsorption by the method of
continuous variation following batch adsorption experi-
ments mentioned above. Optimum adsorbent dose and
particle size were found to be 0.2 g and 75 mm,
respectively, for 100ml of 206 ppm lead solution. For
all practical purpose equilibrium was reached within
30min. In all subsequent experiments, unless otherwise
stated, shaking time was set at 30min.
2.6. Experiments for studying adsorption kinetics
For adsorption kinetics a different set of experiments
was carried out in which 100ml of 226.8 ppm Pb
solution was adsorbed on 0.05 g of sea nodule with a
particle size of 75mm over a time period of 0–300min
following the procedure outlined in Section 2.4.
3. Results and discussion
3.1. Characterization of sea nodule
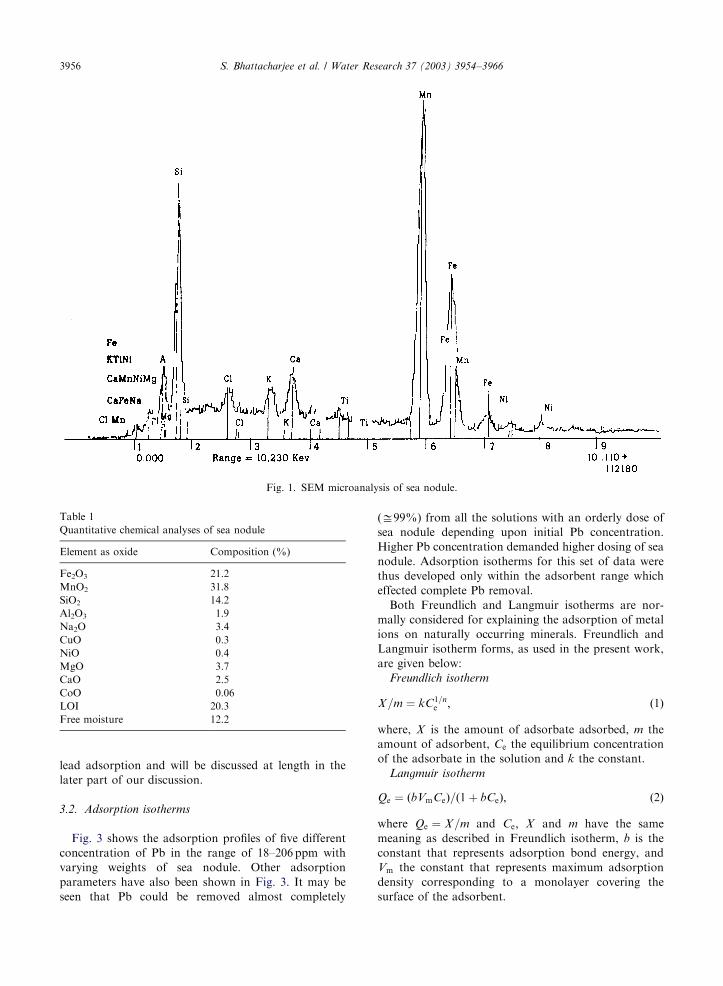
Fig. 1 shows the EDX microanalysis of sea nodule. It
is evident from Fig. 1 that the major constituents of sea
nodule are Mn, Fe and Si with traces of Ni, Ca, K and
Mg. The SEM data are further augmented with
complete quantitative chemical analyses of constituent
metals, which are given in Table 1 as oxides.
To ascertain the mineral phases present in the sea
nodule matrix, it was subjected to XRD analysis. The
diffractogram has been shown in Fig. 2. It may be seen
that there are only two discernible peaks which
correspond to silica (d ¼ 3:34) and a shifted b-MnO2
(d ¼ 3:18) phase. In addition to these two, one may also
observe three broad bands around d-spacings of 4.85,
2.45 and 1.42, which could not be identified with any
particular phase but in all likelihood were due to some
hydrated oxides of Fe and Mn as will be seen being
vindicated in the later part of our discussion. It is,
however, apparent from the diffractogram that the
compounds of Fe and Mn present in sea nodule were
primarily non-crystalline in nature.
Sea nodule is extremely hygroscopic in nature. The
loss on ignition (LOI) in sea nodule was found to be
20.3% of which 12.2% was free moisture. Chemically
bound moisture in sea nodule plays a significant role in
ARTICLE IN PRESSS. Bhattacharjee et al. / Water Research 37 (2003) 3954–3966 3955
lead adsorption and will be discussed at length in the
later part of our discussion.
3.2. Adsorption isotherms
Fig. 3 shows the adsorption profiles of five different
concentration of Pb in the range of 18–206 ppm with
varying weights of sea nodule. Other adsorption
parameters have also been shown in Fig. 3. It may be
seen that Pb could be removed almost completely
(D99%) from all the solutions with an orderly dose of
sea nodule depending upon initial Pb concentration.
Higher Pb concentration demanded higher dosing of sea
nodule. Adsorption isotherms for this set of data were
thus developed only within the adsorbent range which
effected complete Pb removal.
Both Freundlich and Langmuir isotherms are nor-
mally considered for explaining the adsorption of metal
ions on naturally occurring minerals. Freundlich and
Langmuir isotherm forms, as used in the present work,
are given below:
Freundlich isotherm
X=m ¼ kC1=ne ; ð1Þ
where, X is the amount of adsorbate adsorbed, m the
amount of adsorbent, Ce the equilibrium concentration
of the adsorbate in the solution and k the constant.
Langmuir isotherm
Qe ¼ ðbVmCeÞ=ð1þ bCeÞ; ð2Þ
where Qe ¼ X=m and Ce; X and m have the same
meaning as described in Freundlich isotherm, b is the
constant that represents adsorption bond energy, and
Vm the constant that represents maximum adsorption
density corresponding to a monolayer covering the
surface of the adsorbent.
ARTICLE IN PRESS
Fig. 1. SEM microanalysis of sea nodule.
Table 1
Quantitative chemical analyses of sea nodule
Element as oxide Composition (%)
Fe2O3 21.2
MnO2 31.8
SiO2 14.2
Al2O3 1.9
Na2O 3.4
CuO 0.3
NiO 0.4
MgO 3.7
CaO 2.5
CoO 0.06
LOI 20.3
Free moisture 12.2
S. Bhattacharjee et al. / Water Research 37 (2003) 3954–39663956

Data presented in Fig. 3 were fit into both Freundlich
and Langmuir forms separately using robust techniques.
n; k; b and Vm values for each curve were calculated and
they have been listed in Table 2 along with goodness of
the fit. It is evident from Table 2 that adsorption
isotherms vary with initial lead concentrations. This
point has been addressed in greater detail in the later
part of our discussion.
It is pertinent to mention at this stage that Freundlich
isotherm is essentially an empirical relationship without
a firm theoretical basis. Langmuir isotherm as applied to
the adsorption of solutes on solid surface is also an
extension of its original derivation. Presence of more
than one mineral phase in sea nodule complicates the
situation further. Also, adsorption energy in Langmuir
approach is considered constant over the entire range of
ARTICLE IN PRESS
Fig. 2. X-ray diffractogram of sea nodule.
Table 2
Freundlich and Langmuir isotherm constants at different lead concentration
Initial Pb conc., C0 (ppm) Freundlich Langmuir
k n r2 Vm (mgg�1) b (mlmg�1) r2a
206 133.9 5.4 0.8714 323.8 0.7 0.8629
192 249.6 9.8 0.9803 390 14.8 0.825
135 279.0 8.1 0.9861 467.3 2.5 0.9109
88 228.1 3.0 0.9420 574.0 1.6 0.8654
46 262.5 14.3 0.7621 332.9 10.6 0.8026
aGoodness of fit between ðX=mÞcalculated and ðX=mÞ:
0
50
100
150
200
250
0 0.05 0.1 0.15 0.2
Weight of sea nodule (g)
Pb
co
nce
ntr
atio
n, p
pm
18 ppm 46 ppm 88 ppm 135 ppm 192 ppm 206 ppm
Particle size : 75 micronsVolume : 100 mlShaking time : 30 min
Fig. 3. Pb adsorption profile of sea nodule.
S. Bhattacharjee et al. / Water Research 37 (2003) 3954–3966 3957
adsorption, which invariably is not true for soils and
similar adsorbents like naturally occurring minerals [27].
In spite of these limitations, reasonable success achieved
with Freundlich and Langmuir forms make them
popular choice for explaining sorption experimental
data.
3.3. Adsorption kinetics
The Lagergren first-order rate equation [28], as
applied by Ho and Mckay [7], was used to explain the
adsorption kinetics of lead on sea nodule. The Lagerg-
ren form may be written as
log ðqp � qtÞ ¼ log ðqpÞ � ðk=2:303Þt; ð3Þ
where qp is the amount of adsorbate adsorbed per unit
weight of the adsorbent at equilibrium (t ¼ p), qt the
amount of adsorbate per unit weight of adsorbent at
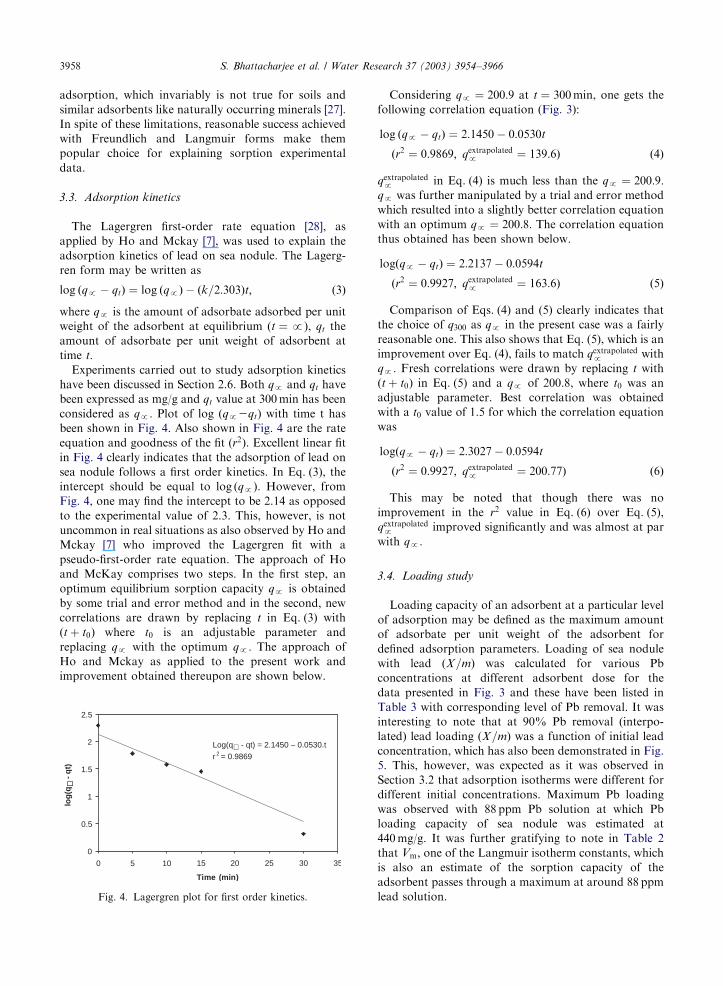
time t:Experiments carried out to study adsorption kinetics
have been discussed in Section 2.6. Both qp and qt have
been expressed as mg/g and qt value at 300min has been
considered as qp: Plot of log (qp2qt) with time t has
been shown in Fig. 4. Also shown in Fig. 4 are the rate
equation and goodness of the fit (r2). Excellent linear fit
in Fig. 4 clearly indicates that the adsorption of lead on
sea nodule follows a first order kinetics. In Eq. (3), the
intercept should be equal to log (qp). However, from
Fig. 4, one may find the intercept to be 2.14 as opposed
to the experimental value of 2.3. This, however, is not
uncommon in real situations as also observed by Ho and
Mckay [7] who improved the Lagergren fit with a
pseudo-first-order rate equation. The approach of Ho
and McKay comprises two steps. In the first step, an
optimum equilibrium sorption capacity qp is obtained
by some trial and error method and in the second, new
correlations are drawn by replacing t in Eq. (3) with
(t þ t0) where t0 is an adjustable parameter and
replacing qp with the optimum qp: The approach of
Ho and Mckay as applied to the present work and
improvement obtained thereupon are shown below.
Considering qp ¼ 200:9 at t ¼ 300min, one gets the
following correlation equation (Fig. 3):
log ðqp � qtÞ ¼ 2:1450� 0:0530t
ðr2 ¼ 0:9869; qextrapolatedp
¼ 139:6Þ ð4Þ
qextrapolatedp
in Eq. (4) is much less than the qp ¼ 200:9:qp was further manipulated by a trial and error method
which resulted into a slightly better correlation equation
with an optimum qp ¼ 200:8: The correlation equation
thus obtained has been shown below.
logðqp � qtÞ ¼ 2:2137� 0:0594t
ðr2 ¼ 0:9927; qextrapolatedp
¼ 163:6Þ ð5Þ
Comparison of Eqs. (4) and (5) clearly indicates that
the choice of q300 as qp in the present case was a fairly
reasonable one. This also shows that Eq. (5), which is an
improvement over Eq. (4), fails to match qextrapolatedp
with
qp: Fresh correlations were drawn by replacing t with
(t þ t0) in Eq. (5) and a qp of 200.8, where t0 was an
adjustable parameter. Best correlation was obtained
with a t0 value of 1.5 for which the correlation equation
was
logðqp � qtÞ ¼ 2:3027� 0:0594t
ðr2 ¼ 0:9927; qextrapolatedp
¼ 200:77Þ ð6Þ
This may be noted that though there was no
improvement in the r2 value in Eq. (6) over Eq. (5),
qextrapolatedp
improved significantly and was almost at par
with qp:
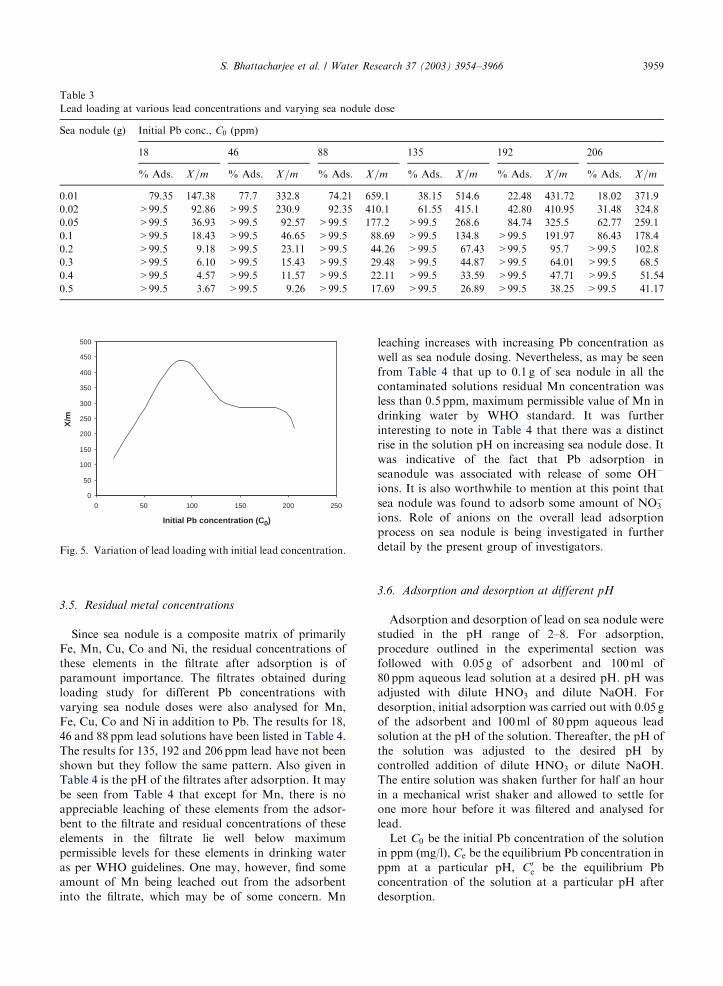
3.4. Loading study
Loading capacity of an adsorbent at a particular level
of adsorption may be defined as the maximum amount
of adsorbate per unit weight of the adsorbent for
defined adsorption parameters. Loading of sea nodule
with lead (X=m) was calculated for various Pb
concentrations at different adsorbent dose for the
data presented in Fig. 3 and these have been listed in
Table 3 with corresponding level of Pb removal. It was
interesting to note that at 90% Pb removal (interpo-
lated) lead loading (X=m) was a function of initial lead
concentration, which has also been demonstrated in Fig.
5. This, however, was expected as it was observed in
Section 3.2 that adsorption isotherms were different for
different initial concentrations. Maximum Pb loading
was observed with 88 ppm Pb solution at which Pb
loading capacity of sea nodule was estimated at
440mg/g. It was further gratifying to note in Table 2
that Vm; one of the Langmuir isotherm constants, which
is also an estimate of the sorption capacity of the
adsorbent passes through a maximum at around 88 ppm
lead solution.
ARTICLE IN PRESS
0
0.5
1
1.5
2
2.5
0 5 10 15 20 25 30 35
Time (min)
log
(q∝
- q
t)
Log(q∝ - qt) = 2.1450 – 0.0530.t
r 2 = 0.9869
Fig. 4. Lagergren plot for first order kinetics.
S. Bhattacharjee et al. / Water Research 37 (2003) 3954–39663958
3.5. Residual metal concentrations
Since sea nodule is a composite matrix of primarily
Fe, Mn, Cu, Co and Ni, the residual concentrations of
these elements in the filtrate after adsorption is of
paramount importance. The filtrates obtained during
loading study for different Pb concentrations with
varying sea nodule doses were also analysed for Mn,
Fe, Cu, Co and Ni in addition to Pb. The results for 18,
46 and 88 ppm lead solutions have been listed in Table 4.
The results for 135, 192 and 206 ppm lead have not been
shown but they follow the same pattern. Also given in
Table 4 is the pH of the filtrates after adsorption. It may
be seen from Table 4 that except for Mn, there is no
appreciable leaching of these elements from the adsor-
bent to the filtrate and residual concentrations of these
elements in the filtrate lie well below maximum
permissible levels for these elements in drinking water
as per WHO guidelines. One may, however, find some
amount of Mn being leached out from the adsorbent
into the filtrate, which may be of some concern. Mn
leaching increases with increasing Pb concentration as
well as sea nodule dosing. Nevertheless, as may be seen
from Table 4 that up to 0.1 g of sea nodule in all the
contaminated solutions residual Mn concentration was
less than 0.5 ppm, maximum permissible value of Mn in
drinking water by WHO standard. It was further
interesting to note in Table 4 that there was a distinct
rise in the solution pH on increasing sea nodule dose. It
was indicative of the fact that Pb adsorption in
seanodule was associated with release of some OH�
ions. It is also worthwhile to mention at this point that
sea nodule was found to adsorb some amount of NO3�
ions. Role of anions on the overall lead adsorption
process on sea nodule is being investigated in further
detail by the present group of investigators.
3.6. Adsorption and desorption at different pH
Adsorption and desorption of lead on sea nodule were
studied in the pH range of 2–8. For adsorption,
procedure outlined in the experimental section was
followed with 0.05 g of adsorbent and 100ml of
80 ppm aqueous lead solution at a desired pH. pH was
adjusted with dilute HNO3 and dilute NaOH. For
desorption, initial adsorption was carried out with 0.05 g
of the adsorbent and 100ml of 80 ppm aqueous lead
solution at the pH of the solution. Thereafter, the pH of
the solution was adjusted to the desired pH by
controlled addition of dilute HNO3 or dilute NaOH.
The entire solution was shaken further for half an hour
in a mechanical wrist shaker and allowed to settle for
one more hour before it was filtered and analysed for
lead.
Let C0 be the initial Pb concentration of the solution
in ppm (mg/l), Ce be the equilibrium Pb concentration in
ppm at a particular pH, C0e be the equilibrium Pb
concentration of the solution at a particular pH after
desorption.
ARTICLE IN PRESS
Table 3
Lead loading at various lead concentrations and varying sea nodule dose
Sea nodule (g) Initial Pb conc., C0 (ppm)
18 46 88 135 192 206
% Ads. X=m % Ads. X=m % Ads. X=m % Ads. X=m % Ads. X=m % Ads. X=m
0.01 79.35 147.38 77.7 332.8 74.21 659.1 38.15 514.6 22.48 431.72 18.02 371.9
0.02 >99.5 92.86 >99.5 230.9 92.35 410.1 61.55 415.1 42.80 410.95 31.48 324.8
0.05 >99.5 36.93 >99.5 92.57 >99.5 177.2 >99.5 268.6 84.74 325.5 62.77 259.1
0.1 >99.5 18.43 >99.5 46.65 >99.5 88.69 >99.5 134.8 >99.5 191.97 86.43 178.4
0.2 >99.5 9.18 >99.5 23.11 >99.5 44.26 >99.5 67.43 >99.5 95.7 >99.5 102.8
0.3 >99.5 6.10 >99.5 15.43 >99.5 29.48 >99.5 44.87 >99.5 64.01 >99.5 68.5
0.4 >99.5 4.57 >99.5 11.57 >99.5 22.11 >99.5 33.59 >99.5 47.71 >99.5 51.54
0.5 >99.5 3.67 >99.5 9.26 >99.5 17.69 >99.5 26.89 >99.5 38.25 >99.5 41.17
0
50
100
150
200
250
300
350
400
450
500
0 50 100 150 200 250
Initial Pb concentration (C0)
X/m
Fig. 5. Variation of lead loading with initial lead concentration.
S. Bhattacharjee et al. / Water Research 37 (2003) 3954–3966 3959
Then
ðC0 � CeÞ=10
¼ Amount of Pb adsorbed in mg ðfor 100 mlÞ; ð7Þ
ðC0e � CeÞ=10
¼ Amount of Pb desorbed in mg ðfor 100 mlÞ: ð8Þ
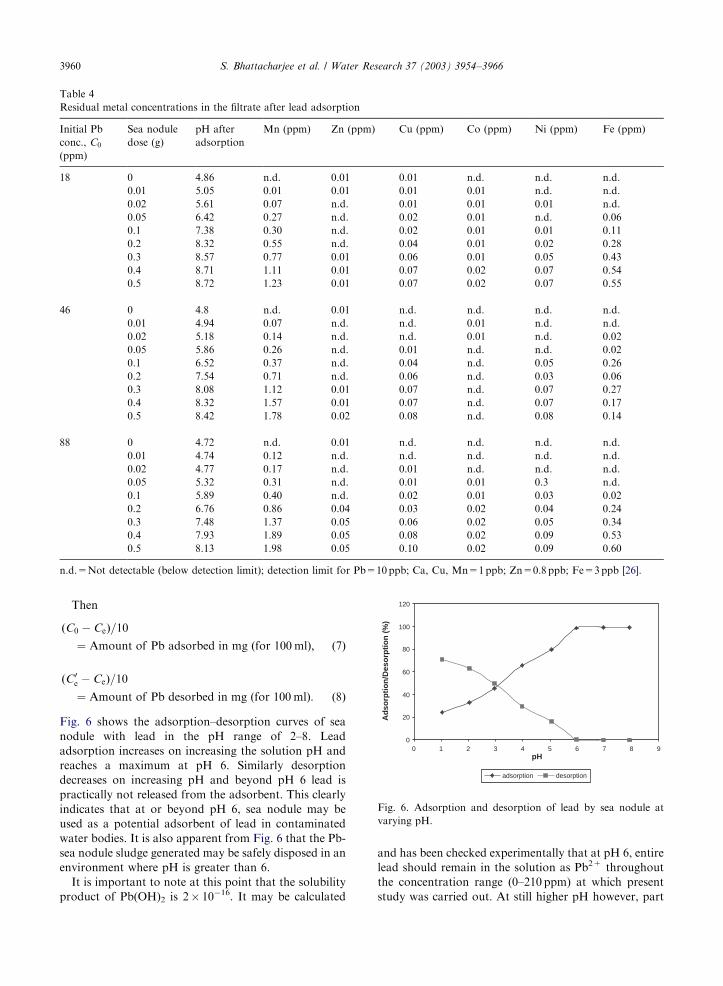
Fig. 6 shows the adsorption–desorption curves of sea
nodule with lead in the pH range of 2–8. Lead
adsorption increases on increasing the solution pH and
reaches a maximum at pH 6. Similarly desorption
decreases on increasing pH and beyond pH 6 lead is
practically not released from the adsorbent. This clearly
indicates that at or beyond pH 6, sea nodule may be
used as a potential adsorbent of lead in contaminated
water bodies. It is also apparent from Fig. 6 that the Pb-
sea nodule sludge generated may be safely disposed in an
environment where pH is greater than 6.
It is important to note at this point that the solubility
product of Pb(OH)2 is 2� 10�16. It may be calculated
and has been checked experimentally that at pH 6, entire
lead should remain in the solution as Pb2+ throughout
the concentration range (0–210 ppm) at which present
study was carried out. At still higher pH however, part
ARTICLE IN PRESS
Table 4
Residual metal concentrations in the filtrate after lead adsorption
Initial Pb
conc., C0
(ppm)
Sea nodule
dose (g)
pH after
adsorption
Mn (ppm) Zn (ppm) Cu (ppm) Co (ppm) Ni (ppm) Fe (ppm)
18 0 4.86 n.d. 0.01 0.01 n.d. n.d. n.d.
0.01 5.05 0.01 0.01 0.01 0.01 n.d. n.d.
0.02 5.61 0.07 n.d. 0.01 0.01 0.01 n.d.
0.05 6.42 0.27 n.d. 0.02 0.01 n.d. 0.06
0.1 7.38 0.30 n.d. 0.02 0.01 0.01 0.11
0.2 8.32 0.55 n.d. 0.04 0.01 0.02 0.28
0.3 8.57 0.77 0.01 0.06 0.01 0.05 0.43
0.4 8.71 1.11 0.01 0.07 0.02 0.07 0.54
0.5 8.72 1.23 0.01 0.07 0.02 0.07 0.55
46 0 4.8 n.d. 0.01 n.d. n.d. n.d. n.d.
0.01 4.94 0.07 n.d. n.d. 0.01 n.d. n.d.
0.02 5.18 0.14 n.d. n.d. 0.01 n.d. 0.02
0.05 5.86 0.26 n.d. 0.01 n.d. n.d. 0.02
0.1 6.52 0.37 n.d. 0.04 n.d. 0.05 0.26
0.2 7.54 0.71 n.d. 0.06 n.d. 0.03 0.06
0.3 8.08 1.12 0.01 0.07 n.d. 0.07 0.27
0.4 8.32 1.57 0.01 0.07 n.d. 0.07 0.17
0.5 8.42 1.78 0.02 0.08 n.d. 0.08 0.14
88 0 4.72 n.d. 0.01 n.d. n.d. n.d. n.d.
0.01 4.74 0.12 n.d. n.d. n.d. n.d. n.d.
0.02 4.77 0.17 n.d. 0.01 n.d. n.d. n.d.
0.05 5.32 0.31 n.d. 0.01 0.01 0.3 n.d.
0.1 5.89 0.40 n.d. 0.02 0.01 0.03 0.02
0.2 6.76 0.86 0.04 0.03 0.02 0.04 0.24
0.3 7.48 1.37 0.05 0.06 0.02 0.05 0.34
0.4 7.93 1.89 0.05 0.08 0.02 0.09 0.53
0.5 8.13 1.98 0.05 0.10 0.02 0.09 0.60
n.d.=Not detectable (below detection limit); detection limit for Pb=10ppb; Ca, Cu, Mn=1ppb; Zn=0.8 ppb; Fe=3ppb [26].
0
20
40
60
80
100
120
0 51 62 73 84 9pH
Ad
sorp
tio
n/D
eso
rpti
on
(%
)
adsorption desorption
Fig. 6. Adsorption and desorption of lead by sea nodule at
varying pH.
S. Bhattacharjee et al. / Water Research 37 (2003) 3954–39663960
of the lead may precipitate out as Pb(OH)2 which also
depends upon lead concentration. Since maximum
adsorption was achieved at a pH of 6, It may be safely
stated that lead removal at or below pH 6 was by the
process of adsorption and not precipitation.
It was even more interesting to note that Pb(OH)2 at a
still higher pH goes into the solution as plumbite anion,
PbO22�. It was most gratifying to note that sea nodule
was also a good adsorbent for PbO2�. The ramifications
for this observation are enormous and calls for a
complete investigations which has already been taken
up by the present group of investigators. The role of
OH� and other anions on the lead adsorption is being
investigated giving due consideration to material bal-
ance as well as electro-neutrality in the solution.
Residual elements like Fe, Co, Cu, Ni and Mn were also
analysed in the filtrate obtained from adsorption and
desorption experiments. It was noted with satisfaction that
concentrations of these elements in the filtrate beyond pH
6 were well below the maximum permissible levels of these
elements in drinking water as per WHO guidelines.
3.7. Adsorbent regeneration/sludge disposal
In a wastewater treatment that uses adsorption,
regeneration of the adsorbent and/or disposal of the
sludge is crucially important. Attempts were made to
regenerate the spent sea nodule by stripping of the lead
from sea nodule surface using different concentrations
of acetic acid and potassium iodide. Potassium iodide
failed and only partial success was achieved with acetic
acid which also was much short of desired level.
It has already been mentioned that removal of Pb2+
from solution using sea nodule as adsorbent follows two
pathways. At lower pH it is adsorption of Pb2+ ions
over solid surface and at higher pH, it is partially
adsorption and partially precipitation as Pb(OH)2. The
fine particles of Pb(OH)2 have a tendency to settle over
the solid sea nodule surface. Thus the pH at which the
sludge is generated is also important for a probable
regeneration scheme. Instant solubility of Pb(OH)2 in
acetic acid may be attributed to the partial success
obtained with acetic acid in regenerating sea nodule
sludge. Acetic acid, however, failed to drive out the
Pb2+ ions adsorbed over sea nodule surface.
3.8. Chemically bound moisture in sea nodule
Any moisture trapped in a matrix beyond 105�C is
normally termed as chemically bound moisture. This may
be due to water of crystallization, hydration of oxides or
chemically bound hydroxyl groups. Chemically bound
moisture figures in the conventional determination of LOI
at 900�C, but may also include other volatiles.
It was mentioned earlier (Section 3.1) that the
chemically bound moisture might play an important
role in Pb adsorption, which was looked into system-
atically in greater detail. Sea nodule samples were
calcined at varying temperatures of 100�C, 200�C,
300�C, 500�C, 700�C and 900�C. The calcined products
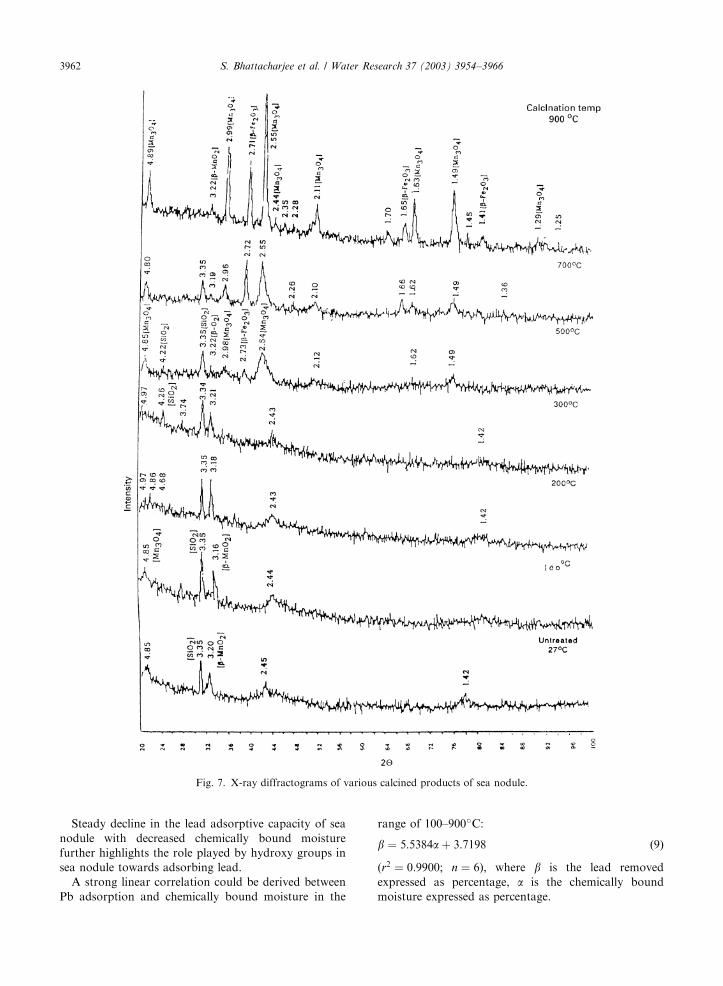
and the untreated sea nodule were subjected to X-ray
analysis and their diffractograms have been shown in
Fig. 7 which makes some very interesting revelations.
The diffractogram of untreated sea nodule has been
discussed earlier in detail while discussing Fig. 2 but also
retained here for the sake of quick comparison. This
pattern broadly remains unchanged with calcined
products upto 500�C not withstanding some distinct
and progressive changes along the entire spectrum. The
wide band observed around d ¼ 4:85 gets resolved into a
number of small but distinct peaks with increasing
calcination temperature. Maximum number of such
peaks could be observed at 200�C which smoothened on
increasing the temperature and eventually settled at two
distinct peaks at d ¼ 4:25 and 4:85 at 500�C correspond-
ing to SiO2 and Mn3O4 phases, respectively. Intermedi-
ate peaks at d ¼ 4:97 for 200�C and 300�C products
correspond to some non-stoichiometric intermediate
phase MnxOy, which gets converted to Mn3O4 on
increasing the calcination temperature. At 500�C one
may also observe the beginning of several other
peaks, which transpires into very well-defined peaks of
Mn3O4 and b-Fe2O3 at 700�C and 900�C. It was
most interesting to observe that in the entire range
of calcined products a consistent peak at around
d ¼ 3:1523:22 could be observed which was almost
independent of calcination temperature. This peak was
identified with b-MnO2, which was also supported by
the identification of auxiliary peaks of b-MnO2. It was
also interesting to note that the most predominant peak
of silica in untreated sea nodule was completely
suppressed at 900�C as its relative intensity considerably
decreased due to the formation of several new and
intense peaks.
Effect of calcination on lead adsorptive capability of
sea nodule was also studied in detail. Calcined products
of each of 0.1 g was separately used for Pb adsorption in
100ml of 242.4 ppm lead solution keeping other
adsorption parameters constant in each. Lead removals
for each calcined product have been shown in Table 5.
Also shown in Table 5 are the chemically bound
moistures in each of the calcined products and residual
Mn, Ni, Co and Cu contents in the filtrate after
adsorption. It may be seen that lead adsorptive
capability of sea nodule increases slightly at 100�C after
which it sharply declines on increasing the calcination
temperature resulting into removal of chemically bound
moisture. The increase in lead adsorptivity at 100�C
may be attributed to the removal of free moisture which
amounts to 12.2%. At 900�C where chemically bound
moisture was practically non-existing, calcined sea
nodule had almost ceased to adsorb lead.
ARTICLE IN PRESSS. Bhattacharjee et al. / Water Research 37 (2003) 3954–3966 3961
Steady decline in the lead adsorptive capacity of sea
nodule with decreased chemically bound moisture
further highlights the role played by hydroxy groups in
sea nodule towards adsorbing lead.
A strong linear correlation could be derived between
Pb adsorption and chemically bound moisture in the
range of 100–900�C:
b ¼ 5:5384aþ 3:7198 ð9Þ
(r2 ¼ 0:9900; n ¼ 6), where b is the lead removed
expressed as percentage, a is the chemically bound
moisture expressed as percentage.
ARTICLE IN PRESS
Fig. 7. X-ray diffractograms of various calcined products of sea nodule.
S. Bhattacharjee et al. / Water Research 37 (2003) 3954–39663962
Chemically bound moisture could also be correlated
with the calcination temperature by the following
non-linear correlation:
a ¼ 10�5g2 � 0:0203gþ 9:6644 ð10Þ
(r2 ¼ 0:9911; n ¼ 6), where g is the calcination
temperature in �C
It is also possible to correlate lead removal (b) withcalcination temperature (g) linearly although the fit is
inferior to the one observed in Eq. (9). A parabolic non-
linear fit of lead removal (b) with calcination tempera-
ture (g) is, however, at par with Eq. (9).
The impressive correlation Eq. (9) clearly highlights
the underlying fundamental relationship between lead
removal and chemically bound moisture. It was gratify-
ing to note that residual concentrations of Mn, Ni, Co
and Cu in the filtrate after Pb adsorption with calcined
products were small in general and decreased even
further with increasing calcination temperature. This
was due to the formation of insoluble metal oxides which
was also supported by their respective diffractograms.
3.9. pHzpc of sea nodule
pHzpc (pH at zero point charge) is an indicator of
the net surface charge of the adsorbent and its
preference for ionic species. pHzpc of the seanodule used
in the present work was determined as 7.4 by the method
of Huang and Ostavic [29]. It has already been
established that sea nodule contains a significant
amount of chemically bound moisture. It has also been
ascertained that the compounds of Fe and Mn in sea
nodule are non-crystalline at room temperature and in
all likelihood exist as their oxy hydroxides. Goethite,
oxy hydroxide of iron with the chemical formula a-FeO(OH) has a pHzpc of 8.6 and is known to be a good
adsorbent of anion like arsenite and arsenate [30]. Silica,
another mineral phase of sea nodule has a pHzpc of 2.3
while oxy hydroxide of Mn, MnOOH also has a pHzpc
of 2.3 [31]. It follows from the above discussion that sea
nodule surface has both positive and negative sites and
the observed pHzpc of 7.4 is a net combination of all
such sites. A direct and convincing evidence in favour of
this argument was observed when sea nodule was found
to adsorb anions like arsenite and arsenate exceedingly
well, the results of which will be communicated at a later
date.
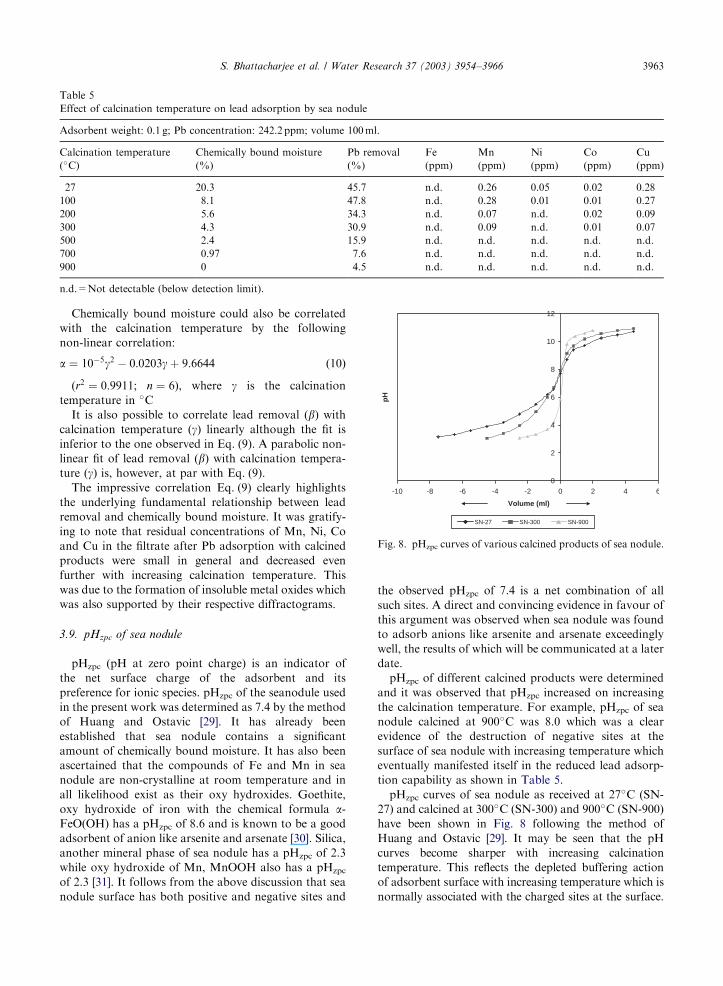
pHzpc of different calcined products were determined
and it was observed that pHzpc increased on increasing
the calcination temperature. For example, pHzpc of sea
nodule calcined at 900�C was 8.0 which was a clear
evidence of the destruction of negative sites at the
surface of sea nodule with increasing temperature which
eventually manifested itself in the reduced lead adsorp-
tion capability as shown in Table 5.
pHzpc curves of sea nodule as received at 27�C (SN-
27) and calcined at 300�C (SN-300) and 900�C (SN-900)
have been shown in Fig. 8 following the method of
Huang and Ostavic [29]. It may be seen that the pH
curves become sharper with increasing calcination
temperature. This reflects the depleted buffering action
of adsorbent surface with increasing temperature which is
normally associated with the charged sites at the surface.
ARTICLE IN PRESS
Table 5
Effect of calcination temperature on lead adsorption by sea nodule
Adsorbent weight: 0.1 g; Pb concentration: 242.2 ppm; volume 100ml.
Calcination temperature
(�C)
Chemically bound moisture
(%)
Pb removal
(%)
Fe
(ppm)
Mn
(ppm)
Ni
(ppm)
Co
(ppm)
Cu
(ppm)
27 20.3 45.7 n.d. 0.26 0.05 0.02 0.28
100 8.1 47.8 n.d. 0.28 0.01 0.01 0.27
200 5.6 34.3 n.d. 0.07 n.d. 0.02 0.09
300 4.3 30.9 n.d. 0.09 n.d. 0.01 0.07
500 2.4 15.9 n.d. n.d. n.d. n.d. n.d.
700 0.97 7.6 n.d. n.d. n.d. n.d. n.d.
900 0 4.5 n.d. n.d. n.d. n.d. n.d.
n.d.=Not detectable (below detection limit).
0
2
4
6
8
10
12
-10 -8 -6 -4 -2 0 2 4 6
Volume (ml)
pH
SN-27 SN-300 SN-900
Fig. 8. pHzpc curves of various calcined products of sea nodule.
S. Bhattacharjee et al. / Water Research 37 (2003) 3954–3966 3963
3.10. Lead adsorption mechanism
Probable lead adsorption mechanism over sea nodule
surface may not be very straight forward as sea nodule
matrix contains a number of mineral phases as has been
discussed in Sections 3.8 and 3.9.These mineral phases
have different types of surface charge and can adsorb
different types of ions. -FeOOH, a principal mineral
phase of sea nodule with a pHzpc of 8.6 has positive
charge on the surface that can attach anions like arsenite
and arsenate. This also implies that with regard to
arsenate and arsenite anions, -FeOOH should work
better at a pH below 8.6 and its efficiency should go
down at pH above 8.6 where OH� ions neutralise the
surface positive charge and render it less effective for
anions. This indeed was observed with regard to
arsenate adsorption on ferrihydrites [32]. Similarly,
MnOOH, another mineral phase of sea nodule having
a pHzpc of 2.3, has negative charges in its surface and
normally should attach cations. However, the surface of
MnOOH may be modified by exposing it to cationic
environment so that it can also adsorb anions [30,31].
Any lead adsorption mechanism on sea nodule must
take into account these factors.
A probable lead adsorption mechanism over sea
nodule must also accommodate following experimental
observations. A scrutiny of Table 4 reveals that on
increasing sea nodule dose, solution pH slowly increases.
It may also be observed that for the same sea nodule
dose, residual Mn concentration keeps on building up
on increasing the initial lead concentration. Lead
adsorption capability of sea nodule is directly related
to the hydroxy groups present in the sea nodule. Sea
nodule was also found to adsorb some amount of nitrate
anion during the process of adsorbing Pb2+. Plumbite
anion, PbO22� was found to have been readily adsorbed
over the sea nodule surface at a pH of 11.
In all likelihood Pb2+ gets adsorbed on the MnOOH
surface resulting into the release of Mn2+ ions, which
keeps on building up as initial lead concentration
increases. Since all the experiments, barring adsorption/
desorption study, were carried out at pH o 7, surface of
FeOOH might got modified with H+ ions present in the
solution by way of coupling with the surface OH groups,
resulting into net increase in solution pH. Adsorption of
NO3� ions over FeOOH surface might also contribute to
pH increase by way of OH� release. Present mechanism
of lead adsorption over sea nodule is somewhat
qualitative in nature as an exhaustive mechanism must
take into consideration the complete material balance and
electro-neutrality of the solution.
3.11. Performance of sea nodule as lead adsorbent
Performance of an adsorbent with respect to an
adsorbate may be judged by its loading capacity, which
has been defined earlier in Section 3.4. Lead loading
capacity of sea nodule as such compares favorably with
lead adsorbents like layered double hydroxide [11],
natural zeolite, 91.17mg/g [15], granulated blast furnace
slag, 20–25mg/g [14], etc. A true comparison between
different adsorbents, however, requires treatment of the
same input water with different adsorbents under
identical sets of adsorption parameters in addition to
other factors like price of the adsorbent, experimental
set up, ease of filtration, etc.
ARTICLE IN PRESS
Table 6
Performance of sea nodule as a lead adsorbent over simulated water matrix
Water sample Adsorption Pb (ppm) Fe (ppm) Ca (ppm) Mg (ppm) Mn (ppm) Zn (ppm)
A Before n.d. 0.65 18.51 20.1 0.7 1.74
After n.d. n.d. 14.79 17.52 0.05 0.12
B Before 2.9 0.58 18.1 20.2 0.69 1.78
After n.d. n.d. 14.25 17.75 0.05 1.16
C Before 7.1 0.51 19.0 20.44 0.67 1.78
After n.d. n.d. 15.0 18.05 0.08 0.21
D Before 13.9 0.76 18.73 20.41 0.67 1.78
After n.d. n.d. 14.97 18.18 0.11 0.30
E Before 18.3 0.93 19.63 20.37 0.67 1.78
After n.d. n.d. 16.83 19.0 0.34 0.67
F Before 26.3 0.96 19.0 20.2 0.67 1.87
After n.d. n.d. 16.5 20.16 0.41 0.94
n.d.=Not detectable (below detection limit).
S. Bhattacharjee et al. / Water Research 37 (2003) 3954–39663964
The performance of sea nodule as a lead adsorbent
was adjudged over a number of simulated water samples
prepared by mixing different quantities of Fe, Ca, Mg,
Mn and Zn in addition to lead. Each of these mixtures
of 50ml was treated with 0.05 g of the adsorbent for a
period of 30min in a manner used for other batch
adsorption experiments described earlier in Section 2.4.
Metal contents were analysed before and after adsorp-
tion the result of which has been given in Table 6. It may
be seen that in each of these mixtures lead could be
removed completely (below detection limit 0.01mg/l). It
was most interesting to observe that sea nodule was also
a good adsorbent for Fe, Zn and Mn and a mild water
softener. Removals of Zn and specially Mn were
inversely correlated with the lead concentration in
water. However, Fe removal was independent of Pb
concentration.
3.12. Scope of real life application
This study looks into the basic lead adsorptive
capability of sea nodule and the chemical species
responsible for it. It is possible to synthesize them in
the laboratory and develop an even more potent lead
adsorbent. Scarce availability of sea nodule may be a
deterrent in using the material directly as an adsorbent.
Nevertheless, very high lead loading capacity of sea
nodule makes the synthetic route to be of high relevance.
Laboratory synthesis of lead active components in sea
nodule is already in progress at National Metallurgical
Laboratory, Jamshedpur, India.
4. Conclusion
A batch adsorption study has been reported on the
adsorption of water soluble lead on polymetallic sea
nodule. Sea nodule is a hygrosopic complex mixture of
oxy hydroxides of Fe and Mn. It is possible to remove
lead almost completely (>99.5%) from contaminated
water bodies using appropriate dose of sea nodule. Lead
loading capacity of sea nodule has been estimated at
440mg/g. Both Freundlich and Langmuir isotherm
forms may be satisfactorily employed to explain lead
adsorption on sea nodule, which is best at pH 6.
Desorption of lead is practically zero beyond pH 6.
Residual metal concentrations in the filtrate after lead
adsorption, presumably leached out from the adsorbent,
lie well below their respective maximum permissible
levels as per WHO guidelines for drinking water. It is
possible to partially regenerate sea nodule using acetic
acid. Pb adsorptive capability of sea nodule may be
linearly correlated with the chemically bound moisture.
Sea nodule calcined at 900�C is practically stripped of its
capability to adsorb lead. pHzpc of calcined sea nodule
increases with increasing calcination temperature. Per-
formance of sea nodule as a lead adsorbent compares
favorably with other adsorbents like activated carbon,
ion exchange resin, anionic clay, natural and treated
zeolite and granulated blast furnace slag. It is possible to
prepare an even more potent lead adsorbent by
synthesizing Pb active components in sea nodule.
Acknowledgements
The authors take this opportunity to thank Director,
National Metallurgical Laboratory, Jamshedpur for his
kind permission to publish this work. The authors
express their gratitude to Sri K.K. Gupta, Senior
Scientist, ANC Division for critically examining the
manuscript. The authors also wish to thank Shri
S.K. Das for EDX analysis and Shri B. Ravikumar for
XRDs.
References
[1] Lead, Pollution prevention and abatement handbook.
World Bank Group, Effective July, 1998, http://
wbln0018.worldbank.org/essd.nsf/Global View/PPAH/
$File/37 lead.pdf.
[2] Current drinking water standards, 2002, EPA. Office of
water, http://www.epa.gov/safewater/mcl.html.
[3] IS (1991) Drinking water specification, (first revision)
(Amendment 1) Reaffirmed 1993. IS: 10500.
[4] Akhtar S, Qadeer R. Active carbon as an adsorbent for
lead ions. Adsorption Sci Technol 1997;15:815–24.
[5] Lee M-Y, Shin H-J. Removal of lead in a fixed bed column
packed with activated carbon and crab shell. Sep Sci
Technol 1998;33:1043–56.
[6] Mostafa MR. Adsorption of mercury, lead and cadmium
ions on modified activated carbons. Adsorption Sci
Technol 1997;15:551–7.
[7] Ho YS, Mckay G. The sorption of lead(II) ions on peat.
Water Res 1999;33:578–84.
[8] Hayes KF, Leckie JO. Mechanism of lead ion adsorption
at the goethite/water interface. In: Davis JA, Hayes KF,
editors. Geochemical process at mineral surface. ACS
Symposium Series, vol. 323. Washington, DC: American
Chemical Society, 1986.
[9] Srivastava SK, Bhattacharjee G, Tyagi R, Pant N, Pal N.
Studies of the removal of some toxic metal ions from
aqueous solutions and industrial waste. Part I (removal of
lead and cadmium by hydrous iron and aluminium oxide).
Environ Technol Lett 1988;9:1173–85.
[10] Theis TL, Iyer R, Ellis S. Evaluating of a new granular
iron oxide for removing lead from drinking water. J Am
Water Works Assoc 1992;July:101–5.
[11] Seida Y, Nakano Y, Nakamura Y. Rapid removal of
dilute lead from water by pyroaurite-like compound.
Water Res 2001;35:2341–6.
[12] Seki H, Suzuki A. Adsorption of lead ions on composite
biopolymer adsorbent. Ind Eng Chem Res 1996;35:
1378–82.
ARTICLE IN PRESSS. Bhattacharjee et al. / Water Research 37 (2003) 3954–3966 3965

[13] Gupta VK, Gupta M, Sharma S. Process development for
the removal of lead and chromium from aqueous solutions
using red mud—an aluminium industry waste. Water Res
2001;35:1125–34.
[14] Dimitrova SV, Mehandgiev DR. Lead removal from
aqueous solutions by granulated blast-furnace slag. Water
Res 1998;32:3289–92.
[15] Curkovic L, Cerjan-stefanovic S, Filipan T. Metal ion
exchange by natural and modified zeolites. Water Res
1997;31:1379–82.
[16] Suzuki Y, Takeuchi Y. Uptake of a few divalent heavy-
metal ion species from their aqueous solutions by coral
sand heat-treated at various temperatures. J Chem Eng
Jpn 1994;27:165–70.
[17] Macchi G, Marani D, Pagano M, Bagnuolo G. A bench
study on lead removal from battery manufacturing waste-
water by carbonate precipitation. Water Res 1996;30:
3032–6.
[18] Esalah JO, Weber ME, Vera JH. Removal of lead
from aqueous solutions by precipitation with sodium di-
(n-octyl) phosphinate. Sep Purification Technol 2000;18:
25–36.
[19] Chu W. Lead metal removal by recycled alum sludge.
Water Res 1999;33:3019–25.
[20] Mier MV, Callejas RL, Gehr R, Cisneros BEJ, Alvarez
PJJ. Heavy metal removal with mexican clinoptilolite:
multi-component ionic exchange. Water Res 2001;35:
373–8.
[21] Chung HI, Kang BH. Lead removal from contaminate
marine clay by electrokinetic soil decontamination. Eng
Geol 1999;53:139–50.
[22] Leung WC, Wong M-F, Chua H, Lo W, Yu PH, Leu CK.
Removal and recovery of heavy metals by bacteria isolated
from activated sludge treating industrial effluents and
municipal waste water. Water Sci Technol 2000;41:233–40.
[23] ASTM. Standard test method for determination of silica in
manganese ores, iron ores and related materials by
gravimetry (E247-96). 1996;03.05:270–71.
[24] ASTM. Standard test method for determination of iron in
manganese ores by hydrogen sulfide reduction-dichromate
titration (E316-95a). 1996;03.05:313–4.
[25] ASTM. Standard test method for determination of
manganese (IV) in manganese ores by redox titration
(E465-95a). 1996;03.06:119–21.
[26] Vandecasteele C, Block CB. Modern methods for trace
element determination. Brisbane, Toronto, Singapore:
Wiley, 1993. p. 134–5.
[27] Baruah TC, Patgiri DK. Physics and chemistry of soils.
New Delhi: New Age International Publishers, 1996.
p. 128–44.
[28] Lagergren S. About the theory of so-called adsorption of
soluble substances. Kungliga Svenska Vetenskapsakade-
miens. Handlingar, Band 1898;24:1–39.
[29] Huang CP, Ostavic FG. Removal of cadmium(II) by
activated carbon adsorption. J Environ Eng Div ASCE
1978;104:863–78.
[30] Chakravarty S, Dureja V, Bhattacharyya G, Maity S,
Bhattacharjee S. Removal of arsenic from groundwater
using low cost ferruginous manganese ore. Water Res
2002;36:625–32.
[31] Mok WM, Wai CM. Mobilization of arsenic in contami-
nated river waters. In: Nriagu JO, editor. Arsenic in the
environment, Part 1. New York: Wiley; 1994. p. 99–117.
[32] Raven KP, Jain A, Loeppert RH. Arsenite and arsenate
adsorption on ferrihydrite: kinetics, equilibrium and
adsorption envelops. Environ Sci Technol 1998;32:344–9.
ARTICLE IN PRESSS. Bhattacharjee et al. / Water Research 37 (2003) 3954–39663966