Mechanism of silica-lysozyme composite formation unravelled ...

Pa
CD
a
ARRA
KMpmFPL
1
atlaicMtr
c
1d
Chemical Engineering Journal 143 (2008) 337–348
Contents lists available at ScienceDirect
Chemical Engineering Journal
journa l homepage: www.e lsev ier .com/ locate /ce j
reparation and characterization of a dye–liganddsorbent for lysozyme adsorption
ristina Garcia-Diego ∗, Jorge Cuellarepartment of Chemical Engineering, University of Salamanca, Plaza de los Caidos 1-5, 37008 Salamanca, Spain
r t i c l e i n f o
rticle history:eceived 18 March 2008eceived in revised form 30 May 2008ccepted 13 June 2008
eywords:acroreticular
oly(styrene-co-divinylbenzene)icroparticles
unctionalizationore size distributionysozyme adsorption
a b s t r a c t
Dye–ligand macroreticular poly(styrene-co-divinylbenzene) microparticles with different pore propertieshave been obtained and used as adsorbents of proteins. To do so, plain microparticles were first coated withpoly(vinyl alcohol) to shield the hydrophobic polymer surface from non-specifically adsorbing protein.The poly(vinyl alcohol) coating was then chemically cross-linked with glutaraldehyde to obtain a stablelayer. Following this, Cibacron Blue F3GA, which was chosen as the dye affinity ligand, was immobilizedon these microparticles to obtain specific protein adsorption. After each modification step, the pore sizedistributions of the microparticles were determined, observing that the adsorption of poly(vinyl alcohol)clogged micropores and low-interval mesopores, and that only microparticles with a high pore volume,basically due to high-interval mesopores and macropores, largely continued to exhibit these pores. Thebatch adsorption properties of the functionalized microparticles were studied using lysozyme as a modelprotein, observing that the existence of high-interval mesopores and macropores was essential in theadsorption of the protein. In fact, it was only possible to evaluate the adsorption characteristics in thecase of microparticles that largely continued to display this kind of pores after their functionalization.Adsorption equilibrium was found to be described well by the Sips model, with a maximum adsorption
−1
capacity of 100.8 mg g dry adsorbent. With regard to adsorption kinetics, both pore-diffusion and solid-diffusion models were used to estimate the diffusion coefficients, with the observation that the simplifiedsolid-diffusion model was reliable for describing the experimental kinetic data, with a diffusion coeffi-cient of 1.4 × 10⁻⁹ cm2 s−1. The non-specific adsorption of lysozyme on the functionalized microparticleswas found to be 2.6 mg g−1 dry adsorbent. Finally, regarding desorption of the protein, it was observedthat more than 73% of the lysozyme adsorbed was readily desorbed in a desorption medium containingct
iwArmim
1.0 mol L−1 NaCl at pH 7.3.
. Introduction
Among all the mechanisms used in biomacromolecular sep-ration processes, affinity chromatography is considered to behe most specific because it relies on the specificity of aigand–biomacromolecule interaction [1]. Affinity systems have
broad range of applications, and they have been used in thesolation and purification of enzymes, hormone receptors, can-er cell-surface antigens, membrane proteins and interferons [2].oreover, it seems probable that in the future the range of applica-
ions will increase and that novel techniques based on bimolecularecognition will continue to be developed.
The basic requirements for the development of an affinity purifi-ation system are an inert matrix material, an affinity ligand, and
∗ Corresponding author. Tel.: +34 923294479; fax: +34 923294574.E-mail address: [email protected] (C. Garcia-Diego).
aDtptpmt
385-8947/$ – see front matter © 2008 Elsevier B.V. All rights reserved.oi:10.1016/j.cej.2008.06.022
© 2008 Elsevier B.V. All rights reserved.
oupling reagents that allow covalent attachment of the ligand tohe matrix.
Use of the affinity chromatography technique has been lim-ted by problems associated with the support matrix, especially
hen high pressures must be used during the separation process.garose, which is a low-charge fraction of seaweed polysaccha-ide agar, is the most widely used support matrix, but its lack ofechanical stability, even in heavily cross-linked varieties, restricts
ts application in large-scale operations [3]. In contrast, syntheticacroreticular polymers are increasingly being used – in particular,
dsorbents based on poly(styrene-co-divinylbenzene) (poly[S-co-VB]) – owing to their good mechanical and chemical properties,
heir versatility and their pore structure [3–6]. However, the use of
oly[S-co-DVB] microparticles as adsorbents of proteins is subjecto two types of problem: (a) they cannot be used directly to purifyroteins because hydrophobic interactions between the polymericatrix and protein often result in irreversible adsorption, and (b)heir direct derivatization with affinity ligands is difficult. There-

338 C. Garcia-Diego, J. Cuellar / Chemical Engineering Journal 143 (2008) 337–348
Nomenclature
A coefficient in Eq. (6)b Langmuir equilibrium coefficient of the adsorption
sites (mL mg−1)c concentration of Lys in the pores (mg mL−1)Ce,Lys concentration of Lys in the supernatant at equilib-
rium (mg mL−1)Ci concentration of the adsorbable in the supernatant
(mg mL−1)Co,i initial concentration of the adsorbable in the solu-
tion (mg mL−1)De effective pore diffusivity of Lys (cm2 s−1)Ds solid diffusivity of Lys (cm2 s−1)H0 null hypothesisH1 alternative hypothesisI1 parameter defined by Eq. (10)I2 parameter defined by Eq. (11)n term in Eq. (6)nplain sample size for the plain S2 microparticlesnwith PVA sample size for the PVA-coated S2 microparticlespn non-zero roots of Eq. (17)q′ Lys concentration in the particles on a pore-free
basis (mg mL−1)q∗ particle-average Lys concentration at equilibrium
(mg mL−1)qe,i amount of Lys (or PVA) adsorbed at equilibrium on
the particles (mg g−1)qi amount of Lys (or PVA) adsorbed at different times
on the particles (mg g−1)q∗
m maximum Lys adsorption capacity on the particles(mg mL−1)
qm maximum Lys adsorption capacity on the particles(mg g−1)
qnon-ads amount of Lys non-specifically adsorbed at equilib-rium on the particles (mg g−1)
r radial position in the microparticles (cm)R2 coefficient of determinationRp average value of the particle radius (cm)SBET BET specific surface area (m2 g−1)S2
p variance defined by Eq. (4)S2
plain individual sample variance for the plain S2microparticles
S2with PVA individual sample variance for the PVA-coated S2
microparticlest uptake time (s); t-statisticV bulk solution volume (mL)Vads volume of nitrogen adsorbed on the microparticles
(cm3 g−1 STP)Vmicro volume of micropores (cm3 g−1)VM volume of microparticles (mL)Vo,i initial volume of adsorbable solution (mL)�Vi dilution due to the humidity of the adsorbent (mL)W dry-adsorbent weight (g)yplain sample mean of the pore property for the plain S2
microparticlesywith PVA sample mean of the pore property for the PVA-
coated S2 microparticles
Greek letters� significance level of the testεp intraparticle porosity of the adsorbent
� parameter defined by Eq. (12)� parameter defined by Eq. (14)� fractional amount of Lys ultimately taken up by the
adsorbent, defined in Eq. (13)�plain mean pore property for the plain S2 microparticles�with PVA mean pore property for the PVA-coated S2
ficafrDgibsphfttmwhaHwtct
faa(dohttTe[tp
ucmtsotdm
cd
microparticles�2 chi-square value
ore, the modification of their surface to prevent hydrophobicnteractions and the introduction of coupling reagents to over-ome the second problem are crucial requirements for obtainingsupport based on poly[S-co-DVB] suitable for their subsequent
unctionalization and use as affinity adsorbents. In this sense,esearch oriented to the modification of the surface of poly[S-co-VB] matrices to mask their hydrophobic surface with hydrophilicroups has been carried out [3–12]. One of the methods usednvolves a hydrophilic coating of the surface, which can be attainedy using a copolymer containing both hydrophobic and hydrophilicegments [8]. Thus, if a copolymer of this type is dissolved in aolar solvent and exposed to the poly[S-co-DVB] microparticles,ydrophobic segments of the copolymer will adsorb on their sur-ace, while the hydrophilic segments will loop outwards away fromhe surface like filaments. With this procedure, it is expected thathe hydrophobic character of poly[S-co-DVB] will be completely
asked and that the surface of the copolymer-support compositeill exhibit the properties of the hydrophilic segments. Owing to itsigh degree of functionality, poly(vinyl alcohol) (PVA) seems to ben appropriate copolymer for coating the poly[S-co-DVB] surface.owever, since it has been demonstrated that PVA partially desorbshen exposed to protein solutions [6], it is usual to increase both
he chemical and the mechanical strength of the adsorbed layer byross-linking it. Several reagents can be used as cross-linkers [3–7],he one most widely used being glutaraldehyde.
With regard to the ligand to be immobilized, a broad array ofunctional molecules, such as proteins, enzymes, antibodies, aminocid derivatives, oligopeptides, and nucleic acids can be used as lig-nds. However, in most cases these ligands have certain problems:a) they are usually expensive and extremely specific, (b) there areifficulties involved in immobilizing them without loss of theirriginal biological activity, and (c) they may be unable to withstandarsh cleaning conditions during use. To overcome these problems,riazine dye ligands have been considered as important alternativeso natural counterparts for specific affinity chromatography [13].hese ligands are able to bind most types of proteins, especiallynzymes, in some cases acting in a remarkably specific manner14]. Among all of the triazine dyes, Cibacron Blue F3GA is one ofhe most widely preferred ligands in the dye-affinity separation ofroteins [15,16].
Although dye-immobilized adsorbents have been extensivelysed for protein purification [17], we have not found any studyovering from the synthesis of the macroreticular poly[S-co-DVB]icroparticles to their use as affinity adsorbents that has addressed
he equilibrium and kinetics of the adsorption, with the corre-ponding modelling. Thus, the aim of the present work was to carryut a global investigation into the production and application of thisype of adsorbent, studying the results of each modification intro-
uced into the plain microparticles and the implications of suchodifications in the final result.To attain this objective, two types of macroreticular poly[S-o-DVB] microparticles were synthesized from mixtures withifferent divinylbenzene and diluent concentrations according

Engineering Journal 143 (2008) 337–348 339
tmcaprumw
2
2
1cwroSifaSaaBc
a(MbpBatI
2
(fonTiaspe
Table 1Synthesis conditions of the plain macroreticular poly(styrene-co-divinylbenzene)microparticles
Property Samples
S1 S2a
DVB concentration (wt%)b 55.0 42.5Monomeric fraction (v/v)c 0.60 0.50Mean particle size (�m) 170 170BET specific surface area(m2 g−1)
434 376
t-Plot micropore volume(cm3 g−1)
0.06 0.05
Cumulative volume ofpores between 10 Å and1000 Å radius (cm3 g−1)
0.81 0.97
Cumulative surface area ofpores between 10 Å and1000 Å radius (m2 g−1)
372 340
Average pore radius (Å) 44 57Modal pore radius (Å) 244 284
a Pore properties are the corresponding to the first replicate of plain S2 micropar-ticles, because these are the microparticles used in the functionalization andadsorption experiments.
b DVB concentration is the weight percentage of DVB isomers in the monomericm
m
2
elwwt
pahdwotPa
q
wbr
TT
P
SVV
t
C. Garcia-Diego, J. Cuellar / Chemical
o an experimental procedure described elsewhere [18]. Theseicroparticles were first coated with PVA and then chemically
ross-linked with glutaraldehyde. Finally, Cibacron Blue F3GA lig-nd was immobilized on the microparticles. Modification of theirore size distribution was also investigated. Additionally, theesulting functionalized adsorbents were characterized by proteinptake equilibrium and kinetic studies using lysozyme (Lys) as aodel protein. The non-specific adsorption and desorption of Lysere also tested.
. Experimental
.1. Chemicals
Poly(vinyl alcohol) (with a weight-average molar mass of3,000–23,000 and a degree of hydrolysis of 87–89%) and theross-linking agent, in this case glutaraldehyde (50% in water),ere obtained from Sigma–Aldrich (Madrid, Spain). Hydrochlo-
ic acid at 35%, used as the catalyst in the cross-linking stepf the adsorbed PVA layer, was supplied by Scharlab (Barcelona,pain). The reagents used in the functionalization of the mod-fied matrices were Cibacron Blue F3GA, which was obtainedrom Fluka Biochemika (Madrid, Spain), and sodium chloride andnhydrous sodium carbonate, both of which were supplied bycharlab (Barcelona, Spain). Other reagents such as 99.5% sodiumzide (Sigma–Aldrich, Madrid, Spain), and methanol multisolventnd hydrogen sodium carbonate (both obtained from Scharlab,arcelona, Spain), were used in the conditioning of the microparti-les.
To check the usefulness of the hydrophilic microparticless adsorbents of proteins, lysozyme from chicken egg whiteLys, lyophilized powder, 95% approximately, from Sigma–Aldrich,
adrid, Spain) was used as a model protein. Salt-phosphateuffer solutions were prepared from monobasic anhydrous sodiumhosphate and dibasic anhydrous potassium phosphate (Panreac,arcelona, Spain), and sodium chloride (Scharlab, Barcelona, Spain),ll of them of reagent grade. All sample solutions were microfilteredhrough a 0.45-�m syringe membrane filter (Millex-HV, Milliporeberica).
.2. Experimental procedure
Two types of macroreticular poly(styrene-co-divinylbenzene)poly[S-co-DVB]) microparticles (S1 and S2) synthesized under dif-erent operating conditions were used. They were synthesized atur laboratory by means of the suspension polymerization tech-ique, using n-heptane as porogen, as described elsewhere [18].heir synthesis conditions, together with their structural character-
stics, are summarized in Table 1. Sample S1 proved to have gooddsorption and structural properties, as well as good mechanicaltrength [18–20]. With respect to the S2 microparticles, these dis-layed enhanced adsorption properties as regards both adsorptionquilibrium and adsorption diffusivity [20].C(d
w
able 2wo-sample t-test for the PVA coating experiment on S2 microparticles with regard to th
roperty Plain S2 microparticles PVA-c
First replicate Second replicate yplain Splain First rqe,PVA
BET(m2 g−1) 376 365 370 7.4 53
micro (cm3 g−1) 0.05 0.06 0.06 0.011 0.00
10–1000 Å (cm3 g−1) 0.97 1.08 1.02 0.079 0.39
˛/2,nplain+nwith PVA−2 = 4.30.
ixture.c The monomeric fraction in the organic phase is the volume fraction of theonomers in the organic phase.
.2.1. Coating of the polystyrene matrix with PVAMacroreticular poly[S-co-DVB] microparticles were first washed
xtensively with methanol and then with deionized water. Fol-owing this, the microparticles were equilibrated overnight withater, which was later removed. The dry-weight fraction of theet microparticles, W (g), was determined from the weight loss of
he samples after 24 h in an oven at 110 ◦C.After washing, 15.0 g of wet polymeric microparticles were
laced in a round-bottomed flask and 250 mL of PVA solution wasdded at an initial concentration of 50 mg mL−1. The solution waseated to 30 ◦C and stirred mechanically at 50 rpm for 3 days. Toetermine the PVA adsorption kinetics, samples of supernatantere removed on a regular basis to measure the concentration
f PVA (CPVA, expressed in units of mg mL−1) with a UV–Vis spec-rophotometer (Varian, model Cary 50) at 320 nm. The amount ofVA adsorbed per unit dry weight of adsorbent (qPVA, mg g−1 of drydsorbent) was obtained from the mass balance:
i = Vo,iCo,i − (Vo,i + �Vi)Ci
W(1)
here qi is the amount of adsorbate which is adsorbed on the adsor-ent (mg g−1); Vo,i is the initial volume of the solution (mL); �Viepresents the dilution due to the humidity of the adsorbent (mL);
o,i is the initial concentration of the adsorbable in the solutionmg mL−1); Ci is the concentration at time t (mg mL−1); W is thery-adsorbent weight (g).The PVA-coated poly[S-co-DVB] microparticles were thenashed thoroughly with deionized water.
e pore properties
oated S2 microparticles
eplicate= 955 mg g−1
Second replicateqe,PVA = 939 mg g−1
ywith PVA Swith PVA Sp t0
58 56 3.4 5.8 54.40.00 0.00 0.00 0.008 7.20.38 0.38 0.008 0.056 11.4

340 C. Garcia-Diego, J. Cuellar / Chemical Engineering Journal 143 (2008) 337–348
igand
pSm
2
wslo1bftaafi
2
pnaotaCtaa[f1cpt
btwas
sn
2
mtptfpebmaeDu
2
baA(
s
2acbLstitw
Fig. 1. Chemical structure of Cibacron Blue F3GA and coupling of this l
To establish the effect of the adsorption of PVA on the structuralroperties of the microparticles by statistical inference, two plain2 microparticles and two replicates of adsorption of PVA on theseicroparticles were obtained (Table 2).
.2.2. Stabilization of the PVA coating with glutaraldehydeThe PVA molecules adsorbed on the polymeric microparticles
ere chemically cross-linked to obtain a stable PVA coating on theurface of the microparticles. Glutaraldehyde was used as the cross-inking agent, with a molar ratio for glutaraldehyde to PVA adsorbedf 10:1. A solution of 100 mL of cross-linking agent was poured over0.0 g of wet PVA-coated poly[S-co-DVB] microparticles in a round-ottomed flask. The batch was first stirred mechanically at 50 rpmor 30 min at 30 ◦C to allow diffusion of the glutaraldehyde intohe microparticles. Then, a solution of HCl (5 mol L−1, 0.3 mL) wasdded to catalyze the cross-linking reaction. The mixture was leftt the same temperature for 16 h. Finally, the microparticles wereltered and washed several times with deionized water.
.2.3. Ligand immobilizationCibacron Blue F3GA was covalently attached to the PVA-coated
oly[S-co-DVB] microparticles under alkaline conditions via theucleophilic substitution reaction between the chloride of its tri-zine ring and the alkoxide anions formed from the hydroxyl groupsf the PVA coating (Fig. 1). First, a sample of 10.0 g of micropar-icles was dispersed in 100 mL of deionized water at 60 rpm andt 60 ◦C in a round-bottomed flask. Then, 30 mL of a solution ofibacron Blue F3GA, at a concentration of 33 mg mL−1, was addedo the aqueous dispersion. The sample was left to mix well at 60 ◦Cnd at 60 rpm in the reactor for 30 min. Then, 15.0 g of NaCl wasdded to facilitate the interaction between the dye and the matrix21,22], and the solution was maintained at the same temperatureor 45 min. Following this, the medium was heated to 80 ◦C and.5 g of Na2CO3 was added to the suspension to obtain the alkalineonditions under which the nucleophilic substitution reaction waserformed. The reaction was allowed to progress for 2 h after whichhe reaction mixture was cooled to room temperature and filtered.
After dye immobilization, in order to remove any uncovalently
ound dye, the microparticles were treated with warm water untilhe washing water was colourless. Finally, microparticles wereashed with 1 L of 1.0 mol L−1 NaCl, 1 L of 10−2 mol L−1 NaHCO3nd 1 L of water. The absence of dye leakage was confirmed bypectrophotometry of the supernatant at 610 nm.
w
2i(
to the hydroxyl groups of the PVA coating the poly[S-co-DVB] matrix.
The Cibacron Blue F3GA-immobilized microparticles weretored in 0.02% sodium azide at 4 ◦C to avoid microbial contami-ation.
.2.4. Characterization of the polymeric microparticlesThe polymeric microparticles were characterized after each
odification step. Structural characterization of the micropar-icles was accomplished using nitrogen adsorption–desorptionorosimetry (Micromeritics Gemini V2380 v1.00), which permit-ed the determination of the BET specific surface area (SBET, m2 g−1)ollowing the Brunauer–Emmet–Teller method [23], and the micro-ore volume (Vmicro, cm3 g−1) according to the t-method [24]. Thesexperimental data were also used to study the pore size distri-ution of the microparticles, following the Barret–Joyner–Halendaethod [25]. The shape of the microparticles was observed withlight microscope (Leica DS1000). Their surface morphology was
xamined by scanning electron microscopy (SEM), using a ZeissSM 940 microscope. UV–Vis spectrophotometry was carried outsing a Varian apparatus, model Cary 50.
.2.5. Protein adsorption–desorption experimentsThe usefulness of the functionalized microparticles as adsor-
ents of proteins was checked via a batch method. As mentionedbove, chicken egg white lysozyme was selected as a model protein.ll pH measurements were performed with a digital pH/mV meter
GLP 21, Crison).In all experiments, the absence of dye leakage was confirmed by
pectrophotometry of the supernatant at 610 nm.
.2.5.1. Adsorption equilibrium of Lys. Samples of dye-immobilizeddsorbent (0.2 g approximately) were weighed and placed in tubesontaining 10 mL of a buffer solution (0.05 mol L−1 phosphateuffer, pH 7.3) with different, but known, initial concentrations ofys. The solutions were allowed to equilibrate for 24 h in a rotatinghaker, which was placed inside a thermostated chamber to main-ain the temperature at 25 ◦C. After this time, the Lys concentrationn the supernatant (Ce,Lys, mg mL−1) was determined spectropho-ometrically at 280 nm. The amount of Lys adsorbed per unit dryeight of adsorbent (qe,Lys, mg g−1 dry functionalized adsorbent)
as obtained from the mass balance given in Eq. (1)..2.5.2. Adsorption kinetics of Lys. To study the adsorption kinet-cs of Lys onto the functionalized microparticles, a buffer solution0.05 mol L−1 phosphate buffer, pH 7.3) with an initial protein con-

C. Garcia-Diego, J. Cuellar / Chemical Engin
cs12osum
2ipiooaisqtg
2awbt0LtLmrmt
3
3
Da
totmibEmiiootmlmPhcalpo
magtmtVtTteasedts
wcm
ahitfa
t
wn
Fig. 2. Adsorption kinetics of PVA onto the S2 sample.
entration of 5 mg mL−1 was used. A volume of 100 mL of thisolution was poured into a round-bottomed flask that contained.5 g of functionalized microparticles. Adsorption proceeded at5 ◦C at a stirring speed of 60 rpm. Adsorption kinetic data werebtained by measuring the concentration of Lys in the supernatantpectrophotometrically at 280 nm at different times, which alloweds to determine the amount of Lys adsorbed at these times (qads,g g−1 dry functionalized adsorbent).
.2.5.3. Non-specific adsorption of Lys. The effectiveness of the coat-ng in preventing possible non-specific interactions between therotein and the polystyrene support was checked in an experiment
nvolving non-specific protein adsorption. To do so, a sample of 0.2 gf dye-functionalized microparticles was placed in a tube and 10 mLf Lys solution (1 mg mL−1 of Lys in 0.05 mol L−1 phosphate buffernd 1 mol L−1 NaCl, pH 6.7) was added. The sample was left for 24 hn a rotating shaker at 25 ◦C, after which the Lys concentration in theolution was determined spectrophotometrically at 280 nm. Theuantity of protein bound non-specifically (qnon-ads, mg g−1 func-ionalized microparticles) was calculated from the mass balanceiven in Eq. (1).
.2.5.4. Desorption of Lys. To study the reversibility of proteindsorption on the functionalized microparticles, sodium chlorideas used as a desorption agent to decrease the interaction forcesetween the protein and the adsorbent. Thus, a batch desorp-ion experiment was performed in a phosphate buffer solution of.05 mol L−1 containing 1 mol L−1 NaCl at pH 7.3. In this experiment,ys-adsorbed microparticles (0.1 g approximately) were placed inhe desorption medium and stirred for 24 h at 25 ◦C. The finalys concentration in the solution was determined spectrophoto-etrically at 280 nm. The desorption ratio was calculated as the
elationship between the final amount of Lys in the desorptionedium and the amount of Lys initially adsorbed on the micropar-
icles.
. Results and discussion
.1. PVA adsorption on polymeric microparticles
Fig. 2 shows the adsorption kinetics of PVA onto the poly[S-co-VB] microparticles synthesized with a DVB concentration of 42.5%nd a monomeric fraction of 0.50 (S2 sample); it may be observed
S
eering Journal 143 (2008) 337–348 341
hat PVA adsorption was completed in 6 h. The maximum amountf PVA adsorbed was found to be 267 mg g−1 dry adsorbent, onhe S1 microparticles; and 947 mg g−1 dry adsorbent, on the S2
icroparticles (this is the mean value of both replicates, see valuesn Table 2). The difference in these values can be explained on theasis of the structural properties of the microparticles (Table 1).ssentially, a high specific surface area is due to the presence oficropores and low-interval mesopores, while a high pore volume
s due to macropores and high-interval mesopores. Thus, takingnto account the higher values of the BET specific surface area andf the micropore volume for the S1 sample, and the higher valuef the volume of pores with a radius between 10 Å and 1000 Å forhe S2 sample, it may be expected that the S1 sample would have
ore micropores and low-interval mesopores than S2, while theatter can be presumed to have a higher proportion of high-interval
esopores and macropores, thus admitting a higher amount ofVA. Considering these differences in the porous structure and theigh molecular weight of PVA, the existence of steric hindrancean be anticipated to occur during the coating procedure, in suchway that the PVA, instead of penetrating into micropores and
ow-interval mesopores, simply plugs them at some point along theore. Consequently, the S1 sample, with smaller pores than thosef S2, displays a lower PVA adsorption capacity.
As can be deduced, the study of the structural properties of theicroparticles after the adsorption of PVA is essential to obtain
n adsorbent with the most appropriate porous structure for aiven application. For this reason, it is appropriate to study whetherhe effect of the adsorption of PVA on the pore properties of the
icroparticles is statistically significant [26]. To accomplish this,he first step was to obtain the pore properties (SBET, Vmicro and
10–1000 Å) of the two replicates of plain S2 microparticles and ofhe two PVA-coated S2 microparticles. These results are given inable 2, together with the mean (y) and the standard deviation ofhe experimental data (S), and they are plotted in Fig. 3, where thextreme values for each single column are the experimental data,nd the mean, which fits in the median, is indicated by lines. Fromcrutiny of this figure, it may be deduced that the PVA coating influ-nces the pore properties because the SBET, Vmicro and V10–1000 Åecrease notably after PVA adsorption. Nevertheless, to confirmhis deduction, a statistical hypothesis testing was performed. Thetatistical hypothesis may be stated formally as
Null hypothesis H0 : �plain = �with PVAAlternate hypothesis H1 : �plain /= �with PVA
(2)
here �plain is the mean pore property of the plain S2 microparti-les and �with PVA is the mean pore property of the PVA-coated S2icroparticles.To test the hypothesis it is necessary to calculate an appropri-
te test statistic, thus being able to reject or fail to reject the nullypothesis H0. Because the sample standard deviations were sim-
lar (see values in Table 2), it is not unreasonable to conclude thathe population standard deviations (or variances) are equal. There-ore, a two-sample t-test was performed, calculating the t-statistics follows:
0 = yplain − ywith PVA
Sp√
1/nplain + 1/nwith PVA
(3)
here yplain and ywith PVA are the sample means, and nplain andwith PVA are the sample sizes. An estimate of the common variance
2plain = 2with PVA = 2 is indicated by S2p:
2p =
(nplain − 1)S2plain + (nwith PVA − 1)S2
with PVA
nplain + nwith PVA − 2(4)
342 C. Garcia-Diego, J. Cuellar / Chemical Engineering Journal 143 (2008) 337–348
F ating:v
wT
c�tt
ma
cowCoNioctec
lae7Sp
ttpmaa
3
a
ig. 3. Dot-plots of the pore properties of S2 microparticles before and after PVA-coolume of pores with a pore radius between 10 Å and 1000 Å (cm3 g−1).
here S2plain and S2
with PVA are the two individual sample variances.he results are given in Table 2.
Since nplain + nwith PVA − 2 = 2 + 2 − 2 = 2, if we choose a signifi-ance level of the test of ˛ = 0.05, then the null hypothesis, H0:plain = �with PVA, is rejected because the numerical value of the
est statistic, |t0|, is greater than 4.30 for all pore properties (|t0| >
˛/2,nplain+nwith PVA−2 = 4.30). This allows us to conclude that theean pore properties of the S2 microparticles change after the PVA
dsorption with a significance level of 0.05.Other authors have reported the coating of polystyrene matri-
es with PVA. In this sense, using PVA with a molecular weightf 85,000–146,000 and 99+% hydrolysed and a polymeric matrixith a specific surface area of 200–300 m2 g−1 (AmberchromG162s), Leonard et al. [6] obtained a maximum PVA adsorptionf 1.12 mg m−2 of polystyrene under the best coating conditions.evertheless, the PVA saturated the particle surface, produc-
ng aggregates of poly[S-co-DVB] microparticles. Nash et al. [3]
btained a maximum PVA coating of about 240 mg g−1 on poly[S-o-DVB] microparticles (CG1000sd–TosoHaas) by using PVA withhe same molecular weight and degree of hydrolysis as thatmployed in the present work. Also, Tuncel et al. [7] studied theoating of polystyrene microparticles with PVA (average molecu-i
dct
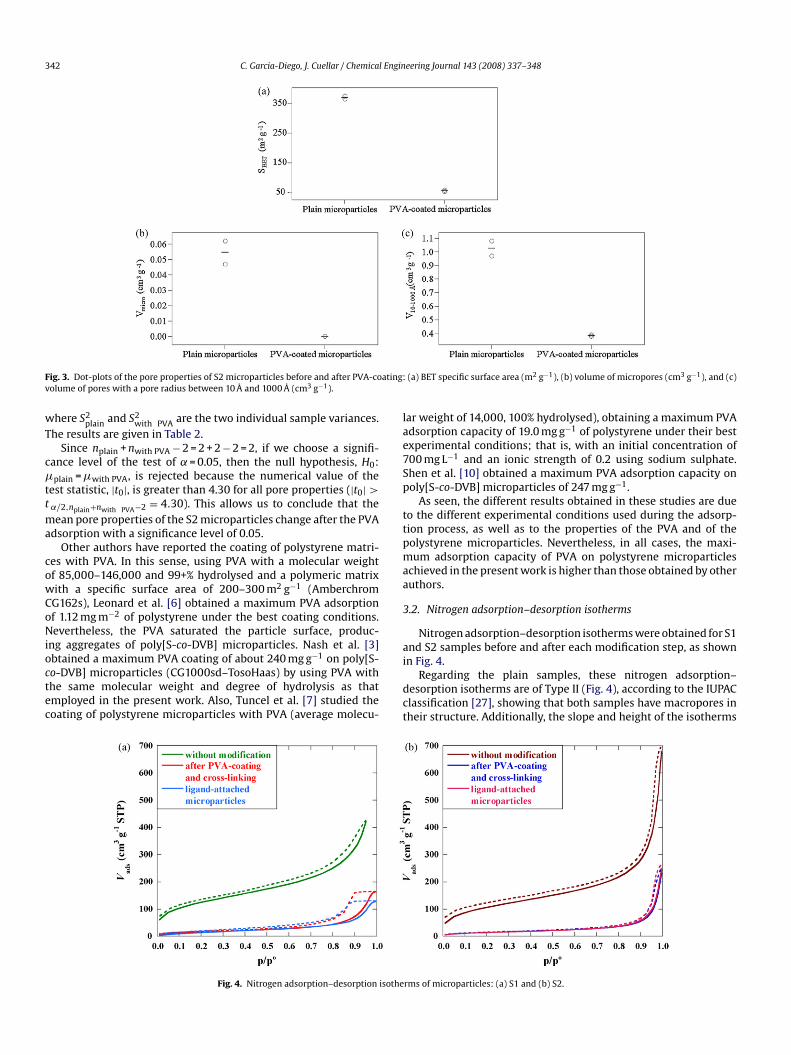
Fig. 4. Nitrogen adsorption–desorption isothe
(a) BET specific surface area (m2 g−1), (b) volume of micropores (cm3 g−1), and (c)
ar weight of 14,000, 100% hydrolysed), obtaining a maximum PVAdsorption capacity of 19.0 mg g−1 of polystyrene under their bestxperimental conditions; that is, with an initial concentration of00 mg L−1 and an ionic strength of 0.2 using sodium sulphate.hen et al. [10] obtained a maximum PVA adsorption capacity onoly[S-co-DVB] microparticles of 247 mg g−1.
As seen, the different results obtained in these studies are dueo the different experimental conditions used during the adsorp-ion process, as well as to the properties of the PVA and of theolystyrene microparticles. Nevertheless, in all cases, the maxi-um adsorption capacity of PVA on polystyrene microparticles
chieved in the present work is higher than those obtained by otheruthors.
.2. Nitrogen adsorption–desorption isotherms
Nitrogen adsorption–desorption isotherms were obtained for S1nd S2 samples before and after each modification step, as shown
n Fig. 4.Regarding the plain samples, these nitrogen adsorption–esorption isotherms are of Type II (Fig. 4), according to the IUPAClassification [27], showing that both samples have macropores inheir structure. Additionally, the slope and height of the isotherms
rms of microparticles: (a) S1 and (b) S2.

C. Garcia-Diego, J. Cuellar / Chemical Engineering Journal 143 (2008) 337–348 343
Table 3Modification of the structural properties of plain microparticles after coating and functionalization
Structural property Samples
S1 S2
Plainmicroparticles
After coating andcross-linking
After function-alization
Plain microparticles After coating andcross-linking
After functionalization
BET specific surfacearea (m2 g−1)
434 58 60 376 51 50
t-Plot microporevolume (cm3 g−1)
0.06 0.00 0.00 0.05 0.00 0.00
Cumulative volume ofpores between 10 Åand 1000 Å radius(cm3 g−1)
0.81 0.25 0.19 0.97 0.32 0.34
Cumulative surfacearea of pores between1(
372 68 68 340 56 56
AM
iptio
sasbtofaWdsdwttlwS
tm
ttacao
3
dmF
hI
Fw
0 Å and 1000 Å radiusm2 g−1)verage pore radius (Å) 44 74 57odal pore radius (Å) 244 223 224
n the range of the low relative pressure of nitrogen indicate theresence of micropores, which was confirmed from the values ofhe micropore volume obtained with the t-method [24], as shownn Table 1. Further, high values of the BET specific surface area werebtained.
After the PVA coating of the microparticles and its sub-equent cross-linking with glutaraldehyde, the nitrogendsorption–desorption isotherms changed significantly. Con-idering first the low-relative pressure range of nitrogen, it cane observed that the micropores disappeared completely fromhe structure of the microparticles, as confirmed by the valuesf the micropore volume (Table 3). This was the main reasonor the severe decline in the values of the BET specific surfacerea after the modification of both types of microparticles.ith respect to the high-relative pressure range of nitrogen,
ifferent kinds of behaviour were observed, depending on theample. Thus, the PVA-coated microparticles of the S1 sampleisplayed isotherm of Type IV with a broad hysteresis loop,hich indicates that the pores were mainly mesopores subject
o difficulties as regards nitrogen desorption as a consequence ofheir shape. In fact, this is a typical bottle-neck-type hysteresisoop, which corresponds to pores with narrow entrances and
ider pores. In contrast, the PVA-coated microparticles of the2 sample continued to display isotherm of Type II, indicating
obppe
ig. 5. Pore size distributions of microparticles: (a) S1 and (b) S2. Note: the experimental daith mercury porosimetry data to obtain the complete pore size distribution.
57 113 123284 283 281
hat the macropores remained in the structure even after theodification.After the immobilization of Cibacron Blue F3GA on the micropar-
icles, these were analyzed again using the nitrogen adsorptionechnique. It was observed that, for both samples, the nitrogendsorption–desorption isotherms did not undergo any significanthange. Thus, in both cases, the values of the BET specific surfacerea were essentially the same before and after the immobilizationf the ligand, as seen in Table 3.
.3. Pore size distributions
From the experimental nitrogen adsorption data, the pore sizeistributions of both samples were obtained before and after eachodification step by following the BJH method [25], as shown in
ig. 5.For the S1 sample (Fig. 5a), the pore size distribution indicates a
igh proportion of mesopores in the structure of the microparticles.n contrast, the presence of macropores was less patent and, more-
ver, they decreased abruptly from a pore radius of 400 Å. Aftereing PVA-coated and cross-linked with glutaraldehyde, the micro-ores were almost completely clogged, and the size and quantity ofores with a pore radius between 10 Å and 70 Å decreased consid-rably. Regarding the macropores, although the modal pore radiusta on the adsorption of nitrogen by the plain S1 microparticles have been completed

3 l Engineering Journal 143 (2008) 337–348
rtrdsmp
sPmarmt
3
ocaoopasttTa
eFLra
L
F
waitat
e
Fi
ttoomt
ttnAbl
q
apbc
TA
A
L
A
L
44 C. Garcia-Diego, J. Cuellar / Chemica
emained almost unchanged (see values in Table 3), the size andhe quantity of macropores decreased abruptly from the modal poreadius. Nevertheless, the average pore radius increased because theecrease in pore volume was not so rapid as the decrease in poreurface (Table 3). Regarding the immobilization of the ligand to theicroparticles, no significant changes can be appreciated in the
ore size distribution of this sample of microparticles.Considering the S2 sample (Fig. 5b), the pore size distribution
hows a modal form, with a maximum value at 284 Å. After beingVA-coated and cross-linked, and also after immobilization, theicroparticles continued to have the same modal pore radius but,
s in the case of microparticles of the S1 sample, the average poreadius increased significantly (see values in Table 3). Regarding theacropores, although their quantity decreased after functionaliza-
ion, this was not as abrupt as for the S1 sample.
.4. Lysozyme adsorption equilibrium
Experiments addressing the lysozyme adsorption equilibriumn both functionalized samples were performed. However, in thease of the use of the S1 sample as an adsorbent, no appreciabledsorption was obtained. This can be explained in terms of the des-rption branch of its nitrogen isotherm in Fig. 4a, where it can bebserved that this branch is almost horizontal over the range from/p0 = 0.900 to p/p0 = 0.995 of nitrogen uptake, before which there issharp decrease. The value of the pore radius corresponding to thisharp decrease is about 75 Å meaning that, although the micropar-icles display the pore size distribution shown in Fig. 5a, access tohese pores is limited by narrower necks, with radii of about 75 Å.herefore, this complicates the penetration of the protein to thedsorption sites.
Considering the functionalized S2 adsorbent, Lys adsorptionquilibrium data on this adsorbent were obtained, as shown inig. 6. Different adsorption models (Langmuir, Freundlich, doubleangmuir, Sips, Toth, etc.) were fitted to these adsorption equilib-ium data. The Langmuir and Freundlich models can be expresseds follows:
angmuir model qe = qmbCe
1 + bCe(5)
reundlich model qe = AC1/ne (6)
here qm (mg g−1 dry functionalized adsorbent) is the maximumdsorption capacity of Lys on the adsorption sites; b (mL mg−1)s a parameter related to the affinity between the adsorbate and
he adsorption sites; A is a coefficient indicative of the relativedsorption capacity of the adsorbent; n is a parameter related tohe adsorption intensity.In the Langmuir isotherm (Eq. (5)), the value of the b param-ter depends on the energy of adsorption and it is assumed that
ao
wT
able 4dsorption properties of the functionalized macroreticular poly(styrene-co-divinylbenzen
dsorption properties Value
qm (mg g−1 dry functionalized adsorbent)
ys adsorption equilibriumLangmuir model 85.1 ± 2.0Sips model 100.8 ± 7.7
dsorption properties
ys adsorption kineticsShrinking-core modelSimplified solid-diffusion model
ig. 6. Curve of the adsorption isotherm of Lys on the Cibacron Blue F3GA-mmobilized polymeric microparticles of the S2 sample.
his value is the same for each active site and is independent ofhe presence of nearby adsorbed molecules. However, in the casef the adsorption of proteins, the protein–ligand interactions areften very complex and it is frequently found that the Langmuirodel is unable to adequately explain the shape of the experimen-
al equilibrium isotherm.The Freundlich isotherm (Eq. (6)) is more flexible and assumes
hat the energy of adsorption decreases logarithmically as the frac-ional coverage increases. However, the Freundlich isotherm doesot tend to a limiting coverage as the concentration tends to infinity.dditionally, Sips [28] proposed a model (Eq. (7)) that is a com-ination of Langmuir and Freundlich models and that eludes this
imitation.
e = qmbC1/ne
1 + bC1/ne
(7)
The underlying assumption in the Sips model is the existence ofdsorption sites in such a way that the energy of the diverse types ofossible interactions between the adsorbate and the adsorbent cane described by a symmetrical, quasi-Gaussian, energy distributionurve. This assumption seems to be very appropriate in the case of
ffinity adsorption because of the diverse types of binding that canccur between the adsorbate and the adsorbent.The fitting of the models to the adsorption equilibrium dataas accomplished by multiple non-linear regression techniques.
he Langmuir (Eq. (5)) and Sips (Eq. (7)) models emerged as the
e) microparticles of the S2 sample
b (mL mg−1) n �2 R2
5.9 ± 0.8 1 53.0 0.9912.3 ± 0.6 1.7 ± 0.3 13.1 0.998
Value
Di (×10−9 cm2 s−1) R2
4.0 0.9431.4 0.989

C. Garcia-Diego, J. Cuellar / Chemical Engin
Fi
blcgFt�t
c
3
aFuaet(ttrtoUbt
pim
gpT[
w(r
aaaatsyctmrcip
w
I
I
w
�
�
�
wq(b
idcdbadi
aib
wnb
ig. 7. Curve of the adsorption kinetics of Lys onto the Cibacron Blue F3GA-mmobilized polymeric microparticles of the S2 sample.
est models to describe the adsorption phenomenon. The calcu-ated values of the parameters of these equations as well as thehi-square value (�2) and the coefficient of determination (R2) areiven in Table 4. The curves resulting from these fits are plotted inig. 6. It may be observed that the best results were obtained whenhe Sips model was used. This is also corroborated by the values of2 and R2, because the lower the value of �2 and the closer to unity
he value of R2, the better the fit.As deduced from data in Table 4, the maximum adsorption
apacity of Lys on the functionalized S2 adsorbent is 100.8 mg g−1.
.5. Lysozyme adsorption kinetics
Kinetic data concerning the adsorption of Lys onto the function-lized S2 adsorbent were obtained at different times, as shown inig. 7, where qi is plotted versus time. It may be considered thatsually there are three steps involved in protein adsorption frombulk solution onto a solid adsorbent, all of which can be consid-red to offer resistance to protein uptake. These steps include massransfer from the bulk liquid to the outer surface of the particlesexternal mass transfer resistance), movement of the adsorbent intohe pores by diffusion (internal mass transfer resistance), and pro-ein binding to the ligand (adsorption resistance). The global uptakeate can be controlled by one or more of these three types of resis-ance, depending on the type of adsorbent and adsorbate and alson the operating conditions employed during the uptake process.sually, in protein uptake processes, steps 1 and 2 are rate-limiting,ecause such processes have a tendency to take place much slowerhan adsorption.
Two models are commonly used to characterize the transport ofroteins in porous particles [29,30], each involving a different driv-
ng force: (1) the pore-diffusion model and (2) the solid-diffusionodel.In the pore-diffusion model, protein diffusion is assumed to be
overned by the protein concentration gradient in the liquid-filledores, accompanied by adsorption onto the bounding pore walls.his behaviour is described by the following equation:
∂q′ ] ∂c De ∂(
2 ∂c)
εp + (1 − εp)∂c ∂t
=r2 ∂r
r∂r
(8)
here c and q′, that is, the concentration of protein in the poresmg mL−1) and in the particles on a pore-free basis (mg mL−1),espectively, are expressed as functions of the radial position r (cm)
ts
eering Journal 143 (2008) 337–348 345
nd uptake time t (s). De is the effective pore diffusivity (cm2 s−1),nd εp is the intraparticle porosity of the adsorbent. When thedsorption isotherm is non-linear, a numerical solution is gener-lly required. However, for a rectangular adsorption isotherm [31],he adsorption front within the particle approaches a shock tran-ition, separating an inner core into which the adsorbate has notet penetrated from an outer layer in which the adsorbed phaseoncentration is uniform at the saturation value. The dynamics ofhis process can be described approximately by the shrinking-core
odel. Under our experimental conditions, that is (i) external filmesistance negligible as a consequence of the high initial proteinoncentration and (ii) finite volume conditions due to the decreasen the protein concentration in the bulk solution as adsorption takeslace, this model can be written as follows [32]:
DeC0
R2pq∗
mt = I2 − I1 (9)
here and I1 and I2 are given by
1 = 16��
ln
[�3 + �3
�3 + 1
(� + 1� + �
)3]
+ 1
��√
3
[tan−1
(2� − �
�√
3
)− tan−1
(2 − �
�√
3
)](10)
2 = 13�
ln
[�3 + �3
�3 + 1
](11)
ith
=(
1 − q∗
q∗m
)1/3
(12)
= VMq∗m
VC0(13)
=(
1�
− 1)1/3
(14)
here q∗ is the particle-average solute concentration (mg mL−1),∗m is the maximum solute adsorption capacity in the particlesmg mL−1), VM is the volume of microparticles (mL), and V is theulk solution volume (mL).
Application of the shrinking-core model (Eq. (9)) to the exper-mental kinetic data allowed us to determine the effective poreiffusivity (De = 4.0 × 10⁻⁹ cm2 s−1) and the theoretical kineticurve, which is plotted in Fig. 7 together with the experimentalata. It can be seen that this model represents the experimentalehaviour in the saturation zone correctly, but that it does notllow the beginning of the curve to be fitted. Accordingly, the pore-iffusion model was discarded and the solid-diffusion model was
nvestigated.In the solid-diffusion model, all the protein inside the particle is
ssumed to be free to diffuse, the flux being based on the gradientn the total protein concentration [33]. This behaviour is describedy the following equation [34]:
∂q
∂t= Ds
r2
∂
∂r
(r2 ∂q
∂r
)(15)
here Ds is the solid-diffusion coefficient (cm2 s−1). In general, aumerical solution of the model is required. However, for modellingatch uptake from a finite fluid volume when the external mass
ransfer resistance is negligible, an approximation to this numericalolution can be used:qads
qm= 1 − 6
∞∑n=1
exp(−Dsp2nt/R2
p)
9�/(1 − �) + (1 − �)p2n
(16)

3 l Engineering Journal 143 (2008) 337–348
w
t
dapts
wscsih
oucrailamcsFapfm8
Fpss
3
bFpn
FM
46 C. Garcia-Diego, J. Cuellar / Chemica
here pn is given by the positive roots of
an pn = 3pn
3 + (1/� − 1)p2n
(17)
By applying Eq. (16) to the experimental kinetic data, the solid-iffusion coefficient was determined (Ds = 1.4 × 10⁻⁹ cm2 s−1),llowing us to obtain the theoretical kinetic curve and to com-are it with the experimental data (Fig. 7). It can be observed thathe simplified solid-diffusion model given by Eq. (16) fits the dataatisfactorily across the entire time range considered.
With regard to the values of the diffusion models obtainedith both models (Eqs. (9) and (16)), it can be seen that the
olid-diffusion coefficient, Ds, is smaller than the pore-diffusionoefficient, De. In fact, Ds is typically smaller than De for a givenystem because of the concentrating effect of adsorption: locally, qs generally higher than c, and the gradient ∂q/∂r is correspondinglyigher than ∂c/∂r [33].
Comparison of the results obtained here with those obtained inther studies addressing Lys adsorption equilibrium and kineticssing Cibacron Blue F3GA-attached affinity supports is very diffi-ult because, in most cases, either only the adsorption equilibriumesults are given [13,16,35,36] or the procedures used to obtain andnalyze the experimental data are not the same as those employedn this work [3–5,15,37]. For example, some authors have ana-yzed data on adsorption kinetics by applying pseudo-first-ordernd pseudo-second-order kinetic models instead of using diffusionodels [38]. However, Xue and Sun [39] reported some results that
an be compared with those obtained by us. Those authors synthe-ized Cibacron Blue F3GA-attached PVA microparticles containinge3O4 colloidal particles, with a mean particle size of 42.6 �m and
density of 1.12 g mL−1 calculated with the voidage and density ofacked bed, and used them as adsorbents for Lys adsorption. Theyound that, under their best experimental conditions, the maxi-um Lys adsorption capacity was 254 mg mL−1, with a value of.0 × 10−8 cm2 s−1 for De and a value of 6.0 × 10⁻¹¹ cm2 s−1 for Ds.
pa
mi
ig. 9. Light microscopy photographs showing the modification of the S2 plain polymericean particle size is 170 �m.
ig. 8. Schematic representation of some of the possible interactions between therotein and the dye–ligand attached to the PVA coating the polymeric surface:pecific interaction (case I), specific and non-specific interaction (case II), and non-pecific interaction (case III).
.6. Non-specific lysozyme adsorption
The effectiveness of the hydrophilic functionalization achievedy PVA coating and subsequent immobilization of Cibacron Blue3GA in preventing possible non-specific interactions between theolymeric matrix and the protein was established by determiningon-specific Lys adsorption. A scheme representation of some of the
ossible specific and non-specific interactions between the proteinnd the adsorbent is shown in Fig. 8.As already reported, this experiment was performed via a batchethod, by measuring the amount of Lys bound to the functional-
zed microparticles in the presence of a solution of Lys (1 mg mL−1)
microparticles (a and b) after the immobilization of Cibacron Blue F3GA (c and d).

C. Garcia-Diego, J. Cuellar / Chemical Engineering Journal 143 (2008) 337–348 347
F S2 mia eric m
obgra
3
put(rNain
3
mTpdbp
mTca
4
bmppmbcct
ePawowto
wtlptaA
ig. 10. Scanning electron microscopy photographs showing the modification of there given in a, c, e, g, i and k. Photographs of the Cibacron Blue F3GA-attached polym
f high ionic strength (1 mol L−1 NaCl in 0.05 mol L−1 phosphateuffer, pH 6.7). It was observed that only 2.6 mg of protein perram of dry functionalized adsorbent was adsorbed. Taking thisesult into account, it may be concluded that functionalization waschieved in a satisfactory manner.
.7. Desorption of lysozyme
An adsorbent is useful if recovery of the protein adsorbed isossible. Accordingly, a desorption experiment was carried outsing a batch method. In this experiment, Lys-adsorbed micropar-icles were placed in tubes with a solution of high ionic strength1 mol L−1 NaCl in 0.05 mol L−1 phosphate buffer, pH 7.3). Theesults showed that 73% of the Lys adsorbed was desorbed whenaCl was used as the desorption agent. The desorption of Lys isssumed to be due to the fact that NaCl decreases the specificnteractions between the positively charged groups of Lys and theegatively charged dye.
.8. Light and scanning electron microscopy
Microparticles of the S2 sample were characterized by lighticroscopy before and after functionalization, as shown in Fig. 9.
he colour modification of the microparticles after covalent incor-oration of the ligand may be observed. The images also show that,espite the high amount of PVA adsorbed (955 mg g−1 dry adsor-ent), the microparticles continue to be non-agglomerated, with aerfectly spherical form.
Additionally, SEM photographs of the plain and ligand-attachedicroparticles of the S2 sample were obtained, as seen in Fig. 10.
he detailed surface morphology of the microparticles reveals theoating with PVA. It can also be seen that macropores remainedfter the attachment of the ligand to the microparticles.
scrfc
croparticles after attachment of the ligand. Photographs of the plain microparticlesicroparticles are given in b, d, f, h, j and l.
. Conclusions
Hydrophilic adsorbents suitable for the adsorption ofiomolecules have been obtained by the modification ofacroreticular poly[S-co-DVB] microparticles with different
ore properties. To accomplish this, in a first step a PVA coatingrocedure was carried out to shield the surface of the poly-eric microparticles, thereby ensuring minimal non-specific
iomolecule adsorption. The PVA adsorption layer was laterross-linked with glutaraldehyde to provide a chemically stableoating and, finally, the microparticles were functionalized withhe triazine dye Cibacron Blue F3GA.
Structural changes in the microparticles were studied afterach modification step. Thus, with regard to the coating withVA, both micropores and low-interval mesopores were clogged,nd hence very low values of the BET specific surface areaere obtained. Regarding high-interval mesopores and macrop-
res, these only remained in the structure of the microparticleshich, initially, displayed a higher pore volume. Considering
he immobilization of the ligand, no significant change wasbserved.
The adsorption properties of the dye-immobilized adsorbentsere tested using lysozyme as a model protein. It was found that
he adsorption of Lys was only possible on microparticles thatargely continued to exhibit high-interval mesopores and macro-ores after functionalization. For these microparticles, it was seenhat the adsorption of Lys obeyed the Sips model, with a maximumdsorption capacity of 100.8 mg g−1 dry functionalized adsorbent.lso, the adsorption kinetics of Lys onto these microparticles was
tudied with two simplified diffusion models, that is, the shrinking-ore model and the simplified solid-diffusion model. The resultsevealed that the latter model fitted the experimental data satis-actorily across the entire time range studied, with a solid-diffusionoefficient of 1.4 × 10⁻⁹ cm2 s−1.
3 l Engin
mtto
A
SoF
R
[
[
[
[
[
[
[
[
[
[
[
[
[
[
[
[
[
[
[
[
[
[
[
[
[
[
[
[hydroxyethylmethacrylate) membranes for lysozyme adsorption, Colloid Surf.
48 C. Garcia-Diego, J. Cuellar / Chemica
The non-specific adsorption of Lys on the dye-immobilizedicroparticles was also studied in a batch system and it was found
o be 2.6 mg of protein per gram of functionalized adsorbent. Addi-ionally, a high desorption ratio (over 73% of the Lys adsorbed) wasbtained by using a 1 mol L−1 NaCl solution in a batch process.
cknowledgements
This work was supported financially by the Spanish Ministry ofcience and Technology (CTQ2006-13709), the Educational Councilf the Junta de Castilla y León (SA039A07), and the European Socialund.
eferences
[1] S.R. Narayanan, Preparative affinity chromatography of proteins, J. Chromatogr.A 658 (2) (1994) 237–258.
[2] J. Carlsson, J.C. Janson, M. Sparrman, Affinity chromatography, in: J.C. Janson,L. Ryden (Eds.), Protein Purification: Principles, High Resolution Methods, andApplications, Wiley-VCH, New York, 1989.
[3] D.C. Nash, G.E. McCreath, H.A. Chase, Modification of polystyrenic matrices forthe purification of proteins. Effect of the adsorption of poly(vinyl alcohol) onthe characteristics of poly(styrene-divinylbenzene) beads for use in affinitychromatography, J. Chromatogr. A 758 (1) (1997) 53–64.
[4] D.C. Nash, H.A. Chase, Modification of polystyrenic matrices for the purifica-tion of proteins. II. Effect of the degree of glutaraldehyde–poly(vinyl alcohol)crosslinking on various dye ligand chromatography systems, J. Chromatogr. A776 (1) (1997) 55–63.
[5] D.C. Nash, H.A. Chase, Modification of polystyrenic matrices for the purificationof proteins. III. Effects of poly(vinyl alcohol) modification on the characteristicsof protein adsorption on conventional and perfusion polystyrenic matrices, J.Chromatogr. A 776 (1) (1997) 65–73.
[6] M. Leonard, C. Fourier, E. Dellacherie, Polyvinyl alcohol-coated macroporouspolystyrene particles as stationary phases for the chromatography of proteins,J. Chromatogr. B 664 (1) (1995) 39–46.
[7] A. Tuncel, A. Denizli, D. Purvis, C.R. Lowe, E. Piskin, Cibacron Blue F3G-A-attached monosize poly(vinyl alcohol)-coated polystyrene microspheres forspecific albumin adsorption, J. Chromatogr. A 634 (2) (1993) 161–168.
[8] L. Varady, N. Mu, Y.B. Yang, S.E. Cook, N. Afeyan, F.E. Regnier, Fimbriated sta-tionary phases for proteins, J. Chromatogr. A 631 (1–2) (1993) 107–114.
[9] Y.B. Yang, F.E. Regnier, Coated hydrophilic polystyrene-based packing materials,J. Chromatogr. A 544 (1991) 233–247.
10] L. Shen, B.H. Xiong, R.Z. Cong, J.D. Wang, Preparation of Cibacron Blue F3GAbonded poly(styrene-divinylbenzene) (PSDVB) microbeads used for high per-formance affinity chromatography, Chin. Chem. Lett. 10 (7) (1999) 583–586.
11] K. Hosoya, Y. Kishii, K. Kimata, T. Araki, N. Tanaka, F. Svec, J.M.J. Frechet, Uniform-size hydrophobic polymer-based separation media selectively modified witha hydrophilic external polymeric layer, J. Chromatogr. A 690 (1) (1995) 21–28.
12] G. Bayramoglu, F.B. Senkal, G. Celik, M.Y. Arica, Preparation and characteri-zation of sulfonyl-hydrazine attached poly(styrene-divinylbenzene) beads forseparation of albumin, Colloid Surf. A: Physicochem. Eng. Asp. 294 (1–3) (2007)56–63.
13] N. Basar, L. Uzun, A. Güner, A. Denizli, Lysozyme purification with dye-affinity beads under magnetic field, Int. J. Biol. Macromol. 41 (3) (2007) 234–242.
14] T. Atkinson, P.M. Hammond, R.D. Hartwell, P. Hughes, M.D. Scawen, R.F. Sher-wood, D.A.P. Small, C.J. Bruton, M.J. Harvey, C.R. Lowe, Triazine dye affinitychromatography, Biochem. Soc. Trans. 9 (4) (1981) 290–293.
15] M.Y. Arica, G. Bayramoglu, Purification of lysozyme from egg white by ReactiveBlue 4 and Reactive Red 120 dye–ligands immobilised composite membranes,Process Biochem. 40 (3–4) (2005) 1433–1442.
[
[
eering Journal 143 (2008) 337–348
16] E. Unsal, A. Durdu, B. Elmas, M. Tuncel, A. Tuncel, A new affinity-HPLC packingfor protein separation: Cibacron blue attached uniform porous poly(HEMA-co-EDM) beads, Anal. Bioanal. Chem. 383 (6) (2005) 930–937.
17] A. Denizli, E. Piskin, Dye–ligand affinity systems, J. Biochem. Biophys. Methods49 (1–3) (2001) 391–416.
18] C. Garcia-Diego, J. Cuellar, Synthesis of macroporous poly(styrene-co-divinylbenzene) microparticles using n-heptane as the porogen: quantitativeeffects of the DVB concentration and the monomeric fraction on their structuralcharacteristics, Ind. Eng. Chem. Res. 44 (22) (2005) 8237–8247.
19] C. Garcia-Diego, J. Cuellar, Determination of the quantitative relation-ships between the synthesis conditions of macroporous poly(styrene-co-divinylbenzene) microparticles and the characteristics of their behavior asadsorbents using bovine serum albumin as a model macromolecule, Ind. Eng.Chem. Res. 45 (10) (2006) 3624–3632.
20] C. Garcia-Diego, J. Cuellar, Application of cluster analysis and optimizationto determine the synthesis conditions of macroreticular poly(styrene-co-divinylbenzene) microparticles with enhanced structural and adsorptionproperties, Chem. Eng. J. 139 (1) (2008) 198–207.
21] P.D.G. Dean, D.H. Watson, Protein purification using immobilized triazine dyes,J. Chromatogr. A 165 (3) (1979) 301–319.
22] S. Zhang, Y. Sun, Further studies on the contribution of electrostatic andhydrophobic interactions to protein adsorption on dye–ligand adsorbents,Biotechnol. Bioeng. 75 (6) (2001) 710–717.
23] S. Brunauer, P.H. Emmet, E. Teller, Adsorption of gases in multimolecular layers,J. Am. Chem. Soc. 60 (1938) 309–319.
24] B.C. Lippens, J.H. de Boer, Studies on pore systems in catalysts. V. t method, J.Catal. 4 (3) (1965) 319–323.
25] E.P. Barrett, L.G. Joyner, P.P. Halenda, The determination of pore volume and areadistributions in porous substances. I. Computations from nitrogen isotherms,J. Am. Chem. Soc. 73 (1) (1951) 373–380.
26] D.C. Montgomery, Design and Analysis of Experiments, 5th ed., John Wiley &Sons, New York, 2001, pp. 33–36.
27] K.S.W. Sing, D.H. Everett, R.A.W. Haul, L. Moscou, R.A. Pierotti, J. Rouquerol, T.Siemieniewska, Reporting physisorption data for gas/solid systems with specialreference to the determination of surface area and porosity (recommendations1984), Pure Appl. Chem. 57 (4) (1985) 603–619.
28] R. Sips, On the structure of a catalyst surface, J. Chem. Phys. 16 (5) (1948)490–495.
29] D.M. Ruthven, Principles of Adsorption and Adsorption Processes, Wiley, NewYork, 1984.
30] L.E. Weaver, G. Carta, Protein adsorption on cation exchangers: comparisonof macroporous and gel-composite media, Biotechnol. Prog. 12 (3) (1996)342–355.
31] A.K. Hunter, G. Carta, Protein adsorption on novel acrylamido-based polymericion exchangers. II. Adsorption rates and column behaviour, J. Chromatogr. A 897(1–2) (2000) 81–97.
32] W.K. Teo, D.M. Ruthven, Adsorption of water from aqueous ethanol using 3-Åmolecular sieves, Ind. Eng. Chem. Process Des. Dev. 25 (1) (1986) 17–21.
33] C. Chang, A.M. Lenhoff, Comparison of protein adsorption isotherms and uptakerates in preparative cation-exchange materials, J. Chromatogr. A 827 (2) (1998)281–293.
34] J. Crank, The Mathematics of Diffusion, 2nd ed., Oxford University Press, Lon-don, 1975.
35] S. Senel, R. Say, Y. Arica, A. Denizli, Zinc ion-promoted adsorption of lysozymeto Cibacron Blue F3GA-attached microporous polyamide hollow-fiber mem-branes, Colloid Surf. A: Physicochem. Eng. Asp. 182 (1–3) (2001) 161–173.
36] M. Odabasi, A. Denizli, Cibacron Blue F3GA incorporated magnetic poly(2-hydroxyethyl methacrylate) beads for lysozyme adsorption, J. Appl. Polym. Sci.93 (2) (2004) 719–725.
37] A. Denizli, S. Senel, M.Y. Arica, Cibacron Blue F3GA and Cu(II) derived poly(2-
B: Biointerfaces 11 (3) (1998) 113–122.38] E.B. Altintas, A. Denizli, Monosize poly(glycidyl methacrylate) beads for dye-
affinity purification of lysozyme, Int. J. Biol. Macromol. 38 (2) (2006) 99–106.39] B. Xue, Y. Sun, Protein adsorption equilibria and kinetics to a poly(vinyl alcohol)-
based magnetic affinity support, J. Chromatogr. A 921 (2) (2001) 109–119.
Copyright © 2022 FDOKUMEN