Magnetic Fe3O4@Mg/Al-layered double hydroxide adsorbent ...
15
1 Vol.:(0123456789) Scientific Reports | (2021) 11:2302 | https://doi.org/10.1038/s41598-021-81839-8 www.nature.com/scientificreports Magnetic Fe 3 O 4 @Mg/Al‑layered double hydroxide adsorbent for preconcentration of trace metals in water matrices Luthando Nyaba 1,2* , Tshimangadzo S. Munonde 1,2 , Anele Mpupa 1,2 & Philiswa Nosizo Nomngongo 1,2,3* A magnetic Fe 3 O 4 @MgAl‑layered double hydroxide (MLDH) nanocomposite was successfully synthesized and applied as an effective adsorbent for preconcentration of trace As(III), Cd(II), Cr(III), Co(II), Ni(II), and Pb(II) ions from complex matrices. The quantification of the analytes was achieved using the inductively coupled plasma optical emission spectrometry (ICP‑OES) technique. The nanocomposite was then characterized using BET, FTIR, SEM, and EDS. Due to its high adsorption surface area, compared to traditional metal oxide‑based adsorbents, MLDH nanocomposite exhibited high extraction efficiency. Several experimental parameters controlling the preconcentration of the trace metals were optimized using response surface methodology based on central composite design. Under optimum conditions, the linearity ranged from 0.1 to 500 µg L −1 and the correlation of coefficients (R 2 ) were higher than 0.999. The limits of detection (LODs) and quantification (LOQs) were 0.11–0.22 µg L −1 and 0.35–0.73 µg L −1 , respectively. The intra‑day (n = 10) and inter‑day precisions (n = 5 working days) expressed in the form of percent relative standard deviations (%RSDs) were below 5%. The proposed method was successfully applied for the analysis of the As(III), Cd(II), Cr(III), Co(II), Ni(II), and Pb(II) ions in different environmental water samples. Determination and monitoring of toxic trace metals such as lead, cadmium, mercury, thallium, and arsenic, have received more attention in recent years 1–3 . is is because of their toxicity to humans and other living organisms as well as wide availability in water systems 1 . ese metals come into contact with humans through food chain and uptake by plants 4 . ey can accumulate in human organs such as lungs, liver, kidney, immune system, central nervous, and heart amongst others, thus leading to serious health effects 4,5 . Numerous analytical methodologies have been used for the quantification of trace elements in water systems. ese include flame atomic absorption spectroscopy (FAAS) 6 , atomic fluorescence spectrometry (AFS) 7 , induc- tively coupled plasma-mass spectrometry (ICP-MS) 8,9 electrothermal atomic absorption spectroscopy (ETAAS) 10 , electrochemical methods, and ICP-OES. Among the aforementioned techniques, ICP-OES is one of the most widely used detection method 11 . is is because ICP-OES is robust and can be applied for the qualitative and qualitative analysis of multielement in complex matrices 12,13 . erefore, owing to the low concentration of trace metals in various samples and the complexity of the sample matrices, there is a need for separation/preconcen- tration methods before ICP-OES determination. is is because the preconcentration step improves the LOD/ LOQs, sensitivity, accuracy, and specificity of the analytical technique 14 . Sample preparation methods such as dispersive liquid–liquid micro-extraction (DLLME) 15 , solid-phase extraction (SPE) 16,17 , dispersive solid-phase microextraction (DSPME), and dispersive magnetic solid-phase extraction (DMSPE) 18 , among others have been used for preconcentration of trace metals. Dispersive mag- netic solid-phase extraction (DMSPE) is classified as a miniaturized SPE technique because smaller amounts of adsorbents are needed compared to the traditional SPE 19 . Other advantages of this technique include being easy to carry out, effective, and safe sample preparation method 12 . In this method, the adsorbent is added to the aqueous sample without conditioning step, instead, the sample with the sorbent is dispersed using external forces OPEN 1 Department of Chemical Sciences, University of Johannesburg, Doornfontein Campus, P.O. Box 17011, Doornfontein 2028, South Africa. 2 DSI/NRF SARChI: Nanotechnology for Water, University of Johannesburg, Doornfontein 2028, South Africa. 3 DSI/Mintek Nanotechnology Innovation Centre, University of Johannesburg, Doornfontein 2028, South Africa. * email: [email protected]; [email protected]
-
Upload
khangminh22 -
Category
Documents
-
view
8 -
download
0
Transcript of Magnetic Fe3O4@Mg/Al-layered double hydroxide adsorbent ...

1
Vol.:(0123456789)
Scientific Reports | (2021) 11:2302 | https://doi.org/10.1038/s41598-021-81839-8
www.nature.com/scientificreports
Magnetic Fe3O4@Mg/Al‑layered double hydroxide adsorbent for preconcentration of trace metals in water matricesLuthando Nyaba1,2*, Tshimangadzo S. Munonde1,2, Anele Mpupa1,2 & Philiswa Nosizo Nomngongo1,2,3*
A magnetic Fe3O4@MgAl‑layered double hydroxide (MLDH) nanocomposite was successfully synthesized and applied as an effective adsorbent for preconcentration of trace As(III), Cd(II), Cr(III), Co(II), Ni(II), and Pb(II) ions from complex matrices. The quantification of the analytes was achieved using the inductively coupled plasma optical emission spectrometry (ICP‑OES) technique. The nanocomposite was then characterized using BET, FTIR, SEM, and EDS. Due to its high adsorption surface area, compared to traditional metal oxide‑based adsorbents, MLDH nanocomposite exhibited high extraction efficiency. Several experimental parameters controlling the preconcentration of the trace metals were optimized using response surface methodology based on central composite design. Under optimum conditions, the linearity ranged from 0.1 to 500 µg L−1 and the correlation of coefficients (R2) were higher than 0.999. The limits of detection (LODs) and quantification (LOQs) were 0.11–0.22 µg L−1 and 0.35–0.73 µg L−1, respectively. The intra‑day (n = 10) and inter‑day precisions (n = 5 working days) expressed in the form of percent relative standard deviations (%RSDs) were below 5%. The proposed method was successfully applied for the analysis of the As(III), Cd(II), Cr(III), Co(II), Ni(II), and Pb(II) ions in different environmental water samples.
Determination and monitoring of toxic trace metals such as lead, cadmium, mercury, thallium, and arsenic, have received more attention in recent years1–3. This is because of their toxicity to humans and other living organisms as well as wide availability in water systems1. These metals come into contact with humans through food chain and uptake by plants4. They can accumulate in human organs such as lungs, liver, kidney, immune system, central nervous, and heart amongst others, thus leading to serious health effects4,5.
Numerous analytical methodologies have been used for the quantification of trace elements in water systems. These include flame atomic absorption spectroscopy (FAAS)6, atomic fluorescence spectrometry (AFS)7, induc-tively coupled plasma-mass spectrometry (ICP-MS)8,9 electrothermal atomic absorption spectroscopy (ETAAS)10, electrochemical methods, and ICP-OES. Among the aforementioned techniques, ICP-OES is one of the most widely used detection method11. This is because ICP-OES is robust and can be applied for the qualitative and qualitative analysis of multielement in complex matrices12,13. Therefore, owing to the low concentration of trace metals in various samples and the complexity of the sample matrices, there is a need for separation/preconcen-tration methods before ICP-OES determination. This is because the preconcentration step improves the LOD/LOQs, sensitivity, accuracy, and specificity of the analytical technique14.
Sample preparation methods such as dispersive liquid–liquid micro-extraction (DLLME)15, solid-phase extraction (SPE)16,17, dispersive solid-phase microextraction (DSPME), and dispersive magnetic solid-phase extraction (DMSPE)18, among others have been used for preconcentration of trace metals. Dispersive mag-netic solid-phase extraction (DMSPE) is classified as a miniaturized SPE technique because smaller amounts of adsorbents are needed compared to the traditional SPE19. Other advantages of this technique include being easy to carry out, effective, and safe sample preparation method12. In this method, the adsorbent is added to the aqueous sample without conditioning step, instead, the sample with the sorbent is dispersed using external forces
OPEN
1Department of Chemical Sciences, University of Johannesburg, Doornfontein Campus, P.O. Box 17011, Doornfontein 2028, South Africa. 2DSI/NRF SARChI: Nanotechnology for Water, University of Johannesburg, Doornfontein 2028, South Africa. 3DSI/Mintek Nanotechnology Innovation Centre, University of Johannesburg, Doornfontein 2028, South Africa. *email: [email protected]; [email protected]

2
Vol:.(1234567890)
Scientific Reports | (2021) 11:2302 | https://doi.org/10.1038/s41598-021-81839-8
www.nature.com/scientificreports/
such as vortex, microwave, and ultrasonic bath, among others which improve extraction kinetics and adsorption process20,21. The adsorbent is then recovered by an external magnet and the analytes are desorbed using an acid12.
Design and choice of adsorbents in solid-phase based sample preparation techniques plays a most important factor to get a good recovery and high selectivity13. Among other adsorbents reported in the literature, nano-materials have found great attention in recent years due to their high surface area and large adsorption area22. They are highly effective sorbents that can be applied for the pre-concentration of a wide range of analytes23. Nanomaterials such as layered double hydroxide (LDH) have received great attention in recent years due to their unique physical and chemical properties24. Layered double hydroxides are types of nanomaterials that are amongst a wide class of synthetic 2D anionic nano-clay materials22. The core aim of using LDH as sorbents over the other layered materials is because of its diversity and flexibility. As a result, LDH has been used as sorbents25, catalysts26, catalyst supports27, anion exchangers25, and molecular sieves28. Furthermore, LDH sorbents resemble mineral hydrotalcite (HT), a natural magnesium–aluminium hydroxyl carbonate (Mg6Al2(OH)16CO3·4H2O) because it consists of exchangeable adsorption sites. The attributes of LDH such as excellent anion exchange capacity, high surface area, good biocompatibility, specific structural characteristics, pH-dependent solubility, and high chemical stability are some of the few admirable properties which attracted several researchers’ interest25,29. While many magnetic LDHs have been synthesized, there are not many studies on their application as sorbents for pre-concentration of multi-element in complex matrices such as acid mine drainage and seawater.
The main purpose of this study was to develop an ultrasound-assisted-dispersive magnetic solid-phase extrac-tion (UA-DMSPE) technique for preconcentration of trace quantities of As(III), Cd(II), Cr(III), Co(II), Ni(II) and Pb(II) ions from complex water matrices. Magnetic Fe3O4@Mg/Al-layered double hydroxide (MLDH) nano-composite was used as an adsorbent for the extraction of selected trace metals. The response surface methodol-ogy (RSM) based on the central composite design (CCD) was employed to investigate the effects of important operating parameters such as sample pH, mass of adsorbent, eluent concentration, and extraction time on the preconcentration of trace metals.
ExperimentalReagents and solution. All reagents were of analytical grade unless specified and double-distilled deion-ized water was used during the experiments. Iron (III) trichloride hexahydrate (FeCl3·6H2O, molecular weight 270.30 g mol−1
, 99%), ammonium hydroxide solution (28%), iron(II) dichloride tetrahydrate (FeCl2·4H2O, molecular weight 198.81 g mol−1, 99%), magnesium nitrate hexahydrate (Mg(NO3)0.6H2O molecular mass 256.41 g mol−1, 99.999%), aluminium nitrate (Al(NO3)3 molecular weight 256.41 g mol−1, 99%), obtained from Sigma-Aldrich (St. Loius, MO, USA). A synthetic sample of multi-element at concentration of 50 μg L−1 was prepared from Spectrascan single element standards (1000 mg L−1) of As, Cd, Cr, Pb, Co, and Ni (Teknolab, Nor-way). A 100 mg L−1 Spectrascan multi-element standard solution (Teknolab, Norway,) for preparation working calibration standards. Certified reference material (ERM-CA713 trace metals in wastewater and standard refer-ence materials (NIST SRM 1640a trace elements in natural water) were obtained from Sigma. NIST SRM 1643e was purchased from the National Institute of Standards and Technology (Gaithersburg, MD, USA).
Instrumentation. Inductively coupled plasma–optical emission spectrometer (ICP-OES) (iCAP 6500 Duo, Thermo Scientific, UK) equipped with a charge injection device (CID) was employed for quantification of As(III), Cd(II), Cr(III), Co(II), Ni(II) and Pb(II) ions. The ultrasound-assisted preconcentration of trace metals was performed in a Scientech ultrasonic bath system with a frequency of 50 Hz and power of 150 W (Labotec, Midrand, South Africa). Scanning electron microscope (SEM) (JSM-6360LVSEM, JEOL Co., Japan) was used to examine the morphology Fe3O4@Mg/Al-LDH nanocomposite. The X-ray powder diffraction (XRD) patterns recorded using a Philips X-ray generator model PW 3710/31 a diffractometer with an automatic sample changer model PW 1775. The specific surface area, pore size, and pore volume values were measured using Surface Area and Porosity Analyzer (ASAP2020 V3. 00H, Micromeritics Instrument Corporation, Norcross, USA). Spectrum 100 FT-IR (PerkinElmer, USA) spectrometer equipped with Universal Attenuated Total Reflectance (ATR) was used to investigate the functional groups on the surface of the adsorbent, X-ray photon spectroscopy (XPS) on VG ESCALAB MARK II (VG, UK).
Sample collection and preparation. The sampling of real water samples (tap and river water) was col-lected from south of Johannesburg, South Africa, and were kept in 1000 mL polypropylene bottles and stored in the fridge at 4 °C until analysis. Prior to analysis, the water samples were filtered using 0.25 µm acrodisc and syringe.
Synthesis of Fe3O4 magnetic nano‑particles. The synthesis of Fe3O4 was synthesized following the method reported previously30. Briefly, 10.1 g of FeCl3·6H2O and 5 g of FeCl2·4H2O salts were dissolved in 150 mL of deionized water. The reaction was carried out under vigorous stirring at 85 °C under a nitrogen atmosphere. Whilst continuing stirring, 25 mL aliquot of ammonium hydroxide solution was added dropwise into the solu-tion to form a black precipitate. The mixture could stir at the same conditions for 15 min and then cooled at ambient temperature. The Fe3O4 was collected using an external magnet. The magnetic nanoparticles were rinsed with deionized water. The magnetitic nanoparticles were dried at 60 °C for 10 h in an over and then they were pulverized into fine particles using a pestle and mortar.
Synthesis of Fe3O4@Mg/Al‑LDH nanocomposite. The synthesis of Fe3O4@MgAl LDH nanocompos-ite was achieved following the procedure described elsewhere7,31. Briefly, 1.93 g of previously Fe3O4 nanoparticles were dispersed in 150 mL distilled water in a beaker for 15 min to obtain a uniform suspension. The precipitate

3
Vol.:(0123456789)
Scientific Reports | (2021) 11:2302 | https://doi.org/10.1038/s41598-021-81839-8
www.nature.com/scientificreports/
formed was then stirred vigorously at 60 °C, whilst adding dropwise a mixture of 12.8 g Mg(NO3)0.6H2O and 9.38 g Al(NO3)0.9H2O solution. Then the pH was adjusted to 10 by adding a mixture of 6.75 g NaOH and 5.29 Na2CO3 solution. The precipitate was left to age for 8 h, then washed several times with distilled water and sepa-rated using a magnet. It was dried at 60 °C overnight.
Preconcentration of trace metals using UA‑DMSPE method. The ultrasonic-assisted dispersive solid-phase extraction procedure was carried according to our previous methods12,32. Briefly, 50–100 mg of the magnetic LDHs nanocomposite was weighed into 100 mL plastic bottles, then an aliquot of 20 mL synthetic sample solutions (pH 3–9) was added to the sample bottles. The extraction and preconcentration of the As(III), Cd(II), Cr(III), Co(II), Ni(II), and Pb(II) ions were carried out by ultrasonication for 5–30 min. After the pre-concentration process, the sample solution and nano adsorbent were separated using an external magnetic. The analytes desorbed by adding 2.5 mL of 0.1–1.0 HNO3 to the adsorbent and sonicated for 5 min. The eluent and the nanoadsorbent were separated by magnetic decantation. The aqueous phase containing the analytes was filtered into a pre-cleaned polypropylene centrifuge tube using the PVDF syringe membrane. The filtrate was then analysed by ICP-OES. The experimental parameters affecting the preconcentration method were optimized using RSM employing a CCD. These parameters include the mass of adsorbent (MA), extraction time (ET), sample pH; and eluent concentration (EC). Under optimal conditions, the above method was repeated for the validation and application of the proposed method.
Method validation for the determination of trace metals. The performance and validation of the developed method were assessed using the linear range, precision (repeatability and reproducibility), preconcen-tration factor (PF), enhancement factor (EF), accuracy, the limit of detection (LOD), and limit of quantification (LOQ). The accuracy and precision (intraday and interday) were investigated using certified reference materials (ERM®-CA713) and standard reference materials (NIST SRM 1640a and 1643e). The accuracy was expressed as percentage recovery (%R) and relative error (%RE) and they were calculated according to Eqs. (1) and (2). The precision was expressed as relative standard deviation (%RSD) which was calculated using Eq. (3), where Sd is the standard deviation of five and ten replicates of the CRM analysis.
The LOD and LOQ were calculated as 3Sdm and 10Sdm , where Sd is the Standard deviation of ten measurements of blank solution (analysed and m is the slope of the respective investigated trace metal ion calibration curve. The linearity was investigated by preconcentrating a series of standard solutions ranging from 0 to 500 µg L−1.
Results and discussionCharacterization of the nanocomposite. X‑ray diffraction (XRD). Figure 1 presents the X-ray dif-fraction patterns of MgAl-LDH, Fe3O4, and Fe3O4@MgAl LDH nanocomposite. The appearance of peaks at 2θ 11 (003), 24 (006), 35 (012), 40 (0 15), 47 (018), 62 (110), and 64 (113) in Fig. 1a was assigned to the interlayer spacing of Mg–Al-LDH present in the composite7,33,34. These peaks are the same as those observed in Fig. 1b.
(1)%R =Obtained value
Certified value× 100
(2)%RE =Obtainedvalue − certifiedvalue
Certifiedvalue× 100
(3)%RSD =Sd
mean× 100
Figure 1. X-ray diffraction patterns of (a) magnetic Fe3O4/MgAl LDH nanocomposite, (b) MgAl-LDH.

4
Vol:.(1234567890)
Scientific Reports | (2021) 11:2302 | https://doi.org/10.1038/s41598-021-81839-8
www.nature.com/scientificreports/
The peaks at theta values and Miller indices (in brackets) 20 (111), 30 (220), 38 (311), 43 (400), 55 (442), and 58 (511) confirmed the incorporation of Fe3O4 nanoparticles in the composite31,35. Similar peaks can be observed for pristine Fe3O4 nanoparticles. These findings proved that the prepared adsorbent was crystalline and they were similar to those reported elsewhere35.
Morphological properties and elemental composition of the nanocomposite. The prepared magnetic Fe3O4@MgAl LDH was characterized by scanning electron microscope/(SEM/EDS) and transmission electron micros-copy (TEM) to examine the morphological properties as well as elemental composition (Fig. 2a,b). The Fe3O4@MgAl LDH nanocomposite shows various sizes of particles which suggests that the adsorbent has several sorp-tion active sites that can lead to higher adsorption capacities30. The EDS spectrum (Fig. 2c) shows that the nanocomposite was composed of Fe(31.58%), Mg(0.97%), Al(3.14%), and O(38.80%), confirming the successful synthesis of Fe3O4@MgAl LDH adsorbent and C(25.20%) which was from the carbon coating.
Brunauer–Emmett–teller (BET). Nitrogen adsorption/desorption isotherm and the subsequent pore size distri-bution (obtained from the adsorption/desorption isotherm) for the Fe3O4@MgAl LDH composite are illustrated in Fig. 3. As shown in Fig. 3a, the curve has a distinct hysteresis loop that was observed in the pressure range of 0.4–1.0 p/p0 which is a typical type IV isotherm. This implied that the prepared composite was mesoporous. The BET specific surface area pore volume and pore size (Fig. 3b–d) of the mesoporous composite were 143m2/g, 0.049 cm3/g, and 5.34 nm, respectively. The BET surface areas for MgAl LDH and Fe3O4 were 101 and 36.5 m2/g, respectively. An increase in the surface area of the composite compared to Fe3O4 shows that the magnetic Fe3O4 was successfully coated with MgAl LDH. These results are comparable to the literature7,24,33 and they were better than those reported elsewhere7,31. The relatively high specific surface area proved that the prepared adsorbent is suitable for the adsorption of trace metals.
Fourier‑transform infrared spectroscopy (FTIR). The Fourier-transform infrared spectroscopy (FTIR) tech-nique was used to assess the functional groups present on the surface of Fe3O4@MgAl-LDH nanocomposite and the results are presented in Fig. 4. The broad peak at 3434 cm−1 was ascribed to O–H stretching of LDH layers and interlayer water molecules7,33,36. A sharp at 1374 cm−1 was assigned to the stretching vibration of intercalated
Figure 2. (a) SEM (10 µm) and (b) EDS and (c) TEM of Fe3O4@Al–Mg LDH.

5
Vol.:(0123456789)
Scientific Reports | (2021) 11:2302 | https://doi.org/10.1038/s41598-021-81839-8
www.nature.com/scientificreports/
–NH3 from the synthesis of magnetite. The vibrations at 1636 cm−1, 783 cm−1, and 641 cm−1 were ascribed to the presence of CO3
− ions in the interlayer of LDHs36. The results are comparable to the literature31,36.
Selection of the adsorbent. The selection of a suitable and effective adsorbent is one of the critical aspects of the extraction and preconcentration of trace metals. Therefore, in this study, the sorption and extraction abil-ity of Fe3O4/MgAl LDH nanocomposite was evaluated in comparison with Fe3O4 and MgAl-LDH adsorbents. Figure 5 demonstrates that the Fe3O4/MgAl LDH nanocomposite and MgAl LDH exhibited better extraction efficacy than Fe3O4 nanoparticles. However, due to magnetism, Fe3O4/MgAl LDH nanocomposite displayed better separability compared to MgAl-LDH. Thus, the Fe3O4/MgAl LDH nanocomposite was chosen as the adsorbent for the preconcentration of trace metals.
Optimization of the preconcentration procedure using a central composite design. The CCD matrix and respective recoveries (analytical response) for each analyte are presented in supplementary data (Table S1). Analysis of variance (ANOVA) was carried to investigate the quality of the RSM model and assess the most significant parameters as well as to examine the interactions between the independent variables. The ANOVA results reproduced in the form of a Pareto chart (Fig. 6) revealed that the p-values of the individual variables were less than 0.05, implying that they are significant at a 95% confidence level.
Figure 3. (a) N2 adsorption–desorption isotherm, (b,c) specific surface area pore volume and (d) pore size of the Fe3O4@MgAl LDH composite.
Figure 4. FTIR spectra of magnetic Fe3O4/MgAl LDH nanocomposite before and after adsorption.

6
Vol:.(1234567890)
Scientific Reports | (2021) 11:2302 | https://doi.org/10.1038/s41598-021-81839-8
www.nature.com/scientificreports/
Response surface methodology. The three-dimensional response surface plots of the second-order polynomial equation were used to examine interactions between independent variables and their combined effect on the analytical response. The combined effect of two variables was assessed by varying them within the determined ranges while keeping two other variables at zero level (central point) (Fig. 7). The response surface plots for the effect of pH and eluent concentration, pH and extraction time, and pH and mass of adsorbent on the pre-concentration of target analytes show that the % recovery increased with a slight increase in sample pH. These observations agreed with the Pareto chart illustration which demonstrated that sample pH was ranked as the least significant factor. The response surface plots showing the effect of the mass of adsorbent and pH, the mass of adsorbent and eluent concentration as well as the mass of adsorbent and extraction time revealed that the analytical response for the target analytes increased with an increase in the mass of adsorbent. This might be due to the availability of adsorption sites on the surface of the adsorbent which enhances the extraction efficiency of the adsorbent. Lastly, the increase in extraction time and eluent concentration also proved to have a positive effect on the analytical response.
Optimization by desirability function. The desirability function was employed to optimize individual variables (sample pH, extraction time, eluent concentration, and mass of adsorbent) that affect the pre-concentration pro-cess. The desirability values of 0.0, 0.5, and 1.0 corresponded to the minimum, middle and maximum functions. The values in the desirability profile (Fig. 8) that are closer to 1.0 imply that the corresponding parameter or variable condition is optimum37. The optimum conditions for simultaneous preconcentration of As(III), Cd(II), Cr(III), Co(II), Ni(II), and Pb(II) ions were selected to be 6.5, 84 mg, 10 min, and 2.0 mol L−1 for sample pH, mass of adsorbent, extraction time and eluent concentration, respectively.
Adsorption capacity. The adsorption capacity of the nanocomposite was investigated under optimum con-ditions. An aliquot of 100 mL synthetic solutions containing 10–250 mg L−1 of As(III), Cd(II), Cr(III), Co(II), Ni(II), and Pb(II) ions was processed using the optimized preconcentration method. After equilibrium has been reached the solutions were determined using ICP-OES. The adsorption capacity was measured by using the fol-lowing formula:
Figure 5. Selection of an adsorbent: experiment condition: mass of adsorbent 50 mg; sample pH 7.5; extraction time 10 min; eluent concentration 1.0 mol L−1.
Figure 6. Pareto charts of standardized effects for optimization of preconcentration procedure.

7
Vol.:(0123456789)
Scientific Reports | (2021) 11:2302 | https://doi.org/10.1038/s41598-021-81839-8
www.nature.com/scientificreports/
Figure 7. Three-dimension response surface plots for optimization of the independent variables.
Figure 8. Profile for the predicted values and desirability function for the removal percentages of As(III), Cd(II), Cr(III), Co(II), Ni(II), and Pb(II) ions.

8
Vol:.(1234567890)
Scientific Reports | (2021) 11:2302 | https://doi.org/10.1038/s41598-021-81839-8
www.nature.com/scientificreports/
where qe is the adsorption capacity, C0 and Ce are the initial and equilibrium concentrations of the analytes, m and V are the mass of adsorbent and volume of synthetic solution. The equilibrium data were fitted to nonlinear Langmuir and Freundlich equations (Eqs. 5, 6). The parameters together with the correlation coefficient that resulted from the fitting of the two models are listed in Table 1.
where qe: amount adsorbed; qmax: maximum monolayer adsorption; KL: Langmuir constant; Ce; concentration of adsorbate at equilibrium; RL: separation factor; KF: adsorption capacity; 1/n: adsorption intensity.
The adsorption isotherms of the Fe3O4@MgAl LDH for As, Cd, Co, Cr, Ni, and Pb were performed under the optimized conditions. The results are shown in Table 1. As reported in Table 1, the R2 and RSE values of Langmuir models were higher than the R2 and RSE values of Freundlich. This suggested that the adsorption processes conformed well to the Langmuir model. The experimental maximum adsorption capacities for As, Cd, Co, Cr, Ni, and Pb Langmuir isotherms were found to be (124, 122, 138, 116, 120, 130) and for Freundlich were 0, 24.6, 22.6, 21.6, 23.5 and 25.2).
Adsorption mechanism. Even though the FTIR spectra of Fe3O4/MgAl LDH nanocomposite before and after adsorption of As(III), Cd(II), Cr(III), Co(II), Ni(II), and Pb(II) (Fig. 9a) showed no noticeable changes. The XRD patterns, EDS, and TEM spectra respectively were used for clarifying the removal mechanisms (Fig. 9b–d). It can be observed from XRD patterns demonstrated by (Fig. 9b) showed high crystallinity of the compounds before and after adsorption. The typical diffraction peaks of the Fe3O4@MgAl LDH before adsorption and after adsorption were still strong and sharp. The EDX of Fe3O4@MgAl LDH nanocomposite after adsorption shows (Fig. 9d,e) it is mainly composed of the elements O, Fe, Mg, Al, As, Ni, Cd, Cr, Co, and Pb this confirms the adsorption of the analytes by the adsorbent was successful.
The survey spectra of Fe3O4@MgAl LDH nanocomposites confirm the existence of Al, Mg, Fe, O, and C atoms on the nanocomposites before and after adsorption. Noticeably, the survey spectra of Fe3O4@MgAl LDH nanocomposite after the adsorption of metal ions show an increase in the intensity signal as compared to before adsorption, thus suggesting the conceivable adsorption of metal ions in solution (Fig. 10a)38. Subsequently, the high-resolution XPS spectra of Fe2p (Fig. 10d) exhibited two main peaks at 711.25 and 724.41 eV correspond-ing to Fe2p3/2 and Fe2p1/2, respectively. The deconvoluted Fe2p spectra before and after adsorption displayed Fe2+ and Fe3+ at 710.24 and 712.27 eV confirming the existence of Fe3O4 in the nanocomposite19. No significant shifts in the peaks on Fe2p were observed considering the binding energy before and after adsorption, indicating that Fe3O4 retained its chemical structure on the composite. As expected, the high-resolution spectra of Al2p (Fig. 10b) and Mg1s (Fig. 10e) with binding energies of 73.8 and 1304.2 eV show negligible changes before and after adsorption.
The deconvoluted high-resolution spectra of C1s (Fig. 10c) shows three-carbon contributions corresponding to the C–C, C–O and O–C=O at binding energies of 284.5, 286.1 and 288.5, respectively, before and after adsorp-tion. Subsequently, the C1s signal increased after adsorption from 22.5 to 23.9%. The increase in the C1s signal can be subjected to the increase in interlayer CO3
2− anions39. Moreover, the increase in the C1s signal correlates with the reduction in the O1s signal, as the reduction on the surface hydroxyl groups was complemented by the increase on the intercalated CO32− anions, which is one of the adsorption sites that can effectively adsorb metal cations of interest39–41. Interestingly, the Ols (Fig. 10f) content decreased after adsorption, indicating possible adsorption of As, Pb, Cd, Cr, Co, and Ni metals through the interaction with the present hydroxyl groups on the surface of the composite, which corroborates with the EDS results. Although adsorption primarily occurs through the interaction of the analyte with the surface hydroxyl groups, another site of adsorption concerning the intercalated CO3
2− has been reported40. This implies the adsorption of As, Pb, Cd, Cr, Co, and Ni occurs on both the intercalated MgAl-CO3
2− or on the surface MgAl-OHx/deprotonated MgAl-O−40. To this end, the pos-sible mechanisms of adsorption related to these interactions are listed as follows:
(4)qe =(C0 − Ce)V
m
(5)qe =qmaxKLCe
1+ KLCe
(6)qq = KFC1/ne
Table 1. Non-linear adjusted Langmuir and Freundlich isotherm parameters.
Analytes
Langmuir Freundlich
qmax (mg g−1) KL (L g−1) R2 Adj R2 RSE KF (L/mg) n R2 Adj R2 RSE
As 124 ± 1 0.078 ± 0.003 0.9675 ± 0.02 0.9280 ± 0.03 10.2 ± 0.5
Cd 122 ± 4 0.051 ± 0.002 0.9602 ± 0.03 0.9354 ± 0.05 9.1 ± 0.1 24.6 ± 0.4 3.09 ± 0.03 0.8638 ± 0.01 0.7144 ± 0.03 21.1 ± 0.3
Co 138 ± 3 0.045 ± 0.001 0.9648 ± 0.06 0.9234 ± 0.02 9.7 ± 0.3 22.6 ± 0.2 2.81 ± 0.02 0.9204 ± 0.02 0.8279 ± 0.02 17.2 ± 0.1
Cr 116 ± 4 0.046 ± 0.002 0.9638 ± 0.04 0.9256 ± 0.01 11.2 ± 0.6 21.6 ± 0.1 3.08 ± 0.03 0.8885 ± 0.02 0.7631 ± 0.01 16.9 ± 0.2
Ni 120 ± 1 0.042 ± 0.003 0.9077 ± 0.02 0.8921 ± 0.01 10.7 ± 0.6 23.5 ± 0.3 3.19 ± 0.08 0.8670 ± 0.01 0.7207 ± 0.02 19.1 ± 0.4
Pb 130 ± 4 0.061 ± 0.007 0.9834 ± 0.07 0.9412 ± 0.02 8.3 ± 0.1 25.2 ± 0.6 3.06 ± 0.03 0.9131 ± 0.04 0.8131 ± 0.03 13.2 ± 0.2
9
Vol.:(0123456789)
Scientific Reports | (2021) 11:2302 | https://doi.org/10.1038/s41598-021-81839-8
www.nature.com/scientificreports/
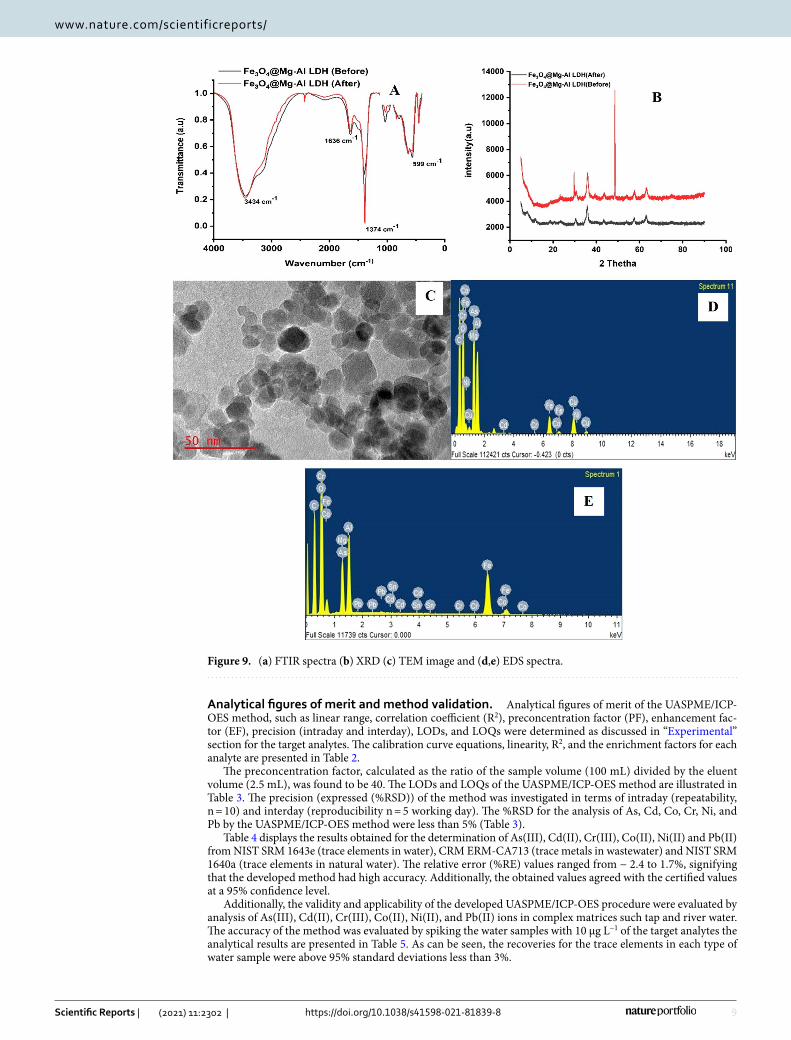
Analytical figures of merit and method validation. Analytical figures of merit of the UASPME/ICP-OES method, such as linear range, correlation coefficient (R2), preconcentration factor (PF), enhancement fac-tor (EF), precision (intraday and interday), LODs, and LOQs were determined as discussed in “Experimental” section for the target analytes. The calibration curve equations, linearity, R2, and the enrichment factors for each analyte are presented in Table 2.
The preconcentration factor, calculated as the ratio of the sample volume (100 mL) divided by the eluent volume (2.5 mL), was found to be 40. The LODs and LOQs of the UASPME/ICP-OES method are illustrated in Table 3. The precision (expressed (%RSD)) of the method was investigated in terms of intraday (repeatability, n = 10) and interday (reproducibility n = 5 working day). The %RSD for the analysis of As, Cd, Co, Cr, Ni, and Pb by the UASPME/ICP-OES method were less than 5% (Table 3).
Table 4 displays the results obtained for the determination of As(III), Cd(II), Cr(III), Co(II), Ni(II) and Pb(II) from NIST SRM 1643e (trace elements in water), CRM ERM-CA713 (trace metals in wastewater) and NIST SRM 1640a (trace elements in natural water). The relative error (%RE) values ranged from − 2.4 to 1.7%, signifying that the developed method had high accuracy. Additionally, the obtained values agreed with the certified values at a 95% confidence level.
Additionally, the validity and applicability of the developed UASPME/ICP-OES procedure were evaluated by analysis of As(III), Cd(II), Cr(III), Co(II), Ni(II), and Pb(II) ions in complex matrices such tap and river water. The accuracy of the method was evaluated by spiking the water samples with 10 µg L−1 of the target analytes the analytical results are presented in Table 5. As can be seen, the recoveries for the trace elements in each type of water sample were above 95% standard deviations less than 3%.
Figure 9. (a) FTIR spectra (b) XRD (c) TEM image and (d,e) EDS spectra.

10
Vol:.(1234567890)
Scientific Reports | (2021) 11:2302 | https://doi.org/10.1038/s41598-021-81839-8
www.nature.com/scientificreports/
Analysis of water samples using UASPME/ICP‑OES method. The developed UASPME/ICP-OES method was applied to the determination of trace As(III), Cd(II), Cr(III), Co(II), Ni(II), and Pb(II) ions in acid mine drainage effluents (SB, WB and Site 3) and the results are shown in Table 6. These findings suggested that the proposed method had the capability to extract, preconcentrate, and determine trace metals ions in real sam-ples with complex matrices.
The comparison of analytical characteristics of UASPME/ICP-OES method for preconcentration of As(III), Cd(II), Cr(III), Co(II), Ni(II), and Pb(II) ions with previously researched preconcentration procedures specifi-cally (solid-phase based extraction) reported in the literature are summarised in Table 7. It was observed that the proposed method had superior LOD, EF, RSD, and linear range compared to those reported elsewhere42,43. In the addition, parameters such as liner calibration range, LOD, EF, and RSD for UASPME/ICP-OES technique were
Figure 10. (a–f) XPS of Fe3O4@Al–Mg LDH after adsorption.

11
Vol.:(0123456789)
Scientific Reports | (2021) 11:2302 | https://doi.org/10.1038/s41598-021-81839-8
www.nature.com/scientificreports/
Table 2. Calibration curve equations, correlation coefficients and enrichment factors of UASPME/ICP-OES method for As(III), Cd(II), Cr(III), Co(II), Ni(II), and Pb(II) ions. a Enrichment factor was defined as the ratio between the slope of the calibration curves before and after preconcentration.
Analytes Equation before preconcentration Equation after preconcentration R2 Enrichment factor (EF)a
As(III) y = 0.0104 (± 0.0005)x + 0.0027 (± 0.0004)
y = 0.783 (± 0.0093)x + 0.0015 (0 ± .0002) 0.9997 ± 0.0009 75.3 ± 0.1
Cd(II) y = 0.0202 (± 0.009)x + 0.0045 (± 0.007) y = 0.618 (± 0.008)x + 0.0022 (± 0.0004) 0.9991 ± 0.0012 60.6 ± 0.3
Co(II) y = 0.0135 (± 0.0011)x + 0.0055 (± 0.0008) y = 0.955 (± 0.005)x + 0.0102 (± 0.0003) 0.9989 ± 0.0007 70.7 ± 0.5
Cr(III) y = 0.0143 (± 0.0006)x + 0.0072 (± 0.0011) y = 0.737 (± 0.0009)x + 0.0010 (± 0.007) 0.9992 ± 0.0005 51.5 ± 0.4
Ni(II) y = 0.0307 (± 0.0013)x + 0.0089 (± 0.0011) y = 0.936 (± 0.001)x + 0.0115 (± 0.003) 0.9994 ± 0.0009 87.5 ± 0.3
Pb(II) y = 0.0122 (± 0.0009)x + 0.0033 (± 0.0005) y = 0.884 (± 0.003)x + 0.0011 (± 0.0005) 0.9987 ± 0.0005 72.5 ± 0.4
Table 3. Analytical performances of UA-DSPME/ICP-OES method.
Analytes As(III) Cd(II) Co(II) Cr(III) Ni(II) Pb(II)
Linearity (μg L−1) 0.2–350 0.3–450 0.2–400 0.2–500 0.3–450 0.3–350
LOD (μg L−1) 0.11 ± 0.01 0.21 ± 0.02 0.16 ± 0.01 0.15 ± 0.02 0.22 ± 0.03 0.17 ± 0.02
LOQ (μg L−1) 0.35 ± 0.03 0.70 ± 0.07 0.55 ± 0.03 0.50 ± 0.07 0.73 ± 0.10 0.57 ± 0.07
Intraday (%RSD) 2.3 1.6 1.8 1.3 1.9 2.5
Interday (%RSD) 4.3 2.5 3.6 3.9 4 4.6
Table 4. Determination of As(III), Cd(II), Cr(III), Co(II), Ni(II) and Pb(II) ions (concentration, μg L−1) in certified and standard reference materials.
Analytes
ERM®-CA713 SRM 1640a SRM 1643e
Certified Found %RE Certified Found %RE Certified Found %RE
As(III) 10.8 ± 0.3 10.5 ± 0.5 − 2.8 8.08 ± 0.07 8.01 ± 0.08 − 0.87 60.5 ± 0.6 61.1 ± 1.1 0.99
Cd(II) 5.09 ± 0.20 4.98 ± 0.15 − 0.22 3.99 ± 0.07 4.01 ± 0.05 0.50 6.57 ± 0.07 6.62 ± 0.05 0.76
Cr(III) 20.9 ± 0.1.3 20.7 ± 0.9 − 0.96 40.5 ± 0.3 40.9 ± 0.9 0.99 20.4 ± 0.2 20.6 ± 0.5 0.98
Co(II) – 20.2 ± 0.2 19.8 ± 0.4 − 2.0 27.8 ± 0.3 28.1 ± 0.7 1.1
Ni(II) 50.3 ± 1.4 51.2 ± 2.3 1.7 25.3 ± 0.1 24.9 ± 0.5 − 1.6 62.4 ± 0.7 62.6 ± 0.6 0.32
Pb(II) 49.7 ± 1.7 50.3 ± 2.1 1.2 12.0 ± 0.1 11.9 ± 0.3 − 0.83 19.6 ± 0.2 19.3 ± 0.5 − 1.5
Table 5. Analysis of real samples using DSPME-SAE/ICP-OES.
Analytes Added (μg L−1)
Tap water River water
Found (μg L−1) Recovery (%) Found (μg L−1) Recovery (%)
As(III)0 BLOD – 0.53 ± 0.03 –
10 9.87 ± 0.11 98.7 10.5 ± 0.3 99.2
Cd(II)0 BLOD – 0.87 ± 0.01 –
10 9.78 ± 0.08 97.8 10.7 ± 0.7 98.3
Co(II)0 5.77 ± 0.06 – 16.3 ± 0.9 –
10 15.7 ± 0.2 99.3 26.2 ± 0.8 99.1
Cr(III)0 13.6 ± 0.9 – 23.8 ± 0.3 –
10 23.5 ± 0.9 98.6 33.7 ± 0.7 99.4
Ni(II)0 25.8 ± 0.8 – 56.7 ± 0.3 –
10 35.8 ± 0.5 99.8 66.9 ± 0.8 102
Pb(II)0 2.37 ± 0.10 – 6.23 ± 0.05 –
10 12.3 ± 0.6 99.3 16.1 ± 0.9 98.7

12
Vol:.(1234567890)
Scientific Reports | (2021) 11:2302 | https://doi.org/10.1038/s41598-021-81839-8
www.nature.com/scientificreports/
comparable to those stated in the literature44. However, the analytical performance on the developed method was relatively poor than those reported by Refs32,45.
Regeneration studies. The reusability and regeneration of Fe3O4@MgAl LDHs composite was performed by conducting subsequent adsorption/desorption experiments. Nitric acid (2.0 mol L˗1) was used to regenerate the spent Fe3O4@MgAl LDHs composite. The amount of trace metals after every adsorption/desorption cycle was expressed in terms of percentage recovery (%R). Figure 11. illustrate the % recoveries of each investigated metal ion. As shown in Figure, the Fe3O4@MgAl LDHs composite retained its adsorption capabilities up to the sixth cycle. After the sixth cycle, the adsorption efficiency gradually decreased by a small margin. At the end of the eighth adsorption/desorption cycle, the %R were 85.3%, 88.1%, 83.6%, 79.9%, 88.5% and 86.7% for As, Cd, Cr, Pb, Co, and Ni, respectively. Nonetheless, it can be concluded that Fe3O4@MgAl LDHs composite had demonstrated exceptional regeneration and reusability as the percentage recoveries decrease only slightly after the sixth cycle. Furthermore, the study of the stability of the prepared magnetic Fe3O4@MgAl LDH adsorbent in the adsorption system was performed by testing for the presence of Fe, Mg, and Al to evaluate the long-term stability. There were no Fe, Mg, and Al detected in all the ten parallel cycles, indicating there was no leaching of Fe3O4@MgAl LDH. Also, the prepared adsorbent showed stable magnetic property before and after use.
Table 6. Recoveries of As(III), Cd(II), Cr(III), Co(II), Ni(II) and Pb(II) ions from AMD water samples using the proposed UASPME/ICP-OES method, n = 3.
Samples
Elemental concentration in μg L−1, n = 3
As(III) Cd(II) Cr(III) Co(II) Ni(II) Pb(II)
SB ND 0.695 2.43 46.9 2.30 ND
WB 74.9 ND 2.83 48.93 ND ND
Site 3 8.69 0.175 21.5 41.0 ND 0.950
Table 7. Analytical characteristics of UA-DSPME/ICP-OES in comparison with other methods in the literature.
Analytes Analytical method Linearity µg L−1 LOD µg L−1 %RSD EF Refs
Cr, Co, Cd, Zn, and Pb mag-SPE/ICP-MS 0.001–0.11 < 10 46
Cd (II) MSPE/ETAAS 0.005–0.715 0.0019 2.8 23
Pb SPE/FAAS 1.7–1000 1.7 1.3 550 47
Cd, Pb, Ni SPE/FAAS 0.15, 0.40, 0.8 < 8.5 48
Cd(II) VA-DLLME/FAAS 0.25 < 2.5 43
Cd, Cr, Cu, and Pb SPE/EDXRF 24, 2.8, 16 and 9.7 2–8.1 42
Co, Ni, and Cd DMSPE/ICP-MS 0.0001, 0.0012 and 0.00009 45
Pb MSPE /FAAS 0.2 3.8 200 44
Pb UA-MSPE/ICP-OES 0.1–500 0.023 1.6 90 32
As, Cd, Cr, Pb, Co, Ni UA-DSPME/ICP-OES 0.2–500 0.11–0.22 1.3–2.5 51.5–87.5 This work
Figure 11. % recoveries of each investigated metal ion.

13
Vol.:(0123456789)
Scientific Reports | (2021) 11:2302 | https://doi.org/10.1038/s41598-021-81839-8
www.nature.com/scientificreports/
ConclusionThe Fe3O4@MgAl LDH composite was prepared successfully via the co-precipitation method. The prepared composite was characterized through instruments such as SEM–EDS, TEM, BET surface area, and FTIR. The Fe3O4@MgAl LDH composite was applied as an adsorbent in UA-DSPME for preconcentration of trace As(III), Cd(II), Cr(III), Co(II), Ni(II), and Pb(II) ions in river water, tap water, and mine wastewater samples. Experi-mental parameters affecting UA-DSPME/ICP-OES method were optimized using a multivariate approach. The UA-DSPME/ICP-OES method revealed outstanding analytical characteristics such as simplicity, rapidity, low LODs, high accuracy, enrichment factors, and precision. Furthermore, the performance of the UA-DSPME/ICP-OES method was applied for the determination of trace metals in complex matrices.
Received: 16 September 2020; Accepted: 11 January 2021
References 1. Dai, Y. & Liu, C. C. A simple, cost-effective sensor for detecting lead ions in water using under-potential deposited bismuth sub-
layer with differential pulse voltammetry (DPV). Sensors 17, 950 (2017). 2. Faisal, A. A., Al-Wakel, S. F., Assi, H. A., Naji, L. A. & Naushad, M. Waterworks sludge-filter sand permeable reactive barrier for
removal of toxic lead ions from contaminated groundwater. J. Water Process Eng. 33, 101112 (2020). 3. Kotp, Y. H. Controlled synthesis and sorption properties of magnesium silicate nanoflower prepared by a surfactant-mediated
method. Sep. Sci. Technol. 52, 657–670 (2017). 4. Chaiyo, S. et al. Electrochemical sensors for the simultaneous determination of zinc, cadmium and lead using a Nafion/ionic liquid/
graphene composite modified screen-printed carbon electrode. Anal. Chim. Acta 918, 26–34 (2016). 5. Kotp, Y. H., Ali, M. E., Mohallal, S. A. & Aboelfadl, M. M. Synthesis of a novel inorganic cation exchanger based on molybdate:
Applications for removal of Pb2+, Fe3+ and Mn2+ ions from polluted water. Sep. Sci. Technol. 54, 620–633 (2019). 6. Kafa, E. B., Fırat, M., Chormey, D. S., Turak, F. & Bakırdere, S. Sensitive determination of cadmium in lake water, municipal waste-
water and onion samples by slotted quartz tube-flame atomic absorption spectrometry after preconcentration with microextraction strategy. Measurement 125, 219–223 (2018).
7. Sun, J. et al. Removal of Cu2+, Cd2+ and Pb2+ from aqueous solutions by magnetic alginate microsphere based on Fe3O4/MgAl-layered double hydroxide. J. Colloid Interface Sci. 532, 474–484 (2018).
8. Nomngongo, P. N. & Ngila, J. C. Determination of trace Cd, Cu, Fe, Pb and Zn in diesel and gasoline by inductively coupled plasma mass spectrometry after sample clean up with hollow fiber solid phase microextraction system. Spectrochim. Acta Part B 98, 54–59 (2014).
9. Mokoena, D. P., Mngadi, S. V., Sihlahla, M., Dimpe, M. K. & Nomngongo, P. N. Development of a rapid and simple digestion method of freshwater sediments for As, Cd, Cr, Cu, Pb, Fe, and Zn determination by inductively coupled plasma-optical emission spectroscopy (ICP-OES): An evaluation of dilute nitric acid. Soil Sediment Contam. Int. J. 28, 323–333 (2019).
10. Ruiz, F. et al. An X-ray photoelectron spectroscopy study of the atomization of Mo from pyrolytic graphite platforms in electro-thermal atomic absorption spectroscopy. Spectrochim. Acta, Part B 133, 1–8 (2017).
11. Liang-Cheng, Z. et al. Application of inductively coupled plasma-atomic emission spectrometry/mass spectrometry to phase analysis of gold in gold ores. Chin. J. Anal. Chem. 46, e1801–e1809 (2018).
12. Nyaba, L., Matong, J. M. & Nomngongo, P. N. Nanoparticles consisting of magnetite and Al2O3 for ligandless ultrasound-assisted dispersive solid phase microextraction of Sb, Mo and V prior to their determination by ICP-OES. Microchim. Acta 183, 1289–1297 (2016).
13. Biata, N. R., Dimpe, K. M., Ramontja, J., Mketo, N. & Nomngongo, P. N. Determination of thallium in water samples using induc-tively coupled plasma optical emission spectrometry (ICP-OES) after ultrasonic assisted-dispersive solid phase microextraction. Microchem. J. 137, 214–222 (2018).
14. Bilal, M. et al. A new tunable dispersive liquid-liquid micro extraction method developed for the simultaneous preconcentration of lead and cadmium from lakes water: A multivariate study. Spectrochim. Acta Part A Mol. Biomol. Spectrosc. 183, 417–424 (2017).
15. Gaubeur, I., Aguirre, M., Kovachev, N., Hidalgo, M. & Canals, A. Dispersive liquid–liquid microextraction combined with laser-induced breakdown spectrometry and inductively coupled plasma optical emission spectrometry to elemental analysis. Microchem. J. 121, 219–226 (2015).
16. Diniz, K. M. et al. Preparation of SiO2/Nb2O5/ZnO mixed oxide by sol–gel method and its application for adsorption studies and on-line preconcentration of cobalt ions from aqueous medium. Chem. Eng. J. 239, 233–241 (2014).
17. Azzouz, A. et al. Review of nanomaterials as sorbents in solid-phase extraction for environmental samples. TrAC Trends Anal. Chem. 108, 347–369 (2018).
18. Dimpe, K. M., Nyaba, L., Magoda, C., Ngila, J. & Nomngongo, P. N. Synthesis, modification, characterization and application of AC@ Fe2O3@ MnO2 composite for ultrasound assisted dispersive solid phase microextraction of refractory metals in environmental samples. Chem. Eng. J. 308, 169–176 (2017).
19. Han, Q. et al. In-syringe solid-phase extraction for on-site sampling of pyrethroids in environmental water samples. Anal. Chim. Acta 1009, 48–55 (2018).
20. Cruz-Vera, M., Lucena, R., Cárdenas, S. & Valcárcel, M. Sample treatments based on dispersive (micro) extraction. Anal. Methods 3, 1719–1728 (2011).
21. Naushad, M., Mittal, A., Rathore, M. & Gupta, V. Ion-exchange kinetic studies for Cd (II), Co (II), Cu (II), and Pb (II) metal ions over a composite cation exchanger. Desalin. Water Treat. 54, 2883–2890 (2015).
22. Rajabi, M., Arghavani-Beydokhti, S., Barfi, B. & Asghari, A. Dissolvable layered double hydroxide as an efficient nanosorbent for centrifugeless air-agitated dispersive solid-phase extraction of potentially toxic metal ions from bio-fluid samples. Anal. Chim. Acta 957, 1–9 (2017).
23. Naghizadeh, M., Taher, M. A., Behzadi, M. & Moghaddam, F. H. Preparation a novel magnetic natural nano zeolite for precon-centration of cadmium and its determination by ETAAS. Environ. Nanotechnol. Monit. Manag. 8, 261–267 (2017).
24. Huang, Q. et al. Magnetic graphene oxide/MgAl-layered double hydroxide nanocomposite: One-pot solvothermal synthesis, adsorption performance and mechanisms for Pb2+, Cd2+, and Cu2+. Chem. Eng. J. 341, 1–9 (2018).
25. Zhou, M. et al. Design and fabrication of enhanced corrosion resistance Zn-Al layered double hydroxides films based anion-exchange mechanism on magnesium alloys. Appl. Surf. Sci. 404, 246–253 (2017).
26. Nayak, S. & Parida, K. Nanostructured CeO2/MgAl-LDH composite for visible light induced water reduction reaction. Int. J. Hydrogen Energy 41, 21166–21180 (2016).
27. An, Z., Wang, W., Dong, S. & He, J. Well-distributed cobalt-based catalysts derived from layered double hydroxides for efficient selective hydrogenation of 5-hydroxymethyfurfural to 2,5-methylfuran. Catal. Today 319, 128–138 (2019).

14
Vol:.(1234567890)
Scientific Reports | (2021) 11:2302 | https://doi.org/10.1038/s41598-021-81839-8
www.nature.com/scientificreports/
28. Bai, X. et al. All-solid state asymmetric supercapacitor based on NiCoAl layered double hydroxide nanopetals on robust 3D gra-phene and modified mesoporous carbon. Chem. Eng. J. 328, 873–883 (2017).
29. Kotp, Y. H., Souaya, E. R., Guindy, K. A. & Ibrahim, R. G. Development the sorption behavior of nanocomposite Mg/Al LDH by chelating with different monomers. Compos. B Eng. 175, 107131 (2019).
30. Munonde, T. S., Maxakato, N. W. & Nomngongo, P. N. Preconcentration and speciation of chromium species using ICP-OES after ultrasound-assisted magnetic solid phase extraction with an amino-modified magnetic nanocomposite prepared from Fe3O4, MnO2 and Al2O3. Microchim. Acta 184, 1223–1232 (2017).
31. Abdolmohammad-Zadeh, H., Jouyban, A. & Amini, R. Ultratrace determination of arsenic in water samples by electrothermal atomic absorption spectrometry after pre-concentration with Mg–Al–Fe ternary layered double hydroxide nano-sorbent. Talanta 116, 604–610 (2013).
32. Gugushe, A. S., Mpupa, A. & Nomngongo, P. N. Ultrasound-assisted magnetic solid phase extraction of lead and thallium in com-plex environmental samples using magnetic multi-walled carbon nanotubes/zeolite nanocomposite. Microchem. J. 149, 103960 (2019).
33. Shan, R.-R. et al. Magnetic Fe3O4/MgAl-LDH composite for effective removal of three red dyes from aqueous solution. Chem. Eng. J. 252, 38–46 (2014).
34. Sheng, T. et al. Adsorption of phosphorus by using magnetic Mg–Al-, Zn–Al-and Mg–Fe-layered double hydroxides: Comparison studies and adsorption mechanism. Environ. Sci. Pollut. Res. 26, 7102–7114 (2019).
35. Jung, I.-K., Jo, Y., Han, S.-C. & Yun, J.-I. Efficient removal of iodide anion from aqueous solution with recyclable core-shell magnetic Fe3O4@ Mg/Al layered double hydroxide (LDH). Sci. Total Environ. 705, 135814 (2020).
36. Shan, R.-R., Yan, L.-G., Yang, K., Hao, Y.-F. & Du, B. Adsorption of Cd (II) by Mg–Al–CO3-and magnetic Fe3O4/Mg–Al–CO3-layered double hydroxides: Kinetic, isothermal, thermodynamic and mechanistic studies. J. Hazard. Mater. 299, 42–49 (2015).
37. Mashile, G., Mpupa, A. & Nomngongo, P. In-syringe micro solid-phase extraction method for the separation and preconcentration of parabens in environmental water samples. Molecules 23, 1450 (2018).
38. Zhang, T. et al. Layered double hydroxide functionalized biomass carbon fiber for highly efficient and recyclable fluoride adsorp-tion. Appl. Biol. Chem. 62, 12 (2019).
39. Tan, Z. et al. In situ formation of NiAl layered double hydroxide with tunable interlayer spacing in a confined impinging jets microreactor. Energy Fuels 34(7), 8939–8946 (2020).
40. Modrogan, C. et al. Mixed oxide layered double hydroxide materials: Synthesis, characterization and efficient application for Mn2+ removal from synthetic wastewater. Materials 13, 4089 (2020).
41. Kameda, T., Tochinai, M., Kumagai, S. & Yoshioka, T. Mg−Al layered double hydroxide intercalated with CO32–and its recyclability for treatment of SO2. Appl. Clay Sci. 183, 105349 (2019).
42. Meira, L. A., Almeida, J. S., Dias, F. D. S. & Teixeira, L. S. Combination of extraction induced by microemulsion-breaking and pre-concentration using magnetic nanoparticles for multi-element determination of Cd, Cr, Cu and Pb in gasoline samples using energy dispersive X-ray fluorescence spectrometry. Microchem. J. 147, 660–665 (2019).
43. Elik, A., Altunay, N. & Gürkan, R. Microextraction and preconcentration of Mn and Cd from vegetables, grains and nuts prior to their determination by flame atomic absorption spectrometry using room temperature ionic liquid. J. Mol. Liq. 247, 262–268 (2017).
44. Abdolmohammad-Zadeh, H. & Salimi, A. Preconcentration of Pb (II) by using Mg (II)-doped NiFe2O4 nanoparticles as a magnetic solid phase extraction agent. Microchim. Acta 185, 343 (2018).
45. Chen, S., Yan, J., Li, J. & Lu, D. Dispersive micro-solid phase extraction using magnetic ZnFe2O4 nanotubes as adsorbent for preconcentration of Co(II), Ni(II), Mn(II) and Cd(II) followed by ICP-MS determination. Microchem. J. 147, 232–238 (2019).
46. Habila, M. A. et al. Carbon-coated Fe3O4 nanoparticles with surface amido groups for magnetic solid phase extraction of Cr(III), Co(II), Cd(II), Zn(II) and Pb(II) prior to their quantitation by ICP-MS. Microchim. Acta 184, 2645–2651 (2017).
47. Oliveira, J. D. A. N., Siqueira, L. M. C., de Sousa Neto, J. A., Coelho, N. M. M. & Alves, V. N. Preconcentration system for deter-mination of lead in chicken feed using Moringa oleifera husks as a biosorbent. Microchem. J. 133, 327–332 (2017).
48. Ghorbani-Kalhor, E. A metal-organic framework nanocomposite made from functionalized magnetite nanoparticles and HKUST-1 (MOF-199) for preconcentration of Cd(II), Pb(II), and Ni(II). Microchim. Acta 183, 2639–2647 (2016).
AcknowledgementsThe authors wish to thank the University of Johannesburg (UJ), Department of Chemical Science for providing their laboratory facilities. The authors are grateful to the DAAD/NRF joint in-country scholarship and NRF Thuthuka (grant no. 99270) for assisting in this project financially.
Author contributionsL.N.: conceptualization; data curation; formal analysis; funding acquisition; investigation; validation; visuali-zation; roles/writing—original draft. P.N.N.: conceptualization; funding acquisition; project administration; resources; software; supervision; methodology; validation; visualization; writing—review and editing. T.S.M.: XPS analysis, review and editing. A.M.: non-linear isotherm editing, review and editing.
Competing interests The authors declare no competing interests.
Additional informationSupplementary Information The online version contains supplementary material available at https ://doi.org/10.1038/s4159 8-021-81839 -8.
Correspondence and requests for materials should be addressed to L.N. or P.N.N.
Reprints and permissions information is available at www.nature.com/reprints.
Publisher’s note Springer Nature remains neutral with regard to jurisdictional claims in published maps and institutional affiliations.

15
Vol.:(0123456789)
Scientific Reports | (2021) 11:2302 | https://doi.org/10.1038/s41598-021-81839-8
www.nature.com/scientificreports/
Open Access This article is licensed under a Creative Commons Attribution 4.0 International License, which permits use, sharing, adaptation, distribution and reproduction in any medium or
format, as long as you give appropriate credit to the original author(s) and the source, provide a link to the Creative Commons licence, and indicate if changes were made. The images or other third party material in this article are included in the article’s Creative Commons licence, unless indicated otherwise in a credit line to the material. If material is not included in the article’s Creative Commons licence and your intended use is not permitted by statutory regulation or exceeds the permitted use, you will need to obtain permission directly from the copyright holder. To view a copy of this licence, visit http://creat iveco mmons .org/licen ses/by/4.0/.
© The Author(s) 2021