Cellulose-lanthanum hydroxide nanocomposite as a selective marker for detection of toxic copper
13
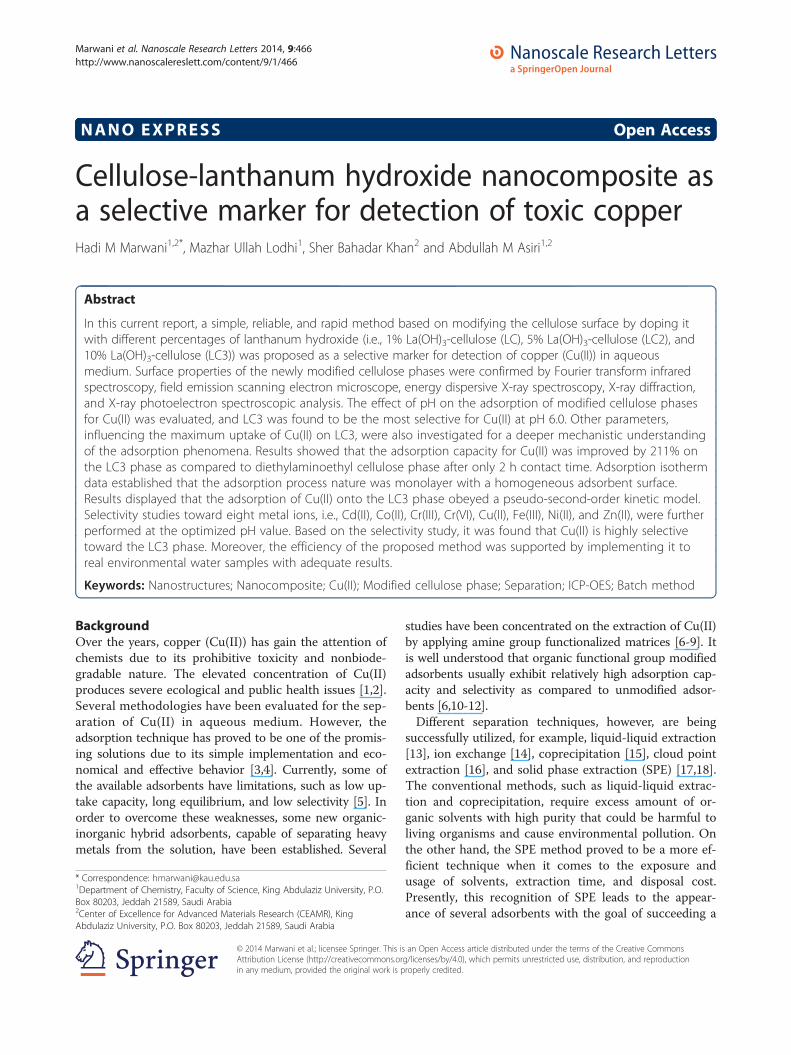
NANO EXPRESS Open Access Cellulose-lanthanum hydroxide nanocomposite as a selective marker for detection of toxic copper Hadi M Marwani 1,2* , Mazhar Ullah Lodhi 1 , Sher Bahadar Khan 2 and Abdullah M Asiri 1,2 Abstract In this current report, a simple, reliable, and rapid method based on modifying the cellulose surface by doping it with different percentages of lanthanum hydroxide (i.e., 1% La(OH) 3 -cellulose (LC), 5% La(OH) 3 -cellulose (LC2), and 10% La(OH) 3 -cellulose (LC3)) was proposed as a selective marker for detection of copper (Cu(II)) in aqueous medium. Surface properties of the newly modified cellulose phases were confirmed by Fourier transform infrared spectroscopy, field emission scanning electron microscope, energy dispersive X-ray spectroscopy, X-ray diffraction, and X-ray photoelectron spectroscopic analysis. The effect of pH on the adsorption of modified cellulose phases for Cu(II) was evaluated, and LC3 was found to be the most selective for Cu(II) at pH 6.0. Other parameters, influencing the maximum uptake of Cu(II) on LC3, were also investigated for a deeper mechanistic understanding of the adsorption phenomena. Results showed that the adsorption capacity for Cu(II) was improved by 211% on the LC3 phase as compared to diethylaminoethyl cellulose phase after only 2 h contact time. Adsorption isotherm data established that the adsorption process nature was monolayer with a homogeneous adsorbent surface. Results displayed that the adsorption of Cu(II) onto the LC3 phase obeyed a pseudo-second-order kinetic model. Selectivity studies toward eight metal ions, i.e., Cd(II), Co(II), Cr(III), Cr(VI), Cu(II), Fe(III), Ni(II), and Zn(II), were further performed at the optimized pH value. Based on the selectivity study, it was found that Cu(II) is highly selective toward the LC3 phase. Moreover, the efficiency of the proposed method was supported by implementing it to real environmental water samples with adequate results. Keywords: Nanostructures; Nanocomposite; Cu(II); Modified cellulose phase; Separation; ICP-OES; Batch method Background Over the years, copper (Cu(II)) has gain the attention of chemists due to its prohibitive toxicity and nonbiode- gradable nature. The elevated concentration of Cu(II) produces severe ecological and public health issues [1,2]. Several methodologies have been evaluated for the sep- aration of Cu(II) in aqueous medium. However, the adsorption technique has proved to be one of the promis- ing solutions due to its simple implementation and eco- nomical and effective behavior [3,4]. Currently, some of the available adsorbents have limitations, such as low up- take capacity, long equilibrium, and low selectivity [5]. In order to overcome these weaknesses, some new organic- inorganic hybrid adsorbents, capable of separating heavy metals from the solution, have been established. Several studies have been concentrated on the extraction of Cu(II) by applying amine group functionalized matrices [6-9]. It is well understood that organic functional group modified adsorbents usually exhibit relatively high adsorption cap- acity and selectivity as compared to unmodified adsor- bents [6,10-12]. Different separation techniques, however, are being successfully utilized, for example, liquid-liquid extraction [13], ion exchange [14], coprecipitation [15], cloud point extraction [16], and solid phase extraction (SPE) [17,18]. The conventional methods, such as liquid-liquid extrac- tion and coprecipitation, require excess amount of or- ganic solvents with high purity that could be harmful to living organisms and cause environmental pollution. On the other hand, the SPE method proved to be a more ef- ficient technique when it comes to the exposure and usage of solvents, extraction time, and disposal cost. Presently, this recognition of SPE leads to the appear- ance of several adsorbents with the goal of succeeding a * Correspondence: [email protected] 1 Department of Chemistry, Faculty of Science, King Abdulaziz University, P.O. Box 80203, Jeddah 21589, Saudi Arabia 2 Center of Excellence for Advanced Materials Research (CEAMR), King Abdulaziz University, P.O. Box 80203, Jeddah 21589, Saudi Arabia © 2014 Marwani et al.; licensee Springer. This is an Open Access article distributed under the terms of the Creative Commons Attribution License (http://creativecommons.org/licenses/by/4.0), which permits unrestricted use, distribution, and reproduction in any medium, provided the original work is properly credited. Marwani et al. Nanoscale Research Letters 2014, 9:466 http://www.nanoscalereslett.com/content/9/1/466
-
Upload
independent -
Category
Documents
-
view
0 -
download
0
Transcript of Cellulose-lanthanum hydroxide nanocomposite as a selective marker for detection of toxic copper
Marwani et al. Nanoscale Research Letters 2014, 9:466http://www.nanoscalereslett.com/content/9/1/466
NANO EXPRESS Open Access
Cellulose-lanthanum hydroxide nanocomposite asa selective marker for detection of toxic copperHadi M Marwani1,2*, Mazhar Ullah Lodhi1, Sher Bahadar Khan2 and Abdullah M Asiri1,2
Abstract
In this current report, a simple, reliable, and rapid method based on modifying the cellulose surface by doping itwith different percentages of lanthanum hydroxide (i.e., 1% La(OH)3-cellulose (LC), 5% La(OH)3-cellulose (LC2), and10% La(OH)3-cellulose (LC3)) was proposed as a selective marker for detection of copper (Cu(II)) in aqueousmedium. Surface properties of the newly modified cellulose phases were confirmed by Fourier transform infraredspectroscopy, field emission scanning electron microscope, energy dispersive X-ray spectroscopy, X-ray diffraction,and X-ray photoelectron spectroscopic analysis. The effect of pH on the adsorption of modified cellulose phasesfor Cu(II) was evaluated, and LC3 was found to be the most selective for Cu(II) at pH 6.0. Other parameters,influencing the maximum uptake of Cu(II) on LC3, were also investigated for a deeper mechanistic understandingof the adsorption phenomena. Results showed that the adsorption capacity for Cu(II) was improved by 211% onthe LC3 phase as compared to diethylaminoethyl cellulose phase after only 2 h contact time. Adsorption isothermdata established that the adsorption process nature was monolayer with a homogeneous adsorbent surface.Results displayed that the adsorption of Cu(II) onto the LC3 phase obeyed a pseudo-second-order kinetic model.Selectivity studies toward eight metal ions, i.e., Cd(II), Co(II), Cr(III), Cr(VI), Cu(II), Fe(III), Ni(II), and Zn(II), were furtherperformed at the optimized pH value. Based on the selectivity study, it was found that Cu(II) is highly selectivetoward the LC3 phase. Moreover, the efficiency of the proposed method was supported by implementing it toreal environmental water samples with adequate results.
Keywords: Nanostructures; Nanocomposite; Cu(II); Modified cellulose phase; Separation; ICP-OES; Batch method
BackgroundOver the years, copper (Cu(II)) has gain the attention ofchemists due to its prohibitive toxicity and nonbiode-gradable nature. The elevated concentration of Cu(II)produces severe ecological and public health issues [1,2].Several methodologies have been evaluated for the sep-aration of Cu(II) in aqueous medium. However, theadsorption technique has proved to be one of the promis-ing solutions due to its simple implementation and eco-nomical and effective behavior [3,4]. Currently, some ofthe available adsorbents have limitations, such as low up-take capacity, long equilibrium, and low selectivity [5]. Inorder to overcome these weaknesses, some new organic-inorganic hybrid adsorbents, capable of separating heavymetals from the solution, have been established. Several
* Correspondence: [email protected] of Chemistry, Faculty of Science, King Abdulaziz University, P.O.Box 80203, Jeddah 21589, Saudi Arabia2Center of Excellence for Advanced Materials Research (CEAMR), KingAbdulaziz University, P.O. Box 80203, Jeddah 21589, Saudi Arabia
© 2014 Marwani et al.; licensee Springer. This isAttribution License (http://creativecommons.orin any medium, provided the original work is p
studies have been concentrated on the extraction of Cu(II)by applying amine group functionalized matrices [6-9]. Itis well understood that organic functional group modifiedadsorbents usually exhibit relatively high adsorption cap-acity and selectivity as compared to unmodified adsor-bents [6,10-12].Different separation techniques, however, are being
successfully utilized, for example, liquid-liquid extraction[13], ion exchange [14], coprecipitation [15], cloud pointextraction [16], and solid phase extraction (SPE) [17,18].The conventional methods, such as liquid-liquid extrac-tion and coprecipitation, require excess amount of or-ganic solvents with high purity that could be harmful toliving organisms and cause environmental pollution. Onthe other hand, the SPE method proved to be a more ef-ficient technique when it comes to the exposure andusage of solvents, extraction time, and disposal cost.Presently, this recognition of SPE leads to the appear-ance of several adsorbents with the goal of succeeding a
an Open Access article distributed under the terms of the Creative Commonsg/licenses/by/4.0), which permits unrestricted use, distribution, and reproductionroperly credited.

Marwani et al. Nanoscale Research Letters 2014, 9:466 Page 2 of 13http://www.nanoscalereslett.com/content/9/1/466
selective separation of the analytes, for instance, alumina[19], C18 [20], molecular imprinted polymers [21], cellu-lose [22], silica gel [23], and activated carbon [24,25].Cellulose is considered to be one of the highly abun-
dant naturally existing polymers in the world. This com-prises repeating units of β-D-glucopyranose, covalentlylinked with OH group of C4 and C1 carbon atoms[26-28]. Naturally occurring cellulose shows less adsorp-tion capacity and physical stability due to the steric hin-drance offered by three hydroxyl groups with the samering. Moreover, these hydroxyl moieties are chemicallyunreactive as the polymer matrix contains crystalline re-gions [27,29]. In order to develop adsorption capacityand structural stability of natural cellulose, modificationswere employed in the matrix by means of chemical reac-tions, such as halogenation, etherification, esterification,and oxidation. Such modified matrices were found to becapable of separating heavy metal ions from aqueous so-lutions [27]. The cellulose beads when treated mainlywith 2-(diethylamino) ethyl chloride hydrochloride alongwith some other treatments produced diethylaminoethylcellulose [30]. Recently, we have also developed somesurface modified cellulose adsorbents for the selectiveseparation of Ni(II) and Cr(VI) ions [31,32].In order to monitor metal ionic species in the environ-
ment, the development of rapid, simple, and proficientapproach has gain an interest. Different approaches wereemployed for the determination of metal ions in aqueousmedium, namely atomic absorption spectrometry (AAS)[33], inductively coupled plasma-mass spectrometry (ICP-MS) and inductively coupled plasma-optical emissionspectrometry (ICP-OES) [34-36], anodic stripping volt-ammetry [37], and ion chromatography [38]. Despiteimmense enhancement in selectivity and sensitivity ofstate-of-the-art instruments, there is still a vital need forimprovement in selective separation of chemical speciesof interest prior to their determination; in particular, theconcentration of such analytes is frequently low in com-plex matrices. Moreover, a cleanup step is frequentlyneeded because of high level of other constituents ac-companying the analyte.Current study emphasizes the development of new
cellulose-based adsorbents by surface modification. Lan-thanum hydroxide was doped with cellulose with a pro-portion of 1%, 5%, and 10% [i.e., 1% La(OH)3-cellulose(LC), 5% La(OH)3-cellulose (LC2), and 10% La(OH)3-cellulose (LC3)]. Additionally, the effectiveness of nano-composites was investigated as a potential adsorbent fora selective extraction of Cu(II) ion prior to its determin-ation by ICP-OES. Several parameters were evaluated inorder to acquire the optimum condition for Cu(II) ex-traction. The pH effect on Cu(II) adsorption was investi-gated and optimized for the best modified cellulosephase (LC3). In order to understand the mechanism of
Cu(II) adsorption, other parameters controlling the max-imum uptake of Cu(II) on LC3 was studied at theoptimum pH 6.0. Furthermore, adsorption data was mod-eled by Freundlich and Langmuir adsorption isotherms.The kinetics of adsorption was evaluated by employingpseudo-first- and second-order kinetic models. At opti-mized pH, selectivity was also scrutinized for other metalion, including Cd(II), Co(II), Cr(III), Cr(VI), Fe(III), Ni(II),and Zn(II). This study revealed that LC3 was the most se-lective toward Cu(II) in comparison to other metal ions.Ultimately, the proposed method was further validated byanalysis of real environmental water samples.
MethodsChemicals and reagentsDiethylaminoethyl (DEAE) cellulose, lanthanum chloride,and ethanol were purchased from Sigma-Aldrich (Milwau-kee, WI, USA). Stock standard solutions of 1,000 mgL−1
Cd(II), Co(II), Cu(II),Cr(III), Cr(VI), Fe(III), Ni(II), andZn(II) were obtained from Sigma-Aldrich (Milwaukee,WI, USA). All utilized reagents were of high purity andof analytical reagent grade, whereas double-distilleddeionized water was used throughout the experiments.
Preparation of the new solid phase extractor based onDEAE celluloseDifferent amounts of DEAE cellulose (99%, 95%, and90%) were first mixed with distilled deionized water.Various portions of lanthanum chloride (1%, 5%, and10%) were then dissolved in distilled deionized waterand mixed with DEAE cellulose water suspensions. Allsolutions were adjusted to pH 10.0 by a dropwiseaddition of 0.1-M NaOH. Mixtures were then allowed tostir at 60°C for 24 h. Mixtures were filtered, washed withethanol twice and 18.2 MΩ cm distilled deionized water,and dried in oven at 80°C for 5 h to obtain LC, LC2, andLC3 nanocomposites.
Samples preparation and procedureStock standard solutions of Cd(II), Co(II), Cu(II),Cr(III),Cr(VI), Fe(III), Ni(II), Pb(II), and Zn(II) ions were pre-pared in 18.2 MΩ cm distilled deionized water and storedin the refrigerator at 4°C. The environmental sampleswere collected from seawater, wastewater, tap water, andground water from Jeddah region at Saudi Arabia.
Effect of pHThe effect of pH on the adsorption of Cu(II) ion onto n%La(OH)3 DEAE cellulose was investigated. Standard solu-tions of 5.0 mgL−1 Cu(II) were adjusted to pH values ran-ging from 1.0 to 8.0 with appropriate buffer solutions, i.e.,HCl/KCl buffer for pH 1.0 and 2.0, acetate buffer forpH 3.0 to 5.0, and KH2PO4/NaOH buffer for pH 6.0 to8.0. Each solution was individually mixed with 25.0 mg of
Marwani et al. Nanoscale Research Letters 2014, 9:466 Page 3 of 13http://www.nanoscalereslett.com/content/9/1/466
modified cellulose phases (LC, LC2, or LC3) and unmodi-fied DEAE cellulose phase and mechanically shaken for 2 hby a mechanical shaker at 150 rpm and 25°C temperature.
Effect of concentrationTo estimate the uptake capacity of Cu(II) under batchconditions, standard solutions of 0, 1, 5, 10, 20, 30, 40, 50,80, 100, 150, 200, 300, 400, and 500 mgL−1 were preparedand adjusted to the optimum pH 6.0 with the buffer solu-tion of KH2PO4/NaOH. Each solution was individuallyadded to 25.0 mg LC3 (or unmodified DEAE cellulose).All mixtures were then allowed to be mechanically shakenfor 2 h at 25°C.
Effect of temperatureFor the effect of temperature, standard solutions of5.0 mgL−1 Cu(II) were prepared, adjusted to the pH 6.0 asabove, and individually mixed with 25.0 mg LC3. Thermo-dynamic study of the adsorption of LC3 toward Cu(II)was also performed under the same batch conditions atdifferent temperatures (298, 308, 323, and 338 K).
Effect of shaking timeThe effect of shaking time on LC3 adsorption for Cu(II)was performed under the same batch conditions asabove by given various equilibrium periods (5, 10, 20,30, 50, 80, 100, and 120 min) and at a concentration of400 mgL−1 of Cu(II).
Selectivity studiesIn order to investigate the selectivity of modified cellu-lose adsorbents toward different metal ions, includingCd(II), Co(II), Cu(II), Cr(III), Cr(VI), Fe(III), Ni(II), Pb(II), and Zn(II), 5 mgL−1 of each metal ion solution was
LC
LC3 before adsorption
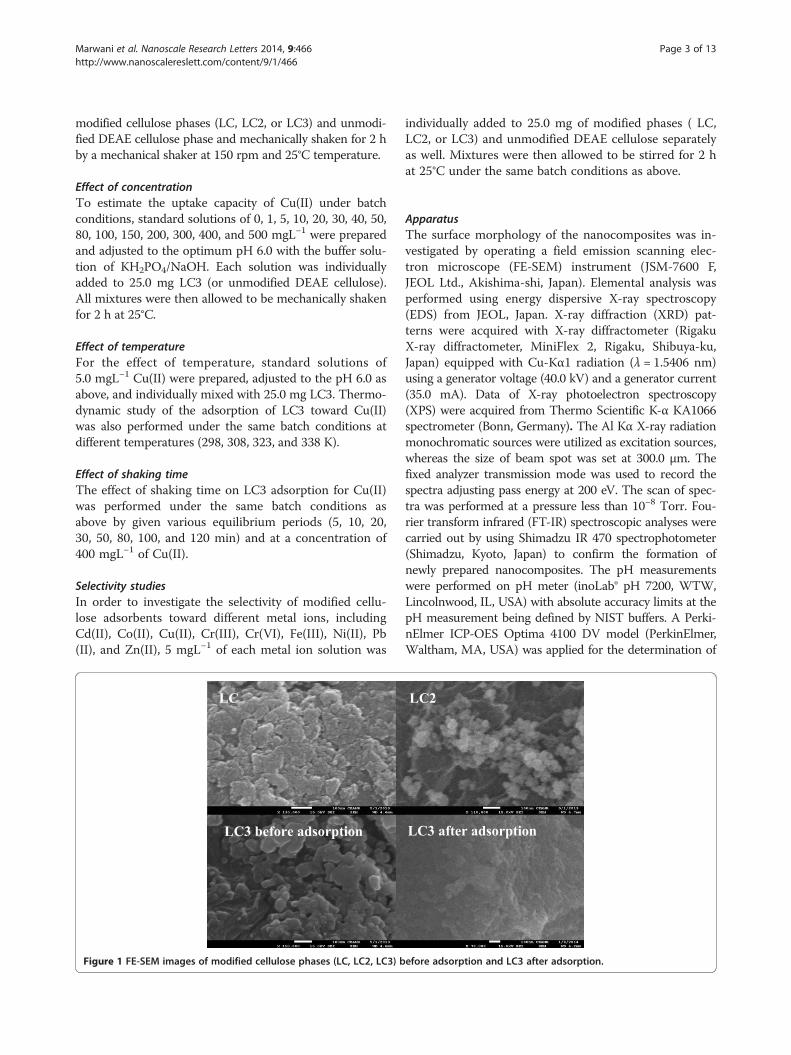
Figure 1 FE-SEM images of modified cellulose phases (LC, LC2, LC3) b
individually added to 25.0 mg of modified phases ( LC,LC2, or LC3) and unmodified DEAE cellulose separatelyas well. Mixtures were then allowed to be stirred for 2 hat 25°C under the same batch conditions as above.
ApparatusThe surface morphology of the nanocomposites was in-vestigated by operating a field emission scanning elec-tron microscope (FE-SEM) instrument (JSM-7600 F,JEOL Ltd., Akishima-shi, Japan). Elemental analysis wasperformed using energy dispersive X-ray spectroscopy(EDS) from JEOL, Japan. X-ray diffraction (XRD) pat-terns were acquired with X-ray diffractometer (RigakuX-ray diffractometer, MiniFlex 2, Rigaku, Shibuya-ku,Japan) equipped with Cu-Kα1 radiation (λ = 1.5406 nm)using a generator voltage (40.0 kV) and a generator current(35.0 mA). Data of X-ray photoelectron spectroscopy(XPS) were acquired from Thermo Scientific K-α KA1066spectrometer (Bonn, Germany). The Al Kα X-ray radiationmonochromatic sources were utilized as excitation sources,whereas the size of beam spot was set at 300.0 μm. Thefixed analyzer transmission mode was used to record thespectra adjusting pass energy at 200 eV. The scan of spec-tra was performed at a pressure less than 10−8 Torr. Fou-rier transform infrared (FT-IR) spectroscopic analyses werecarried out by using Shimadzu IR 470 spectrophotometer(Shimadzu, Kyoto, Japan) to confirm the formation ofnewly prepared nanocomposites. The pH measurementswere performed on pH meter (inoLab® pH 7200, WTW,Lincolnwood, IL, USA) with absolute accuracy limits at thepH measurement being defined by NIST buffers. A Perki-nElmer ICP-OES Optima 4100 DV model (PerkinElmer,Waltham, MA, USA) was applied for the determination of
LC2
LC3 after adsorption
efore adsorption and LC3 after adsorption.
Marwani et al. Nanoscale Research Letters 2014, 9:466 Page 4 of 13http://www.nanoscalereslett.com/content/9/1/466
metal ions concentration. The optimization of ICP-OES in-strument was performed daily before analysis and operatedas recommended by the manufacturers.The ICP-OES spectrometer was operated with the fol-
lowing parameters: FR power, 1,300 kW; frequency,27.12 MHz; demountable quartz torch, Ar/Ar/Ar; plasmagas (Ar) flow, 15.0 L min−1; auxiliary gas (Ar) flow,0.2 L min−1; nebulizer gas (Ar) flow, 0.8 L min−1; nebulizer
LC
LC3 before adsorption
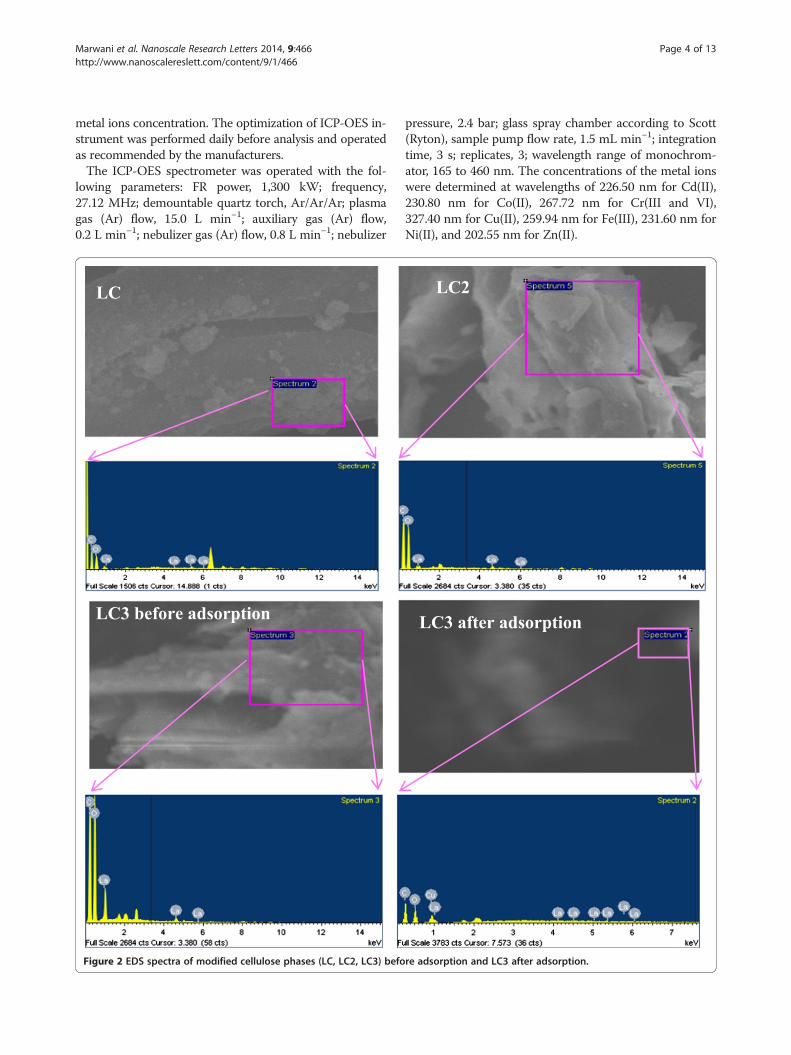
Figure 2 EDS spectra of modified cellulose phases (LC, LC2, LC3) befo
pressure, 2.4 bar; glass spray chamber according to Scott(Ryton), sample pump flow rate, 1.5 mL min−1; integrationtime, 3 s; replicates, 3; wavelength range of monochrom-ator, 165 to 460 nm. The concentrations of the metal ionswere determined at wavelengths of 226.50 nm for Cd(II),230.80 nm for Co(II), 267.72 nm for Cr(III and VI),327.40 nm for Cu(II), 259.94 nm for Fe(III), 231.60 nm forNi(II), and 202.55 nm for Zn(II).
LC2
LC3 after adsorption
re adsorption and LC3 after adsorption.
10 20 30 40 50 60
0
200
400
600
800
1000
1200
1400
1600
1800
2000
La
(OH
) 3
La
(OH
) 3
La
(OH
) 3
La
(OH
) 3
La
(OH
) 3
La
(OH
) 3
La
(OH
) 3
La
(OH
) 3
C
Inte
nsi
ty
2 Theta
LC3
LC2
LC
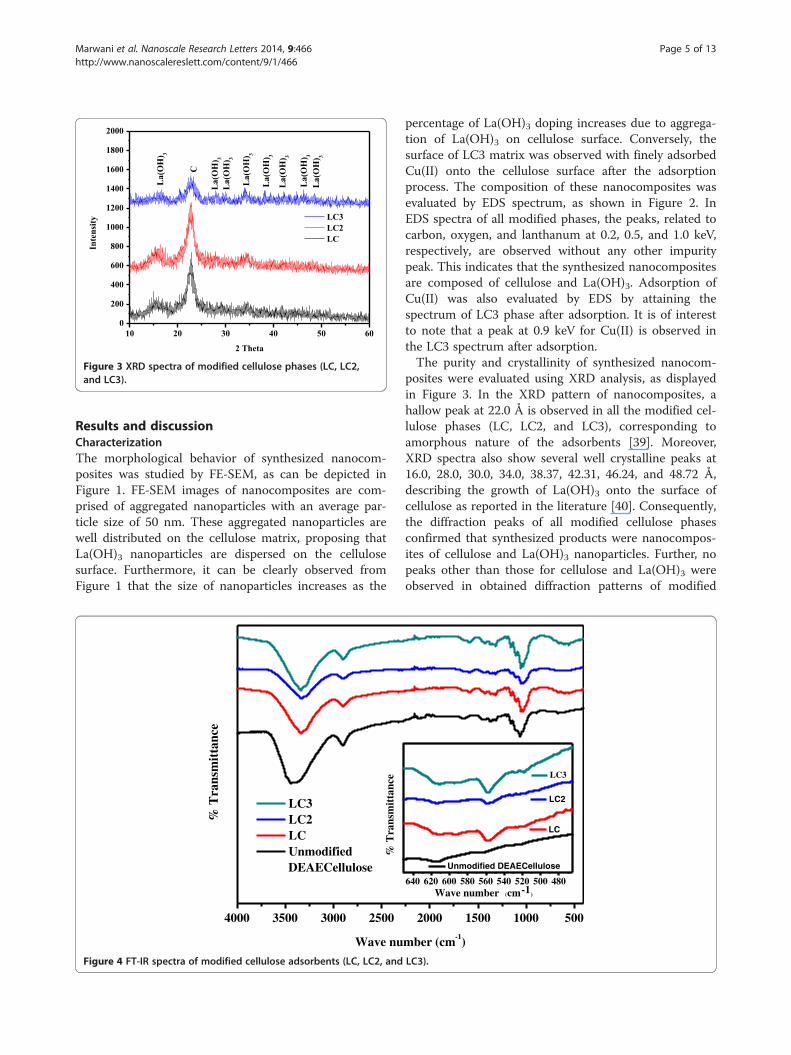
Figure 3 XRD spectra of modified cellulose phases (LC, LC2,and LC3).
Marwani et al. Nanoscale Research Letters 2014, 9:466 Page 5 of 13http://www.nanoscalereslett.com/content/9/1/466
Results and discussionCharacterizationThe morphological behavior of synthesized nanocom-posites was studied by FE-SEM, as can be depicted inFigure 1. FE-SEM images of nanocomposites are com-prised of aggregated nanoparticles with an average par-ticle size of 50 nm. These aggregated nanoparticles arewell distributed on the cellulose matrix, proposing thatLa(OH)3 nanoparticles are dispersed on the cellulosesurface. Furthermore, it can be clearly observed fromFigure 1 that the size of nanoparticles increases as the
4000 3500 3000 2500
% T
rans
mit
tanc
e
% T
rans
mit
tanc
e
Wave nu
LC3 LC2 LC Unmodified
DEAECellulose
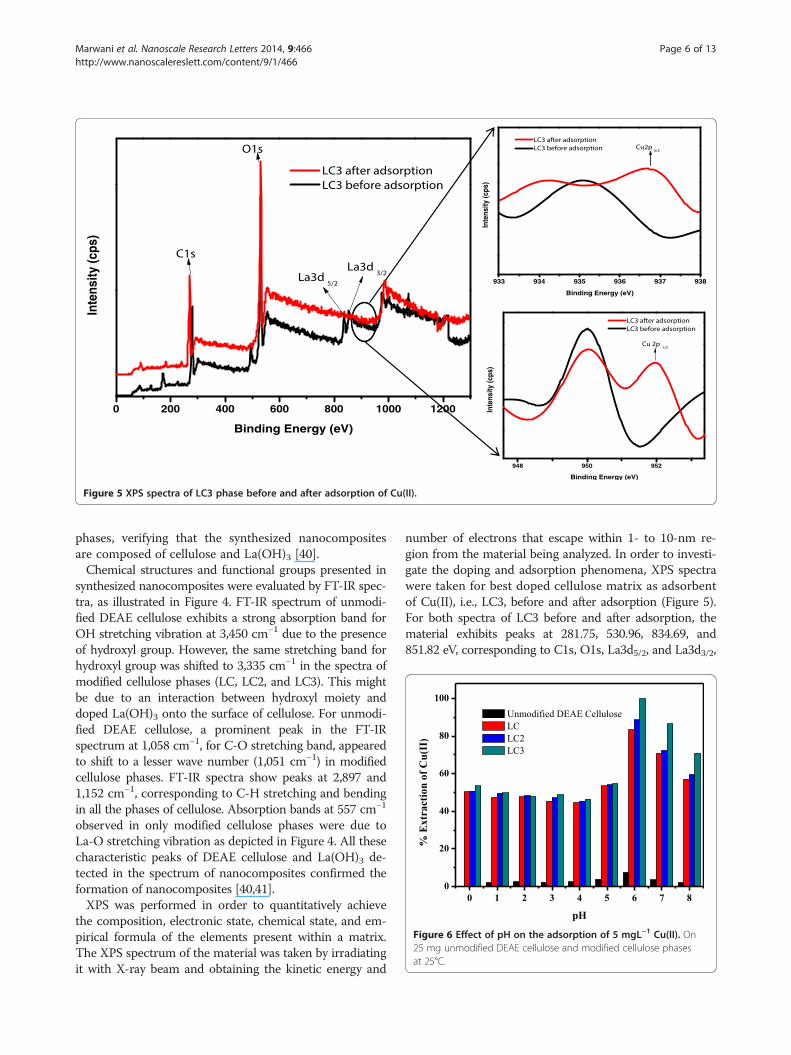
Figure 4 FT-IR spectra of modified cellulose adsorbents (LC, LC2, and
percentage of La(OH)3 doping increases due to aggrega-tion of La(OH)3 on cellulose surface. Conversely, thesurface of LC3 matrix was observed with finely adsorbedCu(II) onto the cellulose surface after the adsorptionprocess. The composition of these nanocomposites wasevaluated by EDS spectrum, as shown in Figure 2. InEDS spectra of all modified phases, the peaks, related tocarbon, oxygen, and lanthanum at 0.2, 0.5, and 1.0 keV,respectively, are observed without any other impuritypeak. This indicates that the synthesized nanocompositesare composed of cellulose and La(OH)3. Adsorption ofCu(II) was also evaluated by EDS by attaining thespectrum of LC3 phase after adsorption. It is of interestto note that a peak at 0.9 keV for Cu(II) is observed inthe LC3 spectrum after adsorption.The purity and crystallinity of synthesized nanocom-
posites were evaluated using XRD analysis, as displayedin Figure 3. In the XRD pattern of nanocomposites, ahallow peak at 22.0 Å is observed in all the modified cel-lulose phases (LC, LC2, and LC3), corresponding toamorphous nature of the adsorbents [39]. Moreover,XRD spectra also show several well crystalline peaks at16.0, 28.0, 30.0, 34.0, 38.37, 42.31, 46.24, and 48.72 Å,describing the growth of La(OH)3 onto the surface ofcellulose as reported in the literature [40]. Consequently,the diffraction peaks of all modified cellulose phasesconfirmed that synthesized products were nanocompos-ites of cellulose and La(OH)3 nanoparticles. Further, nopeaks other than those for cellulose and La(OH)3 wereobserved in obtained diffraction patterns of modified
2000 1500 1000 500
640 620 600 580 560 540 520 500 480
LC2
LC
Unmodified DEAECellulose
Wave number (cm-1)
LC3
mber (cm-1)
LC3).
933 934 935 936 937 938
Inte
nsity
(cps
)
Binding Energy (eV)
LC3 after adsorption LC3 before adsorption Cu2p
3/2
948 950 952
Inte
nsity
(cps
)
Binding Energy (eV)
LC3 after adsorption LC3 before adsorption
Cu 2p1/2
0 200 400 600 800 1000 1200
La3d3/2
O1s
La3d5/2
Inte
nsity
(cps
)
Binding Energy (eV)
LC3 after adsorption LC3 before adsorption
C1s
Figure 5 XPS spectra of LC3 phase before and after adsorption of Cu(II).
0 1 2 3 4 5 6 7 8
0
20
40
60
80
100
% E
xtr
act
ion
of
Cu
(II)
pH
Unmodified DEAE Cellulose
LC
LC2
LC3
Figure 6 Effect of pH on the adsorption of 5 mgL−1 Cu(II). On25 mg unmodified DEAE cellulose and modified cellulose phasesat 25°C.
Marwani et al. Nanoscale Research Letters 2014, 9:466 Page 6 of 13http://www.nanoscalereslett.com/content/9/1/466
phases, verifying that the synthesized nanocompositesare composed of cellulose and La(OH)3 [40].Chemical structures and functional groups presented in
synthesized nanocomposites were evaluated by FT-IR spec-tra, as illustrated in Figure 4. FT-IR spectrum of unmodi-fied DEAE cellulose exhibits a strong absorption band forOH stretching vibration at 3,450 cm−1 due to the presenceof hydroxyl group. However, the same stretching band forhydroxyl group was shifted to 3,335 cm−1 in the spectra ofmodified cellulose phases (LC, LC2, and LC3). This mightbe due to an interaction between hydroxyl moiety anddoped La(OH)3 onto the surface of cellulose. For unmodi-fied DEAE cellulose, a prominent peak in the FT-IRspectrum at 1,058 cm−1, for C-O stretching band, appearedto shift to a lesser wave number (1,051 cm−1) in modifiedcellulose phases. FT-IR spectra show peaks at 2,897 and1,152 cm−1, corresponding to C-H stretching and bendingin all the phases of cellulose. Absorption bands at 557 cm−1
observed in only modified cellulose phases were due toLa-O stretching vibration as depicted in Figure 4. All thesecharacteristic peaks of DEAE cellulose and La(OH)3 de-tected in the spectrum of nanocomposites confirmed theformation of nanocomposites [40,41].XPS was performed in order to quantitatively achieve
the composition, electronic state, chemical state, and em-pirical formula of the elements present within a matrix.The XPS spectrum of the material was taken by irradiatingit with X-ray beam and obtaining the kinetic energy and
number of electrons that escape within 1- to 10-nm re-gion from the material being analyzed. In order to investi-gate the doping and adsorption phenomena, XPS spectrawere taken for best doped cellulose matrix as adsorbentof Cu(II), i.e., LC3, before and after adsorption (Figure 5).For both spectra of LC3 before and after adsorption, thematerial exhibits peaks at 281.75, 530.96, 834.69, and851.82 eV, corresponding to C1s, O1s, La3d5/2, and La3d3/2,
0.0029 0.0030 0.0031 0.0032 0.0033 0.0034
10.0
10.5
11.0
11.5
12.0
12.5
13.0
13.5
y = 6954.5x - 10.426
R² = 0.9878
ln K
d(m
Lg–1
)
1/T (K-1)
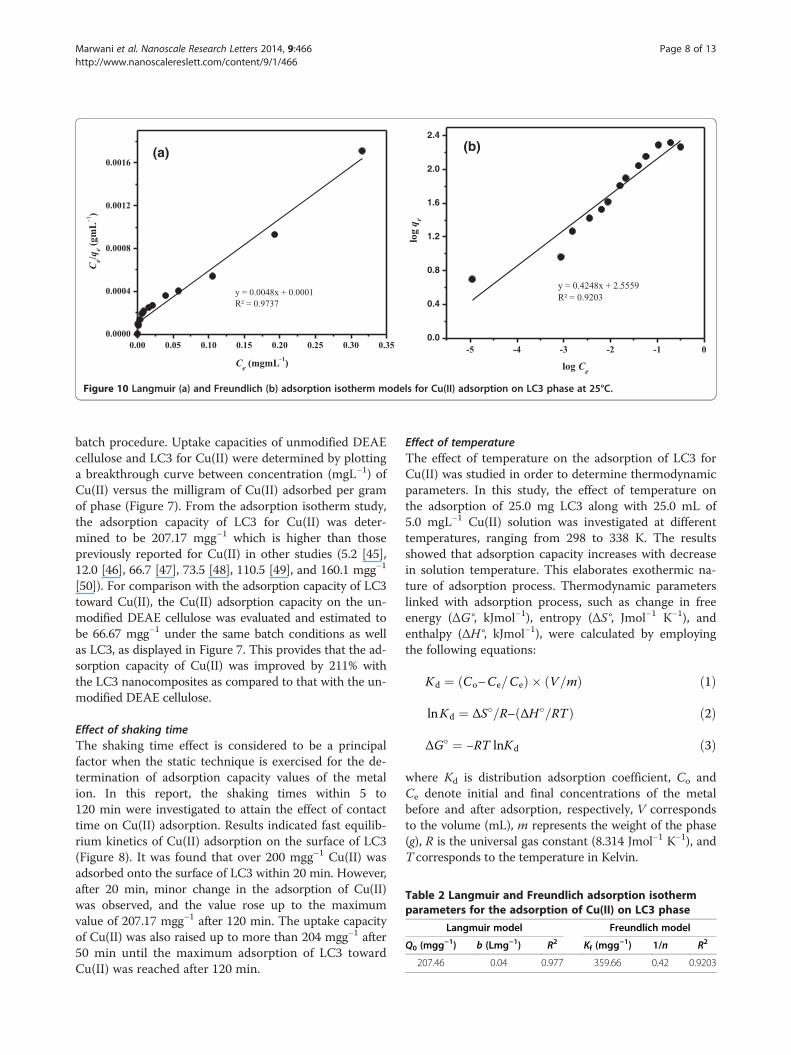
Figure 9 Adsorption isotherm study of Cu(II) extraction by LC3at different temperatures.
0 100 200 300 400 500
0
50
100
150
200
250
Ad
sorb
ed C
u(I
I) c
on
cen
trati
on
(m
gg–1
)
Cu(II) concentration (mgL–1
)
Unmodified DEAE cellulose
LC3
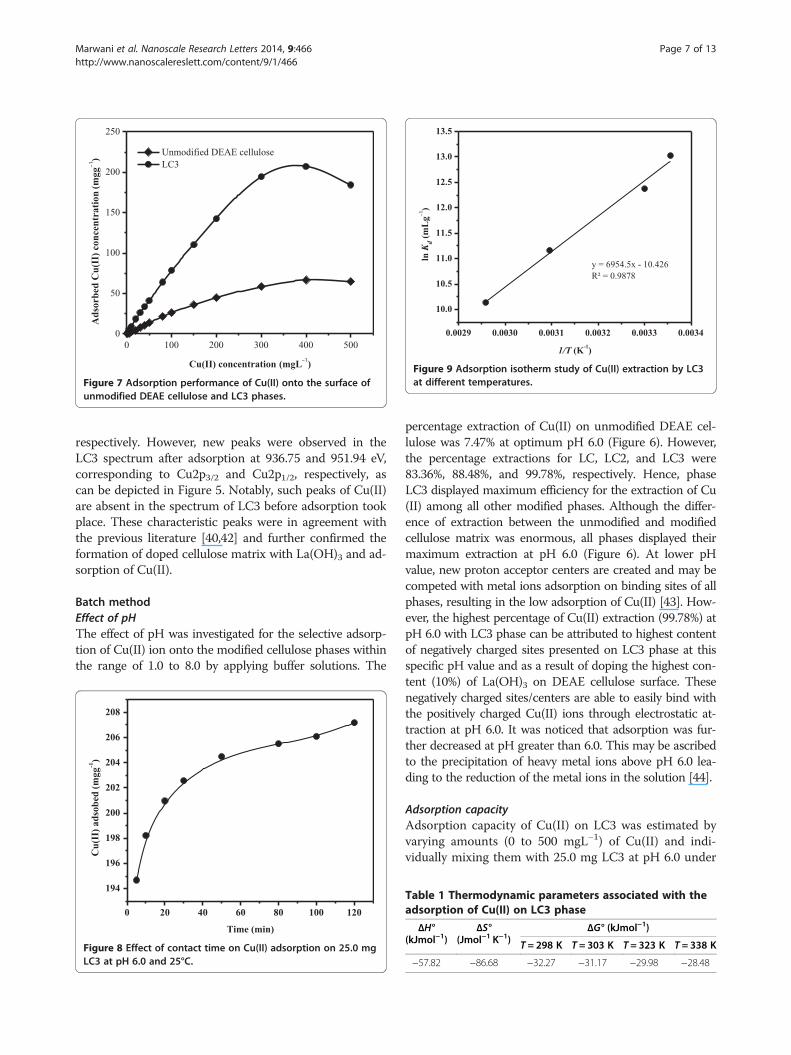
Figure 7 Adsorption performance of Cu(II) onto the surface ofunmodified DEAE cellulose and LC3 phases.
Marwani et al. Nanoscale Research Letters 2014, 9:466 Page 7 of 13http://www.nanoscalereslett.com/content/9/1/466
respectively. However, new peaks were observed in theLC3 spectrum after adsorption at 936.75 and 951.94 eV,corresponding to Cu2p3/2 and Cu2p1/2, respectively, ascan be depicted in Figure 5. Notably, such peaks of Cu(II)are absent in the spectrum of LC3 before adsorption tookplace. These characteristic peaks were in agreement withthe previous literature [40,42] and further confirmed theformation of doped cellulose matrix with La(OH)3 and ad-sorption of Cu(II).
Batch methodEffect of pHThe effect of pH was investigated for the selective adsorp-tion of Cu(II) ion onto the modified cellulose phases withinthe range of 1.0 to 8.0 by applying buffer solutions. The
0 20 40 60 80 100 120
194
196
198
200
202
204
206
208
Cu
(II)
ad
sob
ed (
mgg
-1)
Time (min)
Figure 8 Effect of contact time on Cu(II) adsorption on 25.0 mgLC3 at pH 6.0 and 25°C.
percentage extraction of Cu(II) on unmodified DEAE cel-lulose was 7.47% at optimum pH 6.0 (Figure 6). However,the percentage extractions for LC, LC2, and LC3 were83.36%, 88.48%, and 99.78%, respectively. Hence, phaseLC3 displayed maximum efficiency for the extraction of Cu(II) among all other modified phases. Although the differ-ence of extraction between the unmodified and modifiedcellulose matrix was enormous, all phases displayed theirmaximum extraction at pH 6.0 (Figure 6). At lower pHvalue, new proton acceptor centers are created and may becompeted with metal ions adsorption on binding sites of allphases, resulting in the low adsorption of Cu(II) [43]. How-ever, the highest percentage of Cu(II) extraction (99.78%) atpH 6.0 with LC3 phase can be attributed to highest contentof negatively charged sites presented on LC3 phase at thisspecific pH value and as a result of doping the highest con-tent (10%) of La(OH)3 on DEAE cellulose surface. Thesenegatively charged sites/centers are able to easily bind withthe positively charged Cu(II) ions through electrostatic at-traction at pH 6.0. It was noticed that adsorption was fur-ther decreased at pH greater than 6.0. This may be ascribedto the precipitation of heavy metal ions above pH 6.0 lea-ding to the reduction of the metal ions in the solution [44].
Adsorption capacityAdsorption capacity of Cu(II) on LC3 was estimated byvarying amounts (0 to 500 mgL−1) of Cu(II) and indi-vidually mixing them with 25.0 mg LC3 at pH 6.0 under
Table 1 Thermodynamic parameters associated with theadsorption of Cu(II) on LC3 phase
ΔH°(kJmol−1)
ΔS°(Jmol−1 K−1)
ΔG° (kJmol−1)
T = 298 K T = 303 K T = 323 K T = 338 K
−57.82 −86.68 −32.27 −31.17 −29.98 −28.48
0.00 0.05 0.10 0.15 0.20 0.25 0.30 0.35
0.0000
0.0004
0.0008
0.0012
0.0016
y = 0.0048x + 0.0001
R² = 0.9737
Ce/q
e(g
mL
–1)
Ce (mgmL–1
)
(a)
-5 -4 -3 -2 -1 0
0.0
0.4
0.8
1.2
1.6
2.0
2.4
y = 0.4248x + 2.5559
R² = 0.9203
log Ce
log q
e
(b)
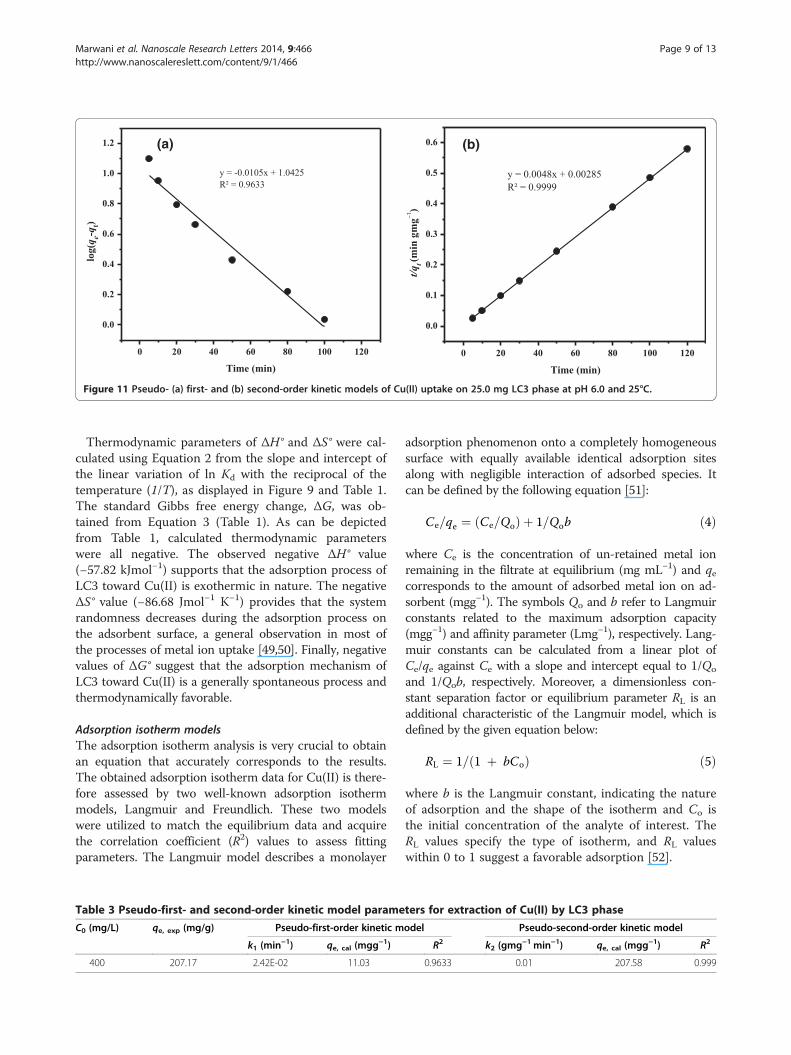
Figure 10 Langmuir (a) and Freundlich (b) adsorption isotherm models for Cu(II) adsorption on LC3 phase at 25°C.
Table 2 Langmuir and Freundlich adsorption isothermparameters for the adsorption of Cu(II) on LC3 phase
Langmuir model Freundlich model
Q0 (mgg−1) b (Lmg−1) R2 Kf (mgg−1) 1/n R2
207.46 0.04 0.977 359.66 0.42 0.9203
Marwani et al. Nanoscale Research Letters 2014, 9:466 Page 8 of 13http://www.nanoscalereslett.com/content/9/1/466
batch procedure. Uptake capacities of unmodified DEAEcellulose and LC3 for Cu(II) were determined by plottinga breakthrough curve between concentration (mgL−1) ofCu(II) versus the milligram of Cu(II) adsorbed per gramof phase (Figure 7). From the adsorption isotherm study,the adsorption capacity of LC3 for Cu(II) was deter-mined to be 207.17 mgg−1 which is higher than thosepreviously reported for Cu(II) in other studies (5.2 [45],12.0 [46], 66.7 [47], 73.5 [48], 110.5 [49], and 160.1 mgg−1
[50]). For comparison with the adsorption capacity of LC3toward Cu(II), the Cu(II) adsorption capacity on the un-modified DEAE cellulose was evaluated and estimated tobe 66.67 mgg−1 under the same batch conditions as wellas LC3, as displayed in Figure 7. This provides that the ad-sorption capacity of Cu(II) was improved by 211% withthe LC3 nanocomposites as compared to that with the un-modified DEAE cellulose.
Effect of shaking timeThe shaking time effect is considered to be a principalfactor when the static technique is exercised for the de-termination of adsorption capacity values of the metalion. In this report, the shaking times within 5 to120 min were investigated to attain the effect of contacttime on Cu(II) adsorption. Results indicated fast equilib-rium kinetics of Cu(II) adsorption on the surface of LC3(Figure 8). It was found that over 200 mgg−1 Cu(II) wasadsorbed onto the surface of LC3 within 20 min. However,after 20 min, minor change in the adsorption of Cu(II)was observed, and the value rose up to the maximumvalue of 207.17 mgg−1 after 120 min. The uptake capacityof Cu(II) was also raised up to more than 204 mgg−1 after50 min until the maximum adsorption of LC3 towardCu(II) was reached after 120 min.
Effect of temperatureThe effect of temperature on the adsorption of LC3 forCu(II) was studied in order to determine thermodynamicparameters. In this study, the effect of temperature onthe adsorption of 25.0 mg LC3 along with 25.0 mL of5.0 mgL−1 Cu(II) solution was investigated at differenttemperatures, ranging from 298 to 338 K. The resultsshowed that adsorption capacity increases with decreasein solution temperature. This elaborates exothermic na-ture of adsorption process. Thermodynamic parameterslinked with adsorption process, such as change in freeenergy (ΔG°, kJmol−1), entropy (ΔS°, Jmol−1 K−1), andenthalpy (ΔH°, kJmol−1), were calculated by employingthe following equations:
Kd ¼ Co–Ce=Ceð Þ � V=mð Þ ð1Þ
lnKd ¼ ΔS�=R– ΔH�=RTð Þ ð2Þ
ΔG� ¼ −RT lnKd ð3Þ
where Kd is distribution adsorption coefficient, Co andCe denote initial and final concentrations of the metalbefore and after adsorption, respectively, V correspondsto the volume (mL), m represents the weight of the phase(g), R is the universal gas constant (8.314 Jmol−1 K−1), andT corresponds to the temperature in Kelvin.
0 20 40 60 80 100 120
0.0
0.2
0.4
0.6
0.8
1.0
1.2
y = -0.0105x + 1.0425
R² = 0.9633
log(q
e-qt)
Time (min)
(a)
0 20 40 60 80 100 120
0.0
0.1
0.2
0.3
0.4
0.5
0.6
y = 0.0048x + 0.00285
R² = 0.9999
t/qt(m
in g
mg–1
)
Time (min)
(b)
Figure 11 Pseudo- (a) first- and (b) second-order kinetic models of Cu(II) uptake on 25.0 mg LC3 phase at pH 6.0 and 25°C.
Marwani et al. Nanoscale Research Letters 2014, 9:466 Page 9 of 13http://www.nanoscalereslett.com/content/9/1/466
Thermodynamic parameters of ΔH° and ΔS° were cal-culated using Equation 2 from the slope and intercept ofthe linear variation of ln Kd with the reciprocal of thetemperature (1/T), as displayed in Figure 9 and Table 1.The standard Gibbs free energy change, ΔG, was ob-tained from Equation 3 (Table 1). As can be depictedfrom Table 1, calculated thermodynamic parameterswere all negative. The observed negative ΔH° value(−57.82 kJmol−1) supports that the adsorption process ofLC3 toward Cu(II) is exothermic in nature. The negativeΔS° value (−86.68 Jmol−1 K−1) provides that the systemrandomness decreases during the adsorption process onthe adsorbent surface, a general observation in most ofthe processes of metal ion uptake [49,50]. Finally, negativevalues of ΔG° suggest that the adsorption mechanism ofLC3 toward Cu(II) is a generally spontaneous process andthermodynamically favorable.
Adsorption isotherm modelsThe adsorption isotherm analysis is very crucial to obtainan equation that accurately corresponds to the results.The obtained adsorption isotherm data for Cu(II) is there-fore assessed by two well-known adsorption isothermmodels, Langmuir and Freundlich. These two modelswere utilized to match the equilibrium data and acquirethe correlation coefficient (R2) values to assess fittingparameters. The Langmuir model describes a monolayer
Table 3 Pseudo-first- and second-order kinetic model parame
C0 (mg/L) qe, exp (mg/g) Pseudo-first-order kinetic m
k1 (min−1) qe, cal (mgg−1)
400 207.17 2.42E-02 11.03
adsorption phenomenon onto a completely homogeneoussurface with equally available identical adsorption sitesalong with negligible interaction of adsorbed species. Itcan be defined by the following equation [51]:
Ce=qe ¼ Ce=Qoð Þ þ 1=Qob ð4Þ
where Ce is the concentration of un-retained metal ionremaining in the filtrate at equilibrium (mg mL−1) and qecorresponds to the amount of adsorbed metal ion on ad-sorbent (mgg−1). The symbols Qo and b refer to Langmuirconstants related to the maximum adsorption capacity(mgg−1) and affinity parameter (Lmg−1), respectively. Lang-muir constants can be calculated from a linear plot ofCe/qe against Ce with a slope and intercept equal to 1/Qo
and 1/Qob, respectively. Moreover, a dimensionless con-stant separation factor or equilibrium parameter RL is anadditional characteristic of the Langmuir model, which isdefined by the given equation below:
RL ¼ 1= 1 þ bCoð Þ ð5Þ
where b is the Langmuir constant, indicating the natureof adsorption and the shape of the isotherm and Co isthe initial concentration of the analyte of interest. TheRL values specify the type of isotherm, and RL valueswithin 0 to 1 suggest a favorable adsorption [52].
ters for extraction of Cu(II) by LC3 phase
odel Pseudo-second-order kinetic model
R2 k2 (gmg−1 min−1) qe, cal (mgg−1) R2
0.9633 0.01 207.58 0.999
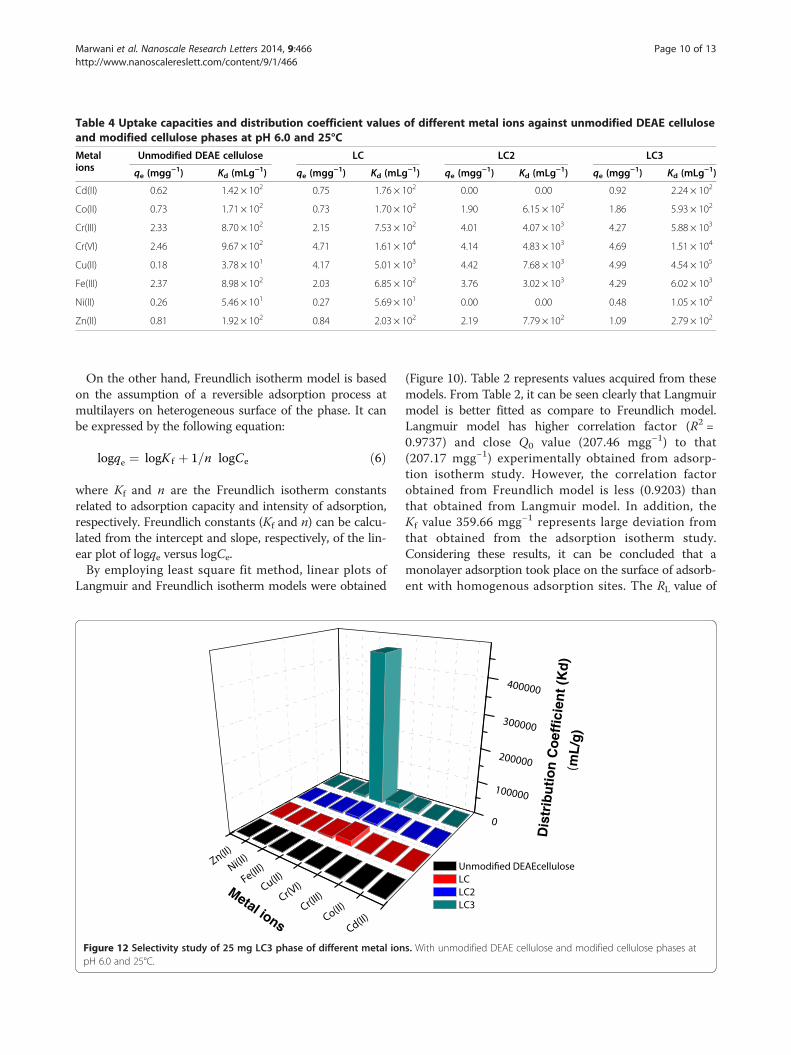
Table 4 Uptake capacities and distribution coefficient values of different metal ions against unmodified DEAE celluloseand modified cellulose phases at pH 6.0 and 25°C
Metalions
Unmodified DEAE cellulose LC LC2 LC3
qe (mgg−1) Kd (mLg−1) qe (mgg−1) Kd (mLg−1) qe (mgg−1) Kd (mLg−1) qe (mgg−1) Kd (mLg−1)
Cd(II) 0.62 1.42 × 10² 0.75 1.76 × 10² 0.00 0.00 0.92 2.24 × 10²
Co(II) 0.73 1.71 × 10² 0.73 1.70 × 10² 1.90 6.15 × 10² 1.86 5.93 × 10²
Cr(III) 2.33 8.70 × 10² 2.15 7.53 × 10² 4.01 4.07 × 10³ 4.27 5.88 × 10³
Cr(VI) 2.46 9.67 × 10² 4.71 1.61 × 10⁴ 4.14 4.83 × 10³ 4.69 1.51 × 10⁴
Cu(II) 0.18 3.78 × 101 4.17 5.01 × 10³ 4.42 7.68 × 10³ 4.99 4.54 × 10⁵
Fe(III) 2.37 8.98 × 10² 2.03 6.85 × 10² 3.76 3.02 × 10³ 4.29 6.02 × 10³
Ni(II) 0.26 5.46 × 101 0.27 5.69 × 101 0.00 0.00 0.48 1.05 × 10²
Zn(II) 0.81 1.92 × 10² 0.84 2.03 × 10² 2.19 7.79 × 10² 1.09 2.79 × 10²
Marwani et al. Nanoscale Research Letters 2014, 9:466 Page 10 of 13http://www.nanoscalereslett.com/content/9/1/466
On the other hand, Freundlich isotherm model is basedon the assumption of a reversible adsorption process atmultilayers on heterogeneous surface of the phase. It canbe expressed by the following equation:
logqe ¼ logK f þ 1=n logCe ð6Þ
where Kf and n are the Freundlich isotherm constantsrelated to adsorption capacity and intensity of adsorption,respectively. Freundlich constants (Kf and n) can be calcu-lated from the intercept and slope, respectively, of the lin-ear plot of logqe versus logCe.By employing least square fit method, linear plots of
Langmuir and Freundlich isotherm models were obtained
Cd(II)Co(II)Cr(III)Cr(V
I)Cu(II)Fe(III)Ni(II)Zn(II)
Metal ions
Figure 12 Selectivity study of 25 mg LC3 phase of different metal ionpH 6.0 and 25°C.
(Figure 10). Table 2 represents values acquired from thesemodels. From Table 2, it can be seen clearly that Langmuirmodel is better fitted as compare to Freundlich model.Langmuir model has higher correlation factor (R2 =0.9737) and close Q0 value (207.46 mgg−1) to that(207.17 mgg−1) experimentally obtained from adsorp-tion isotherm study. However, the correlation factorobtained from Freundlich model is less (0.9203) thanthat obtained from Langmuir model. In addition, theKf value 359.66 mgg−1 represents large deviation fromthat obtained from the adsorption isotherm study.Considering these results, it can be concluded that amonolayer adsorption took place on the surface of adsorb-ent with homogenous adsorption sites. The RL value of
0
100000
200000
300000
400000
Unmodified DEAEcellulose LC LC2 LC3
Dis
trib
uti
on
Co
effi
cien
t (K
d)
(mL
/g)
s. With unmodified DEAE cellulose and modified cellulose phases at
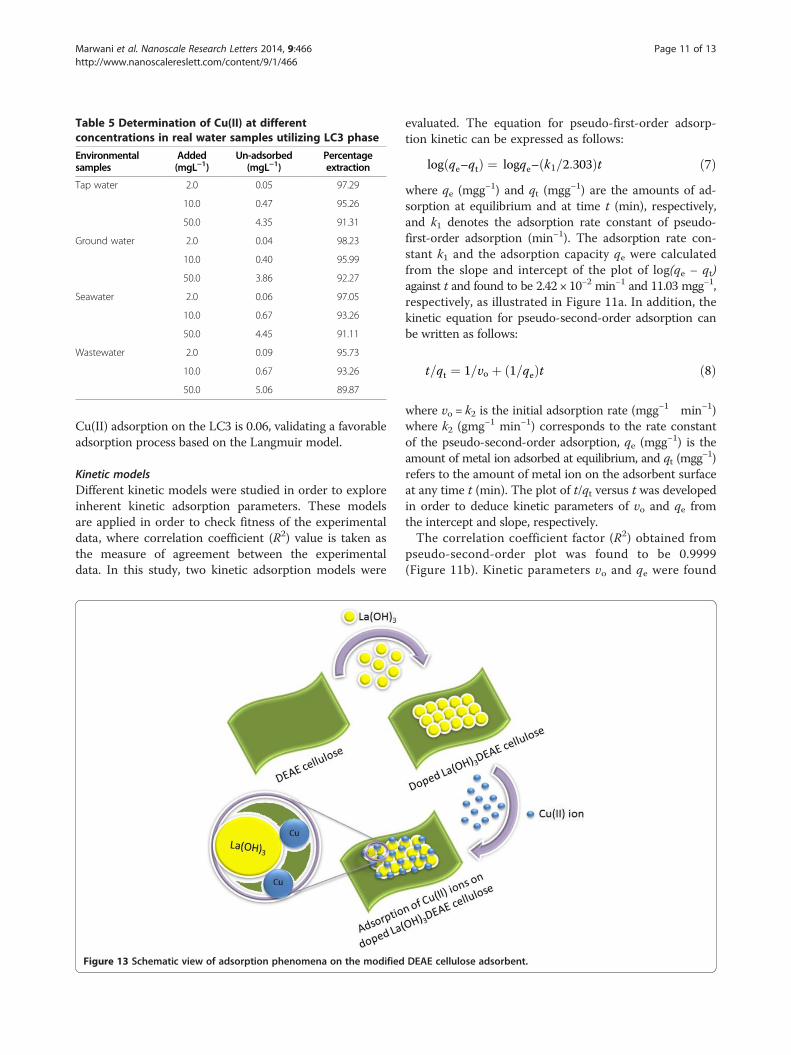
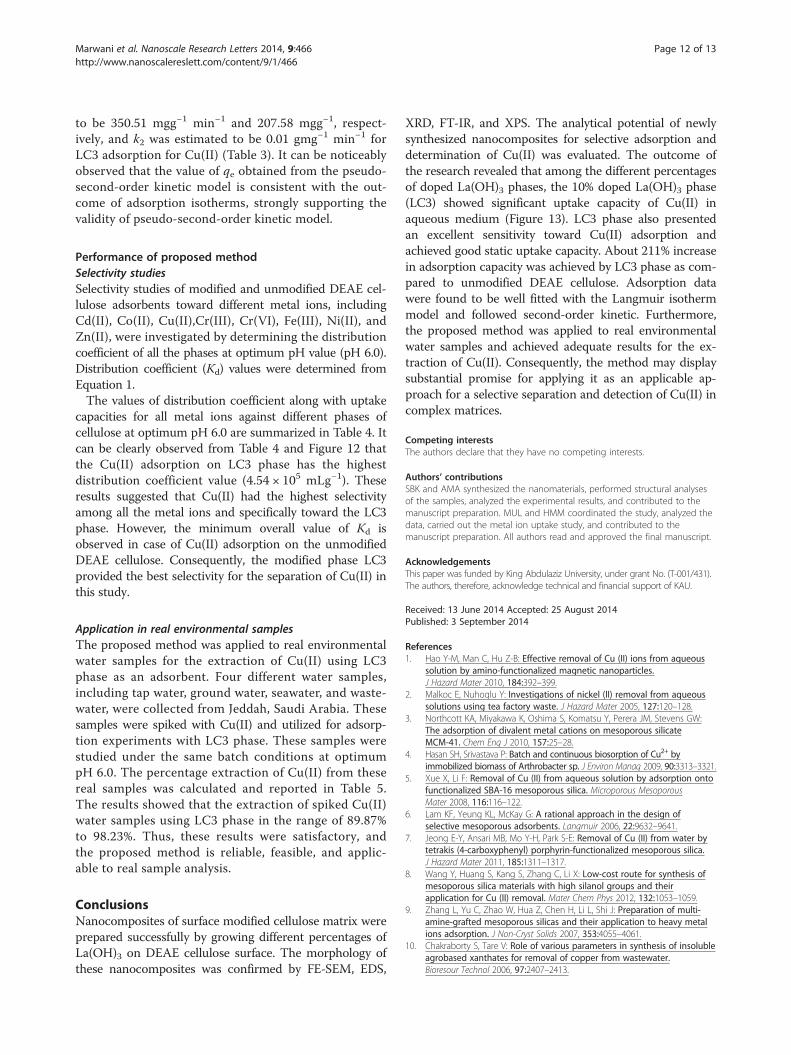
Table 5 Determination of Cu(II) at differentconcentrations in real water samples utilizing LC3 phase
Environmentalsamples
Added(mgL−1)
Un-adsorbed(mgL−1)
Percentageextraction
Tap water 2.0 0.05 97.29
10.0 0.47 95.26
50.0 4.35 91.31
Ground water 2.0 0.04 98.23
10.0 0.40 95.99
50.0 3.86 92.27
Seawater 2.0 0.06 97.05
10.0 0.67 93.26
50.0 4.45 91.11
Wastewater 2.0 0.09 95.73
10.0 0.67 93.26
50.0 5.06 89.87
Marwani et al. Nanoscale Research Letters 2014, 9:466 Page 11 of 13http://www.nanoscalereslett.com/content/9/1/466
Cu(II) adsorption on the LC3 is 0.06, validating a favorableadsorption process based on the Langmuir model.
Kinetic modelsDifferent kinetic models were studied in order to exploreinherent kinetic adsorption parameters. These modelsare applied in order to check fitness of the experimentaldata, where correlation coefficient (R2) value is taken asthe measure of agreement between the experimentaldata. In this study, two kinetic adsorption models were
Figure 13 Schematic view of adsorption phenomena on the modified
evaluated. The equation for pseudo-first-order adsorp-tion kinetic can be expressed as follows:
log qe–qtð Þ ¼ logqe– k1=2:303ð Þt ð7Þwhere qe (mgg−1) and qt (mgg−1) are the amounts of ad-sorption at equilibrium and at time t (min), respectively,and k1 denotes the adsorption rate constant of pseudo-first-order adsorption (min−1). The adsorption rate con-stant k1 and the adsorption capacity qe were calculatedfrom the slope and intercept of the plot of log(qe – qt)against t and found to be 2.42 × 10⁻² min−1 and 11.03 mgg−1,respectively, as illustrated in Figure 11a. In addition, thekinetic equation for pseudo-second-order adsorption canbe written as follows:
t=qt ¼ 1=υo þ 1=qeð Þt ð8Þ
where υo = k2 is the initial adsorption rate (mgg−1 min−1)where k2 (gmg−1 min−1) corresponds to the rate constantof the pseudo-second-order adsorption, qe (mgg−1) is theamount of metal ion adsorbed at equilibrium, and qt (mgg−1)refers to the amount of metal ion on the adsorbent surfaceat any time t (min). The plot of t/qt versus t was developedin order to deduce kinetic parameters of υo and qe fromthe intercept and slope, respectively.The correlation coefficient factor (R2) obtained from
pseudo-second-order plot was found to be 0.9999(Figure 11b). Kinetic parameters υo and qe were found
DEAE cellulose adsorbent.
Marwani et al. Nanoscale Research Letters 2014, 9:466 Page 12 of 13http://www.nanoscalereslett.com/content/9/1/466
to be 350.51 mgg−1 min−1 and 207.58 mgg−1, respect-ively, and k2 was estimated to be 0.01 gmg−1 min−1 forLC3 adsorption for Cu(II) (Table 3). It can be noticeablyobserved that the value of qe obtained from the pseudo-second-order kinetic model is consistent with the out-come of adsorption isotherms, strongly supporting thevalidity of pseudo-second-order kinetic model.
Performance of proposed methodSelectivity studiesSelectivity studies of modified and unmodified DEAE cel-lulose adsorbents toward different metal ions, includingCd(II), Co(II), Cu(II),Cr(III), Cr(VI), Fe(III), Ni(II), andZn(II), were investigated by determining the distributioncoefficient of all the phases at optimum pH value (pH 6.0).Distribution coefficient (Kd) values were determined fromEquation 1.The values of distribution coefficient along with uptake
capacities for all metal ions against different phases ofcellulose at optimum pH 6.0 are summarized in Table 4. Itcan be clearly observed from Table 4 and Figure 12 thatthe Cu(II) adsorption on LC3 phase has the highestdistribution coefficient value (4.54 × 10⁵ mLg−1). Theseresults suggested that Cu(II) had the highest selectivityamong all the metal ions and specifically toward the LC3phase. However, the minimum overall value of Kd isobserved in case of Cu(II) adsorption on the unmodifiedDEAE cellulose. Consequently, the modified phase LC3provided the best selectivity for the separation of Cu(II) inthis study.
Application in real environmental samplesThe proposed method was applied to real environmentalwater samples for the extraction of Cu(II) using LC3phase as an adsorbent. Four different water samples,including tap water, ground water, seawater, and waste-water, were collected from Jeddah, Saudi Arabia. Thesesamples were spiked with Cu(II) and utilized for adsorp-tion experiments with LC3 phase. These samples werestudied under the same batch conditions at optimumpH 6.0. The percentage extraction of Cu(II) from thesereal samples was calculated and reported in Table 5.The results showed that the extraction of spiked Cu(II)water samples using LC3 phase in the range of 89.87%to 98.23%. Thus, these results were satisfactory, andthe proposed method is reliable, feasible, and applic-able to real sample analysis.
ConclusionsNanocomposites of surface modified cellulose matrix wereprepared successfully by growing different percentages ofLa(OH)3 on DEAE cellulose surface. The morphology ofthese nanocomposites was confirmed by FE-SEM, EDS,
XRD, FT-IR, and XPS. The analytical potential of newlysynthesized nanocomposites for selective adsorption anddetermination of Cu(II) was evaluated. The outcome ofthe research revealed that among the different percentagesof doped La(OH)3 phases, the 10% doped La(OH)3 phase(LC3) showed significant uptake capacity of Cu(II) inaqueous medium (Figure 13). LC3 phase also presentedan excellent sensitivity toward Cu(II) adsorption andachieved good static uptake capacity. About 211% increasein adsorption capacity was achieved by LC3 phase as com-pared to unmodified DEAE cellulose. Adsorption datawere found to be well fitted with the Langmuir isothermmodel and followed second-order kinetic. Furthermore,the proposed method was applied to real environmentalwater samples and achieved adequate results for the ex-traction of Cu(II). Consequently, the method may displaysubstantial promise for applying it as an applicable ap-proach for a selective separation and detection of Cu(II) incomplex matrices.
Competing interestsThe authors declare that they have no competing interests.
Authors’ contributionsSBK and AMA synthesized the nanomaterials, performed structural analysesof the samples, analyzed the experimental results, and contributed to themanuscript preparation. MUL and HMM coordinated the study, analyzed thedata, carried out the metal ion uptake study, and contributed to themanuscript preparation. All authors read and approved the final manuscript.
AcknowledgementsThis paper was funded by King Abdulaziz University, under grant No. (T-001/431).The authors, therefore, acknowledge technical and financial support of KAU.
Received: 13 June 2014 Accepted: 25 August 2014Published: 3 September 2014
References1. Hao Y-M, Man C, Hu Z-B: Effective removal of Cu (II) ions from aqueous
solution by amino-functionalized magnetic nanoparticles.J Hazard Mater 2010, 184:392–399.
2. Malkoc E, Nuhoglu Y: Investigations of nickel (II) removal from aqueoussolutions using tea factory waste. J Hazard Mater 2005, 127:120–128.
3. Northcott KA, Miyakawa K, Oshima S, Komatsu Y, Perera JM, Stevens GW:The adsorption of divalent metal cations on mesoporous silicateMCM-41. Chem Eng J 2010, 157:25–28.
4. Hasan SH, Srivastava P: Batch and continuous biosorption of Cu2+ byimmobilized biomass of Arthrobacter sp. J Environ Manag 2009, 90:3313–3321.
5. Xue X, Li F: Removal of Cu (II) from aqueous solution by adsorption ontofunctionalized SBA-16 mesoporous silica. Microporous MesoporousMater 2008, 116:116–122.
6. Lam KF, Yeung KL, McKay G: A rational approach in the design ofselective mesoporous adsorbents. Langmuir 2006, 22:9632–9641.
7. Jeong E-Y, Ansari MB, Mo Y-H, Park S-E: Removal of Cu (II) from water bytetrakis (4-carboxyphenyl) porphyrin-functionalized mesoporous silica.J Hazard Mater 2011, 185:1311–1317.
8. Wang Y, Huang S, Kang S, Zhang C, Li X: Low-cost route for synthesis ofmesoporous silica materials with high silanol groups and theirapplication for Cu (II) removal. Mater Chem Phys 2012, 132:1053–1059.
9. Zhang L, Yu C, Zhao W, Hua Z, Chen H, Li L, Shi J: Preparation of multi-amine-grafted mesoporous silicas and their application to heavy metalions adsorption. J Non-Cryst Solids 2007, 353:4055–4061.
10. Chakraborty S, Tare V: Role of various parameters in synthesis of insolubleagrobased xanthates for removal of copper from wastewater.Bioresour Technol 2006, 97:2407–2413.
Marwani et al. Nanoscale Research Letters 2014, 9:466 Page 13 of 13http://www.nanoscalereslett.com/content/9/1/466
11. Kumar GP, Kumar P, Chakraborty S, Ray M: Uptake and desorption ofcopper ion using functionalized polymer coated silica gel in aqueousenvironment. Sep Purif Technol 2007, 57:47–56.
12. Li J, Miao X, Hao Y, Zhao J, Sun X, Wang L: Synthesis, amino-functionalization of mesoporous silica and its adsorption of Cr (VI).J Colloid Interface Sci 2008, 318:309–314.
13. Nasu A, Yamaguchi S, Sekine T: Solvent extraction of copper(I) and (II) asthiocyanate complexes with tetrabutylammonium ions into chloroformand with trioctylphosphine oxide into hexane. Anal Sci 1997, 13:903–911.
14. Tao GH, Fang Z: Dual stage preconcentration system for flame atomicabsorption spectrometry using flow injection on-line ion-exchangefollowed by solvent extraction. J Anal Chem 1998, 360:156–160.
15. Soylak M, Erdogan ND: Copper(ii)-rubeanic acid coprecipitation systemfor separation-preconcentration of trace metal ions in environmentalsamples for their flame atomic absorption spectrometric determinations.J Hazard Mater 2006, 137:1035–1041.
16. Manzoori JL, Abdolmohammad-Zadeh H, Amjadi M: Simplified cloud pointextraction for the preconcentration of ultra-trace amounts of gold priorto determination by electrothermal atomic absorption spectrometry.Microchim Acta 2007, 159:71–78.
17. Ahmed SA: Alumina physically loaded by thiosemicarbazide for selectivepreconcentration of mercury(ii) ion from natural water samples.J Hazard Mater 2008, 156:521–529.
18. Alvarez AM, Alvarez JRE, Alvarez RP: Heavy metal analysis of rainwaters: acomparison of txrf and asv analytical capabilities. J RadioanalNucl Chem 2007, 273:427–433.
19. Soliman EM, Ahmed SA: Selective separation of silver(i) and mercury(ii)ions in natural water samples using alumina modified thiouracilderivatives as new solid phase extractors. Int J Environ Anal Chem 2009,89:389–406.
20. Pei S, Fang Z: Flame atomic absorption spectrometric determination ofsilver in geological materials using a flow-injection system with on-linepreconcentration by coprecipitation with diethyldithio-carbamate.Anal Chim Acta 1994, 294:185–193.
21. Saraji M, Yousefi H: Selective solid-phase extraction of Ni(II) by an ion-imprinted polymer from water samples. J Hazard Mater 2009, 167:1152–1157.
22. Gustavo Rocha de C, Ilton Luiz de A, Paulo dos Santos R: Synthesis,characterization and determination of the metal ions adsorptioncapacity of cellulose modified with p-aminobenzoic groups.Journal of Materials Research 2004, 7:329–334.
23. Mahmoud ME, Kenawy IMM, Soliman EM, Hafez MA, Akl MAA, Lashein RRA:Selective preconcentration of uranyl ion by silica gel phases modifiedwith chelating compounds as inorganic polymeric ion exchangers.Anal Sci 2008, 24:381–387.
24. Sato S, Yoshihara K, Moriyama K, Machida M, Tatsumoto H: Influence ofactivated carbon surface acidity on adsorption of heavy metal ions andaromatics from aqueous solution. Appl Surf Sci 2007, 253:8554–8559.
25. Sanchez-polo M, Rivera-utrilla J: Adsorbent-adsorbate interactions in theadsorption of Cd(ii) and Hg(ii) on ozonized activated carbons.Environ Sci Technol 2002, 36:3850–3854.
26. Clasen C, Kulicke W-M: Determination of viscoelastic and rheo-opticalmaterial functions of water-soluble cellulose derivatives.Prog Polym Sci 2001, 26:1839–1919.
27. O’Connell DW, Birkinshaw C, O’Dwyer TF: Heavy metal adsorbentsprepared from the modification of cellulose: a review.Bioresour Technol 2008, 99:6709–6724.
28. Kaplan DL: Biopolymers from renewable resources. New York: Springer; 1998.29. Kirk R, Othmer D: Cellulose encyclopedia of chemical technology. New York:
Wiley; 1967.30. Ishimura D, Morimoto Y, Saito H: Influences of chemical modifications on
the mechanical strength of cellulose beads. Cellulose 1998, 5:135–151.31. Khan SB, Alamry KA, Marwani HM, Asiri AM, Rahman MM: Synthesis and
environmental applications of cellulose/ZrO2 nanohybrid as a selectiveadsorbent for nickel ion. Composites Part B: Engineering 2013, 50:253–258.
32. Asiri AM, Khan SB, Alamry KA, Marwani HM, Rahman MM: Growth of Mn3O4
on cellulose matrix: nanohybrid as a solid phase adsorbent for trivalentchromium. Applied Surface Science 2013, 270:539–544.
33. Ajtony Z, Bencs L, Haraszi R, Jeno S, Szoboszlai N: Study on thesimultaneous determination of some essential and toxic trace elementsin honey by multi-element graphite furnace atomic absorptionspectrometry. Talanta 2007, 71:683–690.
34. Montes-Bayon M, Pröfrock D, Sanz-Medel A, Prange A: Direct comparison ofcapillary electrophoresis and capillary liquid chromatography hyphenatedto collision-cell inductively coupled plasma mass spectrometry for theinvestigation of Cd-, Cu- and Zn-containing metalloproteins.J Chromatogr A 2006, 1114:138–144.
35. Li Z, Chang X, Zou X, Zhu X, Nie R, Hu Z, Li R: Chemically-modifiedactivated carbon with ethylenediamine for selective solid-phase extractionand preconcentration of metal ions. Anal Chim Acta 2009, 632:272–277.
36. Gao R, Hu Z, Chang X, He Q, Zhang L, Tu Z, Shi J: Chemically modifiedactivated carbon with 1-acylthiosemicarbazide for selective solid-phaseextraction and preconcentration of trace Cu(II), Hg(II) and Pb(II) fromwater samples. J Hazard Mater 2009, 172:324–329.
37. Bonfil Y, Kirowa-Eisner E: Determination of nanomolar concentrations oflead and cadmium by anodic-stripping voltammetry at the silverelectrode. Anal Chim Acta 2002, 457:285–296.
38. Tanikkul S, Jakmunee J, Lapanantnoppakhun S, Rayanakorn M, Sooksamiti P,Synovec RE, Christian GD, Grudpan K: Flow injection invalve mini-columnpretreatment combined with ion chromatography for cadmium, leadand zinc determination. Talanta 2004, 64:1241–1246.
39. Ci L, Wei B, Xu C, Liang J, Wu D, Xie S, Zhou W, Li Y, Liu Z, Tang D:Crystallization behavior of the amorphous carbon nanotubes preparedby the CVD method. J Cryst Growth 2001, 233:823–828.
40. Salavati-Niasari M, Hosseinzadeh G, Davar F: Synthesis of lanthanumhydroxide and lanthanum oxide nanoparticles by sonochemical method.J Alloys Compd 2011, 509:4098–4103.
41. Peng F, Ren J-L, Xu F, Bian J, Peng P, Sun R-C: Comparative studies on thephysico-chemical properties of hemicelluloses obtained by DEAE-cellulose-52 chromatography from sugarcane bagasse.Food Res Int 2010, 43:683–693.
42. Strohmeier BR, Levden DE, Field RS, Hercules DM: Surface spectroscopiccharacterization of CuAl2O3 catalysts. J Catal 1985, 94:514–530.
43. Pang Y, Zeng G, Tang L, Zhang Y, Liu Y, Lei X, Li Z, Zhang J, Xie G:PEI-grafted magnetic porous powder for highly effective adsorption ofheavy metal ions. Desalination 2011, 281:278–284.
44. Feng Y, Gong J-L, Zeng G-M, Niu Q-Y, Zhang H-Y, Niu C-G, Deng J-H,Yan M: Adsorption of Cd (II) and Zn (II) from aqueous solutions usingmagnetic hydroxyapatite nanoparticles as adsorbents. Chem Eng J 2010,162:487–494.
45. Yılmaz V, Hazer O, Kartal S: Synthesis, characterization and application of anovel ion-imprinted polymer for selective solid phase extraction ofcopper (II) ions from high salt matrices prior to its determination byFAAS. Talanta 2013, 2013:2013.
46. Lan S, Wu X, Li L, Li M, Guo F, Gan S: Synthesis and characterization ofhyaluronic acid-supported magnetic microspheres for copper ionsremoval. Colloids and Surfaces A: Physicochemical and EngineeringAspects 2013, 425:42–50.
47. Zhou L, Wang Y, Liu Z, Huang Q: Characteristics of equilibrium, kineticsstudies for adsorption of Hg (II), Cu (II), and Ni (II) ions by thiourea-modified magnetic chitosan microspheres. J Hazard Mater 2009,161:995–1002.
48. Zhao X, Zhang G, Jia Q, Zhao C, Zhou W, Li W: Adsorption of Cu (II), Pb (II),Co (II), Ni (II), and Cd (II) from aqueous solution by poly (aryl etherketone) containing pendant carboxyl groups (PEK-L): equilibrium,kinetics, and thermodynamics. Chem Eng J 2011, 171:152–158.
49. Monier M, Nawar N, Abdel-Latif D: Preparation and characterization ofchelating fibers based on natural wool for removal of Hg (II), Cu (II) andCo (II) metal ions from aqueous solutions. J Hazard Mater 2010, 184:118–125.
50. Wang J, Xu L, Cheng C, Meng Y, Li A: Preparation of new chelating fiberwith waste PET as adsorbent for fast removal of Cu2+ and Ni2+ fromwater: kinetic and equilibrium adsorption studies. Chem Eng J 2012,193:31–38.
51. Langmuir I: The constitution and fundamental properties of solids andliquids. J Am Chem Soc 1916, 38:2221–2295.
52. Mckay G, Blair HS, Gardener JR: Adsorption of dyes on chitin-I: equilibriumstudies. J Appl Polym Sci 1982, 27:3043–3057.
doi:10.1186/1556-276X-9-466Cite this article as: Marwani et al.: Cellulose-lanthanum hydroxidenanocomposite as a selective marker for detection of toxic copper.Nanoscale Research Letters 2014 9:466.