Statistical distribution of the electric field-driven switching of the Verwey state in Fe3O4
10
arXiv:1201.0772v1 [cond-mat.str-el] 3 Jan 2012 Statistical distribution of the electric field driven switching of the Verwey state in Fe 3 O 4 A A Fursina 1 ‡, R G S Sofin 2 , I V Shvets 2 , and D Natelson 3,4 1 Department of Chemistry, Rice University, 6100 Main St., Houston, TX 77005, USA 2 CRANN, School of Physics, Trinity College, Dublin 2, Ireland 3 Department of Physics and Astronomy, Rice University, 6100 Main St., Houston, TX 77005 4 Department of Electrical and Computer Engineering, Rice University, 6100 Main St,.Houston, TX 77005 Abstract. The insulating state of magnetite (Fe 3 O 4 ) can be disrupted by a sufficiently large dc electric field. Pulsed measurements are used to examine the kinetics of this transition. Histograms of the switching voltage show a transition width that broadens as temperature is decreased, consistent with trends seen in other systems involving “unpinning” in the presence of disorder. The switching distributions are also modified by an external magnetic field on a scale comparable to that required to reorient the magnetization. PACS numbers: 71.30.+h,73.50.-h,72.20.Ht Submitted to: New J. Phys. ‡ Present address: Department of Chemistry, University of Nebraska-Lincoln, 525 HAH, Lincoln, NE 68588-0304, USA
Transcript of Statistical distribution of the electric field-driven switching of the Verwey state in Fe3O4
arX
iv:1
201.
0772
v1 [
cond
-mat
.str
-el]
3 J
an 2
012
Statistical distribution of the electric field driven
switching of the Verwey state in Fe3O4
A A Fursina1‡, R G S Sofin2, I V Shvets2, and D Natelson3,4
1Department of Chemistry, Rice University, 6100 Main St., Houston, TX 77005, USA2CRANN, School of Physics, Trinity College, Dublin 2, Ireland3Department of Physics and Astronomy, Rice University, 6100 Main St., Houston,
TX 770054Department of Electrical and Computer Engineering, Rice University, 6100 Main
St,.Houston, TX 77005
Abstract. The insulating state of magnetite (Fe3O4) can be disrupted by a
sufficiently large dc electric field. Pulsed measurements are used to examine the kinetics
of this transition. Histograms of the switching voltage show a transition width that
broadens as temperature is decreased, consistent with trends seen in other systems
involving “unpinning” in the presence of disorder. The switching distributions are
also modified by an external magnetic field on a scale comparable to that required to
reorient the magnetization.
PACS numbers: 71.30.+h,73.50.-h,72.20.Ht
Submitted to: New J. Phys.
‡ Present address: Department of Chemistry, University of Nebraska-Lincoln, 525 HAH, Lincoln, NE
68588-0304, USA
Statistical distribution of the electric field driven switching 2
1. Introduction
Magnetite is an archetypal strongly correlated transition metal oxide, with properties
not well described by single-particle band structure. Below 858 K, magnetite, which
may be written as Fe3+A (Fe2+Fe3+)BO4, is ferrimagnetically ordered, with the A and
B sublattices having oppositely directed magnetizations. The moments of the five
unpaired 3d electrons of the tetrahedrally coordinated A-site Fe3+ ions are compensated
by those of the octahedrally coordinated B-site Fe3+ ions. The net magnetization results
from the octahedrally coordinated B-site Fe2+ that have four unpaired 3d electrons [1].
Upon cooling, bulk magnetite undergoes a first-order phase transition from a moderately
conducting high temperature state to a more insulating low temperature state at what is
now called the Verwey[2] temperature, TV ≈ 122 K. The change in electronic properties
is coincident with a structural transition from a high temperature cubic inverse spinel
to a low temperature monoclinic unit cell. The nature of the ordered insulating state
remains an active topic of current research[3, 4, 5, 6]. Experiments indicate the onset
of multiferroicity[7] in magnetite below 40 K[8], further highlighting the rich physics in
this correlated system.
Recently, nanostructured electrodes have been used to apply strong electric fields
in the plane of magnetite films[9, 10]. Below TV, a sufficient applied voltage triggers a
breakdown of the comparatively insulating low-temperature state and a sudden increase
in conduction [9, 10]. This is an example of electric field-driven breakdown of a gapped
state in strongly correlated oxides[11, 12, 13] similar to Landau-Zener breakdown in
classic semiconductors. The electric field-driven transition in magnetite is consistent
with expectations[13] based on such a mechanism (via geometric scaling [9, 10], lack of
intrinsic hysteresis [14], changes of both contact and bulk resistance at the transition
[15, 16]). These prior experiments examined films of various thicknesses, from 30 nm
to 100 nm. No strong thickness dependence was observed in the switching properties,
consistent with the applied lateral electric field at the sample surface acting as the driver
of the breakdown (though thinner films showed a less pronounced Verwey transition in
low-bias resistance vs. temperature measurements, consistent with expectations).
Here we report studies of the statistical variations of this electric field-driven
transition in Fe3O4, as a function of temperature and magnetic field perpendicular
to the film surface (out-of-plane). We find that there is a statistical distribution of
switching voltages, VSW, that becomes more broad and shifts to higher voltages as T is
reduced. We discuss these trends in the context of switching kinetics in other systems
that exhibit similar trends. The application of a magnetic field perpendicular to the
plane of the Fe3O4 film alters the VSW, shifting the mean by several mV (several percent)
and changing its shape, within a range of fields comparable to that required to reorient
the magnetization out of plane.

Statistical distribution of the electric field driven switching 3
2. Experimental Techniques
The 50 nm Fe3O4 (100) thin films used in the present study were grown on (100) oriented
MgO single crystal substrates as described elsewhere [17, 18]. Contact electrodes (2nm
adhesion layer of Ti and 15 nm layer of Au) were patterned by e-beam lithography on the
surface of the Fe3O4 film. As before [9, 14], VSW scales linearly with the channel length,
L (the electrode spacing), implying an electric field-driven transition. Long channels
(L > 100 nm) required large switching voltages that would alter the electrode geometry
over numerous switching cycles, distorting the shape of VSW histograms. To minimize
VSW, electrodes separated by 10-30 nm were patterned using a self-aligned technique
[10]. Electrical characterization of the devices was performed using a semiconductor
parameter analyzer (HP 4155A). To minimize self-heating when in the conducting state,
the voltage was applied as pulses 500 µs in duration with a 5 ms period [14, 15]. The
samples were cooled below TV with no magnetic field applied, and the distribution of
VSW was obtained by executing several thousand consecutive forward pulsed I-V sweeps
in the vicinity of the transition point (typically a 0.2-0.3 V range) at a fixed (to within
50 mK) temperature, and recording the number of switching events at each voltage.
Each voltage value is essentially an independent test to see if switching takes place
under the pulse conditions. Hence, some sweeps show one (figure 1 a) or several (figure 1
b) switching events. Even if the system is switched to the conducting state at VSW(1),
it may return to the Off state between pulses, and then switch to the On state at some
Figure 1. (color online) Details of VSW distribution experiment. (a and b) The
fragments of I-V curves in the vicinity of a transition demonstrating one (a)
and three (b) switching events in a single pulsed I-V cycle. (c) Typical SEM
image of Ti/Au electrodes, patterned on magnetite film surface, separated by
nanogap < 100 nm. (d) An example of VSW distribution histogram at 90 K.
Statistical distribution of the electric field driven switching 4
higher voltage, VSW(2), and so on. The VSW distribution at a particular temperature
is built by recording all switching events over several thousands (3000-6000) of I-V
cycles and then counting the number of switchings at a certain VSW, to produce a “#
of counts” vs. VSW histogram. A typical VSW distribution at 90K is shown in figure 1
d. The distribution is a single peak, symmetrical around the most probable VSW value.
3. Results and Discussion
This procedure was repeated at each temperature below TV (∼ 110K for devices under
test; see figure 2b inset), down to ∼ 75 K. At T < 75 K, the high values of VSW necessary
led to irreversible alteration of the electrode geometry, resulting in asymmetric, distorted
VSW histograms. Near 80-90 K, I-V cycles with multiple VSW events (figure 1b) were
observed more frequently. Thus, the total number of switching events observed varied
with T , even with a fixed number of I-V cycles at each temperature. To compare VSW
distributions at different temperatures, the distributions were normalized, plotted as (#
of counts)/(max # of counts) vs VSW, where “max # of counts” is the number of events
at the most probable VSW and “# of counts” is the number of events at a certain VSW.
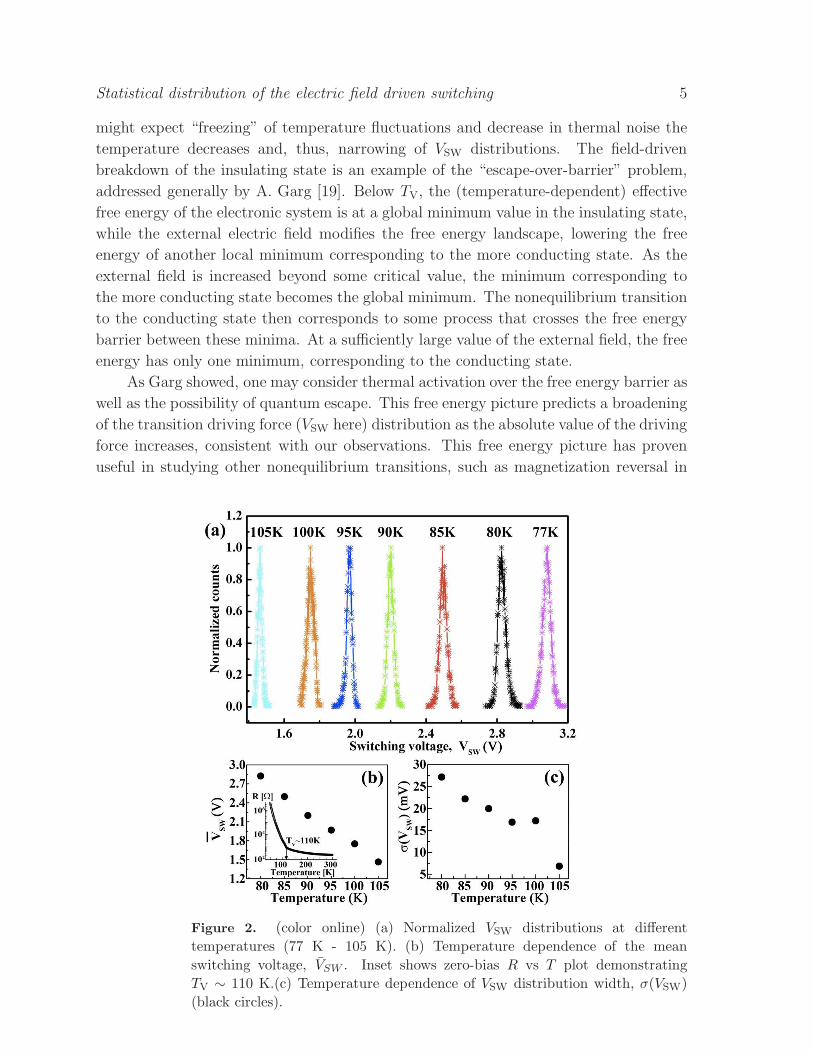
Figure 2a is an example of normalized VSW distributions in the 77 K-105 K temperature
range. The measured widths of the VSW distributions are not limited by temperature
stability.
As has been discussed elsewhere[14], the use of pulses is essential to minimize the
role of self-heating once the system has been driven into the more conducting state. This
self-heating and the short timescale[14] required to raise the local temperature in the
channel significantly makes it extremely challenging to determine directly whether the
initial breakdown takesplace through the formation of a conducting filament or through a
uniform switching; once a highly conducting path is formed, the whole channel rapidly
becomes conducting through self-heating. The filamentary picture is certainly likely,
based on other breakdown phenomena in solids, and the statistical variation in VSW is
consistent with the idea of a process involving run-to-run variability associated with
local details rather than global material properties, but this is not definitive.
The VSW distribution at each temperature is characterized by two main parameters:
the mean switching value VSW = (∑N
i=1 VSW,i)/N , where N is the total number of
switching events; and the width of distribution, calculated as a standard deviation:
σ(VSW) =√
(∑N
i=1(VSW,i − Vsw)2)/N − 1. As expected, the VSW(T ) has the same T -
dependence (see figure 2 b) as VSW(T ) in single I-V experiments described in previous
publications [9, 14]. More interesting is the σ(VSW) temperature dependence, showing
broadening of the VSW distribution as the temperature decreases (figure 2 c). We note
a deviation from monotonous temperature dependence of σ(VSW) at 100 K, observed in
several devices tested. This is a temperature well below TV = 110K (see figure 2b inset),
where several physical parameters (resistance, heat capacity and magnetoresistance)
change abruptly.
This increase in σ(VSW) as temperature decreases is rather counter-intuitive. One
Statistical distribution of the electric field driven switching 5
might expect “freezing” of temperature fluctuations and decrease in thermal noise the
temperature decreases and, thus, narrowing of VSW distributions. The field-driven
breakdown of the insulating state is an example of the “escape-over-barrier” problem,
addressed generally by A. Garg [19]. Below TV, the (temperature-dependent) effective
free energy of the electronic system is at a global minimum value in the insulating state,
while the external electric field modifies the free energy landscape, lowering the free
energy of another local minimum corresponding to the more conducting state. As the
external field is increased beyond some critical value, the minimum corresponding to
the more conducting state becomes the global minimum. The nonequilibrium transition
to the conducting state then corresponds to some process that crosses the free energy
barrier between these minima. At a sufficiently large value of the external field, the free
energy has only one minimum, corresponding to the conducting state.
As Garg showed, one may consider thermal activation over the free energy barrier as
well as the possibility of quantum escape. This free energy picture predicts a broadening
of the transition driving force (VSW here) distribution as the absolute value of the driving
force increases, consistent with our observations. This free energy picture has proven
useful in studying other nonequilibrium transitions, such as magnetization reversal in
Figure 2. (color online) (a) Normalized VSW distributions at different
temperatures (77 K - 105 K). (b) Temperature dependence of the mean
switching voltage, VSW . Inset shows zero-bias R vs T plot demonstrating
TV ∼ 110 K.(c) Temperature dependence of VSW distribution width, σ(VSW)
(black circles).
Statistical distribution of the electric field driven switching 6
nanoparticles [20] and nanowires [21, 22]. Pinning due to local disorder is one way to
find increasing distribution widths as T → 0, as seen in investigations of field-driven
magnetization reversal in nanowires [21, 22]. Unfortunately, quantitative modeling
in this framework requires several free parameters and is difficult without a detailed
understanding of the underlying mechanism.
Qualitatively similar phenomenology (distribution of switching thresholds that
broadens as T is decreased) is also observed in the current-driven superconducting-
normal transition in ultrathin nanowires[24, 25]. In this latter case as in ours, self-
heating in the switched state is of critical importance, as is the temperature variation of
the local thermal path. Again, quantitative modeling using this self-heating approach
would require the introduction of multiple parameters that are difficult to constrain
experimentally, as well as detailed thermal modeling of the nanoscale local effective
temperature distribution, and is beyond the scope of this paper.
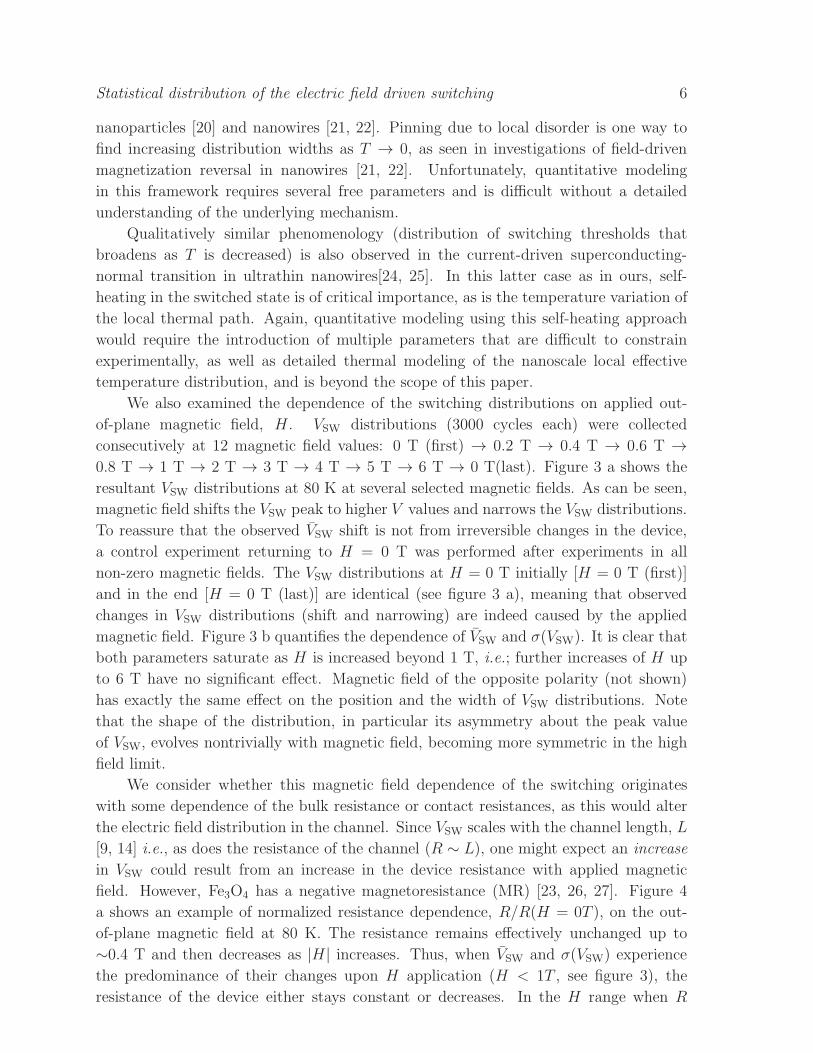
We also examined the dependence of the switching distributions on applied out-
of-plane magnetic field, H . VSW distributions (3000 cycles each) were collected
consecutively at 12 magnetic field values: 0 T (first) → 0.2 T → 0.4 T → 0.6 T →
0.8 T → 1 T → 2 T → 3 T → 4 T → 5 T → 6 T → 0 T(last). Figure 3 a shows the
resultant VSW distributions at 80 K at several selected magnetic fields. As can be seen,
magnetic field shifts the VSW peak to higher V values and narrows the VSW distributions.
To reassure that the observed VSW shift is not from irreversible changes in the device,
a control experiment returning to H = 0 T was performed after experiments in all
non-zero magnetic fields. The VSW distributions at H = 0 T initially [H = 0 T (first)]
and in the end [H = 0 T (last)] are identical (see figure 3 a), meaning that observed
changes in VSW distributions (shift and narrowing) are indeed caused by the applied
magnetic field. Figure 3 b quantifies the dependence of VSW and σ(VSW). It is clear that
both parameters saturate as H is increased beyond 1 T, i.e.; further increases of H up
to 6 T have no significant effect. Magnetic field of the opposite polarity (not shown)
has exactly the same effect on the position and the width of VSW distributions. Note
that the shape of the distribution, in particular its asymmetry about the peak value
of VSW, evolves nontrivially with magnetic field, becoming more symmetric in the high
field limit.
We consider whether this magnetic field dependence of the switching originates
with some dependence of the bulk resistance or contact resistances, as this would alter
the electric field distribution in the channel. Since VSW scales with the channel length, L
[9, 14] i.e., as does the resistance of the channel (R ∼ L), one might expect an increase
in VSW could result from an increase in the device resistance with applied magnetic
field. However, Fe3O4 has a negative magnetoresistance (MR) [23, 26, 27]. Figure 4
a shows an example of normalized resistance dependence, R/R(H = 0T ), on the out-
of-plane magnetic field at 80 K. The resistance remains effectively unchanged up to
∼0.4 T and then decreases as |H| increases. Thus, when VSW and σ(VSW) experience
the predominance of their changes upon H application (H < 1T , see figure 3), the
resistance of the device either stays constant or decreases. In the H range when R

Statistical distribution of the electric field driven switching 7
Figure 3. (a) Examples of VSW distributions at selected magnetic fields
(T=80 K).(b) Magnetic field dependence of the mean switching value, VSW
(red squares), and the width of VSW distributions, σ(VSW) (black circles).
Figure 4. Dependences of the resistance (R/R(H = 0T )) (a) and the
magnetization (M/Ms) (b) on the out-of-plane magnetic field applied.
experiences significant changes (see figure 4 a), VSW and σ(VSW) remain essentially
unchanged (figure 3). Therefore, the shift of VSW in the presence of H does not originate
from the change in the resistance value of the device.
Another Fe3O4 film parameter effected by H is the magnetization of the film.
Figure 4 shows the normalized out-of-plane magnetization, M/Ms, as a function of
the out of plane H , where M is the magnetization of the film and Ms is the saturated
magnetization. This data is consistent with prior measurements on magnetite films[28]
While we do not know the microscopic arrangement of M in the film in the absence of an
external H, magnetostatic energy considerations mean that M under that condition lies
in the plane of the film. The H range over which M is fully reoriented out of the plane
(up to 1 T) matches the H range of changes in the position of VSW and σ(VSW, T ) (fig. 3
b). This suggests (though does not prove) that the switching kinetics parameters VSW
and σ(VSW, T ), and therefore the stability of the gapped, low temperature, insulating
state is tied the magnetization direction of magnetite films.
This observation is intriguing because it is not clear how the nonequilibrium
breakdown of the low temperature state would be coupled to the magnetization. Possible
factors include magnetoelastic effects such as magnetostriction[29] (∼ parts in 104
per Tesla) affecting the tunneling matrix element between B-site iron atoms; and

Statistical distribution of the electric field driven switching 8
spin-orbit coupling playing a similar role[30]. There have been reports of significant
magnetoelectric and multiferroic effects in magnetite [7, 8], and a recent calculation [30]
argues that these originate through the interplay of orbital ordering and on-site spin-
orbit interactions of the B-site electrons. In this picture, reorientation of the spin distorts
the partially filled minority-spin orbitals occupied on the B-site (formally) Fe2+ ions.
Such a distortion would be a natural explanation for the observed correlation between
M and the kinetics of the electric field-driven breakdown of the ordered state, which
directly involves the motions of those charge carriers. It is unclear how this kind of spin-
orbit physics would explain the evolution of the VSW distribution, however. It would
also be worth considering whether there is any correlation between the characteristics
of the switching distributions reported here, and the recently observed glassy relaxor
ferroelectric relaxations in bulk magnetite crystals[31].
Additional, detailed experiments as a function of directionality of H, M, and
crystallographic orientation should be able to test these alternatives. With the existing
(100) films, studies of VSW and σ(VSW, T ) as a function of H in the plane as well
as perpendicular to the plane should be able to access the tensorial form of the H
dependence. Comparison with appropriately directed M vs. H data as a function of
temperature would be a clear test of whether the observed agreement between H-field
scales (in VSW and reorientation of M is coincidental. Further measurements on films
grown with different crystallographic orientations would serve as a cross-check. It is
important to note, however, that the acquisition of such data is very time intensive
due to the need to acquire many thousands of switching events. In turn, there is a
companion requirement of extremely good device stability, to avoid irreversible changes
in the metal configuration over the thousands of switching cycles.
4. Conclusions
We have studied the statistical distribution of the electric field needed for breakdown of
the low temperature state of Fe3O4. The distribution of critical switching voltages moves
to higher voltages and broadens, as T is reduced. This broadening is consistent with
phenomenology in other nonequilibrium experimental systems incorporating disorder
and thermal runaway effects. The breakdown distributions are altered by modest
external magnetic fields normal to the film, suggesting a need for further experiments
to understand the connection between magnetization and breakdown of the correlated
state.
The authors acknowledge valuable conversations with Paul Goldbart and David
Pekker. This work was supported by the US Department of Energy grant DE-FG02-
06ER46337. DN also acknowledges the David and Lucille Packard Foundation and the
Research Corporation. RGSS and IVS acknowledge the Science Foundation of Ireland
grant 06/IN.1/I91.[1] McQueeney R J, Yethiraj M, Montfrooij W, Gardner J S, Metcalf P and Honig J M 2006
Investigation of the presence of charge order in magnetite by measurement of the spin wave
spectrum Phys. Rev. B 73 174409
Statistical distribution of the electric field driven switching 9
[2] Verwey E J 1939 Electronic Conduction of Magnetite (Fe3O4) and its transition point at low
temperatures Nature 144, 327
[3] Rozenberg G K, Pasternak M P, Xu W M, Amiel Y, Hanfland M, Amboage M, Taylor R D and
Jeanloz R 2006 Origin of the Verwey Transition in Magnetite Phys. Rev. Lett. 96 045705
[4] Piekarz P, Parlinski K and Oles A M 2006 Origin of the Verwey Transition in Magnetite Phys.
Rev. Lett. 97, 156402
[5] Schlappa J, Schussler-Langeheine C, Chang C F, Ott H, Tanaka A, Hu Z, Haverkort M W, Scheirle
E, Weschke E, Kaindl G and Tjeng L H 2008 Direct Observation of t2g Orbital Ordering in
Magnetite Phys. Rev. Lett. 100, 026406
[6] Sub’ias G, Garcıa J, Blasco J, Herrero-Martin J and Sanchez M C 2009 Resonant x-ray scattering
in 3d-transition-metal oxides: Anisotropy and charge orderings J. Phys.: Conf. Ser. 190, 012085
[7] Rado G T and Ferrari J M 1975 Electric field dependence of the magnetic anisotropy energy in
magnetite (Fe3O4) Phys. Rev. B 12, 5166-5174
[8] Alexe M, Ziese M, Hesse D, Esquinazi P, Yamauchi K, Fukushima T, Picozzi S and Gosele U 2009
Ferroelectric Switching in Multiferroic Magnetite (Fe3O4) Thin Films Adv. Mater. 21, 4452
[9] Lee S, Fursina A A, Mayo J T, Yavuz C T, Colvin V L, Sofin R G S, Shvets I V and Natelson D
2008 Electrically driven phase transition in magnetite nanostructures Nature Mater. 7, 130-133
[10] Fursina A A, Lee S, Sofin R G S, Shvets I V and Natelson D 2008 Nanogaps with very large aspect
r atios for electrical measurements Appl. Phys. Lett. 92, 113102
[11] Asamitsu A, Tomioka Y, Kuwahara H and Tokura Y 1997 Current switching of resistive states in
magnetoresistive manganites Nature 388, 50-52
[12] Oka T and Aoki H 2005 Ground-State Decay Rate for the Zener Breakdown in Band and Mott
Insulators Phys. Rev. Lett. 95, 137601
[13] Sugimoto N, Onoda S and Nagaosa N 2008 Field-induced metal-insulator transition and switching
phenomenon in correlated insulators Phys. Rev. B 78, 155104
[14] Fursina A A, Sofin R G S, Shvets I V and Natelson D 2009 The origin of hysteresis in resistive
switching in magnetite is Joule heating Phys. Rev. B 79, 245131
[15] Fursina A A, Sofin R G S, Shvets I V and Natelson D 2010 Interplay of bulk and interface effects
in the electric field driven transition in magnetite Phys. Rev. B 81, 045123
[16] Fursina A A, Sofin R G S, Shvets I V and Natelson D 2010 Interfacial transport properties between
a strongly correlated transition metal oxide and a metal: Contact resistance in Fe3O4/M (M=Cu,
Au, Pt) nanostructures Phys. Rev. B 82, 245112
[17] Koblischka-Veneva A, Koblischka M R, Zhou Y, Murphy S, Muucklich F, Hartmann U and Shvets
I V 2007 Electron backscatter diffraction analysis applied to [0 0 1] magnetite thin films grown
on MgO substrates J. Magn. Magn. Mater. 316, 663-665
[18] Arora S K, Sofin R G S, Shvets I V and Luysberg M 2006 Anomalous strain relaxation behavior of
Fe3O4/MgO (100) heteroepitaxial system grown using molecular beam epitaxy J. Appl. Phys.
100, 073908
[19] Garg A 1995 Escape-field distribution for escape from a metastable potential well subject to a
steadily increasing bias field Phys. Rev. B 51, 15592-15595
[20] Wernsdorfer W et al. 1997 Mesoscopic effects in magnetism: Submicron to nanometer size single
particle measurements J. Appl. Phys. 81, 5543-5545
[21] Varga R, Garcıa K L, Zhukov A, Vazquez M and Vojtanik P 2003 Temperature dependence of the
switching field and its distribution function in Fe-based bistable microwires Appl. Phys. Lett.
83, 2620-2622
[22] Varga R, Garcıa K L, Vazquez M, Zhukov A and Vojtanik P 2004 Switching-field distribution in
amorphous magnetic bistable microwires Phys. Rev. B 70, 024402
[23] Sofin R G S, Arora S and Shvets I V 2005 Study of magnetoresistance of epitaxial magnetite films
grown on vicinal MgO (100) substrate J. Appl. Phys. 97, 10D315
[24] Sahu M, Bae M H, Rogachev A, Pekker D, Wei T C, Shah N, Goldbart P M and Bezryadin A 2009
Individual topological tunnelling events of a quantum field probed through their macroscopic
Statistical distribution of the electric field driven switching 10
consequences Nature Phys. 5, 503-508
[25] Pekker D, Shah N, Sahu M, Bezryadin A and Goldbart P M 2009 Stochastic dynamics of phase-
slip trains and superconductive-resistive switching in current-biased nanowires Phys. Rev. B 80,
214525
[26] De Teresa J M, Fernandez-Pacheco A, Morellon L, Orna J, Pardo J A, Serrate D, Algarabel P
A, Ibarra M R 2007 Magnetotransport properties of Fe3O4 thin films for applications in spin
electronics Micro. Engn. 84, 1660-1664
[27] Eerenstein W, Palstra T T M, Saxena S S and Hibma T 2002 Origin of the increased resistivity
in epitaxial Fe3O4 films Phys. Rev. Lett. 88, 247204
[28] Zhou Y, Xuesong, J, and Shvets IV 2004 Enhancement of the magnetization saturation in
magnetite (100) epitaxial films by thermochemical treatment J. Appl. Phys. 95, 7357-7359
[29] Tsuya N, Arai K I and Ohmori K 1977 Effect of magnetoelastic coupling on the anisotropy of
magnetite below the transition temperature Physica B+C 86-88, 959-960
[30] Yamauchi K and Picozzi S 2010 Orbital degrees of freedom as origin of magnetoelectric coupling
in magnetite arXiv:1010.1105
[31] Schrettle F, Krohns S, Lunkenheimer P, Brabers V A M, and Loidl A 2011 Relaxor ferroelectricity
and the freezing of short-range polar order in magnetite Phys. Rev. B 83, 195109