Silica Gels from Coal Fly Ash as Methylene Blue Adsorbent
10
Silica Gels from Coal Fly Ash as Methylene Blue Adsorbent: Isotherm and Kinetic Studies Yudi Aris Sulistiyo *) , Nida Andriana, Bambang Piluharto, Z. Zulfikar Chemistry Department, Faculty of Mathematics and Natural Science, University of Jember, Indonesia Bulletin of Chemical Reaction Engineering & Catalysis, 12 (2), 2017, 263-272 Abstract A lot of dye pollutants were released in the aquatic environment as waste from industrial coloring process. This research aimed to study silica gels (SG) as a potential adsorbent to remove the dyes. The SG can be synthesized from coal fly ash (FA), which is industrial solid waste rarely utilized, using the sol-gel method. Its properties were then characterized by FTIR, XRD, SEM, and isothermal ads-des N2. As a result, FTIR spectra and XRD diffractogram exhibited the successfully SG synthesized from FA with the amorphous structure. The image analysis using SEM demonstrated that SG particles are spherical. The isotherm type, based on isotherm ads-des N2, is type II without hysteresis loop which represents the nonporous material SG with the surface area and pore diameter of 25.977 m 2 /g and 1.52 nm, respectively. The adsorption capacity performance of SG to remove methylene blue (MB) as a basic dye is 62.70 % which is higher than FA, following Langmuir isotherm adsorption model. The kinetics of adsorption rate of SG are based on the pseudo second order models accelerated by 3.37 times faster than FA. Copyright © 2017 BCREC Group. All rights reserved Keywords: Adsorption isotherms; Coal fly ash; Kinetics; Methylene blue dyes; Silica gel How to Cite: Sulistiyo, Y.A., Andriana, N., Piluharto, B., Zulfikar, Z. (2017). Silica Gels from Coal Fly Ash as Methylene Blue Adsorbent: Isotherm and Kinetic Studies. Bulletin of Chemical Reaction Engineering & Catalysis, 12 (2): 263-272 (doi:10.9767/bcrec.12.2.766.263-272) Permalink/DOI: http://dx.doi.org/10.9767/bcrec.12.2.766.263-272 bcrec_766_2016, Copyright © 2017, BCREC, ISSN 1978-2993 Available online at BCREC Website: http://bcrec.undip.ac.id Research Article 1. Introduction The production of the dye is up to 7×10 5 tons/year and consists of 10,000 kinds [1]. The dyes are used in some manufacturers, such as textiles, printings, cosmetics, and food dyes in- dustries. Approximately, 50 % of the dyes are released to the environment as pollutants, be- cause of low interaction between fibers and dyes [2]. Therefore, some pollutants in the aquatic environment can be up to 3.5×10 5 tons /year. The waste water from the industry containing inorganic dye is one of the pollutants that are difficult to degrade. This dye is easy to bind with other compounds, has a slow biodegrada- tion rate, and has a high level of color (chroma) [3]. This high concentration of inorganic dyes in the environment will decrease the ecosystem quality because it inhibits sunlight and disrupts biological processes in water [4]. In addition, it is highly toxic and may damage the landscape of the affected environment. The methods that have been developed for solving problems related to dyes are adsorption [5], coagulation and oxidation [6], photo- degradation [7], biodegradation [8], and mem- brane filtration [9]. However, adsorption appears to be the most feasible method. It is be- cause the adsorption method is easy to imple- * Corresponding Author. E-mail: [email protected] (Sulistyo, Y.A.) Received: 13 rd November 2016; Revised: 18 th February 2017; Accepted: 19 th February 2017
-
Upload
khangminh22 -
Category
Documents
-
view
0 -
download
0
Transcript of Silica Gels from Coal Fly Ash as Methylene Blue Adsorbent
Silica Gels from Coal Fly Ash as Methylene Blue
Adsorbent: Isotherm and Kinetic Studies
Yudi Aris Sulistiyo*), Nida Andriana, Bambang Piluharto, Z. Zulfikar
Chemistry Department, Faculty of Mathematics and Natural Science,
University of Jember, Indonesia
Bulletin of Chemical Reaction Engineering & Catalysis, 12 (2), 2017, 263-272
Abstract
A lot of dye pollutants were released in the aquatic environment as waste from industrial coloring
process. This research aimed to study silica gels (SG) as a potential adsorbent to remove the dyes. The
SG can be synthesized from coal fly ash (FA), which is industrial solid waste rarely utilized, using the
sol-gel method. Its properties were then characterized by FTIR, XRD, SEM, and isothermal ads-des N2.
As a result, FTIR spectra and XRD diffractogram exhibited the successfully SG synthesized from FA
with the amorphous structure. The image analysis using SEM demonstrated that SG particles are
spherical. The isotherm type, based on isotherm ads-des N2, is type II without hysteresis loop which
represents the nonporous material SG with the surface area and pore diameter of 25.977 m2/g and 1.52
nm, respectively. The adsorption capacity performance of SG to remove methylene blue (MB) as a basic
dye is 62.70 % which is higher than FA, following Langmuir isotherm adsorption model. The kinetics of
adsorption rate of SG are based on the pseudo second order models accelerated by 3.37 times faster
than FA. Copyright © 2017 BCREC Group. All rights reserved
Keywords: Adsorption isotherms; Coal fly ash; Kinetics; Methylene blue dyes; Silica gel
How to Cite: Sulistiyo, Y.A., Andriana, N., Piluharto, B., Zulfikar, Z. (2017). Silica Gels from Coal Fly
Ash as Methylene Blue Adsorbent: Isotherm and Kinetic Studies. Bulletin of Chemical Reaction
Engineering & Catalysis, 12 (2): 263-272 (doi:10.9767/bcrec.12.2.766.263-272)
Permalink/DOI: http://dx.doi.org/10.9767/bcrec.12.2.766.263-272
bcrec_766_2016, Copyright © 2017, BCREC, ISSN 1978-2993
Available online at BCREC Website: http://bcrec.undip.ac.id
Research Article
1. Introduction
The production of the dye is up to 7×10⁵
tons/year and consists of 10,000 kinds [1]. The
dyes are used in some manufacturers, such as
textiles, printings, cosmetics, and food dyes in-
dustries. Approximately, 50 % of the dyes are
released to the environment as pollutants, be-
cause of low interaction between fibers and dyes
[2]. Therefore, some pollutants in the aquatic
environment can be up to 3.5×10⁵ tons /year.
The waste water from the industry containing
inorganic dye is one of the pollutants that are
difficult to degrade. This dye is easy to bind
with other compounds, has a slow biodegrada-
tion rate, and has a high level of color (chroma)
[3]. This high concentration of inorganic dyes in
the environment will decrease the ecosystem
quality because it inhibits sunlight and disrupts
biological processes in water [4]. In addition, it
is highly toxic and may damage the landscape of
the affected environment.
The methods that have been developed for
solving problems related to dyes are adsorption
[5], coagulation and oxidation [6], photo-
degradation [7], biodegradation [8], and mem-
brane filtration [9]. However, adsorption
appears to be the most feasible method. It is be-
cause the adsorption method is easy to imple- * Corresponding Author.
E-mail: [email protected] (Sulistyo, Y.A.)
Received: 13rd November 2016; Revised: 18th February 2017; Accepted: 19th February 2017
Bulletin of Chemical Reaction Engineering & Catalysis, 12 (2), 2017, 264
Copyright © 2017, BCREC, ISSN 1978-2993
ment, low-cost technology, effective, wide pH
tolerance and does not create new problems to
the environment (environmentally friendly)
[10]. The adsorption process requires the ad-
sorbent to be easily separated from its
adsorbate, having a high surface area, large
pores, and good chemical and thermal stability.
The common materials used in adsorption are
zeolites, activated carbon, metal organic frame-
works, metal oxide, and other porous materials.
Some porous materials from industrial solid
waste are less used in research focusing on re-
moval of the dyes.
Among the industrial solid wastes used to
remove methylene blue dye (MB), fly ash is po-
tential as the material for adsorbent [11]. Fly
ash can be found in the coal combustion process
along with bottom ash approximately in the
amount of 80 % and 20 %, respectively. More-
over, fly ash contains chemical compounds such
as SiO2 64.97 %; Al2O3 26.64 %; Fe2O3 5.69 %;
CaO 0.33 %; and MgO 0.85 % [12]. The adsorp-
tion capacity of the MB by raw fly ash varies
from 12.7 mg.g-1 [13], 4.60 mg.g-1 [14], to 1.11
mg.g-1 [15]. Those sorption capacities are not
sufficient to solve the MB problems, and there-
fore, it is necessary to find a more potential
adsorbent based on FA.
Removal of metal oxide from FA to be Silica
Gels (SG) by sol-gel method was found to in-
crease the sorption capacity. Silica xerogels
were produced from SiO2 extraction 91 % from
rice husk ash [16] and 99 % of bagasse ash [17].
Silica gels offer the potential as an adsorbent
for MB because it has silanol groups (Si–OH)
acting as the reactive surface that can adsorb
both organic and inorganic pollutants [18].
Goschianska et al. [19] reported the adsorption
capacity of L-phenylalanine using mesoporous
silica gel, such as KIT-6 and SBA-15, were con-
secutively 69.38 and 64.26 mg/g. Those adsorp-
tion capacities of mesoporous SG were higher
than FA, and therefore that study shows the
importance of isolating SiO2 from FA. To the
author’s knowledge, the potential use of SG
that was isolated from FA as MB adsorbent is
rarely investigated.
In this work, the aim of this research is to
study the adsorption capacity of Methylene
Blue as dyes by synthesized silica gel from fly
ash. On the other hand, the using of fly ash as
materials for silica gel will obtain many bene-
fits such as to decrease the environmental
problems that caused by the high amount of fly
ash, to increase the economic value of fly ash
and to overcome the Methylene Blue from in-
dustrial waste.
2. Materials and Methods
2.1. Materials
Materials used in this research were NaOH
(Merck, 99 %), HCl (Merck, 37 %), H2SO4
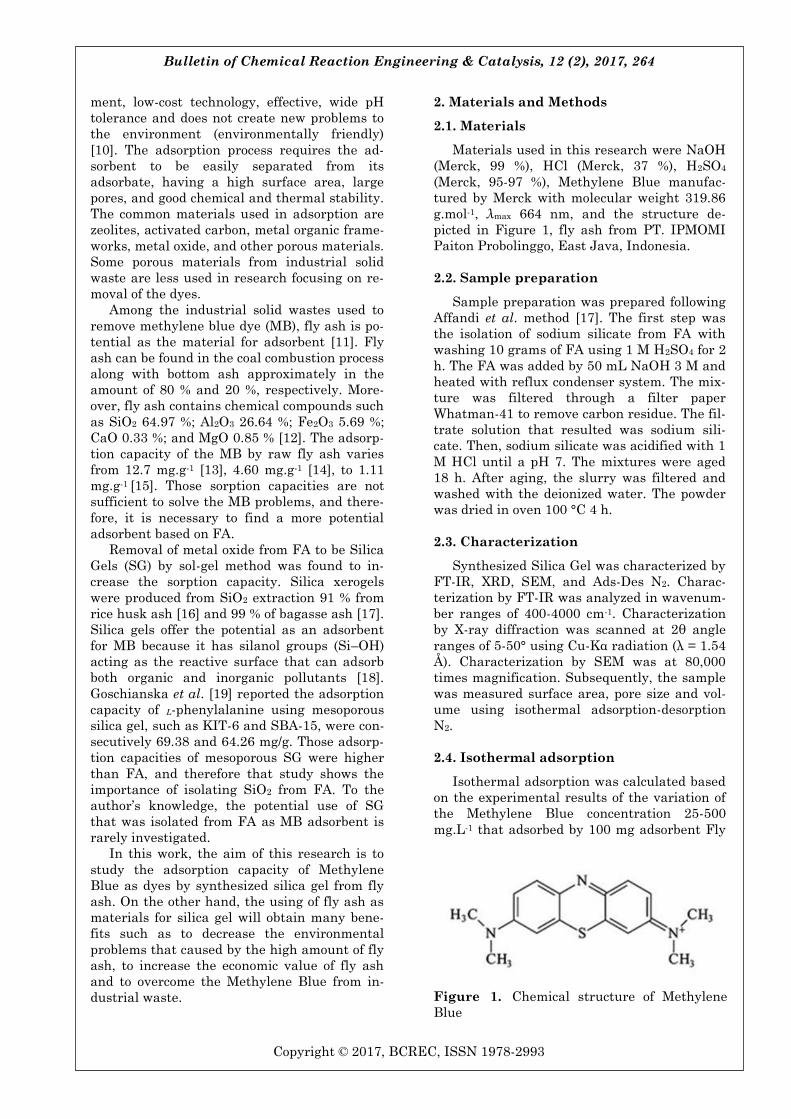
(Merck, 95-97 %), Methylene Blue manufac-
tured by Merck with molecular weight 319.86
g.mol-1, λmax 664 nm, and the structure de-
picted in Figure 1, fly ash from PT. IPMOMI
Paiton Probolinggo, East Java, Indonesia.
2.2. Sample preparation
Sample preparation was prepared following
Affandi et al. method [17]. The first step was
the isolation of sodium silicate from FA with
washing 10 grams of FA using 1 M H2SO4 for 2
h. The FA was added by 50 mL NaOH 3 M and
heated with reflux condenser system. The mix-
ture was filtered through a filter paper
Whatman-41 to remove carbon residue. The fil-
trate solution that resulted was sodium sili-
cate. Then, sodium silicate was acidified with 1
M HCl until a pH 7. The mixtures were aged
18 h. After aging, the slurry was filtered and
washed with the deionized water. The powder
was dried in oven 100 °C 4 h.
2.3. Characterization
Synthesized Silica Gel was characterized by
FT-IR, XRD, SEM, and Ads-Des N2. Charac-
terization by FT-IR was analyzed in wavenum-
ber ranges of 400-4000 cm-1. Characterization
by X-ray diffraction was scanned at 2θ angle
ranges of 5-50° using Cu-Kα radiation (λ = 1.54
Å). Characterization by SEM was at 80,000
times magnification. Subsequently, the sample
was measured surface area, pore size and vol-
ume using isothermal adsorption-desorption
N2.
2.4. Isothermal adsorption
Isothermal adsorption was calculated based
on the experimental results of the variation of
the Methylene Blue concentration 25-500
mg.L-1 that adsorbed by 100 mg adsorbent Fly
Figure 1. Chemical structure of Methylene
Blue
Bulletin of Chemical Reaction Engineering & Catalysis, 12 (2), 2017, 265
Copyright © 2017, BCREC, ISSN 1978-2993
Ash and Silica Gels. The mixture was filtered,
and the filtrate was measured as a residual
concentration of Methylene Blue that is not ab-
sorbed by the adsorbent. Thus, the adsorption
capacity data can be calculated by the following
equation:
(1)
where qe is the amount of Methylene Blue that
absorbed per gram of adsorbent, C0 and Ce are
the initial and at equilibrium (mg.L-1) Methyl-
ene Blue concentration, respectively. Based on
the data adsorption capacity can be calculated
the equilibrium adsorption isotherm using
several models.
The Langmuir adsorption isotherm was de-
veloped as in Equation 2 [20]:
(2)
qe is the amount of adsorbate that adsorbed on
the equilibrium condition (mg.g-1), Ce is the
equilibrium concentration of adsorbate
(mg.L-1), qmax is the monolayer maximum ad-
sorption capacity on the adsorbent (mg.g-1), KL
is Langmuir equilibrium constant that related
to the free energy of adsorption (L.mg-1).
The Freundlich adsorption isotherm was de-
veloped as in Equation 3 [5]:
(3)
Ce is the equilibrium concentration of adsorbate
(mg.L-1), qe is the amount of adsorbate that ad-
sorbed per unit mass (mg.g-1), KF is the adsorp-
tion capacity of the adsorbent, n is the
Freundlich constants.
2.5. Kinetics of adsorption
The kinetics of adsorption was calculated
based on experimental results of the variation
of the interaction time (15, 30, 45, 60, and 90
minutes) between 200 mg.L-1 of Methylene
Blue and 10 mg adsorbent Fly Ash and Silica
Gels. The mixture was filtered, and the filtrate
was measured as a residual concentration of
MB that was not absorbed by the adsorbent.
Based on these data, the studies of kinetics ad-
sorption was calculated by pseudo-first-order,
pseudo-second-order, Intra-particle and Elovich
Diffusion Equations models.
Pseudo-first-order Model by isothermal Lager-
gren is typed as in Equation 4 [21]:
(4)
qt and qe are the amounts of adsorbate ad-
sorbed in time t and equilibrium (mg.g-1), k1 is
a constant pseudo-first-order (min-1) and t is
the interaction time (min). Determining the
value of k1 may be determined by the plot be-
tween log (qe-qt) versus t.
Pseudo-second-order Model Ho and McKey [22]
is typed in Equation 5:
(5)
k2 is the Pseudo-second-order constant (g.mg-
1.min-1) that determined by plot t/qt versus t.
Intra-particle Diffusion Model [23] is typed as
in Equation 6:
(6)
where kt is the rate constant of intra-particle
diffusion (mg.g-1.min-1/2) and C is an intercept
which shows the relationship boundary layer
thickness. The larger of the value of C was the
greater of the effect of the barrier layer.
Elovich Equation Model [21] is typed in Equa-
tion 7:
(7)
α is the adsorption rate constant at first (mg.
g-1.min-1) and parameter β is the relations of
the surface that covered and chemisorption ac-
tivation energy (g.mg-1). Values α and β can be
calculated with a plot qt vs ln t. Elovich Equa-
tion Model is often used when adsorption oc-
curs on the heterogeneous surface.
3. Results and Discussion
3.1. Characterization of adsorbent
The acidification of sodium silicate from
coal fly ash with 1 M HCl via sol-gel process
produced SG. It was calcined at 550 °C under
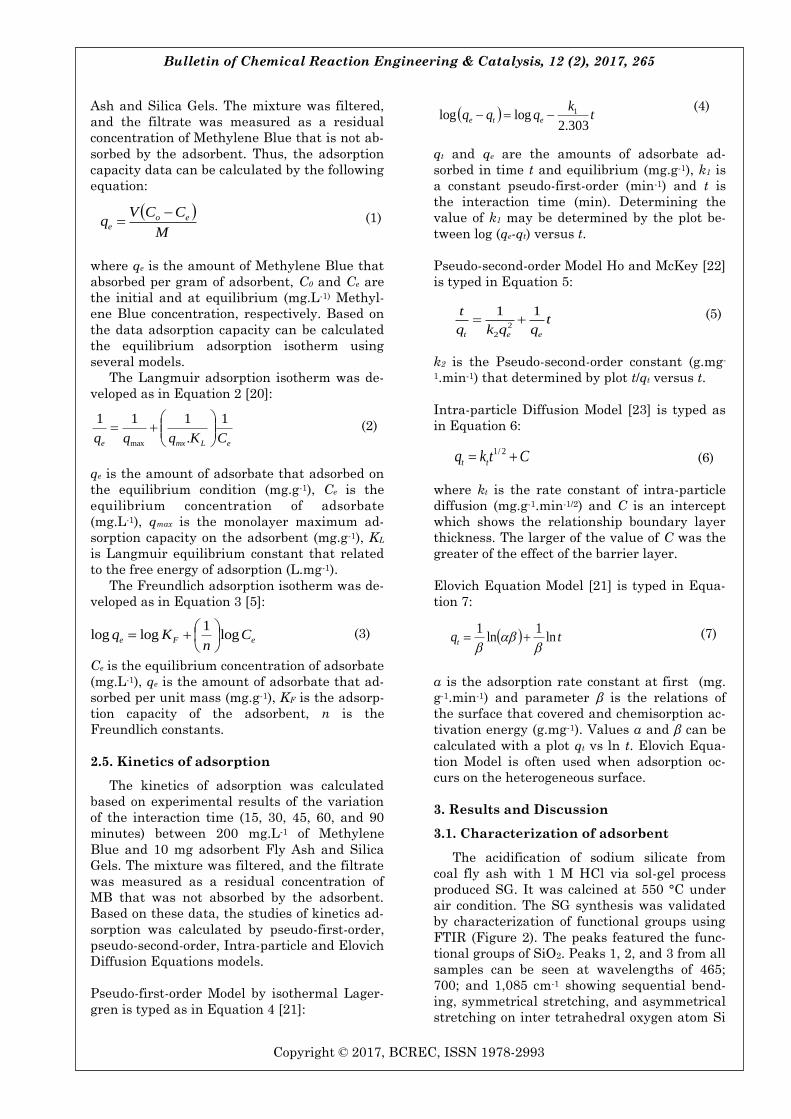
air condition. The SG synthesis was validated
by characterization of functional groups using
FTIR (Figure 2). The peaks featured the func-
tional groups of SiO2. Peaks 1, 2, and 3 from all
samples can be seen at wavelengths of 465;
700; and 1,085 cm-1 showing sequential bend-
ing, symmetrical stretching, and asymmetrical
stretching on inter tetrahedral oxygen atom Si
M
CCVq eo
e
eLmxe CKqqq
1
.
111
max
eFe Cn
Kq log1
loglog
tk
qqq ete303.2
loglog 1
tqqkq
t
eet
112
2
Ctkq tt 2/1
tqt ln1
ln1
Bulletin of Chemical Reaction Engineering & Catalysis, 12 (2), 2017, 266
Copyright © 2017, BCREC, ISSN 1978-2993
–O–Si (siloxane) as the main structure of SiO2
[21]. In addition, the peak at wavelength 1,630
cm-1 (peak 4) and a broad peak at 3,440 cm-1
(peak 7) showed consecutively the characteris-
tic of bending and stretching of ‒OH attached
to the SiO2 frameworks to become silanol group
(Si–OH). The differences in peak intensity of
the silanol and siloxane structures on fly ash
(Figure 2a) are lower than both on the silica gel
(Figure 2b) reflecting the increase of purity
silica content. Aside from that, the impurities
were successfully removed from the SiO2 struc-
ture. It was confirmed by X-ray diffractogram.
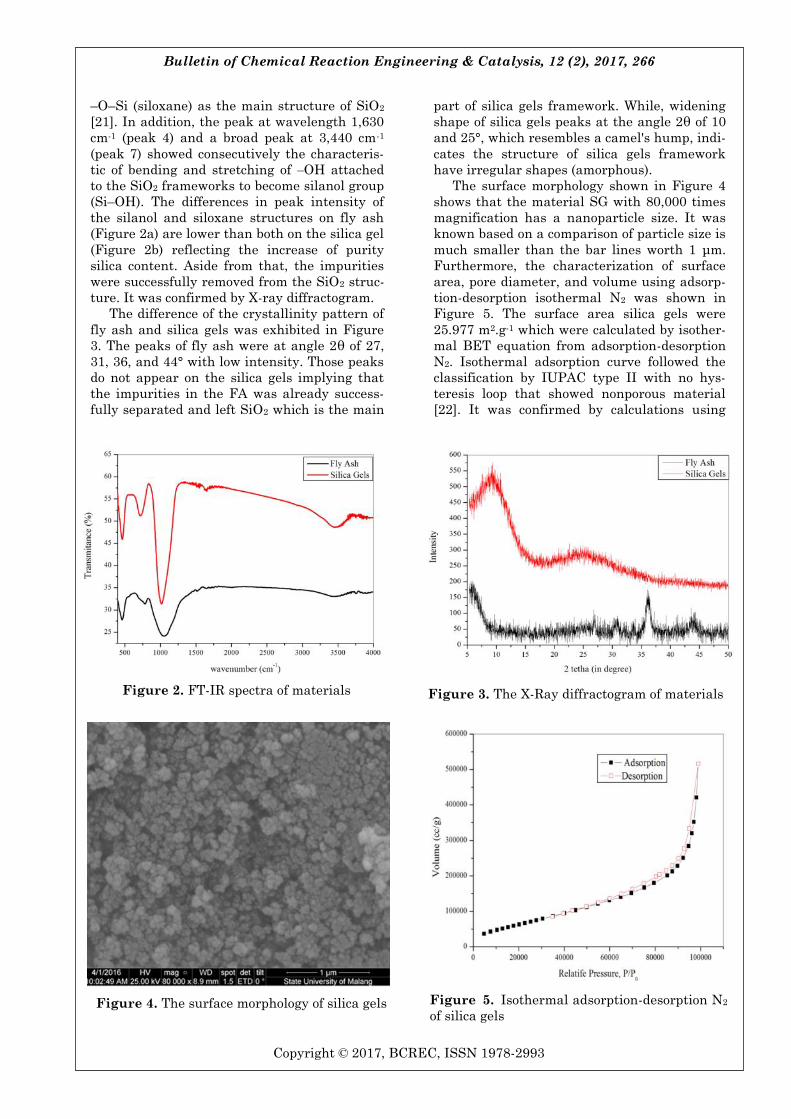
The difference of the crystallinity pattern of
fly ash and silica gels was exhibited in Figure
3. The peaks of fly ash were at angle 2θ of 27,
31, 36, and 44° with low intensity. Those peaks
do not appear on the silica gels implying that
the impurities in the FA was already success-
fully separated and left SiO2 which is the main
part of silica gels framework. While, widening
shape of silica gels peaks at the angle 2θ of 10
and 25°, which resembles a camel's hump, indi-
cates the structure of silica gels framework
have irregular shapes (amorphous).
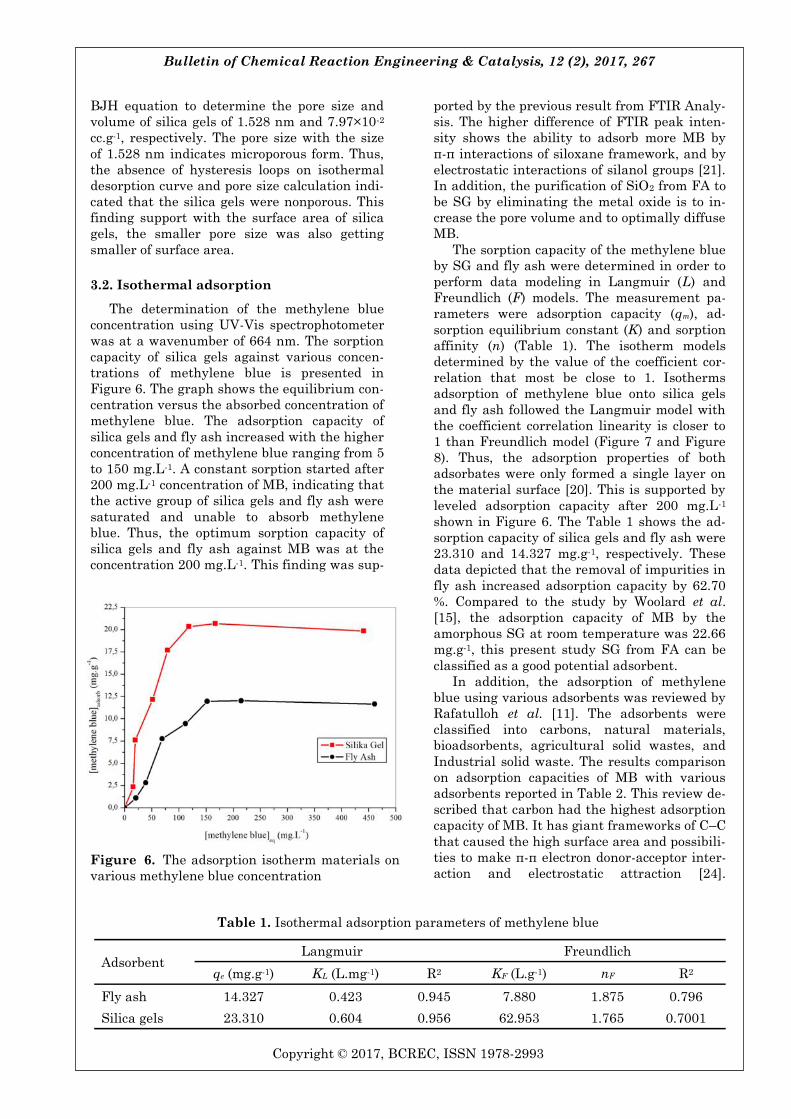
The surface morphology shown in Figure 4
shows that the material SG with 80,000 times
magnification has a nanoparticle size. It was
known based on a comparison of particle size is
much smaller than the bar lines worth 1 μm.
Furthermore, the characterization of surface
area, pore diameter, and volume using adsorp-
tion-desorption isothermal N2 was shown in
Figure 5. The surface area silica gels were
25.977 m2.g-1 which were calculated by isother-
mal BET equation from adsorption-desorption
N2. Isothermal adsorption curve followed the
classification by IUPAC type II with no hys-
teresis loop that showed nonporous material
[22]. It was confirmed by calculations using
Figure 4. The surface morphology of silica gels Figure 5. Isothermal adsorption-desorption N2
of silica gels
Figure 2. FT-IR spectra of materials Figure 3. The X-Ray diffractogram of materials
Bulletin of Chemical Reaction Engineering & Catalysis, 12 (2), 2017, 267
Copyright © 2017, BCREC, ISSN 1978-2993
BJH equation to determine the pore size and
volume of silica gels of 1.528 nm and 7.97×10⁻²
cc.g-1, respectively. The pore size with the size
of 1.528 nm indicates microporous form. Thus,
the absence of hysteresis loops on isothermal
desorption curve and pore size calculation indi-
cated that the silica gels were nonporous. This
finding support with the surface area of silica
gels, the smaller pore size was also getting
smaller of surface area.
3.2. Isothermal adsorption
The determination of the methylene blue
concentration using UV-Vis spectrophotometer
was at a wavenumber of 664 nm. The sorption
capacity of silica gels against various concen-
trations of methylene blue is presented in
Figure 6. The graph shows the equilibrium con-
centration versus the absorbed concentration of
methylene blue. The adsorption capacity of
silica gels and fly ash increased with the higher
concentration of methylene blue ranging from 5
to 150 mg.L-1. A constant sorption started after
200 mg.L-1 concentration of MB, indicating that
the active group of silica gels and fly ash were
saturated and unable to absorb methylene
blue. Thus, the optimum sorption capacity of
silica gels and fly ash against MB was at the
concentration 200 mg.L-1. This finding was sup-
ported by the previous result from FTIR Analy-
sis. The higher difference of FTIR peak inten-
sity shows the ability to adsorb more MB by
π-π interactions of siloxane framework, and by
electrostatic interactions of silanol groups [21].
In addition, the purification of SiO2 from FA to
be SG by eliminating the metal oxide is to in-
crease the pore volume and to optimally diffuse
MB.
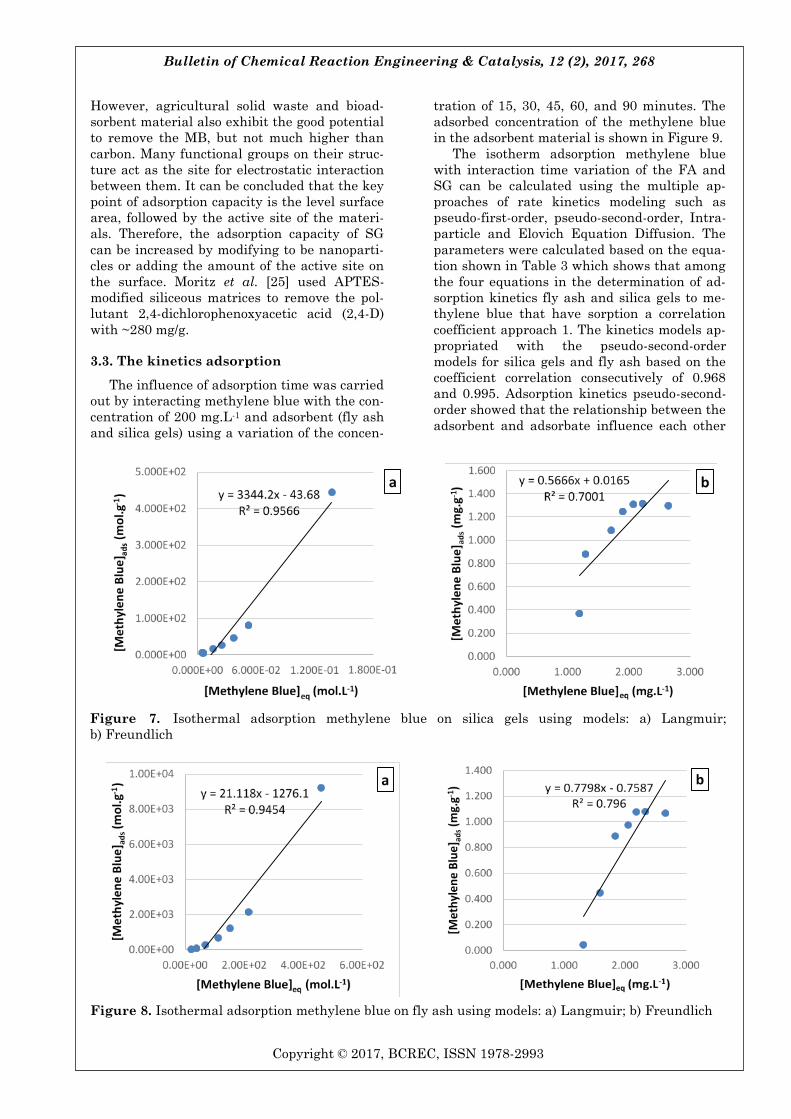
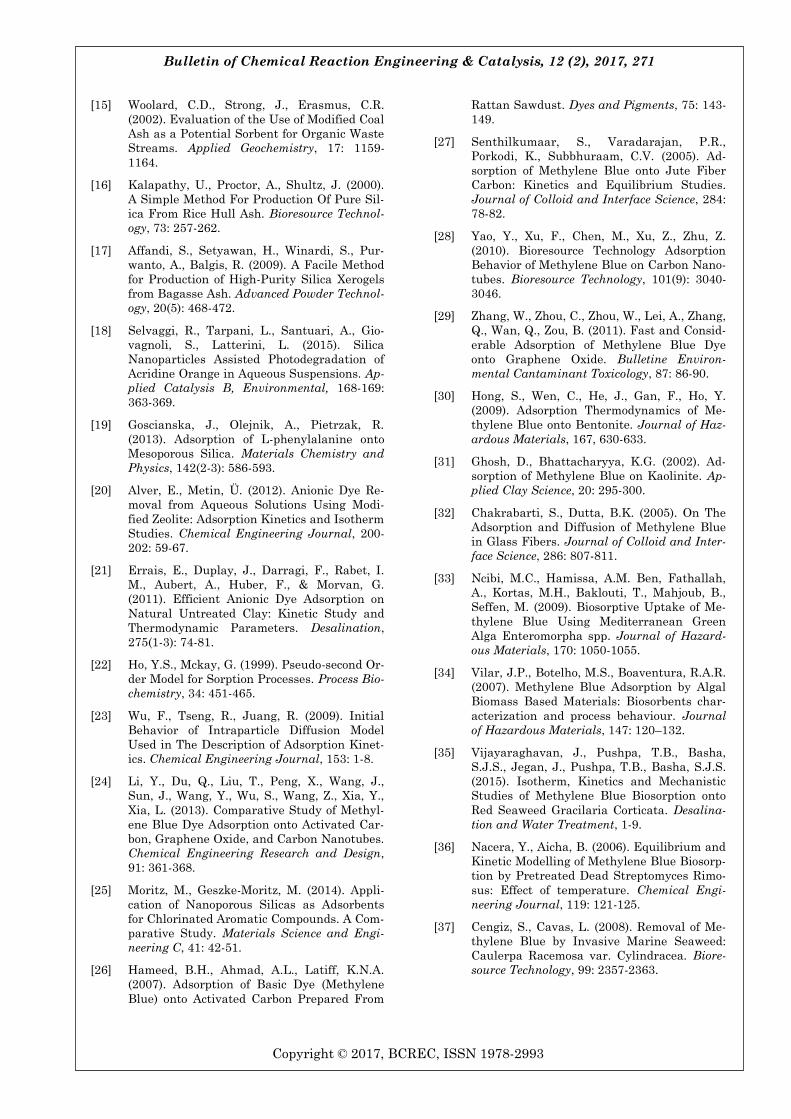
The sorption capacity of the methylene blue
by SG and fly ash were determined in order to
perform data modeling in Langmuir (L) and
Freundlich (F) models. The measurement pa-
rameters were adsorption capacity (qm), ad-
sorption equilibrium constant (K) and sorption
affinity (n) (Table 1). The isotherm models
determined by the value of the coefficient cor-
relation that most be close to 1. Isotherms
adsorption of methylene blue onto silica gels
and fly ash followed the Langmuir model with
the coefficient correlation linearity is closer to
1 than Freundlich model (Figure 7 and Figure
8). Thus, the adsorption properties of both
adsorbates were only formed a single layer on
the material surface [20]. This is supported by
leveled adsorption capacity after 200 mg.L-1
shown in Figure 6. The Table 1 shows the ad-
sorption capacity of silica gels and fly ash were
23.310 and 14.327 mg.g-1, respectively. These
data depicted that the removal of impurities in
fly ash increased adsorption capacity by 62.70
%. Compared to the study by Woolard et al.
[15], the adsorption capacity of MB by the
amorphous SG at room temperature was 22.66
mg.g-1, this present study SG from FA can be
classified as a good potential adsorbent.
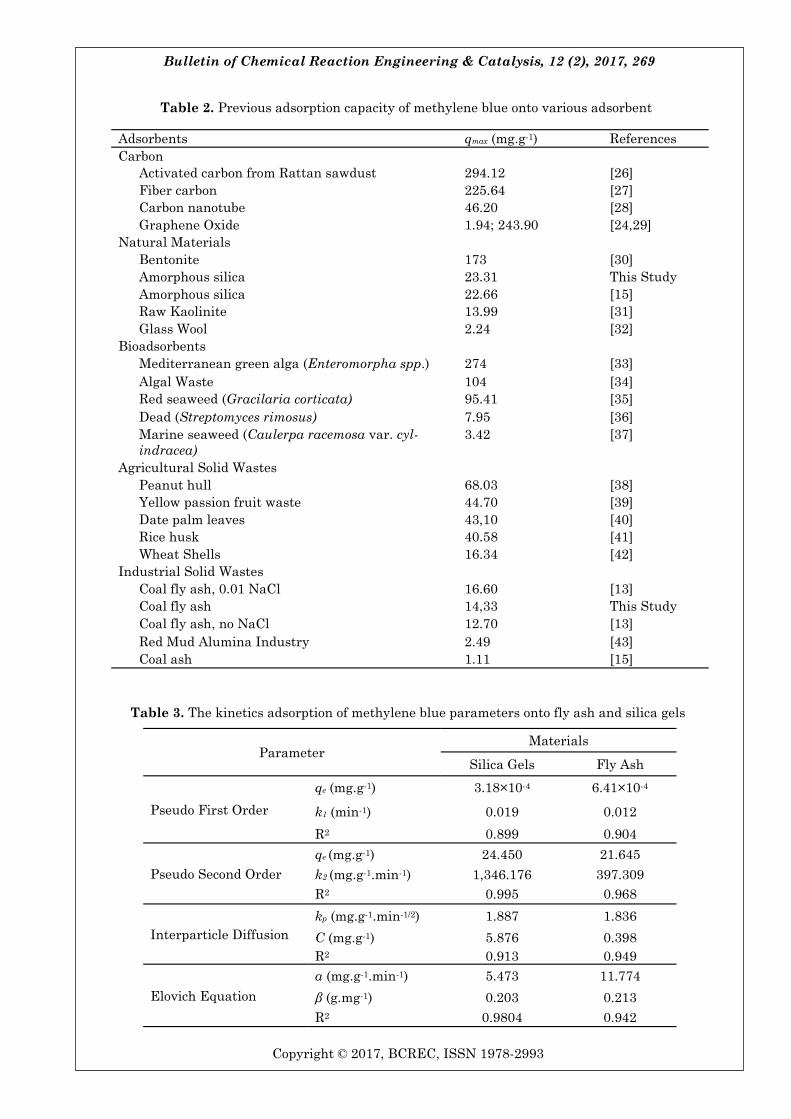
In addition, the adsorption of methylene
blue using various adsorbents was reviewed by
Rafatulloh et al. [11]. The adsorbents were
classified into carbons, natural materials,
bioadsorbents, agricultural solid wastes, and
Industrial solid waste. The results comparison
on adsorption capacities of MB with various
adsorbents reported in Table 2. This review de-
scribed that carbon had the highest adsorption
capacity of MB. It has giant frameworks of C–C
that caused the high surface area and possibili-
ties to make π-π electron donor-acceptor inter-
action and electrostatic attraction [24].
Table 1. Isothermal adsorption parameters of methylene blue
Figure 6. The adsorption isotherm materials on
various methylene blue concentration
Adsorbent Langmuir Freundlich
qe (mg.g-1) KL (L.mg-1) R2 KF (L.g-1) nF R2
Fly ash 14.327 0.423 0.945 7.880 1.875 0.796
Silica gels 23.310 0.604 0.956 62.953 1.765 0.7001
Bulletin of Chemical Reaction Engineering & Catalysis, 12 (2), 2017, 268
Copyright © 2017, BCREC, ISSN 1978-2993
However, agricultural solid waste and bioad-
sorbent material also exhibit the good potential
to remove the MB, but not much higher than
carbon. Many functional groups on their struc-
ture act as the site for electrostatic interaction
between them. It can be concluded that the key
point of adsorption capacity is the level surface
area, followed by the active site of the materi-
als. Therefore, the adsorption capacity of SG
can be increased by modifying to be nanoparti-
cles or adding the amount of the active site on
the surface. Moritz et al. [25] used APTES-
modified siliceous matrices to remove the pol-
lutant 2,4-dichlorophenoxyacetic acid (2,4-D)
with ~280 mg/g.
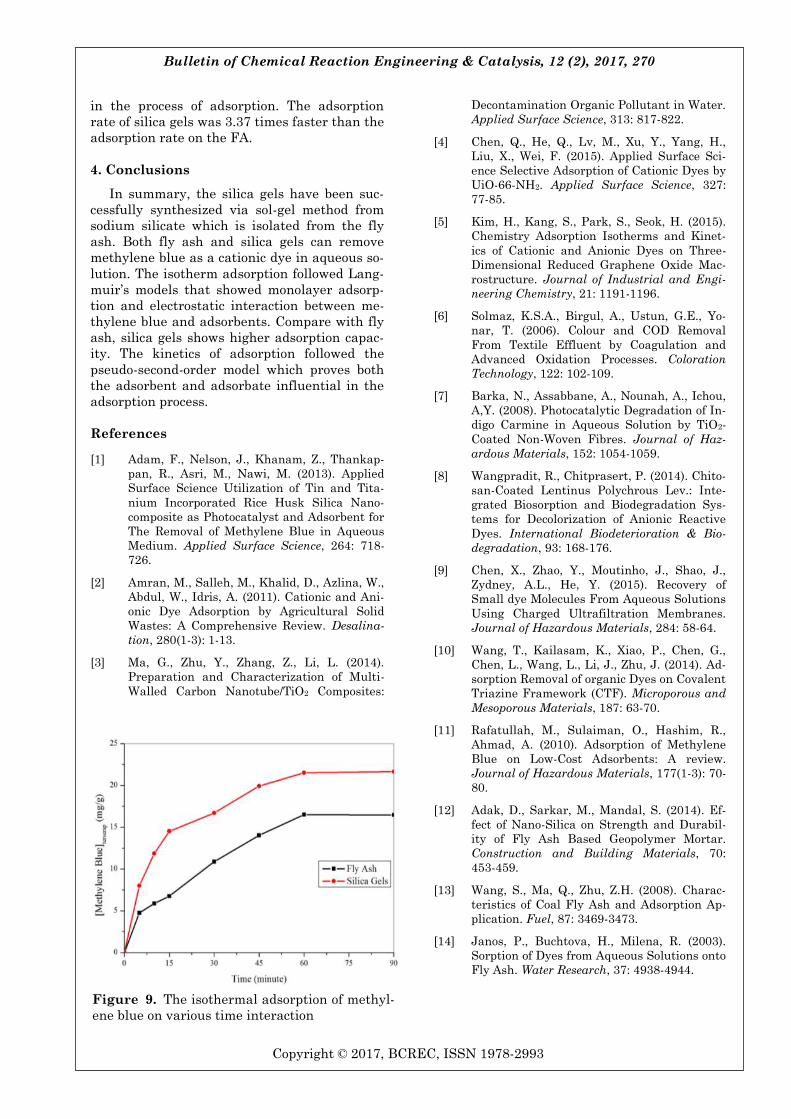
3.3. The kinetics adsorption
The influence of adsorption time was carried
out by interacting methylene blue with the con-
centration of 200 mg.L-1 and adsorbent (fly ash
and silica gels) using a variation of the concen-
tration of 15, 30, 45, 60, and 90 minutes. The
adsorbed concentration of the methylene blue
in the adsorbent material is shown in Figure 9.
The isotherm adsorption methylene blue
with interaction time variation of the FA and
SG can be calculated using the multiple ap-
proaches of rate kinetics modeling such as
pseudo-first-order, pseudo-second-order, Intra-
particle and Elovich Equation Diffusion. The
parameters were calculated based on the equa-
tion shown in Table 3 which shows that among
the four equations in the determination of ad-
sorption kinetics fly ash and silica gels to me-
thylene blue that have sorption a correlation
coefficient approach 1. The kinetics models ap-
propriated with the pseudo-second-order
models for silica gels and fly ash based on the
coefficient correlation consecutively of 0.968
and 0.995. Adsorption kinetics pseudo-second-
order showed that the relationship between the
adsorbent and adsorbate influence each other
Figure 8. Isothermal adsorption methylene blue on fly ash using models: a) Langmuir; b) Freundlich
Figure 7. Isothermal adsorption methylene blue on silica gels using models: a) Langmuir;
b) Freundlich
Bulletin of Chemical Reaction Engineering & Catalysis, 12 (2), 2017, 269
Copyright © 2017, BCREC, ISSN 1978-2993
Table 3. The kinetics adsorption of methylene blue parameters onto fly ash and silica gels
Parameter Materials
Silica Gels Fly Ash
Pseudo First Order
qe (mg.g-1) 3.18×10⁻⁴ 6.41×10⁻⁴
k1 (min-1) 0.019 0.012
R2 0.899 0.904
Pseudo Second Order
qe (mg.g-1) 24.450 21.645
k2 (mg.g-1.min-1) 1,346.176 397.309
R2 0.995 0.968
Interparticle Diffusion
kp (mg.g-1.min-1/2) 1.887 1.836
C (mg.g-1) 5.876 0.398
R2 0.913 0.949
Elovich Equation
α (mg.g-1.min-1) 5.473 11.774
β (g.mg-1) 0.203 0.213
R2 0.9804 0.942
Adsorbents qmax (mg.g-1) References
Carbon
Activated carbon from Rattan sawdust 294.12 [26]
Fiber carbon 225.64 [27]
Carbon nanotube 46.20 [28]
Graphene Oxide 1.94; 243.90 [24,29]
Natural Materials
Bentonite 173 [30]
Amorphous silica 23.31 This Study
Amorphous silica 22.66 [15]
Raw Kaolinite 13.99 [31]
Glass Wool 2.24 [32]
Bioadsorbents
Mediterranean green alga (Enteromorpha spp.) 274 [33]
Algal Waste 104 [34]
Red seaweed (Gracilaria corticata) 95.41 [35]
Dead (Streptomyces rimosus) 7.95 [36]
Marine seaweed (Caulerpa racemosa var. cyl-
indracea)
3.42 [37]
Agricultural Solid Wastes
Peanut hull 68.03 [38]
Yellow passion fruit waste 44.70 [39]
Date palm leaves 43,10 [40]
Rice husk 40.58 [41]
Wheat Shells 16.34 [42]
Industrial Solid Wastes
Coal fly ash, 0.01 NaCl 16.60 [13]
Coal fly ash 14,33 This Study
Coal fly ash, no NaCl 12.70 [13]
Red Mud Alumina Industry 2.49 [43]
Coal ash 1.11 [15]
Table 2. Previous adsorption capacity of methylene blue onto various adsorbent
Bulletin of Chemical Reaction Engineering & Catalysis, 12 (2), 2017, 270
Copyright © 2017, BCREC, ISSN 1978-2993
in the process of adsorption. The adsorption
rate of silica gels was 3.37 times faster than the
adsorption rate on the FA.
4. Conclusions
In summary, the silica gels have been suc-
cessfully synthesized via sol-gel method from
sodium silicate which is isolated from the fly
ash. Both fly ash and silica gels can remove
methylene blue as a cationic dye in aqueous so-
lution. The isotherm adsorption followed Lang-
muir’s models that showed monolayer adsorp-
tion and electrostatic interaction between me-
thylene blue and adsorbents. Compare with fly
ash, silica gels shows higher adsorption capac-
ity. The kinetics of adsorption followed the
pseudo-second-order model which proves both
the adsorbent and adsorbate influential in the
adsorption process.
References
[1] Adam, F., Nelson, J., Khanam, Z., Thankap-
pan, R., Asri, M., Nawi, M. (2013). Applied
Surface Science Utilization of Tin and Tita-
nium Incorporated Rice Husk Silica Nano-
composite as Photocatalyst and Adsorbent for
The Removal of Methylene Blue in Aqueous
Medium. Applied Surface Science, 264: 718-
726.
[2] Amran, M., Salleh, M., Khalid, D., Azlina, W.,
Abdul, W., Idris, A. (2011). Cationic and Ani-
onic Dye Adsorption by Agricultural Solid
Wastes: A Comprehensive Review. Desalina-
tion, 280(1-3): 1-13.
[3] Ma, G., Zhu, Y., Zhang, Z., Li, L. (2014).
Preparation and Characterization of Multi-
Walled Carbon Nanotube/TiO2 Composites:
Decontamination Organic Pollutant in Water.
Applied Surface Science, 313: 817-822.
[4] Chen, Q., He, Q., Lv, M., Xu, Y., Yang, H.,
Liu, X., Wei, F. (2015). Applied Surface Sci-
ence Selective Adsorption of Cationic Dyes by
UiO-66-NH2. Applied Surface Science, 327:
77-85.
[5] Kim, H., Kang, S., Park, S., Seok, H. (2015).
Chemistry Adsorption Isotherms and Kinet-
ics of Cationic and Anionic Dyes on Three-
Dimensional Reduced Graphene Oxide Mac-
rostructure. Journal of Industrial and Engi-
neering Chemistry, 21: 1191-1196.
[6] Solmaz, K.S.A., Birgul, A., Ustun, G.E., Yo-
nar, T. (2006). Colour and COD Removal
From Textile Effluent by Coagulation and
Advanced Oxidation Processes. Coloration
Technology, 122: 102-109.
[7] Barka, N., Assabbane, A., Nounah, A., Ichou,
A,Y. (2008). Photocatalytic Degradation of In-
digo Carmine in Aqueous Solution by TiO2-
Coated Non-Woven Fibres. Journal of Haz-
ardous Materials, 152: 1054-1059.
[8] Wangpradit, R., Chitprasert, P. (2014). Chito-
san-Coated Lentinus Polychrous Lev.: Inte-
grated Biosorption and Biodegradation Sys-
tems for Decolorization of Anionic Reactive
Dyes. International Biodeterioration & Bio-
degradation, 93: 168-176.
[9] Chen, X., Zhao, Y., Moutinho, J., Shao, J.,
Zydney, A.L., He, Y. (2015). Recovery of
Small dye Molecules From Aqueous Solutions
Using Charged Ultrafiltration Membranes.
Journal of Hazardous Materials, 284: 58-64.
[10] Wang, T., Kailasam, K., Xiao, P., Chen, G.,
Chen, L., Wang, L., Li, J., Zhu, J. (2014). Ad-
sorption Removal of organic Dyes on Covalent
Triazine Framework (CTF). Microporous and
Mesoporous Materials, 187: 63-70.
[11] Rafatullah, M., Sulaiman, O., Hashim, R.,
Ahmad, A. (2010). Adsorption of Methylene
Blue on Low-Cost Adsorbents: A review.
Journal of Hazardous Materials, 177(1-3): 70-
80.
[12] Adak, D., Sarkar, M., Mandal, S. (2014). Ef-
fect of Nano-Silica on Strength and Durabil-
ity of Fly Ash Based Geopolymer Mortar.
Construction and Building Materials, 70:
453-459.
[13] Wang, S., Ma, Q., Zhu, Z.H. (2008). Charac-
teristics of Coal Fly Ash and Adsorption Ap-
plication. Fuel, 87: 3469-3473.
[14] Janos, P., Buchtova, H., Milena, R. (2003).
Sorption of Dyes from Aqueous Solutions onto
Fly Ash. Water Research, 37: 4938-4944.
Figure 9. The isothermal adsorption of methyl-
ene blue on various time interaction
Bulletin of Chemical Reaction Engineering & Catalysis, 12 (2), 2017, 271
Copyright © 2017, BCREC, ISSN 1978-2993
[15] Woolard, C.D., Strong, J., Erasmus, C.R.
(2002). Evaluation of the Use of Modified Coal
Ash as a Potential Sorbent for Organic Waste
Streams. Applied Geochemistry, 17: 1159-
1164.
[16] Kalapathy, U., Proctor, A., Shultz, J. (2000).
A Simple Method For Production Of Pure Sil-
ica From Rice Hull Ash. Bioresource Technol-
ogy, 73: 257-262.
[17] Affandi, S., Setyawan, H., Winardi, S., Pur-
wanto, A., Balgis, R. (2009). A Facile Method
for Production of High-Purity Silica Xerogels
from Bagasse Ash. Advanced Powder Technol-
ogy, 20(5): 468-472.
[18] Selvaggi, R., Tarpani, L., Santuari, A., Gio-
vagnoli, S., Latterini, L. (2015). Silica
Nanoparticles Assisted Photodegradation of
Acridine Orange in Aqueous Suspensions. Ap-
plied Catalysis B, Environmental, 168-169:
363-369.
[19] Goscianska, J., Olejnik, A., Pietrzak, R.
(2013). Adsorption of L-phenylalanine onto
Mesoporous Silica. Materials Chemistry and
Physics, 142(2-3): 586-593.
[20] Alver, E., Metin, Ü. (2012). Anionic Dye Re-
moval from Aqueous Solutions Using Modi-
fied Zeolite: Adsorption Kinetics and Isotherm
Studies. Chemical Engineering Journal, 200-
202: 59-67.
[21] Errais, E., Duplay, J., Darragi, F., Rabet, I.
M., Aubert, A., Huber, F., & Morvan, G.
(2011). Efficient Anionic Dye Adsorption on
Natural Untreated Clay: Kinetic Study and
Thermodynamic Parameters. Desalination,
275(1-3): 74-81.
[22] Ho, Y.S., Mckay, G. (1999). Pseudo-second Or-
der Model for Sorption Processes. Process Bio-
chemistry, 34: 451-465.
[23] Wu, F., Tseng, R., Juang, R. (2009). Initial
Behavior of Intraparticle Diffusion Model
Used in The Description of Adsorption Kinet-
ics. Chemical Engineering Journal, 153: 1-8.
[24] Li, Y., Du, Q., Liu, T., Peng, X., Wang, J.,
Sun, J., Wang, Y., Wu, S., Wang, Z., Xia, Y.,
Xia, L. (2013). Comparative Study of Methyl-
ene Blue Dye Adsorption onto Activated Car-
bon, Graphene Oxide, and Carbon Nanotubes.
Chemical Engineering Research and Design,
91: 361-368.
[25] Moritz, M., Geszke-Moritz, M. (2014). Appli-
cation of Nanoporous Silicas as Adsorbents
for Chlorinated Aromatic Compounds. A Com-
parative Study. Materials Science and Engi-
neering C, 41: 42-51.
[26] Hameed, B.H., Ahmad, A.L., Latiff, K.N.A.
(2007). Adsorption of Basic Dye (Methylene
Blue) onto Activated Carbon Prepared From
Rattan Sawdust. Dyes and Pigments, 75: 143-
149.
[27] Senthilkumaar, S., Varadarajan, P.R.,
Porkodi, K., Subbhuraam, C.V. (2005). Ad-
sorption of Methylene Blue onto Jute Fiber
Carbon: Kinetics and Equilibrium Studies.
Journal of Colloid and Interface Science, 284:
78-82.
[28] Yao, Y., Xu, F., Chen, M., Xu, Z., Zhu, Z.
(2010). Bioresource Technology Adsorption
Behavior of Methylene Blue on Carbon Nano-
tubes. Bioresource Technology, 101(9): 3040-
3046.
[29] Zhang, W., Zhou, C., Zhou, W., Lei, A., Zhang,
Q., Wan, Q., Zou, B. (2011). Fast and Consid-
erable Adsorption of Methylene Blue Dye
onto Graphene Oxide. Bulletine Environ-
mental Cantaminant Toxicology, 87: 86-90.
[30] Hong, S., Wen, C., He, J., Gan, F., Ho, Y.
(2009). Adsorption Thermodynamics of Me-
thylene Blue onto Bentonite. Journal of Haz-
ardous Materials, 167, 630-633.
[31] Ghosh, D., Bhattacharyya, K.G. (2002). Ad-
sorption of Methylene Blue on Kaolinite. Ap-
plied Clay Science, 20: 295-300.
[32] Chakrabarti, S., Dutta, B.K. (2005). On The
Adsorption and Diffusion of Methylene Blue
in Glass Fibers. Journal of Colloid and Inter-
face Science, 286: 807-811.
[33] Ncibi, M.C., Hamissa, A.M. Ben, Fathallah,
A., Kortas, M.H., Baklouti, T., Mahjoub, B.,
Seffen, M. (2009). Biosorptive Uptake of Me-
thylene Blue Using Mediterranean Green
Alga Enteromorpha spp. Journal of Hazard-
ous Materials, 170: 1050-1055.
[34] Vilar, J.P., Botelho, M.S., Boaventura, R.A.R.
(2007). Methylene Blue Adsorption by Algal
Biomass Based Materials: Biosorbents char-
acterization and process behaviour. Journal
of Hazardous Materials, 147: 120–132.
[35] Vijayaraghavan, J., Pushpa, T.B., Basha,
S.J.S., Jegan, J., Pushpa, T.B., Basha, S.J.S.
(2015). Isotherm, Kinetics and Mechanistic
Studies of Methylene Blue Biosorption onto
Red Seaweed Gracilaria Corticata. Desalina-
tion and Water Treatment, 1-9.
[36] Nacera, Y., Aicha, B. (2006). Equilibrium and
Kinetic Modelling of Methylene Blue Biosorp-
tion by Pretreated Dead Streptomyces Rimo-
sus: Effect of temperature. Chemical Engi-
neering Journal, 119: 121-125.
[37] Cengiz, S., Cavas, L. (2008). Removal of Me-
thylene Blue by Invasive Marine Seaweed:
Caulerpa Racemosa var. Cylindracea. Biore-
source Technology, 99: 2357-2363.
Bulletin of Chemical Reaction Engineering & Catalysis, 12 (2), 2017, 272
Copyright © 2017, BCREC, ISSN 1978-2993
[38] Gong, R., Li, M., Yang, C., Sun, Y., Chen, J.
(2005). Removal of Cationic Dyes From Aque-
ous Solution by Adsorption on Peanut Hull.
Journal of Hazardous Materials B, 121: 247-
250.
[39] Pavan, F.A., Lima, E.C., Dias, S.L.P., Mazzo-
cato, A.C. (2008). Methylene Blue Biosorption
from aqueous Solutions by Yellow Passion
Fruit Waste. Journal of Hazardous Materials,
150: 703-712.
[40] Gouamid, M., Ouahrani, M.R., Bensaci, M.B.
(2013). Adsorption Equilibrium, Kinetics and
Thermodynamics of Methylene Blue From
Aqueous Solutions Using Date Palm Leaves.
Energy Procedia, 36: 898-907.
[41] Vadivelan, V., Kumar, K.V. (2005). Equilib-
rium, Kinetics, Mechanism, and Process De-
sign for The Sorption of Methylene Blue onto
Rice Husk. Journal of Colloid and Interface
Science, 286: 90-100.
[42] Bulut, Y., Aydin, H. (2006). A Kinetics and
Thermodynamics Study of Methylene Blue
Adsorption on Wheat Shells. Desalination,
194: 259-267.
[43] Wang, S., Boyjoo, Y., Choueib, A., Zhu, Z.H.
(2005). Removal of Dyes from Aqueous Solu-
tion Using Fly Ash and Red Mud. Water Re-
search, 39: 129-138.
Selected and Revised Papers from The 2nd International Seminar on Chemistry (ISoC 2016) (Surabaya, 26-27
July 2016) (http://chem.its.ac.id/isoc-2016/) after Peer-reviewed by Scientific Committee of ISoC 2016 and
Peer-Reviewers of BCREC journal