Mechanical properties of a self-assembling oligopeptide matrix
Upload
khangminh22Category
view
1download
0
i
Self-Assembling Peptides for Cartilage
Regeneration
Andres Barco
Submitted in accordance with the requirements for the degree of Doctor of Philosophy
The University of Leeds
School of Mechanical Engineering
September 2017

ii
The candidate confirms that the work submitted is his/her own and that
appropriate credit has been given where reference has been made to the work of
others.
This copy has been supplied on the understanding that it is copyright material and
that no quotation from the thesis may be published without proper
acknowledgement.
The right of Andres Barco to be identified as author of this work has been asserted by
her in accordance with the Copyright, Designs and Patents Act 1988
© 2017 The University of Leeds and Andres Barco

iii
Acknowledgements
It would only be right to start off by thanking one of the best supervisors a person could ask for, Eileen
Ingham. Your constant support, patience and guidance over the years has been admirable, even in
time of darkness. Without all your help I wouldn’t be who I am today and for that I have everything to
thank you for. I wish you well in the future and hope to keep in contact. I would also l ike to thank my
other supervisors and mentors: John Fisher for his witty engineering insights and al l the lovely
chocolate biscuits. Phil Davies for his constant support and guidance at the beginning of my project,
without you I think I would have given up. Hazel Fermor for always being there when I needed help
and being an excellent mentor. Your enthusiasm for science is truly inspirational and I feel very
privileged to have had the opportunity to work with you all – all the best for the future!
A big thank you to all my lab peers both in engineering, biology and chemistry for making my time
here enjoyable to work in. Particular thanks to Imran Asif, James Warren and Fiona Walker for their
infinite sources of wisdom, kindness, advice and laughs – you guys were always there to l isten to my
PhD stories and kept me sane! I would also l ike to thank the EPSRC for giving me the funding for this
excellent opportunity, without it, my growth and learning would have not been possible.
My time at Leeds would have not been the same without each and every one of my friends that I made
over the years. You helped me take a step back when I needed it the most and you enabled me to
cope with the hard times throughout the last 5 years and for that I will always be grateful – you are
too numerous to name but I’m sure you know who you are.
I would like to give a big special thanks to my family and friends back home. Mum, Auntie Lil ianna and
Uncle Jorge, we have been through a lot together in the past 6 months but your love, support and
encouragement is more than I could have ever wished for and I could have not done this without you
all! My sister, Carolina, for her constant nagging and entertainment, you’ve known how to cheer me
up when I’ve been down. To my cousin, Felipe, for his words of wisdom and always a person I could
come talk too when times got hard. Lastly to my dad, for all your help and encouragement throughout
the years.
Start by doing what’s necessary, then do what’s possible and suddenly
you are doing the impossible.

iv
Abstract
Loss of glycosaminoglycans (GAGs) in osteoarthritic (OA) cartilage contributes to a decrease
in mechanical properties and function in vitro, and is considered to be a major contributor to
disease progression. The aims of this investigation were to test the hypothesis that a
combination of self-assembling peptides (SAPs) and chondroitin sulfate (glycosaminoglycan;
GAG) would restore the biomechanical properties of GAG depleted porcine condylar
cartilage, ideally to a level intrinsic to native porcine condylar cartilage.
The SAPs investigated were members of the P11 series which have been designed to
spontaneously self-assemble into three-dimensional fibrilar hydrogels, in response to
physiological conditions. Initial studies were carried out to determine which of three
peptides (P11-4, P11-8 and P11-12) demonstrated high β-sheet percentage, long-woven fibrilar
networks and high stiffness; when mixed with chondroitin sulfate at two different GAG molar
ratios (1:16 and 1:64) in physiological conditions, using FTIR analysis, transmission electron
microscopy and rheology. The β-sheet percentage, dimensions of fibrils and stiffness were
dependent upon the peptide, GAG molar ratio and Na2+ salt concentration. P11-4 and P11-8:
GAG mixtures had high β-sheet percentage ranging from 50.6-91 % and 81.7-92 %,
respectively. Fibril lengths of the P11-4 and P11-8: GAG mixtures were in the range 498- 3518
nm and the elastic shear modulus (G’) ranged from 4,479-10,720 Pa and 7,722-26,854 Pa,
respectively. P11-4 and P11-8: GAG mixtures were selected for further investigation.
In order to produce a GAG depleted cartilage model, porcine femoral condylar cartilage was
subjected to three different methods of GAG depletion (1) coating the surface with
chondroitinase ABC (2) injecting chondroitinase ABC into the cartilage (3) washing the
condyles in sodium dodecyl sulfate (SDS). GAG depletion was successfully achieved following
two 24 hour washes in 0.1 % (w/v) SDS and buffer washes. Histological analysis of safranin O
stained sections revealed an absence of GAGs. Quantification of GAGs using the
dimethylemethylene blue assay revealed that 75 % of GAGs had been removed.
In order to assess the effects of peptide: GAG mixtures on the biomechanical properties of
the GAG depleted porcine condylar cartilage a biomechanical test method was developed. A
series of indentation tests using different loads, followed by finite element analysis of the
data were performed on native and GAG depleted porcine condylar cartilage ; to identify a
suitable load for detection of a significant difference in the deformation, equilibrium elastic
modulus and permeability between the native and GAG depleted porcine condylar cartilages.
A load of 0.31 N was identified as the most appropriate.

v
GAG depleted porcine condylar cartilage was injected with P11-4 and P11-8 alone, P11-4 and
P11-8 : GAG mixtures at a molar ratio of 1:64 and chondroitin sulfate alone. The average
percentage deformation of the medial condylar cartilage samples injected with P11-4 alone
and P11-4: GAG mixture was 15.5 % and 8.7 % and for P11-8 alone and P11-8: GAG mixture was
11.4 % and 9.1 % respectively; compared to 6.3 % for the native cartilage and 12.6 % for the
GAG depleted cartilage. The average equilibrium elastic modulus of the medial cartilage
samples injected with P11-4 alone and P11-4: GAG mixture was 0.16 MPa and 0.43 MPa and
for P11-8 alone and P11-8: GAG, 0.23 MPa and 0.35 MPa, respectively; compared to 0.49 MPa
for the native cartilage and 0.21 MPa for the GAG depleted cartilage. Statistical analysis
(ANOVA) showed that a mixture of P11-4: GAG, but not P11-8: GAG restored both the
percentage deformation and equilibrium elastic modulus of the GAG depleted cartilage to
levels that were not significantly different to the native cartilage.
This study has shown that the use of P11-4 in combination with chondroitin sulfate has future
potential for development as a minimally invasive treatment for early stage osteoarthritis.
vi
Table of Contents
Acknowledgements...................................................................................................... iii
Abstract ........................................................................................................................iv
Table of Contents ..........................................................................................................vi
List of Figures................................................................................................................xi
List of Tables ............................................................................................................... xvi
List of Abbreviations ................................................................................................. xviii
Chapter 1 Literature Review and Research Goals ............................................................1
1.1 Introduction .................................................................................................1
1.2 The Anatomy of Hyaline Articular Cartilage ....................................................2
1.2.1 Composition and Structure of Cartilage.................................................2
1.2.2 Microstructure of Cartilage ..................................................................2
1.2.3 Macrostructure of Cartilage .................................................................7
1.2.4 Function of Cartilage............................................................................8
1.2.5 Lubrication Mechanisms of Cartilage .................................................. 11
1.2.6 Wear of articular cartilage.................................................................. 14
1.3 Osteoarthritis ............................................................................................. 16
1.3.1 Introduction ...................................................................................... 16
1.3.2 Pathophysiology of Osteoarthritis....................................................... 16
1.3.3 Relevance of OA Models .................................................................... 18
1.3.4 Structural and histological signs of OA ................................................ 21
1.3.5 Biochemical and biomechanical changes of OA cartilage ...................... 23
1.4 Cartilage Treatments and Research ............................................................. 30
1.4.1 Early Intervention for Cartilage Defects............................................... 30
1.4.2 Surgical Procedures for Cartilage Repair.............................................. 31
1.4.3 In Vitro Tissue Engineering of Cartilage ............................................... 39
1.5 Introduction to Peptides ............................................................................. 50
1.6 Introduction into self-assembling peptides (SAPs) ........................................ 51
1.6.1 Self-assembly mechanism .................................................................. 51
1.6.2 Uses of self-assembling peptides in tissue engineering......................... 53
1.7 Rationale.................................................................................................... 56
1.8 Aim and Objectives ..................................................................................... 57
1.8.1 Objectives ......................................................................................... 57
Chapter 2 Materials and Methods ................................................................................ 58
2.1 Materials.................................................................................................... 58

vii
2.1.1 Equipment ........................................................................................ 58
2.1.2 Chemicals.......................................................................................... 59
2.1.3 Peptides............................................................................................ 60
2.1.4 Glycosaminoglycan (GAG; chondroitin sulfate) .................................... 61
2.1.5 Software ........................................................................................... 61
2.2 Methods .................................................................................................... 61
2.2.1 General Methods............................................................................... 61
2.2.2 Cartilage Tissue acquisition ................................................................ 63
2.2.3 Histological techniques ...................................................................... 67
2.2.4 Histological staining methods ............................................................. 69
2.2.5 Biochemical Methods ........................................................................ 70
2.2.6 Biomechanical Methods..................................................................... 71
2.2.7 Statistical analysis.............................................................................. 79
Chapter 3 The effect of GAG molar ratio and Na+ ion concentration in two different
salt solutions on the biochemical, morphological and biomechanical properties
of peptides: P11-4, P11-8 and P11-12....................................................................... 80
3.1 Introduction ............................................................................................... 80
3.2 Aims and objectives .................................................................................... 82
3.3 Methods .................................................................................................... 82
3.3.1 Dissolution of peptides, peptide: GAG mixtures and Na+ salt
solutions. .......................................................................................... 82
3.3.2 Measurement and adjustment of pH .................................................. 84
3.3.3 Fourier Transform Infra-Red Spectroscopy (FTIR)................................. 84
3.3.4 Transmission Electron Microscopy (TEM) ............................................ 88
3.3.5 Rheology ........................................................................................... 90
3.3.6 Statistical analysis.............................................................................. 95
3.4 Results ....................................................................................................... 96
3.4.1 Self-assembly of peptides and peptide-GAG mixtures at varying molar ratios in the presence of two different physiological Na+ salt
solutions with varying Na+ ion concentrations. .................................... 96
3.4.2 Morphology of peptides and peptide-GAG mixtures at varying molar ratios in the presence of two different physiological Na+ salt
solutions with varying Na+ ion concentrations. .................................... 98
3.4.3 Determination of elastic and viscous shear moduli of peptides and peptide-GAG mixtures at varying molar ratios in the presence of two
different physiological Na+ salt solutions with varying Na+ ion
concentrations using Rheology ......................................................... 107

viii
3.4.4 Summary of the effect of GAG molar ratio and Na+ salt solution on the elastic shear modulus (G’) of the peptide and PEP: GAG
mixtures.......................................................................................... 117
3.5 Discussion ................................................................................................ 117
Chapter 4 Development of GAG depleted cartilage models ......................................... 126
4.1 Introduction ............................................................................................. 126
4.2 Aims and objectives .................................................................................. 126
4.2.1 Objectives ....................................................................................... 126
4.3 Experimental Methods.............................................................................. 127
4.3.1 Acquisition of porcine femoral condyles............................................ 127
4.3.2 Treatment of porcine femoral cartilage with chondroitinase ABC. ...... 127
4.3.3 SDS and PBS washes of porcine condylar cartilage – Model 3 ............. 130
4.3.4 Histological Characterisation ............................................................ 131
4.3.5 GAG Quantification.......................................................................... 132
4.3.6 SDS Quantification in GAG depleted cartilage (Model 3) .................... 132
4.4 Results ..................................................................................................... 133
4.4.1 Evaluation of native and GAG depleted porcine femoral condyles ...... 133
4.4.2 GAG quantification of native and GAG depleted porcine femoral
cartilage .......................................................................................... 144
4.5 Discussion ................................................................................................ 146
4.6 Conclusion ............................................................................................... 148
Chapter 5 Development of methods for the determination of the biomechanical
properties of native and GAG depleted cartilage. ............................................... 149
5.1 Introduction ............................................................................................. 149
5.2 Aims and objectives .................................................................................. 151
5.2.1 Objectives ....................................................................................... 151
5.3 Experimental methods .............................................................................. 151
5.3.1 Acquisition of porcine femoral condyles............................................ 151
5.3.2 GAG depletion of porcine femoral condylar cartilage ......................... 151
5.3.3 Biomechanical characterisation of porcine femoral cartilage .............. 151
5.4 Results ..................................................................................................... 153
5.4.1 Cartilage thickness measurements.................................................... 153
5.4.2 Percentage deformation .................................................................. 154
5.4.3 Equilibrium elastic modulus and permeability ................................... 158
5.5 Discussion ................................................................................................ 161
5.6 Conclusion ............................................................................................... 165

ix
Chapter 6 Investigation of the effects of injection of peptide-GAG mixtures to GAG
depleted cartilage. ............................................................................................ 167
6.1 Introduction ............................................................................................. 167
6.2 Aims and objectives .................................................................................. 168
6.2.1 Objectives ....................................................................................... 168
6.3 Experimental Design ................................................................................. 168
6.4 Experimental Methods.............................................................................. 169
6.4.1 Acquisition of porcine femoral condyles............................................ 169
6.4.2 GAG depletion of porcine femoral condylar cartilage ......................... 169
6.4.3 Preparation of peptides, peptide: GAG mixtures and chondroitin
sulfate GAG control. ........................................................................ 169
6.4.4 Injection of peptides, PEP: GAG mixtures and chondroitin sulfate
(GAG) into GAG depleted porcine condylar cartilage. ......................... 171
6.4.5 Biomechanical characterisation of porcine femoral condylar
cartilage .......................................................................................... 172
6.4.6 Determination of self-assembly of peptides and PEP: GAG mixtures
in situ in GAG depleted porcine condylar cartilage. ............................ 173
6.5 Results ..................................................................................................... 175
6.5.1 Preliminary study to determine the effects of injecting water and just a needle (without water) on the deformation properties of
native condylar cartilage. ................................................................. 175
6.5.2 The effects of injecting P11-4 and P11-8 alone and in combination with GAG, at a molar ratio of 1:64 on the deformation properties of
GAG depleted porcine condylar cartilage. ......................................... 181
6.5.3 Equilibrium elastic modulus and permeability ................................... 189
6.5.4 Summary of the effects of injecting GAG-depleted porcine medial
condylar cartilage with peptides and PEP: GAG mixtures on the
percentage deformation, elastic modulus and permeability values
for all groups tested......................................................................... 192
6.5.5 Fluorescence recovery after photobleaching (FRAP) analysis to
determine self-assembly of injected fluorescein-doped P11-4 and P11-8 and fluorescein-doped PEP: GAG mixtures in GAG depleted
condylar cartilage. ........................................................................... 192
6.6 Discussion ................................................................................................ 201
6.7 Conclusion ............................................................................................... 207
Chapter 7 Conclusions and Future Studies................................................................... 208
7.1 Major conclusions..................................................................................... 208
7.2 Future studies .......................................................................................... 211
7.2.1 Histological and GAG quantification of PEP: GAG treated cartilage. .... 211

x
7.2.2 Testing of mild and moderate GAG depleted porcine cartilage
models. ........................................................................................... 211
7.2.3 Testing of higher GAG molar ratio of PEP: GAG mixtures – 1:16 .......... 211
7.2.4 Development of friction test to study the bio-tribological properties
of the PEP: GAG mixtures. ................................................................ 212
7.2.5 Use of natural whole joint GAG depleted models in knee simulator
to investigate the effects of PEP: GAG mixtures on function. .............. 212
7.2.6 Leakage study to the asses the stability of the PEP: GAG gel over a
prolonged time period. .................................................................... 213
7.3 Potential for Clinical Translation ................................................................ 213
7.3.1 Arthroscopic delivery system............................................................ 214
7.3.2 Pre-clinical studies in animal models of osteoarthritis. ....................... 214
7.4 Significance of the study ........................................................................... 214
References................................................................................................................. 215

xi
List of Figures Figure 1: Collagen triple helix with arrangement of amino acids within each
procollagen alpha chain ........................................................................................3 Figure 2: The intracellular and extracellular events in the formation of a collagen
fibril......................................................................................................................4 Figure 3: (Left) Schematic of ECM of articular cartilage (Barnes Baili, 2011), (Right)
Proteoglycan aggrecan monomer molecule. Adapted from: ...................................5 Figure 4: Stratified structure of cartilage demonstrating zonal arrangement. Adapted
from: ....................................................................................................................8 Figure 5: Stress-strain curve for articular cartilage under uniaxial constant strain rate
loading .................................................................................................................9 Figure 6: Friction coefficient plotted as a function of fluid viscosity and shear velocity
divided by the load (Stribeck Curve) with the correspodning film thickness for boundary, mixed and hydrodynamic lubrication mechanisms .............................. 12
Figure 7: Histological images of healthy and osteoarthritic cartilage. ............................. 21 Figure 8: Severe OA, Safranin O/fast green staining. (A) Human, (B) and (C) rabbit. ....... 22 Figure 9: Involvement of synovium in OA pathophysiology............................................ 23 Figure 10: The role of mechanical loading in osteoarthritis. ........................................... 28 Figure 11: Autologous chondrocyte implantation procedure using tibial periostuem
for cartilage repair .............................................................................................. 34 Figure 12: Diagrammatic representation of the collagen I/III membrane showing
rough and smooth side........................................................................................ 36 Figure 13: Chondrocyte-Seeded Type I/III collagen membrane for autologous
chondrocyte transplantation. .............................................................................. 37 Figure 14: Complications after ACI (diagnosed by clinical exam, MRI, and
arthroscopy). Adapted from: ............................................................................... 38 Figure 15: Hyalograft-C scaffold displayed as a commercialised product (left), MTT
assay showing the encapsulated chondrocytes in an Injectable chitosan-based hydrogel for cartilage tissue engineering ............................................................. 43
Figure 16: The three-dimensional poly(lactic-glycolic acid) (3D-PLGA) scaffold. .............. 47 Figure 17: Hierarchical self-assembly of chiral rod like units. ......................................... 53 Figure 18: Schematic of self-assembly curve for both nucleated self-assembly & non-
nucleated self-assembly of peptides. ................................................................... 53 Figure 19: One subunit of Chondroitin-6-sulfate............................................................ 62 Figure 20: Dissection equipment................................................................................... 64 Figure 21: Dissection of porcine knee joints. ................................................................. 65 Figure 22: Extraction of osteochondral pins. ................................................................. 66 Figure 23: Extraction of Medial and Lateral condyles. .................................................... 67 Figure 24: Orientation of cartilage tissue for histology. ................................................. 68 Figure 25: Indentation apparatus.................................................................................. 72 Figure 26: Cross-sectional view of the cup holder, showing how the condyle was
orientated inside the cup holder and outlining rough distances and heights of relative components. .......................................................................................... 72
Figure 27: Medial Porcine condylar cartilage cemented in PMMA.................................. 74 Figure 28: LVDT calibration. .......................................................................................... 74 Figure 29: Load cell calibration. .................................................................................... 75 Figure 30: Picture of Instron testing equipment. ........................................................... 75 Figure 31: Needle indentation graph interpretation. ..................................................... 76 Figure 32: Finite element model of cartilage. ................................................................ 77 Figure 33: Experimental and modelled cartilage displacement curves. ........................... 78

xii
Figure 34: Equilibrium elastic modulus and permeability of healthy native medial condylar cartilage under a load of 0.31 N (Blue – Healthy condylar cartilage with the ‘no fluid flow’ boundary condition; Red – Healthy condylar cartilage with the ‘fluid flow’ boundary condition)............................................................. 78
Figure 35: TEM images of P11-8 fibrils, illustrating how the fibril lengths, widths (long and short) and twist pitch was calculated. ........................................................... 89
Figure 36: Schematic of a rotational rheometer. ........................................................... 90 Figure 37: Example of phase angle and its relationship to viscous and elastic
materials. ........................................................................................................... 91 Figure 38: Loss, complex and elastic modulus................................................................ 91 Figure 39: Graph demonstrating the Linear Viscoelastic Region. .................................... 92 Figure 40: General material behaviour in terms of storage and viscous modulus and
phase angle. ....................................................................................................... 92 Figure 41: Example amplitude sweep run at 1Hz and 20Hz showing both the elastic
and viscous shear modulus.................................................................................. 95 Figure 42: Fitted IR amide I’ band of P11-4, P11-8 and P11-12 at 10 mg.ml-1 in the
presence of 130 mM (A, C and E) and 230 mM (B, D and F) Na+ salt solution with and without varying chondroitin sulfate molar ratios of 1:16 and 1:64. ......... 97
Figure 43: Morphology of the P11-4 peptide in the presence of two Na+ salt solutions at varying chondroitin sulfate molar ratios (1:16 and 1:64) by TEM. ..................... 98
Figure 44: Morphology of the P11-8 peptide in the presence of two Na+ salt solutions at varying chondroitin sulfate molar ratios (1:16 and 1:64) by TEM. ..................... 99
Figure 45: Morphology of the P11-12 peptide in the presence of two Na+ salt solutions at varying chondroitin sulfate molar ratios (1:16 and 1:64) by TEM. ..................... 99
Figure 46: Images of (a) P11-4. P11-8 and P11-12 in the 130 mM Na+ salt solution at pH 7.4 (b) P11-4. P11-8 and P11-12 in the 230 mM Na+ salt solution at pH 7.4. ............. 100
Figure 47: Widths of fibrils of all peptides in two different Na+ salt solutions at pH 7.4 at varying molar ratios of GAG. ......................................................................... 106
Figure 48: Lengths of fibrils of all peptides in two different Na+ salt solutions at pH 7.4 at varying molar ratios of GAG. .................................................................... 106
Figure 49: P11-4, P11-8 and P11-12 self-supporting gels at 10 mg.ml-1 in 130 mM and 230 mM Na+ salt solutions. ................................................................................ 107
Figure 50: The amplitude sweeps (elastic and viscous modulus vs. shear strain) of P11- 4, P11- 8 and P11- 12 at 10 mg.ml-1 in 130 mM and 230 mM Na+ salt solutions. ..... 108
Figure 51: The effect of varying the Na+ ion concentration (130 mM or 230 mM) on the mechanical stiffness of the P11-4, P11-8 and P11-12 gels, Strain 0.1 % and temperature 37oC ............................................................................................. 109
Figure 52: P11-4, P11-8 and P11-12 self-supporting gels at 10 mg.ml-1 at two different GAG molar ratios (1:64 & 1:16) in 130 mM and 230 mM Na+ salt solutions. ......... 111
Figure 53: The amplitude sweeps (elastic and viscous modulus vs. shear strain) of P11- 4, P11- 8 and P11- 12: GAG mixtures at 10 mg.ml-1 in 130 mM and 230 mM Na+ salt solutions. ................................................................................................... 113
Figure 54: The effect of varying the Na+ ion concentration (130 mM or 230 mM) and GAG molar ratio (1:16 and 1:64) on the mechanical stiffness of the P11-4, P11-8 and P11-12: GAG mixtures. ................................................................................. 114
Figure 55: Varying concentrations of chondroitin sulfate (4.85 mg.ml -1 and 22.1 mg.ml-1) in 130 mM & 230 mM Na+ salt solutions. .............................................. 115
Figure 56: Amplitude sweep: Elastic and viscous modulus vs. shear strain of chondroitin sulfate in both the 130 mM and 230 mM Na+ salt solutions at concentrations of 4.85 and 22.1 mg.ml-1. ........................................................... 116

xiii
Figure 57: Frequency sweep: Elastic and viscous modulus vs. frequency of chondroitin sulfate in both the 130 mM and 230 mM Na+ salt solutions at a concentration of 4.85 and 22.1 mg.ml-1.............................................................. 116
Figure 58: Self-assembly behaviour of P11-4, P11-8 and P11-12 in 130 mM Na+ salt solution with no other salts. .............................................................................. 119
Figure 59: Amino acid residues: a) Glutamine residue b) Serine residue. ...................... 120 Figure 60: Sterile condyles showing the area of interest marked out in permanent
marker, Case ABC gel was applied to this area to allow the depletion of GAGs.... 129 Figure 61: Porcine femoral condyle showing the area of interest marked out in
permanent marker. ........................................................................................... 130 Figure 62: Safranin O stained sections of GAG depleted porcine condylar cartilage
treated with an agarose gel containing CaseABC and antibiotic/aprotinin solution (model 1) and a porcine condylar cartilage treated with an agarose gel containing only antibiotic/aprotinin solution (control). ...................................... 135
Figure 63: GAG content of cartilage from GAG depleted porcine condylar cartilage in model 1 compared to the control sample and untreated native porcine condylar cartilage. ............................................................................................ 136
Figure 64: Safranin O stained sections of GAG depleted porcine condylar cartilage treated with injections of CaseABC containing antibiotic/aprotinin solution (model 2) and porcine condylar cartilage treated with injections of antibiotic/ aprotinin solution alone (control). ..................................................................... 138
Figure 65: GAG content of cartilage from GAG depleted porcine condylar cartilage in models 2 compared to the control sample and untreated native porcine condylar cartilage. ............................................................................................ 139
Figure 66: Safranin O stained sections of GAG depleted porcine condylar cartilage and untreated native porcine condylar cartilage control from model 3. .............. 141
Figure 67: Safranin O stained sections of GAG depleted porcine condylar cartilage and untreated native porcine condylar cartilage control from model 3. .............. 142
Figure 68: GAG content of cartilage from GAG depleted porcine cartilage in model 3.......................................................................................................................... 143
Figure 69: SDS concentration (ug.ml-1) after given SDS and PBS washes in model 3, method 4. ......................................................................................................... 143
Figure 70: GAG content of cartilage from GAG depleted porcine cartilage in Models 1 - 3 vs. native porcine cartilage. ....................................................................... 145
Figure 71: Low Load (0.11 N) - Cartilage thickness measurement for native and GAG depleted cartilage (n=5). ................................................................................... 153
Figure 72: Medium Load (0.31 N) - Cartilage thickness measurement for native and GAG depleted cartilage (n=6)............................................................................. 153
Figure 73: High Load (0.51 N) - Cartilage thickness measurement for native and GAG depleted cartilage (n=3). ................................................................................... 153
Figure 74: Percentage deformation of native and GAG depleted cartilage over the duration of 1 hour with a load of 0.11 N: (A) Medial condyle (B) Lateral condyle.......................................................................................................................... 154
Figure 75: Final percentage deformation of native and GAG depleted cartilage at 1 hour with a load of 0.11 N. ................................................................................ 154
Figure 76: Percentage deformation of native and GAG depleted cartilage over the duration of 1 hour with a load of 0.31 N: (A) Medial condyle (B) Lateral condyle.......................................................................................................................... 155
Figure 77: Final percentage deformation of native and GAG depleted cartilage at 1 hour with a load of 0.31 N. ................................................................................ 156

xiv
Figure 78: Percentage deformation of native and GAG depleted cartilage over the duration of 1 hour with a load of 0.51 N: (A) Medial condyle (B) Lateral condyle.......................................................................................................................... 157
Figure 79: Final percentage deformation of native and GAG depleted cartilage at 1 hour with a load of 0.51 N. ................................................................................ 157
Figure 80: Representative graphs of indentation characteristics obtained experimentally and through FEA model curve fitting of a medial porcine condyle under a load of 0.31 N. ......................................................................... 159
Figure 81: Equilibrium elastic modulus and permeability of native and GAG depleted medial condylar cartilage under a load of 0.11 N. ............................................... 159
Figure 82: Equilibrium elastic modulus and permeability of native and GAG depleted medial condylar cartilage under a load of 0.31 N. ............................................... 160
Figure 83: Equilibrium elastic modulus and permeability of native and GAG depleted medial condylar cartilage under a load of 0.51 N. ............................................... 160
Figure 84: Hydrated monomeric peptide being drawn up into a 1 ml syringe, ready for injection into the GAG depleted porcine condylar cartilage........................... 171
Figure 85: Schematic showing (A) the identification of the flattest region of interest (ROI) of the GAG depleted porcine condylar cartilage. ....................................... 172
Figure 86: Diffusion profiles for the intensity of fluorescein over a period of time ....... 174 Figure 87: Cartilage thickness measurement of the medial condyles for the: native,
native water injected and native injected only groups (n=3 for all groups). ......... 175 Figure 88: Cartilage thickness measurement of the lateral condyles for the: native,
native water injected and native injected only groups (n=3 for all groups). ......... 176 Figure 89: Percentage deformation of medial condyles from: native, native water
injected and native injected only groups, over the duration of 1 hour with a load of 0.31 N. .................................................................................................. 177
Figure 90: Percentage deformation of lateral condyles from: native, native water injected and native injected only groups, over the duration of 1 hour with a load of 0.31 N. .................................................................................................. 178
Figure 91: Final percentage deformation at 1 hour of: native, native water injected and native injected only groups, for the medial and lateral condyles, with a load of 0.31 N. .................................................................................................. 179
Figure 92: Cartilage thickness measurement of the medial condyles for the: native, GAG depleted chondroitin sulfate (CS) injected only, GAG depleted, P11-4: GAG injected, P11-4 only injected, P11-8: GAG injected and P11-8 only injected groups (n=3 for all groups). ........................................................................................... 181
Figure 93: Cartilage thickness measurement of the lateral condyles for the: native, GAG depleted chondroitin sulfate (CS) injected only, GAG depleted, P11-4: GAG injected, P11-4 only injected, P11-8: GAG injected and P11-8 only injected groups (n=3 for all groups). ........................................................................................... 182
Figure 94: Percentage deformation of medial condyles from: native, GAG depleted chondroitin sulfate (CS) injected only, GAG depleted, P11-4: GAG injected, P11-4 only injected, P11-8: GAG injected, P11-8 only injected groups, over the duration of 1 hour with a load of 0.31 N. ........................................................... 183
Figure 95: Percentage deformation of lateral condyles from: native, GAG depleted chondroitin sulfate (CS) injected only, GAG depleted, P11-4: GAG injected, P11-4 only injected, P11-8: GAG injected, P11-8 only injected groups, over the duration of 1 hour with a load of 0.31 N. ........................................................... 184
Figure 96: Final percentage deformation at 1 hour of all groups: native, GAG depleted chondroitin sulfate (CS) injected only, GAG depleted, P11-4: GAG injected, P11-4 only injected, P11-8: GAG injected, P11-8 only injected, for the medial and lateral condyles, with a load of 0.31 N. .............................................................. 185

xv
Figure 97: Final percentage deformation at 1 hour of medial condyles from: native, GAG depleted, GAG depleted chondroitin sulfate (CS) injected only, P11-4: GAG injected, P11-4 only injected, P11-8: GAG injected, P11-8 only injected, with a load of 0.31 N. .................................................................................................. 186
Figure 98: Final percentage deformation at 1 hour of lateral condyles from: native, GAG depleted, GAG depleted chondroitin sulfate (CS) injected only, P11-4: GAG injected, P11-4 only injected, P11-8: GAG injected, P11-8 only injected, with a load of 0.31 N. .................................................................................................. 187
Figure 99: Representative graphs of indentation characteristics obtained experimentally and through FEA model curve fitting of a medial porcine condyle under a load of 0.31 N. ......................................................................... 190
Figure 100: Elastic modulus and permeability of GAG depleted porcine medial condylar cartilage injected with P11-4: GAG, P11-4 only, P11-8: GAG, P11-8 only and their corresponding native and GAG depleted condylar cartilage controls, under a load of 0.31 N. ...................................................................................... 191
Figure 101: Representative FRAP images of GAG depleted porcine condylar cartilage injected with fluorescein-tagged peptide-doped P11-4: GAG. .............................. 194
Figure 102: Representative FRAP images of porcine GAG depleted condylar cartilage injected with fluorescein-tagged peptide-doped P11-4 alone............................... 195
Figure 103: Representative FRAP images of porcine GAG depleted condylar cartilage injected with fluorescein-tagged peptide-doped P11-8: GAG. .............................. 197
Figure 104: Representative FRAP images of porcine GAG depleted condylar cartilage injected with fluorescein-tagged peptide-doped P11-8 only. ............................... 198
Figure 105: Representative FRAP images of porcine GAG depleted condylar cartilage injected with fluorescein-tagged chondroitin sulfate (CS). .................................. 199
Figure 106: Representative images of native porcine condylar cartilage viewed under a fluorescein filter and transmitted light. ........................................................... 200
Figure 107: Representative images of porcine GAG depleted condylar cartilage viewed under a fluorescein filter and transmitted light. ..................................... 201

xvi
List of Tables
Table 1: Different descriptions of the Kellgren and Lawrence (K&L) criteria of knee osteoarthritis (OA) adapted from Schiphof et al (Schiphof et al., 2008) and Arden et al (Arden and Nevitt, 2006). .................................................................. 20
Table 2: Clinical, histological and molecular signs of synovitis in OA. ............................. 25 Table 3: The different cell sources that have been investigated for use in tissue
engineering cartilage, along with the respective reasons for selecting them and their limitations for use. ...................................................................................... 40
Table 4: Current clinical products on the market with their associated clinical trials that have been completed or are in the process of completion. Adapted from: (Huang et al., 2016). ............................................................................................ 44
Table 5: Equipment used throughout the study............................................................. 58 Table 6: Chemicals and reagents used throughout the study. ........................................ 59 Table 7: Peptide primary structures, and their net charges at pH 7.4. Positively
charged residues are coloured blue, negatively charged residues are red. All peptides were amidated and acetylated. ............................................................. 60
Table 8: Masses (mg) of peptide and chondroitin sulfate (GAG) weighed out for the different molar ratios. Samples were made up to a total volume of 1 ml in two aqueous Na+ salt solutions, unless otherwise stated. ............................................ 63
Table 9: Dissection equipment used throughout the study. ........................................... 64 Table 10: Concentrations of different salts present in the two physiological salt
solutions. ............................................................................................................ 83 Table 11: Characteristic infrared bands of the peptide (Susi, 1972). ............................... 84 Table 12: Secondary structural assignments of amide I’ infrared bands.......................... 86 Table 13: Amino acid side chain absorptions in the amide I’ region for the P11
peptides studied by FTIR spectroscopy. ............................................................... 87 Table 14: Masses of peptide and CS weighed out for the different molar ratios.
Samples were made up to a total volume of 4ml in two aqueous Na+ salt solutions. ............................................................................................................ 93
Table 15: Average widths and twist pitch of the P11-4 fibrils in different Na+ salt solutions and GAG molar ratios. ........................................................................ 101
Table 16: Average lengths of the P11-4 fibrils in different Na+ salt solutions and GAG molar ratios. ..................................................................................................... 101
Table 17: Average widths and twist pitch of the P11-8 fibrils in different Na+ salt solutions and GAG molar ratios. ........................................................................ 102
Table 18: Average lengths of the P11-8 fibrils in different Na+ salt solutions and GAG molar ratios. ..................................................................................................... 102
Table 19: Average widths and twist pitch of the P11-12 fibrils in different Na+ salt solutions and GAG molar ratios. ........................................................................ 103
Table 20: Average lengths of the P11-12 fibrils in different Na+ salt solutions and GAG molar ratios. ..................................................................................................... 103
Table 21: Two-way analysis of variance to determine the effect of GAG molar ratio and Na+ ion concentration had on the length of the P11- 4 fibrils. ........................ 104
Table 22: Two-way analysis of variance to determine the effect of GAG molar ratio and Na+ ion concentration had on the length of the P11- 8 fibrils. ........................ 104
Table 23: Two-way analysis of variance to determine the effect of GAG molar ratio and Na+ ion concentration had on the length of the P11- 12 fibrils. ...................... 104
Table 24: Two-way analysis of variance to determine the effect of GAG molar ratio and Na+ ion concentration had on the width of the P11- 4 fibrils.......................... 105

xvii
Table 25: Two-way analysis of variance to determine the effect of GAG molar ratio and Na+ ion concentration had on the width of the P11- 8 fibrils.......................... 105
Table 26: Two-way analysis of variance to determine the effect of GAG molar ratio and Na+ ion concentration had on the width of the P11- 12 fibrils. ....................... 105
Table 27: Summary table of the elastic shear modulus (G’) of the peptides alone and the PEP: GAG mixtures at 1 Hz. .......................................................................... 117
Table 28: Masses of peptide and chondroitin sulfate (GAG) weighed out for the different injection experiments. ........................................................................ 170
Table 29: Summary table of the percentage deformation, elastic modulus and permeability and the difference between the GAG depleted medial porcine condylar cartilage sample injected with P11-4: GAG, P11-4 only, P11-8: GAG and P11-8 only and the native and GAG depleted medial porcine condylar cartilage.......................................................................................................................... 192

xviii
List of Abbreviations
AC Articular cartilage ACI Autologous chondrocyte implantation
ADAMTS A disintegrin and metalloprotease with thrombospondin motifs AFM Atomic force microscopy
ANOVA Analysis of variances BMPs Bone morphogenetic proteins
BSA Bovine serum albumin CACI Collagen autologous chondrocyte implantation CaCl2 Calcium Chloride CaF2 Calcium flouride
CaseABC Chondroitinase ABC CL Confidence level CS Chondroitin sulfate
D2O Deuterium oxide DCELL Decullularisation
DCl Deuterium chloride DMB 1,9-dimethylemethylene blue ECM Extracellular matrix
EDTA Ethylenediaminetetraacetic acid ER Endoplasmic reticulum
FEA Finite element analysis FRAP Fluorescence recovery after photobleaching FTIR Fourier transform infrared spectrometer
g Grams GAG Glycosaminoglycan
GF Growth factors GLY Glycine HA Hyaluronic Acid
HBSS Hank’s balanced salt solution HCl Hydrochloric acid
HYP Hydroxyproline ICRS International cartilage repair system IGF Insulin growth factor
IKDC International knee documentation committee IL Interleukin IR Infrared
KCL Potassium chloride KOOS Knee injury and osteoarthritis outcome score
KS Keratan sulfate LVDT Linear variable differential transformer MACI Matrix associated chondrocyte implantation
Mag Magnification ml Millilitre
mm Millimetres mM Millimolar
MMPs Matrix metalloproteases MOCART Magnetic resonance observation of cartilage repair tissue
MPa Megapascals MR Molar ratio
xix
MRI Magnetic resonance imaging MSCs Mesenchymal stem cells
N Newtons NaCl Sodium Chloride
NaHCO3 Sodium hydrocarbonate NaOD Sodium deuteroxide NaOH Sodium Hydroxide
Nm Nanometres NS Not significant difference
NSAIDs Non-steroidal anti-inflammatory drugs OA Osteoarthritis Pa Pascals
PACI Periosteum autologous chondrocyte implantation PBS Phosphate Buffered Saline PBT Poly butyleneterephtalate PCL Poly-caprolactone
PCM Pericellular matrix PEG Polyethylene glycol
PEOT Poly ethylene oxide-terephtalate PEP: GAG Peptide-glycosaminoglycan
PG Proteoglcan PGA Poly-glycolic acid PGS Poly glycerol-co-sebacate PLA Poly-lactic acid
PLGA Poly lactic-glycolic acid PMMA Polymethylmethacrylate
POC Poly octanedoil-co-citrate PRO Proline
RA Rheumatoid arthritis ROI Region of interest
ROM Range of motion SA Self-assembly
SAL Surface amorphous layer SAPL Surface active phospholipids SAPs Self-assembling peptides
SDS Sodium dodecyl sulfate SS Salt solution ST Stromelysin
SZP Superficial zonal proteins TEM Transmission electron microscopy TFA Trifluoroacetic acid TGF Transforming growth factor TJR Total joint replacement
TNF Tumour necrosis factor UV Ultra violet
µl Microlitre µM Micromiliter
VAS Visual analogue scale VEGF Vascular endothelial growth factor
WOMAC Western ontario and McMaster universities osteoarthritis index

1
Chapter 1 Literature Review and Research Goals
1.1 Introduction
Healthy articular cartilage in the knee has unique properties, allowing it to withstand high
compressive, shear and tensile forces that the human body exerts upon it during normal gait
or other activities such as running or climbing stairs (Mouw et al., 2005). Articular cartilage
is a special type of hyaline cartilage that provides a low friction and wear resistant tissue at
the articulating surfaces of bone. This is facilitated by distributing the applied load over a
greater surface area which leads to a smooth interaction between the two opposing surfaces
(Buckwalter et al., 2005). Unfortunately, articular cartilage is frequently injured in incidences
which usually involve sport or trauma from motorized accidents; however it may also
degenerate with increasing age (Groh and Herrera, 2009). Due to its avascular nature, the
damaged cartilage has a poor propensity to self-repair (Farquhar et al., 1996; Buckwalter et
al., 2005).
Cartilage damage and degeneration significantly affects an individual’s quality of life. Pain
and dysfunction of normal movements are symptoms of cartilage damage, frequently seen
in the aging population, which can be attributed to arthritis. Arthritis, defined simply means
joint inflammation, however there are two main types of arthritis that affect individuals;
osteoarthritis (OA) and rheumatoid arthritis (RA) (Jackson et al., 2001). Osteoarthritis is a
degenerative joint disease caused by the degradation of articular cartilage in the joints and
rheumatoid arthritis is a chronic inflammatory autoimmune disease with a genetic
predisposition. Articular cartilage loss causes proximal bones to rub, leading to pain,
discomfort, swelling and limitation in movement. It is estimated that 8.75 million people in
the UK suffer from OA (Arthritis Research UK, 2013). Currently there are many ways in which
these problems can be overcome and/or managed, however there are limitations to all
approaches.
Research is currently focused on development of more advanced methods of cartilage repair,
such as autologous chondrocyte implantation (ACI) or the use of biomaterials for tissue
engineering of articular cartilage using scaffolds and/or hydrogels. A fundamental knowledge
of healthy and degenerated cartilage tissue anatomy, physiology, biomechanical and
tribological function is of upmost importance to comprehend cartilage disease and develop
novel therapies, for the early intervention in OA.

2
1.2 The Anatomy of Hyaline Articular Cartilage
Hyaline articular cartilage is the most important structure in synovial joints (e.g. knee and hip
joints). It protects the two articulating surfaces from abrasion by allowing smooth movement
of the surfaces against each other whilst distributing load evenly (Buckwalter et al., 2005).
Articular cartilage is a flexible and tough tissue consisting of chondrocytes (cartilage cells),
which are distributed amongst an interlaced network of collagen fibrils and proteoglycans
within the extracellular matrix (ECM) (Buckwalter et al., 2005). The work within this thesis is
concerned with articular cartilage, therefore the words ‘cartilage’, ‘cartilage tissue’ etc.
refers to articular cartilage (AC), unless otherwise stated.
1.2.1 Composition and Structure of Cartilage
The main component of cartilage is the ECM which accounts for 95% of the total cartilage
dry weight; the remaining 5% is constituted by the cellular component of cartilage. The
cellular component consists of chondrocytes, which are the functional element of the ECM
(Anderson et al., 1964). The ECM of hyaline cartilage is 70% fluid (water), the remainder is
made up of organic collagen molecules (15%), mainly type II collagen, 10% proteoglycans
(aggrecan) and 5% glycoproteins (Poole et al., 1982).
The structure of AC can be divided into two hierarchical levels; the micro-scale and the
macro-scale. These two scales of viewing the structure of cartilage are of great importance
in determining the biomechanical properties of the tissue.
1.2.2 Microstructure of Cartilage
1.2.2.1 Collagen
1.2.2.1.1 Structure of Collagen
Collagen is the major ECM protein. It makes up ~15% of the cartilage ECM. In the body there
are 19 types of collagen, however AC is predominantly composed of type II collagen; with
smaller amounts of types V, VI, IX, X and XI (Athanasiou et al., 2009; Mow and Ateshian,
1997). All collagens are composed of 3 procollagen alpha chains, coiled around each other to
form a triple helix configuration. These polypeptide chains contain approximately ~1000
amino acid residues. The constituent procollagen chains are numbered using Arabic
numerals followed by the collagen type with roman numerals in parentheses. For example:
Type I procollagen is made up of two pro-α-1 (I) and one pro-α-2 (I), therefore it is a
heterotrimer (Cremer et al., 1998). Whereas type II procollagen is assembled of three pro-α-
1 (II) chains and is therefore a homotrimer. The individual procollagen alpha chains are each

3
shaped into a left-handed helix and then all three of the chains coil together to form a right-
handed triple helix (Steplewski et al., 2007). The amino acids in the collagen peptide chains
are primarily glycine, proline, hydroxyproline, lysine and hydroxylysine. These amino acids
are arranged in the following tripeptide sequence: Gly-X-Y, where glycine is repeated every
third residue, X is most commonly a proline residue and Y is frequently a hydroxyproline or
hydroxylysine residue. This repeat region is encompassed by short unorganised telometric
regions (the globular amino terminal and carboxyl terminal), which are prone to proteolytic
attack by procollagen peptidase/ procollagen aminoproteinase/ procollagen
carboxyproteinase. The cleavage of these terminal peptides allows the spontaneous
formation of collagen fibrils (Steplewski et al., 2007).
Figure 1: Collagen triple helix with arrangement of amino acids within each procollagen alpha chain. Adapted from: (The collagen molecule: Collagen structure, 2014).
1.2.2.1.2 Synthesis of Collagen
In cartilage, collagen synthesis occurs within chondrocytes. The individual helices gather in
the lumen of the endoplasmic reticulum (ER) to form procollagen (Figure 2, (1)). Various
proline and lysine amino acids are hydroxylated here and the addition of glucose and
galactose to the hydroxylysine residues also occurs (Figure 2, (2,3)). The middle portion of
the procollagen chain associates with other molecules to form the triple helix and the
propeptide extensions prevent premature assembly of collagen within the ER (Figure 2,
(4,5)). Exocytosis of procollagen from the plasma membrane via a secretory vesicle is
followed by the cleavage of the globular amino (N-terminal) and carboxyl terminals (C-
terminal) via selective proteolysis (Figure 2, (6,7)). The tropocollagen molecule formed then
undergoes spontaneous assembly to form collagen fibrils and in turn fibres, which are
stabilised by covalent cross-links (Figure 2, (8,9)) (Alberts et al., 2002).
Collagen Fibres
Amino acid chains
-chains Collagen Molecules
(triple helix)
Collagen Fibrils

4
Figure 2: The intracellular and extracellular events in the formation of a collagen fibril. (A) Collagen fibrils assemble in the extracellular space contained within a folding of the plasma membrane. They further assemble to larger collagen fibres which a stabilised by covalent
crosslinks. Adapted from: (Alberts et al., 1994).
1.2.2.1.3 Roles of different types of collagen
The most dominant form of collagen in the cartilage ECM is type II collagen (a homotrimer)
which constitutes ~80-85% of the total collagen content. Collagen XI and IX (both
heterotrimeric) are the second most common forms of collagen, consisting of ~3-10% each.
Collagen IX is known to have a slight kink mid-chain where chondroitin sulfate
glycosaminoglycans (GAGs) branches off (Steplewski et al., 2007). Collagen type XI is similar
to type II, in that it is a straight chain molecule; however, it contains an α-chain at the amino
terminal which projects out and forms a covalent cross link to the collagen type II molecule
in the fibre backbone at the hydroxylysine residue. Collagen X is also a straight chain specific
homotrimer. Although collagen X forms shorter chains than type II and XI, it forms multimeric
collagen fibrils.
The specific roles of all the types of collagen are not fully understood, however it is thought
that these minor collagens play a role in adjusting the structure of collagen type II (Guilak et
al., 2000). Collagen type II makes up the backbone of heteropolymeric cartilaginous fibres of
which type IX is thought to play a role in facilitating the interaction of fibrils with
proteoglycans. Collagen type VI forms independent microfibrils in the ECM and it plays a role
in chondrocyte attachment to the ECM (Cremer et al., 1998; Poole, 1997). Type X is thought
to play a role in the organisation and distribution of the matrix components and is present in
areas where hypertrophic chondrocytes are found (Cremer et al., 1998; Shen, 2005).
1) Synthesis of Pro-𝜶 chain
2) Hydroxylation of selected prolines and lysines
3) Glycosylation of selected hydroxylysines
4) Self-assembly of three Pro-𝜶 chains
5) Procollagen triple-helix formation
6) Secretion
7) Cleavage of propeptides
8) Self-assembly into fibril
3 Pro-𝛼 chains
Propeptides
Secretory vesicle
Plasma membrane
ER/Golgi
compartment
Procollagen molecule
10-300 µm
0.5-3 µm
Collagen fibril
Collagen fibre

5
1.2.2.2 Proteoglycans & Glycosaminoglycans
The ECM contains three main types of glycosaminoglycans (GAGs): hyaluronan, chondroitin
sulfate and keratan sulfate. A proteoglycan (PG) monomer consists of a core protein
(aggrecan), to which numerous GAGs are attached. This proteoglycan monomer has
associated chondroitin sulfate and keratan sulfate molecules through simple sugar bonds
(Figure 3) (Hardingham and Muir, 1974). In AC, the most important proteoglycan monomer
is aggrecan. Aggrecan consists of a protein core onto which GAG chains, made up of
chondroitin sulfate and keratan sulfate, are covalently attached (Figure 3) (Mow and
Ateshian, 1997). These aggrecan monomers bind, via a link protein to a hyaluronan molecule,
forming a proteoglycan aggregate (Figure 3). This macromolecular complex interacts with
the surrounding collagen fibrils to from a fibre-reinforced, porous-permeable composite
solid matrix (Poole, 1997), which is known as the solid phase (Figure 3). The most abundant
GAG in AC is chondroitin sulfate, however there are other GAGs present in smaller quantities
such as; heparin, heparan sulfate, dermatan sulfate and keratan sulfate. The functional
properties of PGs are given to them by the individual GAG chains (Mow and Ateshian, 1997).
Figure 3: (Left) Schematic of ECM of articular cartilage (Barnes Baili, 2011), (Right) Proteoglycan aggrecan monomer molecule. Adapted from: (Brinker and Miller, 1999).
1.2.2.2.1 Roles of collagen and proteoglycan in articular cartilage
Both the collagen and PGs bind water in different ways, which is essential to the function of
healthy cartilage (Mankin et al., 1999). In the solid phase, proteoglycan monomers (Figure
3) with GAGs rich in sulfate and carboxylate groups, are highly negatively charged in contact
with water. A swelling pressure, resisted by the surrounding collagen network is created as
a result of the repulsion force induced by the negatively charged molecules (Jaffe et al.,
1974,). The balance of these two forces determines the degree of cartilage hydration and
any disruption of this balance will cause an increase in tissue hydration (Mankin, 1982).
Protein core
Proteoglycan aggregate Proteoglycan
monomer
Linker protein
Hyaluroante
GAGs
Col lagen fibre
Hyaluronate
6
The fluid phase of cartilage contributes to the healthy function of cartilage. It is this phase
that influences the mechanical behaviour of cartilage when it is loaded. As the cartilage is
loaded under compressive force, water is able to flow through the porous structure, which
creates a frictional drag force on the matrix. The applied load causes the fluid to be extruded
and this reduces the pore size and hence permeability of the ECM. Hence as the permeability
of the ECM decreases, the drag force increases further (Maroudas et al., 1968). This
mechanical mechanism provides cartilage with a protective feedback feature which enables
the cartilage to stiffen by reducing the rate fluid flow through its matrix, when it experiences
high and increasing loads (Mow et al., 1980). The combination of fluid and solid matrix
properties provides AC with the viscoelastic, biomechanical and low friction properties for
efficient load distribution.
However, in degenerative cartilage these properties become compromised. The increased
water content (tissue hydration) attributed to degenerative cartilage seems surprising as
there is also a loss of glycosaminoglycans, which are themselves highly hydrophilic.
Maroudas et al., explained this paradox as a degeneration of the collagen network, which
allows the fibrillated tissue to swell even more, in spite of the relatively low osmotic pressure
created by the decreased GAG content. Therefore, the swelling seen in degenerate cartilage
is not due to any changes in the state of water but to a breakdown in the collagen network.
The main disaccharide unit of GAGs in AC is chondroitin sulfate. It is formed by the linkage of
D-glucuronic acid to N-acetylgalactosamine. These galactosamine residues can be sulfated
either in positions 4 (C4S) or 6 (C6S); the sulfate groups alongside the carboxyl groups of
glucuronic acid, are ionised, therefore giving rise to a global negative charge. In normal
healthy cartilage, the concentration of C4S and C6S present in the synovial fluid has been
shown to vary between 13.4- 23.4 nmol.ml-1 and 64.3-141.9 nmol.ml-1 respectively and the
ratio of C6S:C4S has been shown to fluctuate between 4.3 to 6.9 (Nakayama et al., 2000;
Nakayama et al., 2002). However, this ratio has been reported to decrease with increasing
age and severity of the disease, most commonly OA, which is why this ratio has been
suggested as a clinical marker for damage in articular cartilage in early OA (Sharif et al., 1996;
Bayliss et al., 1999). Within the layers of cartilage, the proteoglycan composition changes
with depth. The proteoglycans in the upper layers contain a lower amount of keratan sulfate
and a higher amount of chondroitin sulfate (Zanetti et al., 1985). Recent studies using various
biochemical characterisation techniques have confirmed that there is a topographical
variation in the zonal distribution of chondroitin sulfate, and it is more predominantly found
in the topmost layers of AC (Crockett et al., 2007; Bayliss et al., 1999).

7
1.2.3 Macrostructure of Cartilage
Cartilage can be subdivided into four main zones. This zonal structure varies from the surface
of AC down to the subchondral bone; through which the cellular (chondrocytes) and
structural components (collagen fibre orientation) of the ECM undergo some changes (
Figure 4).
1.2.3.1 The Superficial Zone (tangential zone)
This is the articulating surface that provides low friction movement between the two
opposing surfaces and resists shear. It consists of two layers; a sheet of very fine fibrils with
few polysaccharides and no cells, which forms a clear film often referred to as the lamina
splendens, also known as the surface amorphous layer (SAL). Underneath this are flattened
ellipsoid-shaped chondrocytes, packed parallel to the articulating surface with collagen fibres
also aligned parallel to the surface. They synthesise an ECM with high collagen content and
a low proteoglycan concentration, relative to other zones (Buckwalter et al., 2005).
Fibronectin and water concentration are also highest in this zone.
1.2.3.2 The Middle Zone (transitional zone)
This zone makes up for around 40-60% of the AC volume. It has a higher Young’s modulus
than the superficial zone, perpendicular to the AC surface. Chondrocytes in this zone are
more rounded than in the superficial layer (Mow and Hung, 1989). They synthesise a matrix
that has larger collagen fibrils (arranged loosely and horizontal to the articulating surface),
higher proteoglycan content but a lower collagen and water content than seen in the
superficial zone matrix (Buckwalter et al., 2005).
1.2.3.3 The Deep Zone (radial Zone)
This zone makes up 30% of the cartilage. Chondrocytes here are spheroidal in shape and
arrange themselves parallel to the collagen fibrils and perpendicular to the joint line (Mow
and Hung, 1989). This zone contains collagen fibrils with the largest diameter, the highest
proteoglycan concentration and the lowest concentration of water (Buckwalter et al., 2005).
1.2.3.4 Calcified Cartilage Layer
The tide mark divides the deep zone from the underlying calcified cartilage, which rests
directly on the subchondral bone (Mow and Hung, 1989). This transition reduces the stiffness
gradient between the inflexible bone and the more flexible cartilage. The subchondral bone
ultimately provides the anchorage for the cartilage tissue as a whole (Radin and Rose, 1986).

8
Figure 4: Stratified structure of cartilage demonstrating zonal arrangement. Adapted from: (Brinker and Miller, 1999).
1.2.4 Function of Cartilage
The function of cartilage is best understood when it is viewed as a biphasic structure. This
specialist tissue is composed of a solid phase consisting of mostly type II collagen and
proteoglycans and the fluid phase, which consists of water and ions. The solid phase has low
permeability because of the high resistance to fluid flow, creating high interstitial fluid
pressurization in the fluid phase. It is this pressure force that accounts for 90% of the ‘load
transmission’ function of cartilage (Ateshian and Wang, 1997). The low permeability of the
solid phase and the high pressurization of the fluid phase both work to establish the stiffness
and viscoelastic properties that allow AC to perform its function (Felson et al., 2000).
1.2.4.1 Mechanical properties of articular cartilage
One of the roles of cartilage is to facilitate the load support and load transfer whilst allowing
the rotation and translation between bones. The knee experiences a load of approximately
3.5 times body weight and considering the average person weighs about 70 kg, the force
experienced in the knee is exceptionally high (Mow et al., 2000). Therefore, the mechanical
as well as the biochemical characteristics of AC are proportional to how it performs within
the joint. Changes in these characteristics could ultimately affect the loading pattern that the
bone experiences and hence, lead to degradation and eventually the total loss of tissue. The
ability of cartilage to deform under load plays a crucial role in its mechanical function (Hayes
and Mockros, 1971; Mow et al., 1984). The mechanical properties of AC can be described as
anisotropic (dependant on orientation), nonlinear (dependant on magnitude of strain) and
inhomogeneous (variable within tissue); all of which are due to the changes in macroscopic
and microscopic structure throughout its depth (Guilak et al., 2000). AC can best be described
5
4
1
3
2
- 4
5 -
1
3
2

9
as a viscoelastic material with a solid and fluid phase, in which the interaction of
proteoglycans and the collagen network play a crucial role in displaying this behaviour.
When cartilage is put under uniaxial tension, the tissue exhibits non-linear stress-strain
characteristics. In vivo, this tension is experienced when the cartilage is compressed and the
surrounding regions are pulled towards the point of loading. As the cartilage is loaded in
tension, the coiled collagen fibrils of the solid matrix begin to uncrimp, which contributes to
the initial slope increase in the toe region (Figure 5). Following this initial straightening of the
fibres, there is a constant increase in slope as the collagen fibres start to resist the applied
tension which eventually leads to the failure of these fibres, as they are stretched to rupture.
A study performed by Mow et al., showed that collagen in cartilage exhibits anisotropic
behaviour as the tensile modulus was considerably higher in samples that were aligned
parallel to the collagen fibres compared to those that were perpendicular to the collagen
fibres (Mow and Ateshian, 1997).
Figure 5: Stress-strain curve for articular cartilage under uniaxial constant strain rate loading.
The tensile Young’s modulus of cartilage can be referred to as a measure of the strength of
the solid collagenous matrix, which varies depending on the orientation and the depth of the
cartilage tissue (Roth and Mow, 1980). Other parameters which also affect this parameter
are type of joint, sample location, age, fibre density and diameter, strength of ionic bonds
and amount of cross-linking within the cartilage tissue (Schmidt et al., 1990). In healthy
human AC, the tensile modulus has been shown to vary between 5 to 25 MPa, depending
mostly on the latter conditions (Kempson et al., 1968; Akizuki et al., 1986). The viscoelastic
behaviour of AC is also dependant on the interactions of the solid collagenous matrix and its
proteoglycans network. Schmidt et al. reported that the removal of GAGs from AC affects
the collagen fibre orientation, which consequently alters the rate of deformation (creep) of
the cartilage samples (Schmidt et al., 1990). Although, this study suggested that the collagen-
proteoglycan interactions affect the rate of deformation in AC, it is the inherent stiffness of
Toe Region
Ten
sile
Str
ess,
(F
/A) Young’s Modulus = /
Failure
Linear Region
Strain, (L/Lo)

10
the solid collagenous matrix that mainly contributes to the stress-strain behaviour of
cartilage in tension (Guilak et al., 2000).
Wong et al., proposed that the loss of tensile integrity in degenerative cartilage and in
osteoarthritic cartilage was directly proportional to the amount of collagen degradation as
well as the network remodelling (Temple-Wong et al., 2009). Studies by Silver et al.,
suggested that the elastic modulus (calculated from stress-strain curves) for human AC was
influenced by the collagen fibril length and its structure. It was found to be higher in healthy
cartilage compared to OA cartilage. They suggested that this increase was due to the
presence of PGs within the collagen. However, from the results it was not clear whether the
decrease in the elastic modulus in OA cartilage is as a result of the degradation of the collagen
network; the loss of PG content; synthesis of catabolic enzymes or a combination of the latter
(Silver et al., 2001a; Silver et al., 2004). Nevertheless, the 3D organisation of collagen fibres
is known to vary throughout the depth of AC and the orientation of these fibre aids in giving
cartilage its unique mechanical properties.
Articular cartilage also exhibits compressive properties that are mainly dependant on the
water content and its interaction with the proteoglycan network. The compressive modulus
of cartilage ranges from 0.08 to 2 MPa and like the tensile modulus, the compressive modulus
can vary depending on location on the joint, age, type of joint and pathology (Schinagl et al.,
1997; Athanasiou et al., 1994). Compression of cartilage is governed by the highly charged
sulfate and carboxyl groups on the proteoglycans, causing repulsion between them and
owing to the expansion in the proteoglycan network. However, this swelling is restricted by
the electrostatic forces between the collagen and proteoglycan network. These charged
groups have a high affinity for water molecules which restrict the free movement of
interstitial fluid through the interconnected pore structure of the solid matrix, setting up a
frictional drag coefficient. As a result of these interactions, a Donnan osmotic pressure is
created within the cartilage tissue network, which is the major contributor to the
compressive stiffness of AC (Ateshian et al., 2003). Interstitial fluid pressures are significantly
higher under compression, hence their importance in the load support in the joint. The
frictional drag created by the flow of interstitial water through the porous permeable matrix
acts as dissipative mechanism for AC. As this fluid is dispersed through the tissue, the fluid
pressure decreases over time and more of the load is supported by the solid matrix, giving
rise to the creep and stress-relaxation behaviours in cartilage (Mow et al., 1984; Park et al.,
2003; Lai et al., 1981; Mow et al., 1980). In conclusion, the creep and stress-relaxation

11
behaviour of AC is mainly explained by this biphasic behaviour, as the stresses are dispersed
between the solid and fluid phases of cartilage.
1.2.5 Lubrication Mechanisms of Cartilage
Synovial fluid contributes to the low friction articulation within the human joints. Water is
the main fluid constituent in AC, as well as the synovial fluid. The synovial fluid contains many
inorganic salts, such as calcium, chloride, potassium and sodium as well as other components
such as hyaluronic acid and proteins. This interstitial fluid also plays an important role in the
transport of nutrients for the chondrocytes and the removal of waste from the tissue. The
following section will cover the various lubrication regimes/theories stated for the synovial
joints. It is important to note that none of these regimes alone can account for the behaviour
of the joints under physiological loading. Therefore, it is suggested that a combination of
more than one of the following regimes will be active under any physiological condition that
the joint experiences.
1.2.5.1 Fluid Film Lubrication
When two articulating surfaces of AC are separated by a thin fluid layer, there are low levels
of friction, and fluid film lubrication exists. The pressure created by this thin layer of fluid
between the two bearing surfaces supports the load. The thickness of the film has to be three
times greater than the combined roughness of the bearing surfaces, for the fluid film
lubrication to subsist and function. Within this type of lubrication theory there are various
regimes that can be used to describe the joint lubrication (McNary et al., 2012).
Hydrostatic lubrication, is where the two opposing surfaces are separated and supported by
an externally pressured fluid film from the recesses of the cartilage surface. Whereas,
hydrodynamic lubrication occurs when two surfaces move at relatively high speed and fluid
is drawn between them. The film thickness is a function of many different variables such as;
geometry, roughness and fluid viscosity (Bassani and Piccigallo, 1992; Neu et al., 2008). In
elastohydrodynamic lubrication, the asperities of the cartilage surface become of the same
order of thickness as the fluid film. Therefore, the pressures generated by the fluid result in
the elastic deformation of the bearing surfaces (Dowson, 1995). Squeeze film lubrication, is
exhibited when the lubricant fluid between the two-bearing surface is viscous in nature and
cannot be exuded out of the contact zone, when under load. This resultant pressure keeps
the surfaces apart and dissipates the load (Mow and Ateshian, 1997). Lastly, boosted
lubrication occurs when the joint is under load, this causes the solvent within the synovial
fluid to be forced back in to the cartilage ECM, therefore leaving behind highly viscous and

12
concentrated hyaluronic acid and proteins on the cartilage surface, which have load bearing
capabilities (Walker et al., 1968; Longfield et al., 1969).
1.2.5.2 Boundary Lubrication
Boundary lubrication comes into play when the combined asperity height of the two
opposing surfaces becomes greater than the fluid film thickness. The articulating surfaces
become separated by a mono/multi-layer of boundary lubricant, which prevents direct
contact between the two surfaces. In the absence of this continuous and self-replenishing
layer, the continuous asperity contact would lead to the degeneration of the cartilage surface
by mechanical wear (Mow and Ateshian, 1997; Gleghorn and Bonassar, 2008; Chan et al.,
2010). Fluid film lubrication is dependent on the changes in viscosity of the fluid and the fluid
forces generated from the joint motion (Figure 6). Nevertheless, the literature states that the
lubrication of AC is not completely reliant on the viscosity of the synovial fluid; therefore, this
led to further investigation into the lubricating constituents present in the synovial fluid.
Research has mainly focused around the study of three proposed boundary lubricant
molecules: surface active phospholipids (SAPLs), superficial zonal proteins (SZP) and
hyaluronic acid (Chan et al., 2010; Jay and Cha, 1999) and their roles in different lubrication
regimes. However, a full discussion of the research into these proposed boundary lubricants
is beyond the scope of this thesis.
Figure 6: Friction coefficient plotted as a function of fluid viscosity and shear velocity divided by the load (Stribeck Curve) with the correspodning film thickness for boundary,
mixed and hydrodynamic lubrication mechanisms (Coles et al., 2010).
1.2.5.3 Mixed Lubrication
This type of lubrication regime comes into play when the interstitial fluid seeps out of the
porous cartilage as the load increases. The ability of the cartilage to support the
elastohydrodynamic lubrication via the secretion of interstitial fluid is reduced and ‘mixed
lubrication’ comes into play. This is a combination of fluid film lubrication and boundary
lubrication processes. Throughout the gait cycle, the bearing surfaces of AC undergo a variety
of loading conditions (i.e. contact stresses and sliding speeds), diminishing the fluid film layer.
As this occurs, the bearing surfaces start to come into contact; this is where boundary

13
lubrication operates to reduce the friction between the opposing surfaces. Thus, it is likely
that under normal physiological conditions, the synovial joint operates under mixed
lubrication and may revert to another regime depending on the activity of the individual
(Gleghorn and Bonassar, 2008; Neu et al., 2008; Chan et al., 2010).
1.2.5.4 Biphasic Lubrication
Variations of fluid film, boundary and mixed lubrication regimes have been found to operate
at the synovial joint. These regimes are attributed to the composition of the articulating
surface and the materials present within them. Biphasic lubrication plays an intrinsic role in
the tribological function of the cartilage tissue and hence the synovial joints.
McCutchen was the first to propose that the interstitial fluid within the joint cavity was able
to carry the load when a force was applied to it. The theory also stated that this fluid exudates
from within the cartilage, providing a fluid film to the area that is loaded, keeping the surfaces
from coming into contact (McCutchen, 1959). Over the years, many different lubrication
mechanisms had been attributed to AC and it had become increasingly clear that the
tribological performance of AC was not confined to one single lubrication regime alone. It is
considered to have a manifold of lubrication regimes, which can be characteristic of two
distinct incompressible and immiscible phases (Greene et al., 2011). These phases are
comprised of the solid phase (mainly collagen and proteoglycans) and the fluid phase
(interstitial water) (Mow and Lai, 1980). The interaction between these two phases is what
controls the deformation of AC, which is the flow of the interstitial fluid through the complex
interwoven solid phase. The significance of biphasic deformation in AC on its lubrication was
highlighted in the late 1950s by McCutchen et al. However, it was not until the 1990s that
further studies were carried out; experimentally by Forster et al. (1996), and theoretically by
Ateshian et al. (1997), to confirm the biphasic mechanism (Forster and Fisher, 1996;
Ateshian, 1997). The unique structure of AC is crucial to its biphasic and load bearing
characteristics. Cartilage is highly porous; this is due to the interwoven nature of the collagen
matrix, with pore size varying between 2 - 6.5 nm. The presence of charged groups on the
proteoglycan network and these small pores in the matrix contribute to the low permeability
value, which varies between 10-15 to 10-16 m4Ns-1 (Mow and Ateshian, 1997). As the interstitial
fluid (fluid phase) is under load, it generates what is known as pressure gradients (drag
forces). The pressurization of this fluid phase is able to support the majority of the load
applied. However, as time progresses the fluid is exuded into the joint space or into other
unloaded areas. Gradually the load is transferred from the fluid phase to the solid phase and
as a result the friction is increased.

14
Forster & Fisher (1996) demonstrated that the friction observed between the two
articulating surfaces was mainly due to the solid phases interactions. However, they also
suggested that the COF between the articulating surfaces could be kept low as long as the
fluid phase load support was very high. This was confirmed by their test measuring the COF
in an in vitro cartilage specimen against metal and cartilage against cartilage set up for
different loading times (Forster and Fisher, 1996).
1.2.5.5 Triphasic Lubrication
Mow et al., established the triphasic material properties of AC as a progression from the
original biphasic theory. The proteoglycan aggregates were modelled to be restrained within
the collagen matrix, just as in the biphasic theory. These molecules contain a large number
of fixed negatively charged groups (SO3- and COO-) along the GAG chains (Mow et al., 1990).
Due to these negatively charged molecules, in a water-like environment such as the
interstitial fluid, univalent counter ions (e.g. Na+) are needed to maintain the electro-
neutrality. These univalent ions which are present within the interstitial fluid were modelled
as an addition to the fluid phase in the biphasic theory (Lai et al., 1991). Although the use of
this theory has improved the accuracy in determining the equilibrium response to the
deformation of cartilage under load, this ionic phase plays a very small role when compared
to the solid and fluid phases of AC (Lai et al., 1991), however it is a factor that should be kept
in mind experimentally.
1.2.6 Wear of articular cartilage
The wear of articular cartilage can be classified into two categories, mechanical wear and
biochemical degradation, both of which can eventually lead to the destruction and
degeneration of AC. In engineering terms, wear is classed as the removal and deformation of
a material surface as the result of a mechanical stress applied by an opposing surface or
object. Cartilage can last a life time with very minor wear however, this can be hindered by
several environmental factors such as, but not limited to; abnormal biomechanical loading,
trauma, changes in the structure of the ECM and pathologically induced alterations in the
lubrication mechanism. All of the factors can either work in isolation or in concert to increase
the cartilage wear past its normal limits. Cartilage tissue is biological in nature and therefore
it can suffer from collateral biochemical degradation; this can either be alteration to the
collagen network, increased loss of proteoglycans or ionic disturbances in the synovial fluid.
It is very hard to determine which of the two types of wear damage, biomechanical or
biochemical, follow on from each other. The difficulty of understanding the underlying
process of these two types of cartilage wear has focused past and present research, to

15
determine the frictional and deformation properties of AC, whilst still being aware of any
tribological properties.
1.2.6.1 Types of wear
1.2.6.1.1 Mechanical wear
This type of wear can be further subdivided into two groups: fatigue wear and interfacial
wear. The latter occurs mostly during boundary and mixed lubrication where there is slight
solid-solid contact between the two opposing surfaces. There are two forms of interfacial
wear; adhesive wear, which occurs when there is unwanted displacement and attachment
of wear debris, from one surface to the other. The other is abrasive wear, in which the
material of the softer of the two bearing surfaces is removed from its surface due to rubbing
against the harder bearing surface. The harder material can either be the particles between
the surfaces, which can be considered as third-body wear or the bearing surface itself (Mow
and Ateshian, 1997). However, due to the many lubricating mechanisms within the joint, the
contact between the articulating surfaces is hampered, meaning that interfacial wear does
not tend to happen frequently. Nevertheless, any disruption to these lubricating mechanisms
due to any sort of AC degradation may lead to interfacial wear and accelerate the tissue loss
because of the altered biomechanics of the joint and increased contact.
1.2.6.1.2 Fatigue wear
Unlike mechanical wear, fatigue wear is independent of the lubrication phenomenon
occurring between the two surfaces of the AC. This type of wear is produced as a result of
cyclic loading causing increased stress and strain on the joint by which the material becomes
weakened. This produces wear debris that becomes dislodged due to the propagated crack
growth at the cartilage surface or in the underlying bulk material. In cartilage, it is manifested
in the form of collagen network buckling or loosening (Mow and Ateshian, 1997), by which
the collagen fibres become separated from their bundles into individual fibres or even
smaller subunits. This results in a dramatic decrease in the mechanical properties and an
increase in the tissue permeability, similar to the process seen in OA cartilage.
1.2.6.1.3 Biochemical degeneration
Cartilage loss due to the degeneration of its structural and functional components can be as
a result of various pathological causes such as, but not limited to, metabolic disorders, over
production of cytokines and matrix metalloproteases (MMPs) and joint haemophilia. This is
termed as biochemical degeneration. There is a vast amount of literature that uncovers the
underlying mechanisms of these factors and the role they have in cartilage degeneration as
well as the onset and progression of OA (Alcaraz et al., 2010; Kapoor et al., 2011; Pitsillides

16
and Beier, 2011; Ashkavand et al., 2013; Lee et al., 2013). Biochemical degradation can also
affect the natural aging of chondrocytes and stimulate chondrocyte hypertrophy as a result
of increased metabolic activity. These changes in chondrocyte behaviour alter the
composition of the ECM as a result of an increase in the ratio of CS-6 to CS-4, which is similar
to the ratio seen in undeveloped foetal cartilage (Sandy et al., 1987; Hickery et al., 2003;
Clarkin et al., 2011). Following these events, the biomechanical properties of AC become
adversely affected and hence make it susceptible to further mechanical and/or biochemical
degeneration, aggravating the OA condition. Therefore, OA is a combination of biological,
chemical and mechanical processes.
1.3 Osteoarthritis
1.3.1 Introduction
Osteoarthritis (OA) is one the most common joint diseases worldwide. This disease is
characterised by the progressive loss of articular cartilage and formation of osteophytes
which leads to chronic pain and discomfort. The vast literature all points to the same factors
that are responsible for the development of OA (Lorenz and Richter, 2006). These mainly
include traumatic events either from sporting activities or traffic accidents; however, there
are also other factors such as congenital abnormalities, ageing and malnutrition which can
all lead to changes in the AC structure (Swoboda, 2001). Unfortunately, cartilage has a poor
propensity for self-renewal due to its avascular nature. The repair tissue that it does form as
a result of cartilage loss mainly consists of fibrous tissue, which has mechanical properties
that are considerably reduced compared to that of healthy AC. Early therapeutic intervention
is needed to repair initial cartilage damage and prevent or delay the progression to OA (Arden
and Nevitt, 2006). Unfortunately, OA is not normally diagnosed in early stages and
predominantly manifest at an advanced stage, when alterations to the joint are pronounced
and can be visualised radiographically. The therapeutic options for advanced OA are difficult
and limited. There is a real need to understand the underlying molecular mechanisms of
cartilage degeneration, in order to develop early intervention therapeutic approaches and
diagnostic techniques (Lorenz and Richter, 2006).
1.3.2 Pathophysiology of Osteoarthritis
As noted above, a major problem with understanding of the pathophysiology of OA is that
early stage OA cartilage is not easily diagnosed. The morphological and histological features
of established OA are well known, however the underlying molecular mechanisms that lead
to the development of the disease are still not completely understood. This section aims to

17
review current literature available on the biochemical and molecular process at different
stages of OA that lead to histological and macroscopically visible alterations in AC.
Damage to cartilage, mainly through trauma, involves damage to chondrocytes, which
compromises their ability to repair. This leads to loss of proteoglycan content (Lohmander et
al., 1989), increased hydration and altered collagen organization (Mankin, 1982). The
progressive loss of structure and functionality of AC is driven by an imbalance of anabolic and
catabolic processes within the tissue (Sandell and Aigner, 2001). The disturbance of the
cartilage organisation results in a decrease in the tensile stiffness and strength that is usually
provided by the healthy 3D architecture of the collagen network (Wang et al., 2003).
Similarly, the OA process is linked to a loss of proteoglycans, by which proteoglycan
monomers are no longer bound to the hyaluronan backbone. This is due to proteolytic
enzymes which shorten the chain length of the aggrecan molecule and hence inhibit the
formation of the normal macromolecular complex seen in Figure 3 (Mankin et al., 1999;
Poole, 1997). It is thought that metalloproteases (MMPs) such as collagenase-1 (MMP-1) and
collagenase-3 (MMP-3) are responsible for the degradation of type II collagen (Reboul et al.,
1996), whereas stromelysin-1 (ST3) and aggrecanase-1 (ADAMTS-4) are responsible for the
degradation of aggrecan (Lark et al., 1997; Tortorella et al., 2000). The breakdown of these
complexes leads to a more permeable solid matrix. Even though there is increased water
content, the increase in permeability of the matrix results in a decrease in the hydraulic
pressure and therefore a reduction in the compressive stiffness (softening) of the cartilage
(Akizuki et al., 1987; Lai et al., 1991). Inflammatory cytokines may augment the process of
cartilage softening and degradation. Pro-inflammatory cytokines such as tumour necrosis
factor- 𝛼 (TNF- 𝛼 ), interleukin 1- 𝛽 (IL-1𝛽 ) and IL-6 stimulate chondrocytes to secrete
catabolic enzymes such as MMPs and aggrecanase, which degrade the cartilage matrix
(Martel-Pelletier, 2004). The loss of structure to the ECM and decrease in the mechanical
properties leads to the load applied at the surface of the AC to be transferred to the
underlying subchondral bone and consequently making it stiffer. Consequently, this causes
the impact loads to be transmitted to the weaker damaged cartilage (Mankin, 1982). Small
lesions occur which eventually increase in size, revealing naked bone and ultimately the
whole layer of the articular cartilage is destroyed (Howell, 1986; Felson, 1993). In summary,
the pathophysiological process of OA that causes the morphological and histol ogical change
can simply be divided into three stages. Firstly, the ECM breaks down on a molecular level,
water content increases and matrix molecules are reduced in size. This compromises the
structure of collagen leading to a reduced stiffness. Secondly, chondrocytes try to repair the
damage through enhanced proliferation and metabolic activity. Chondrocytes aggregate

18
around newly formed matrix molecules. Finally, the cells are not able to sustain their
reparative activity and as a consequence the regeneration of cartilage is superseded by its
degeneration (Lorenz and Richter, 2006).
1.3.3 Relevance of OA Models
One approach to understand the disease progression of OA is via the use of animal models.
Animal models have been able to provide radiographical, histological and molecular changes,
which can be directly correlated to certain stages of degeneration of human AC (Lorenz and
Richter, 2006). Animal models allow direct comparison of diseased and healthy AC in the
same animal. Animal models include spontaneous (Huebner et al., 1998), mechanically
induced (Pond and Nuki, 1973; Marijnissen et al., 2002), and chemically induced (Dumond et
al., 2004) approaches. The relevance of these models to the human situation is, however
questionable, not least because animals are quadrupeds and have different loading patterns
in joints compared to humans. Nevertheless, most of the current understanding of the
pathophysiology of early OA and its progression over time is derived from animal models
(Lorenz and Richter, 2006). The type of joint usually studied in animals is the stifle (knee)
joint. Nonetheless, other joints include the temporomandibular joint in STR/ort mice
(Kumagai et al., 2015), the metacarpophalangeal and middle carpel joints in horses, which
have been shown to have great similarities to the human knee joint (McCoy, 2015;
McIlwraith et al., 2010). Both small (mouse, rat, rabbit, guinea pig) and large animal (dog,
sheep and horse) have been used to develop OA model. However, the choice of an imal
usually depends on, but is not limited to, the type of experiment, length of study, husbandry
costs, ease of handling and outcome measurements. All of which have been associated with
the disadvantages of using animal models (Kuyinu et al., 2016). In addition, the length of time
needed for each animal to reach skeletal maturity and, as a consequence develop OA is also
another limiting factor. Small animal models are usually used to study the pathogenesis and
pathophysiology of the OA disease process as well as screening models for therapeutic
interventions. Although they are quick, cheap and easy models to implement the efficacy of
treatments may not be translatable to humans, which is mainly down to the difference in
anatomy, histology and physiology between these animals and humans (McCoy, 2015;
Pelletier et al., 2010). Larger animal models are usually used to study the disease process and
treatment, as their anatomy is much more like those of humans, which is why studies of
cartilage degeneration and osteochondral defects are much more useful in larger animals.
They can be used to confirm the efficacy of drugs or treatments before they are taken to
clinical trials (McCoy, 2015; Pelletier et al., 2010). The biggest problem however when using
animal models is, because there are so many approaches to induce OA, such as but not
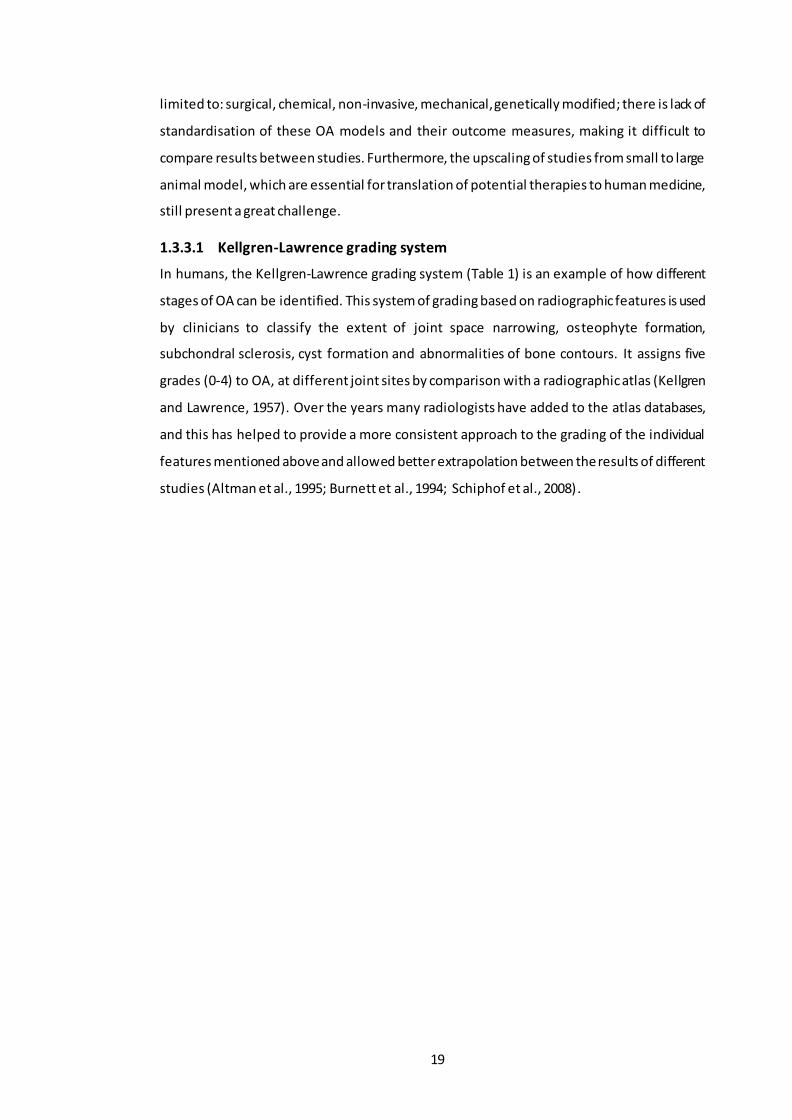
19
limited to: surgical, chemical, non-invasive, mechanical, genetically modified; there is lack of
standardisation of these OA models and their outcome measures, making it difficult to
compare results between studies. Furthermore, the upscaling of studies from small to large
animal model, which are essential for translation of potential therapies to human medicine,
still present a great challenge.
1.3.3.1 Kellgren-Lawrence grading system
In humans, the Kellgren-Lawrence grading system (Table 1) is an example of how different
stages of OA can be identified. This system of grading based on radiographic features is used
by clinicians to classify the extent of joint space narrowing, osteophyte formation,
subchondral sclerosis, cyst formation and abnormalities of bone contours. It assigns five
grades (0-4) to OA, at different joint sites by comparison with a radiographic atlas (Kellgren
and Lawrence, 1957). Over the years many radiologists have added to the atlas databases,
and this has helped to provide a more consistent approach to the grading of the individual
features mentioned above and allowed better extrapolation between the results of different
studies (Altman et al., 1995; Burnett et al., 1994; Schiphof et al., 2008).
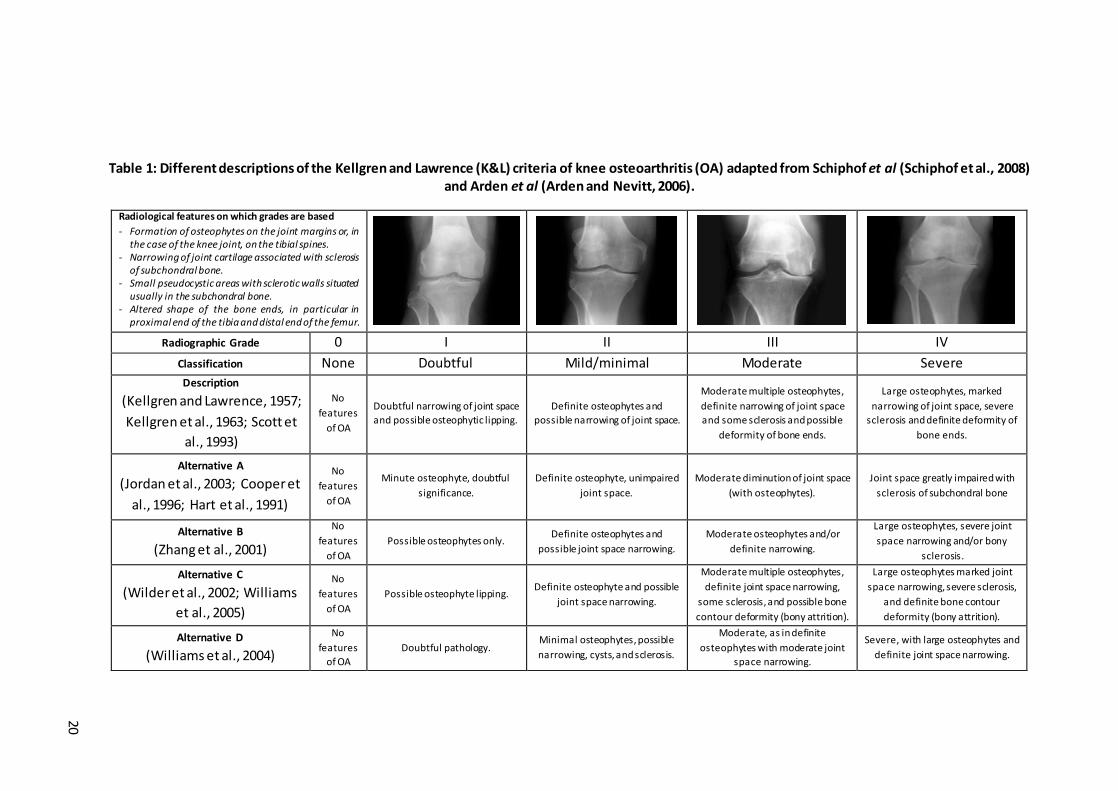
20
Table 1: Different descriptions of the Kellgren and Lawrence (K&L) criteria of knee osteoarthritis (OA) adapted from Schiphof et al (Schiphof et al., 2008) and Arden et al (Arden and Nevitt, 2006).
Radiological features on which grades are based
- Formation of osteophytes on the joint margins or, in the case of the knee joint, on the tibial spines.
- Narrowing of joint cartilage associated with sclerosis of subchondral bone.
- Small pseudocystic areas with sclerotic walls situated usually in the subchondral bone.
- Altered shape of the bone ends, in particular in proximal end of the tibia and distal end of the femur.
Radiographic Grade 0 I II III IV
Classification None Doubtful Mild/minimal Moderate Severe
Description
(Kellgren and Lawrence, 1957;
Kellgren et al., 1963; Scott et
al., 1993)
No
features
of OA
Doubtful narrowing of joint space
and possible osteophytic lipping.
Definite osteophytes and
possible narrowing of joint space.
Moderate multiple osteophytes,
definite narrowing of joint space
and some sclerosis and possible
deformity of bone ends.
Large osteophytes, marked
narrowing of joint space, severe
sclerosis and definite deformity of
bone ends .
Alternative A
(Jordan et al., 2003; Cooper et
al., 1996; Hart et al., 1991)
No
features
of OA
Minute osteophyte, doubtful
significance.
Definite osteophyte, unimpaired
joint space.
Moderate diminution of joint space
(with osteophytes).
Joint space greatly impaired with
sclerosis of subchondral bone
Alternative B
(Zhang et al., 2001)
No
features
of OA Possible osteophytes only.
Definite osteophytes and
possible joint space narrowing.
Moderate osteophytes and/or
definite narrowing.
Large osteophytes, severe joint
space narrowing and/or bony
sclerosis.
Alternative C
(Wilder et al., 2002; Williams
et al., 2005)
No
features
of OA Possible osteophyte lipping.
Definite osteophyte and possible
joint space narrowing.
Moderate multiple osteophytes,
definite joint space narrowing,
some sclerosis, and possible bone
contour deformity (bony attrition).
Large osteophytes marked joint
space narrowing, severe sclerosis,
and definite bone contour
deformity (bony attrition).
Alternative D
(Williams et al., 2004)
No
features
of OA Doubtful pathology.
Minimal osteophytes, possible
narrowing, cysts, and sclerosis.
Moderate, as in definite
osteophytes with moderate joint
space narrowing.
Severe, with large osteophytes and
definite joint space narrowing.

21
1.3.4 Structural and histological signs of OA
1.3.4.1 Early OA
The initial degeneration process of OA is characterised by changes in the cartilage surface,
which are no longer smooth (McDevitt et al., 1977). The GAGs remain unchanged compared
to normal healthy cartilage, however as the disease progresses, there is a loss of
proteoglycans indicated by a reduction in Safranin O staining (Figure 7) and the cells in the
superficial layer become round (as opposed to flat), hypertrophic and eventually disappear
(Fernandes et al., 2002).
Figure 7: Histological images of healthy and osteoarthritic cartilage. [Top Pictures] Normal
knee articular cartilage, Safranin O/fast green stained sections. (A) Human, (B) Rabbit. (1) Smooth surface, (2) cells in the tangential zone are small and flat, (3) cells in the
intermediate and radial zone are arranged in columns, (4) the complete cartilage matrix stains with Safranin O, and (5) the tidemark is intact. [Bottom Pictures] Mild OA, (C) Human,
(D) and (E) rabbit. (1) Surface irregularities, (2) Hypertrophic cells in tangential zone, (3) staining of Safranin O is reduced and (4) pannus (Lorenz and Richter, 2006).
In the transitional and radial zones the tissue shows mild to moderate hypercellularity.
Necrotic chondrocytes have been reported within the tangential zone of experimental OA
models (Bluteau et al., 2001). Pelletier et al., as well as many others, have noted that there
is a change in the synovial membrane in OA models in dogs and rabbits (Pelletier et al., 1985).
Hyperplasia of the synovial lining cells, thickening of the synovial membrane, presence of
inflammatory cells and fibrosis have all been reported (Brandt et al., 1991; Sakakibara et al.,
1994). The progression of the disease is dependent on the species of animal as well as the
D E C

22
location of the joint as proposed in reviews by; Le Graverand et al. (Le Graverand et al., 2002),
Lorenz et al. (Lorenz et al., 2005), and Young et al. (Young et al., 2005).
1.3.4.2 Advanced OA
At a more advanced stage of OA, there are visible signs of complete bre akdown of the
cartilage (Figure 8). The AC surface demonstrates a rough and uneven surface, with some
signs of fissures and cracks, which penetrate down to the calcified bone (Veje et al., 2003).
The cells in this very severe OA cartilage, either disappear completely or cluster around the
fissures, as the tissue degenerates further. The organisation of cartilage is completely lost
and is replaced by fibrous tissue (Miosge et al., 2004). In very extreme cases, the bone is
denuded of cartilage creating full-thickness defects (Pfander et al., 1999). A considerable loss
of proteoglycan content, visualised by lack of Safranin O in histological sections in all layers
of the cartilage is seen, eventually reaching the deep zone (Figure 8). The tidemark between
calcified and uncalcified cartilage is obscured (Hayami et al., 2003). Histological studies of
human cartilage exhibiting signs of OA, show the presence of fibrocartilage (Goldwasser et
al., 1982), as well as the presence of fibrillated tissue with areas of cartilage loss (Squires et
al., 2003).
Bock et al. were able to distinguish between three types of chondrocytes within OA cartilage
via a series of light and electron microscopical analyses. Type I cells exhibited the normal
healthy phenotype, in a continuous matrix and small amounts of endoplasmic reticulum.
Type II cells, were elongated and more irregular in shape, situated in a fibrillated matrix with
an enlarged endoplasmic reticulum. In severe cases of OA, Type III cells were found. These
cells contained pyknotic nuclei and partly dissolved cytoplasm within a severely fibrillated
matrix (Bock et al., 2001).
Figure 8: Severe OA, Safranin O/fast green staining. (A) Human, (B) and (C) rabbit. (1-3) The tissue shows deep clefts in the surface from which cells have disappeared from the tangential zone. (4) Lack of cells in the intermediate and radial zone, (5) reduced to no
staining of the matrix with Safranin O, and (6) denuded bone (Lorenz and Richter, 2006).

23
1.3.5 Biochemical and biomechanical changes of OA cartilage
Within the vast literature there is much discussion regarding the biomechanical and
biochemical mechanisms involved in the onset and progression of OA. Clinically, OA has been
linked to symptoms such as joint swelling, synovitis and inflammatory pain. The synovial
membrane contains highly metabolic synoviocytes, which are important in regulating the
physiological conditions within the joint capsule and nourishing the chondrocyte s via the
synovial fluid. They also remove any products of degeneration (Sellam and Berenbaum,
2010). Synovitis has been linked with the structural degradation of the OA disease because
of the action of several soluble mediators involved in the pathophysiology. However how this
occurs, is open to debate. Sallam & Berenbaum (2010) and later Berenbaum (2013) both
proposed the same hypothesis (Sellam and Berenbaum, 2010; Berenbaum, 2013); that as AC
degrades due to several factors (some listed in Table 2); cartilage debris becomes dislodged
in the joint space. Synovial cells, recognise these fragments as foreign material and mount
an inflammatory response leading to the release of inflammatory mediators as depicted in
Figure 9.
Figure 9: Involvement of synovium in OA pathophysiology. The activated synovial cells produce catabolic and pro-inflammatory mediators, which leads to the excess production of proteolytic enzymes responsible for cartilage and matrix breakdown, creating a positive
feedback loop. The inflammatory response is amplified by synovial T & B cells and macrophages. In addition to these inflammatory and degenerative effects, the inflamed
synovium also contributes to the formation of osteophytes via the release of bone morphogenetic proteins. Abbreviations - IL: interleukin; TNF: tumor necrosis factor; MMPs:
matrix metalloproteinases; ADAMTS: a disintegrin and metalloprotease with thrombospondin motifs and VEGF: vascular endothelial growth factor. Adapted from:
(Kuyinu et al., 2016).
Bone
Calcified cartilage
Deep zone
Middle zone
Superficial zone
Synovium Macrophage
(inactive)
Chondrocyte
Osteoclast (minimal bone turnover)
Osteoblast (inactive)
Vascular infiltration
Osteoclast (increased bone turnover)
Osteophyte formation
Macrophage (activated)
Fissural lesion
Synovium (fibrotic)
Cartilage erosion
Hypertrophic
chondrocyte Apoptotic chondrocyte
Pore formation in the subchondral bone plate Sclerotic bone formation
Osteoblast (activated)

24
Histological changes in OA synovium, reported by Myers et al., show signs of hypertrophy
and hyperplasia with an increased number of lymphocytes and macrophages. The
permeation of these cells into the synovium and thickness of the synovial lining seem to be
closely related (Myers et al., 1990). Inflammatory mediators, detected in the synovial fluid
have been suggested to originate from three tissues that have undergone histological
modification; cartilage, subchondral bone and synovium. The two most common cytokines
involved in the synovial inflammation and hence the pathogenesis of OA are; IL-1β and TNF-
α. Interestingly, a study performed on patients with knee pain both at the early stage and
late stage OA suggested that within the synovial fluid, the levels of IL-1β and TNF-α were
higher in patients with early OA than patients with late OA (Benito et al., 2005). The
production of these cytokines can have a secondary effect, via the stimulation of
chondrocytes and synoviocytes to produce other cytokines ( IL-6 & IL-8). These synovial
cytokines act on the cartilage matrix and chondrocytes (Sellam and Berenbaum, 2010;
Berenbaum, 2013), either independently or in concert with other cytokines to initiate and
propagate the inflammation process (Kapoor et al., 2011). In several cell culture studies, IL-
1β and TNF-α have been shown to suppress the synthesis of proteoglycans (Gouze et al.,
2001; Saklatvala, 1986), link proteins and type II collagen (Séguin and Bernier, 2003) within
AC (Nietfeld et al., 1990; Chadjichristos et al., 2003). Therefore low grade synovitis,
generated via pro-inflammatory cytokines as discussed above, as well as other soluble
mediators, contributes to the accelerated up-regulation of catabolic factors and down-
regulation of anabolic factors, thus leading to the degeneration of AC and progression of OA
(Sellam and Berenbaum, 2010; Fernandes et al., 2003; Berenbaum, 2013; Sutton et al., 2009) .
As a result of these cytokines, synovial cells as well as OA chondrocytes both produce large
quantities of metalloproteinase (MMPs), these include MMP-1, MMP-3, MMP-9 and MMP-
13 (Sellam and Berenbaum, 2010). MMP-3 is mainly synthesised at the boundary between
hyaline cartilage and synovial fluid, which suggests that this proteinase is produced by the
synovium to directly break down cartilage (Blom et al., 2007). Other authors have added to
this, indicating that MMPs are able to degrade all components of the ECM (Little et al., 2009).
It is clear that these inflammatory mediators play an important role in many physiological
processes, their over expression and activation by different cell types contributes to many
pathologies, including joint destruction in OA (Sellam and Berenbaum, 2010; Berenbaum,
2013; Little et al., 2009).

25
Table 2: Clinical, histological and molecular signs of synovitis in OA. (Adapted from Sellam et al (Sellam and Berenbaum, 2010)).
Level of
Evidence
Evidence of Synovitis in OA
Observation References
Clinical
Effus ion, joint swelling, or palpable synovitis
Loca l signs of inflammation
Sudden increase in pain
Night pain and morning s tiffness
(Krasnokutsky et al., 2008)
Histological
Synovial hypertrophy and hyperplasia
Infi ltration of mononuclear cells
(monocytes/macrophages, activated B cells and T cells)
Adaptative immune T-cell and B-cell responses to
fragments of extracellular matrix
Increased angiogenesis
Synovitis in the vicinity of degenerative cartilage
(Ayral et al., 2005), (Myers
et al., 1990), (Walsh et al.,
2007), (Nakamura et al.,
1999) and (Alsalameh et al.,
1990).
Molecular
Production and/or release of proinflammatory
cytokines
(TNF, IL-1β, IL-6, IL-8, IL-15, IL-17, IL-21)
Increased production of PGE2 and nitric oxide in the
synovium
Increased activity of MMPs (MMP-1, MMP-3, MMP-9,
MMP-13) and ADAMTS
Involvement of macrophages in osteophytes formation
via BMPs
Insufficient release of anti‑inflammatory cytokines (IL-
4, IL-10,IL‑13, IL‑1Ra)
(Benito et al., 2005), (Smith
et al., 1997), (Farahat et
al., 1993),
(Furuzawa-Carballeda and
Alcocer-varela, 1999), and
(Scanzello et al., 2009).
Alongside these events, the breakdown of aggrecan in the early stages of OA is also a
contributing factor to the pathogenesis of OA. The production of aggrecanase ADAMTS (A
disintegrin and metalloproteinase with thrombospondin motifs), in particular (ADAMTS)-4
(aggrecanase-1) and ADAMTS-5 (aggrecanase-2) are responsible for the aggrecan
degradation (Alcaraz et al., 2010). The production of these proteolytic enzymes is mainly
driven by TNF-α but also by IL-1β and therefore indirectly mediated by synovial
macrophages. However, studies using chondrocytes taken from porcine and bovine cartilage
explants revealed that the up-regulation ADAMTS-4 but not ADAMTS-5, was dependant on
TNF-α and IL-1β (Tortorella et al., 2001). This finding is in agreement with a similar study
performed on human OA synovium (Bondeson et al., 2006).
Several studies have shown that synovial macrophages are responsible for the inflammatory
responses in OA (Blom et al., 2007). The depletion of these cells within the synovium

26
demonstrated a reduction in the formation of osteophytes. Therefore, suggesting the role
that TNF-α has on osteophyte formation, perhaps through the stimulation of bone
morphogenetic proteins (BMPs) such as BMP-2 and BMP-4 (Blom et al., 2004; Van Lent et al.,
2004).
On the whole, the long-established view of OA as a cartilage only disease is no longer valid.
This inflammatory disease should be considered as a whole joint pathology that
encompasses the synovial tissue, the different layers of cartilage and the subchondral bone,
all of which communicate via cell-to-cell interactions, via the release of soluble mediators
and mechanical signals. From the literature is it clear that synovial inflammation (synovitis)
is not a prerequisite for the development of OA, however it is somewhat involved in the
degeneration of cartilage and thus the progression of OA.
During the progressive stages of OA, there is a visible change in the molecular composition
and organization of the ECM, which has been linked to the deterioration in the mechanical
properties of AC. Some of the current research has focused on the role of chondrocytes in
the pathogenesis of these alterations. Chondrocytes are able to respond to sudden structural
and mechanical changes in their surrounding matrix, as well as responding to cytokines and
various inflammatory mediators (Goldring and Marcu, 2009). The architecture and structural
properties of the peri-articular cortical and trabecular bone become compromised, via the
cell mediated processes of re-modelling. During the initial stages of remodelling, osteoclasts
drive bone resorption, which is then followed by a phase of bone formation, driven by
osteoblasts. In normal physiological conditions, the amount of bone lost during the
resorption phase is balanced by the bone gained in the formation phases of bone
remodelling. Thus, there is no change in the bone mass. However, the architecture and shape
of the bone may change (Goldring and Goldring, 2010). The changes to periarticular bone in
OA can be subdivided into varying patterns which include; changes in the subchondral plate
thickness, changes in the structure of the underlying subchondral bone, formation of
osteophytes and the development of subchondral bone cysts. These defined skeletal changes
have been linked to changes in the contours of adjacent articulating surfaces, hence altering
the homogenous structure of the joint, which further contributes to altered biomechanical
properties (Bullough, 2004; Burr, 2004; Radin and Rose, 1986). Radin and co-workers were
the first to propose that an increase in the subchondral bone thickness will cause an increase
in its stiffness. They speculated that these changes in the bone, adversely affected the
biomechanical environment of the cartilage and hence lead to the structural changes.
Furthermore, they also made a link between the ability of the adjacent AC to adapt to
mechanical load, as a result of the changes in contour and shape to the subchondral plate

27
(Radin and Rose, 1986), which was later validated by advances in radiography (Buckland-
Wright, 2004).
Of the cases of OA reported in the literature, the most common area of OA is the medial
compartment of the knee (Andriacchi, 1994; Wise et al., 2012). This is due to the fact that it
is subject to greater loads than the lateral compartment. During the development stages of
the knee, cartilage thickens in areas that undergo greater loading conditions through the
whole joint. This therefore, has an effect on the tibiofemoral mechanics and hence plays a
role in the development of OA. Alteration to normal gait mechanics, can change the normal
gait patterns under weight-bearing activities; from areas of cartilage which are not adapted
to receiving these kinds of loads (Andriacchi et al., 2009; Carter et al., 2004). The aberrant
loading of these areas causes the cartilage to become damaged, adversely affecting its
mechanical properties.
Injury to AC or other tissue structures within the joint (anterior cruciate ligament) (Chaudhari
et al., 2008) as well as the aging process associated with cartilage, all increase the joint laxity.
This allows for aberrant motion between the opposing surfaces. At the micro molecular level,
this causes fibrillation to the collagen network, loss of proteoglycans, increased surface
friction and shear stress, as well as an up-regulation of catabolic factors. This cascade of
events, further exacerbates the progression of OA secondary to the damage caused to the
AC or the other soft tissues (Vincent et al., 2012; Guilak, 2011).
By and large, chondrocytes are able to modulate their activity in responses to loading and
various other factors. However, their ability to modify and repair the surrounding ECM is
limited, when compared to the skeletal cells in bone. Therefore, the divergence in adaptation
of these two tissue cells disrupts the physiological association between cartilage and bone,
which is primordial for the safeguarding of normal joint structure and function and could
further contribute to the progression of OA.
Other than pro-inflammatory cytokines and mediators, biomechanical factors also play a
crucial role in the events that lead to the commencement and evolution of OA. Under normal
physiological conditions; the ECM is able to remain in a constant state of ‘slow-turnover’,
exhibited by a homeostatic balance between anabolic and catabolic events of chondrocytes.
This steady state is regulated through the processing of environmental and soluble mediators
(cytokines and growth factors), matrix composition and bio-physical factors; including
mechanical or interstitial pressure (Guilak, 2011). However, a shift in the direction of
degeneration of AC, is indicative that the balance of normal metabolic activity of
chondrocytes has been severely compromised. Current research has shown growing
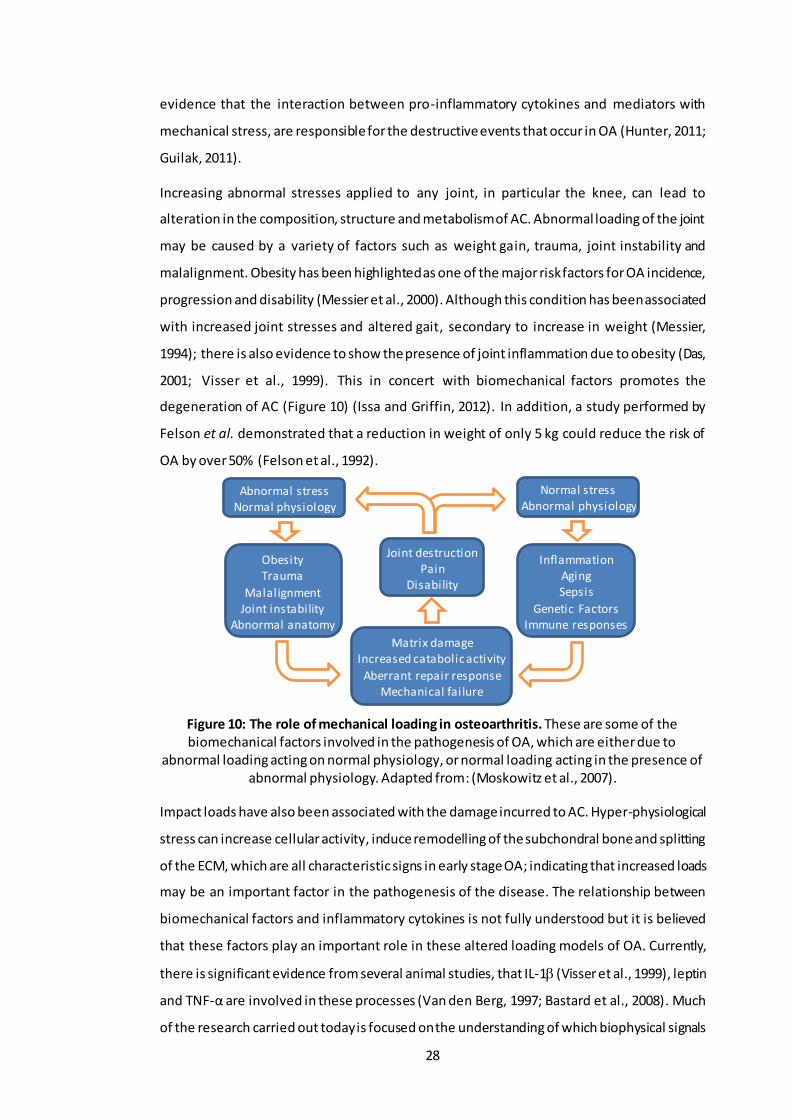
28
evidence that the interaction between pro-inflammatory cytokines and mediators with
mechanical stress, are responsible for the destructive events that occur in OA (Hunter, 2011;
Guilak, 2011).
Increasing abnormal stresses applied to any joint, in particular the knee, can lead to
alteration in the composition, structure and metabolism of AC. Abnormal loading of the joint
may be caused by a variety of factors such as weight gain, trauma, joint instability and
malalignment. Obesity has been highlighted as one of the major risk factors for OA incidence,
progression and disability (Messier et al., 2000). Although this condition has been associated
with increased joint stresses and altered gait, secondary to increase in weight (Messier,
1994); there is also evidence to show the presence of joint inflammation due to obesity (Das,
2001; Visser et al., 1999). This in concert with biomechanical factors promotes the
degeneration of AC (Figure 10) (Issa and Griffin, 2012). In addition, a study performed by
Felson et al. demonstrated that a reduction in weight of only 5 kg could reduce the risk of
OA by over 50% (Felson et al., 1992).
Figure 10: The role of mechanical loading in osteoarthritis. These are some of the biomechanical factors involved in the pathogenesis of OA, which are either due to
abnormal loading acting on normal physiology, or normal loading acting in the presence of abnormal physiology. Adapted from: (Moskowitz et al., 2007).
Impact loads have also been associated with the damage incurred to AC. Hyper-physiological
stress can increase cellular activity, induce remodelling of the subchondral bone and splitting
of the ECM, which are all characteristic signs in early stage OA; indicating that increased loads
may be an important factor in the pathogenesis of the disease. The relationship between
biomechanical factors and inflammatory cytokines is not fully understood but it is believed
that these factors play an important role in these altered loading models of OA. Currently,
there is significant evidence from several animal studies, that IL-1 (Visser et al., 1999), leptin
and TNF-α are involved in these processes (Van den Berg, 1997; Bastard et al., 2008). Much
of the research carried out today is focused on the understanding of which biophysical signals
Joint destruction Pain
Disability
Abnormal stress Normal physiology
Obesity Trauma
Malalignment Joint instability
Abnormal anatomy
Matrix damage Increased catabolic activity
Aberrant repair response Mechanical failure
Inflammation Aging Sepsis
Genetic Factors Immune responses
Normal stress Abnormal physiology

29
are converted into biochemical signals by chondrocytes; in an attempt to better understand
cartilage physiology and hence the pathogenesis of OA. Several in vitro studies have used a
range of different loading configurations of explanted cartilage to show that static
compression inhibits matrix biosynthesis; and cyclic and intermittent compression stimulates
chondrocyte metabolism (Guilak et al., 1994; Torzilli and Grigiene, 1998; Bonassar et al.,
2000). Later studies elaborated that excessive loading, consisting of high loads for an
extended period of time had a deleterious effect; resulting in cell death, swelling and tissue
disruption (Torzilli et al., 1999; Milentijevic et al., 2003). The reasoning behind these
destructive events has been described by many to be due to: the interpretation of these
physical signals by chondrocytes through the integrated action of various ion channels;
integrin-mediated connections to the ECM and membrane deformations (Kock et al., 2009;
Ramage et al., 2009; Mobasheri et al., 2010). The peri-celluar matrix (PCM), which is a shell
of collagen fibres encapsulating the chondrocytes, acts like a transducer of the mechanical
and physiochemical signals in the cell environment. The PCM together with its enclosed cell
form the functional unit known as the chondron. The signals detected by the PCM can
influence chondrocyte metabolism, cartilage homeostasis and overall joint health (Halloran
et al., 2012). Some studies have commented on the ability of the PCM along with the ECM to
regulate the conversion of mechanical loading to physicochemical changes that can be
sensed by the chondrocyte (Lai et al., 1991; Mow et al., 1999). These signals can lead to the
over production of inflammatory mediators such as cytokines (Chauffier et al., 2012),
chemokines and prostaglandins (Gosset et al., 2006). These cytokines are also expressed in
the chondrocytes and cells of the subchondral bone when a certain threshold is reached
(Sanchez et al., 2012).
Taking into consideration all the points above, it is evident that the inflammatory cytokine
network contributes to the pathogenesis of OA. Increased amounts of these pro-
inflammatory cytokines in cartilage, subchondral bone and synovium are all believed to be
pivotal to the development and progression of the structural and functional changes in the
OA joint. Synovitis, has been shown to be one of the major contributors to the symptom
severity of OA, the rate of cartilage degeneration, as well as the progression of OA from early
to late stage. The aging process and a population increasing in weight, are also factors that
can affect joint morphology, cell metabolic activity and mechanical properties of dif ferent
underlying tissues, associated with the onset and progression of OA. The view of OA is one
that has changed vastly over the years. It is now seen as a complex, multi-etiological disease,
in which the underlying molecular and biochemical changes are still poorly understood.
Focus has to be made in our understanding of the individual roles, mechanism and functions

30
of the several cytokines (IL-1β & TNF-α) and MMPs (MMP-3, MMP-9 & MMP-13). This
fundamental knowledge will be key to uncovering the underlying disease mechanisms, which
will in turn give better solutions for the treatment of OA at both early and late stages.
1.4 Cartilage Treatments and Research
1.4.1 Early Intervention for Cartilage Defects
Early intervention to repair cartilage defects is desirable in order to prevent or delay disease
progression to OA. In any patient with cartilage defects, the aim is to provide them with a
means by which they will no longer experience pain or discomfort in their joint, and are able
to regain normal activities. There are many different therapeutic approaches to achieve this:
viscosuplementation, steroid injections, surgical procedures and more recently tissue
engineering approaches. The following section will discuss these treatments and their
efficacy as well as highlighting current research relevant to this thesis.
1.4.1.1 Pharmacological Treatment
Non-steroidal anti-inflammatory drugs (NSAIDs) and are a form of palliative treatment for
the early signs of OA. They aim to reduce/manage pain in symptomatic patients by reducing
inflammation and restoring mobility. The drugs include painkillers or specific drugs that aim
to control/inhibit the production of inflammatory mediators (e.g. MMPs, aggrecanase’s, IL-
1β, COX-2 and cathepsins) (Hunter and Matthews, 2011). Examples of oral NSAIDs and
topical NSAIDs are discussed by Strand et al (Strand et al., 2011) and Roth et al (Roth and
Fuller, 2011) respectively.
1.4.1.2 Viscosupplementation
As OA progresses further, the analgesic properties of NSAIDS prove insufficient and therapy
can be supplemented via intra-articular injections of hyaluronic acid and/or corticosteroids.
Glucosamine, CS and hyaluronic acid (HA) have all been tested as successful
viscosupplements, with hyaluronic acid being used most frequently (Vangsness et al., 2009;
Miller and Clegg, 2011; Sherman et al., 2012; Migliore and Procopio, 2015; Vasiliadis and
Tsikopoulos, 2017). HA is a naturally occurring polymer found in the synovial fluid, which
becomes sparse in OA synovial fluid.
HA has been vastly researched for its efficacy in controlling pain, reducing inflammation in
OA joints and improving joint motion (Chang et al., 2013; 2011; Leighton et al., 2014). Most
of the HA therapies available require multiple injections (3 to 5); in order to attain the desired
results, due to the rapid degeneration of HA within the joints (Altman et al., 2004). The
stabilisation and hence consequent durability of HA within the joint, may reduce the number

31
of injections required to attain a longer-term result in the treatment of OA (Chevalier et al.,
2010). Therefore, a single injection of HA therapy was introduced as an alternative in terms
of logistics, cost and tolerability. This not only ensured comfort, but also safety to the
patients by removing the risk associated with frequent injections. Altman et al demonstrated
the efficacy and safety of a single intra-articular injection of non-animal stabilized hyaluronic
acid (NASHA), in patients with knee OA. This 26 week randomized, double blind, multicentre
study showed that there was no statistical difference between patients injected with NASHA
and those given the placebo (saline solution) (Altman et al., 2004). The nature in which this
study was carried out however, via the inclusion of patients with OA at other sites may have
skewed the overall results; as there were significant benefits seen over the placebo when
the patients selected had OA confined to the knee. Therefore, future studies that scrutinize
a local therapy should consider stratifying the population to those that have OA in a single
joint. A similar study by Borras-Verdera et al., also investigated the efficacy and safety,
alongside the long-term effects, of a single intra-articular injection of 2% HA + 0.5% mannitol
in knee OA patients (Borrás-Verdera et al., 2013). This study was the first to show that a
single intra-articular injection of HA was an effective treatment for knee OA as it significantly
reduced pain, increased joint functionality and had relatively low incidences of adverse
effects.
While clinical studies seem to provide evidence for the therapeutic value of HA injections; in
vitro studies on the boundary lubrication capabilities of HA are still a matter of debate, as
discussed in Section 1.2.5.2. Nevertheless, any form of viscosuplementation is only really
considered as an early stage intervention and in most cases to prolong the time before
surgical intervention. Currently, there is little evidence supporting the effectiveness of
viscosuplementation in severe cases of surface and underlying tissue damage in AC.
1.4.2 Surgical Procedures for Cartilage Repair
There are several therapeutic approaches to treat individuals with cartilage lesions that if left
untreated could lead to OA. These include different types of arthroscopy procedures such as
lavage, debridement and micro-fracture.
1.4.2.1 Surgical Interventions without cells
1.4.2.1.1 Lavage
Lavage has been reported to be beneficial to patients with cartilage lesions and painful knee
joints. This arthroscopic procedure involves a simple thorough rinse of the joint, to remove
any tissue debris within the joint space (Livesley et al., 1991). However, this procedure has
only proven successful in a handful of patients and in some studies success, has been shown

32
to be attributed to the ‘placebo effect of surgery’. There are currently no convincing scientific
or biological explanations which can be related to the benef icial effects of this technique.
However, some reports indicate that the effects last up to 1 year or more. It has been
speculated that the extensive rinsing, may remove some of the intra-articular active pain
signalling molecules. Hunziker et al. added that the removal of proteoglycans and aggrecan
molecules from the cartilage surface, could promote adhesion of repair cells, which could
promote an anti-inflammatory response (Hunziker and Kapfinger, 1998). Nonetheless,
evidence is lacking in the literature to support the use of this surgical technique, and most
studies comment that there is no substantial relief of pain in patients who have undergone
lavage treatment (Gibson et al., 1992; Ontario, 2005).
1.4.2.1.2 Debridement
Debridement involves the removal of free bodies from the joint space as well as excision of
osteophytes (Gibson et al., 1992). There is no substantial evidence from in vivo studies of
beneficial biological effects of this procedure. In addition to this, both experimentally
(Messner et al., 2001) and clinically (Neyret et al., 1994), this procedure has been shown to
aggravate the OA condition. Several clinical studies (Sprague, 1981; McGinley et al., 1999;
Kruger et al., 2000) , have reported variable findings, ranging from good pain relief in about
65% of patients, through to moderate pain relief in 50% of patients to very poor pain relief;
nevertheless even when results have been reported to be good, it is stressed in the literature
that pain relief is only temporary.
1.4.2.1.3 Microfracture
This is a type of reparative treatment is for chondral lesions usually less than 2-3 cm in
diameter, for patients who have moderate demands due to their lifestyles (Detterline et al.,
2005). This treatment involves the drilling of holes (0.5-1 mm in diameter (Knutsen et al.,
2004) and 3 mm in depth (Mithoefer et al., 2005)) through the bone and into the bone
marrow cavity. This procedure allows for direct access to the bone marrow, exposing the
underlying mesenchymal stem cells (MSCs). These stem cells are believed to initiate the
healing process and lead to the formation of fibrocartilage. Microfracture has been widely
used; however, it has been reported to only have a short-term improvement in the joint
function. The majority of reviews of medium to long term studies, have reported that the
tissue formed is not hyaline-like. This is mainly due to the initial hyaline-like tissue formed
becoming fibrous in nature and deteriorating as a result of the sub-optimal biomechanical
properties of the repair tissue (Matsiko et al., 2013). Unfortunately, this repair tissue
eventually fails. Therefore, this type of treatment option only serves to delay the eventual
requirement for other reparative methods, or joint replacement in more severe cases. This

33
said, microfracture can often be combined with other treatment methods to give more
promising results in the long term (Nukavarapu, S. P.; Dorcemus, D. L., 2013; Matsiko et al.,
2013).
All these operative approaches only result in the short term, temporary removal of pain and
do not really have any effect in the long term. In some extreme cases, there have been
incidences where these techniques have led to osteonecrosis (Rozbruch et al., 1996);
reactive synovitis, chondrolysis and an acceleration of articular degeneration (Tabib et al.,
1999). The more common problem is however, that these procedures aim to repair the
damaged areas of the cartilage surface, by stimulation of growth of new cartilage tissue.
However, these techniques form tissue that is variable in composition, structure and
durability. In most cases, they form what is known as fibrocartilage, which is significantly
inferior mechanically, to healthy hyaline AC. Inevitably this fibrous repair tissue is prone to
failure and therefore the patient’s symptoms return. Hence, there is hope for more advanced
techniques such as those with viable cells, biomaterials and tissue engineered solutions, that
they may have more favourable success rates. These advanced approaches are speculated
to reproduce better the composition, structure and durability of the original healthy
cartilage. Conversely, as they have not all yet been tested in animals and/or patients, the
potential success of more advanced treatments is unknown.
1.4.2.2 Surgical Interventions with cells
Autologous chondrocyte implantation (ACI) is a procedure that is used to treat knee cartilage
defects. The aim of this treatment is to regenerate hyaline or hyaline-like cartilage, thereby
restoring normal joint function. In the literature, there are three generations of ACI. They
have small differences between them, contributing to their success or failure in patients. This
section will systematically review each of the generations of ACI from earliest to present
literature.
1.4.2.2.1 Autologous Chondrocyte Implantation ACI- 1st Generation
The first generation ACI, originally reported by Brittberg et al. in 1994 (Brittberg et al., 1994),
was defined as a two-stage procedure. The first stage involved arthroscopic biopsy, where
200 to 300 mg of articular cartilage is removed, from a non-weight bearing area of the joint,
usually the femoral condyle or inter-condular notch (The Center for Orthopaedics & Sports
Medicine, 2003; Brittberg et al., 1994). Chondrocytes are isolated and cultured for about 4
to 5 weeks to expand the cell population by a factor of about 50 (The Center for Orthopaedics
& Sports Medicine, 2003; Brittberg et al., 1994). The second stage involves an open surgical
procedure (arthrotomy) where the defected area undergoes removal of the dead/damaged
34
cartilage and smoothing the surrounding living cartilage (The Center for Orthopaedics &
Sports Medicine, 2003; Brittberg et al., 1994). Periosteum taken from the patient’s tibia
(Figure 11) is then sutured over the defect area and the circumference secured with fibrin
glue (2nd Generation ACI). This creates a watertight patch in to which the autologous cultured
chondrocytes are injected, where they grow and mature over time (Brittberg et al., 1994).
It is clear from the literature that there has been some controversy between the use of 1st
generation periosteum-ACI cover (PACI) and the collagen-ACI cover (CACI). The CACI is made
up of a type I/III bilayer collagen membrane derived from porcine peritoneum and skin,
which is able to resorb within the body in a matter of months. Bently et al., reported that the
PACI, acts as a watertight seal and that using a CACI, brought about the same if not better
results in patients (Bentley et al., 2003). The study showed promising results, with 51/58
(88%) patients (46 underwent CACI and 12 underwent PACI); showing excellent results
favouring this hypothesis. Gooding et al. carried out a more recent study, consisting of a two-
year follow-up of both of the ACI techniques, showing very similar results (Gooding et al.,
2006). Furthermore, Gooding et al. (Gooding et al., 2006); reported that 26/35 (74%) of
patients, treated by CACI had good-excellent results compared to 22/33 (67%) of patients,
treated by PACI. They concluded that the PACI technique is not essential for the development
and maturation of hyaline cartilage repair and that the CACI technique is better than PACI.
This was attributed to its decreased invasive procedure and lower resorption rate compared
to the high incidence of graft hypertrophy, delamination and failure rate of the PACI;
reported in many recent studies (Minas, 2001; Minas and Bryant, 2005; Zaslav et al., 2009;
Harris et al., 2011).
Figure 11: Autologous chondrocyte implantation procedure using tibial periostuem for cartilage repair (Smith, 2005).
1.4.2.2.2 ACI - 2nd Generation
Second generation ACI, also defined as a two-stage procedure, involves an initial
arthroscopic biopsy and either an open arthrotomy; or a favoured arthroscopic implantation

35
of the cultured chondrocytes through cell-seeded, 3-dimensional, bio-absorbable scaffolds
(Kon et al., 2008). This technique is somewhat similar to first generation ACI. The difference
is that due to advanced methods, prior chondrocyte seeding and the ability for secure graft
fixation without sutures means that there is no need for an open arthrotomy, allowing for
an all arthroscopic procedure (Marcacci et al., 2002). Several studies using one of the most
common 2nd generation ACI (Hyalograft C), show that this technique provides good structural
support, allowing for cell to cell contact, cluster formation and ECM production leading to
excellent clinical results (Grigolo et al., 2002; Kon et al., 2009; Knutsen et al., 2010). However,
despite these favourable clinical results, most of the reported clinical studies are only short
to medium term follow ups. Additionally, as reported earlier with the 1st generation
techniques, many different approaches may seem favourable in the short term, but the
quality of the repair tissue might be influenced in long term results. More recent studies by
Gobbi et al. (Gobbi et al., 2009) and Nehrer et al. (Nehrer et al., 2009), have aimed at
reviewing the outcomes of 2nd generation ACI after 5 and 7 year follow-ups, respectively.
These studies have reported this specific technique to have good clinical outcomes compared
to the 1st generation ACI techniques. However, as a result of the increased complexity of this
type of procedure and its method of implantation, there were several drawbacks highlighted
by Nehrer et al. They reporterd that the procedure was only successful with young patients
sustaining single cartilage defects and implant hypertrophy was high. Although not many
cases were reviewed in that particular study, it agrees with the later findings of Gobbi et al.
(Gobbi et al., 2009) and Marcacci et al. (Marcacci et al., 2005). They added that although this
method can be very patient specific, it is advantageous in terms of easy handling and
application of graft material through minimally invasive techniques. Hence, shortening
surgical time and post-operative care of patients (Gobbi et al., 2009; Harris et al., 2011).
Nonetheless, further long-term studies (10 years plus) are required to assess the durability
of the tissue repair produced using this 2nd generation technique, which will help in further
identifying this approach is patient specific or whether it can be used for all types of patients.
1.4.2.2.3 ACI - 3rd Generation
Third generation ACI can be either defined as a one or a two-stage process. It can either
consist of an arthroscopic or open surgery, with the implantation of a 3-dimensional matrix
containing in vitro treated autologous chondrocytes. This particular type of approach uses a
matrix associated chondrocyte implantation technique (MACI), which consists of either a
protein based polymer, such as collagen or fibrin, or carbohydrate based matrix such as a
hyaluronic acid sponge.

36
Trattnig et al., demonstrated the use of a collagen type I/III MACI and a hyaluronic acid
sponge, in 20 human patients to test cartilage regeneration over 52 weeks using high
resolution non-invasive magnetic resonance imaging (MRI) (Trattnig et al., 2005). They
concluded that both MACI techniques were able to completely fill the defect in terms of
thickness, length and homogenous structure, producing regenerated cartilage similar to that
of native hyaline cartilage (Trattnig et al., 2005). The reason behind the increasing success of
these third-generation ACI techniques is the fact that they do not have to be sutured onto
the defect like the PACI & CACI; instead fibrin glue is used, which not only reduces operating
times if multiple grafts are needed, but allows for a minimally invasive approach. In addition,
the seeding of autologous chondrocytes onto a larger, rougher, less tightly woven collagen
type I/III membrane structure (Figure 12), allows for better attachment and even distribution
of cells over the implant (Cherubino et al., 2003).
Figure 12: Diagrammatic representation of the collagen I/III membrane showing rough and smooth side (Gibson et al., 2006).
There have been an increasing number of studies comparing the effectiveness of MACI (3rd
generation) over the CACI (2nd generation) approaches (Gibson et al., 2006). A 7-year study
by Rogers et al. reported improved clinical outcome scores for both approaches, with better
improvements seen in patients implanted with MACI (Rogers et al., 2010). However, a similar
12-month study showed an increase in knee scores for both approaches, with no significant
difference in patient satisfaction between the two approaches (Bartlett et al., 2005). This
could be associated with the fact that the MACI operation was performed as an open
procedure (arthrotomy) as opposed to an arthroscopic surgery. MACI tends to lend itself for
arthroscopic implantation techniques and has shown better long-term results in terms of
increased range of motion, decreased pain and decreased post-operative recovery (Laffargue
et al., 1999). Although there have been reports of technical difficulties with this arthroscopic
procedure, this MACI technique is still in its infancy with the potential to do well (Erggelet et
al., 2003; Marcacci et al., 2002).
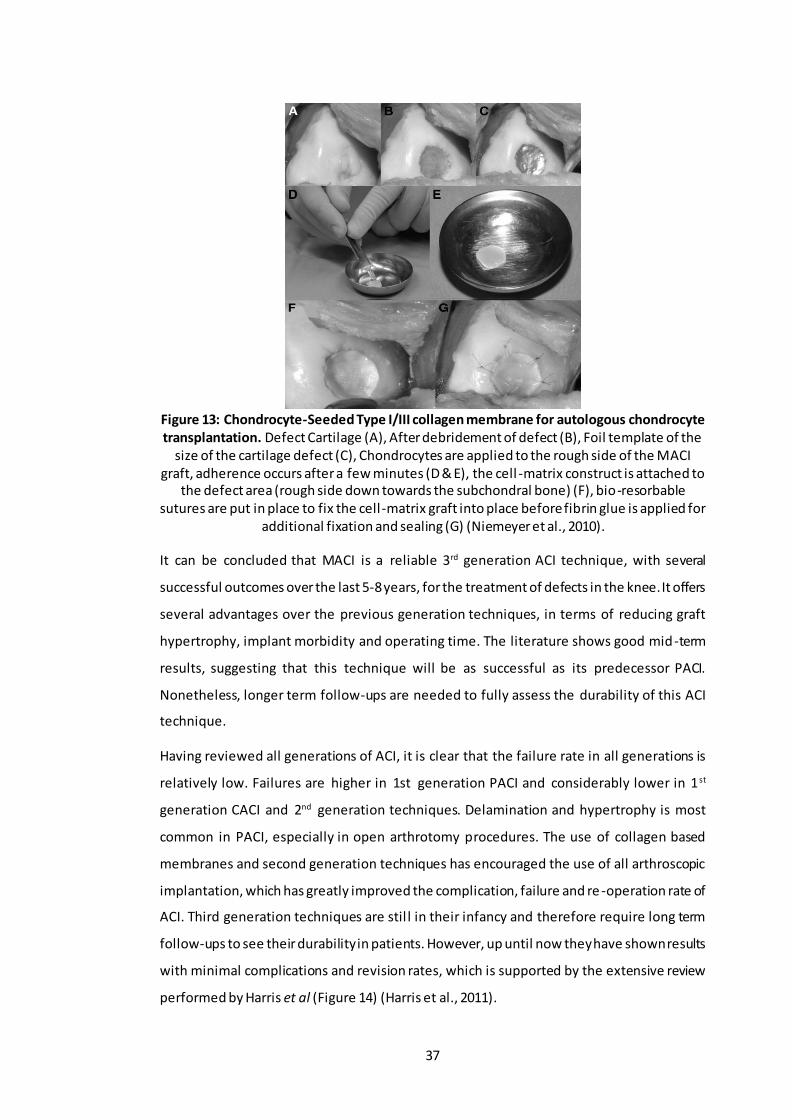
37
Figure 13: Chondrocyte-Seeded Type I/III collagen membrane for autologous chondrocyte transplantation. Defect Cartilage (A), After debridement of defect (B), Foil template of the
size of the cartilage defect (C), Chondrocytes are applied to the rough side of the MACI graft, adherence occurs after a few minutes (D & E), the cell -matrix construct is attached to
the defect area (rough side down towards the subchondral bone) (F), bio-resorbable sutures are put in place to fix the cell-matrix graft into place before fibrin glue is applied for
additional fixation and sealing (G) (Niemeyer et al., 2010).
It can be concluded that MACI is a reliable 3rd generation ACI technique, with several
successful outcomes over the last 5-8 years, for the treatment of defects in the knee. It offers
several advantages over the previous generation techniques, in terms of reducing graft
hypertrophy, implant morbidity and operating time. The literature shows good mid-term
results, suggesting that this technique will be as successful as its predecessor PACI.
Nonetheless, longer term follow-ups are needed to fully assess the durability of this ACI
technique.
Having reviewed all generations of ACI, it is clear that the failure rate in all generations is
relatively low. Failures are higher in 1st generation PACI and considerably lower in 1st
generation CACI and 2nd generation techniques. Delamination and hypertrophy is most
common in PACI, especially in open arthrotomy procedures. The use of collagen based
membranes and second generation techniques has encouraged the use of all arthroscopic
implantation, which has greatly improved the complication, failure and re -operation rate of
ACI. Third generation techniques are stil l in their infancy and therefore require long term
follow-ups to see their durability in patients. However, up until now they have shown results
with minimal complications and revision rates, which is supported by the extensive review
performed by Harris et al (Figure 14) (Harris et al., 2011).
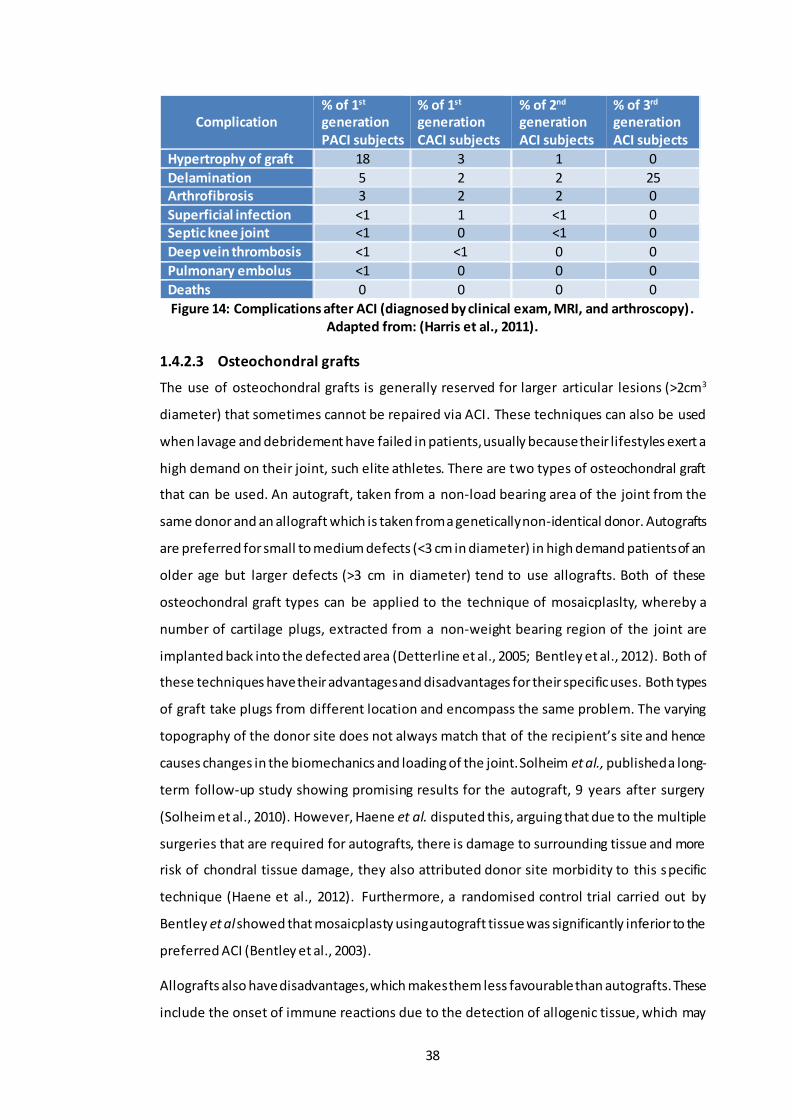
38
Complication % of 1st generation PACI subjects
% of 1st generation CACI subjects
% of 2nd generation ACI subjects
% of 3rd generation ACI subjects
Hypertrophy of graft 18 3 1 0
Delamination 5 2 2 25 Arthrofibrosis 3 2 2 0
Superficial infection <1 1 <1 0 Septic knee joint <1 0 <1 0
Deep vein thrombosis <1 <1 0 0
Pulmonary embolus <1 0 0 0
Deaths 0 0 0 0
Figure 14: Complications after ACI (diagnosed by clinical exam, MRI, and arthroscopy). Adapted from: (Harris et al., 2011).
1.4.2.3 Osteochondral grafts
The use of osteochondral grafts is generally reserved for larger articular lesions (>2cm3
diameter) that sometimes cannot be repaired via ACI. These techniques can also be used
when lavage and debridement have failed in patients, usually because their lifestyles exert a
high demand on their joint, such elite athletes. There are two types of osteochondral graft
that can be used. An autograft, taken from a non-load bearing area of the joint from the
same donor and an allograft which is taken from a genetically non-identical donor. Autografts
are preferred for small to medium defects (<3 cm in diameter) in high demand patients of an
older age but larger defects (>3 cm in diameter) tend to use allografts. Both of these
osteochondral graft types can be applied to the technique of mosaicplaslty, whereby a
number of cartilage plugs, extracted from a non-weight bearing region of the joint are
implanted back into the defected area (Detterline et al., 2005; Bentley et al., 2012). Both of
these techniques have their advantages and disadvantages for their specific uses. Both types
of graft take plugs from different location and encompass the same problem. The varying
topography of the donor site does not always match that of the recipient’s site and hence
causes changes in the biomechanics and loading of the joint. Solheim et al., published a long-
term follow-up study showing promising results for the autograft, 9 years after surgery
(Solheim et al., 2010). However, Haene et al. disputed this, arguing that due to the multiple
surgeries that are required for autografts, there is damage to surrounding tissue and more
risk of chondral tissue damage, they also attributed donor site morbidity to this specific
technique (Haene et al., 2012). Furthermore, a randomised control trial carried out by
Bentley et al showed that mosaicplasty using autograft tissue was significantly inferior to the
preferred ACI (Bentley et al., 2003).
Allografts also have disadvantages, which makes them less favourable than autografts. These
include the onset of immune reactions due to the detection of allogenic tissue, which may

39
carry a risk of disease transmission, reported in a few cases (Haene et al., 2012). Conversely,
Gortz et al. promoted the use of these grafts, their results showed good to excellent
outcomes in up to 80% of cases and most importantly that the larger defects were
successfully filled. A very recent study focusing on the outcomes of allograft transplantation
in the knee showed favourable outcomes and high satisfaction rates in patients who had an
intermediate follow up. They noted that patients with certain etiologies tended to have more
favourable results as did younger patients, but there were too few in this study for it to be
conclusive (Chahal et al., 2013).
Many of the studies mentioned, particularly the latter, have failed to produce prospective
cohort studies in which several comparative cohorts are included. This would further help
evaluate the efficacy of osteochondral grafts as a reparative treatment for cartilage defects.
Nonetheless it is clear from the literature that autografts are preferred over allografts simply
because of no immune rejection and better integration with surrounding tissue (Chahal et
al., 2013; Versier and Dubrana, 2011).
1.4.2.4 Joint Replacement
When cartilage degeneration is severe beyond repair, the only option left is to replace the
joint with a prosthetic device. These prosthetic devices are known as total joint replacement
(TJR). TJR consists of replacing the damaged bone and AC surface with hard smooth bearing
components. In the knee, the most common choice of material is metal-on-polyethylene,
however ceramics are also being introduced to replace the metal femoral component (Voss
et al., 2016; Bergschmidt et al., 2016; Nakamura et al., 2017). This TJR will not only relieve
the patient from pain, but it will also improve their quality of life. While the expected lifetime
of these conventional TJR is harder to determine, it is not unlimited (Atkinson, 2017).
Nevertheless, patients today can look forward to potentially benefitting from new advances
that could increase the lifetime of these TJR (Kunčická et al., 2017).
1.4.3 In Vitro Tissue Engineering of Cartilage
The failure of the aforementioned regenerative techniques is mainly due to the insufficient
filling of the defect area and the fact that the tissue regenerated is fibrous in nature (Huang
et al., 2016). These various surgical/therapeutic approaches have resulted in the formation
of fibrocartilage, which is weak in its biomechanical properties compared to the desirable
hyaline cartilage found at healthy joints (Cancedda et al., 2003). The ideal treatment would
be one in which early cartilage defects are repaired by promoting the formation of hyaline
cartilage in vivo. Other ways of treating cartilage defects, in the short term, could be to

40
reduce the further degeneration of cartilage by being able to restore the biochemical and
biophysical properties of the damaged cartilage as a result of OA.
Tissue engineering of cartilage is a method by which this might be achieved. In situ tissue
engineering approaches, such as ACI have undergone a great deal of change and
development in the past few years as discussed above. Moving on from this approach are in
vitro tissue engineering approaches that focus on developing cartilage constructs for
implantation. It involves isolating and expanding cells in vitro; seeding them onto biomaterial
scaffolds; culturing the cell/scaffold complex to create cartilage equivalents and then finally
implanting them back into the body to repair the tissue defect. Choice of cell source is an
important factor to be considered as some cells are harder to obtain than others, with many
of them not differentiating before they are implanted into the patient (Chung and Burdick,
2008). This following section will systematically review the success of some of the cells
sources; as well as some of the material types used in tissue engineering of cartilage,
highlighting the reasons for their use and limitations.
1.4.3.1 Cell Source
To this day the optimal choice of cell source has not been identified. However, there is some
evidence that the preferred choice of cells is chondrocytes (Chung and Burdick, 2008).
Chondrocytes are the naturally occurring cells in cartilage, therefore they do not need to be
pre-differentiated in vitro. But, the difficulty comes when these cells have to be expanded,
as they have a tendency to dedifferentiate. Nevertheless, the use of growth factors and
chondro-inducive biomaterials upon which the chondrocytes are seeded, may overcome this
problem. A list of the cell sources used to date, where they are taken from, and their
limitations is given in Table 3.
Table 3: The different cell sources that have been investigated for use in tissue engineering cartilage, along with the respective reasons for selecting them and their
limitations for use.
Chondrocytes
Chondrocyte cells can be obtained from articular (Mesa et al., 2006; Li et al., 2004; Bhattacharjee et al., 2015) , auricular (Van Osch et al., 2004; Panossian et al., 2001; Lohan et al., 2014; El Sayed
et al., 2010; El Sayed et al., 2013; Ishibashi et al., 2017) costal (Tay et al., 2004; Johnson et al., 2004; El Sayed et al., 2010) or nasoseptal (El Sayed et al., 2010; El Sayed et al., 2013) cartilage.
Reason for Choice
(Huang et al., 2016)
- Found in native cartilage - Natural choice of cell source. - Have been extensively studied in their role of producing, maintaining
and remodelling the ECM (Chung and Burdick, 2008; Li et al., 2004).

41
Limitations (Vinatier and
Guicheux, 2016; Correa and
Lietman, 2017)
- Limited number of them found within native cartilage, therefore need for expansion (Huang et al., 2016).
- Expansion in a monolayer causes dedifferentiation of the chondrocytes
(Tay et al., 2004; Li et al., 2004; Albrecht et al., 2011), resulting in decreased production of proteoglycan and collagen type II and hence increased production of collagen type I (Chung and Burdick, 2008; Van Osch et al., 2004).
- To minimize this problem, authors have suggested decreasing the passage number or optimise the expansion medium components (e.g. specific growth factors, serums and antibiotics) (Huang et al., 2016; Correa and Lietman, 2017; Bhattacharjee et al., 2015).
- Use of other heterotopic chondrocytes such as ‘nasospetal’ or ‘auricular’ chondrocytes are better as alternatives as they are easier to harvest, have lower donor site morbidity and possess higher proliferation rates than articular chondrocytes (El Sayed et al., 2010; El Sayed et al., 2013).
Fibroblasts
Reason for Choice
(French et al., 2004; Lee et al.,
2001)
- Available in greater abundance compared to chondrocytes - Can be directed to express a chondrogenic phenotype (Chung and
Burdick, 2008; French et al., 2004; Zhao et al., 2009; Chee et al., 2016).
Limitations
- Require differentiation in vitro prior to implantation into patients (Chung and Burdick, 2008) which has proved to be difficult.
- However, the use of certain scaffolds and gene expression factors this can be overcome (Zhao et al., 2009).
Stem Cells
Stem cells can be Bone-marrow derived (Li et al., 2005; Chen et al., 2005; Huang et al., 2016; Beane and Darling, 2012), Adipose derived (Huang et al., 2004; Erickson et al., 2002) or
Embryonic (Hwang et al., 2006; Kramer et al., 2000; Beane and Darling, 2012)
Reason for Choice
(Vinatier and Guicheux, 2016)
- Have “multi lineage potential” (Chung and Burdick, 2008). - Can be extracted from a variety of different tissues, making them an
attractive choice for cartilage regeneration (Vinatier and Guicheux, 2016).
- Does not express molecules of the Class II major histocompatibility complex, which are responsible for immune rejection, therefore it has been hinted that this cell type could be immunologically privileged (Noel et al., 2007; Du et al., 2016).
Limitations
- Bone-marrow derived stem cells produce a mechanically weaker matrix than the one produced by native chondrocytes.
- Adipose-derived stem cells produce a low concentration of cartilage specific matrix proteins as well expressing collagen type I.
- Embryonic stem cells have the problems of purification as well as the difficulty in differentiating them into chondrocytes as well as well-known ethical issues (Chung and Burdick, 2008; Fontan et al., 2017).
From the literature reviewed in Table 3, the majority of the cells sourced in these studies
were all taken from one animal species and implanted into another animal of the same
species; to see whether they would express a chondrocytic phenotype and hence produce a

42
new cartilaginous matrix in vivo (Mesa et al., 2006; Van Osch et al., 2004; Panossian et al.,
2001; Johnson et al., 2004). One study in particular demonstrated that the use of articular
chondrocytes from old animals could produce neocartilage in vivo, as well as articular
chondrocytes from young donors (Mesa et al., 2006). Therefore, the authors suggested that
middle-aged and elderly patients could benefit from using their own “aged” articular
cartilage as a source of reparative chondrocytes for cartilage defects owing to the fact that
it was also immunologically beneficial.
There has been growing interest in the use of human autologous chondrocytes in synthetic
scaffold for cartilage regeneration purposes. Human auricular chondrocytes expanded in
vitro using several growth factors; demonstrated their potential to produce cartilage grafts
of high quality compared to costal chondrocytes. Similarly, bone marrow-derived
mesenchymal stem cells (MSCs) on a poly-caprolactone (PCL) scaffold in the presence of
certain chondrogenic growth factors, differentiated to a chondrocytic phenotype. The use of
these autografts seems a practical and effective way to treat cartilage defects in humans,
however the limitations in this technique lies in the multiple operations required before
these scaffolds can be implanted. Nevertheless, the use of animal models is an acceptable
means to investigate the feasibility of different cell sources, for the use in cartilage tissue
engineering.
1.4.3.2 Scaffold Biomaterials
1.4.3.2.1 Natural Biomaterials
Attention has been directed onto natural and synthetic materials for their use as the scaffold
material in cartilage repair. Natural scaffold such as hyaluronic acid, collagen, chitosan,
gelatin and chondroitin sulfate, have been explored as biocompatible and biodegradable
scaffolds for the tissue engineering of cartilage. Despite this, they are prone to variable
enzymatic degradation in the body, indicating they are not sufficiently mechanically stable
for cells to survive in vivo (Chung and Burdick, 2008). Nevertheless, Campoccia et al.
demonstrated through careful chemical modification, that the esterification of a hyaluronic
acid gel, significantly improved its mechanical properties (Campoccia et al., 1998). Moreover,
Grigolo et al. (Grigolo et al., 2001) showed how the development of HYAFF 11 scaffold, an
esterified derivative of hyaluronic acid was able to support in vitro growth of viable
chondrocytes and maintain their chondrogenic phenotype. Furthermore, a study by Facchini
et al. (Facchini et al., 2006) showed that the same three-dimensional scaffolds seeded with
autologous chondrocytes improved the regeneration of cartilage in vivo. This 3D Scaffold is
now a commercially available product called Hyalograft-C and has been successfully
implanted into human patients with knee cartilage defects, as a tissue engineered

43
regeneration approach to cartilage repair. A 5-year clinical trial showed promising results
post-operatively (Marcacci et al., 2002; Chung et al., 2006; Facchini et al., 2006). Despite
supportive evidence of its clinical ability, a review in the Europeans Medicines Agency report
(Withdrawal Assessment Report: Hyalograft C Autograft., 2013), raised issues regarding
quality control and lack of randomisation in Phase III studies. Commercialisation was ceased
in 2013.
Another widely used natural polymer is chitosan, derived from chitin commonly found in the
exoskeleton of crustaceans. Its high cationic charges mean it can be ionically cross-linked
with a variety of polymers, such as chondroitin sulfate, forming a hydrogel. It forms a semi
crystalline biodegradable polymer matrix that can support both chondrogenesis and the
expression of cartilage extracellular matrix proteins (Suh and Matthew, 2001; Lahiji et al.,
2000). An in vivo study by Lu et al. showed that a chitosan injection effectively repaired
defects of rat knee cartilage (Lu et al., 1999). Like hyaluronic acid, chitosan also has poor
mechanical strength and elasticity. However, these can be improved by the addition of a
cross linker. Mwale et al. showed that the use of chitosan cross-linked with genipin, provided
a hydrogel for cartilage tissue engineering (Mwale et al., 2008). Similarly, Yan et al. and
Hrabhack et al. found that this combination was successful in the treatment of osteochondral
knee defects in rabbits. The crosslinked material was biocompatible and non-immunogenic,
which is a common trait of some natural polymers (Yan et al., 2010; Hrabchak et al., 2010;
Jeong and Hollister, 2010).
Figure 15: Hyalograft-C scaffold displayed as a commercialised product (left), MTT assay showing the encapsulated chondrocytes in an Injectable chitosan-based hydrogel for
cartilage tissue engineering (Anika Therapeutics).
The chemical functionalization of hydrogels has been pursued further by Soppimath et al., to
develop a ‘native-like’ environment for cells. These so called “smart” biomaterials have the
ability to reversibly gel in response to temperature, ultraviolet light and pH whilst still
maintaining the cell viability (Soppimath et al., 2002). This advantageous characteristic
means they could be minimally invasively injected into the recipients and form in situ at the

44
defect site, reducing postoperative recovery. Moreover, these biomaterials could play a
useful role as carriers, to deliver growth factors that could be released in a controlled
manner. Subsequently, stimulating chondrogenic differentiation and in vivo proliferation.
Wu et al., demonstrated the significance of slow release growth factors, such as transforming
growth factor (TGF- β1) in the promotion of chondrocyte proliferation and matrix synthesis
(Wu et al., 2011). Similarly, Kim et al. (Kim et al., 2003) and Lee et al. (Lee et al., 2004) showed
that a combination of TGF-β1 and the insulin growth factor (IGF-1) in microspheres of
chitosan; increased the cartilage ECM synthesis and enhanced the proliferation of
chondrocytes in the defected area.
Unfortunately, most of the aforementioned studies utilising hyaluronic acid and chitosan
have been short term, very few with FDA approval. The majority of the studies were
conducted in animal models, such as nude mice. These promising techniques need to be
moved forward into larger animal models, or even clinical trials to test their long term
regenerative capacity.
Nevertheless, advances have been made in the production of natural scaffolds for cartilage
repair that have undergone extensive animal studies or/and some that have gone through
phases I-III clinical trials. These clinical products are summarised in Table 4. The efficacy and
success of these clinical products was measured through several common outcome
measures. To list a few: International knee documentation committee (IKDC) score; knee
injury and osteoarthritis outcome score (KOOS); western ontario and McMaster universities
osteoarthritis index (WOMAC); visual analogue scale (VAS) for pain; international cartilage
repair system (ICRS) score and the magnetic resonance observation of cartilage repair tissue
(MOCART) score. The majority of these are forms/questionnaires; in which treated patients
fill in questions about how they feel with their new implant. Other methods include medical
evaluations of MRI images and evaluating range of motion (ROM) that patients are able to
achieve. Although these questionnaires can be subjective; they have been used for many
years and are said to be a reliable way of assessing post-operative success.
Table 4: Current clinical products on the market with their associated clinical trials that have been completed or are in the process of completion. Adapted from: (Huang et al.,
2016).
Product Clinical studies
(completed) Clinical studies
(ongoing) Clinical scores and
outcomes.
Biocart™II fibrinogen/hyaluronic acid scaffold seeded
with expanded autologous
- Preliminary study
(n=8) [2008]
- Phase II study (n=40)
[2012]
N/A
Showed feasibil ity to
treat cartilage lesion of 1-
8 cm2. IKDC scores

45
chondrocytes (26,27,29).
improved at 6 & 12 months.
Cartipatch®
- Agarose-alginate hydrogel seeded with expanded autologous
chondrocytes.
- Multi-centre study
(n= 17) [2008]
- Phase III study
comparing Cartipatch® to mosaicplasty (n=58) [2013]
- Phase III study
comparing Cartipatch®
to microfacture was terminated.
Largely used to treat
osteochondritis dissecans (OCD). Defects ranged
from 1.0 to 5.1 cm2. IKDC scores improved at 2 years over baseline.
Chondrospheres®
- Smal l spheroids of neo-cartilage
composed of expanded autologous
chondrocytes and
their associated matrix.
- Over 7200 patients
treated since 2004.
- Multi-centre study
(n=42) [2009]
- Investigator-initiated
trial (n=37) [2012]
- Phase II study to
finish Nov. 2017 (2-year outcome).
- Phase III study to
finish Dec. 2020 (5-year outcome).
Improved range of
motion (ROM), pain levels where reported at 2 year follow up,
however IKDC and WOMAC scores remained unchanged.
NeoCart®
- Honeycomb bovine type I col lagen
scaffold seeded with expanded autologous
chondrocytes.
- Phase I study (n=8)
[2009]
- Phase II study
comparing to micro-fracture (n=30) [2012]
- Phase III study
(n=245) to finish Jul. 2017 (1-year outcome
measures)
- Ph I - Pain scores and
ROM were improved over bassline values at 2 years.
- Ph 2 – IKDC, KOOS and
VAS scores were all
significantly improved vs microfracture.
NOVOCART® 3D
- Biphasic type I
col lagen scaffold seeded with
autologous chondrocytes.
- Over 6000 patients
treated since 2003.
- Prospective study
(n=23) [2014]
- Other prospective
studies (n=30-41)
[2009,2014,2012]
- Study on treatment
of OCD [2011]
- Phase III study
(n=233) comparing NOVOCART® 3D to
microfracture finish Jul. 2018 (2-year outcome)
- Non-interventional
study (n=80) to finish
Sept. 2019 (3-year
outcome)
- Phase III study
(n=261) comparing NOVOCART® 3D plus to microfracture finish
Jun. 2019 (5-year outcome).
- Showed feasibil ity to
treat cartilage lesion of 2-6 cm2.
- Prospective clinical
studies have all shown improvments in the IKDC, VAS and MOCART scores
at 1 and 2 year follow ups.
RevaFlex™
- Scaffold-free neocartilage disc
composed of a l logeneic juvenile
chondrocytes and their associated
matrix.
- Phase I/II study
(n=12) [2013]
- Phase III study
(n=225) comparing RevaFlex™ to microfracture finish Jul.
2019 (5-year outcome).
- Showed feasibil ity to
treat cartilage lesion <5 cm2.
- Immunological and
histological analysis showed no adverse immune response,
indicating that allogeneic chondrocytes may be immune-privileged.
CaReS®
- Type I collagen
hydrogel embedded
- Multi-center study
(n=116) [2011] N/A
IKDC scores were
improved from baseline
in multi-centre study and in the retrospective

46
with primary autologous
chondrocytes.
- Retrospective study
comparing to
microfracture (n=20)
[2013]
comparative study showed no significant difference in 2 methods.
From the literature reviewed in Table 4, it was highlighted that although many of these
natural scaffolds are able to promote hyaline cartilage formation, future/current clinical
trials have been halted or stopped. The authors did not comment on the reasons for this.
Nevertheless, if these long term clinical studies were to be successful, eventually gaining FDA
approval; the clinical application would still need to be thoroughly considered and thought-
out for future use in humans. Having said this, there were some clinical products
(Chondrospheres®, NeoCart®, NOVOCART® 3D and RevaFlex™), which successfully made it
through to Phase III clinical trials and are yet to reveal their long-term success in patients.
1.4.3.2.2 Synthetic Biomaterials
Aside from natural polymers, there are also synthetic polymer scaffolds. Their chemical and
physical properties can be modified to alter their degradation rate and mechanical
characteristics, which is harder to do in natural polymers. Common synthetic polymers used
in cartilage tissue engineering are the family of poly α-hydroxy esters, such as poly-glycolic
acid (PGA), poly-lactic acid (PLA) and PCL. The growing research interest of these synthetic
polymers is due to their biocompatibility, and FDA approval for clinical use for more than 20
years (Mouw et al., 2005). The physical properties of these scaffolds, such as pore size,
polymer crystallinity and fibre size are key features that regulate their degradation rates.
Highly porous PGA has been extensively used in cartilage regeneration as it is able to degrade
in about 6-8 weeks. These PGA scaffolds have exhibited high rates of initial cell growth,
maintenance of chondrocyte function and secretion of ECM similar to that of healthy hyaline
cartilage (Mouw et al., 2005; Hooper et al., 1998). Highly crystalline PLA has also been studied
for cartilage repair and can take about 6-18 weeks to degrade. This synthetic material has
shown good chondrocyte proliferation and GAG production in vitro. However, cell growth
and matrix production is much lower than that of PGA (Hooper et al., 1998; Lee and Shin,
2007). The pioneers behind the in vitro study of the family of poly (𝛼-hydroxy esters) were
Vacanti et al.; whose team reported the ability to regenerate cartilage in animal models
(Vacanti et al., 1991). This led to further fabrication of various structured synthetic polymers
scaffolds to culture chondrocytes or mesenchymal stem cell s (MSCs) for regeneration of
cartilage in vitro. Unlike natural biopolymers that are often prepared in a hydrogel form,
synthetic polymers can be fabricated into various pre-formed structures, such as fibres,
foams and sponges.

47
Figure 16: The three-dimensional poly(lactic-glycolic acid) (3D-PLGA) scaffold. The micropore side (cell seeding side) (a) and a cross section (b) of the scaffold. Schematic
illustration of cell seeding (left) and scanning electron photomicrograph of cross section of cells seeded in the 3D-PLGA scaffold (right) (c). The cells lie in a uniform array at the
palisades, similar to hyaline cartilage. Gross appearance of a cartilage defect in the patella groove of a rabbit implanted with a complex between adherent bone marrow cells and 3D-
PLGA scaffold (d). The arrows indicate cell/PLGA scaffold (Jin et al., 2009).
Holland et al. highlighted that the manufacturing process of certain synthetic biodegradable
polymers has a significant effect on cell migration of chondrocytes and differentiation of
MSCs (Holland and Mikos, 2006); which is why the development of nanostructural materials
has been an emerging trend in cartilage tissue engineering. Nanostructured scaffolds can be
fabricated via a technique called electrospinning. Two detailed studies performed by Li et al.
showed that chondrocytes cultured in PCL nanofibrous scaffolds maintained their
chondrocytic phenotype (Li et al., 2003), similarly MSCs were successfully induced into
chondrocytes (Li et al., 2005). Li et al. pursued a further in vivo study showing that
chondrocyte-MSC laden nanofibrous scaffolds, grown in a bioreactor, were able to repair full
thickness defects in pig femoral condyles (Li et al., 2009). Despite this, current studies have
shown interest in new synthetic biomaterials such as poly glycerol-co-sebacate (PGS) and
poly octanedoil-co-citrate (POC) as they have been found to have similar mechanical stiffness
to articular cartilage, potentially making them feasible for cartilage tissue engineering,
however their regenerative potential is still unknown (Wang et al., 2003; Kang et al., 2006;
Jeong and Hollister, 2010). Claire et al. proposed a method in which PCL, PGS and POC were
fabricated into the same fixed 3D architecture. This enabled the study of solely the material
to determine its effects on cartilage regeneration in vitro (Jeong and Hollister, 2010). The
study reported that POC provided optimal support for cartilage rege neration in terms of
maintaining cell phenotype, ECM production and differentiation of chondrocytes.
Conversely, PGS and PCL were found to be less favourable as they caused de -differentiation
of some chondrocytes and high matrix degradation.

48
Other synthetic scaffolds used in cartilage regeneration which have both undergone clinical
trials are; a commercial product named Bioseed®-C (biodegradable polymer scaffold) and
INSTRUCT (poly (ethylene oxide-terephtalate)/poly(butyleneterephtalate) (PEOT/PBT)
scaffold seeded with primary autologous chondrocytes and bone marrow cells). Studies using
Bioseed®-C in human clinical trials, have reported great clinical success. At 2 years, significant
improvements in the KOOS score were reported when compared to baseline val ues and
histological images showed good integration and formation of cartilaginous repair tissue
(Ossendorf et al., 2007). At 4 years significant improvements in the ICRS, IKDC and KOOS
scores were reported when compared to baseline and MRI examinations showed complete
filling in 72.7 %, moderate filling in 25 % and less than 50 % filling in 0.3 % of patients (Kreuz
et al., 2009; Kreuz et al., 2011). Over 300 patients have been treated with the Bioseed®-C
scaffold since 2003 (BioTissue - BIOSEED®-C). A recently a long-term follow up study (12
years), highlighted that morphological evaluation by MRI showed moderate to complete
filling in 10 of 14 patients. From which qualitative evaluation of the cartilage ultrastructure
showed hyaline-like repair tissue in repair site, 12 years after implantation (BioTissue -
BIOSEED®-C). This scaffold is currently being widely used in Europe with hopes to move into
the American market (Huang et al., 2016).
The INSTRUCT scaffold utilises a modern approach of a bio-plotter device to create the
desired porous lattice structure (approx. 170 mm diameter fibres, 200 mm pore size, and
56% porosity) (Hendriks et al., 2013). An initial study in nude mice, reported that the softer
PEOT polymer of the scaffold functions to support the chondrogenic phenotype, whilst the
PBT part, increases the material stiffness (Moroni et al., 2007). Several authors commented
on the ability to easily fine tune the mechanical properties of this scaffold by altering the
ratio of PEOT to PBT, which also gave rise to varying pore sizes for better cell aggregation,
alongside differing rates of degradation (Jansen et al., 2008; Deschamps et al., 2001; Emans
et al., 2012). This bio-resorbable scaffold (12 months) has a unique way of being input into
patients via a single surgical intervention, whereby the patient’s cells and bone marrow
aspirate are inserted into a semi-automated machine (INSTRUCT cell processor). The
machine isolated the chondrocytes, mixes them with marrow cells, adds fibronectin and
seeds them onto a scaffold, all of which can be done in under 1 hour (Moroni et al., 2007;
Mechanically Functional Scaffold Technology, 2015; The INSTRUCT Products, 2015) . A Phase
II trial completed in 2014, with a 2-year outcome, showed improvements in the IKDC and
KOOS scores, with 72 % of patient exhibiting hyaline cartilage and 97 % with either
fibrocartilage or hyaline cartilage (Hendriks et al., 2013; Slynarski et al., 2015).
49
From the literature, it is clear that scaffold material, cell source and signalling factors make
up the basis of a good tissue engineered construct. Examples of some novel biomaterials
used have been reviewed, showing their continuous development as biocompatible
scaffold/hydrogels. Not only have these scaffolds been able to meet the mechanical
requirements to maintain cell phenotype but they have been able to provide a stable
environment in which cells are able to synthesise an ECM, something that was not as well
characterised in earlier therapeutic techniques. Furthermore, the incorporation of certain
bioactive molecules has shown enhancement in the cartilage regeneration properties as well
as cell proliferation. Both natural and synthetic biomaterials have their drawbacks, some of
which have viable solutions to them. Aside from this, the prime concern of some of these
scaffold materials is that the majority of them are yet to be tested in humans to assess their
feasibility.
The current approaches to cartilage repair reviewed in the previous sections have all been
shown to have different effects on the regeneration of cartilage. The therapeutic techniques
without any active cells have been shown to have only temporary effects on patients, in some
cases worsening the condition. Severities of the disease or lesion, age and bone quality have
all been reported to have an effect on the surgical outcomes of these therapeutic
approaches.
Despite the large number of preclinical and clinical studies reviewed here for cartilage tissue
engineering, none of the scaffolds or clinical products discussed were injectable
percutaneously. Recent interest has been directed toward the development of self-
hardening and injectable materials, that can be used in the percutaneous injection of
biomaterials, capable of cartilaginous tissue repair without causing any extra damage to the
surrounding tissue. The properties and structures of hydrogels make them ideal candidates
for implantation by minimally invasive surgery (Liu et al., 2017; Lum and Elisseeff, 2003;
Radhakrishnan et al., 2017). Hydrogels are composed of chains of synthetic or natural
macromolecules capable of forming hydrogels after physical, ionic stimuli or covalent
crosslinking (Dury and Mooney, 2003; Liu et al., 2017). They are known to exhibit a high level
of hydration close to that of the articular cartilage, allowing them to mimic the 3D
environment of chondrocytes (Teixeira et al., 2014).
In conclusion, surgeons have a variety of tools that can be used to treat OA cartilage. Age,
aetiology, extent of cartilage damage and the lifestyle of the patient, should all be factors
that should define the choice of treatment of the patient. The use of minimal invasive surgery
should be put into practise where possible in order to avoid open intrusive surgery and put

50
off joint replacement for as long as possible. One of the most important factors in avoiding
the extensive end stage deterioration of cartilage, is to improve the current methods and
approaches to diagnose the changes in biochemical and biomechanical propert ies of
cartilage at a much earlier stage of the disease. Equal effort should also be made to develop
new methods and biomaterials that can oppose the changes that occur in the ECM of
cartilage in early OA, in order to prevent the further progression of the disease. The following
section will introduce a novel type of material – self-assembling peptides (SAPs) – that have
shown potential as injectable biomaterials for intervention in early cartilage defect and early
stage OA. They offer flexibility in function and design, as well as lending themselves to be
developed into viable alternatives to joint lubricants that may also have the ability to repair
ECM damage.
1.5 Introduction to Peptides
Peptides are short chains of amino acid monomers that through condensation reactions (H2O
produced), form peptide bonds. This covalent bond is as a result of the carboxyl group of one
amino acid reacting with the amino group of another (Voet and Voet, 1995; University of
Arizona , 2001).
There are 20 main natural amino acids involved in the synthesis of peptides and proteins
present in biology. These amino acids are organised according to the polarity of their side
chains. All these amino acids have the same basic structure, varying only in their ‘R groups’
(Ulijn and Smith, 2008). The peptides made from these amino acids are completely ionised
at all pH ranges, and therefore can act either as an acid or a base. Cation and anion
concentrations in solution can have an effect on the behaviour of these peptides; as these
ions can act electrostatically to shield the side chain charges from one another, disturbing
any intra and intra molecular interactions (Voet and Voet, 1995).
Proteins that naturally occur in nature are considered to have four levels of hierarchical
structure, making them more complex than peptides, which only generally have two levels
(Berg et al., 2002). For peptides, the primary structure is the formation of polypeptides. They
are made up by a sequence of amino acid residues, determining the specific conformation
that is adopted by the peptide. The secondary structure refers to the orientation of the
peptide backbone, due to the formation of hydrogen bonding. The main secondary
structures are known as α-helix and β-sheet (Berg et al., 2002).

51
1.6 Introduction into self-assembling peptides (SAPs)
Self-assembling peptides can be thermodynamically driven to self-assemble into well-
defined aggregates through weak non-covalent forces. In order of strength, these forces
consist of: hydrogen bonding, electrostatic interaction, hydrophobic interactions and Van de
Waals (Semino, 2008). The idea behind molecular self-assembly (SA) has become one of the
main driving force for the development of these biomaterials. The bottom up approach to
the design and synthesise of these functional biomaterials starts with the careful design of
the small building blocks that can self-assemble without any external forces and hence lend
themselves for the use in nanoscience (Tu and Tirrell, 2004). The structural ordering of the
SA process is similar to the one seen in biological proteins, in that there are primary SA,
secondary and tertiary SA and finally quaternary folding (Aggeli et al., 2001).
In peptides, one dimensional SA is the formation of singular polypeptide chains. Secondary
SA consists in the formation of α-helices and/or β-sheets. Tertiary SA is when either the α-
helices and/or β-sheets assemble into 3D structures via side chain interactions of the
individual amino acids. The different level of SA are based on protein folding; whilst the last
level (quaternary assembly), is when several peptide chains assemble into tape like or
globular structures. The SA process can further continue, depending on the physical
conditions (pH or ionic strength of solution) into ribbons, fibril or fibres (Aggeli et al., 2001;
Aggeli et al., 2003).
1.6.1 Self-assembly mechanism
Self-assembling peptides are able to assemble in one of two ways; nucleated or non-
nucleated (classical).
Non-nucleated self-assembly is the free energy change associated with the formation of one
dimer unit or higher order aggregates. This stepwise addition of individual units will occur
with identical rate constants for each of the associating reactions. Equation 1 gives the free
energy change per molecule where; α= is the association energy, KB= Boltzmann constant
and T=temperature.
∆𝜇∗ = −𝛼𝐾𝐵𝑇 - [Equation 1]
Nucleated self-assembly is a more complex self-assembly mechanism. This mechanism
involves a critical concentration for the formation of aggregates (nucleation). Below this
nucleation point, the majority of molecules in the system will exist as isolated monomers
where their 𝜑 & 𝜓 angles have any value (Branden and Tooze, 1999). Essentially, the growth
or aggregation is inhibited until a particular concentration is reached at which point it will

52
spontaneously take off. This concentration is known as the critical concentration more
commonly known as C* (Israelachvil, 1992). This mechanism involves two parameters,
nucleation energy (𝛼𝑛𝐾𝐵𝑇) and growth energy(𝛼𝑔𝐾𝐵𝑇). The latter is associated with the
corresponding energy of 𝛼𝐾𝐵 𝑇, as seen in the non-nucleated SA (Eq 1), however in classical
non-nucleated SA the nucleation energy is absent (Israelachvil, 1992).
For peptides to self-assemble in 1D, they must undergo a conformational transition,
associated with an entropy loss. This entropy loss is characteristic of the straightening out of
a peptide chain from its random coil to its β-strand conformation. This process is described
by the energetic parameter, 휀𝑡𝑟𝑎𝑛𝑠𝐾𝐵𝑇. Once this β-strand conformation is reached, further
SA can occur once the tape scission energy is increased; 휀𝑡𝑎𝑝𝑒𝐾𝐵𝑇 (energy required to break
tape in 2 pieces) (Aggelli, 2000). This energy is enthalpic in nature, which stems from the
intermolecular peptide backbone complementary hydrogen bonds and the side chain
interactions. Indeed, SA can only occur when the loss in entropy (휀𝑡𝑟𝑎𝑛𝑠𝐾𝐵𝑇) is
counterbalanced by the gain in enthalpy (휀𝑡𝑎𝑝𝑒𝐾𝐵𝑇). The SA mechanism can further
continue, where two tapes can associate to form a ribbon structure, stabilised by
휀𝑟𝑖𝑏𝑏𝑜𝑛𝐾𝐵𝑇. The magnitude of 휀𝑟𝑖𝑏𝑏𝑜𝑛 is due to the intermolecular interaction between the
side chains. Opposing the stacking of these tapes is what is called the elastic energy
휀𝑒𝑙𝑎𝑠𝑡𝑟𝑖𝑏𝑏𝑜𝑛, which originates from the helical nature of tapes. In order for two tapes to stack
together, they must both decrease their helical twist to facilitate the presence of each other.
Therefore, the ribbon formed has more of a saddle curvature rather than a helical twist.
Therefore, if 휀𝑟𝑖𝑏𝑏𝑜𝑛 can overcome 휀𝑒𝑙𝑎𝑠𝑡𝑟𝑖𝑏𝑏𝑜𝑛, the formation of a ribbon will occur (Aggeli
et al., 2001; Fishwick et al., 2003).
Similarly, the stacking of several ribbons one top of one another will form fibrils. This is
stabilised by 휀𝑓𝑖𝑏𝑟𝑖𝑙𝐾𝐵𝑇, which is the free energy per stacked peptides in the fibril. This
system has an opposing force restricting the formation of fibrils, known as 휀𝑒𝑙𝑎𝑠𝑡𝑓𝑖𝑏𝑟𝑖𝑙, which
is the energy associated with the untwisting of the ribbons upon stacking. The number of
tapes within a fibril is determined by a balance between the gain in attraction (휀𝑓𝑖𝑏𝑟𝑖𝑙),
associated with ribbon stacking, and the elastic cost associated with packing of the ribbons
in the fibril. Therefore if 휀𝑓𝑖𝑏𝑟𝑖𝑙 overcomes 휀𝑒𝑙𝑎𝑠𝑡𝑓𝑖𝑏𝑟𝑖𝑙, the SA of the fibril will occur. Finally,
once a stable fibril is formed, pairs of fibrils are able to entwine edge on edge resulting in the
formation of a fibre.
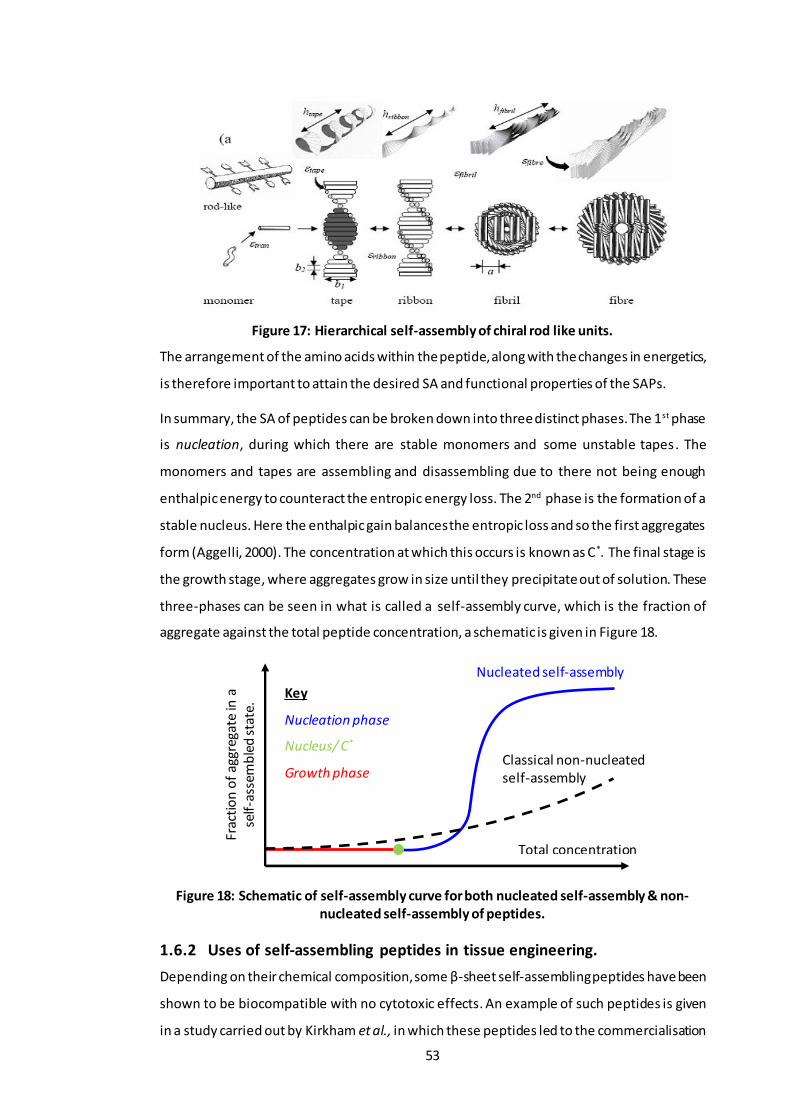
53
Figure 17: Hierarchical self-assembly of chiral rod like units.
The arrangement of the amino acids within the peptide, along with the changes in energetics,
is therefore important to attain the desired SA and functional properties of the SAPs.
In summary, the SA of peptides can be broken down into three distinct phases. The 1st phase
is nucleation, during which there are stable monomers and some unstable tapes. The
monomers and tapes are assembling and disassembling due to there not being enough
enthalpic energy to counteract the entropic energy loss. The 2nd phase is the formation of a
stable nucleus. Here the enthalpic gain balances the entropic loss and so the first aggregates
form (Aggelli, 2000). The concentration at which this occurs is known as C*. The final stage is
the growth stage, where aggregates grow in size until they precipitate out of solution. These
three-phases can be seen in what is called a self-assembly curve, which is the fraction of
aggregate against the total peptide concentration, a schematic is given in Figure 18.
Figure 18: Schematic of self-assembly curve for both nucleated self-assembly & non-nucleated self-assembly of peptides.
1.6.2 Uses of self-assembling peptides in tissue engineering.
Depending on their chemical composition, some β-sheet self-assembling peptides have been
shown to be biocompatible with no cytotoxic effects. An example of such peptides is given
in a study carried out by Kirkham et al., in which these peptides led to the commercialisation
Total concentration
Nucleated self-assembly
Key
Nucleation phase
Nucleus/ C*
Growth phase
Frac
tio
n o
f ag
greg
ate
in a
se
lf-a
ssem
ble
d s
tate
.
Classical non-nucleated self-assembly

54
of a product for dental repair (Kirkham et al., 2007). The use of these peptides was to
treat/prevent caries lesion via the insertion of these peptides as a monomeric solution. It
was hypothesised that they would polymerise in situ via changes in pH or ionic strength; in
order to provide a biomimetric scaffold upon which hydroxyapatite nucleation could occur
and promote repair. The matrix like structures formed by these peptides not only mimic the
biological macromolecules found in the natural ECM of the mammalian skeleton, but are also
able to induce the deposition of hydroxyapatite. The reasoning behind this increased mineral
deposition of the peptide used (P11-4), was due to the structure of the fibrils formed, which
is reminiscent of collagen fibres. The presence of these collagen-like fibres promotes
nucleation of hydroxyapatite more readily than normal (Kirkham et al., 2007). The successes
of this study led to the commercialisation of a product named, CURODONT™, which is now
used to treat caries lesion.
Further uses of SAPs, as biomaterials for the application in tissue engineering, are their use
as joint lubricants. Bell et al., was among the first to study the frictional properties of these
peptides, which had been designed based on the functional moti f of hyaluronic acid, which
is a commonly used as a viscosupplement and is a very important GAG within the ECM of
cartilage (Bell et al., 2006). In static and dynamic friction tests carried out in healthy cartilage
pin on plate experiments, it was found that one of the peptides, P11-9, had favourable
frictional characteristics, similar if not better than hyaluronic acid. However, this was not the
case in damaged cartilage samples (Bell et al., 2006). Nevertheless, the study was able to
provide preliminary evidence that these self-assembling peptides are promising candidates
in developing effective joint lubricant and could also be used to regulate the AC degeneration
in its early stage.
SAPs have also been used for other tissue engineering application such as the formation of
hydrogel scaffolds. Kisiday et al showed that chondrocytes are able to grow and multiply on
a hydrogel scaffold-like material produced by a SAP called KLD-12. The bovine chondrocytes
used were not only able to maintain their chondrocytic phenotype and produce cartilage-like
ECM, rich in collagen type-II but also showed increased mechanical properties, after 4-weeks
of culture in vitro (Kisiday et al., 2002).
The examples outlined here are only some of the uses that make these SAPs so promising as
scaffolds for tissue engineering and show tremendous promise in the field of regenerative
medicine. In depth studies and reviews by several authors cover a vast number of
applications for all the different types of SAPs in tissue engineering (Maude et al., 2013;
Hosseinkhani et al., 2013; Johnstone et al., 2013; Stephanopoulos et al., 2013; Varaprasad et

55
al., 2017; Calo and Khutoryanskiy, 2016). A few significant application that SAPs have been
used for reduction of blood loss in haemorrhagic sites, which could be used to treat non-
compressible torso haemorrhage in battlefield patients (Morgan et al., 2016), wound healing
(Schneider et al., 2008; Meng et al., 2009; Loo et al., 2014; Xie et al., 2015) , bone repair
(Fellah et al., 2006; Ozeki et al., 2011; Short et al., 2015; Xavier et al., 2015; Radhakrishnan
et al., 2017), scaffold for regenerating dental pulp (Galler et al., 2012), nucleus pulposus
(Collin et al., 2011; Tao et al., 2015; Xu et al., 2015; Miles et al., 2016; Thorpe et al., 2016;
Wan et al., 2016; Gullbrand et al., 2017; Wachs et al., 2017) and cartilage (Balakrishnan et
al., 2014; He et al., 2014; Kim et al., 2015; Ren et al., 2015; Tatman et al., 2015). Most of the
above studies using SAP hydrogels for cartilage regeneration purposes are mixed with cells
in complicated multi-step procedures. Some of which use more than one biomaterial to
improve the mechanical stiffness’s of the gels formed, which can increase the cost of the
potential minimally invasive procedure. Nevertheless, these SAP hydrogels have
demonstrated good biocompatibility with the host environment and have shown good
feasibility to be used as minimally invasive injectable materials for the use in early stages of
OA. However, in this study cells will not be used. A much simpler and cheaper approach of
mixing the SAPs with a naturally occurring biopolymer in cartilage (chondroitin sulfate), in a
one-step procedure, will be investigated to see whether it is able to restore the
biomechanical properties of OA cartilage.
In general terms SAP molecules have been labelled as ‘Lego bricks’ , with the ability to
spontaneously self-assemble when exposed to an external stimulus to form nanofibrous
structures. Their success is thanks to their highly defined structure and the molecular
interaction which enable them form fibrilar intricate nanostructures that are very similar in
size, shape and porosity to that of natural fibrilar proteins in the ECM. Additionally, their self-
assembling properties allow them to form porous network structures. These provide a tissue-
like microenvironment and can display cell-binding sites that can be made to specially
interact with cells and influence their biological function. From the literature reviewed, their
most important characteristic, which makes them favourable for tissue engineering and
regenerative medicine is their self-assembling properties and how this can be triggered. The
self-assembly of the SAPs used in regenerative medicine was reported to be triggered by
shifts in pH or temperature or by the presence of monovalent or divalent electrolyte ions.
The combination of all these characteristics makes SAPs very favourable biomaterials for
percutaneous injections, specifically in minimally invasive surgery techniques for cartilage
regeneration. Therefore, the ideal design requirements for a SAP gel, that could be used in
the regeneration of osteoarthritic cartilage should be able to form self -supporting gels in a

56
physiological environment, show characteristic morphology similar to that of proteoglycan
structures found in native cartilage and be strong enough to remain in the area to which it is
applied.
1.7 Rationale
Osteoarthritis is considered the most common joint disorder worldwide (Arden and Nevitt,
2006; Lorenz and Richter, 2006). The number of people that will be affected by OA is on the
rise because of the aging population in most Western countries and the recent obesity
epidemic (Arden and Nevitt, 2006; Zhang and Jordan, 2010). This degenerative joint disease
is characterised by the progressive loss of articular cartilage and formation of osteophytes,
which leads to pain, loss of function and mobility problems (Berenbaum, 2013; Pitsillides and
Beier, 2011; Bach and Hunter, 2014). Cartilage is a unique tissue, demonstrating both
viscoelastic and compressive properties provided by its extracellular matrix (ECM).
Unfortunately, chondrocytes have a very limited ability to fully repair damaged cartilage
(Berenbaum, 2013). Therapeutic interventions are needed. Current treatments are limited
in respect to their ability to regenerate/restore hyaline cartilage and alleviate pain. OA is
characterised by a loss of GAGs from the cartilage ECM which are essential for it
biomechanical function. Restoration of GAGs in articular cartilage during early stages of OA
may delay or prevent disease progression. Treatment with chondroitin sulfate (Katta et al.,
2008) has been shown to be ineffective in restoration of mechanical properties to GAG
depleted cartilage. It is hypothesised that a combination of chondroitin sulfate and SAPs,
with the SAPs retaining the GAG in situ will be effective. The use of SAPs (Shaha et al., 2010;
Kyle et al., 2010), which can transform from injectable liquids into hydrogel bioactive
structures in vivo; is an attractive approach that could be transferred to the clinic.
The SAPs chosen were a family of peptides from the P11 series that have been de novo
designed at the University of Leeds. These SAPs are able to form β-sheet tapes, which self-
assemble in one dimension into a hierarchy of well -defined structures. They are
advantageous because they are entirely based on natural amino acids and their self-assembly
can be triggered by external factors such as pH, ionic strength and temperature (Aggeli et al.,
2003; Carrick et al., 2007; Maude et al., 2011). The peptides P11-4, P11-8 and P11-12 were
chosen as they systematically vary in charge (net charge of +2 or -2) and hydrogen bonding
capacity (glutamine (Q) or Serine (S) based peptides). They were then combined with
chondroitin sulfate, which has a -2 charge and a large number of hydrogen bond donors (4)
and acceptors (15) groups per repeat monomer unit that will potentially facilitate
interactions between the peptides and these GAGs through a combination of electrostatic

57
and/or hydrogen bonding interactions. Miles et al., carried out a similar study in which these
peptides were combined with GAGs at varying molar ratios to investigate if they could
restore the in vitro biomechanical properties of degenerative intervertebral discs. To date
this is the only other study which has combined the use of the P 11 peptides and GAG.
However, the authors carried out their experiments at room temperature and in only one
physiological conditions (130 mM NaCl in Deuterated water (D2O)), which was relevant to
their area of study. Hence this study aims to investigate a range of physiological conditions
found within the cartilage tissue.
Therefore, this project will investigate the feasibility of using novel self-assembling peptides
combined with chondroitin sulfate (a key component of the ECM), for the restoration of
biomechanical properties of GAG depleted cartilage in vitro.
1.8 Aim and Objectives
The aim of this project is to use multidisciplinary approaches, to determine whether a
combination SAPs and chondroitin sulfate is able to restore the biomechanical properties of
GAG depleted porcine condylar cartilage, ideally to a level intrinsic to natural porcine
condylar cartilage.
1.8.1 Objectives
1) To determine the effects of combining the SAPs (P11-4, P11-8 and P11-12) and
chondroitin sulfate (GAG) at two molar ratios (1:64 and 1:16) in two physiological
conditions (130 mM and 230 mM Na+ salt solutions), on the β-sheet percentage, fibril
morphology and biomechanical properties of the SAPs and SAP: GAG mixtures.
2) To create a GAG depleted porcine condylar cartilage model and characterise the
model biochemically and histologically.
3) To develop an indentation testing procedure that gives a significant difference in the
deformation, equilibrium elastic modulus and permeability between native and GAG
depleted porcine condylar cartilages.
4) To determine the GAG content and biomechanical properties of native and GAG
depleted porcine condylar cartilage
5) To investigate whether the SAPs or SAPs/GAG mixtures are able to restore the
biomechanical properties of GAG depleted porcine condylar cartilage.

58
Chapter 2 Materials and Methods
2.1 Materials
2.1.1 Equipment
A list of the laboratory equipment used throughout the study is shown in Table 5.
Table 5: Equipment used throughout the study.
Equipment Model/Size Supplier
Automatic pipettes Gilson P20-P5000 Anachem Ltd. Balance Mettler AE240 Balance Inte Equipment Trading Ltd.
Bijous 5 ml Scientific Laboratory Supplies Ltd Disposable plastic syringes 1 ml, 2 ml, 10 ml, 20 ml Scientific Laboratory Supplies Ltd
Fourier transform infrared spectrometer (FTIR)
Nicolet 6700 Thermo Scientific.
Freeze drier Modulyod-230 Thermo Savant
Freezer (-20 °C) Electrolux 3000 Jencons PLC
Fridge Electrolux ER8817C Jencons PLC Hexagonal mesh copper grids 400 mesh grids Agar Scientific Ltd.
Histology cassettes CMB-160-030R Thermo Fisher Scientific Ltd Histology moulds - Thermo Fisher Scientific Ltd
Histology water bath MH8515 Barnstead Hot plate E18.1 hotplate Raymond A Lamb
Hot wax dispenser E66 was dispenser Raymond A Lamb
Incubator Heraeus Jencons PLC Instron material testing machine
3365 Instron
Linear variable differential transformer (LVDT)
RDP DS-200H Electrosence
Magnetic stirrer Stuart SB161 Scientific Laboratory Systems Ltd
Mica carbon sheets - Agar Scientific Ltd. Micro-plate spectrophotometer Multiscan Spectrum 1500 Thermo Scientific
Microscope (upright) Zeiss AX10 Zeiss Microscope Zeiss with FRAP module
Microtome RM2125 RTR Leica Microsystems Microtome Blades SD3050835 Fisher Scientific
Orbital Shaker IKA KS130 basic Jencons PLC
Parafilm M - Sigma Aldrich Ltd. pH Meter Sartorius Docu-pH-meter Fisher Scientific
Pipette tips 10 μl, 200 μl, 1000 μl Star Labs Plate Shaker IKA KS130 basic Jencons PLC
Rheometer Malvern Kinexus Pro Malvern Sample vials (7ml) 4013610 Scientific Industries Inc.
Slide holder E102 Raymond A Lamb
Sonicator Sonorex RK52H Bandelin Sonorex Ltd. Superfrost Plus microscope slide MIC3022 Scientific Laboratory Supplies Ltd
Syringe needles 32G Thermo Fisher Schientific Ltd

59
Tissue Processor TP11020 Leica Microsystems Transmission electron microscope
Jeol 1400 Jeol Ltd.
Universals 25 ml Scientific Laboratory Supplies Ltd Vortexer Vortex Genie-2 Scientific Industries Inc.
Water Bath Grant Jencons PLC Well plates, Nunc® (flat bottomed)
96-well plates Nunc International Corporation
Wax oven Windsor E18/31 Scientific Laboratory Supplies
2.1.2 Chemicals
Sources of chemicals used throughout the study are shown in Table 6.
Table 6: Chemicals and reagents used throughout the study.
Chemical/reagent Supplier
1,9 dimethylene blue Sigma-Aldrich Ltd. Acetic Acid (glacial) Thermo Fisher Scientific Ltd
Amphotericin B VWR International
Aprotinin (10,000 KUI) Mayfair house Bovine Serum Albumin Sigma Aldrich Ltd.
Calcium acetate Thermo Fisher Scientific Ltd Calcium chloride (CaCl2) Thermo Fisher Scientific Ltd
Chondroitin sulfate B Sigma Aldrich Ltd. Deuterium chloride (DCl) Sigma Aldrich Ltd.
Deuterium oxide (D2O) Sigma Aldrich Ltd.
DPX mountant Thermo Fisher Scientific Ltd di-sodium hydrogen orthophosphate VWR International
Ethanol Thermo Fisher Scientific Ltd Ethylenediaminetetraacetic acid (EDTA) VWR International
Fast green Sigma Aldrich Ltd. Formic acid Sigma Aldrich Ltd.
Formamide Sigma Aldrich Ltd.
Gentamycin Biochrom A Hank’s balanced salt solution (HBSS) Sigma Aldrich Ltd.
Haematoxylin (Weigert’s) Atom Scientific Hydrochloric acid VWR International
Isopropanol Thermo Fisher Scientific Ltd L-cystine hydrochloride Sigma Aldrich Ltd.
Methyl methacrylate (liquid) WhW Plastics
Nystatin Sigma Aldrich Ltd. OCT embedding media Leica Biosystems
Papain Sigma Aldrich Ltd. Paraffin wax Thermo Fisher Scientific Ltd
Phosphate Buffered Saline (PBS) without Ca2/Mg2+
Lonza
Penicillin Lonza
Potassium chloride (KCl) Sigma Aldrich Ltd. Polymixin B Calbiochem
Polymethylmethacrylate (PMMA) powder WhW Plastics
Primixin I.V. (Imipenem Cilastatin) Medreg

60
2.1.3 Peptides
P11-4, P11-8 and P11-12 were purchased from CS Bio Co. These peptides were analysed in
house to check their composition and purity using elemental analysis and UV spectroscopy.
Table 7: Peptide primary structures, and their net charges at pH 7.4. Positively charged residues are coloured blue, negatively charged residues are red. All peptides were
amidated and acetylated.
Peptide Amino Acid Sequence Net charge at pH 7.4 P11-4 QQRFEWEFEQQ -2 P11-8 QQRFOWOFEQQ +2 P11-12 SSRFOWOFESS +2
Manufacturer values of peptide percentage purity were checked using UV spectroscopy. The
three peptides studied here (Table 7) all contain tryptophan. Therefore, the UV absorption
spectra can be used to calculate the molar concentration. The wavelength of 279 nm
corresponds to the excitation peak of the indol side chain of the tryptophan residue.
Therefore, when the spectra are collected in a 1 mm path length cell, the molar ratio can be
calculated using equation 2:
𝐸𝑞𝑢𝑎𝑡𝑖𝑜𝑛 2 − [𝑝𝑒𝑝𝑡𝑖𝑑𝑒]𝑀 = 𝐴𝑏𝑠279
5600 (𝑀−1𝑐𝑚−1)
Where 5600 M-1cm-1 is the molar extinction coefficient of the tryptophan residue at 279 nm.
Solutions were prepared at 1 mg.ml -1 in water. The pH of these solutions was adjusted (pH >
8 for P11-4 and a pH < 6 for P11-8 and P11-12), to obtain a fully monomerised solution. Peptide
solutions were added to the Hellma UV quartz cuvettes with a 1 mm path length. Prior to
commencing, spectrometer was auto-zeroed using Hellman UV quartz cuvettes filled with
blank solvent (water). Solution absorbance was recorded using a PerkinElmer UV/VIS/NIR
Safranin O Acros Sodium acetate Thermo Fisher Scientific Ltd
Sodium chloride (NaCl) Thermo Fisher Scientific Ltd Sodium deuteroxide (NaOD) Sigma Aldrich Ltd.
Sodium di-hydrogen orthophosphate VWR International Sodium dodecyl sulfate (SDS) Sigma Aldrich Ltd.
Sodium formate VWR International
Sodium hydrocarbonate (NaHCO3) Thermo Fisher Scientific Ltd Sodium Hydroxide VWR International
Stains-all solution VWR International Standard pH buffers (pH 4, 7 and 10) Sigma Aldrich Ltd.
Trizma base Sigma Aldrich Ltd. Uranyl acetate Sigma Aldrich Ltd.
Vancomycin Sigma Aldrich Ltd.
Xylene Genta Medical Zinc acetate Thermo Fisher Scientific Ltd
Zinc chloride Thermo Fisher Scientific Ltd

61
Lambda 900 Spectrometer, controlled by UV WinLab software. Ten measurements of
absorbance were recorded, with a ten second pause in-between the successive readings. An
average of the absorbance measurements was taken. The in-house peptide content value
from UV spectroscopy was calculated using Equation 3:
𝐸𝑞𝑢𝑎𝑡𝑖𝑜𝑛 3 − 𝑃𝑒𝑝𝑡𝑖𝑑𝑒 𝑐𝑜𝑛𝑡𝑒𝑛𝑡 =𝑀𝑜𝑙𝑎𝑟𝑖𝑡𝑦 𝑚𝑒𝑎𝑠𝑢𝑟𝑒𝑑 𝑏𝑦 𝑈𝑉
𝑀𝑜𝑙𝑎𝑟𝑖𝑡𝑦 𝑚𝑒𝑎𝑠𝑢𝑟𝑒𝑑 𝑏𝑦 𝑚𝑎𝑠𝑠/𝑣𝑜𝑙𝑢𝑚𝑒 𝑟𝑎𝑡𝑖𝑜
Peptides were stored in a freezer and prior to use left to thaw at room temperature.
2.1.4 Glycosaminoglycan (GAG; chondroitin sulfate)
Chondroitin sulfate sodium salt from shark cartilage was purchased from Sigma-Aldrich Ltd,
Dorset, UK. This particular GAG is the most abundant in healthy articular cartilage, therefore
is the most likely candidate to provide mechanical and biological behaviour similar to that
found in the natural tissue (Mow and Ateshian, 1997).
2.1.5 Software
OMNIC software by Thermo Fisher Scientific (Version 7.3, SP1) was used to interpret the
peptide spectra data produced by the Fourier transform infrared spectroscopy (FTIR)
machine. This program allowed the production of peak fitted graphs, to determine the
secondary structure of the peptides, which were saved as CSV files to be further manipulated
in Origin Pro 8.6 (OriginLab, SR1). rSpace Kinexus by Malvern Instruments (Version 6.7) was
used to control the rheometer and export raw data. Origin Pro 8.6 was used to process,
manipulate and present the graphs throughout this thesis.
2.2 Methods
2.2.1 General Methods
2.2.1.1 Weighing of peptides
A Mettler AE240 balance was used to measure masses greater than ≈ 1 mg, while masses
less than ≈1 mg, were weighed on a Sartorius SC2 balance. The accuracy of the balances were
0.01 mg and 0.1 µg, respectively. The percentage purities of the three peptides, P11-4, P11-8
and P11-12 were 95 %, 79.05 % and 79.7 % respectively. Throughout this study, it was decided
to use 10 mg of peptide per 1 ml of Na+ salt solution. However, as the peptide purities were
not 100%, the amount of peptide to weigh out in order to obtain 10 mg. ml-1 was calculated.

62
The percentage purities (above) were divided by 100 and then subtracted from 1 to give the
number of milligrams (mg) of counter ions in each sample, the remaining weight was the
weight of peptide as detailed below:
- For each mg of P11-4, 0.05 mg was counter ions. The remaining weight 0.95 mg, was of
actual P11-4.
- For each mg of P11-8, 0.21 mg was counter ions. The remaining weight 0.79 mg, was of
actual P11-8.
- For each mg of P11-12, 0.20 mg was counter ions. The remaining weight 0.80 mg, was of
actual P11-12.
Therefore for 10 mg.ml-1 to be achieved, 10 mg was divided by the weight of peptide (above)
which accounted for the counter ions to give the weight of peptide that was weighed out.
For P11-4 = 10.53 mg.ml-1 of Na+ salt solution – (1)
For P11-8 = 12.65 mg.ml-1 of Na+ salt solution – (2)
For P11-12 = 12.50 mg.ml-1 of Na+ salt solution – (3)
The concentration of the peptides used in this study was always 10 mg.ml-1.
2.2.1.2 Weighing of chondroitin sulfate (CS) powder – (GAG)
Chondroitin sulfate sodium salt was used as the GAG for all the experiments (unless
otherwise stated). Different molar ratios of GAG: peptide were used throughout this study,
these were 1:64 and 1:16. Throughout this work the terminology 1:64 & 1:16, refers to one
part GAG to one part peptide.
Figure 19: One subunit of Chondroitin-6-sulfate.
To determine the amount of GAG powder to be weighed to make up these molar ratios the
following calculations were carried out.
The peptide weight, 10 mg, was divided by the molecular weights of the corresponding
peptide to determine the number of moles of peptide.
The number of moles of peptide was then divided by the ratio required, so either 64 for the
1:64 ratio or 16 for the 1:16 ratio. This gave the moles of GAG required, from this using
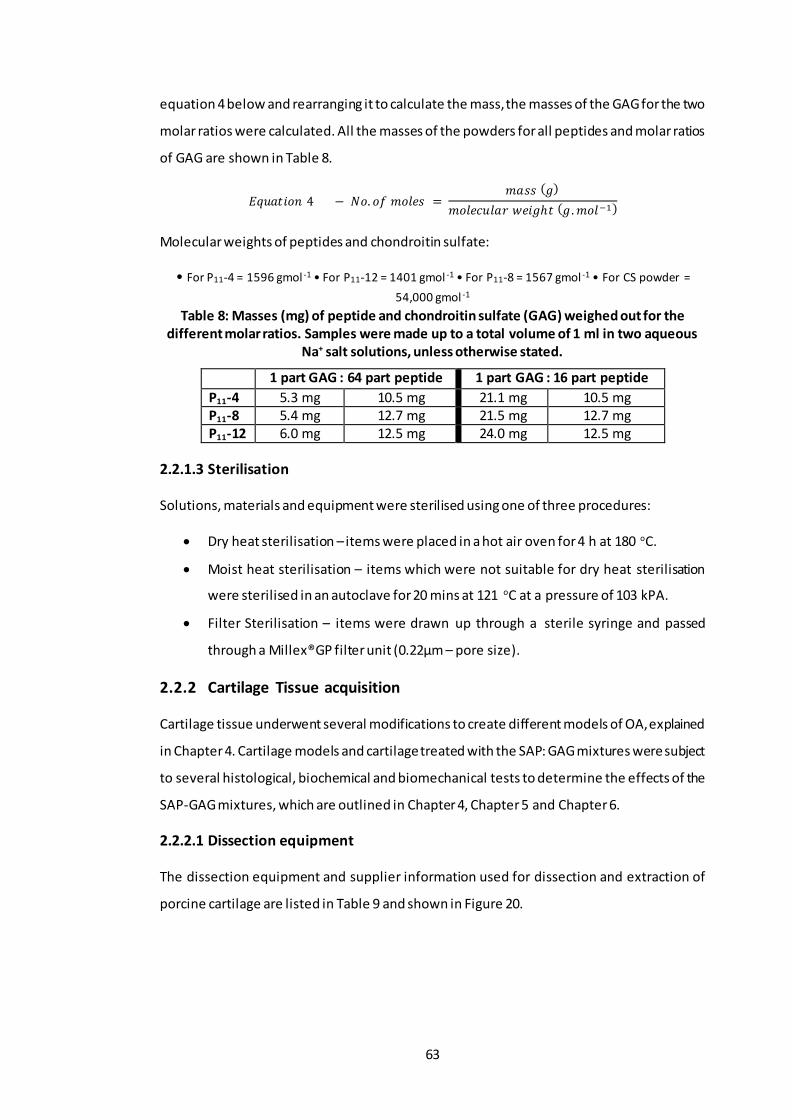
63
equation 4 below and rearranging it to calculate the mass, the masses of the GAG for the two
molar ratios were calculated. All the masses of the powders for all peptides and molar ratios
of GAG are shown in Table 8.
𝐸𝑞𝑢𝑎𝑡𝑖𝑜𝑛 4 − 𝑁𝑜. 𝑜𝑓 𝑚𝑜𝑙𝑒𝑠 = 𝑚𝑎𝑠𝑠 (𝑔)
𝑚𝑜𝑙𝑒𝑐𝑢𝑙𝑎𝑟 𝑤𝑒𝑖𝑔ℎ𝑡 (𝑔. 𝑚𝑜𝑙−1)
Molecular weights of peptides and chondroitin sulfate:
• For P11-4 = 1596 gmol -1 • For P11-12 = 1401 gmol -1 • For P11-8 = 1567 gmol -1 • For CS powder =
54,000 gmol -1
Table 8: Masses (mg) of peptide and chondroitin sulfate (GAG) weighed out for the different molar ratios. Samples were made up to a total volume of 1 ml in two aqueous
Na+ salt solutions, unless otherwise stated.
1 part GAG : 64 part peptide 1 part GAG : 16 part peptide
P11-4 5.3 mg 10.5 mg 21.1 mg 10.5 mg P11-8 5.4 mg 12.7 mg 21.5 mg 12.7 mg P11-12 6.0 mg 12.5 mg 24.0 mg 12.5 mg
2.2.1.3 Sterilisation
Solutions, materials and equipment were sterilised using one of three procedures:
• Dry heat sterilisation – items were placed in a hot air oven for 4 h at 180 oC.
• Moist heat sterilisation – items which were not suitable for dry heat sterilisation
were sterilised in an autoclave for 20 mins at 121 oC at a pressure of 103 kPA.
• Filter Sterilisation – items were drawn up through a sterile syringe and passed
through a Millex®GP filter unit (0.22µm – pore size).
2.2.2 Cartilage Tissue acquisition
Cartilage tissue underwent several modifications to create different models of OA, explained
in Chapter 4. Cartilage models and cartilage treated with the SAP: GAG mixtures were subject
to several histological, biochemical and biomechanical tests to determine the effects of the
SAP-GAG mixtures, which are outlined in Chapter 4, Chapter 5 and Chapter 6.
2.2.2.1 Dissection equipment
The dissection equipment and supplier information used for dissection and extraction of
porcine cartilage are listed in Table 9 and shown in Figure 20.

64
Table 9: Dissection equipment used throughout the study.
Equipment Size/Model Supplier
Bench top clamp - -
Bunsen Burner - Fisher Scientific Ltd
Corer (serrated drill attachment)
9 mm diameter Mechanical Engineering Workshop
Corer (serrated) 9 mm diameter Mechanical Engineering Workshop
Corer (smooth) 9 mm diameter Mechanical Engineering Workshop E-cut precision blade - Fien Industry power tools UK Ltd
Hand drill - Bosch Oscillating saw - Fien Industry power tools UK Ltd
Rat toothed forceps 125 mm length Fisher Scientific Ltd Scalpel handle Size 4 & 3 Swann Morton Ltd
Sterile stainless and carbon steel surgical blades
Size 22 & 10 Swann Morton Ltd
Straight pincer forceps Long and short Fisher Scientific Ltd
Figure 20: Dissection equipment. A- Hand held oscillating saw. B - Piezo electronic gas igniter. C – E-cut precision blade for multi master drill. D – Sterile stainless steel surgical
blade. E – Scalpel handle (size 3). F - Sterile carbon steel surgical blade. G - Scalpel handle (size 4). H – Smooth corer. I – Serrated corer. J – Serrated corer drill attachment. K – Pincer forceps (long). L – Pincer forceps (short). M – Bunsen burner. N – Hand held power drill. O -
Bench top vice for holding porcine knee condyles in place.
2.2.2.2 Dissection
Right hand-side porcine legs were supplied by local abattoirs 24 h after slaughter. Pigs were
aged ~ 6 months. The knee condyles, both medial and lateral were extracted in a sterile
environment using a Bunsen burner and sterile equipment. Condyles were used either
directly following extraction or if necessary for use the next day, the condyles were stored in
a moist environment at 4 oC overnight.
Porcine knees were dissected as shown in Figure 21. Excess tissue was removed from the
femur and surrounding skeletal structures to allow easier access. The knee joint was exposed
by severing all surrounding ligaments and excising the joint capsule. First the patella ligament
A
B C
D F E G I
H
K J
L
M
N O

65
was cut allowing extraction of the patella to expose the knee joint. Medial and lateral
collateral ligaments were cut allowing full flexion of the knee and exposure of the posterior
and anterior cruciate ligaments, which were then cut. The knee condyles were fully exposed;
cartilage was kept hydrated whilst extracting individual condyles or pins, by covering in
phosphate buffered saline (PBS) soaked tissue paper.
Figure 21: Dissection of porcine knee joints. (A) - Whole porcine leg. (B) – Incision made laterally to the knee. (C) – Enlargement of the incision site, parallel to the femur. (D) –
Removal of the lateral muscles/tissue. (E) – Removal of the medial lateral muscles/tissue. (F) – Excision of the patella tendon. (G) – Removal of the patella and exposure to the joint cavity. (H) – Collateral ligaments severed. (I) – Cruciate ligaments severed. (J) – Excision of
the meniscus ligaments to separate the femur from the tibia. (K) – Removal of excess tissue. (L) – All knee surface exposed.
2.2.2.3 Extraction of condyles and osteochondral pins
Osteochondral pins 9 mm in diameter were extracted from the cartilage surface of the
medial and lateral condyles. Usually two pins were taken from each condyle (medial and
lateral) for analysis, unless otherwise stated. Pins were initially marked out then a hand held
(A) (B) (C)
(D) (E) (F)
(G) (I) (H)
(J) (L) (K)

66
power drill with a specialist corer drill bit was used to cut into the subchondral bone. A hand
held corer was used to loosen the pin and extract it from the joint. The cartilage was carefully
removed from the bone, using a scalpel blade, leaving behind just the cartilage. Images of
this procedure are shown in Figure 22.
Figure 22: Extraction of osteochondral pins. (A) - Power drill with a specialist corer drill to cut subchondral bone. (B) - The power drill was drilled into the cartilage until the third line
last line of the specialist corer drill. (C and D) - A hand held corer was pushed into the cartilage to loosen the pin, forced was used to snap the pin and extract it from the joint. (E) – A specialised metal rod with a polyethylene tip was used to remove the pin from the hand held corer. (F) – A piece of PBS soaked blue roll was pushed down the central canal of the hand held corer with the help of the specialised metal rod. (G) Force was applied to the
specialised metal rod and the pin was removed from the hand held corer orifice. (H) - Representative image of porcine cartilage pin. (I) – Rat toothed forceps were used to secure the porcine cartilage pin and scalpel with a surgical blade was used to carefully remove the
cartilage from the bone. (J) – Cartilage removed from the bone.
Condyles were obtained using a hand held oscillating saw. An incision point to remove both
condyles was chosen at the distal end of the patella groove where it meets the anterior area
of the condyles. This narrowing ensured that the cut area exposed was small. The saw was
(A) (B)
(D)
(C)
(E)
(J)
(G)
(I) (H)
(F)

67
held in the transverse plane towards the posterior area of the condyle. A second incision site
was made in-between the two condyles in the sagittal plane. Individual condyles were then
placed in sterile 250 ml pots with sterile filter paper soaked in sterile PBS. Images of this
procedure are shown in Figure 23.
Figure 23: Extraction of Medial and Lateral condyles. A – Cut made at the distal end of the femoral patella groove to reduce cut area of cartilage. B-D – Anterior-posterior cut made to
remove the condyles from the femur. E – Lateral cut made to separate the medial and lateral condyles. F – Removal of individual condyles.
2.2.2.4 Storage of tissues
Cartilage tissue removed from osteochondral pins was labelled and placed in histology
cassettes (Histocette®). Condyles and the histology cassettes containing the cartilage tissue
were placed in sterile 250 ml pots with sterile filter paper soaked in sterile PBS and stored at
4 oC overnight.
2.2.3 Histological techniques
2.2.3.1 Zinc Fixation
Reagents:
Zinc fixative
Tris solution (0.1 M) was made by dissolving 12.1 g of Trizma base in 1000 ml of distilled
water using a magnetic stirrer. Calcium acetate (0.5 g) was added and dissolved and the pH
adjusted to 7.0-7.4 via the addition of 6 M hydrochloric acid (HCL) or 6 M sodium hydroxide
(NaOH) dropwise whilst being stirred using a magnetic stirrer. Zinc acetate (5 g) was dissolved
into the solution followed by 5 g of zinc chloride using a magnetic stirrer.
(A) (B) (C)
(D) (E) (F)

68
Method:
Cartilage tissue that had been placed in histological cassettes, was fixed using the zinc fixative
solution. Fixation took place in a sealed 250 ml pot immersed with 200 ml of the zinc fixative
solution for 16 hours to achieve complete fixation of samples.
Figure 24: Orientation of cartilage tissue for histology. Pins were bisected to remove the cartilage from the bone and then cut in half before being placed in histology cassettes.
Either the cut or cartilage surface was placed face down such that when moulded in wax, sections could be cut to observe the cartilage architecture from different angles.
2.2.3.2 Paraffin wax embedding
Once fixed, samples were placed in a Leica TP 1020 automated tissue processor and
processed using program 9 excluding the first step (formalin fixation). The samples were
immersed in 70 % (w/v) ethanol for 1 h followed by 1 h in 90 % (w/v) ethanol. Samples were
then immersed in absolute ethanol for 2 h 20 min, 3 h 20 min, and then 4 h and 20 min.
Immersion of xylene followed in cycles of 1 h, 1 h 30 min, and 2 h. Overall the process took
22 h. Samples were removed from the processor and oriented accordingly into the moulds,
as illustrated in Figure 24. Samples were covered in molten wax and left to set overnight at
room temperature, after which, excess wax was scraped away using a blunt blade.
2.2.3.3 Sectioning and slide preparation
A microtome (Leica RM2125 RTR) was used to section the wax embedded cartilage to a
thickness of 6 μm. Using forceps and a brush, thin sections were transferred to a water bath
at 50 oC. The sections were transferred onto Superfrost Plus slides and placed directly onto
a hotplate at 45 oC to bake on for 1 h and then transferred to slide rack and allowed to air
dry at room temperature.
2.2.3.4 Dewaxing and rehydration
Xylene solutions were used to dewax the sections. They were immersed twice in xylene for
10 min sections were then rehydrated in 3 successive immersions in 100% (w/v) ethanol for
Pin
Cartilage
Subchondral Bone
Cut Line
Cut Line
Orientation of cartilage in moulds
Direction of cutting

69
3 min, 2 min and then 2 min, followed by immersion in 70% (w/v) ethanol for 2 min. To finish
slides were placed in running tap water for 3 min to rehydrate the sections before staining.
2.2.3.5 Dehydration and mounting
Stained sections were dehydrated by immersion in 70% (w/v) ethanol for 5 sec, followed by
successive washes in 100% ethanol for 1 min 2 min and 3 min. Sections where then immersed
twice in xylene for 10 min. Cover slips were carefully mounted to the slides using 3 drops of
DPX mountant, avoiding any bubbles. If any bubbles were present, plastic tongs were used
to press and disperse them out of field of view of the section. Slides were left to dry in a fume
hood overnight before visualising by microscopy.
2.2.3.6 Microscopy
Bright-field microscopy was carried out using a Zeiss AX10 microscope. Where needed, the
tilling function was used to stich images together to enable visualisation of the full
architecture of the sample. Images were captured using the attached Zeiss digital camera
controlled through the Zen Zeiss software (image capture and digitalisation).
2.2.4 Histological staining methods
2.2.4.1 Safranin O/ fast green staining
Reagents:
• 0.1% (w/v) Safranin O, 500 mg of safranin O dye was dissolved in 500 ml of distilled
water.
• 0.02 % (w/v) Fast green, 100 mg of fast green dye was dissolved in 500 ml of distilled
water.
• 1 % (v/v) acetic acid, 5 ml of glacial acetic acid was mixed with 495 ml of distilled
water.
• 1 % acid alcohol, 5ml of concentrated hydrochloric acid was added to 495 ml of 70%
(w/v) ethanol.
• Weigerts haematoxylin, equal volumes of solution A and solution B (as supplied by
the manufacturer).
Safranin O stains proteoglycans whilst fast green stains collagen. Cell nuclei are stained with
Weigert’s haematoxylin. Following the dewaxing and rehydration (Section 2.2.3.4), slides
were placed in Weigert’s haematoxylin for 3 min and then run under cold tap water for 3
min. Sections were then immersed in fast green dye for 5 min before being rinsed in acetic
acid for 10 to 15 seconds and dabbed dry to remove excess liquid and placed straight into

70
safranin O for 4 min. Following this, sections were dehydrated and mounted, as described in
Section 2.2.3.5.
2.2.5 Biochemical Methods
2.2.5.1 Sample preparation
2.2.5.1.1 Lyophilisation
Cartilage tissue removed from the bone was macerated and placed in a bijous. Samples were
weighed three times and a mean wet weight was calculated. Samples were placed in a freeze
dryer (Thermo, Savant ModulyoD) at -50 oC, 0.15-0.2 mbar, and the weight measured every
24 h until constant (~72 hours).
2.2.5.1.2 Papain digestion
For quantification of sulfated proteoglycans, macerated, freeze-dried cartilage samples were
digested in papain.
Reagents:
• Digestion buffer, 0.788 g of L-cystine hydrochloride and 1.8612 g of disodium
ethylenediaminetetraacetic acid (EDTA) were dissolved in 1 litre of PBS. 6 M HCL or
6 M NaOH were added dropwise whilst using a magnetic stirrer, to achieve pH 6.0.
• Papain digestion solution, 96,012 kU of papain (Sigma A3824, Lot no#2B005436, 31.5
kU/mg) was dissolved in 60 ml of digestion buffer.
Method:
Papain digestion solution (5 ml) was added to each bijou containing the lyophilised cartilage
(~10-20 mg, dry weight) and incubated in a water bath at 60 oC for 36-48 h until fully digested.
2.2.5.2 Water content
The percentage water content was measured by weighing the cartilage before and after
lyophilisation (Section 2.2.5.1.1.). The water weight was then calculated by subtracting the
dry weight from the wet weight and is presented as a percentage of the tissue wet weight.
2.2.5.3 Quantification of sulfated sugars (GAG)
Quantification of GAGs in tissues was achieved via colorimetric analysis. The method used
was pioneered by Farndale et al., such that under acidic conditions the metachromatic
change in the 1,9-dimethylemethylene blue (DMB) cationic dye, as it binds to carboxyl or
sulfated groups of GAG chains, is detected. This change can be measured
spectrophotometrically (Farndale et al., 1982).
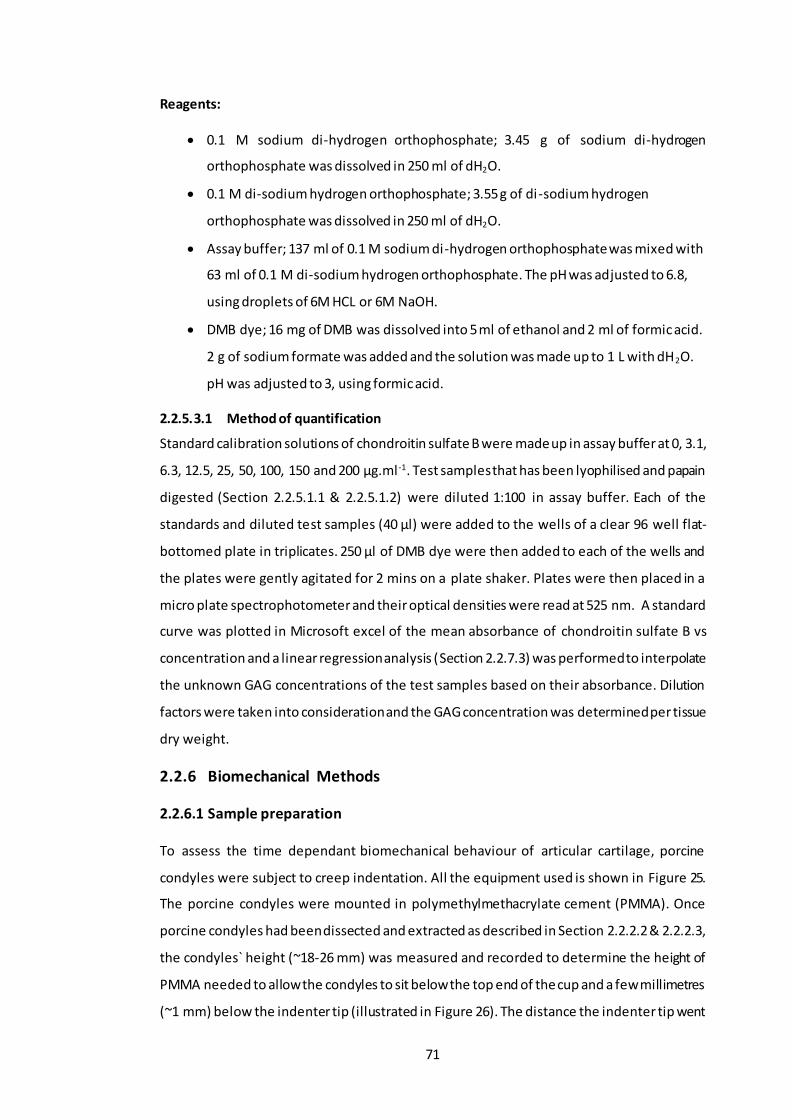
71
Reagents:
• 0.1 M sodium di-hydrogen orthophosphate; 3.45 g of sodium di-hydrogen
orthophosphate was dissolved in 250 ml of dH2O.
• 0.1 M di-sodium hydrogen orthophosphate; 3.55 g of di-sodium hydrogen
orthophosphate was dissolved in 250 ml of dH2O.
• Assay buffer; 137 ml of 0.1 M sodium di-hydrogen orthophosphate was mixed with
63 ml of 0.1 M di-sodium hydrogen orthophosphate. The pH was adjusted to 6.8,
using droplets of 6M HCL or 6M NaOH.
• DMB dye; 16 mg of DMB was dissolved into 5 ml of ethanol and 2 ml of formic acid.
2 g of sodium formate was added and the solution was made up to 1 L with dH2O.
pH was adjusted to 3, using formic acid.
2.2.5.3.1 Method of quantification
Standard calibration solutions of chondroitin sulfate B were made up in assay buffer at 0, 3.1,
6.3, 12.5, 25, 50, 100, 150 and 200 μg.ml -1. Test samples that has been lyophilised and papain
digested (Section 2.2.5.1.1 & 2.2.5.1.2) were diluted 1:100 in assay buffer. Each of the
standards and diluted test samples (40 μl) were added to the wells of a clear 96 well flat-
bottomed plate in triplicates. 250 μl of DMB dye were then added to each of the wells and
the plates were gently agitated for 2 mins on a plate shaker. Plates were then placed in a
micro plate spectrophotometer and their optical densities were read at 525 nm. A standard
curve was plotted in Microsoft excel of the mean absorbance of chondroitin sulfate B vs
concentration and a linear regression analysis (Section 2.2.7.3) was performed to interpolate
the unknown GAG concentrations of the test samples based on their absorbance. Dilution
factors were taken into consideration and the GAG concentration was determined per tissue
dry weight.
2.2.6 Biomechanical Methods
2.2.6.1 Sample preparation
To assess the time dependant biomechanical behaviour of articular cartilage, porcine
condyles were subject to creep indentation. All the equipment used is shown in Figure 25.
The porcine condyles were mounted in polymethylmethacrylate cement (PMMA). Once
porcine condyles had been dissected and extracted as described in Section 2.2.2.2 & 2.2.2.3,
the condyles` height (~18-26 mm) was measured and recorded to determine the height of
PMMA needed to allow the condyles to sit below the top end of the cup and a few millimetres
(~1 mm) below the indenter tip (illustrated in Figure 26). The distance the indenter tip went

72
into the cup holder was measured (~6 mm); this was marked out on the inside of the cup in
several spots around the circumference of the cylindrical cup with a ruler and permanent
pen. From this distance, the height of the condyle was measured down into the cup and
another marking was made along the circumference of the cup holder.
Figure 25: Indentation apparatus. The equipment used to perform creep indentation testing to determine deformation of porcine condylar cartilage. (A) - Indentation rig and
components. (B) – Sample holder, stage adjuster and indenter.
Figure 26: Cross-sectional view of the cup holder, showing how the condyle was orientated inside the cup holder and outlining rough distances and heights of relative
components.
LVDT
Shaft
Load Cell
Sample holder
Adjustable Stage
Weights attached to the top of indenter shaft
Void filled with PBS to cover condyle
~ 1 mm
~ 6 mm
Measured height of condyles
Indenter with 2.5 mm indenter tip attached
Condyle
Cup Holder PMMA Cement: the 1st set of cement was poured and allowed to set before the 2nd was poured.
Adjustable platform
1st
2nd ~ 2 mm

73
PMMA powered was weighed and whilst stirring simultaneously, the methyl-methacrylate
liquid was added to the powder until a thick silky paste was achieved. The thick paste was
poured into the cup holder up to the lower line previously marked out and left to set. Another
batch of PMMA paste was made up of a much thinner consistency (added more methyl
methacrylate liquid) and left to one side. Once the PMMA had set hard, the condyle was
placed in the centre of the cup holder, with a piece of moistened PBS paper covering the
condyle surface. The second batch of PMMA paste was poured into the cup holder carefully,
making sure not to pour it directly over the condyle. The PMMA paste surrounded and
covered the bottom half (~2 mm) of the condyle. This was left to set and fresh moistened
PBS paper towels were placed over the condyle to stop it from drying out. Once the PMMA
had set hard and cooled down the sample was ready to test.
2.2.6.2 Method
Generally, PBS was added to the cup holder to completely submerge the condyle whilst
testing. Variation from this method is detailed in the relevant Sections. An impermeable,
stainless steel flat indenter (2.5 mm diameter) was used to indent the cartilage with a set
load over 1 h. The extra load added to the top part of the shaft (Figure 26), is detailed in the
relevant Sections. The cup holder was placed on the adjustable platform and the cup holder
was raised so that the indenter was positioned about ~1 mm above the cartilage surface. The
adjustable platform was then secured with a locking nut at the bottom to avoid shaking and
vibration once the cup holder was set to the required height. The lowering of the indenter
shaft was controlled via a silicone filled dashpot to reduce the speed of impact, the full load
was applied within 0.2 sec. The displacement of the indenter was measured using a linear
variable differential transducer (LVDT, RDP D5-200H, 2 mv/V/0.001 sensitivity, Electrosence,
PA, USA) and the resistance force measured using a piezo-electric force transformer (Part
No. 060-1896-02, Electrosence, PA, USA). The data from the LVDT and force sensors were
passed through analogue-to-digital converters and acquired at a 10 Hz sampling frequency
and stored on a computer using Labview 8 software (National Instruments). Once the
condyle had been immersed in PBS for 10 minutes and located in the correct place, the lock
holding the indenter tip was released to start the experiment. After one hour of testing, the
condyle was removed and the area that had been indented was marked out using a non-
permanent pen (Figure 27) and the condyles were stored in plastic Tupperware on moist PBS
soaked tissue at 4 0C, to allow the tissue to recover before measuring cartilage thickness.
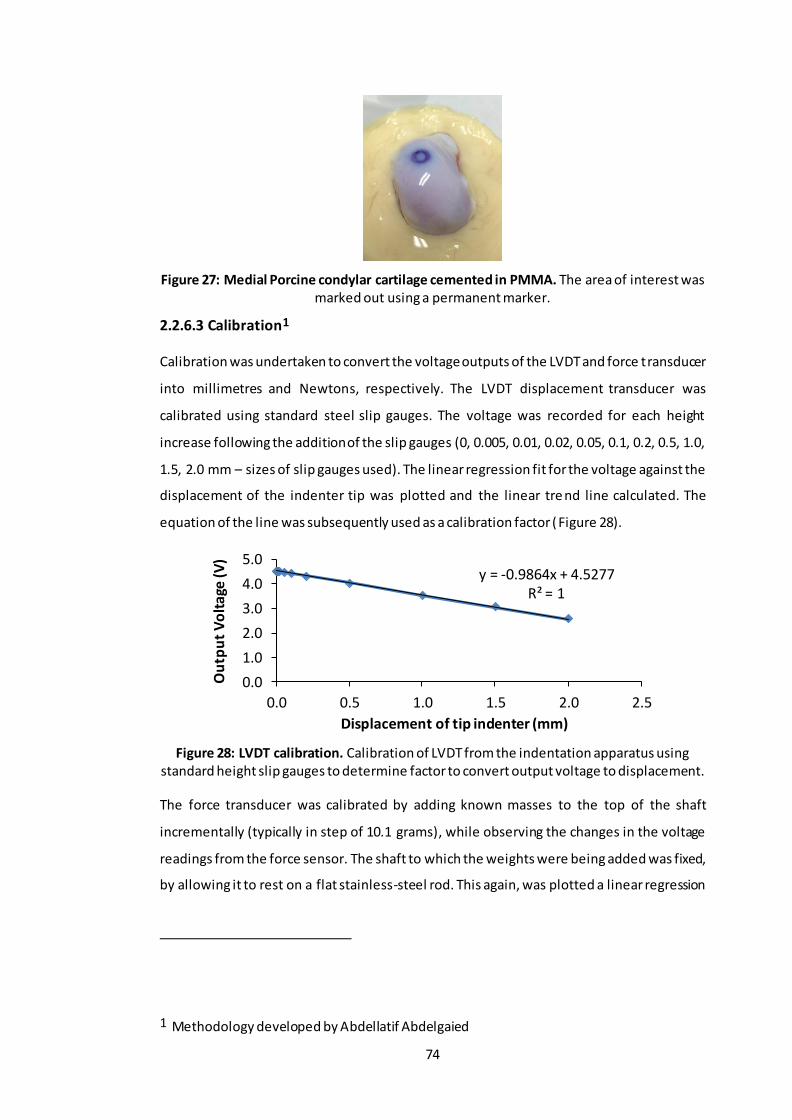
74
Figure 27: Medial Porcine condylar cartilage cemented in PMMA. The area of interest was marked out using a permanent marker.
2.2.6.3 Calibration1
Calibration was undertaken to convert the voltage outputs of the LVDT and force transducer
into millimetres and Newtons, respectively. The LVDT displacement transducer was
calibrated using standard steel slip gauges. The voltage was recorded for each height
increase following the addition of the slip gauges (0, 0.005, 0.01, 0.02, 0.05, 0.1, 0.2, 0.5, 1.0,
1.5, 2.0 mm – sizes of slip gauges used). The linear regression fit for the voltage against the
displacement of the indenter tip was plotted and the linear tre nd line calculated. The
equation of the line was subsequently used as a calibration factor (Figure 28).
Figure 28: LVDT calibration. Calibration of LVDT from the indentation apparatus using standard height slip gauges to determine factor to convert output voltage to displacement.
The force transducer was calibrated by adding known masses to the top of the shaft
incrementally (typically in step of 10.1 grams), while observing the changes in the voltage
readings from the force sensor. The shaft to which the weights were being added was fixed,
by allowing it to rest on a flat stainless-steel rod. This again, was plotted a linear regression
1 Methodology developed by Abdellatif Abdelgaied
y = -0.9864x + 4.5277R² = 1
0.0
1.0
2.0
3.0
4.0
5.0
0.0 0.5 1.0 1.5 2.0 2.5
Ou
tpu
t V
olt
age
(V)
Displacement of tip indenter (mm)

75
graph (voltage against load) and the equation of the trend line was used to convert voltage
to Newtons (Figure 29).
Figure 29: Load cell calibration. Calibration of load cell from the indentation apparatus using standard known masses to determine the factor to convert output voltage into
Newton’s.
2.2.6.4 Cartilage thickness measurements
Cartilage thickness was measured to normalise the deformation data for each cartilage
condyle, so that the percentage deformation could be presented and material properties
could be derived. The thickness was measured using an Instron material testing machine
(Instron 3365B, INSTRON, University of Leeds - Figure 30A) with a needle attached to a force
transducer. Condyles that had previously been cemented in PMMA cement (Section 2.2.6.1)
and allowed to recover in a sealed Tupperware box moistened with PBS tissue at 40C
overnight, were fixed to the base of the material testing machine using 4 screws (Figure 30B).
This allowed the area of indentation to be located directly underneath the needle indenter.
The needle attached to the Instron arm was manually positioned ~1 mm above the cartilage
surface (Figure 30C). During testing the arm was controlled via a PC graphic user interface
(Bluehill Software V) and lowered at a rate of 4.5 mm.min-1. The resistance to motion was
measured using a 500 N load cell.
Figure 30: Picture of Instron testing equipment. (A) - Picture of Instron 3365B used for
cartilage thickness measurements. (B) - Instron base for attachment of cemented porcine condyle (C) – Starting position of needle (circa 1 mm from cartilage surface) before
cartilage thickness indentation method commenced.
y = 0.0099x - 0.0524R² = 0.9999
-0.1
0.0
0.1
0.2
0.3
0.4
0 10 20 30 40 50
Ou
tpu
t V
olt
age
(V)
Load (g)
(B) (C) (A)

76
The cartilage thickness was defined as the distance between the increase in resistance
(measured in Newtons) from the initial needle contact with the cartilage surface and the
steep increase in resistance from the needle coming into contact with the stiffer bone (Figure
31). Each condyle was indented 6 times on the periphery of the area that had been previously
indented, taking care not to indent inside that area. An average of the thickness was
calculated.
Figure 31: Needle indentation graph interpretation. This diagram shows how the cartilage thickness was determined from the needle indentation.
2.2.6.5 Finite element method for derivation of material properties
Cartilage deformation curves generated in Section 2.2.6.2 along with cartilage thicknesses
measured in Section 2.2.6.4 were used to derive the permeability and equilibrium elastic
modulus of the cartilage. An axisymmetric poroelastic biphasic finite element model
(ABAQUS, version 6.9-1 Dassault Systemes, Suresnes Cedex, France) developed by Pawaskar
et al. was used to simulate the indentation tests and derive the biphasic material parameters
- permeability (k) and elastic modulus (E) of the cartilage samples (Figure 32) (Pawaskar et
al., 2010; Pawaskar et al., 2011).
The cartilage was modelled as a poroelastic material and meshed with 900 four-node bilinear
displacement and pore pressure elements CAX4P, whereas the subchondral bone was
modelled with 225 four-node bilinear elastic elements CAX4. The choice of elements for
these regions in the cartilage meant that there was no fluid flow between cartilage and
subchondral bone, making it an impermeable boundary, shown in Figure 32. The cartilage
model was assigned a water content of 80% and a Poisson’s ratio of zero, in order to
Cartilage Thickness (mm)
Re
sist
ive
load
(N
)
Needle Displacement (mm)

77
maximise the biphasic effect or compressibility (Pawaskar et al., 2010; Jin et al., 2000). The
metal indenter was modelled as rigid, since its elastic modulus was at least 5 orders of
magnitude greater than that of cartilage.
Figure 32: Finite element model of cartilage. This schematic shows the axis of symmetry and the imposed fluid flow restrictions in the model.
The FE model aims to mimic the method that was outlined in Section 2.2.6.2. The load was
increased from 0 to a max load (specified in each Section), over 2 seconds through the
indenter and applied for 1 hour in total. A graph showing the deformation/time was
produced by the FE model based on the material properties (permeability and equilibrium
elastic modulus) set, these starting material properties varied depending on the study being
done. The closeness of fit between the final 30 % of the FE model data and the experimental
data was assessed using MATLAB (version 7.4, MathWorks Inc, Boston, MA, USA; Figure 33).
The input initial material properties were adjusted to minimise the squared error. An R2 value
greater than 0.75 (75%) was accepted as significant for biological tissue. Equilibrium elastic
modulus’s and permeability values of each cartilage sample were chosen from the initial
material properties that gave the highest R2 value.
Cartilage
Bone
Axi
s o
f sym
me
try
Flat indenter (2.5 mm diameter)
No fluid flow Free fluid flow
Contact dependant flow

78
Figure 33: Experimental and modelled cartilage displacement curves. The FE model curve was fitted to the deformation curve produced by the experimental data to reach the
highest possible agreement by altering the input material properties.
2.2.6.5.1 Sensitivity Analysis
A sensitivity analysis was carried out to determine if changing the end boundary condition
(BC) on the left-hand side of the cartilage pin (red line - Figure 32), from ‘free-flowing fluid’
to ‘no fluid flow’ made a significant difference to the elastic modulus and permeability of the
samples being tested. The experimental deformation data from 6 healthy pig condyles was
input into the FE model. The same set of data was run twice. (BC-1) the first time the data
was run with the left-hand side boundary condition with a ‘free fluid flow’ and (BC-2) the
second time it was run with ‘no fluid flow’. The data is shown in Figure 34.
Figure 34: Equilibrium elastic modulus and permeability of healthy native medial condylar cartilage under a load of 0.31 N (Blue – Healthy condylar cartilage with the ‘no fluid flow’
boundary condition; Red – Healthy condylar cartilage with the ‘fluid flow’ boundary condition). Data is expressed as the mean (n=6) ± 95 % confidence limits. The R2 values
define how close the FE model curve fitting was to the last 70% of the experimental deformation curve, the closer the R2 value is to 1, the better the fit. The data was analysed
by Student`s t-test; *p<0.05. This revealed that changing the left-hand side boundary condition from ‘no fluid flow’ to ‘fluid flow’ did not significantly affect the elastic modulus
nor the permeability of the healthy native cartilage.
0.00E+00
1.00E-15
2.00E-15
3.00E-15
4.00E-15
5.00E-15
6.00E-15
0
0.1
0.2
0.3
0.4
0.5
0.6
Elastic Modulus Permeability
Pe
rme
abil
ity
(m
4/N
.s)
Elas
tic
Mo
du
lus
(MP
a)
Healthy (BC) Healthy (No BC)
R2 = 0.95 R2 = 0.95 R2 = 0.95 R2 = 0.95
0
0.1
0.2
0.3
0.4
0.5
0 600 1200 1800 2400 3000 3600
De
form
atio
n (m
m)
Time (Secs)
Experimental FEA
R2 = 0.997

79
The elastic modulus and permeability values of the healthy native cartilage samples with BC-
1 were compared to the healthy native cartilage samples with BC-2, to determine if there
were any difference. The data was analysed by Student’s t-test to determine differences
between group means. This showed that the elastic modulus and permeability values of the
healthy native cartilage samples run with BC-1 were not significantly different to those of
healthy native cartilage samples run with BC-2. Therefore, it was decided to run future FE
models with the ‘free fluid flow’ boundary condition (BC-1) given the results of this sensitivity
analysis.
2.2.7 Statistical analysis
2.2.7.1 Confidence limits
Microsoft Excel (version 2013, Microsoft) was used to analyse numerical data produced in
this thesis. 95% confidence limits (CL) were chosen over standard error and standard
deviation because 95 % CL are the most accurate and honest way of presenting the data of
small samples sizes (n=3). 95 % CL take into account the sample size, whereas for the
standard error, one has to provide the readership with the sample size so that the region in
which the true mean lies, can be calculated. In this study the numerical data has been
presented as the mean (n≥3) ± 95 % CL. The ± 95 % confidence intervals (α = 0.05) were
calculated using the descriptive statistics option of the data analysis package in Microsoft
Excel.
2.2.7.2 ANOVA
An analysis of variance was used when comparing the means of more than two groups.
Individual differences between the data sets were identified by performing a Tukey Kramer
post-hoc analysis to identify significant differences between group means.
2.2.7.3 Linear regression analysis
When interpolation of results was required, a linear regression analysis was performed on
standard curves.
𝑈𝑛𝑘𝑛𝑜𝑤𝑛 𝑥 =𝑀𝑒𝑎𝑛 𝑚𝑒𝑎𝑠𝑢𝑟𝑒𝑑 𝑦 𝑣𝑎𝑟𝑖𝑎𝑏𝑙𝑒𝑠
𝑦 𝑣𝑎𝑙𝑢𝑒 𝑜𝑓 𝑙𝑖𝑛𝑒𝑎𝑟 𝑟𝑒𝑔𝑟𝑒𝑠𝑠𝑖𝑜𝑛 𝑙𝑖𝑛𝑒 𝑒𝑞𝑢𝑎𝑡𝑖𝑜𝑛
2.2.7.4 Arcsin transformation
When data is presented as a percentage or proportion, data values were transformed to
arcsin to allow accurate calculation of the 95 % CL and statistical analysis. After analysis,
values were transformed back for presentation.
80
Chapter 3 The effect of GAG molar ratio and Na+ ion concentration in
two different salt solutions on the biochemical, morphological and
biomechanical properties of peptides: P11-4, P11-8 and P11-12
3.1 Introduction
The overall aim of this research is to investigate the utility of a multi-component system
whereby GAGs are delivered into GAG depleted cartilage using a carrier self-assembling
peptide (SAP) which is initially delivered as a non-viscous fluid. Subsequently, once in place,
the SAPS are triggered by the physiological environment to self-assemble into a gel
incorporating the GAGs.
Osteoarthritic cartilage has reduced biomechanical properties and this is primarily due to the
gradual loss of GAGs. There is a great deal of interest in the research and development of
early intervention treatments to repair or replace damaged cartilage in an attempt to delay
the progression of OA and the need for joint replacement. One approach to repair early
cartilage degradation is to restore GAG levels with the aim of maintaining functional cartilage
material properties (Katta et al., 2008).
Peptides have been shown to readily self-assemble into higher order structures that create
very stable hydrogels under physiological conditions and have been used to develop novel
materials for regenerative medicine applications (Zhang et al., 2005; Bell et al., 2006; Firth et
al., 2006; Kirkham et al., 2007; Galler et al., 2008; Schneider et al., 2008; Kyle et al., 2009;
Kyle et al., 2010). The P11-X family of self-assembling peptides (SAPs), are rationally designed
11 residue long peptides, with strategically placed hydrophobic and hydrophilic amino acids,
which have been studied extensively (Kyle et al., 2010; Aggeli et al., 2001; Maude et al.,
2011). The SAPs in this study, have the ability to form hydrogels f rom an initial non-
Newtonian fluid state upon application of a trigger, they have been shown to be
biocompatible and studies have indicated that they have potential as a visco-
supplementation treatment for early stage OA (Bell et al., 2006). The combination of these
self-recovering peptides with GAGs, which may provide increased bio-functionality, along
with their ability to be delivered in a minimally invasive manner, makes them ideal candidates
as injectable materials for use as a potential intervention therapy for early stage OA.
A key challenge is the control over the mechanical properties of these hydrogels which can
be affected by the concentration of the peptide, the net charge of the peptide and also the
environmental conditions such as pH and ionic strength (Aggeli et al., 2001; Miles, 2012). For

81
potential application in the treatment of early stage OA; SAP-GAG mixtures with three
favourable properties would be desirable: high β-sheet percentage, long-woven fibrilar
networks which are densely packed and have a high stiffness, all of which must occur in
specific physiological conditions. Cartilage contains varying counter ions and the amounts
and species depend on the region of the cartilage. These counter ions are important for the
biomechanical function of cartilage (Urban, 1994). Urban (1994) summarised the range of
ion concentrations in two discreet areas of articular cartilage, at the surface ([Na+] 210-230
mM, [K+] 7mM [Ca2+] 4-6 mM, [Cl-] 100-110mM) and in deep cartilage ([Na+] 260-320 mM,
[K+] 9-11 mM, [Ca2+] 8-15 mM, [Cl-] 70-90 mM). The primary interest is in replacing depleted
GAGs near the surface of cartilage and therefore it was important to investigate the
behaviour of P11-X peptides and P11-X-GAG mixtures in the physiological conditions
representative of this region.
Fourier transform infra-red spectroscopy (FTIR), has been used to analyse the secondary
structure of peptides, in particular the amide I region. The peptides used in this study have
been designed to self-assemble into β-sheet character. Therefore, interest lies in analysing
the β–sheet percentage of these peptides and peptide: GAG mixtures. Transmission electron
microscopy (TEM), allows for high resolution images of the macro and micro-structures of
the peptides in a self-assembled state. At the micro-level, the fibril/fibre formation can be
analysed morphologically. Thicknesses and of the peptide fibril/fibres can also be calculated.
Rheology has previously been used to explore the biomechanical properties of various
peptide hydrogels, and also to study their gelation mechanisms during and after flow (Aggeli
et al., 1997). Rheology may be used to mimic the mechanical process that these hydrogels
would undergo if used in vivo in cartilage, such as shear under load. Walking frequency (stride
length) is ca. 1Hz (60 strides per minute) (Danion et al., 2003; Mason et al., 2005). Therefore,
the rheological behaviour of the assembled peptides and assembled peptide/GAG mixtures
were compared at 1Hz. The GAG chosen in this study, was chondroitin sulfate. Chondroitin
sulfate, is the most abundant GAG in the proteoglycans present in native cartilage. Molar
ratios of 1:16 and 1:64 were chosen based on findings presented by Aggeli et al. (2001) and
Ng et al. (2003). Aggeli et al. described a model in which the length and width of peptide
fibrils could be calculated through theoretical principles and assumptions paramount to
concentration dependent self-assembly, which are based upon the monomeric peptide
concentration. Furthermore, Ng et al. calculated the average individual core-protein end to
end length, GAG chain length (average number of disaccharides per chain) and GAG to GAG
spacing of two types of aggrecan from foetal and mature cartilage from atomic force
microscopy (AFM) images and measurements (Ng et al., 2003). In this study, the peptide

82
mimicked the role of the core protein in the aggrecan. Therefore, combining information
from both these studies, it was possible to determine the amount of GAGs that would be
needed to be give the correct ratio of GAGs to peptide.
3.2 Aims and objectives
The aims of this part of the study were to determine the effects of combining the SAPs with
chondroitin sulfate (GAG) at two molar ratios of 1:16 and 1:64 in 130 mM and 230 mM Na+
salt solutions, representative of normal physiological conditions and the physiological
environment within the surface of articular cartilage. The specific objectives were:
1) To determine the β-sheet percentage of the peptides and peptide/GAG mixtures in
physiological conditions.
2) To assess the fibril morphology of the peptides and peptide/GAG mixtures in physiological
conditions.
3) To determine the biomechanical properties (stiffness) of the peptides and peptide/GAG
mixtures in physiological conditions.
3.3 Methods
This section summarises the procedures generally used to prepare peptide solutions for FTIR
and transmission electron microscopy (TEM). Any exceptions to these procedures are
detailed in the appropriate sections.
Peptides and GAG were weighed as detailed in Chapter 2; Sections 2.2.1.1 and 2.2.1.2,
respectively. With the exception that in this study for the TEM and FTIR, the concentration
(w/v) of peptide used was 5 mg.ml-1.
3.3.1 Dissolution of peptides, peptide: GAG mixtures and Na+ salt
solutions.
3.3.1.1 Dissolution of peptides for studies of peptide alone.
The appropriate Na+ salt solution (300 µl; described below) was added to the weighed
peptides. Peptides were then taken to a monomeric state (unless otherwise stated), which
was determined by achieving the required pH or [pD] and observing the fluidity of the gels;
monomeric peptides were clear and exhibited water like properties (above pH 12 [pD 11.6]
for P11-4 and below pH 3 [pD 2.6] for P11-8 and P11-12). Between 50-100 µl of 0.1–3 M HCl or
NaOH [DCl or NaOD] aliquots were added during this process before the monomeric
solutions were carefully taken to pH7.4 [pD 7] using 50-100 µl of 0.1–3 M HCl and NaOH [DCl

83
and NaOD]. The containers were sealed with Parafilm, vortexed for ≈40 seconds and
sonicated in a water bath at 35 kHz at 37oC for two hours before storage at 4oC overnight to
allow the peptides to equilibrate and prevent any contamination. The pH [pD] was re-
measured and re-adjusted to pH 7.4 [pD 7] the following day and the final volumes were
adjusted to 0.5 ml.
3.3.1.2 Dissolution of peptides and chondroitin sulfate for studies of peptide: GAG
mixtures.
The peptides were treated as described in Section 3.3.1.1, except that chondroitin sulfate
was added before bringing the pH back to 7.4. Chondroitin sulfate powder was weighed
(Chapter 2; Section 2.2.1.2) and 50-100 µl of the appropriate Na+ salt solution was added.
The chondroitin sulfate solution was vortexed for ≈40 seconds and sonicated in a water bath
at 35 kHz for a further ≈ 5 minutes at 37oC. The chondroitin sulfate solution was added to the
monomerised peptide and vortexed for a further 40 seconds. After bringing the PEP-GAG
mixture to pH 7.4 [pD 7] and adding the Na+ salt solution to make the final volume to 0.5 ml,
the mixture was vortexed for ≈40 seconds and sonicated in a water bath at 35 kHz at 37oC
for two hours. Samples were refrigerated overnight (4°C) to allow them to equilibrate and
the pH was re-measured and re-adjusted to pH 7.4 [pD 7] the following day. The final volumes
of the mixtures were adjusted to 0.5 ml.
3.3.1.3 Dissolution of physiological salts to make up two concentrations of Na+ salt
solutions.
The peptides and PEP-GAG mixtures were studied in two aqueous salt solutions containing
varying Na+ ion concentrations (130 mM & 230 mM), unless otherwise stated. These two salt
solutions contained all the ions present in cartilage (Urban, 1994). The salts present within
these two salt solutions and their concentrations are listed in Table 10. The only species that
varied between the two salt solutions was the concentration of Na+ ions. Throughout this
thesis an increase in the salt concentration is described as an increase in the Na+ ion
concentration. The solvent used to dissolve the ions, peptides and chondroitin sulfate in this
study was distilled water (H2O), unless otherwise stated (Section 3.3.1).
Table 10: Concentrations of different salts present in the two physiological salt solutions.
Salt Salt solution 1 (130mM of NaCl)
(mg.ml-1) Salt solution 2 (230mM of NaCl)
(mg.ml-1)
KCl 0.522 0.522
CaCl2 0.555 0.555
NaCl 5.143 5.143
NaHCO3 3.528 11.929

84
3.3.2 Measurement and adjustment of pH
All samples were adjusted to pH or pD (pH in deuterated solutions) of 7.4 ± 0.3, unless
otherwise specified. Measured pD values quoted here were those following the a 0.4
correction value subtracted from the pH meter reading (Glasoe and Long, 1960). Sample pH
was determined using a Sartorius Docu-pH meter and a pH electrode probe. The probe was
filled with and stored in a 3 M KCl solution.
Prior to use, the Sartorius Docu-pH meter was calibrated using three different pH standard
buffers at pH 4, 7 and 10 (each within ± 0.01 pH units at 25oC). Following this procedure, the
value of the pH 7 buffer was rechecked to ensure correct calibration.
The pH of the solutions was adjusted using micro-litre aliquots of 0.05, 0.1, 0.25, 0.5 and 1 M
HCl and NaOH [DCl and NaOD for the FTIR study]. After each addition of acid or base, the
solution was vortexed (≈ 10 seconds), and its pH or pD rechecked.
3.3.3 Fourier Transform Infra-Red Spectroscopy (FTIR)
3.3.3.1 Background to FTIR analysis of peptides
The application of FTIR spectroscopy to peptides allows their secondary structure to be
analysed. When a molecule absorbs IR light, the oscillating dipole moment interacts with the
oscillating electric vector of the IR beam (Williams and Fleming, 1995). A bond within a
molecule can experience different types of oscillation depending on the energy between its
ground state and excited state. The amount of energy absorbed is dependent on changes in
the dipole moment. Bonds that are non-polar show weak absorption and those that are
polar, such as C=O, show strong absorption. Complex molecules will have a variety of
vibrational modes, these will consist of vibrations from individual bonds but there will also
be vibrations from functional groups. The main amide vibrational modes are termed A and B
and I-VII, which enable the study of peptide secondary structure. Of these modes, amides I
to III are of most interest for proteins (Table 11) (Seshadri et al., 1999).
Table 11: Characteristic infrared bands of the peptide (Susi, 1972).
Amide Band Wavenumber (cm-1) Origin
A ~3300 NH Stretching
B ~3100 NH stretching I 1600-1690 C=O Stretching
II 1480-1575 CN Stretching, NH Bending III 12229-1301 CN Stretching, NH Bending
IV 625-767 OCN bending mixed with other nodes V 640-800 Out of plane NH Bending
VI 537-606 Out of plane C=O Bending
VII ~200 Skeletal Torsion
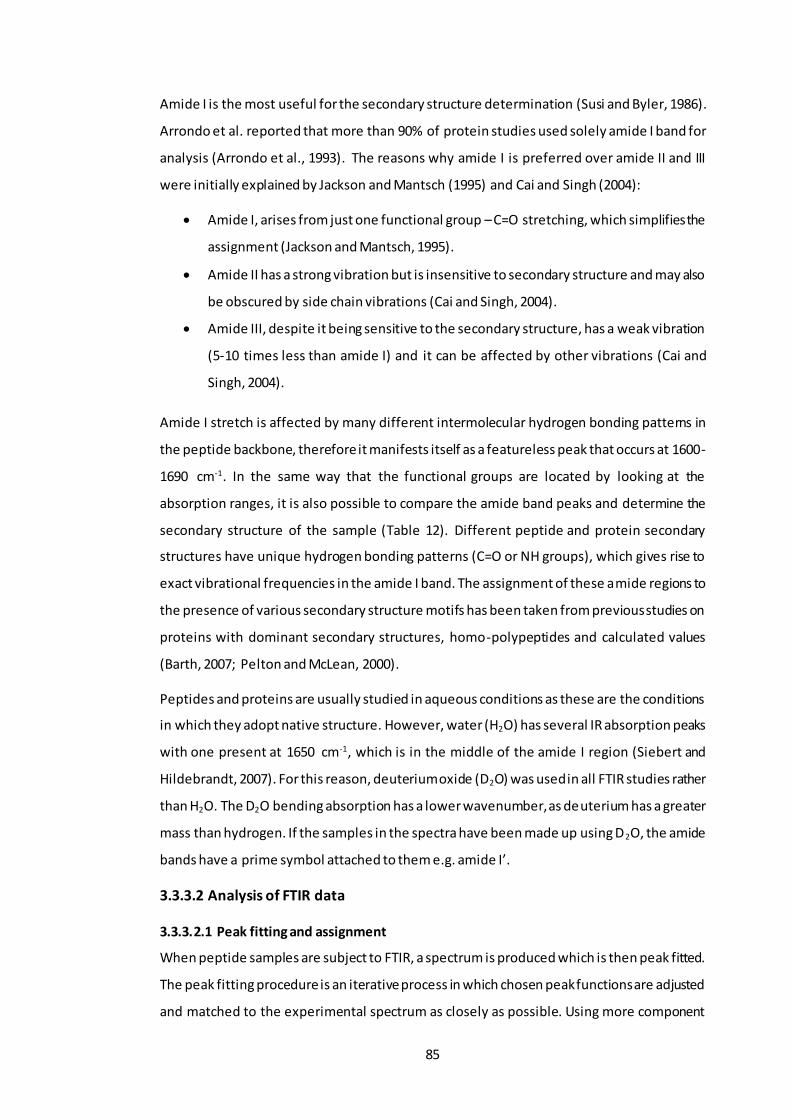
85
Amide I is the most useful for the secondary structure determination (Susi and Byler, 1986).
Arrondo et al. reported that more than 90% of protein studies used solely amide I band for
analysis (Arrondo et al., 1993). The reasons why amide I is preferred over amide II and III
were initially explained by Jackson and Mantsch (1995) and Cai and Singh (2004):
• Amide I, arises from just one functional group – C=O stretching, which simplifies the
assignment (Jackson and Mantsch, 1995).
• Amide II has a strong vibration but is insensitive to secondary structure and may also
be obscured by side chain vibrations (Cai and Singh, 2004).
• Amide III, despite it being sensitive to the secondary structure, has a weak vibration
(5-10 times less than amide I) and it can be affected by other vibrations (Cai and
Singh, 2004).
Amide I stretch is affected by many different intermolecular hydrogen bonding patterns in
the peptide backbone, therefore it manifests itself as a featureless peak that occurs at 1600-
1690 cm-1. In the same way that the functional groups are located by looking at the
absorption ranges, it is also possible to compare the amide band peaks and determine the
secondary structure of the sample (Table 12). Different peptide and protein secondary
structures have unique hydrogen bonding patterns (C=O or NH groups), which gives rise to
exact vibrational frequencies in the amide I band. The assignment of these amide regions to
the presence of various secondary structure motifs has been taken from previous studies on
proteins with dominant secondary structures, homo-polypeptides and calculated values
(Barth, 2007; Pelton and McLean, 2000).
Peptides and proteins are usually studied in aqueous conditions as these are the conditions
in which they adopt native structure. However, water (H2O) has several IR absorption peaks
with one present at 1650 cm-1, which is in the middle of the amide I region (Siebert and
Hildebrandt, 2007). For this reason, deuterium oxide (D2O) was used in all FTIR studies rather
than H2O. The D2O bending absorption has a lower wavenumber, as deuterium has a greater
mass than hydrogen. If the samples in the spectra have been made up using D2O, the amide
bands have a prime symbol attached to them e.g. amide I’.
3.3.3.2 Analysis of FTIR data
3.3.3.2.1 Peak fitting and assignment
When peptide samples are subject to FTIR, a spectrum is produced which is then peak fitted.
The peak fitting procedure is an iterative process in which chosen peak functions are adjusted
and matched to the experimental spectrum as closely as possible. Using more component
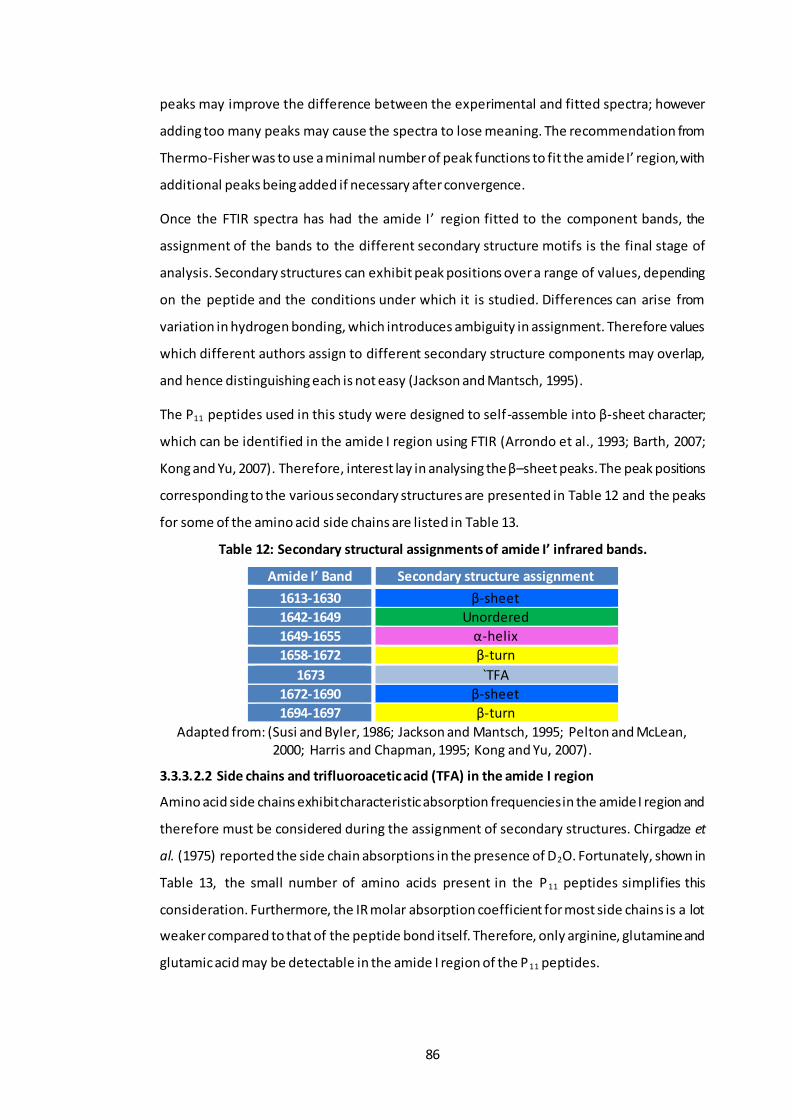
86
peaks may improve the difference between the experimental and fitted spectra; however
adding too many peaks may cause the spectra to lose meaning. The recommendation from
Thermo-Fisher was to use a minimal number of peak functions to fit the amide I’ region, with
additional peaks being added if necessary after convergence.
Once the FTIR spectra has had the amide I’ region fitted to the component bands, the
assignment of the bands to the different secondary structure motifs is the final stage of
analysis. Secondary structures can exhibit peak positions over a range of values, depending
on the peptide and the conditions under which it is studied. Differences can arise from
variation in hydrogen bonding, which introduces ambiguity in assignment. Therefore values
which different authors assign to different secondary structure components may overlap,
and hence distinguishing each is not easy (Jackson and Mantsch, 1995).
The P11 peptides used in this study were designed to self-assemble into β-sheet character;
which can be identified in the amide I region using FTIR (Arrondo et al., 1993; Barth, 2007;
Kong and Yu, 2007). Therefore, interest lay in analysing the β–sheet peaks. The peak positions
corresponding to the various secondary structures are presented in Table 12 and the peaks
for some of the amino acid side chains are listed in Table 13.
Table 12: Secondary structural assignments of amide I’ infrared bands.
Amide I’ Band Secondary structure assignment
1613-1630 β-sheet
1642-1649 Unordered
1649-1655 α-helix
1658-1672 β-turn
1673 `TFA
1672-1690 β-sheet
1694-1697 β-turn
Adapted from: (Susi and Byler, 1986; Jackson and Mantsch, 1995; Pelton and McLean, 2000; Harris and Chapman, 1995; Kong and Yu, 2007).
3.3.3.2.2 Side chains and trifluoroacetic acid (TFA) in the amide I region
Amino acid side chains exhibit characteristic absorption frequencies in the amide I region and
therefore must be considered during the assignment of secondary structures. Chirgadze et
al. (1975) reported the side chain absorptions in the presence of D2O. Fortunately, shown in
Table 13, the small number of amino acids present in the P11 peptides simplifies this
consideration. Furthermore, the IR molar absorption coefficient for most side chains is a lot
weaker compared to that of the peptide bond itself. Therefore, only arginine, glutamine and
glutamic acid may be detectable in the amide I region of the P11 peptides.

87
Table 13: Amino acid side chain absorptions in the amide I’ region for the P11 peptides studied by FTIR spectroscopy.
Amino Acid Wavenumber (cm-1) Molar absorption coefficient/notes
Arginine 1586 ε = 500 M-1 cm-1
1608 ε = 460 M-1 cm-1 Glutamine 1635-1654 ε = 550 M-1 cm-1
Glutamic Acid 1567 ε = 830 M-1 cm-1
1706-1775 ε = 280 M-1 cm-1
Ornithine - No data found, note lysine does not
absorb in the amide I’ region.
Phenylalanine - No absorption Tryptophan 1618 Little to no absorption.
Adapted from: (Chirgadze et al., 1975; Barth, 2000).
Trifluoroacetic acid (TFA) is frequently used during the purification of peptides, which means
it could be present in the peptides as a counter ion bound to the positively charged residues
(Cornish et al., 1999). The amount of TFA present in the peptide is dependent on the amount
of positively charged residues in the peptide i.e. peptides containing greater numbers of
arginine and ornithine will contain more TFA. The TFA band is located at 1673cm -1. Care had
to be taken when assigning the secondary structures of the peptides, as the TFA falls in a β-
sheet region and could be incorrectly assigned to it.
3.3.3.3 Method
3.3.3.3.1 Sample preparation
Two sets of solutions of P11-4, P11-8 and P11-12 were prepared in D2O. One set of peptides
was prepared in 130 mM Na+ salt solution and the other set was prepared in a 230 mM Na+
salt solution as detailed in Section 3.3.1.
3.3.3.3.2 Equipment and data acquisition
Samples were placed in a Thermo HT-32 demountable cell with CaF2 windows and a copper
spacer in-between the windows with a thickness of 0.25 mm. A Thermo Nicolet 6700 FTIR
spectrometer, controlled with OMNIC 7.3 SP1 software, was used to record the FTIR spectra.
Each spectrum was an average of 32 scans taken at a resolution of 4 cm -1 at room
temperature, one replicate per sample was analysed. Experiments involved pipetting about
~40 µl of the gel/liquid sample into the cell. A background air spectrum, consisting of an
empty sample compartment (no cell), was always taken before commencing any sample
measurement.
3.3.3.3.3 Processing of spectra
As well as collecting spectra for the background and the sample, spectra of the two Na+ salt
solutions in D2O were also recorded using the same path length spacer and then they were

88
subtracted from the sample spectrum, using the subtract function in OMNIC. Whilst in this
function, the region of 1800 to 2100 cm-1 was observed while varying the subtraction factor;
the appropriate subtraction factor was chosen when a flat baseline was achieved in this
region. Subtracted spectra were then baseline corrected with a manually selected baseline,
whose points were fixed to the spectral values and interpolated using a spline function.
In order to fit the amide I’ band, baseline corrected spectra were processed with the OMNIC
peak analysis tool (Bradley, 2007). This tool fitted a series of defined functions which
summed to ideally match the experimental spectra as well as possible. In order to achieve
this, the second derivative of the amide I’ region had to be observed (spectra were analysed
in the 1720-1580 cm-1 range) to locate large negative peaks. Negative peaks in the second
derivative corresponded to actual absorption peaks (Stuart, 2004). Once located, Gaussian-
Lorentzian peak functions with constant baseline and a noise of 10 were centrally aligned at
wavenumbers corresponding to these negative peaks. Initially, a minimum number of peaks
were selected. Peak parameters were optimised by a Fletcher-Powell-McCormick algorithm
which minimised the root mean square noise ratio of the residual of the fitted peak sum to
the actual spectrum. Once converged, if necessary, new peak functions were manually added
in the same manner, where the residual was large and the optimisation was repeated. This
process was repeated until it was no longer possible to further improve the residual.
Once the fitted peaks in the amide I’ region had been assigned to a secondary structure the
proportion of peptide adopting a particular secondary structure was determined from the
relative areas using equation 5 (Stuart and George, 1996). The relative areas were calculated
for each peak parameter, during the peak fitting, using the peak analysis tool in OMNIC. In
this study the percentage of β-sheet was of particular interest.
𝐸𝑞𝑢𝑎𝑡𝑖𝑜𝑛 5 % 𝑆𝑒𝑐𝑜𝑛𝑑𝑎𝑟𝑦 𝑠𝑡𝑟𝑢𝑐𝑡𝑢𝑟𝑒 = 100 × 𝑀𝑜𝑡𝑖𝑓 𝑡𝑜𝑡𝑎𝑙 𝑝𝑒𝑎𝑘 𝑎𝑟𝑒𝑎
𝑇𝑜𝑡𝑎𝑙 𝑠𝑒𝑐𝑜𝑛𝑑𝑎𝑟𝑦 𝑠𝑡𝑟𝑢𝑐𝑡𝑢𝑟𝑒 𝑝𝑒𝑎𝑘 𝑎𝑟𝑒𝑎
3.3.4 Transmission Electron Microscopy (TEM)
3.3.4.1 Method
3.3.4.1.1 Sample preparation
Two sets of solutions of P11-4, P11-8 and P11-12 were prepared in H2O. One set of peptides
was prepared in 130 mM Na+ salt solution and the other set was prepared in a 230 mM Na+
salt solution as detailed in Section 3.3.1.
Carbon-coated copper grids (400 mesh grids, Agar scientific) were placed coated side down
on the surface of a 10 µl droplet of the sample to be analysed for 1 min and then blotted on

89
filter paper to remove excess. Grids were then placed on a 10 µl droplet of 2% (20 mg.ml -1)
uranyl acetate for 30 secs for negative staining and then blotted against double folded
Whatman 50 filter paper and left to dry. Prepared grids were stored in plastic grid storage
boxes. Grids were examined with a JEM-1400 JEOL microscope.
3.3.4.1.2 Image capturing and processing
Digital images where captured using an AMT ERB bottom mounted digital CCD camera on
the TEM microscope. AMT image capture engine (Version 602) was used as an interface
between the camera and the computer in order to save the pictures as tiff images for further
processing. Only one replicate per sample was analysed. Fibril lengths and widths and twist
pitch were measured with ImageJ software (Version 1.47), as described in Figure 35. Before
any measurement was made the appropriate distance per pixel was set using the software’s
set scale function. The measurements were then made by tracing over the image with a
straight or segmented line tool and then using the software inbuilt measure function to
measure the cumulative distances.
Figure 35: TEM images of P11-8 fibrils, illustrating how the fibril lengths, widths (long and short) and twist pitch was calculated. (A) 20 random fibrils where chosen and the length measured, (B) 20 random fibrils where chosen and the width measured, (C) if the fibrils were twisted the long width (red line) and short width (yellow line) were measured 20
times, (D) the twist pitch was calculated by measuring the first narrowest point to the third, indicative of a full twist. This was repeated all the way down the fibril length and then an
average of these values was recorded.
A B
D
C
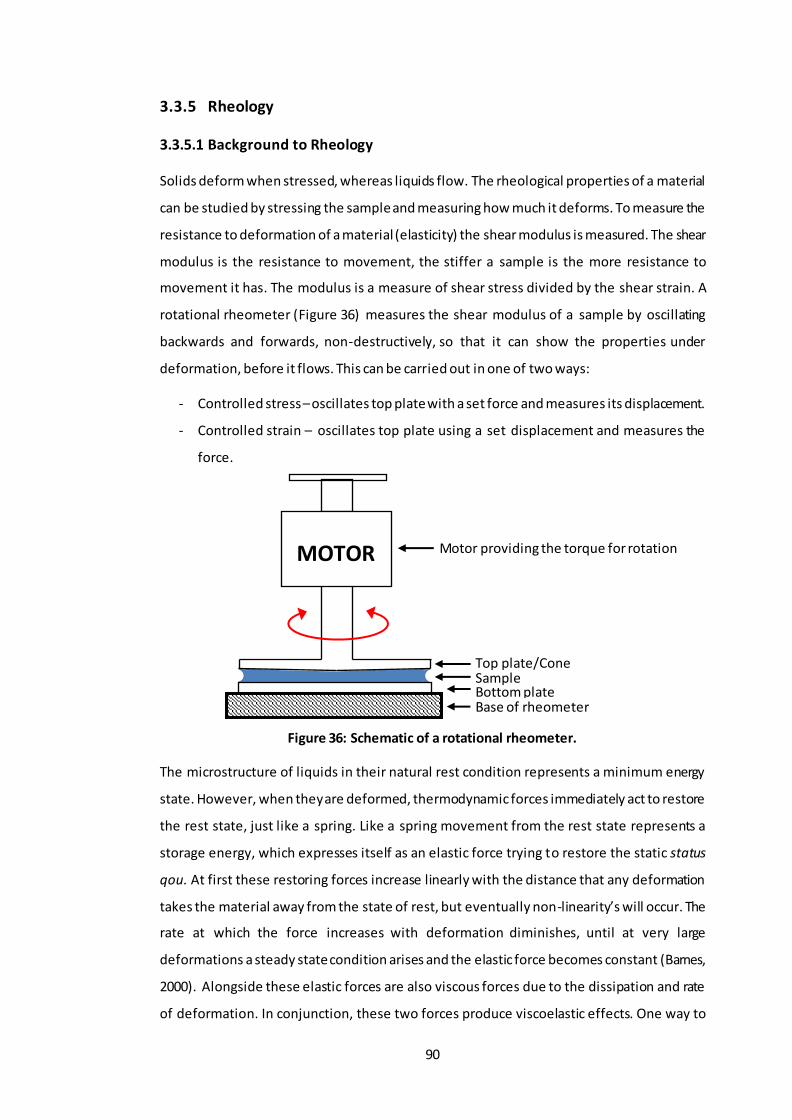
90
3.3.5 Rheology
3.3.5.1 Background to Rheology
Solids deform when stressed, whereas liquids flow. The rheological properties of a material
can be studied by stressing the sample and measuring how much it deforms. To measure the
resistance to deformation of a material (elasticity) the shear modulus is measured. The shear
modulus is the resistance to movement, the stiffer a sample is the more resistance to
movement it has. The modulus is a measure of shear stress divided by the shear strain. A
rotational rheometer (Figure 36) measures the shear modulus of a sample by oscillating
backwards and forwards, non-destructively, so that it can show the properties under
deformation, before it flows. This can be carried out in one of two ways:
- Controlled stress – oscillates top plate with a set force and measures its displacement.
- Controlled strain – oscillates top plate using a set displacement and measures the
force.
Figure 36: Schematic of a rotational rheometer.
The microstructure of liquids in their natural rest condition represents a minimum energy
state. However, when they are deformed, thermodynamic forces immediately act to restore
the rest state, just like a spring. Like a spring movement from the rest state represents a
storage energy, which expresses itself as an elastic force trying to restore the static status
qou. At first these restoring forces increase linearly with the distance that any deformation
takes the material away from the state of rest, but eventually non-linearity’s will occur. The
rate at which the force increases with deformation diminishes, until at very large
deformations a steady state condition arises and the elastic force becomes constant (Barnes,
2000). Alongside these elastic forces are also viscous forces due to the dissipation and rate
of deformation. In conjunction, these two forces produce viscoelastic effects. One way to
MOTOR
Base of rheometer
Sample Top plate/Cone
Motor providing the torque for rotation
Bottom plate

91
measure the viscoelastic profile of a material is to use oscillatory testing. This involves
applying an oscillating stress or strain as an input to the sample and resolving the re sulting
oscillatory strain or stress output to study the microstructure and therefore predict the
materials` behaviour.
There are two types of responses; a solid-like response and a liquid-like response. A solid-like
response is where the input stress or strain is in phase with the output stress or strain and
therefore the phase angle would be zero. Whereas for a liquid-like response, the output
stress or strain would be π/2 out of phase (Phase angle = 900) with the input (Figure 37).
Figure 37: Example of phase angle and its relationship to viscous and elastic materials. Adapted from (Duffy, 2016).
The solid component at any particular frequency is characterised by the storage modulus
(𝐺′ = 𝐺 × 𝑐𝑜𝑠𝛿) and the liquid like component is described as the loss modulus ( 𝐺′′ =
𝐺 × 𝑠𝑖𝑛𝛿), where G is the elastic modulus (𝜎
𝛾) and 𝛿 is the phase angle. The combination of
both these parameter yields the complex modulus (G*), which is the measure of the overall
stiffness of a material and is calculated by how much a sample moves (shear strain (𝛾)) for a
given force (shear stress (σ)). If G’ > G’’, then the phase angle will be less than 45o and exhibit
solid-like behaviour. If G’’ > G’, then the phase angle will be greater than 45o and exhibit
liquid-like behaviour (Duffy, 2016).
Figure 38: Loss, complex and elastic modulus.
Oscillatory rheometers have two components of the oscillation setup that can be controlled:
1. The oscillation amplitude (strain or stress) – An amplitude sweep can be run to
determine the linear viscoelastic region (LVER). This gives an idea of the stability of
G’’
G’
G*
δ
δ Phase angle
Input Stress Measured Strain
Max Strain
Elastic
0o Max Shear
Rate
Viscous
90o
σ 𝛾

92
the sample and this can also be quantified to indicate how much energy is required
to break up the suspension. The larger the force is, the more stable the sample. In
the LVER, the storage modulus does not change, therefore this means that it is non-
destructive to the material and any subsequent tests (frequency sweeps) can be kept
within the LVER (e.g. Figure 39).
Figure 39: Graph demonstrating the Linear Viscoelastic Region. Adapted from (Duffy, 2015).
2. The frequency (oscillation time-scale) – A frequency sweep is run to determine the
response at different timescales and this is carried out within the LVER region.
Generally, there are three types of material behaviour that can be determined from
rheological data:
1) Viscoelastic liquid; where the phase angle at rest tends towards 90o.
2) Viscoelastic solid; where the phase angle at rest tends towards 0o.
3) Gel; where the phase angle is independent of frequency.
Figure 40: General material behaviour in terms of storage and viscous modulus and phase angle. Adapted from (Duffy, 2016).
Rheology has previously been used to not only look at bulk mechanical properties of various
peptide hydrogels, but also to study their gelation mechanisms during and after flow (Aggeli
et al., 1997). Self-recovering peptide hydrogels could be ideal candidates for injectable
materials and rheometry can be used to mimic the mechanical process of such procedures;
such as the shearing effect of an injection or the shear of cartilage under load. The rheology
that will be undertaken in this chapter will not only give an insight into the gelation kinetics
and gel stiffness, both of which directly affect the final use of these materials, but it will also
Small LVER
Large LVER G’ Storage Modulus
Stra in
Viscoelastic Solid Gel Viscoelastic Liquid
Frequency Frequency Frequency
G’, G’’ Storage Modulus
δ, Phase Angle

93
be used to determine whether the SAP:GAG systems are reproducible and whether individual
samples are repeatable. Hence this will determine whether the preparation method is
suitable for future use.
3.3.5.2 Sample preparation
Three replicate samples were measured in triplicate for each peptide alone, chondroitin
sulfate alone and PEP: GAG mixture in the two Na+ salt solutions. Each sample had a total
volume of 4 ml. For each replicate 1 ml was applied to the rheometer.
3.3.5.2.1 Peptide control: P11-4, P11-8, P11-12.
Approximately 40 mg of peptide was weighed into a sample vial, to which 3.5 ml of the
appropriate Na+ salt solution was added (i.e. 130 mM or 230 mM Na+ salt solution). Samples
were then sonicated for 10 minutes. The peptide controls were then prepared as described
in Section 3.3.1.1.
Once a pH as close to 7.4 had been achieved, peptide samples were placed in a water bath
at 37oC for two hours. Samples were stored at 4oC overnight to allow them to equilibrate and
the pH was re-measured and re-adjusted to pH 7.4 the following day. This was carried out
using minimal microliter volumes of HCL and NaOH aliquots, vortexing for ≈40 seconds after
each addition. The final volumes of each solution were adjusted to 4 ml.
3.3.5.2.2 Peptide: GAG samples: P11-4, P11-8, P11-12: GAG (1:16 and 1:64).
It was hypothesised that the introduction of varying molar ratios of chondroitin-6-sulfate
(CS), would not only interact electrostatically with the charged peptide but also with the
charged Na+ salt solutions. Therefore, in order to establish whether these interactions were
possible, a mixing study was carried out, whereby a gel would be made by combining the
peptide and GAG to produce a peptide-GAG gel. The concentration of peptide was kept the
same for each sample (10 mg.ml -1) and the molar ratios of GAG used was 1:16 and 1:64. In
order to carry out several repeats (n=3), the volume of the peptide: GAG mixtures were
increased from 1 ml to 4 ml, with the concentration remaining at 10 mg.ml -1, as shown in
Table 14. The GAG was also found to have some impurities in terms of Na+, which was
determined using atomic absorption spectrophotometry. There was 0.08312 mg of Na+ per
mg of CS, therefore this was accounted for in the ratio weights of the GAG.
Table 14: Masses of peptide and CS weighed out for the different molar ratios. Samples were made up to a total volume of 4ml in two aqueous Na+ salt solutions.
1 part GAG : 64 part peptide 1 part GAG : 16 part peptide
P11-4 19.4mg 42.1 mg 77.6 mg 42.1 mg
P11-8 19.7 mg 51.5 mg 79.0 mg 51.5 mg
P11-12 22.1 mg 50.2 mg 88.4 mg 50.2 mg

94
Approximately 40 mg of peptide was weighed into a sample vial, to which 3 ml of the
corresponding Na+ salt solution was added (i.e. 130 mM or 230 mM Na+ salt solution).
Samples were sonicated for 10 minutes at 37oC. The peptides were monomerised as
described in Section 3.3.1.1. For each peptide, the appropriate pre measured amount of GAG
(Table 14) was hydrated in 950 µl of the corresponding Na+ salt solution. This GAG suspension
was vortexed for ≈40 seconds and then sonicated for 5 minutes at 37oC. The GAG suspension
was added to the monomerised peptide and vortexed for a further ≈ 40 seconds on a low
setting. The pH was adjusted to pH 7.4 or as close to it as possible and then placed in a water
bath at 37oC for two hours. Samples were stored at 4oC overnight to allow them to equilibrate
and the pH was re-measured and re-adjusted to pH 7.4 the following day. This was carried
out using the remaining 50 µl volume of HCl and NaOH aliquots to make the total volume up
to 4 ml.
3.3.5.2.3 GAG control: chondroitin sulfate alone.
The highest and the lowest weights of chondroitin sulfate mixed with the peptides (19.4 mg
and 88.4 mg; Table 14), were selected as controls. The pre-weighed chondroitin sulfate was
hydrated in 3.95 ml of the corresponding Na+ salt solution. Samples were vortexed for ≈ 40
seconds and then sonicated for a further 10 minutes at 37oC. The pH was adjusted to 7.4
using the remaining 50 µl volume of HCl and NaOH aliquots to make the total volume up to
4 ml.
3.3.5.3 Method
All rheological measurements were carried out on the Malvern Kinexus Rheometer. rSpace
Kinexus by Malvern Instruments was used to control the rheometer and export raw data. A
coned-plate geometry (50 mm diameter, gap of 0.0330 mm) was used with a cone angle of
1o. All tests were run at 37oC, using a solvent trap (SU0005 PLC) so that the atmosphere was
kept saturated to ensure minimal evaporation of the peptide: GAG samples.
Samples were firstly subjected to an amplitude sweep, which determined the linear
viscoelastic region (LVER) of the sample. Therefore, two amplitude sweeps were performed
in a shear strain controlled mode from 0.01-100%. One at 1 Hz and another at 20 Hz with a
10-minute pause in-between the two amplitude sweeps to allow the peptides to equilibrate.
Both components of the shear modulus (elastic and viscous) at both 1Hz and 20 Hz were
overlaid in Origin Pro. A strain value that lay within the LVER (preferably in the middle), in
which the elastic shear modulus (G’) and the viscous shear modulus (G’’) were independent
of the strain amplitude was chosen (i.e. Figure 41).

95
0.01 0.1 1 10
10
100
1000
10000
Sh
ea
r M
od
ulu
s (P
a)
Shear Strain (%)
Shear modulus (elastic component)(Pa) - 1Hz
Shear modulus (viscous component)(Pa) - 1Hz
Shear modulus (elastic component)(Pa) - 20Hz
Shear modulus (viscous component)(Pa) - 20Hz
Figure 41: Example amplitude sweep run at 1Hz and 20Hz showing both the elastic and viscous shear modulus. Strain value that lay in the middle of the LVER was chosen.
Frequency sweeps were then run to determine the dynamic modulus of the hydrogel
samples. The sweeps were run between 1 and 20 Hz at the pre-determined strain that was
established from the amplitude sweep. Peptide hydrogels were allowed to equilibrate for 15
minutes once loaded, prior to the start of testing. Visual observations were recorded in the
form of images of the gels after 48 hours, prior to testing.
3.3.6 Statistical analysis
3.3.6.1 Analysis of variance (ANOVA)
Throughout this part of the study various ANOVA’s were used to determine the source of
variation within the data. For determination of the length and width of peptide fibres/fibrils
using TEM, the null hypothesis was that neither the GAG molar ratio nor concentration of
Na+ ions would have any effect on the lengths and widths of a given peptide (P 11-4, P11-8 or
P11-12). Therefore, the data for each peptide lengths and peptide widths was analysed by
two-way ANOVA using SPSS. The analysis enabled understanding of whether the
independent factors (GAG molar ratio, Na+ salt concentration or their combined effects) had
a significant effect on the lengths and/or widths of each peptide fibres/fibrils.
Shear strain value chosen
LVER
96
3.4 Results
3.4.1 Self-assembly of peptides and peptide-GAG mixtures at varying
molar ratios in the presence of two different physiological Na+ salt solutions
with varying Na+ ion concentrations.
FTIR analysis was used to study the secondary structure of peptides P 11-4, P11-8 and P11-12 in
the presence and absence of chondroitin sulfate at molar ratios of 1:16 and 1:64 (peptide:
GAG) in two concentrations of Na+ salt solution.
The FTIR data showed that the self-assembled peptide conformation was rich in β-sheet for
P11-4, P11-8 and P11-12 alone in 130 mM and 230 mM Na+ salt solutions and in the majority of
the peptide-chondroitin sulfate mixtures in both Na+ salt solutions, as shown in Figure 42. Of
particular interest, was the relative β-sheet percentage formed by the SAPs alone, which was
indicative of a self-assembled hydrogel state. Increasing the Na+ ion concentration had
different effects which were dependent upon the peptide
The addition of chondroitin sulfate at molar ratios of 1:16 and 1:64 in conjunction with the
two Na+ salt solutions had a very different effect on the percentage of β-sheet formed. The
addition of the GAG to P11-4 at the lower molar ratio (1:64), resulted in a decrease in the
peaks observed in the region of 1672-1690 cm-1 (anti-parallel β-sheet conformation), which
was indicative of a decreased percentage of β-sheet formed when compared to the peptide
alone (Figure 42A & B). The addition of the GAG to P11-4 at the higher molar ratio (1:16),
however resulted in an increase in the overall percentage β-sheet, regardless of the
concentration of Na+ ions in the salt solution.
On the other hand, the addition of the lower molar ratio of GAG to P11-8 and P11-12 in the
130 mM Na+ salt solution caused the percentage of β-sheet formed to initially increase but
when the molar ratio of the GAG was increased, the percentage of β-sheet formed
decreased. The effect was greater for P11-12 than P11-8 (Figure 42). It was notable that the
addition of the GAG to P11-12 had a detrimental effect on the percentage of β-sheet formed,
especially at the higher GAG molar ratio (Figure 42E & F).

97
Figure 42: Fitted IR amide I’ band of P11-4, P11-8 and P11-12 at 10 mg.ml-1 in the presence of 130 mM (A, C and E) and 230 mM (B, D and F) Na+ salt solution with and without
varying chondroitin sulfate molar ratios of 1:16 and 1:64. The β-sheet percentage was calculated by adding the total area of the peaks showing β-sheet and then dividing them by the areas of all the individual peaks combined for each graph and multiplying by 100. The β-
sheet regions are defined by the peaks in the wavelength region of 1630-1613 cm-1 and 1690-1672 cm-1.
1720 1700 1680 1660 1640 1620 1600 1580
0.00
0.05
0.10
0.15
0.20
0.25 1630 - 1613 cm-1
1690 - 1672 cm-1
- 93.8%
- 50.6%
- 70.3%
P11
-4 130mM Na+ salt solution
Absorb
ance
Wavelength (cm-1)
P11-4 Alone
P11-4 at 1:64
P11-4 at 1:16
-sheet %
1720 1700 1680 1660 1640 1620 1600 1580
0.0
0.2
0.4
0.6
0.8
1.0
1.2
1.4
1.6
P11
-8 130mM Na+ salt solution
Ab
so
rban
ce
Wavelength (cm-1)
P11-8 Alone
P11-8 at 1:64
P11-8 at 1:16
1630 - 1613 cm-1
1690 - 1672 cm-1
-sheet %
- 46.3%
- 83.6%
- 83.3%
1720 1700 1680 1660 1640 1620 1600 1580
0.0
0.2
0.4
0.6
0.8
1.0
1.2
1.4
1.6
P11
-12 130mM Na+ salt solution
Absorb
ance
Wavelength (cm-1)
P11-12 Alone
P11-12 at 1:64
P11-12 at 1:16
1630 - 1613 cm-1
1690 - 1672 cm-1
-sheet %
- 78.2%
- 86.5%
- 39.6%
1720 1700 1680 1660 1640 1620 1600 1580
0.00
0.05
0.10
0.15
0.20
0.25
1630 - 1613 cm-1
P11
-4 230mM Na+ salt solution
Absorb
ance
Wavelength (cm-1)
P11-4 Alone
P11-4 at 1:64
P11-4 at 1:16
-sheet %
- 79.3%
- 69.4%
- 91%
1690 - 1672 cm-1
1720 1700 1680 1660 1640 1620 1600 1580
0.0
0.2
0.4
0.6
0.8
P11
-8 230mM Na+ salt solution
Ab
so
rban
ce
Wavelength (cm-1)
P11-8 Alone
P11-8 at 1:64
P11-8 at 1:16
1690 - 1672 cm-1
1630 - 1613 cm-1-sheet %
- 59.4%
- 81.7%
- 92%
1720 1700 1680 1660 1640 1620 1600 1580
0.0
0.2
0.4
0.6
0.8
1.0
1.2
1.4
1.6
P11
-12 230mM Na+ salt solution
Absorb
ance
Wavelength (cm-1)
P11-12 Alone
P11-12 at 1:64
P11-12 at 1:16
1630 - 1613 cm-11690 - 1672 cm-1
-sheet %
- 87.1%
- 37%
- 38.1%
A
C
B
F E
D

98
3.4.2 Morphology of peptides and peptide-GAG mixtures at varying molar
ratios in the presence of two different physiological Na+ salt solutions with
varying Na+ ion concentrations.
Physical differences between the fibre morphology of the peptides P11-4, P11-8 and P11-12 in
the presence and absence of chondroitin sulfate at molar ratios of 1:16 and 1:64 in two
concentrations of Na+ salt solution were observed by TEM. Representative images are shown
in Figure 43 - Figure 45. Varying networks of entangled fibres or bundles were observed,
which are essential for gel formation.
The TEM images for peptides alone at both Na+ ion concentrations (Figure 43 – Figure 45: A
& D) showed that the gels were composed of fibrils and fibres, as was the case with the
peptide: GAG mixtures (Figure 43 – Figure 45; B & E; C & F).
Figure 43: Morphology of the P11-4 peptide in the presence of two Na+ salt solutions at varying chondroitin sulfate molar ratios (1:16 and 1:64) by TEM. (A) P11-4 in a 230 mM Na+
salt solution, (B) P11-4 at 1:64 GAG molar ratio in a 230 mM Na+ salt solution, (C) P11-4 at 1:16 GAG molar ratio in a 230mM Na+ salt solution, (D) P11-4 in a 130mM Na+ salt solution, (E) P11-4 at 1:64 GAG molar ratio in a 130mM Na+ salt solution, (F) P11-4 at 1:16 GAG molar
ratio in a 130mM Na+ salt solution. Magnification of 500. Individual scale bars (10 m) are shown for each image.
10 µm 10 µm 10 µm
10 µm 10 µm 10 µm
A B C
D F E

99
Figure 44: Morphology of the P11-8 peptide in the presence of two Na+ salt solutions at varying chondroitin sulfate molar ratios (1:16 and 1:64) by TEM. (A) P11-8 in a 230mM Na+
salt solution, (B) P11-8 at 1:64 GAG molar ratio in a 230mM Na+ salt solution, (C) P11-8 at 1:16 GAG molar ratio in a 230mM Na+ salt solution, (D) P11-8 in a 130mM Na+ salt solution, (E) P11-8 at 1:64 GAG molar ratio in a 130mM Na+ salt solution, (F) P11-8 at 1:16 GAG molar
ratio in a 130mM Na+ salt solution. Magnification of 500. Individual scale bars (10 m) are shown for each image.
Figure 45: Morphology of the P11-12 peptide in the presence of two Na+ salt solutions at varying chondroitin sulfate molar ratios (1:16 and 1:64) by TEM. (A) P11-12 in a 230mM
Na+ salt solution, (B) P11-12 at 1:64 GAG molar ratio in a 230mM Na+ salt solution, (C) P11-12 at 1:16 GAG molar ratio in a 230mM Na+ salt solution, (D) P11-12 in a 130mM Na+ salt
solution, (E) P11-12 at 1:64 GAG molar ratio in a 130mM Na+ salt solution, (F) P11-12 at 1:16 GAG molar ratio in a 130mM Na+ salt solution. Magnification of 500. Individual scale bars
(10 m) are shown for each image.
10 µm 10 µm 10 µm
10 µm 10 µm 10 µm
A B C
D F E
10 µm 10 µm 10 µm
10 µm 10 µm 10 µm
A B C
D F E

100
The physical properties of P11-4, P11-8 and P11-12 alone in 130 mM and 230 mM Na+ salt
solution are shown in Figure 46. The P11-4 and P11-8 peptide samples had a cloudy gel
appearance when compared to the clear gel produced by the P11-12 peptide sample. All three
peptides exhibited shear softening (i.e. if sheared they would flow but after some time, they
would return to their original gel state). This characteristic was exaggerated in the lower Na+
salt concentration. The peptide underwent a range of different physical states, ranging from
isotropic fluid to nematic liquid crystalline/gel, however once equilibrium was reached at pH
7.4, the sample exhibited nematic gel characteristics. The liquid crystalline properties were
established using a high resolution digital camera, with the sample placed in-between
crossed polarized film/lenses (Figure 46C – E).
Figure 46: Images of (a) P11-4. P11-8 and P11-12 in the 130 mM Na+ salt solution at pH 7.4 (b) P11-4. P11-8 and P11-12 in the 230 mM Na+ salt solution at pH 7.4. Images show their
physical properties 3 days after the gels were made (from left to right: P 11-12, P11-8 and P11-4) (c-e) Photographs of bulk samples exhibiting the birefringent gels of P11-4. P11-8 and P11-
12, respectively.
Overlapping of the fibrils and fibres made it difficult to definitively assess the morphology,
hence regions in which individual fibrils could clearly be observed were chosen to measure
fibre lengths and widths. The peptides in different salt solutions exhibited a twist pitch,
meaning two widths were recorded; a wide width and a narrow width (where the twist
occurred), values of twist pitch are presented in Figure 47, along with their corresponding
widths. Average lengths ranging from ca. 410 to 990 nm for the peptides alone and ca. 498
to 3518 nm for the peptide-GAG mixtures were recorded (Figure 48).
The average widths and lengths of the P11-4: GAG mixtures are summarised in Table 15 and
Table 16 and represented in Figure 47 and Figure 48, respectively. From the TEM images for
P11-4, it was observed that in the 230 mM Na+ salt solution the fibrils were thicker and longer
than those formed in the 130 mM Na+ salt solution. The average fibril width for P11-4 in the
130 mM and 230 mM Na+ salt solutions was 9.96 ± 0.48 nm (± SEM) and 12.42 ± 0.22 nm,
respectively at their widest point (Table 15). The average fibril length in the 130 mM and 230
mM Na+ salt solution were 468.68 ± 66.34 nm and 532.13 ± 54.24 nm, respectively (Table
16). However, in the 230 mM Na+ salt solution, P11-4 exhibited a twist pitch of 236.26 nm

101
(Figure 47 – Image *1), and at its narrowest point (where the twist occurred) it had an
average width of 8.58 ± 0.12 nm.
As the Na+ ion concentration and GAG molar ratio were increased the average lengths of the
P11-4: GAG fibrils were also increased, compared to P11-4 alone. However, this was not the
case for the average widths of the P11-4: GAG mixtures, as these were affected independently
by the two variables (Na+ ion concentration and GAG molar ratio). As the Na+ ion
concentration was increased, the average width of the P11-4: GAG fibril at the GAG molar
ratio of 1:64 decreased, however at the 1:16 GAG molar ratio the average widths of the fibrils
were increased. On the other hand, as the GAG molar ratio for the P11-4: GAG mixtures in the
230 mM Na+ salt solution was increased, the average width of the fibrils was also increased,
however for the P11-4-GAG mixtures in the 130 mM Na+ salt solution, the average width of
the fibrils was decreased.
Table 15: Average widths and twist pitch of the P11-4 fibrils in different Na+ salt solutions and GAG molar ratios.
Widths (nm) P11-4 130mM
9.96 ± 0.48 P11-4 130mM 1:64
18.17 ± 1.60
P11-4 130mM 1:16 12.63 ± 0.41
P11-4 230mM [12.42 ± 0.22]*w [8.58 ± 0.12]*s
Twist pitch = 236.26 nm
P11-4 230mM 1:64 14.15 ± 0.92
P11-4 230mM 1:16 [21.44 ± 0.27]*w [13.02 ± 0.41]*s
Twist pitch = 330.78 nm
The widths were determined from TEM images at a magnification of 30,000 using the software imageJ. 20 fibrils were measured for each sample. The data is presented as the
mean (n=20) ± SEM. The twist pitch was calculated using the measure tool in imageJ. It was measured for an individual fibre from its first narrowest point to the third, indicative of a
full twist (*W = Wide width and *S = Short width).
Table 16: Average lengths of the P11-4 fibrils in different Na+ salt solutions and GAG molar ratios.
Lengths (nm) P11-4 130mM
468.68 ± 66.34 P11-4 130mM 1:64
498.08 ± 41.24 P11-4 130mM 1:16
674.17 ± 76.38
P11-4 230mM 532.13 ± 54.24
P11-4 230mM 1:64 973.66 ± 79.75
P11-4 230mM 1:16 1075.85 ± 125.09
The lengths were determined from TEM images at a magnification of 12,000 using the software imageJ. 20 fibrils were measured for each sample. The data is presented as the
mean (n=20) ± SEM.
The average widths and lengths of the P11-8 fibrils at different GAG molar ratios and Na+ ion
concentrations are summarised in Table 17 and Table 18 and represented in Figure 47 and
Figure 48, respectively. For the measured P11-8 fibrils, they were thicker and longer in the
130 mM Na+salt solution, when compared to the P11-8 fibrils in the 230 mM Na+ salt solution.
The average fibril width for P11-8 in the 130 mM and 230 mM Na+ salt solutions were 20.42 ±

102
0.25 nm and 19.16 ± 0.31, at their widest point and 10.66 ± 0.15 nm and 14.45 ± 0.25 nm, at
their narrowest point, respectively (Table 17). In both of these conditions the fibrils exhibited
a twist pitch of 379.24 nm and 345.23 nm, respectively (Figure 47 – Image*3 & 4). The
average fibril length in the 130 mM and 230 mM Na+ salt solutions was 445.27 ± 40.74 nm
and 410.68 ± 32.81, respectively (Table 18).
As the Na+ ion concentration increased, the length of the P11-8 fibrils/fibres decreased
regardless of the GAG molar ratio. However, as the GAG molar ratio increased the length of
the fibrils/fibres increased regardless of the Na+ ion concentration. Interestingly in the P11-8:
GAG mixtures there were multiple types of structure observed, fibrils were by far the most
common type but there were instances of nanotube formation. The P11-8: GAG fibrils were
longer in the 130 mM Na+ salt solution, when compared to the P11-8: GAG fibrils in the 230
mM Na+ salt solution. The widths of the fibres of the P11-8: GAG mixtures were increased with
an increased Na+ ion concentration and GAG molar ratio. Similarly, the P11-8: GAG fibrils were
thicker in the 130 mM Na+ salt solution, when compared to the P11-8: GAG fibrils in the 230
mM Na+ salt solution.
Table 17: Average widths and twist pitch of the P11-8 fibrils in different Na+ salt solutions and GAG molar ratios.
Widths (nm) P11-8 130mM
[20.42 ± 0.25]*w [10.66 ± 0.15]*s Twist pitch = 379.24 nm
P11-8 130mM 1:64 [16.40 ± 0.32]*w [8.96 ± 0.37]*s
Twist pitch = 196.41 nm
P11-8 130mM 1:16 16.81 ± 1.21
P11-8 230mM [19.16 ± 0.31]*w [12.03 ± 0.31]*s
Twist pitch = 345.23 nm
P11-8 230mM 1:64 17.22 ± 1.13
P11-8 230mM 1:16 [19.90 ± 0.49]*w [10.98 ± 0.33]*s
Twist pitch = 229.97 nm
The widths ere determined from TEM images at a magnification of 30,000 using the software imageJ. 20 fibrils were measured for each sample. The data is presented as the
mean (n=20) ±SEM. The twist pitch was calculated using the measure tool in imageJ it was measured for an individual fibre from its first narrowest point to the third, indicative of a
full twist (*W = Wide width & *S = Short width).
Table 18: Average lengths of the P11-8 fibrils in different Na+ salt solutions and GAG molar ratios.
Lengths (nm) P11-8 130mM
445.27 ± 40.74 P11-8 130mM 1:64 2682.16 ± 545.21
P11-8 130mM 1:16 3518.32 ± 432.47
P11-8 230mM 410.68 ± 32.81
P11-8 230mM 1:64 799.13 ± 57.47
P11-8 230mM 1:16 827.87 ± 50.37
These were determined from TEM images at a magnification of 12,000 using the software imageJ. 20 fibrils were measured for each sample. The data is presented as the mean
(n=20) ±SEM.
From the TEM images for P11-12, it was observed that increasing the Na+ ion concentration
in the salt solution increased the widths of the fibrils, however the fibril length was

103
decreased, as shown in Table 19 and Table 20 and represented in Figure 47 and Figure 48.
The average width of P11-12 in the 130 mM and 230 mM Na+ salt solutions was 4.95 ± 0.15
nm and 22.72 ± 0.32 nm respectively at the widest point. The fibrils in the 230 mM Na+ salt
solution exhibited a twist pitch of 397.81 nm, at the narrowest point the average width of
the P11-12 fibrils was 15.11 ± 0.36 nm. In the 130 mM Na+ salt solution at a magnification of
x500, P11–12 showed a less dense network of fibrils and fibres compared to the image seen
in the 230 mM Na+ salt solution at the same magnification.
The average widths and lengths of the fibrils in the P11-12: GAG mixtures varied depending
on the amount of Na+ ions in the salt solution or GAG molar ratio (Table 19 and Table 20;
Figure 47 and Figure 48). An increase in the Na+ ion concentration resulted in increased
widths and lengths of the fibrils, regardless of the GAG molar ratio. However, as the GAG
molar ratio increased the length of the fibrils was increased regardless of the Na+ ion
concentration; as well as the width of only the P11-12: GAG fibrils in the 230 mM Na+ salt
solution. Overall the lengths and widths of the P11-12: GAG fibrils were greatest in the higher
Na+ ion concentration and GAG molar ratio (Figure 47 and Figure 48). The longest fibrils
formed by the P11-12 peptide were seen in the GAG molar ratio of 1:16 in both 130 mM and
230 mM Na+ salt solutions.
Table 19: Average widths and twist pitch of the P11-12 fibrils in different Na+ salt solutions and GAG molar ratios.
Widths (nm) P11-12 130mM
4.95 ± 0.15 P11-12 130mM 1:64
31.84 ± 1.96
P11-12 130mM 1:16 14.24 ± 0.96
P11-12 230mM [22.72 ± 0.32]*w [15.11 ± 0.36]*s
Twist pitch = 397.81 nm
P11-12 230mM 1:64 34.24 ± 2.12
P11-12 230mM 1:16 83.89 ± 4.94
The widths were determined from TEM images at a magnification of 30,000 using the software imageJ. 20 fibrils were measured for each sample. The data is presented as the
mean (n=20) ±SEM.
Table 20: Average lengths of the P11-12 fibrils in different Na+ salt solutions and GAG molar ratios.
Lengths (nm) P11-12 130mM 990.96 ± 75.79
P11-12 130mM 1:64 588.55 ± 59.02
P11-12 130mM 1:16 1802.74 ± 334.82
P11-12 230mM 893.60 ± 100.13
P11-12 230mM 1:64 1374.98 ± 114.16
P11-12 230mM 1:16 1880.11 ± 137.65
These were determined from TEM images at a magnification of 12,000 using the software imageJ. 20 fibrils were measured for each sample. The data is presented as the mean
(n=20) ±SEM.

104
3.4.2.1 Analysis of the effects of Na+ ion concentration and GAG molar ratio on the
lengths and widths of fibrils of P11-4, P11-8 and P11-12.
The effect that the Na+ ion concentration in the salt solution and the GAG molar ratios had
on (a) the lengths (Table 21 to Table 23) and (b) the widths (Table 24 to Table 26) of the fibrils
formed; was determined by 2-way ANOVA for each peptide and was found to vary from
peptide to peptide. The null hypothesis was that neither of the independent variables (GAG
molar ratio and concentration of Na+ ions) would have any effect on the lengths and widths
of the peptide fibrils.
The results of the analyses revealed that both Na+ ion concentration in the salt solution, GAG
molar ratio and their combinations, all had a significant effect (p<0.05) on the length and
widths of the fibrils; in all the peptide hydrogels except in P 11-12, where the Na+ ion
concentration in the salt solution did not have a significant effect on the length of the fibrils
formed (p = 0.084) (Table 23).
Table 21: Two-way analysis of variance to determine the effect of GAG molar ratio and Na+ ion concentration had on the length of the P11- 4 fibrils.
Source df Mean Square F Sig.
Salt Solution (SS) 1 2.95E+06 23.991 .000 GAG Molar Ratio (MR) 2 1.43E+06 11.665 .000
MR * SS 2 4.83E+05 3.927 .022 Error 114 1.23E+05
Statistical significance was determined at p<0.05. Independent variables: GAG molar ratio (MR) and Salt Solution (SS). Dependant variable: Length.
Table 22: Two-way analysis of variance to determine the effect of GAG molar ratio and Na+ ion concentration had on the length of the P11- 8 fibrils.
Source df Mean Square F Sig.
Salt Solution (SS) 1 7.08E+07 43.084 .000
GAG Molar Ratio (MR) 2 3.30E+07 20.109 .000 MR * SS 2 1.85E+07 11.283 .000
Error 114 1.64E+06
Statistical significance was determined at p<0.05. Independent variables: GAG molar ratio (MR) and Salt Solution (SS). Dependant variable: Length.
Table 23: Two-way analysis of variance to determine the effect of GAG molar ratio and Na+ ion concentration had on the length of the P11- 12 fibrils.
Source df Mean Square F Sig.
Salt Solution (SS) 1 1.76E+06 3.037 .084 GAG Molar Ratio (MR) 2 9.92E+06 17.093 .000
MR * SS 2 1.81E+06 3.113 .049
Error 114 5.80E+05
Statistical significance was determined at p<0.05. Independent variables: GAG molar ratio (MR) and Salt Solution (SS). Dependant variable: Length.

105
Table 24: Two-way analysis of variance to determine the effect of GAG molar ratio and Na+ ion concentration had on the width of the P11- 4 fibrils.
Source df Mean Square F Sig.
Salt Solution (SS) 1 174.947 13.379 .000
GAG Molar Ratio (MR) 2 397.873 30.428 .000
MR * SS 2 411.463 31.467 .000
Error 114 13.076
Statistical significance was determined at p<0.05. Independent variables: GAG molar ratio (MR) and Salt Solution (SS). Dependant variable: Width.
Table 25: Two-way analysis of variance to determine the effect of GAG molar ratio and Na+ ion concentration had on the width of the P11- 8 fibrils.
Source df Mean Square F Sig.
Salt Solution (SS) 1 360.995 31.244 .000 GAG Molar Ratio (MR) 2 518.656 44.890 .000
MR * SS 2 81.586 7.061 .001 Error 114 11.554
Statistical significance was determined at p<0.05. Independent variables: GAG molar ratio (MR) and Salt Solution (SS). Dependant variable: Width.
Table 26: Two-way analysis of variance to determine the effect of GAG molar ratio and Na+ ion concentration had on the width of the P11- 12 fibrils.
Source df Mean Square F Sig.
Salt Solution (SS) 1 2.69E+04 238.950 .000
GAG Molar Ratio (MR) 2 1.24E+04 110.568 .000 MR * SS 2 1.24E+04 110.333 .000
Error 114 1.13E+02
Statistical significance was determined at p<0.05. Independent variables: GAG molar ratio (MR) and Salt Solution (SS). Dependant variable: Width.
Perusal of the data indicated that in the 230 mM Na+ salt solution, the P11-4 fibrils were longer
than those in the 130 mM Na+ salt solution. However, for the P11-8 fibrils, the opposite effect
was observed, where the P11-8 fibrils were longer in the 130 mM Na+ salt solution when
compared to the P11-8 fibrils in the 230 mM Na+ salt solution (Figure 47 and Figure 48). For
P11-12, the 2-way ANOVA revealed that only the GAG molar ratio had a significant effect
(p<0.05) on the length of the P11-12 fibrils. The analysis also revealed that, Na+ ion
concentration in the salt solution, GAG molar ratio and the combination of the latter all had
a significant effect (p<0.05) on the widths of the P11-12 fibrils.

106
Figure 47: Widths of fibrils of all peptides in two different Na+ salt solutions at pH 7.4 at varying molar ratios of GAG. Widths of the fibrils were determined from TEM images at a
magnification of 30,000 using the software imageJ. 20 fibrils were measured for each sample. The data is presented as the mean (n=20) ± 95% confidence intervals. Data was analysed using 2-way analysis of variance. This showed that the Na+ ion concentration in
the salt solution, GAG molar ratio and their combined effects had a significant effect on the overall widths of the fibrils formed by all three peptides (p<0.05).
Figure 48: Lengths of fibrils of all peptides in two different Na+ salt solutions at pH 7.4 at varying molar ratios of GAG. Lengths of the fibrils were determined from TEM images at a
magnification of 12,000 using the software imageJ. 20 fibrils were measured for each sample. The data is presented as the mean (n=20) ± 95% confidence intervals. Data was analysed using 2-way ANOVA and statistical significance was determined at p<0.05. This showed that for P11-4 and P11-8 the Na+ ion concentration in the salt solution, GAG molar
ratio and their combined effects all had a significant effect on the lengths of the fibres formed (p<0.05). For P11-12, the Na+ ion concentration had no significant effect on the lengths of the fibrils formed by P11-12 (p=0.084). However, the GAG molar ratio had a
significant effect on the length of the fibrils formed by P11-12 (p<0.05). The combined effect of GAG molar ratio and Na+ ion concentration in the salt solution had a significant effect on
the length of the fibrils formed by P11-12 (p=0.049).
*1
*2 *4
*7
*3 *5
*6

107
3.4.3 Determination of elastic and viscous shear moduli of peptides and
peptide-GAG mixtures at varying molar ratios in the presence of two
different physiological Na+ salt solutions with varying Na+ ion
concentrations using Rheology
All of the samples tested exhibited a higher G’ than G’’ value, which confirmed that all
hydrogels exhibited viscous solid-like behaviour.
3.4.3.1 Shear modulus of peptides alone
Samples were prepared as described in Section 3.3.5.2.1. P11-4 and P11-8 in both Na+ salt
solutions formed cloudy self-supporting gels, however P11-12 formed a clear gel in the
130mM Na+ salt solution but in the 230mM Na+ salt solution it formed a cloudy gel, as shown
in Figure 49.
Peptide 130 mM Na+ Salt Solution 230 mM Na+ Salt Solution
P11-4
P11-8
P11-12
Figure 49: P11-4, P11-8 and P11-12 self-supporting gels at 10 mg.ml-1 in 130 mM and 230 mM Na+ salt solutions. Images captured 2 days after they were made before testing on the
rheometer (n=3).
As shown in Figure 50, the LVER of the two amplitude sweeps run at 1 Hz and 20 Hz for each
peptide, were used to calculate the shear strain value to run the frequency sweep. P11-4 in
the 130 mM and 230 mM Na+ salt solutions had a shear strain value of 0.1 % and 0.15 %,
respectively. P11-8 in the 130 mM and 230 mM Na+ salt solutions had a shear strain value of
0.3 %. P11-12 in the 130 mM and 230 mM Na+ salt solutions had a shear strain value of 0.3 %

108
and 0.1 %, respectively. During the amplitude sweep tests, it was observed that the shear
moduli of the P11-12 gels were considerably lower than for the P11-4 and P11-8 gels in both
Na+ salt solutions, which was concurrent with the weakness of the P 11-12 gel when it was
handled and placed on the rheometer for testing. A slight tap of the vial caused shearing in
the gel which did not recover as quickly as the P11-4 and P11-8 gels.
Figure 50: The amplitude sweeps (elastic and viscous modulus vs. shear strain) of P11- 4, P11- 8 and P11- 12 at 10 mg.ml-1 in 130 mM and 230 mM Na+ salt solutions. Shear strain
started at 0.01 % and ramped up to 100% at a temperature 370C. Shear strain chosen within the LVER was: (A=0.1 %, B=0.15 %, C, D and E=0.3 % and F=0.1 %).
For the peptides alone, the shear moduli of P11-4 and P11-8 were higher than those of P11-12
by two orders of magnitude, which indicated that there was variation between the glutamine
based peptide gels and the serine based peptide gels in both Na+ salt solutions across the
0.01 0.1 1
1
10
100
1,000
10,000 P11
- 4 at 230 mM Na+ Salt Solution
Shear
Moduli
(Pa)
Complex shear strain (%)
Shear modulus (elastic component)(Pa) - 1Hz
Shear modulus (viscous component)(Pa) - 1Hz
Shear modulus (elastic component)(Pa) - 20Hz
Shear modulus (viscous component)(Pa) - 20Hz
0.01 0.1 1 10
100
1,000
10,000
100,000P
11 - 8 at 230 mM Na
+ Salt Solution
Shear
Moduli
(Pa)
Complex shear strain (%)
Shear modulus (elastic component)(Pa) - 1Hz
Shear modulus (viscous component)(Pa) - 1Hz
Shear modulus (elastic component)(Pa) - 20Hz
Shear modulus (viscous component)(Pa) - 20Hz
0.01 0.1 110
100
1,000
10,000
100,000
Sh
ea
r M
od
uli
(Pa
)
Complex shear strain (%)
Shear modulus (elastic component)(Pa) - 1Hz
Shear modulus (viscous component)(Pa) - 1Hz
Shear modulus (elastic component)(Pa) - 20Hz
Shear modulus (viscous component)(Pa) - 20Hz
P11
- 4 at 130 mM Na+ Salt Solution
0.01 0.1 1 101
10
100P
11 - 12 at 130 mM Na
+ Salt Solution
Shear
Moduli
(Pa)
Complex shear strain (%)
Shear modulus (elastic component)(Pa) - 1Hz
Shear modulus (viscous component)(Pa) - 1Hz
Shear modulus (elastic component)(Pa) - 20Hz
Shear modulus (viscous component)(Pa) - 20Hz
0.01 0.1 110
100
1,000
10,000
100,000 P11
- 12 at 230 mM Na+ Salt Solution
Sh
ea
r M
od
uli
(Pa
)
Complex shear strain (%)
Shear modulus (elastic component)(Pa) - 1Hz
Shear modulus (viscous component)(Pa) - 1Hz
Shear modulus (elastic component)(Pa) - 20Hz
Shear modulus (viscous component)(Pa) - 20Hz
0.01 0.1 1 10
100
1,000
10,000
100,000 P11
- 8 at 130 mM Na+ Salt Solution
Shear
Moduli
(Pa)
Complex shear strain (%)
Shear modulus (elastic component)(Pa) - 1Hz
Shear modulus (viscous component)(Pa) - 1Hz
Shear modulus (elastic component)(Pa) - 20Hz
Shear modulus (viscous component)(Pa) - 20Hz
A B
C D
E F

109
frequency range studied (Figure 51A & B). Increasing the Na+ salt concentration increased
the moduli of P11-12, indicating that the positively charged serine based peptide was
interacting positively with the increased concentration of Na+ ions in the higher ionic strength
solution, hence increasing its mechanical stiffness three-fold (Figure 51C), which was
concurrent with the FTIR analysis, as the β-sheet component also increased. A very slight
increase in the shear moduli was noticed more so at the 130mM Na+ salt solution in the P11-
4 and P11-8 samples, whereas this effect was not as apparent in the P11-12 samples in either
of the Na+ salt solutions, suggesting that as the frequency increased the P11-4 and P11-8
samples became stiffer (Figure 51A & B). Nevertheless, the frequency sweeps shown in
Figure 51A & B were relatively flat indicating that the experiments were run near equilibrium
state.
Figure 51: The effect of varying the Na+ ion concentration (130 mM or 230 mM) on the mechanical stiffness of the P11-4, P11-8 and P11-12 gels, Strain 0.1 % and temperature 37oC:
(A) Frequency sweep test between 1Hz and 20Hz for the P11- 4, P11- 8 and P11- 12 gels in the 130 mM Na+ salt solution, (B) Frequency sweep test between 1Hz and 20Hz for the
P11- 4, P11- 8 and P11- 12 gels in the 230 mM Na+ salt solution, (C) Shear modulus extracted at 1Hz for the P11- 4, P11- 8 and P11- 12 gels in both 130 mM and 230 mM Na+ salt
solutions. Data is presented as the mean (n=3) ± 95% confidence intervals. Individual samples were subject to an amplitude sweep before commencing the test, in order to identify the linear viscoelastic region (LVER). A strain value was then chosen withi n the
middle region of the LVER and the shear moduli (elastic and viscous) were all calculated by running a frequency sweep test between 1Hz and 20Hz.
1 10
100
1,000
10,000
100,000
230 mM Na+
Salt Solution
Shear
Moduli,
G',
G''
(Pa)
Frequency(Hz)
P11- 4 Shear modulus (elastic component)(Pa)
P11- 4 Shear modulus (viscous component)
P11- 8 Shear modulus (elastic component)
P11- 8 Shear modulus (viscous component)
P11- 12 Shear modulus (elastic component)
P11- 12 Shear modulus (viscous component)
1 10
1
10
100
1,000
10,000
100,000
130 mM Na+
Salt Solution
Shear
Moduli,
G',
G''
(Pa)
Frequency(Hz)
P11- 4 Shear modulus (elastic component)
P11- 4 Shear modulus (viscous component)
P11- 8 Shear modulus (elastic component)
P11- 8 Shear modulus (viscous component)
P11- 12 Shear modulus (elastic component)
P11- 12 Shear modulus (viscous component)
A B
C

110
3.4.3.2 Shear modulus of peptide: GAG mixtures
In this study, the mixing of GAGs with the peptides in different ionic strength salt solutions
and the effect on the rheological properties were investigated. It was hypothesised that the
charged GAG chains would not only interact electrostatically with the charged peptides but
also with the two ionic salt solutions.
Samples were prepared as described in Section 3.3.5.2.2. The P11-4 and P11-8: GAG mixtures
in both Na+ salt solutions formed cloudy self-supporting gels, however P11-12 in the 130 mM
Na+ salt solution at both GAG molar ratios, even after vortexing, sonicating and heating, did
not gel or form a viscous liquid as with other peptide-GAG mixtures. After allowing 48 hours
for the P11-12: GAG mixtures to reach equilibrium, a slight change in appearance of the gels
was observed for the mixture at the higher molar ratio (1:16) of GAG. Some self -assembly
was observed on the walls of the tube as well as some solid clumps within the runny liquid,
however the mixture was still liquid in nature. The mixtures at the lower molar ratio (1:64)
of GAG also had solid-clumps within the runny liquid but with no self-assembly on the walls
of the tube. These observations were not obvious initially but became more apparent when
loading samples onto the rheometer. The appearance of the gels is shown in Table 26. The
addition of the GAG to P11-12 in the 230mM Na+ salt solution had a similar effect. Upon
mixing, the P11-12: GAG mixture at the lower GAG molar ratio (1:64), showed self-assembly
on the walls. After vortexing, sonicating and heating small clumps of solid aggregates were
present in the viscous liquid suspension, which remained after the 48 hours prior to testing
(Table 26). Similarly, the P11-12: GAG mixture at the higher GAG molar ratio (1:16), exhibited
the same phenomenon however it formed a very weak gel after 48 hours just prior to testing.
This gel sheared easily upon inverting and loading onto the rheometer, as shown in Table 26,
in particular the 3rd sample. The addition of the GAG to P11-8 led to much faster gelation, with
self-supporting gels forming almost instantly on the addition of the GAG (Table 26); even
before they had been sonicated, vortexed or heated. This behaviour had not been observed
previously with any other of the peptides alone. Gels were very hard to shear once they had
been made which made the measurement of pH after 24 hours very difficult.

111
Peptide
GAG
Molar Ratio
130 mM Na+ Salt Solution 230 mM Na+ Salt Solution
P11-4
1:64
1:16
P11-8
1:64
1:16
P11-12
1:64
1:16
Figure 52: P11-4, P11-8 and P11-12 self-supporting gels at 10 mg.ml-1 at two different GAG molar ratios (1:64 & 1:16) in 130 mM and 230 mM Na+ salt solutions. Images captured 2
days after they were made before testing on the rheometer (n=3).
The LVER of the two amplitude sweeps run at 1 Hz and 20 Hz for each peptide: GAG mixture,
which were used to calculate the shear strain value that the frequency sweep would be run
at are shown in Figure 53. P11-4 at both GAG molar ratios and in both the 130 mM and 230

112
mM Na+ salt solutions had a shear strain value of 0.15 %. P11-8 at GAG molar ratio 1:64 in the
130 mM and 230 mM Na+ salt solution had a shear strain value of 0.17 % and 0.15 %,
respectively. P11-8 at GAG molar ratio 1:16 in the 130 mM and 230 mM Na+ salt solutions had
a shear strain value of 0.1 % and 0.3 %, respectively. P11-12 at both GAG molar ratios and in
both the 130 mM and 230 mM Na+ salt solutions had a shear strain value of 0.15 %. The
amplitude sweep test again showed that the shear moduli of the P 11-12 gels were
considerably lower than the P11-4 and P11-8 gels in both Na+ salt solutions, which was
concurrent with the weakness of the P11-12 gel when it was handled and placed on the
rheometer for testing.
The frequency sweeps shown in Figure 54A-F, showed that the elastic moduli for all the
peptide: GAG mixtures were higher than the viscous modulus, indicating that the samples
exhibited a solid-like behaviour. Their overall flatness of the data lines was indicative that
the test runs were near the equilibrium state of the hydrogels. For P11-4, the
addition/presence of more of GAG (1:16) in both the 130 mM and 230 mM Na+ salt solutions,
led to a slight decrease in the shear moduli of P11-4. P11-4: GAG mixtures in the 230 mM Na+
salt solution were the stiffest hydrogels when compared to those in the 130 mM Na+ salt
solution regardless of the GAG molar ratio. P11-8 in the presence of GAG molar ratios 1:16
and 1:64, were also investigated. The observations of the gelation properties of these gels
were reflected in the rheological properties of P11-8, where the highest shear moduli of all
the peptide: GAG mixtures investigated were seen in P11-8 at GAG molar ratio of 1:64 in both
of the Na+ salt solutions. However similarly to P11-4 the addition of more GAG (1:16) to P11-8
led to a reduced stiffness compared to P11-8 at the 1:64 GAG molar ratio. Despite their liquid
like appearance, P11-12 samples tested demonstrated solid-like behaviour as the samples
tested were biphasic (i.e. fluid and flocculated peptide). The P11-12 gels in the 130mM Na+
salt solution were stiffer at the higher GAG molar ratio (1:16) when compared to those at the
lower GAG molar ratio.

113
0.01 0.1 1
10
100
1,000
10,000
P11
- 4 at GAG molar ratio 1:64 in the 130 mM Na+ Salt Solution
She
ar M
odul
us (
Pa)
Complex Shear Strain (%)
Shear modulus (elastic component)(Pa) - 1Hz
Shear modulus (viscous component)(Pa) - 1Hz
Shear modulus (elastic component)(Pa) - 20Hz
Shear modulus (viscous component)(Pa) - 20Hz
0.01 0.1 1
10
100
1,000
10,000
100,000P
11- 4 at GAG molar ratio 1:64 in the 230 mM Na
+ Salt Solution
She
ar M
odul
us (
Pa)
Complex Shear Strain (%)
Shear modulus (elastic component)(Pa) - 1Hz
Shear modulus (viscous component)(Pa) - 1Hz
Shear modulus (elastic component)(Pa) - 20Hz
Shear modulus (viscous component)(Pa) - 20Hz
0.01 0.1 1
10
100
1,000
10,000
100,000P
11- 4 at GAG molar ratio 1:16 in the 230 mM Na
+ Salt Solution
She
ar M
odul
us (
Pa)
Complex Shear Strain (%)
Shear modulus (elastic component)(Pa) - 1Hz
Shear modulus (viscous component)(Pa) - 1Hz
Shear modulus (elastic component)(Pa) - 20Hz
Shear modulus (viscous component)(Pa) - 20Hz
0.01 0.1 1
10
100
1,000
10,000
100,000P
11- 8 at GAG molar ratio 1:64 in the 130 mM Na
+ Salt Solution
She
ar M
odul
us (
Pa)
Complex Shear Strain (%)
Shear modulus (elastic component)(Pa) - 1Hz
Shear modulus (viscous component)(Pa) - 1Hz
Shear modulus (elastic component)(Pa) - 20Hz
Shear modulus (viscous component)(Pa) - 20Hz
0.01 0.1 1
10
100
1,000
10,000P
11- 8 at GAG molar ratio 1:16 in the 130 mM Na
+ Salt Solution
She
ar M
odul
us (
Pa)
Complex Shear Strain (%)
Shear modulus (elastic component)(Pa) - 1Hz
Shear modulus (viscous component)(Pa) - 1Hz
Shear modulus (elastic component)(Pa) - 20Hz
Shear modulus (viscous component)(Pa) - 20Hz
0.01 0.1 1
10
100
1,000
10,000
100,000P
11- 8 at GAG molar ratio 1:64 in the 230 mM Na
+ Salt Solution
She
ar M
odul
us (
Pa)
Complex Shear Strain (%)
Shear modulus (elastic component)(Pa) - 1Hz
Shear modulus (viscous component)(Pa) - 1Hz
Shear modulus (elastic component)(Pa) - 20Hz
Shear modulus (viscous component)(Pa) - 20Hz
0.01 0.1 1
10
100
1,000
10,000
100,000P
11- 8 at GAG molar ratio 1:16 in the 230 mM Na
+ Salt Solution
She
ar M
odul
us (
Pa)
Complex Shear Strain (%)
Shear modulus (elastic component)(Pa) - 1Hz
Shear modulus (viscous component)(Pa) - 1Hz
Shear modulus (elastic component)(Pa) - 20Hz
Shear modulus (viscous component)(Pa) - 20Hz
0.01 0.1 1
0.1
1
10
100P
11- 12 at GAG molar ratio 1:64 in the 130 mM Na
+ Salt Solution
She
ar M
odul
us (
Pa)
Complex Shear Strain (%)
Shear modulus (elastic component)(Pa) - 1Hz
Shear modulus (viscous component)(Pa) - 1Hz
Shear modulus (elastic component)(Pa) - 20Hz
Shear modulus (viscous component)(Pa) - 20Hz
0.01 0.1 1
10
100
1,000
10,000
100,000P
11- 12 at GAG molar ratio 1:16 in the 130 mM Na
+ Salt Solution
She
ar M
odul
us (
Pa)
Complex Shear Strain (%)
Shear modulus (elastic component)(Pa) - 1Hz
Shear modulus (viscous component)(Pa) - 1Hz
Shear modulus (elastic component)(Pa) - 20Hz
Shear modulus (viscous component)(Pa) - 20Hz
0.01 0.1 1
0.1
1
10
100
1,000P
11- 12 at GAG molar ratio 1:64 in the 230 mM Na
+ Salt Solution
She
ar M
odul
us (P
a)
Complex shear strain(%)
Shear modulus (elastic component)(Pa) - 1Hz
Shear modulus (viscous component)(Pa) - 1Hz
Shear modulus (elastic component)(Pa) - 20Hz
Shear modulus (viscous component)(Pa) - 20Hz
0.01 0.1 1
0.1
1
10
100
1,000P
11- 12 at GAG molar ratio 1:16 in the 230 mM Na
+ Salt Solution
She
ar M
odul
us (P
a)
Complex Shear Strain (%)
Shear modulus (elastic component)(Pa) - 1Hz
Shear modulus (viscous component)(Pa) - 1Hz
Shear modulus (elastic component)(Pa) - 20Hz
Shear modulus (viscous component)(Pa) - 20Hz
Figure 53: The amplitude sweeps (elastic and viscous modulus vs. shear strain) of P11- 4, P11- 8 and P11- 12: GAG mixtures at 10 mg.ml-1 in 130 mM and 230 mM Na+ salt solutions. Shear strain started at 0.01 % and ramped up to 100% at a temperature 370C. Shear strain chosen within the LVER was: (A, B, C & D=0.15 %, E=0.17 %, F=0.1 %, G=0.15 %, H=0.3 %, I,
J, K & L=0.15 %).
A B
C D
E F
G H
I J
K L

114
Figure 54: The effect of varying the Na+ ion concentration (130 mM or 230 mM) and GAG molar ratio (1:16 and 1:64) on the mechanical stiffness of the P11-4, P11-8 and P11-12: GAG mixtures. Temperature 37oC. Frequency sweep tests between 1Hz and 20Hz for the P11-4,
P11-8 and P11-12 at GAG molar ratio of 1:16 and 1:64 in the: (A, C & E) 130 mM Na+ salt solution & (B, D & F) in the 230 mM Na+ salt solution, (G) Shear modulus extracted 1Hz for the P11-4, P11-8 and P11-12 at GAG molar ratio of 1:16 and 1:64 in both 130 mM and
230 mM Na+ salt solution. Data is presented as the mean (n=3) ± 95% confidence intervals. Individual samples were subject to an amplitude sweep before commencing the test, in
order to identify the linear viscoelastic region (LVER). A strain value was then chosen within the middle region of the LVER and the shear moduli (elastic and viscous) were all calculated
by running a frequency sweep test between 1Hz & 20Hz.
1 10100
1,000
10,000
100,000
P11
- 4 at different GAG molar ratios in a 130mM Na+ salt solution
She
ar m
odul
us, G
', G
'' (P
a)Frequency(Hz)
GAG molar ratio 1:16 elastic modulus GAG molar ratio 1:16 viscous modulus
GAG molar ratio 1:64 elastic modulus GAG molar ratio 1:64 viscous modulus
1 10100
1,000
10,000
100,000
P11
- 4 at different GAG molar ratios in a 230mM Na+ salt solution
Sh
ear
mo
dul
us,
G',
G''
(Pa
)
Frequency(Hz)
GAG molar ratio 1:16 elastic modulus GAG molar ratio 1:16 viscous modulus
GAG molar ratio 1:64 elastic modulus GAG molar ratio 1:64 viscous modulus
1 10100
1,000
10,000
100,000
P11
- 8 at different GAG molar ratios in a 130mM Na+ salt solution
She
ar m
odul
us, G
', G
'' (P
a)
Frequency (Hz)
GAG molar ratio 1:16 elastic modulus GAG molar ratio 1:16 viscous modulus
GAG molar ratio 1:64 elastic modulus GAG molar ratio 1:64 viscous modulus
1 10100
1,000
10,000
100,000
P11
- 8 at different GAG molar ratios in a 230mM Na+ salt solution
She
ar m
odul
us, G
', G
'' (P
a)
Frequency (Hz)
GAG molar ratio 1:16 elastic modulus GAG molar ratio 1:16 viscous modulus
GAG molar ratio 1:64 elastic modulus GAG molar ratio 1:64 viscous modulus
1 100.1
1
10
100
1,000
10,000
100,000
P11
- 12 at different GAG molar ratios in a 130mM Na+ salt solution
She
ar m
odul
us, G
', G
'' (P
a)
Frequency (Hz)
GAG molar ratio 1:16 elastic modulus GAG molar ratio 1:16 viscous modulus
GAG molar ratio 1:64 elastic modulus GAG molar ratio 1:64 viscous modulus
1 100.1
1
10
100
1,000
10,000
100,000
P11
- 12 at different GAG molar ratios in a 230mM Na+ salt solution
She
ar m
odul
us, G
', G
'' (P
a)
Frequency (Hz)
GAG molar ratio 1:16 elastic modulus GAG molar ratio 1:16 viscous modulus
GAG molar ratio 1:64 elastic modulus GAG molar ratio 1:64 viscous modulus
A B
C D
E F
G

115
3.4.3.3 Shear modulus of chondroitin sulfate alone
In order to understand the effect of the GAG, rheological studies of chondroitin sulfate alone
in both 130mM and 230mM Na+ salt solutions were carried out. The lowest (4.85 mg.ml-1)
and highest (22.1 mg.ml-1) concentrations of chondroitin sulfate were used (see Table 14).
These concentrations were deemed as a good starting point to determine whether the GAGs
alone had any mechanical properties. All samples were made up as described in Section
3.3.5.2.3. All the GAG solutions regardless of their concentration or the Na+ salt solution they
were in, formed clear runny liquids as shown in Figure 55.
Peptide Weight
of GAG (mg.ml-1)
130 mM Na+ Salt Solution 230 mM Na+ Salt Solution
GAG
4.85
22.1
Figure 55: Varying concentrations of chondroitin sulfate (4.85 mg.ml-1 and 22.1 mg.ml-1) in 130 mM & 230 mM Na+ salt solutions. Images captured 2 days after the solutions were
prepared before testing on the rheometer (n=3).
The amplitude sweep in both the 130 mM and 230 mM Na+ salt solutions (Figure 56A - D),
showed that chondroitin sulfate at both the highest (22.1 mg.ml -1) and lowest (4.85 mg.ml-1)
concentration had a very large LVER. This indicated that the gels could undergo higher strains
before there was a breakdown in the molecular structure. However, the shear moduli values
were among the lowest in this study, hence the stiffness of these liquids was very low. A
strain value of 10% was chosen to carry out the frequency sweeps for all samples ( Figure 57A
& B). The shear moduli in the frequency sweep spectrum varied drastically across the
frequency range (1Hz to 20Hz). This behaviour was observed across both chondroitin sulfate
concentrations in both Na+ salt solutions, in which the viscous moduli and the elastic moduli
crossed over at various points, eventually converged or in most cases the viscous moduli
were higher than the elastic moduli, indicating that the suspensions formed had a more liquid
nature than solid. This agreed with the physical properties (Figure 55) of the suspensions
made, which were all liquid.

116
Figure 56: Amplitude sweep: Elastic and viscous modulus vs. shear strain of chondroitin sulfate in both the 130 mM and 230 mM Na+ salt solutions at concentrations of 4.85 and
22.1 mg.ml-1. Starting shear strain: 0.01%, end shear strain: 100%, Temperature 370C. Shear strain chosen within the LVER for frequency sweep was 10% for all samples. Data presented
as the mean (n=3) ± 95% confidence intervals.
Figure 57: Frequency sweep: Elastic and viscous modulus vs. frequency of chondroitin sulfate in both the 130 mM and 230 mM Na+ salt solutions at a concentration of 4.85 and
22.1 mg.ml-1. Starting frequency: 1Hz, end frequency: 20Hz, Shear strain: 10%, Temperature 370C. Data presented as the mean (n=3) ± 95% confidence intervals.
A B
C D 1 10 100
1E-4
1E-3
0.01
0.1
1
10
Shear modulus (elastic component) - 1Hz
Shear modulus (viscous component) - 1Hz
Shear modulus (elastic component) - 20Hz
Shear modulus (viscous component) - 20HzSh
ea
r m
od
ulu
s,
G',
G''
(Pa
)
Complex shear strain(%)
GAG (4.85 mg.ml-1) in 130 mM Na
+ Salt Solution
1 10 100
1E-4
1E-3
0.01
0.1
1
10
Shear modulus (elastic component) - 1Hz
Shear modulus (viscous component) - 1Hz
Shear modulus (elastic component) - 20Hz
Shear modulus (viscous component) - 20HzShear
modulu
s, G
', G
'' (P
a)
Complex shear strain(%)
GAG (22.1 mg.ml-1) in 130 mM Na
+ Salt Solution
1 10 100
1E-4
1E-3
0.01
0.1
1
10
Shear modulus (elastic component) - 1Hz
Shear modulus (viscous component) - 1Hz
Shear modulus (elastic component) - 20Hz
Shear modulus (viscous component) - 20HzShear
modulu
s, G
', G
'' (P
a)
Complex shear strain(%)
GAG (4.85 mg.ml-1) in 230 mM Na
+ Salt Solution
1 10 100
1E-4
1E-3
0.01
0.1
1
10
Shear modulus (elastic component) - 1Hz
Shear modulus (viscous component) - 1Hz
Shear modulus (elastic component) - 20Hz
Shear modulus (viscous component) - 20HzSh
ea
r m
od
ulu
s, G
', G
'' (P
a)
Complex shear strain(%)
GAG (22.1 mg.ml-1) in 230 mM Na
+ Salt Solution
1 101E-4
1E-3
0.01
0.1
1
10
GAG at different concn in a 130 mM Na
+ Salt Solution
Shear
Moduli, G
', G
'' (P
a)
Frequency(Hz)
GAG at 4.85 mg.ml-1 (elastic component)
GAG at 4.85 mg.ml-1 (viscous component)
GAG at 22.1 mg.ml-1 (elastic component)
GAG at 22.1 mg.ml-1 (viscous component)
1 101E-4
1E-3
0.01
0.1
1
10
GAG at different concn in a 230 mM Na
+ Salt Solution
Sh
ea
r M
od
uli,
G', G
'' (P
a)
Frequency(Hz)
GAG at 4.85 mg.ml-1 (elastic component)
GAG at 4.85 mg.ml-1 (viscous component)
GAG at 22.1 mg.ml-1 (elastic component)
GAG at 22.1 mg.ml-1 (viscous component)
A B

117
3.4.4 Summary of the effect of GAG molar ratio and Na+ salt solution on
the elastic shear modulus (G’) of the peptide and PEP: GAG mixtures.
A summary of the effects of two GAG molar ratios (1:16 and 1:64) and two Na+ salt solutions
(130 mM and 230 mM) on the elastic shear modulus of the peptides alone and the peptide:
GAG mixtures at 1 Hz, is presented in Table 27. The data clearly showed that P11-4, P11-8 and
their PEP: GAG mixtures had the stiffest gels.
Table 27: Summary table of the elastic shear modulus (G’) of the peptides alone and the PEP: GAG mixtures at 1 Hz.
Elastic shear modulus (G’) (Pa)
Peptide alone 1:16 GAG 1:64 GAG
130 mM 230 mM 130 mM 230 mM 130 mM 230 mM
P11-4 10,282 ±
2,047 9,951 ±
880 4,480 ±
377 10,190 ±
2,385 7,930 ±
1,774 10,720 ±
3,032 P11-8 24,604 ±
8,943 53,173 ±
2,398 7,722 ±
1,087 8,468 ±
404 26,854 ±
2,737 23,515 ±
4,891 P11-12 24 ±
4 5,608 ±
867 1,813 ±
124 502 ±
186 47 ±
5 130 ±
82
The data is presented as the mean (n=3) ± 95% confidence intervals.
3.5 Discussion
A peptide-hydrogel biomaterial for use in the regeneration of osteoarthritic cartilage should
be able to form self-supporting gels in a physiological environment, show characteristic
morphology similar to that of proteoglycan structures found in native cartilage and be strong
enough to remain in the area to which it is applied. In this study, it was hypothesised that
GAG chains at different molar ratios would not only interact electrostatically with the
charged self-assembling peptides but also with the two ionic salt solutions. To gain a better
understanding of whether such interactions were possible, the rheological data from this
study was considered alongside the data from the studies of the self-assembly of the peptide-
GAG mixtures using FTIR, and the morphological assessment of the peptide-GAG mixtures
using TEM.
Initial experiments of the peptides alone in two different Na+ salt solutions (130 mM Na+ salt
solution and 230 mM Na+ salt solution); gave an insight of how the three peptides would
behave under normal physiological conditions and also within the environment of the
surface layer of articular cartilage. Despite the difference in the percentages of β–sheet
formation between the peptides, they all exhibited characteristic networks of entangled
fibrils, which were indicative of self-sustaining gels as supported by the TEM images.
Increasing the ionic strength of the Na+ salt solution had different effects on the three
peptides. Decreases in the percentage of β-sheet formed in P11-4, at increased ionic strength

118
could have been due to the monovalent cation interaction in the unassembled (monomeric)
state. The monovalent cations could have interacted with the negatively charged peptide,
forming an electric layer around the negatively charged monomer; which in turn would have
increased the translational ( trans) energy barrier, preventing self-assembly. Similarly,
increases in the β-sheet formed for P11-8 and P11-12 at higher ionic strength, could be
attributed to the net positive charge of these monomeric peptides; which could have caused
local repulsion of the monovalent cations, thus, not incurring an increase in the translation
energy barrier. This study highlighted the potential effects of the surrounding ionic
environment on the biochemical properties of the peptides.
A similar study carried out by Carrick et al., showed the effect that ionic strength had on the
self-assembly, morphology and gelation of pH responsive 𝛽-sheet tape-forming peptides
(Carrick et al., 2007). This study emphasised the effect that the physiological-like conditions
(130mM NaCl in D2O – no other salts added), had on the transition from fluid solutions with
monomeric random coil, to gels with an anti-parallel 𝛽-sheet structure. The shifts in the
transitions experienced by P11-4, P11-8, & P11-12 (Figure 58), as a result of an increase in the
ionic strength, were attributed to the screening of electrostatic repulsions between the
positive and negative side chains of the individual peptides; rather than a change of the
deprotonation behaviour of the amino acid side chains or the net peptide charge.
This can be quantified by the DLVO theory, which predicts that the addition of salts will
screen charged groups from each other and therefore decrease the Debye length of the
solvent (Caplan et al., 2000; Caplan et al., 2002). The behaviour of this P11-X series of peptides
is consistent with this theory, however, the effects of different concentrations of salts or
different types of counter ions was not studied by Carrick et al. (2007). They did comment
that the use of ions with a greater charge (usually divalent ions), which have a larger Debye
radius (divalent ion vs univalent ions), allow the divalent ions to screen the electrostatic
interactions over a larger range. Possibly affecting the overall self-assembly mechanism,
which could explain the results presented here.

119
Figure 58: Self-assembly behaviour of P11-4, P11-8 and P11-12 in 130 mM Na+ salt solution with no other salts. (a) Percentage of β-sheet of the peptides determined by FTIR (●) and
NMR (▲) as a function of pD in D2O. (b) Percentage of β-sheet of the peptides determined by FTIR (○) and NMR (Δ) as a function of pD in 130mM NaCl in D2O, adapted from (Carrick
et al., 2007).
Although initial studies showed promising results, in terms of peptide ability to form self-
supporting gels in two different Na+ salt solutions; the aim was to mix the peptides with
chondroitin sulfate (GAGs) with the goal of restoring the biomechanical properties of OA
cartilage. These highly negatively charged molecules could potentially interfere with peptide
self-assembly and therefore this required investigation.
The FTIR data showed that a small addition of GAG, could either increase or decrease the 𝛽-
sheet percentage and also, in some instances disrupt the ability of the peptides to self-
assemble. In the case of P11-4 in 130 mM Na+ salt solution, the decrease in 𝛽-sheet, after a
small addition of GAG (1:64), could be explained by the interaction of the highly negatively
charged GAG molecules with the negatively charged peptide, increasing the translation
energy required, hence limiting the self-assembly. However, in the 230 mM Na+ salt solution
a similar effect was observed, which could be explained by the screening of electrostatic
repulsion between the positive and negative side chains of P 11-4 with the increasing
Peptides In D2O 130mM NaCl in D2O Key
P11-4
I – Nematic gel
II – Flocculate
III – Nematic fluid
IV – Isotropic fluid
P11-8
I – Isotropic fluid
II – Biphasic
solution
III – Nematic gel
P11-12
I – Isotropic fluid
II – Weakly
nematic viscous
fluid
III – Weakly
nematic gel
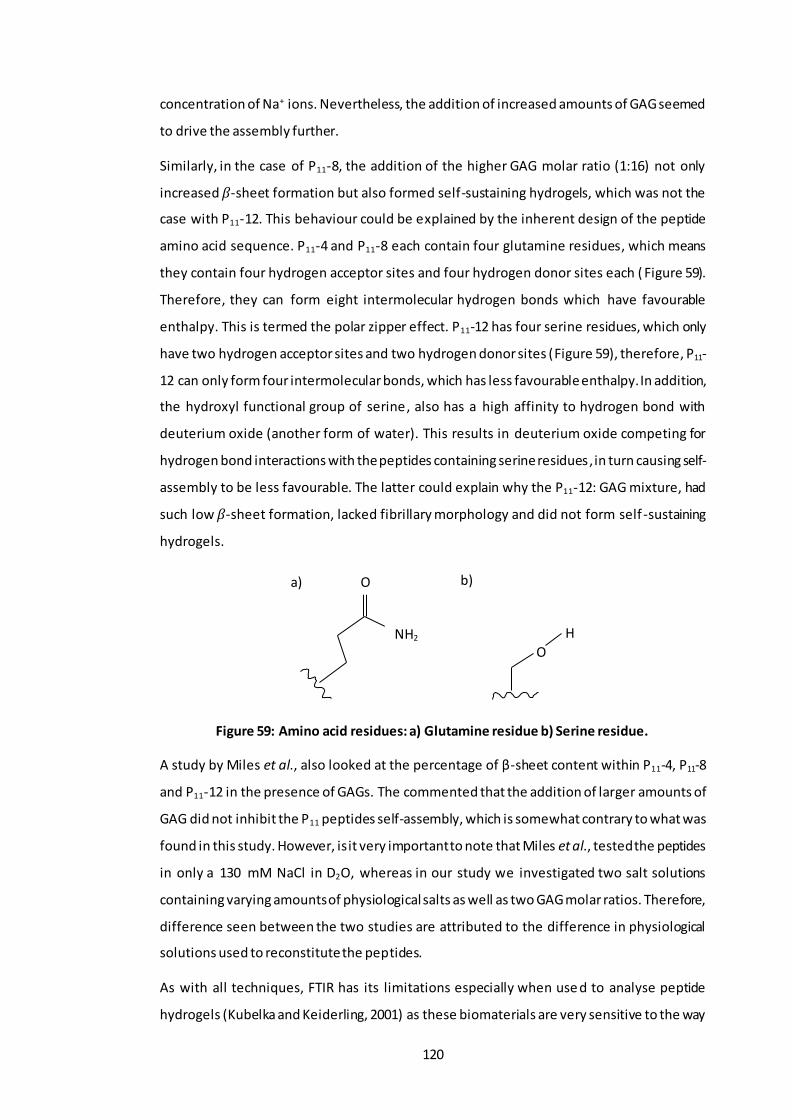
120
concentration of Na+ ions. Nevertheless, the addition of increased amounts of GAG seemed
to drive the assembly further.
Similarly, in the case of P11-8, the addition of the higher GAG molar ratio (1:16) not only
increased 𝛽-sheet formation but also formed self-sustaining hydrogels, which was not the
case with P11-12. This behaviour could be explained by the inherent design of the peptide
amino acid sequence. P11-4 and P11-8 each contain four glutamine residues, which means
they contain four hydrogen acceptor sites and four hydrogen donor sites each ( Figure 59).
Therefore, they can form eight intermolecular hydrogen bonds which have favourable
enthalpy. This is termed the polar zipper effect. P11-12 has four serine residues, which only
have two hydrogen acceptor sites and two hydrogen donor sites (Figure 59), therefore, P11-
12 can only form four intermolecular bonds, which has less favourable enthalpy. In addition,
the hydroxyl functional group of serine, also has a high affinity to hydrogen bond with
deuterium oxide (another form of water). This results in deuterium oxide competing for
hydrogen bond interactions with the peptides containing serine residues, in turn causing self-
assembly to be less favourable. The latter could explain why the P11-12: GAG mixture, had
such low 𝛽-sheet formation, lacked fibrillary morphology and did not form self -sustaining
hydrogels.
Figure 59: Amino acid residues: a) Glutamine residue b) Serine residue.
A study by Miles et al., also looked at the percentage of β-sheet content within P11-4, P11-8
and P11-12 in the presence of GAGs. The commented that the addition of larger amounts of
GAG did not inhibit the P11 peptides self-assembly, which is somewhat contrary to what was
found in this study. However, is it very important to note that Miles et al., tested the peptides
in only a 130 mM NaCl in D2O, whereas in our study we investigated two salt solutions
containing varying amounts of physiological salts as well as two GAG molar ratios. Therefore,
difference seen between the two studies are attributed to the difference in physiological
solutions used to reconstitute the peptides.
As with all techniques, FTIR has its limitations especially when use d to analyse peptide
hydrogels (Kubelka and Keiderling, 2001) as these biomaterials are very sensitive to the way
O
NH2 O
H
a) b)

121
they are treated. The biphasic solutions/gels analysed in the FTIR can dissociate upon the
application of mechanical force between the CaF2 discs, resulting in sheer thinning, therefore
leading to a disproportionate amount of gel and fluid between the IR discs, which could lead
to inaccurate determination of β-sheet content. However, every effort was made to reduce
this with the use of a known path length of 0.25mm. Nevertheless, due to the concentration
regime and aqueous salt conditions used, FTIR was the only available means to assess the
conformation of the system studied. Despite the possible limitations of the technique , FTIR
analysis clearly highlighted that two of the three SAPs (P11-4 and P11-8) demonstrated a
greater percentage of β-sheet in the presence of the GAG at 130mM and 230mM Na+ salt
concentrations, when compared to P11-12. This higher percentage of β-sheet, demonstrated
that self-assembly had taken place under physiological conditions, making P11-4 and P11-8,
good candidates to take forward into biological studies, depending on their fibril morphology
and biomechanical properties. The formation of peptide gels is subject to a difference in the
kinetics of self-assembly which can be influenced by the surrounding conditions and the
molar ratio of GAG. Therefore, the values of β-sheet percentage presented in this study may
not be indicative of values that the peptide and peptide-GAG mixtures may have achieved, if
they had been left to reach a full equilibrium state.
When considering the overall morphology of the SAPs and SAP-GAG mixtures, it was
observed that generally those peptides and peptide-GAG mixtures that exhibited higher β-
sheet formation tended to exhibit denser networks of fibrils and fibres, with a greater
proportion of junction points. The presence of these nanofibrilar networks with interwoven
morphology indicated the formation of self-supporting hydrogels. However, this was not the
case for P11-12 at both GAG molar ratios and in both Na+ salt solutions. This peptide
precipitated out of solution and formed solid white flocculates, some of which were
observed in the TEM images for P11-12. These clumps appeared to interact with each other
to form bundles and small networks as was the case in the other gels. The low percentage of
β-sheet formation exhibited in the FTIR analysis could be linked to the irregular fibril
morphology and this may have been due to the unexpected formation of nanotubes,
although these were not widely observed.
The changes seen in β-sheet percentage and morphology; as a result of increasing the Na+
ion concentration could have been due to the increased amount of positively charged sodium
ions present in the salt solutions. This could have been as a result of the interactions with
the differently charged peptide residues, which in theory could have inhibited or promoted
the formation of β-sheet secondary structure as well as fibril formation. Moreover, the
presence of other cations and anions, present within these Na+ salt solutions could also have

122
played a role in the interaction with the differently charged peptide residues and also have
had positive or negative impacts on the peptide self-assembly and fibril morphology.
It is important to consider that the variations and trends observed in the widths and lengths
of the SAPs and SAP-GAG mixtures, may not have been directly related to the concentration
of GAGs and Na+ ions present in the salt solutions; due to the nature by which the peptides
were processed for imaging. Peptide and peptide-GAG samples were left to dry before TEM
analysis and therefore it is possible that the drying process could have had an effect on the
fibril/fibre formation and/or association and hence affected the fibril widths and lengths.
Nevertheless, the TEM images showed that P11-4 and P11-8 alone and with GAG,
demonstrated a characteristic network of entangled fibres/fibrils; an indicator that the SAPs
had undergone hierarchical self-assembly to form these structures. Despite having some of
the longest and thickest fibrils, P11-12, did not demonstrate this characteristic network and
hence would not be considered a good candidate for future studies as when coupled with
the FTIR analysis, it would appear that the GAGs affected the self-assembly and morphology
of P11-12, which was not desirable for the intended application.
Previous studies with the same peptides have shown that the addition of GAG molecules,
also enhanced the thermodynamic stability of the aggregates, increased β-sheet content and
also acted as a trigger for peptide gelation, especially with the positively charged peptides
(P11-8 and P11-12) (Miles et al., 2016). Miles et al. commented that electrostatic interactions
could not be the sole reason to explain why there were favourable peptide-GAG interactions.
The authors discussed the potential of other interactions, such as hydrogen bonding
between the GAGs and peptides, which helped explain how the GAGs also enabled the self-
assembly of like-charged anionic peptides (P11-4). The authors were able to support their
theory through the testing of polyethylene glycol (PEG) polymers with different molar ratios
of GAG. There were no comparable improvements in the gelation kinetics when compared
to the P11-X, peptides, therefore it was concluded that the GAG must also be interacting
directly with the peptide via physical bonds to enhance the gelation kinetics, which could
explain the trends observed in the study presented here.
The P11-x peptides were studied in two different GAG molar ratios (1:64 and 1:16) and Na+
salt solutions (130mM and 230mM Na+ salt solution). Each solution contained a different
concentration of Na+ ions, as well as other salts found in cartilage tissue (Urban, 1994), as
these particular conditions had not been studied previously. The FTIR and TEM analyses
showed the combined effects that the ionic Na+ salt solutions and the negatively charged
GAG had on the self-assembly and morphology (fibril formation) of the P11-x peptides. It was

123
hypothesised that these changes in microscopic structures, would lead to changes in the bulk
mechanical properties of these peptide hydrogels and hence a rheological study was able to
determine these differences in mechanical properties. Peptide only and GAG only controls
were also tested in order to determine the effect that the addition of GAG and different Na+
salt solution had on the shear moduli.
The rheological studies were not only able identify the molar ratio of SAP-GAG that gave
favourable biomechanical properties, but also showed the effect that the presence of GAG
chains had on the mechanical stiffness of the SAP hydrogels as a function of GAG
concentration. Perusal of the data revealed the combined effect of the three variables
(peptide, GAG molar ratio and Na+ salt concentration) had an effect on the overall shear
modulus at 1Hz. It is also important to comment on the data for the GAG controls where it
was confirmed that, regardless of the concentration of GAG added to the 130 mM and 230
mM Na+ salt solutions, the samples exhibited no mechanical strength. Therefore, the GAG
on its own had negligible stiffness, when compared to the peptide on its own and the
peptide-GAG mixtures. This supported previous hypotheses that the mechanical properties
observed for the peptide-GAG mixtures were due to interactions between the negatively
charged GAG and the positively/negatively charged peptides as well as their interaction with
the surrounding ionic Na+ salt solution. Given the two physiological environments that these
peptides were tested under, it was clear that the addition of the GAG allow ed for the
mechanical properties of the peptide hydrogels to be tuned over a range of up to four orders
of magnitude (Table 27). In all peptide samples tested, the elastic component was found to
be greater than the viscous component, demonstrating solid-like behaviour of these
hydrogels and in some cases, even exhibiting shear thinning characteristics that may be
advantageous for their future uses in cartilage regeneration. Of the three SAP-GAG mixtures,
it was clear that two of the peptide hydrogels were more favourable, P114 and P11-8, of which
P11-8 was the stiffest. Overall when comparing the behaviour of P11-8 in both cases (Case 1:
In both 130 mM and 230 mM Na+ salt solutions, with Case 2: In both 130 mM and 230 mM
Na+ salt solutions with the addition of two GAG molar ratios); the addition of the GAG had a
very different effect depending on the ionic strength of Na+ salt solution that the peptide was
in. In the 130 mM Na+ salt solution, P11-8 at the lower molar ratio of GAG (1:64) had a positive
effect on the moduli. Whereas, at the higher molar ratio of the GAG (1:16), it seemed to have
a detrimental effect on the moduli. The latter was also true for both molar ratios of GAG in
the 230 mM Na+ salt solution. Nevertheless, P11-8 in both the 130 mM and 230 mM Na+ salt
solutions at the lowest GAG molar ratio exhibited an elastic modulus of around +23,000 Pa;
which was relatively high for a gel made of soft matter. The bundles of aggregates captured

124
in the TEM images of P11-8 in both Na+ salt solutions (130 mM and 230 mM) at a GAG molar
ratio of 1:64, showed areas of denser bundles of fibrilar networks, indicating that there that
there were higher number of junction points. This observation supported the results of the
rheological study.
The mechanical properties of the SAP-GAG mixtures were influenced by the ionic interactions
between the negatively charged GAGs and the positively/negatively charged peptides as well
as their interaction with the surrounding ionic Na+ salt solution. This study showed that the
addition of another charged bio-polymer and the change in the ionic strength of the
surrounding solution had a large effect on the stiffness of the individual peptide hydrogels
by either promoting a greater number of entanglements in particular peptides or by
inhibiting the peptides ability to form entanglements and junction points. The addition of the
GAG not only provided the high charge found in native tissue, which contributes to the
hydration and function of cartilage, but at certain molar ratios, it improved the rheological
properties of some of the resulting gels. Increasing the Na+ ion concentration (as found in
the surface of cartilage), allowed for the investigation of how the peptides would behave in
in vivo conditions and also the effect that this had on the rheological properties of the
resulting gels. Overall in this study, higher concentrations of GAG (1:16) decreased the gel
stiffness of the glutamine-based peptides (P11-4 and P11-8). However, at lower GAG
concentrations (1:64) the stiffness of the P11-4 gels was slightly improved, but more so in P11-
8 gels. Nevertheless, the corresponding peptides alone were generally mechanically stiffer.
By contrast, for the serine-based peptide (P11-12) gel stiffness was increased at high GAG
concentrations, but the stiffness values were still much lower than the glutamine based
peptides.
A similar study carried by Miles et al. at the University of Leeds, also showed that the GAG
can have a great effect on the shear modulus of the peptides (Miles et al., 2016). Although
the solution used was made up in differently to the one in this study, the authors also
commented that at higher GAG concentrations the shear modulus of the peptides decreased,
when compared to the peptides with lower GAG concentrations. The authors also
commented on how the presence of the GAGs not only affects the peptide interaction but
also has an effect on their microscopic structure. Specifically concluding that the shear
modulus of the peptide gels was related to the thickness of the fibrils and/or the number of
junction points between the interacting fibrils, which in turn is dependent on the density of
the chains, their width and length and cross-linking affinity at the junction points. A
conclusion which strongly agreed with the findings in this study.

125
The equilibrium shear modulus of cartilage has been quoted to be in the range of 0.05 to
0.25 MPa (Athanasiou et al., 2009). Our strongest peptide and peptide: GAG gel was P11-8
(1:64 GAG molar ratio), with an elastic shear modulus of approximately 0.027 MPa, which
doesn’t put it far off the shear modulus of healthy cartilage. Bearing in mind that the gels are
made of soft matter and have only been tested in an environment that is meant to mimic the
internal environment of the knee, these peptide: GAG gels have a potential to improve the
biomechanical properties of GAG depleted condylar cartilage.
New SAP-GAG hybrid materials have been developed with adjustable mechanical properties.
Their ability to self-assemble and the incorporation of chondroitin sulfate, at the correct
molar ratio makes them feasible candidates for a minimally invasive therapy to aid in the
restoration of mechanical properties to early stage osteoarthritic cartilage. FTIR and TEM
studies have highlighted the SAP-GAG combinations that were able to form characteristic
self-supporting gels able to produce characteristic entangled fibrillary networks similar to
those found in native cartilage. Alongside this, the rheological studies at (1Hz) determined
that P11-4 and P11-8 peptide-GAG combinations, were among the stiffest.
The combination of these studies has identified that two of the three SAPs demonstrate all
of the three favourable properties: high β-sheet percentage, characteristic entangled fibrilar
networks and a high stiffness coefficient.
In conclusion, the data presented in this study indicates that P11-4 and P11-8-chondroitin
sulfate mixtures have properties which make them suitable candidates for further
investigation for their capacity to restore the biomechanical properties of GAG depleted
tissues, such as early stage OA cartilage.

126
Chapter 4 Development of GAG depleted cartilage models
4.1 Introduction
In order to be able to test the ability of the peptide and peptide-GAG mixtures to restore the
mechanical properties of GAG depleted cartilage, it was necessary to deve lop an
osteoarthritic-like cartilage model. Several studies have used GAG-depleting enzymes, such
as chondroitinase ABC (CaseABC) to selectively degrade specific proteoglycans of articular
cartilage to study their role in the biomechanical responses of the tissue and also to create
osteoarthritic-like cartilage models, to test novel cartilage regeneration therapies (Schmidt
et al., 1990; Chen et al., 1997; Pickard et al., 1998; Basalo et al., 2004; Basalo et al., 2005;
Sasada et al., 2005; Katta et al., 2008). Chondroitinase ABC (Case ABC) at pH 8 has been
shown to degrade chondroitin sulfate A, B and C at greater rates than chondroitin and
hyaluronic acid. It does not breakdown other GAGs such as heparin, keratan sulfate or
heparan sulfate (Yamagata et al., 1968). Other studies have shown that the use of SDS within
decellularisation processes can also severely deplete the levels of GAGs wi thin porcine
cartilage tissues (Stapleton et al., 2008; Kheir et al., 2011). The number of sodium dodecyl
sulfate (SDS) washes and the concentration of SDS determine the levels of GAGs removed,
however the use of high concentrations of SDS (1.0-2.0% w/v) can also lead to disruption of
matrix proteins and collagen fibres (Samouillan et al., 2000; Elder et al., 2010; Kheir et al.,
2011). These damaging effects can be minimised by using low concentration SDS (0.1 % w/v;
Stapleton et al., 2008; Kheir et al., 2011). Therefore, the use of chondroitinase ABC and low
concentration SDS were investigated for the development of GAG depleted cartilage models
in this study.
4.2 Aims and objectives
The aim of the research described in this chapter was to create a GAG depleted cartilage
model and characterise the model biochemically and histologically.
4.2.1 Objectives
1) To develop a procedure that would consistently remove GAGs from native porcine
femoral condylar cartilage to create femoral condyles with GAG depleted cartilage.
2) To determine the GAG content of native porcine femoral cartilage and GAG depleted
porcine femoral cartilage.

127
3) To characterise the GAG depleted porcine femoral cartilage using histology and to
compare the histological features to those of native porcine femoral cartilage.
4.3 Experimental Methods
4.3.1 Acquisition of porcine femoral condyles
Porcine femoral condyles were acquired, dissected and stored as described in Chapter 2;
Section 2.2.2.2 to 2.2.2.4.
4.3.2 Treatment of porcine femoral cartilage with chondroitinase ABC.
The enzyme chondroitinase ABC was used throughout this thesis for the depletion of GAGs
from porcine femoral cartilage, unless otherwise stated.
As recommended by the supplier, chondroitinase ABC (Case ABC from Proteus vulgaris,
Sigma) was made at the required concentration with an aseptically prepared buffer solution
at pH 8, with the addition of antibiotic solution to inhibit microbial growth and a proteinase
inhibitor, aprotinin, to prevent autolysis of the ECM proteins. The effect of the CaseABC
treatment on the GAG content of the femoral condylar cartilage was determined using the
dimethylmethylene blue assay (DMB assay), outlined in Chapter 2; Section 2.2.5.3.1.
4.3.2.1 GAG depletion of cartilage tissue
Reagents:
• Bovine serum albumin (BSA) 2% (w/v) solution. BSA (10 mg) was dissolved in 0.5 ml
of distilled water (dH2O).
• BSA solution 0.01% (w/v). BSA (10 mg) was dissolved in 100 ml of dH2O.
• Buffer solution (pH 8) Trizma base (0.61 g; Sigma) and 0.49 g of sodium acetate
(Thermo Fisher) were dissolved in 50 ml of dH2O. The pH was adjusted to 8 by
adding 6M HCL or 6M NaOH drop-wise.
• Antibiotic solution: (Working concentration: nystatin [250 U.ml-1], gentamicin [20
U.ml-1], Polymixin B [200 µg.ml-1], vancomycin [50 µg.ml-1], Primixin I.V [200 µg.ml-1],
amphotericin B [25 µg.ml-1], aprotonin [10 KIU.ml-1]). Gentamicin (1 mg), 10 mg
Polymixin B, 2.5 mg of vancomycin and 10 mg of Primixin I.V were dissolved in 1250
µl of nystatin, 10 µl of aprotonin, 5 ml of amphotericin B and 0.5 ml of 2% (w/v) BSA
solution. The final solution was aliquoted into 0.7 ml volumes into sterile Eppendorf
tubes.

128
• Hank’s balanced salt solution (HBSS) with 1 mM Zn2+ and penicillin/streptomycin 100
µg.ml-1. ZnCl2 (78.3 g) was dissolved in 28 ml of sterile HBSS. This solution (25 ml) was
filter sterilised and 10 ml of penicillin/streptomycin (neat as supplied by the
manufacturer) was added. This was carried out aseptically in a class II cabinet.
The Case ABC (10 U) was reconstituted by adding 0.5 ml of 0.01% (w/v) BSA solution. The
reconstituted solution was transferred into a universal container and the volume was made
up to 5 ml using the 0.01% (w/v) BSA solution. The CaseABC (0.1 U.ml -1) solution was
aliquoted in volumes of 0.25 ml into Eppendorf tubes. Aliquots were stored at -20 0C until
needed (max storage: 6 months).
4.3.2.2 Enzymatic painting of CaseABC agarose gel onto porcine femoral cartilage
– Model 1
The CaseABC (0.1 U.ml -1) was mixed with an agarose gel to allow the painting of the Case ABC
solution onto the surface of the porcine condyle. A control containing just the antibiotic
solution in the agarose gel was also used. Three porcine femoral condyles (both medial and
lateral condyles) were used for the application of the CaseABC solution and another 3 for the
application of the control solution.
Agarose (15 mg) was dissolved in 4 ml of Case ABC buffer to make a 0.3 % (w/v) solution. The
solution was placed in the microwave for approximately 30-45 seconds to dissolve the
agarose. The solution was allowed to cool to 37oC before adding 1 aliquot (0.68 ml) of the
antibiotic solution followed by 1 aliquot (0.25 ml) of the CaseABC solution. The mixture was
then vortexed gently to ensure thorough mixing of contents and eventual gelling (viscous
liquid). The sol-gel was kept at 37oC until time of application. The control gel was prepared
in the same way except the Case ABC solution was replaced with 0.25 ml of 0.01 % (w/v) BSA
solution.
Porcine femoral condyles were transferred to a sterile class II cabinet and placed into a sterile
pot. An area of interest was marked out by a permanent marker and, using a paint brush, the
CaseABC gel (or control gel) was generously applied to this area (Figure 60). Condyles were
returned to their sterile containers and incubated at 37oC for 2 hours.

129
Figure 60: Sterile condyles showing the area of interest marked out in permanent marker, Case ABC gel was applied to this area to allow the depletion of GAGs.
After the 2 hours, another CaseABC agarose gel (or control gel) was prepared as described
above and re-applied to the femoral condyles in the area of interest and incubated at 37oC
for a further 2 hours. The process was repeated again and after the 3rd application of the
CaseABC agarose gel (or control gel), the condyles were incubated at 37oC overnight.
CaseABC enzyme is inhibited by Zn2+ ions, therefore the following day, the condyles were
transferred into sterile 250 ml pots and washed twice for 30 min in 200 ml of HBSS Zn 2+
solution on an orbital shaker at room temperature with agitation of 240 rpm.
Cartilage condyles were then transferred to a sterile dissection table. Condyles were clamped
and two plugs were aseptically removed from each condyle as described in Chapter 2; Section
2.2.2.3. Cartilage was removed from the bone in both plugs. One plug was used for
histological analysis (Safranin O staining) and the other for GAG analysis.
4.3.2.3 Injection of CaseABC solution into porcine femoral cartilage – Model 2
This method of GAG depletion used the same reagents described in Section 4.3.2. For Model
2 the enzyme was administered using a 30G needle and syringe to a pre -determined area
(Figure 61). A control containing just the enzyme buffer solution and antibiotic solution was
also used. Three porcine femoral condyles (both medial and lateral condyles) were used for
the injection of the CaseABC solution and another three for the injection of the control
solution.
Firstly, 8.1 ml of enzyme buffer was dispensed into a glass universal container and placed in
a water bath at 37oC. Whilst warming, 2 aliquots (1.4 ml) of antibiotic solution were added,
followed by 2 aliquots (0.5 ml) of CaseABC solution. The solution was vortexed gently to
ensure thorough mixing of the contents and kept at 37oC until use. For the control solution,
CaseABC solution was replaced with 0.5 ml of 0.01 % (w/v) BSA solution.
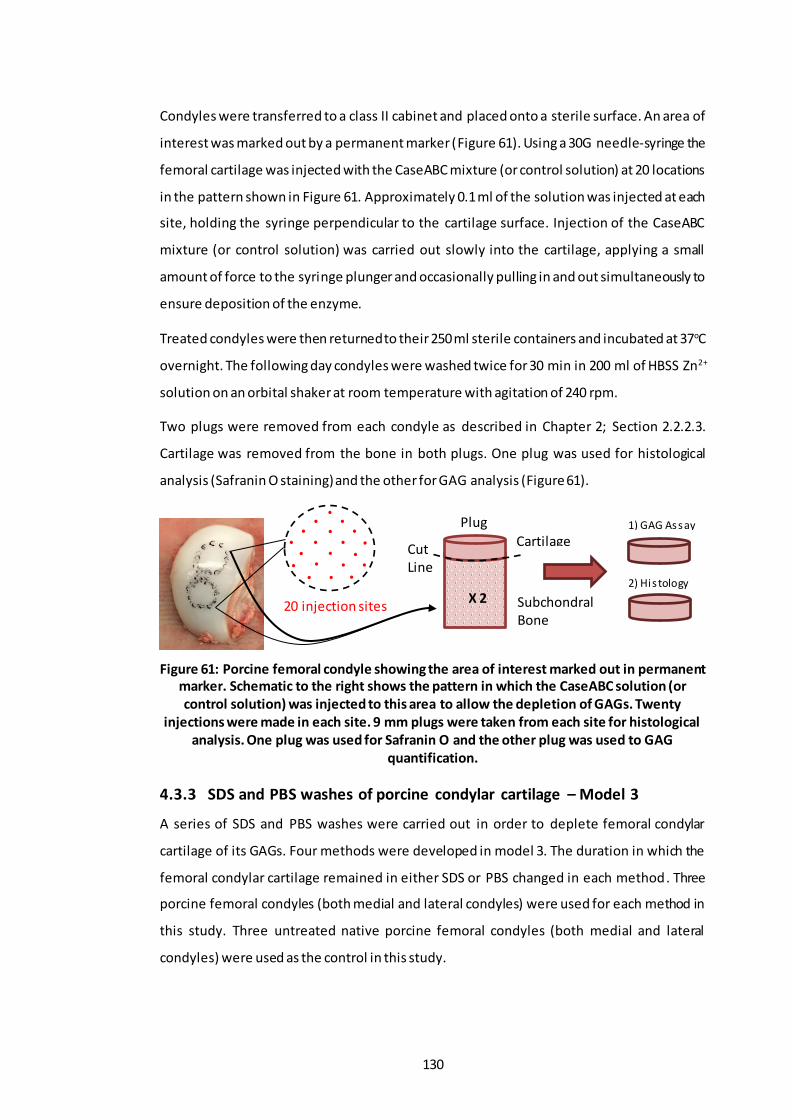
130
Condyles were transferred to a class II cabinet and placed onto a sterile surface. An area of
interest was marked out by a permanent marker (Figure 61). Using a 30G needle-syringe the
femoral cartilage was injected with the CaseABC mixture (or control solution) at 20 locations
in the pattern shown in Figure 61. Approximately 0.1 ml of the solution was injected at each
site, holding the syringe perpendicular to the cartilage surface. Injection of the CaseABC
mixture (or control solution) was carried out slowly into the cartilage, applying a small
amount of force to the syringe plunger and occasionally pulling in and out simultaneously to
ensure deposition of the enzyme.
Treated condyles were then returned to their 250 ml sterile containers and incubated at 37oC
overnight. The following day condyles were washed twice for 30 min in 200 ml of HBSS Zn2+
solution on an orbital shaker at room temperature with agitation of 240 rpm.
Two plugs were removed from each condyle as described in Chapter 2; Section 2.2.2.3.
Cartilage was removed from the bone in both plugs. One plug was used for histological
analysis (Safranin O staining) and the other for GAG analysis (Figure 61).
Figure 61: Porcine femoral condyle showing the area of interest marked out in permanent marker. Schematic to the right shows the pattern in which the CaseABC solution (or control solution) was injected to this area to allow the depletion of GAGs. Twenty
injections were made in each site. 9 mm plugs were taken from each site for histological analysis. One plug was used for Safranin O and the other plug was used to GAG
quantification.
4.3.3 SDS and PBS washes of porcine condylar cartilage – Model 3
A series of SDS and PBS washes were carried out in order to deplete femoral condylar
cartilage of its GAGs. Four methods were developed in model 3. The duration in which the
femoral condylar cartilage remained in either SDS or PBS changed in each method. Three
porcine femoral condyles (both medial and lateral condyles) were used for each method in
this study. Three untreated native porcine femoral condyles (both medial and lateral
condyles) were used as the control in this study.
Plug
Cartilage
Subchondral Bone
Cut Line
2) His tology
1) GAG Assay
X 2 20 injection sites

131
Reagents:
• Sodium dodecyl sulfate (SDS) solution (0.1% w/v). SDS (2 g; Sigma) was dissolved in
2 L of dH2O and 2 ml of aprotinin (Nordic pharma, 10 KIU.ml-1) was then added.
• Phosphate buffered saline (PBS): PBS tablets (20; Sigma) were added to 2 L of dH2O.
The pH was adjusted to between 7.2-7.4, by adding 6M HCL or 6M NaOH dropwise.
The solution was then autoclaved and 2 ml of aprotinin (10 KIU.ml-1) was added.
• Salt solution (130 mM Na+; as outlined in Chapter 3; Section 3.3.1.3). KCl, (1.04 g),
1.11 g of CaCl2, 10.29 g of NaCl, 7.06 g of NaHCO3 were dissolved in 2 L of dH2O.
The method was carried out over four days as described below:
Day 1: porcine femoral condyles (medial and lateral) were placed into 250 ml plastic sterile
containers and 200 ml of 0.1% (w/v) SDS was added. Containers were then secured onto an
orbital shaker using tape. The shaker was placed in an incubator at 37oC and agitated at 240
rpm. The condyles were incubated overnight.
Day 2: the SDS solution was replaced with 200 ml of fresh sterile 0.1% (w/v) SDS and the
samples were returned to the 37oC incubator and agitated at 240 rpm overnight.
Day 3: the 0.1% (w/v) SDS solution was replaced with 200 ml of fresh PBS containing
aprotinin. The samples were returned to the incubator at 37oC and agitated at 240 rpm for
three hours. This step was repeated, followed by a final 24 hour incubation in fresh PBS.
Day 4: the PBS was replaced with the 130 mM Na+ salt solution and left to soak overnight at
4 oC with no agitation.
Two plugs were removed from each condyle as described in Chapter 2; Section 2.2.2.3.
Cartilage was removed from the bone in both plugs. One plug was used for his tological
analysis (Safranin O staining) and the other for GAG analysis.
4.3.4 Histological Characterisation
In order to allow visualisation of any GAG removal from the cartilage as a result of the
methods applied in models (1) to (3), histological analysis was performed. This analysis was
also carried out using native cartilage to observe any differences in GAG distribution. Femoral
condylar cartilage plugs were extracted from the GAG depleted condyles and native cartilage
as outlined above. Cartilage tissues were fixed in zinc fixative, processed and sectioned as
described in Chapter 2; Sections 2.2.3.1 to 2.2.3.3. Sections were placed on slides and were
stained with Safranin O and fast green.

132
4.3.5 GAG Quantification
The GAG content remaining in the GAG depleted tissue from models (1) to (3) was measured
using a DMB assay, to quantify the amount of sulfated sugars remaining within the tissue, as
described in Chapter 2; Section 2.2.5.3.1. The GAG content of native cartilage samples was
also determined for a comparison to be made. There were 3 porcine femoral condyles (both
medial and lateral condyles) for each GAG depleted model and 3 native cartilage samples.
One plug from each condyle (medial and lateral condyle; GAG depleted and native cartilage)
was used for the GAG analysis. Samples were weighed 3 times before lyophilisation (wet
weight) and 3 times after (dry weight) and an average was recorded for the calculation of
percentage GAG per tissue wet and dry weight, as described in Chapter 2; Section 2.2.5.2.
4.3.6 SDS Quantification in GAG depleted cartilage (Model 3)
The SDS concentration within the GAG depleted porcine femoral condylar cartilage was
measured at four different stages of the process for GAG depletion used in model 3. This was
carried out to determine the amount of SDS remaining at the end of each process within the
GAG depleted femoral condylar cartilage. This was important because it was thought that
residual SDS in the cartilage might affect the self-assembly of the peptides and peptide-GAG
mixtures. The analysis was performed on solutions that the femoral condylar cartilage was
immersed in. In addition to reagents listed in Section 4.3.3, the following reagents were used.
Reagents:
• Stains-all stock solution (1.8 mM, Sigma E9379, Lot no#BCBM9845V). Stains-all (10
mg) was dissolved in 10 ml of 50 % (v/v) isopropanol in dH2O. This was then wrapped
in foil and stored at 40C.
• Stains-all working solution (90 µm) was made by mixing 1 ml of the stains-all stock
solution, 1 ml of formamide and 18 ml of dH2O. This was wrapped in foil and stored
at 40C.
SDS was dissolved in three different solvents (SDS 0.1% w/v, PBS and 130 mM Na + salt
solution) at 2 mg.ml -1. These solutions were then serially diluted in the appropriate solvent
to produce a range of standards from 2 to 2000 µg.ml-1 and a standard curve was produced.
A clear flat-bottomed 96-well plate was used for the assay, 200 µl of stains-all working
solution was added to each well and 10 µl of each standard was added in triplicates. The
following samples were analysed: (1) the last SDS wash; (2) the two three hour PBS washes;
(3) the one 24 hour PBS wash and 4) the 130 mM soak. One microliter was taken from each

133
solution and added into the 96-well plate in triplicates. The plate was shaken for 2 min and
the absorbance of each well was measured using a microplate spectrophotometer at 447
nm. A graph of SDS concentration against absorbance at 447 nm was plotted using the
standard solutions. A linear regression analysis was performed and used to interpolate the
concentration of SDS in the test samples.
4.4 Results
4.4.1 Evaluation of native and GAG depleted porcine femoral condyles
Three different methods for producing GAG depleted cartilage were investigated. Images of
sections of native porcine condylar cartilage and porcine condylar cartilage that had been
subject to the three different GAG depletion techniques stained with Safranin O are
presented in Figure 62, Figure 64, Figure 66 and Figure 67. The GAG content in native porcine
condylar cartilage and porcine condylar cartilage that had been subject to the three different
GAG depletion techniques is presented in Figure 63, Figure 65 and Figure 68; with the
statistical analysis of the data shown in Figure 70.
4.4.1.1 Model 1
Images of sections of porcine condylar cartilage that had been painted with Case ABC agarose
gel and a control agarose-gel without CaseABC; stained with Safranin O are presented in
Figure 62A & B, respectively. The control cartilage tissue showed characteristi c cartilage
architecture and cell organisation, throughout the depth of the cartilage tissue, when
compared with native porcine cartilage tissue. Porcine cartilage that had been treated with
the CaseABC showed similar histo-architecture compared to the control cartilage tissue and
native porcine cartilage. It was, however clear from the Safranin O stain distribution that the
CaseABC treatment had removed some of the GAGs from the surface of the cartilage.
Measurement of the depth of GAG depletion in all samples (n=3 for porcine condylar
cartilage painted with CaseABC and n=3 for the control cartilage, painted without CaseABC),
across 6 different points along the top surface of the cartilage, showed that the average
depth of GAG depletion was approximately 163 µm from the surface of the cartilage in the
CaseABC treated cartilage; compared to 8 µm in the control porcine condylar cartilage, which
had not been treated with CaseABC. The latter was attributed to the lower levels of GAGs in
the superficial layer of cartilage compared to the mid-zone. The data (depth of the GAG
depleted surface layer) was analysed using Student`s t-test to test the null hypothesis that
applying the agarose CaseABC gel did not affect the depth of GAG depletion of porcine
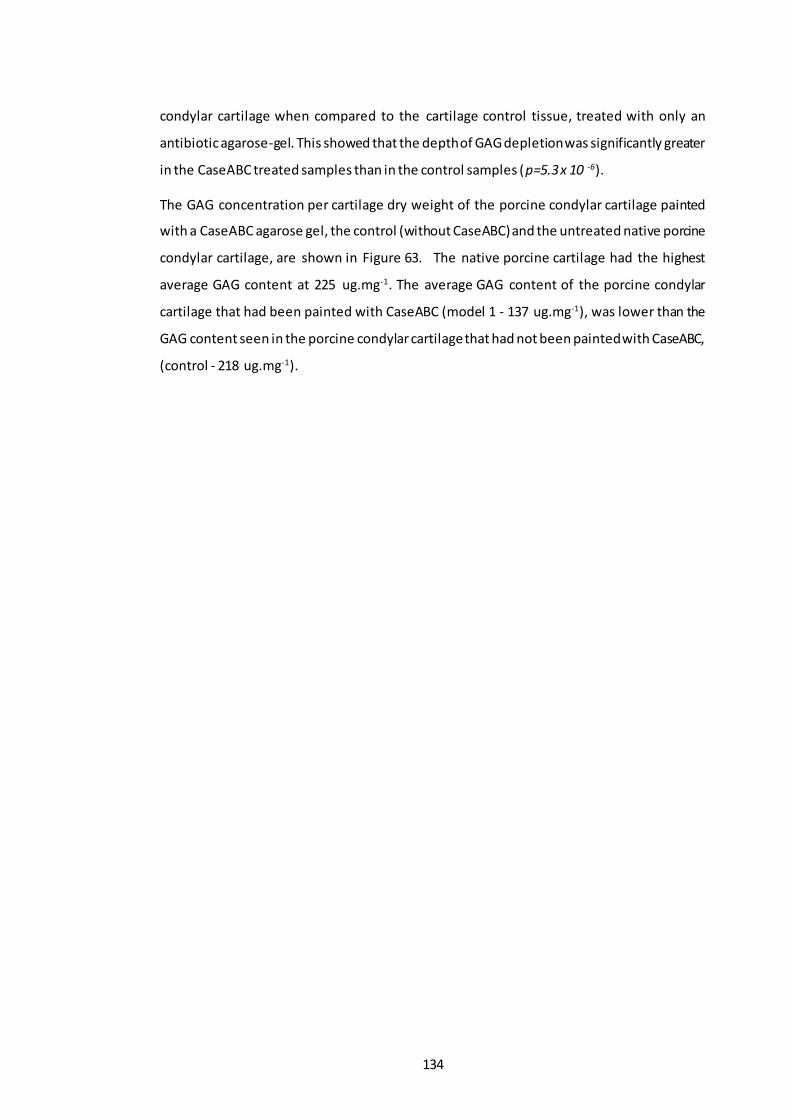
134
condylar cartilage when compared to the cartilage control tissue, treated with only an
antibiotic agarose-gel. This showed that the depth of GAG depletion was significantly greater
in the CaseABC treated samples than in the control samples (p=5.3 x 10 -6).
The GAG concentration per cartilage dry weight of the porcine condylar cartilage painted
with a CaseABC agarose gel, the control (without CaseABC) and the untreated native porcine
condylar cartilage, are shown in Figure 63. The native porcine cartilage had the highest
average GAG content at 225 ug.mg-1. The average GAG content of the porcine condylar
cartilage that had been painted with CaseABC (model 1 - 137 ug.mg-1), was lower than the
GAG content seen in the porcine condylar cartilage that had not been painted with CaseABC,
(control - 218 ug.mg-1).

13
5
Figure 62: Safranin O stained sections of GAG depleted porcine condylar cartilage treated with an agarose gel containing CaseABC and antibiotic/aprotinin solution (model 1) and a porcine condylar cartilage treated with an agarose gel containing only antibiotic/aprotinin solution (control ). (A) GAG depleted cartilage, (B) Control
sample. Images to the left were medial condyles sectioned perpendicular to the cartilage surface and images to the right were lateral condyles sectioned perpendicular to the cartilage surface. The middle picture is representative images of perpendicular cross-sections of porcine cartilage plugs, that have been GAG depleted and one that has
not: (A) GAG depleted, lateral porcine cartilage plug. (B) Control, medial porcine cartilage plug. Scale bars are drawn on individual images so that the depth of GAG depletion could be quantified.
MEDIAL LATERAL
(A)
(B)
(A) (B)
(A) (B)
(A) (B)
(A) (B)
(A) (B)
(A) (B)
500 µm 500 µm
500 µm 500 µm
500 µm 500 µm
500 µm
500 µm
500 µm 500 µm
500 µm 500 µm
500 µm 500 µm

136
The data showed that the method used in model 1 of painting agarose gel containing
antibiotic solution and CaseABC, onto the porcine condylar cartilage surface, reduced the
average GAG content when compared to the control (without CaseABC) and native porcine
condylar cartilage, by circa 40 %.
Figure 63: GAG content of cartilage from GAG depleted porcine condylar cartilage in
model 1 compared to the control sample and untreated native porcine condylar cartilage. Model 1 consists of porcine condylar cartilage painted with CaseABC enzyme containing antibiotic/aprotinin in an agarose gel. The control porcine condylar cartilage was painted with buffer containing antibiotic/aprotinin in an agarose gel (without CaseABC). Data is
expressed as the mean (n=6) ± 95 % confidence limits and is the average of the medial and lateral condyles.
0
50
100
150
200
250
300
Model 1 Control Native cartilage
GA
G c
on
cen
trat
ion
pe
r ca
rtila
ge d
ry w
eig
ht
(ug.
ml-1
)

137
4.4.1.2 Model 2
Images of sections of porcine cartilage tissue subjected to injection of CaseABC containing
antibiotic/ aprotinin solution and porcine cartilage tissue subjected to injection of antibiotic/
aprotinin solution (control), stained with Safranin O are presented in Figure 64A & B,
respectively. Porcine cartilage tissue treated with both injection techniques showed that
there was removal of GAG in both groups. It was observed that the sections of the cartilage
that had been injected with the CaseABC enzyme tended to have a brighter Fast Green stain
(blue stain) than the sections of the cartilage injected with just the antibiotic/ aprotinin
solution. The GAG content was measured using the DMB assay.
The GAG concentration per cartilage dry weight of the porcine condylar cartilage injected
with CaseABC containing antibiotic/aprotinin solution, antibiotic/ aprotinin solution injected
only and untreated native porcine condylar cartilage, are shown in Figure 65. The native
porcine cartilage had the highest average GAG content at 225 ug.mg -1. The average GAG
content of the porcine condylar cartilage that had been injected with CaseABC (model 2 -
174 ug.mg-1), was lower than the GAG content seen in the porcine condylar cartilage that
had not been injected with CaseABC, (control - 201 ug.mg-1). The data showed that the
method used in model 2 of injecting an antibiotic solution containing CaseABC into porcine
condylar cartilage, reduced the average GAG content when compared to the control (without
CaseABC) and native porcine condylar cartilage, by circa 14 % and 23 %, respectively.
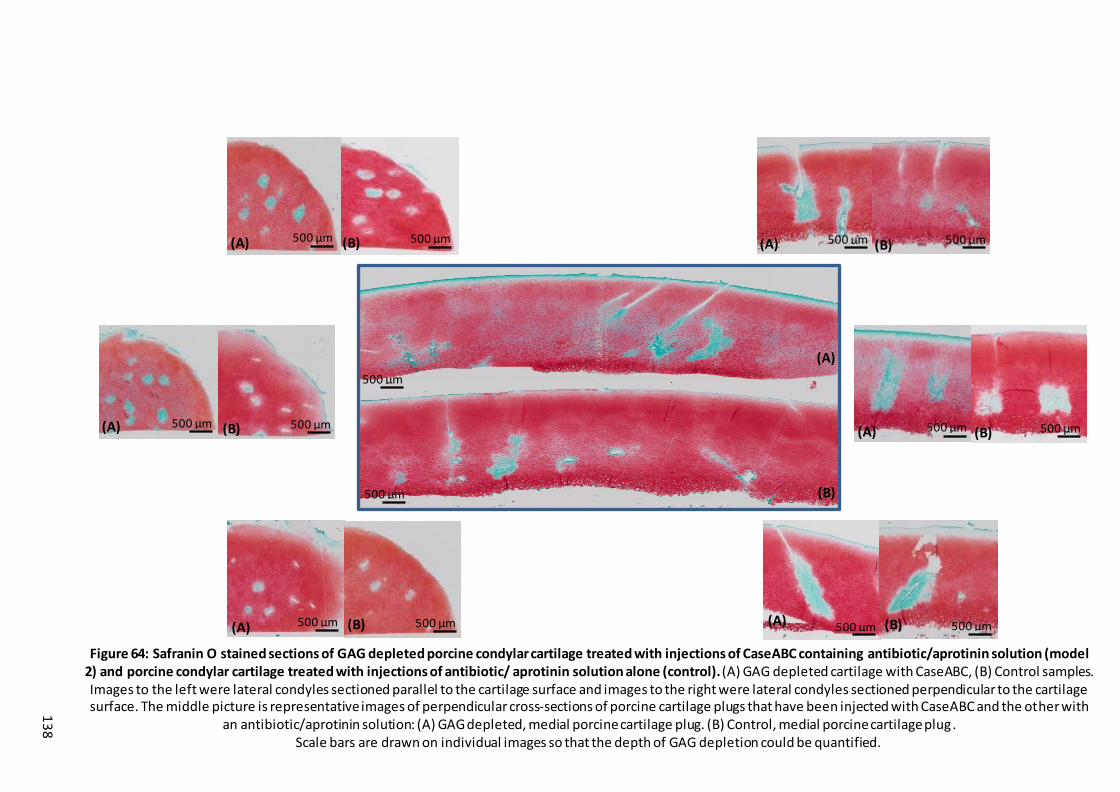
13
8
Figure 64: Safranin O stained sections of GAG depleted porcine condylar cartilage treated with injections of CaseABC containing antibiotic/aprotinin solution (model 2) and porcine condylar cartilage treated with injections of antibiotic/ aprotinin solution alone (control). (A) GAG depleted cartilage with CaseABC, (B) Control samples. Images to the left were lateral condyles sectioned parallel to the cartilage surface and images to the right were lateral condyles sectioned perpendicular to the cartilage surface. The middle picture is representative images of perpendicular cross-sections of porcine cartilage plugs that have been injected with CaseABC and the other with
an antibiotic/aprotinin solution: (A) GAG depleted, medial porcine cartilage plug. (B) Control, medial porcine cartilage plug. Scale bars are drawn on individual images so that the depth of GAG depletion could be quantified.
(A) (B) (A) (B)
(A) (B) (A) (B)
(A) (B)
(A)
(B)
(A) (B)
500 µm 500 µm
500 µm 500 µm
500 µm 500 µm 500 µm 500 µm
500 µm 500 µm
500 µm 500 µm
500 µm
500 µm

13
9
Figure 65: GAG content of cartilage from GAG depleted porcine condylar cartilage in models 2 compared to the control sample and untreated native porcine condylar cartilage. Model 2 consists of porcine condylar cartilage injected with CaseABC enzyme containing antibiotic/aprotinin solution. The control porcine
condylar cartilage was injected with buffer containing antibiotic/aprotinin solution (without CaseABC). Data is expressed as the mean (n=6) ± 95 % confidence limits and is the average of the medial and lateral condyles.
0
50
100
150
200
250
300
Model 2 Control Native Cartilage
GA
G c
on
cen
trat
ion
pe
r ca
rtil
age
dry
we
igh
t (u
g.m
l-1)
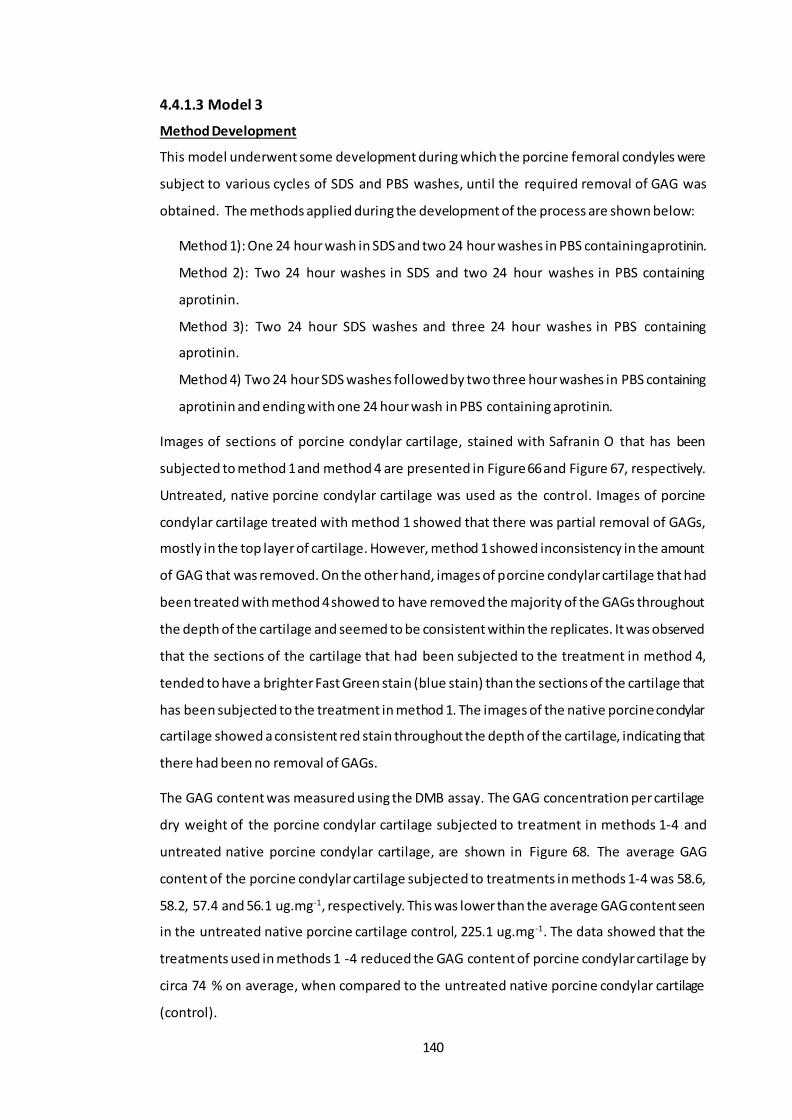
140
4.4.1.3 Model 3
Method Development
This model underwent some development during which the porcine femoral condyles were
subject to various cycles of SDS and PBS washes, until the required removal of GAG was
obtained. The methods applied during the development of the process are shown below:
Method 1): One 24 hour wash in SDS and two 24 hour washes in PBS containing aprotinin.
Method 2): Two 24 hour washes in SDS and two 24 hour washes in PBS containing
aprotinin.
Method 3): Two 24 hour SDS washes and three 24 hour washes in PBS containing
aprotinin.
Method 4) Two 24 hour SDS washes followed by two three hour washes in PBS containing
aprotinin and ending with one 24 hour wash in PBS containing aprotinin.
Images of sections of porcine condylar cartilage, stained with Safranin O that has been
subjected to method 1 and method 4 are presented in Figure 66 and Figure 67, respectively.
Untreated, native porcine condylar cartilage was used as the control. Images of porcine
condylar cartilage treated with method 1 showed that there was partial removal of GAGs,
mostly in the top layer of cartilage. However, method 1 showed inconsistency in the amount
of GAG that was removed. On the other hand, images of porcine condylar cartilage that had
been treated with method 4 showed to have removed the majority of the GAGs throughout
the depth of the cartilage and seemed to be consistent within the replicates. It was observed
that the sections of the cartilage that had been subjected to the treatment in method 4,
tended to have a brighter Fast Green stain (blue stain) than the sections of the cartilage that
has been subjected to the treatment in method 1. The images of the native porcine condylar
cartilage showed a consistent red stain throughout the depth of the cartilage, indicating that
there had been no removal of GAGs.
The GAG content was measured using the DMB assay. The GAG concentration per cartilage
dry weight of the porcine condylar cartilage subjected to treatment in methods 1-4 and
untreated native porcine condylar cartilage, are shown in Figure 68. The average GAG
content of the porcine condylar cartilage subjected to treatments in methods 1-4 was 58.6,
58.2, 57.4 and 56.1 ug.mg-1, respectively. This was lower than the average GAG content seen
in the untreated native porcine cartilage control, 225.1 ug.mg-1. The data showed that the
treatments used in methods 1 -4 reduced the GAG content of porcine condylar cartilage by
circa 74 % on average, when compared to the untreated native porcine condylar cartilage
(control).

14
1
Figure 66: Safranin O stained sections of GAG depleted porcine condylar cartilage and untreated native porcine condylar cartilage control from model 3. (A) GAG
depleted porcine condylar cartilage; model 3 – treatment method 1: treated with one 24 hour wash of 0.1 % SDS and two 24 hour washes of PBS + aprotinin, (B) Untreated native porcine condylar cartilage (control). Images to the left were medial condyles sectioned perpendicular to the cartilage surface and images to the
right were lateral condyles sectioned perpendicular to the cartilage surface. The middle picture is representative images of perpendicular cross-sections of porcine cartilage plugs, that have been GAG depleted and one that has not: (A) GAG depleted, lateral porcine cartilage plug. (B) Control, lateral porcine cartilage plug. Scale
bars are drawn on individual images so that the depth of GAG depletion could be quantified.
500 µm
(A) (B)
500 µm
(A) (B)
500 µm (A) (B)
500 µm
(A) (B)
500 µm
(A) (B)
500 µm
(A) (B)
MEDIAL LATERAL
(A)
(B)
500 µm 500 µm
500 µm 500 µm
500 µm 500 µm 500 µm 500 µm
500 µm 500 µm
500 µm 500 µm
500 µm
500 µm

14
2
(A) (B)
(A) (B)
(A) (B)
(A) (B)
(A) (B)
(A) (B)
MEDIAL LATERAL
(A)
(B)
Figure 67: Safranin O stained sections of GAG depleted porcine condylar cartilage and untreated native porcine condylar cartilage control from model 3. (A) GAG depleted porcine condylar cartilage; model 3 – treatment method 4: treated with two 24 hour washes of 0.1 % SDS, followed by two three hour washes in PBS +
aprotinin and ending with one 24 hour wash in PBS + aprotinin, (B) Untreated native porcine condylar cartilage (control). Images to the left were medial condyles sectioned perpendicular to the cartilage surface and images to the right were lateral condyles sectioned perpendicular to the cartilage surface. The middle picture is
representative images of perpendicular cross-sections of porcine cartilage plugs, that have been GAG depleted and one that has not: (A) GAG depleted, lateral porcine cartilage plug. (B) Control, lateral porcine cartilage plug. Scale bars are drawn on individual images so that the depth of GAG depletion could be quantified.
500 µm 500 µm
500 µm 500 µm
500 µm 500 µm
500 µm
500 µm
500 µm 500 µm
500 µm 500 µm
500 µm 500 µm

143
Figure 68: GAG content of cartilage from GAG depleted porcine cartilage in model 3. Samples tested consisted of porcine condylar cartilage washed using method 1, 2, 3 and 4, and untreated native porcine condylar cartilage as a control. Data is expressed as the mean
(n=6) ± 95 % confidence limits and is the average of the medial and lateral condyles.
It was hypothesised that residual SDS might affect the self -assembly of the peptides and
peptide-GAG mixtures; and so its removal would be beneficial to the development of model
3. Therefore, a study was carried out to investigate SDS concentrations in the solution after
each wash, in the four methods developed as described in section 4.3.6 and the results are
presented in Figure 69.
Figure 69: SDS concentration (ug.ml-1) after given SDS and PBS washes in model 3, method 4. Readings were taken from the solutions at the end of: 1) the last SDS wash, 2)
two three-hour PBS washes, 3) one 24 hour PBS wash and 4) 130 mM soak. Data is expressed as the mean (n=3) ± 95 % confidence limits.
The data showed that the SDS concentration lowered each time a new solution was
introduced into the wash cycles. After the last two 24-hour SDS washes, also applicable to
0
50
100
150
200
250
300
Method 1 Method 2 Method 3 Method 4 NativeCartilage
GA
G c
on
cen
trat
ion
per
ca
rtila
ge d
ry w
eigh
t (u
g.m
l-1)
0
100
200
300
400
500
600
700
800
900
1000
SDS (0.1 %) After lastSDS wash
After x2 PBSwash
After lastPBS wash
After130mM soak
SD
S co
nce
ntr
atio
n r
em
ain
ing
wit
hin
th
e s
olu
tio
n (u
g.m
l-1)
MEDIAL LATERAL

144
methods 2-4, the SDS concentration remaining within the solution was reduced by circa 80
%. After the last two 24-hour PBS washes, also applicable to method 3, the SDS concentration
remaining within the solution had been further reduced by circa 99.3 %. After the final 130
mM Na+ salt solution soak the concentration of SDS remaining in the solution had been
reduced to 99.8 %. The repetitive wash cycles in SDS and PBS used in this study, were an
effective way of reducing the amount of residual SDS found within the cartilage tissue.
4.4.2 GAG quantification of native and GAG depleted porcine femoral
cartilage
The GAG concentration (g.mg-1 dry weight) of the untreated native cartilage samples was
compared to the GAG concentration in the GAG depleted cartilage (model 1, model 2 and
model 3 (method 4)) to determine which of the three models had significantly reduced GAG
concentrations. The data is shown in Figure 70. The data was analysed by one-way ANOVA
followed by post-hoc analysis (Tukey Kramer; p< 0.05) to determine differences between
group means. This showed that the GAG concentrations in GAG depleted cartilage produced
in models 1, 2 and 3 had significantly lower GAG concentration when compared to the
untreated native cartilage control. The GAG depleted cartilage produced using model 3 had
significantly reduced GAG concentration compared to the GAG depleted cartilage produced
using model 1 and model 2 but there was no significant difference between the GAG
concentrations in GAG depleted cartilage produced using models 1 and 2.

145
Figure 70: GAG content of cartilage from GAG depleted porcine cartilage in Models 1 - 3 vs. native porcine cartilage. Model 1 consisted of porcine condylar cartilage painted with
CaseABC containing antibiotic in an agarose gel. Model 2 consisted of porcine condylar cartilage injected with CaseABC containing antibiotic solution and model 3 consisted of porcine condylar cartilage treated with two 24 hour washes of SDS containing aprotinin, two 3 hour PBS washes containing aprotinin, one 24 hour PBS wash containing aprotinin
and a 24-hour soak in 130 mM Na+ salt solution. Data is expressed as the mean (n=6) ± 95 % confidence limits. Data was analysed by one-way analysis of variance followed by a Tukey
Kramer post-hoc analysis to determine differences between group means. *indicates p<0.05.
0
50
100
150
200
250
300
Model 1 Model 2 Model 3 Native Cartilage
GA
G c
on
cen
trat
ion
pe
r ca
rtila
ge d
ry w
eig
ht
(ug.
ml-1
)*
*
* *
*

146
4.5 Discussion
The aims of the studies described in this chapter were to investigate methods for depleting
the GAG content of porcine femoral condylar cartilage; in order to create a model for the
testing of SAP: GAG mixtures. The studies investigated the biological and biochemical
properties of three GAG depleted cartilage models compared to native porcine cartilage. It
was clear that after treatment model 3 - method 4 produced a severe GAG depleted cartilage
model, model 2 produced a moderate GAG depleted cartilage model and model 1 produced
a mild GAG depleted cartilage model.
To assess the amount of GAG removed, the GAG content of each cartilage model was
assessed qualitatively with Safranin O staining of tissue sections and quantitatively using a
colorimetric assay with DMB dye. Qualitatively, all models showed characteristic zonal
distribution of proteoglycans. However, in model 1, the technique of painting the CaseABC
enzyme onto the cartilage surface, to deplete the GAGs, only removed the GAGs in the top
superficial tangential zone (~163 µm). It is thought that the CaseABC enzyme acted through
diffusion removing only the GAGs in the surface layer. A study by Leddy and Guilak (2003)
showed that zonal differences in diffusion coefficients of articular cartilage are due to the
molecular interaction with the ECM molecules, which act as barriers to diffusion. Although,
the study by Leddy and Guilak (2003), stated that proteoglycans do slow the diffusion of
larger molecules (> 40 kDa), the cartilage’s relatively low diffusion coefficient in the surface
zone suggested that other matrix macro molecules such as collagen, may also hinder a
molecules motion into deeper zones of cartilage (Leddy and Guilak, 2003). Our findings
corroborate with the latter study as CaseABC has a known molecular weight of 120 kDa,
which explains why only the top layer (surface zone) of cartilage was affected by the enzyme.
This theory could also be applied to the effects seen in model 2 whereby the injected enzyme
appeared to have only diffused locally around the areas into which it had been injected. It is
likely that diffusion of the CaseABC, was hindered by the molecular interactions with the
surrounding proteoglycan and collagen network.
Initially the aim was to create models with varying levels of GAG depletion, so that the SAPs
and SAP: GAG mixtures could be tested at "various stages of OA". After optimisation, model
1 achieved a partial/mild depletion of GAGs in the surface layer of cartilage; which was
somewhat inconsistent. Nevertheless, this approach provided a model that could be
comparable to cartilage at the very early stages of OA and hence could be a good model to
test the SAPs and SAP: GAG mixtures in future studies. Model 2, although it did not create
cartilage with a significantly lower GAG content than model 1, it was attributed a moderate

147
model of GAG depletion; since the GAGs were clearly depleted in areas of the mid-zone of
the cartilage, as indicated by the histological analysis. The levels of GAG depletion in model
3 (circa 90 % loss of GAGs) throughout the whole depth of the cartilage were severe.
Therefore, the methodology used for model 3 was considered the appropriate approach for
creating a reproducible cartilage depleted model, for the future testing of the SAP: GAG
mixtures. It was hypothesised that if the majority of the GAGs were removed, the
biomechanical properties of the cartilage would be significantly affected and therefore when
the SAPs or SAP: GAG mixtures were injected into this model, changes to the biomechanical
properties would be measurable.
Removal of residual SDS after treatment in model 3, was a very important factor in the
development of the model; as it was thought that any residual SDS could hinder the self-
assembly of the SAP: GAG mixtures in future testing. Hence, it was important to optimise the
washing process following SDS treatment in model 3. An SDS assay was performed on the
solutions used to wash the cartilage samples. The majority of the previous studies using
stains-all to measure SDS, reported measured absorbance of SDS at 510 nm (Campbell et al.,
1983; Arand et al., 1992; Rusconi et al., 2001). However, Wilshaw (2006) found that
measuring the absorbance at 447 nm gave better correlation between the absorbance and
the concentration of SDS, when producing the standard curve. After the last SDS wash, the
concentration of SDS in solution was reduced by ~ 80 % (193.8 ug.ml-1). This would have been
applicable to methods 2-4. In method 4, after the two 3 hour PBS washes and a 24-hour PBS
wash (which would have been comparable to the three PBS washes in method 3); the amount
(ug.ml-1) of SDS in the wash solution was reduced by ~99 %. A further 24 hour 130 mM Na+
salt solution soak, reduced the amount (ug.ml-1) of SDS in solution by 99.8 %, indicating that
by the end of all the washes there was only 0.2 % (2.1 ug.ml-1) of SDS remaining in the tissue.
The additional 130 mM Na+ salt solution soak in method 4 was to ensure that any essential
ions, that may have been lost over the continuous washes in SDS and PBS, were replenished.
Therefore, the GAG depleted cartilage would have a more physiologically relevant
environment, as changes in the ionic composition of the cartilage could lead to changes in
the self-assembly of the SAP and SAP: GAG mixtures in future studies.
The use of pig legs sourced from the local abattoirs meant that all tissue used in this whole
study came from food chain sources. The all parts of the porcine legs were used, from
ligaments to tiny blood vessels, as well as whole joints such as the knee and ankle. This
approach to our research tried to encompass the 3R’s approach. Each experiment was
carefully thought out and all the tissue was used so that none of it went to waste. An example

148
of this was the cartilage plugs taken for histology, whereby from each plug two histological
evaluations could be carried out reducing the amount of tissue required, which compares
the three aspects of the 3R principles (replacement, reduction and refinement).
4.6 Conclusion
Model 1 (painting of the cartilage surface with CaseABC), showed a mean reduction in GAGs
of 39 %, when compared to native porcine cartilage; however, the GAGs were only removed
from the cartilage surface. Nevertheless, a significant reduction in the GAG concentration
was observed between the test and control cartilage. Model 2 (injection of CaseABC into the
cartilage), showed a mean reduction in GAGs of 23 % compared to native porcine cartilage;
however, GAGs were only depleted from the areas in which the CaseABC had been injected.
Again, there was a significant reduction in GAG concentration between the test and control
group. Model 3 (washing in SDS and PBS), showed a 75% reduction in GAG concentration
compared to native porcine cartilage, without any histological evidence of damage to the
cartilage.
Based on the findings in this study, model 3 was identified as the most suitable model to take
forwards for testing whether the SAPs and SAP: GAG mixtures could restore the
biomechanical properties of GAG depleted porcine condylar cartilage. The next stage of the
study, was to develop an appropriate methodology for measuring the biomechanical
properties of the native and GAG depleted porcine condylar cartilage.

149
Chapter 5 Development of methods for the determination of the
biomechanical properties of native and GAG depleted cartilage.
5.1 Introduction
In Chapter 4, different methods were investigated for producing GAG depleted models of
porcine femoral cartilage. It was found that treatment with SDS was the most appropriate
method for producing porcine femoral cartilage which was severely (circa 75%) de pleted of
GAGs. The next stage in the investigations was to determine the effects of GAG removal using
SDS on the biomechanical properties of the cartilage.
In order to do this, it was necessary to develop a suitable method for the indentation testing
of the cartilage which would enable differences in the mechanical properties between the
native and GAG depleted cartilage to be determined. Indentation tests have been used as an
analysis tool to determine the displacement of a material such as cartilage to investigate its
biomechanical properties, specifically creep behaviour under a given load. Indentation tests
are straight forward to perform experimentally with minimal sample preparation. This has
made indentation testing a popular technique for the determination of the biomechanical
properties of cartilage (Kempson et al., 1971; Mak et al., 1987; Mow et al., 1989; Swann and
Seedhom, 1989; Forster and Fisher, 1996; Pickard et al., 1998; Jin et al., 2000; Rieppo et al.,
2003; Boschetti et al., 2004; Lu et al., 2004) (Stolz et al., 2004; Kleemann et al., 2005; Katta
et al., 2008; Hall et al., 2009; Abdelgaied et al., 2015). A constant compressive load applied
to the cartilage surface via an indenter, results in an initial elastic deformation followed by a
creep deformation, due to the exudation of the interstitial fluid. Initially this exudation occurs
rapidly, which leads to high rates of deformation, but this decreases gradually as the flow of
interstitial fluid ceases. Once equilibrium is reached there is no more fluid flow, and the
applied load is borne mostly by the solid collagen-proteoglycan matrix, with some being
taken by the interstitial fluid (Mow et al., 1980). As the rate of creep is governed by fluid
exudation, permeability of the cartilage tissue can be determined. The modulus of the solid
matrix of cartilage at equilibrium, can also be measured when there is no longer any fluid
flow, which occurs at the final equilibrium deformation. This type of displacement analysis
was therefore chosen for this study because GAGs are known to increase the stiffness of
cartilage and hence resistance to deformation when under load. It was hypothesised that
removal of the GAGs from porcine condylar cartilage would reduce the compressive stiffness
of the cartilage tissue, resulting in increased displacement, which could be evaluated using
indentation testing.

150
Linear biphasic poroelastic finite element models have been developed to simulate creep
indentation tests. These models have been used to determine the biphasic properties of
cartilage by sequentially tuning these properties until the model outputs match those of the
experimental outputs, for example the model used by Addelgaied et al. (Abdelgaied et al.,
2015). This finite element model was derived from supplementary mathematical models
(Mak et al., 1987; Mow et al., 1989), which were developed so that the permeability and
equilibrium elastic modulus of cartilage tissues could be calculated. Therefore, this finite
element model was implemented in this study to determine the equilibrium elastic modulus
and permeability of native and GAG depleted porcine condylar cartilages.
Previous studies have used a range of contact stresses ranging from as low as 0.01 MPa to as
high as 0.28 MPa (Katta et al., 2007; Abdelgaied et al., 2015) as nominal values to study the
effect of load on the biomechanical properties of cartilage. In this study, it was decided to
adopt a systematic approach of testing different loads to determine the load that, when
applied during indentation testing, would result in a significant difference between the
deformation of the native and GAG depleted cartilages and also reveal differences between
the equilibrium elastic modulus and permeability. This was important because it was the
intention to treat the GAG depleted cartilage with SAP: GAGs and investigate the capacity of
the SAP: GAGs to restore the biomechanical properties to values that were similar to native
cartilage. The limitations of the experimental indentation test equipment used in this study,
meant that the highest load that could be applied to the rig was 0.51 N. This load generated
a contact stress of 0.1 MPa, using a 2.5 mm diameter stainless steel pin; which was only half
of that used in previous studies. This was primarily due to the space available to insert the
weights and the weights which were available, which would fit onto the top of the indenter.
With the weights available, contact stresses of 0.02, 0.06, 0.1 MPa were achieved in this
study; corresponding to the three loads (0.11, 0.31, & 0.51 N). Therefore, based on the
previous studies carried out in the Institute of Medical and Biological Engineering at the
University of Leeds and the limitations to the experimental set-up and equipment; a contact
stress of 0.1 MPa was chosen initially as a starting point, to investigate the effect of load
variation on native and GAG depleted porcine condylar cartilage. Although, the contact stress
levels were at the lower end of the in vivo joint loading spectrum (Brown and Shaw, 1983;
Mow and Ateshian, 1997; Mow and Hayes, 1997; Rolfe et al., 2006), the low stress levels
ensured that the tissue deformation remained small with equilibrium strain magnitudes <15
%. Deformation should be kept to minimum as the model uses a linear biphasic model, which
assumes permeability is constant with deformation, but this assumption is only valid for

151
small deformation. Furthermore, the computational simulation cannot converge for high
levels of deformation as some elements will end up with zero volume due to the high
deformation, therefore giving us an error message in the simulation model.
5.2 Aims and objectives
The aim of this chapter was to investigate the effect of load variation during indentation
testing of native porcine condylar cartilage and porcine condylar cartilage in which the GAGs
had been depleted using SDS; in order to identify a suitable load for detection of a significant
difference in the deformation, equilibrium elastic modulus and permeability between the
native and GAG depleted porcine condylar cartilages.
5.2.1 Objectives
1) To systematically test three different loads: low (0.11 N), medium (0.31 N) and high (0.51
N) during creep indentation testing of native and GAG depleted porcine condylar cartilage
to evaluate the deformation of the cartilages under the specified loads ove r 60 min.
2) To determine the thickness of the native and GAG depleted porcine condylar cartilage
using a needle indentation method.
3) To use finite element analysis to derive the equilibrium elastic modulus and permeability
of the native and GAG depleted porcine condylar cartilages from the deformation under
load and cartilage thickness measurement data under three different loads.
5.3 Experimental methods
5.3.1 Acquisition of porcine femoral condyles
Porcine femoral condyles were dissected and stored as described in Chapter 2; Section
2.2.2.2 to 2.2.2.4.
5.3.2 GAG depletion of porcine femoral condylar cartilage
GAG depleted porcine condylar cartilages were produced using treatment with SDS (method
4) following the procedure outlined in Chapter 4; Section 4.3.3.
5.3.3 Biomechanical characterisation of porcine femoral cartilage
5.3.3.1 Indentation testing - sample and equipment preparation
Native and GAG depleted samples of porcine femoral condyles were first fixed in PMMA as
outlined in Chapter 2; Section 2.2.6.1. The deformation over time of the native and GAG
depleted cartilages were determined using indentation test methods as described in Chapter

152
2; Section 2.2.6.2. Three porcine condyles (medial and lateral) were used for each test group.
Indentation testing was carried out under three different loads as described below.
5.3.3.1.1 Low load - 0.11 N
The samples were mounted onto the indentation rig as outlined in Chapter 2; Section 2.2.6.1.
The weight of the shaft (11.69 g) was the only load (0.11 N) acting on the specimens. The
samples were allowed to equilibrate in PBS for 10 min and the indentation tip (2.5 mm flat
indenter) was located on the flattest surface of the femoral condyle. The lock holding the
indenter tip was released and the cartilage was indented with a load of 0.11 N over 1 h as
described in Chapter 2; Section 2.2.6.2.
5.3.3.1.2 Medium load - 0.31 N
An extra weight of 20.2 g (two small discs of 10.1 g) was added to the top of the indenter
shaft giving a total weight of 31.89 g. The total load applied to the porcine femoral condyle
specimens equated to 0.31 N. Tests were carried out as described in Chapter 2; Section
2.2.6.2.
5.3.3.1.3 High load - 0.51 N
An extra weight of 40.4 g (two small discs of 10.1 g and one 20.2 g disc) was added to the top
of the indenter shaft, giving a total weight of 52.09 g. The total load applied to the porcine
femoral condyle specimens equated to 0.51 N. Tests were carried out as described in Chapter
2; Section 2.2.6.2.
5.3.3.2 Cartilage thickness measurements
Cartilage thickness of the native and GAG depleted cartilage samples was measured using an
Instron material testing machine and measurements were always taken after indentation, as
outlined in Chapter 2; Section 2.2.6.4. Samples were allowed to recover in a sealed
Tupperware box moistened with PBS tissue, which was kept at 40C overnight.
5.3.3.3 Finite element method for derivation of biomaterial properties of porcine
condylar cartilage.
The deformation data obtained from the indentation testing of the GAG depleted and native
porcine condylar cartilage over time with varying loads, together with the cartilage thickness
data, were used to derive the equilibrium elastic modulus and permeability of the cartilages,
as described in Chapter 2; Section 2.2.6.5.
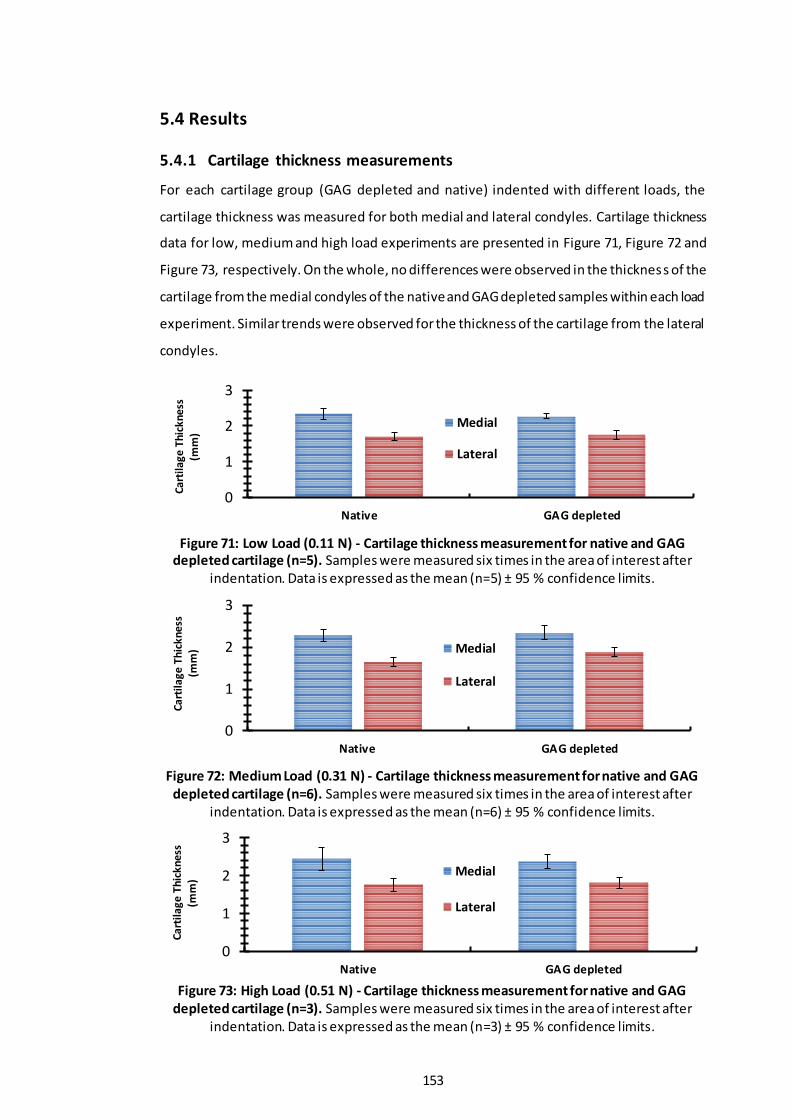
153
5.4 Results
5.4.1 Cartilage thickness measurements
For each cartilage group (GAG depleted and native) indented with different loads, the
cartilage thickness was measured for both medial and lateral condyles. Cartilage thickness
data for low, medium and high load experiments are presented in Figure 71, Figure 72 and
Figure 73, respectively. On the whole, no differences were observed in the thickness of the
cartilage from the medial condyles of the native and GAG depleted samples within each load
experiment. Similar trends were observed for the thickness of the cartilage from the lateral
condyles.
Figure 71: Low Load (0.11 N) - Cartilage thickness measurement for native and GAG depleted cartilage (n=5). Samples were measured six times in the area of interest after
indentation. Data is expressed as the mean (n=5) ± 95 % confidence limits.
Figure 72: Medium Load (0.31 N) - Cartilage thickness measurement for native and GAG depleted cartilage (n=6). Samples were measured six times in the area of interest after
indentation. Data is expressed as the mean (n=6) ± 95 % confidence limits.
Figure 73: High Load (0.51 N) - Cartilage thickness measurement for native and GAG
depleted cartilage (n=3). Samples were measured six times in the area of interest after indentation. Data is expressed as the mean (n=3) ± 95 % confidence limits.
0
1
2
3
Native GAG depleted
Cart
ilage
Thi
ckne
ss
(mm
)
Medial
Lateral
0
1
2
3
Native GAG depleted
Ca
rtila
ge
Th
ick
ne
ss
(mm
) Medial
Lateral
0
1
2
3
Native GAG depleted
Ca
rtil
ag
e T
hic
kn
ess
(m
m)
Medial
Lateral

154
5.4.2 Percentage deformation
5.4.2.1 Low load – 0.11 N
Deformation properties of the GAG depleted and native cartilages (medial and lateral
porcine condyles) under a load of 0.11 N are shown in Figure 74 and Figure 75. Deformation
under load over a period of 1 hour is shown in Figure 74 and the final percentage deformation
at 1 hour is shown in Figure 75, for both medial and lateral condyles.
Figure 74: Percentage deformation of native and GAG depleted cartilage over the duration of 1 hour with a load of 0.11 N: (A) Medial condyle (B) Lateral condyle. Data was
subject to arcsine transformation prior to calculation of the mean and 95 % confidence limits. Data is expressed as the back transformed mean (n=5) ± 95 % confidence limits.
Figure 75: Final percentage deformation of native and GAG depleted cartilage at 1 hour
with a load of 0.11 N. Data was subject to arcsine transformation prior to calculation of the mean and 95 % confidence limits. Data is expressed as the back transformed mean (n=5) ±
95 % confidence limits.
The deformation curves over the duration of 1 hour showed that the GAG depleted medial
and lateral condylar cartilage deformed more than the native condylar cartilage. The rate of
initial deformation (0-600 seconds) for the native medial and lateral condylar cartilage was
slow and steady and reached equilibrium after approximately 1200 seconds. However, the
rate of initial deformation (0-600 seconds) for the GAG depleted medial and lateral condylar
0
5
10
15
20
25
30
35
0 1200 2400 3600
% D
efo
rmat
ion
Time (sec)
GAG depleted Native
(A)
0
5
10
15
20
25
30
35
0 1200 2400 3600
% D
efo
rmat
ion
Time (sec)
GAG depleted Native
(B)
05
101520253035
Native GAG depleted
% D
efo
rmat
ion
M EDIA L
05
101520253035
Native GAG depleted
% D
efo
rmat
ion
LATER A L

155
cartilage was slightly quicker and reached equilibrium after approximately 1800 seconds. The
equilibrium deformation at 1 hour for the native and GAG depleted medial condylar cartilage
was 2.9 % and 5.7 %, respectively and for the native and GAG depleted lateral condylar
cartilage it was 3.7 % and 6.5 %, respectively. None of the cartilages tested exceeded 15 %
deformation.
In order to compare the percentage deformation of the native and GAG depleted cartilage
at one hour, the data for the medial and lateral condyles tested at a load of 0.11 N was arc
sin transformed. The trend seen in the data indicated that the percentage deformation of
the GAG depleted cartilage was greater than the percentage deformation of the native
cartilage for both the medial and lateral condyles.
5.4.2.2 Medium load – 0.31 N
Deformation properties of the native and GAG depleted cartilages under a load of 0.31 N;
from both medial and lateral porcine condyles are shown in Figure 76 and Figure 77.
Deformation under load over a period of 1 hour is shown in Figure 76 and final percentage
deformation is shown in Figure 77, for both medial and lateral condyles.
Figure 76: Percentage deformation of native and GAG depleted cartilage over the duration of 1 hour with a load of 0.31 N: (A) Medial condyle (B) Lateral condyle. Data was
subject to arcsine transformation prior to calculation of the mean and 95 % confidence limits. Data is expressed as the back transformed mean (n=6) ± 95 % confidence limits.
0
5
10
15
20
25
30
35
0 1200 2400 3600
% D
efo
rmat
ion
Time (sec)
GAG depleted Native
(A)
0
5
10
15
20
25
30
35
0 1200 2400 3600
% D
efo
rmat
ion
Time (sec)
GAG depleted Native
(B)
156
Figure 77: Final percentage deformation of native and GAG depleted cartilage at 1 hour with a load of 0.31 N. Data was subject to arcsine transformation prior to calculation of the mean and 95 % confidence limits. Data is expressed as the back transformed mean (n=6) ±
95 % confidence limits.
When tested using a load of 0.31 N, the deformation curves over the duration of 1 hour
showed that the GAG depleted condylar cartilage deformed more than the native condylar
cartilage in both medial and lateral condyles. The rate of initial deformation (0-600 seconds)
for the native medial condylar cartilage was steady and reached equilibrium after
approximately 1800 seconds. However, the rate of initial deformation (0-600 seconds) for
the native lateral condylar cartilage was slightly quicker and reached equilibrium after
approximately 2400 seconds. The rate of initial deformation (0-600 seconds) for the GAG
depleted medial and lateral condylar cartilage was quicker than in the native condylar
cartilage. The equilibrium deformation at 1 hour for the native and GAG depleted medial
condylar cartilage was 6 % and 14.2 %, respectively and for the native and GAG depleted
lateral condylar cartilage it was 9.8 % and 15.3 %, respectively.
In order to compare the percentage deformation of the native and GAG depleted cartilage
at one hour, the data for the medial and lateral condyles tested at a load of 0.31 N was arc
sin transformed. The trend seen in the data indicated that the percentage deformation of
the GAG depleted cartilage was greater than the percentage deformation of the native
cartilage for both the medial and lateral condyles.
5.4.2.3 High load – 0.51 N
Deformation properties of the native and GAG depleted cartilages under a load of 0.51 N;
from both medial and lateral porcine condyles are shown in Figure 78 and Figure 79.
Deformation under load over a period of 1 hour is shown in Figure 78 and final percentage
deformation is shown in Figure 79, for both medial and lateral condyles.
0
5
10
15
20
25
30
35
Native GAG depleted
% D
efo
rmat
ion
M EDIA L
0
5
10
15
20
25
30
35
Native GAG depleted
% D
efo
rmat
ion
LATER A L

157
The deformation curves over the duration of 1 hour showed that the GAG depleted lateral
condylar cartilage deformed more than the native lateral condylar cartilage, but this was not
the case for the medial condyles. The rate of initial deformation (0-600 seconds) for the
native and GAG depleted medial condylar cartilages was very similar and reached equilibrium
after approximately 2400 seconds. However, the rate of initial deformation (0-600 seconds)
for the native lateral condylar cartilage was slightly quicker than its medial counterpart.
However, the rate of initial deformation (0-600 seconds) for the GAG depleted lateral
condylar cartilage was the quickest. The equilibrium deformation at 1 hour for the native and
GAG depleted medial condylar cartilage was 13.4 % and 13.5 %, respectively and for the
native and GAG depleted lateral condylar cartilage it was 16.8 % and 21.1 %, respectively.
Figure 78: Percentage deformation of native and GAG depleted cartilage over the duration of 1 hour with a load of 0.51 N: (A) Medial condyle (B) Lateral condyle. Data was
subject to arcsine transformation prior to calculation of the mean and 95 % confidence limits. Data is expressed as the back transformed mean (n=3) ± 95 % confidence limits.
Figure 79: Final percentage deformation of native and GAG depleted cartilage at 1 hour
with a load of 0.51 N. Data was subject to arcsine transformation prior to calculation of the mean and 95 % confidence limits. Data is expressed as the back transformed mean (n=3) ±
95 % confidence limits.
0
5
10
15
20
25
30
35
0 1200 2400 3600
% D
efo
rmat
ion
Time (sec)
GAG depleted Native
0
5
10
15
20
25
30
35
0 1200 2400 3600
% D
efo
rmat
ion
Time (sec)
GAG depleted Native
(A) (B)
0
5
10
15
20
25
30
35
Native GAG depleted
% D
efo
rmat
ion
M EDIA L
0
5
10
15
20
25
30
35
Native GAG depleted
% D
efo
rmat
ion
LATER A L
158
As above, for the 0.11 N and 0.31 N loads the final percentage deformation data at 1 hour
for the native and GAG depleted cartilage at a load of 0.51 N, was arc sin transformed. The
trend seen was that there was no difference between the percentage deformation mean
values between the native samples when compared to that of the GAG depleted samples in
both medial and lateral condyles.
Overall, GAG depletion using SDS rendered the cartilage tissue soft, indicating a loss of
compressive stiffness. This was evident, because unlike the native cartilage samples, after
indentation prominent indentation marks were observed on the cartilage surface of the GAG
depleted cartilage samples where the stainless steel indentation pin had been in contact with
the femoral condylar cartilage tissue. These indentation marks became more prominent at
higher loads.
5.4.3 Equilibrium elastic modulus and permeability
The FEA model was used to calculate the equilibrium elastic modulus and permeability using
the data from only the medial condyles since the deformation curves at higher loads showed
that the lateral condyles gave high creep deformation (creep deformation > 15% of the
porcine condylar cartilage thickness). Hence the lateral condyle deformation data was
excluded from being input into the FEA model, as high levels of deformation (from the lateral
condyles) would lead to inaccurate predictions of the equilibrium elastic modulus and
permeability.
Representative images of the deformation curve fitting for the native and GAG depleted
medial condylar cartilage with a load of 0.31 N are shown in Figure 80. These curve fittings
were used in the FEA model to calculate the equilibrium elastic modulus and permeability of
the samples. Under the load of 0.31 N, perusal of the data showed that the GAG depleted
samples showed greater deformation than the native cartilage samples and this was also the
case across all loads applied to these two groups. However, the greatest difference in the
deformation was observed between the native and GAG depleted cartilages under a load of
0.31 N (medium load).

159
Figure 80: Representative graphs of indentation characteristics obtained experimentally and through FEA model curve fitting of a medial porcine condyle under a load of 0.31 N. (A): Curve fitting the deformation profile of a porcine medial condyle – Native (B): Curve
fitting the deformation profile of a porcine medial condyle – GAG depleted.
The equilibrium elastic modulus and permeability for the native and GAG depleted medial
condyles under loads of 0.11 N, 0.31 N and 0.51 N are shown in Figure 81, Figure 82 and
Figure 83, respectively. The R2 values presented in Figure 81, Figure 82 and Figure 83,
represent how close the FE model curve fitting was to the last 70% of the experimental
deformation curve. Only samples with an R2 value greater than 75% were accepted as
relevant and accurate enough for this study.
Figure 81: Equilibrium elastic modulus and permeability of native and GAG depleted medial condylar cartilage under a load of 0.11 N. Data is expressed as the mean (n=5) ± 95
% confidence limits. The R2 values define how close the FE model curve fitting was to the last 70% of the experimental deformation curve, the closer the R2 value is to 1, the better
the fit.
0
2E-15
4E-15
6E-15
8E-15
1E-14
1.2E-14
1.4E-14
0
0.2
0.4
0.6
0.8
1
1.2
1.4
1.6
Elastic Modulus Permeability
Pe
rme
abil
ity
(m
4/N
.s)
Elas
tic
Mo
du
lus
(MP
a)
Native GAG Depleted
R2 = 0.83
R2 = 0.93
R2 = 0.83R2 = 0.93
0
0.05
0.1
0.15
0.2
0.25
0.3
0.35
0 1200 2400 3600
Def
orm
atio
n (m
m)
Time (Secs)
Experimental FEA
0
0.05
0.1
0.15
0.2
0.25
0.3
0.35
0 1200 2400 3600
Def
orm
atio
n (m
m)
Time (Secs)
Experimental FEA
(A) (B)
*
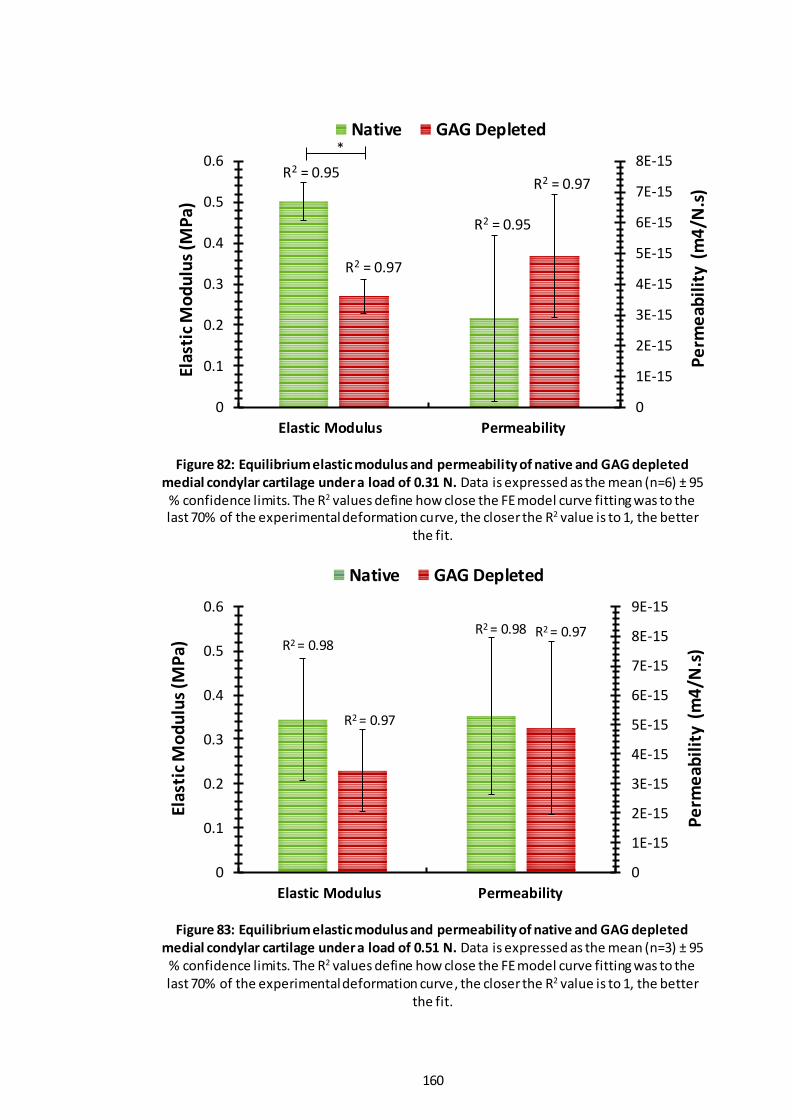
160
Figure 82: Equilibrium elastic modulus and permeability of native and GAG depleted medial condylar cartilage under a load of 0.31 N. Data is expressed as the mean (n=6) ± 95
% confidence limits. The R2 values define how close the FE model curve fitting was to the last 70% of the experimental deformation curve, the closer the R2 value is to 1, the better
the fit.
Figure 83: Equilibrium elastic modulus and permeability of native and GAG depleted medial condylar cartilage under a load of 0.51 N. Data is expressed as the mean (n=3) ± 95
% confidence limits. The R2 values define how close the FE model curve fitting was to the last 70% of the experimental deformation curve, the closer the R2 value is to 1, the better
the fit.
0
1E-15
2E-15
3E-15
4E-15
5E-15
6E-15
7E-15
8E-15
0
0.1
0.2
0.3
0.4
0.5
0.6
Elastic Modulus Permeability
Pe
rme
abil
ity
(m
4/N
.s)
Elas
tic
Mo
du
lus
(MP
a)
Native GAG Depleted
R2 = 0.95 R2 = 0.97
R2 = 0.97
R2 = 0.95
0
1E-15
2E-15
3E-15
4E-15
5E-15
6E-15
7E-15
8E-15
9E-15
0
0.1
0.2
0.3
0.4
0.5
0.6
Elastic Modulus Permeability
Pe
rme
abil
ity
(m
4/N
.s)
Elas
tic
Mo
du
lus
(MP
a)
Native GAG Depleted
R2 = 0.98R2 = 0.97R2 = 0.98
R2 = 0.97
*

161
Overall, the native porcine medial condylar cartilage exhibited a higher equilibrium elastic
modulus compared to the GAG depleted porcine medial condylar cartilage when tested
under the three different loads. The data for the native and GAG depleted groups under each
load were compared using the Student`s t-test. This revealed that the equilibrium elastic
modulus of the native porcine medial cartilage was significantly greater than the GAG
depleted porcine medial condylar cartilage when tested under the low (0.11N; p = 4.65 x 10-
5) and medium (0.31N; p = 2.35 x 10⁻⁵) loads. However, this trend was not the case when
tested under the high (0.51N; p = 0.4) load, further studies (i.e higher n value) are needed to
verify the significance.
With regard to the average permeability values, there was a trend for these to be greater in
the GAG depleted cartilage samples compared to the native cartilage samples when tested
under the 0.11N and 0.31 N loads but not when tested under the 0.51 N load. Again, the data
for the permeability of the native and GAG depleted medial porcine condylar cartilage under
each load was compared using the Student`s t-test which revealed no significant differences
between the groups when tested under the three different loads. (0.11 N, p = 0.5; 0.31 N, p
= 0.2 and 0.51 N, p = 0.9).
5.5 Discussion
The aim of this study was to investigate the effect that load variation had on the deformation,
equilibrium elastic modulus and permeability of native and GAG depleted cartilages. The
ideal load for future testing was the load that gave rise to a significant difference in
percentage deformation, equilibrium elastic modulus and permeability between the native
and GAG depleted cartilages. Therefore, from investigation of three different loads during
indentation testing of porcine femoral condyle cartilage described here, it was clear, after
indentation and FEA analysis, that the medium load (0.31 N, 31.89 g) was the test load that
best showed a clear difference in the biomechanical properties between the native and GAG
depleted porcine cartilages.
It was observed that there was no significant difference in the thickness of the cartilage in
the native and GAG depleted medial condyles within each load experiment. Similarly,
comparison of the thickness of the cartilage in the native and GAG depleted lateral condyles
specimens was not significantly different within the experiments conducted at 0.11 N and
0.51 N; however, the thickness of the GAG depleted cartilage was significantly greater than
the native cartilage in the lateral condyles in the experiments conducted at 0.31 N. The
reason for this are unclear; however, it is possible that this was due to natural biological

162
variation in the cartilage of these particular samples. A radiographic and image analysis
method developed by Wayne et al. (1998) for the measurement of articular cartilage showed
that the thickness of the cartilage in porcine lateral condyles was between 1.1 mm – 1.9 mm.
Similarly, another study measured porcine cartilage thickness from digital histological images
and showed thicknesses of 1.2 – 2.4 mm and 1.2 – 1.6 mm for the medial and lateral condyles,
respectively. Measured porcine femoral cartilage thicknesses in the current study (medial:
2.2 - 2.4 mm; lateral: 1.5 – 1.8 mm), showed good agreement with the ranges reported by
Wayne et al. (1998) and Fermor (2013).
GAGs are attached to the protein core of proteoglycans, of which chondroitin sulfate is the
most abundant and important. The highly electro-negatively charged groups on these GAGs
(sulfate and carboxyl groups) control the osmotic swelling pressure that gives cartilage tissue
its compressive mechanical properties. They are able to do this by trapping/restricting water
and other small molecules in-between their chains. Therefore, water flow through the
cartilage ECM is restricted by these GAGs, because of their hydrophilic nature and they
therefore play an important role in the biomechanical properties and biphasic properties of
cartilage (Mow et al., 1980; Ateshian et al., 1994; Forster and Fisher, 1996; Mow and
Ateshian, 1997). When cartilage is initially loaded, the interstitial ‘water phase’ of cartilage
bears most of the load and over time it is transferred to the solid matri x of the tissue (i.e.
collagen); in order to reduce the load on the solid matrix. This interaction between GAGs,
interstitial water and the collagen network of articular cartilage is considered to be vital for
normal biomechanical function. Osteoarthritic cartilage is associated with a reduced number
of proteoglycans as it is subject to matrix degeneration, which leads to changes in the
biomechanical function of the tissue, rendering it to lose compressive stiffness.
Here, a GAG depleted model of cartilage, developed in Chapter 4, using SDS washes was used
to represent osteoarthritic cartilage.
The effect of load variation on native and GAG depleted porcine condylar cartilage samples
was carried out using a series of indentation tests, from which the deformation properties,
equilibrium elastic modulus and permeability were calculated. Deformation curves for all
loads studied showed that the GAG depleted porcine condylar cartilage exhibited higher
deformation across a 1 hour time period, when compared to the native porcine condylar
cartilage. This can be explained, as the low levels of GAGs in the GAG depleted cartilage were
not able to aid in resisting the compression of the cartilage. Significant differences between
the native and GAG depleted porcine condylar cartilage’s in terms of percentage deformation
(after it has been normalised for the thickness and arcsine transformed) were found when
163
the medial condyles were tested at low and medium loads, and in the lateral condyle when
tested at low load. Similar trends were observed when the percentage deformation had
reached equilibrium after 1 hour. The average deformation of the medial condyles at
equilibrium (after 1 hour) for the native and GAG depleted cartilages, in the low load
experiment was 2.9 % and 5.7 %, respectively and for the lateral condyles, 3.7 % and 6.5 %,
respectively. In the medium load experiment the medial condyles average equilibrium
deformation was 6 % and 14.2 %, respectively.
When observing the data of the high load experiment, percentage deformation appeared to
be higher in the GAG depleted cartilage in both the medial or lateral condyles, when
compared to the native cartilage. Proteoglycans are responsible for the restriction of fluid
flow through the ECM of cartilage; however, increased fluid flow as a result of
reduction/removal of proteoglycans leads to a reduced load supported by the fluid phase,
hence tissue should show greater deformation. Therefore, GAG depleted cartilage samples
were expected to have a much higher deformation than the native cartilage sample s, as
these samples had had 75% of their GAGs removed prior to indentation. However, in the
indentation tests conducted at high load (0.51 N), this was not the case, especially in the
medial condylar cartilage samples. It is thought that this could be because the load applied
to both the native and GAG depleted samples was too high, for a difference in the
deformation to be demonstrated between the two groups. This was further clarified when
the deformation data was back transformed and plotted as a percentage deformation of the
cartilage thickness.
The native and GAG depleted cartilage of the lateral condyles in the high load experiment
and the GAG depleted cartilage of the lateral condyles in the medium load experiment;
showed to have a percentage deformation greater than 15%, which meant that the derived
data for the equilibrium elastic modulus and permeability would not be accurate; as
deformation should be kept to a minimum (<15 %) to abide by the l inear biphasic model used
in this study, which assumes permeability is constant with deformation. However, this is only
valid for small deformations up to 15% (Mow et al., 1989; Proctor et al., 1989; Athanasiou et
al., 1991). The higher percentage deformation seen in the lateral condylar cartilage
compared to the medial condylar cartilage, was thought to be because the cartilage in the
lateral condyles was thinner than their medial counterpart. The thinner the cartilage, the
fewer macro and micro structures there are to resist the compressive loads as well as less
fluid to resist the compressive loads applied. This becomes exacerbated in the samples that
have had the GAGs removed, hence explaining why the GAG depleted cartilage in the lateral

164
condyles generally had a slightly higher deformation. Therefore, it was decided to only
analyse the deformation data from the indentation testing of native and GAG depleted
medial condylar cartilage in the FE model, for calculation of the equilibrium elastic modulus
and permeability.
An axisymmetric poroeleastic FE model used by Abdelgaied et al. (2015) was used to curve
fit the experimental deformation to determine the effect that load variation had on the
equilibrium elastic modulus and permeability of native and GAG depleted porcine cartilages.
As the load was increased, the equilibrium elastic modulus decreased for both native and
GAG depleted cartilages. The cartilages` ability to resist compression diminishes the greater
the load, hence its elastic modulus will decrease naturally. It is important to note that when
cartilage is subject to indentation tests, the rate of deformation is typically controlled by the
permeability of the sample, whereas the equilibrium deformation (deformation at the end,
usually the last 70% of the experiment, were the deformation stays constant) is the outcome
of the elastic modulus of the sample (Mak et al., 1987; Mow et al., 1989).
The equilibrium elastic modulus was greater in the native cartilage samples when compared
to the GAG depleted samples, regardless of the load being added. This can be explained
because the GAG depleted cartilage exhibited a reduced compressive stiffness due to the
loss of GAGs and hence a lower elastic modulus; and was less able to resist compression
when compared to the native cartilage. Comparable changes in the softness of cartilage,
equilibrium percentage deformation, and decrease in equilibrium elastic modulus (due to
removal of GAGs); have been reported in the literature with similar indentation tests of
articular cartilage by Bonassar et al. (1995), Reippo et al. (2003), Han et al. (2007) and Katta
et al. (2007).
It was hypothesised that the mean permeability of the GAG depleted cartilage would be
higher than native cartilage; as the removal of water binding GAGs would allow the
interstitial fluid to move more freely within the remaining collagen network, as the matrix
would be more porous. However, this was not the case across all load experiments. No
significantly differences were observed between the GAG depleted and native cartilage
samples.
However, at the high (0.51N) load, the permeability of the native cartilage was slightly higher
than the GAG depleted cartilage. It is also worth noting that at this higher load, the mean
elastic modulus, tended to be higher in the native cartilage more so than the GAG depleted
cartilage and this same trend was also observed in the deformation data of the native and

165
GAG depleted cartilage under the high load. However, one cannot comment on the
significance of these trends as the sample size was too small (n=3). Nevertheless, the reason
for the trend seen in the percentage deformation between the native and GAG depleted
cartilage in the high load, could be explained by the fact that the larger loads may have a
governing effect on the ability of the tissue to control the deformation, regardless of the
amount of GAGs present in both native and GAG depleted cartilages. It was for this reason
that the higher load (0.51 N) was not chosen for future studies.
A limitation of the experimental indentation testing methodology, was the low contact
stresses that were inherent in the setup of the equipment used in this study. A way around
this could have been to use a smaller stainless-steel pin to increase the contact stress, but
such a set up becomes physiologically irrelevant as in the natural joint, loads are dispersed
over large contact areas. Conversely, changing the stainless-steel pin to a standard 9 mm
cartilage pin would have been more beneficial but it was not possible to attach such a pin in
the rig used in this study. Furthermore, if this were possible, the load could not have been
increased further to compensate for the now even lower contact stress that would have been
possible with a 9 mm cartilage pin.
Therefore, the experimental set up used in this study, was acceptable to achieve the aims of
this study, which were to: investigate the effect of load variation on native and GAG depleted
porcine condylar cartilage and to identify which load would give rise to a significant
difference in the deformation, elastic modulus and permeability between the native and GAG
depleted porcine condylar cartilages.
5.6 Conclusion
The current study, while evaluating the effect of load variation on the deformation,
equilibrium elastic modulus and permeability of native and GAG depleted porcine condylar
cartilage, also addressed the importance of GAGs in the biomechanical properties of articular
cartilage. The loss of compressive stiffness in the GAG depleted porcine condylar cartilage
physically manifested in the form of noticeable deformation marks visible to the naked eye
in the contact zones at the end of indentation tests. Whereas, deformation marks were not
evident in native porcine condylar carti lage samples. This phenomenon can be simply
explained in terms of load supported by the fluid and solid phase. GAG depleted porcine
condylar cartilage had decreased fluid phase load support. This depletion of GAGs which are
intrinsic to the mechanical properties of cartilage caused a relatively higher proportion of the
load to be transferred to the solid phase of articular cartilage, which lead to higher

166
deformation when compared to native porcine condylar cartilage samples, that were able to
support most of the load in the fluid phase before transferring it solid phase, at a much
slower rate.
The medium and low loads both showed significant difference in the deformation as well as
in the equilibrium elastic modulus (p<0.05) between the native and GAG depleted medial
porcine condylar cartilage samples; which was not so apparent in the high load experiment.
However, the medium load measured the biggest significant differences in the deformation
between native and GAG depleted porcine cartilage models. Therefore, this load was
adopted in the following chapter to evaluate the deformation and mechanical properties of
GAG depleted porcine condylar cartilage treated with peptide and PEP: GAG mixtures, which
have been designed to treat GAG depleted articular cartilage tissue and improve its
biomechanical properties.

167
Chapter 6 Investigation of the effects of injection of peptide-GAG
mixtures to GAG depleted cartilage.
6.1 Introduction
The biomechanical properties of articular cartilage are compromised by the loss of GAGs,
which is due to the onset and natural progression of osteoarthritis and other joint diseases
(Lohmander et al., 1989; Arden and Nevitt, 2006; Lorenz and Richter, 2006; Pitsillides and
Beier, 2011; Clarkin et al., 2011; Ashkavand et al., 2013; Lee et al., 2013). The loss of GAGs
reduces the cartilages ability to withstand compressive forces (Mankin and Lippiell, 1971;
Dudhia, 2005; Otsuki et al., 2008; Katta et al., 2008). It has been suggested that restoring
GAGs, in particular chondroitin sulfate (CS), to GAG depleted cartilage may be beneficial to
the biomechanical and frictional properties of articular cartilage (Katta, 2007). The
hypothesis that SAPs in combination with GAGs can be an effective treatment to improve the
biomechanical properties of osteoarthritic cartilage was therefore tested in vitro.
Previous chapters have highlighted the favourable properties of P11-4 and P11-8 in
combination with GAGs. Therefore, the next stage of the study was to determine the effect
of the peptides and PEP: GAG mixtures of P11-4 and P11-8, on the deformation and
biomechanical properties of GAG depleted porcine condylar cartilage, when compared to
native porcine condylar cartilage using indentation testing. The in vitro GAG depleted porcine
condylar cartilage model developed in Chapter 4 – (model 3: method 4) and the load for
indentation testing determined in Chapter 5 – (medium load 0.31 N), were used to evaluate
the utility of P11-4 and P11-8 and their PEP: GAG mixtures, as a minimally invasive treatment
for GAG depleted porcine condylar cartilage. The FE model applied in Chapter 5 was used to
determine whether the peptides and PEP: GAG mixtures improved the biomechanical
properties of GAG depleted porcine condylar cartilage. All PEP: GAG mixtures tested were at
the lower GAG molar ratio of 1:64, as it was hypothesised that any effect on the deformation
and biomechanical properties of the GAG depleted cartilage at the lower GAG molar ratio,
would be magnified at a higher GAG molar ratio. Only medial porcine condyles were used in
FE analysis, as previous studies showed that lateral porcine condyles demonstrated high
creep deformation (creep deformation > 15% of the porcine condylar cartilage thickness),
which would lead to inaccurate predictions of the equilibrium elastic modulus and
permeability.
168
Fluorescence recovery after photobleaching (FRAP) is a quantitative technique that takes
advantage of particular properties of fluorophores, in which fluorophores are excited at a
certain wavelength and omit a fluorescent light. Originally, it was developed in 1970s by
Axelrod et al. as a technique to study the dynamics of molecular mobility in tissues or cells,
by measuring the rate of florescent recovery of organic dyes, such as fluorescein, in a
previously bleached area (Axelrod et al., 1976; Koppel et al., 1976). FRAP was used in this
study to determine whether the peptides and PEP: GAG mixtures that had been fluorescently
tagged with fluorescein; were able to remain in a self-assembled state after injection into
GAG depleted condylar cartilage and indentation testing. It was hypothesised that the
samples that were completely self-assembled would show little or no fluorescence recovery
after photobleaching. The gel like structure of the peptide or PEP: GAG mixtures would
prevent the fluorescein molecules in the non-bleached areas from diffusing to the area that
had been bleached
6.2 Aims and objectives
The aim of this chapter was to investigate whether P11-4 and P11-8 and their PEP: GAG
mixtures were able restore the biomechanical properties of GAG depleted porcine condylar
cartilage.
6.2.1 Objectives
1) To evaluate the deformation and biomechanical properties of native and GAG depleted
porcine condylar cartilage and GAG depleted porcine condylar cartilage injected with
peptides (P11-4 and P11-8) and PEP: GAG mixtures (P11-4 and P11-8 at a GAG molar ratio of
1:64), using indentation testing and FEA.
2) To determine the thickness of the native, GAG depleted and injected (peptide / PEP: GAG
mixtures) porcine condylar cartilage, using a needle indentation method.
3) To determine whether, after indentation testing, the peptides (P11-4 and P11-8) and PEP:
GAG mixtures (P11-4 and P11-8 at a GAG molar ratio of 1:64) injected into GAG depleted
porcine condylar cartilage remained in a self-assembled state within the cartilage, using
fluorescence recovery after photobleaching (FRAP) analysis.
6.3 Experimental Design
The experimental design in this study was to determine the effects of injecting GAG depleted
condylar cartilage with: peptide alone (P11-4 only, P11-8 only), PEP: GAG mixtures (P11-4: GAG
injection, P11-8: GAG injection) and chondroitin sulfate alone (CS injection only) on
deformation properties when compared to GAG depleted condylar cartilage (negative

169
control) and native condylar cartilage (positive control). The three test groups determined
the individual effects that either the peptide, chondroitin sulfate or the combination of the
two, had on the deformation properties of GAG depleted condylar cartilage.
Since testing the effects of the peptides and PEP: GAG mixtures involved physically injecting
the solutions into the cartilage, it was also important to determine the effects of injection of
a pressurized fluid as well as any physical damage caused to the cartilage through the needle
injection. Therefore, initial studies were carried out to compare the deformation properties
of native condylar cartilage; native condylar cartilage injected with distilled water (native
water injection) and native condylar cartilage injected with a needle only with no fluid (native
injection only). These two control experiments were carried out, because the effect of
injecting fluid or piercing the cartilage surface on the deformation properties, would be
better demonstrated in native cartilage, that had not had the GAGs removed, hence isolating
any effects. These test groups determined the effects that: a) the injection of pressurised
water and b) the piercing of the cartilage surface had on the deformation properties of native
condylar cartilage.
6.4 Experimental Methods
6.4.1 Acquisition of porcine femoral condyles
Porcine femoral condyles were acquired, dissected and stored as described in Chapter 2;
Section 2.2.2.2 to 2.2.2.4. Native porcine condyles were mounted in PMMA as outlined in
Chapter 2; Section 2.2.6.1.
6.4.2 GAG depletion of porcine femoral condylar cartilage
Three (medial and lateral) GAG depleted porcine condyles were produced using the
procedure outlined in Chapter 4; Section 4.3.3. The GAG depleted porcine condyles were
mounted in PMMA as outlined in Chapter 2; Section 2.2.6.1.
6.4.3 Preparation of peptides, peptide: GAG mixtures and chondroitin
sulfate GAG control.
The concentration of peptides was the same for all experiments (10 mg.ml -1, ~6 mM) and the
molar ratio of chondroitin sulfate (GAG) used in the PEP: GAG mixtures was 1:64. In this
study, the peptides used (P11-4 and P11-8) were doped with fluorescien tagged-P11-4 and P11-
8 purchased from commercial suppliers (PolyPeptide Group, Sweden) . The molar ratio of
fluorescien tagged-P11-4 and P11-8 to non-tagged P11-4 and P11-8 was 1:150. The chondroitin

170
sulfate GAG control was doped with a fluorescein stock solution (7.8 mM), in order to
visualise the mobility of the fluorescein and fluorescein-tagged peptides in subsequent FRAP
experiments.
The peptide, PEP: GAG mixture and chondroitin sulfate GAG control were weighed as
outlined in Table 28.
Table 28: Masses of peptide and chondroitin sulfate (GAG) weighed out for the different injection experiments.
Peptide alone PEP: GAG mixture
CS alone GAG Peptide
P11-4 10.53 mg 4.85 mg 10.53 mg 4.94 mg
P11-8 12.65 mg 4.94 mg 12.65 mg
Concentration of the peptide was 10 mg.ml -1. GAG molar ratio for the PEP: GAG mixture was 1:64. All samples were made up to a total volume of 1 ml.
6.4.3.1 Preparation of peptides for studies of injection of peptide alone.
Corresponding weights of peptide (Table 28) were weighed into a glass vial. Buffer
(developed by James Warren PhD student; School of Mechanical Engineering) was added (1
ml) into each vial containing the peptide to maintain the peptide in a monomeric state.
Sodium acetate buffer (1 M) at pH 4 was used for P11-8 samples and sodium phosphate buffer
(1 M) at pH 10 was used for P11-4 samples. Samples were vortexed for 30 seconds and
sonicated for 5 mins. Monomerised peptide samples were frozen in liquid nitrogen ( -196 0C)
and then lyophilised. Once fully lyophilised, samples were stored at 4 0C in the dark until used
for injection into the porcine condylar cartilage.
6.4.3.2 Preparation of peptides and chondroitin sulfate for studies of peptide:
GAG mixture injections.
Corresponding weights of peptide and GAG (Table 28) were weighed into individual glass
vials. The P11-4 sample was monomerised with 500 µl of 1 M sodium phosphate buffer at pH
10 and the P11-8 sample was monomerised with 1 M sodium acetate buffer at pH 4. The
corresponding monomersing buffer (500 µl) was added to the corresponding vials containing
the GAG. The reconstituted GAG solution was then added to its corresponding peptide
solution. Samples were vortexed for 30 seconds and then sonicated for 5 mins. The
monomerised PEP: GAG mixtures were frozen in liquid nitrogen (-196 0C) and then
lyophilised. Once fully lyophilised, samples were stored at 4 0C in the dark until required.
6.4.3.3 Preparation of chondroitin sulfate for studies of GAG only injections.
The highest weight of GAG (Table 28), was selected as a control and weighed into a glass vial.
Fluorescein stock solution 7.8 mM was diluted (5 µl stock + 995 µl buffer) to a concentration

171
of 38 µM using a physiological buffer (130mM Na+ salt solution at ~pH 7.4 – Chapter 3;
Section 3.3.1.3). The weighed-out GAG was added to this diluted fluorescein solution and
then lyophilised. The lyophilised powder was stored at 4 0C in the dark until required for
testing.
6.4.4 Injection of peptides, PEP: GAG mixtures and chondroitin sulfate
(GAG) into GAG depleted porcine condylar cartilage.
After the GAG depleted porcine femoral condyles had been mounted in PMMA; lyophilised
peptide, PEP: GAG and GAG were reconstituted in 1 ml of distilled water. A needle and 1 ml
syringe, were used to draw up 1 ml of the corresponding monomeric peptide, PEP: GAG
mixture or chondroitin sulfate solution into the syringe, ready for injection into the GAG
depleted porcine condylar cartilage (Figure 84). Three porcine femoral condyles (both medial
and lateral condyles) were used for all groups in this study.
6.4.4.1 Injection of native porcine condylar cartilage with and without water.
A preliminary study was carried out to determine the effects of injecting native condylar
cartilage with water and just a needle. Control injections of distilled water (1 ml), and a
control of just the injection were performed on native porcine condylar cartilage. Three
porcine femoral condyles (both medial and lateral condyles) were used for all control groups
in this study.
Figure 84: Hydrated monomeric peptide being drawn up into a 1 ml syringe, ready for injection into the GAG depleted porcine condylar cartilage.
The flattest region of interest (ROI) of the condyle was chosen by eye, as the injection site.
The injection technique used to inject the porcine condylar cartilage is illustrated in Figure
85. The highlighted area was injected 20 times around the circumference of the prescribed
ROI. In total 1ml of the peptide, PEP: GAG mixture, water or chondroitin sulfate solution was
deposited across these 20 injection sites, approximately 50 µl at each injection site. The
needle was tilted at circa 45o, so that the peptide, PEP: GAG mixture, water or GAG solution
could be deposited under the ROI, as demonstrated in Figure 85.

172
Figure 85: Schematic showing (A) the identification of the flattest region of interest (ROI) of the GAG depleted porcine condylar cartilage. (B) The injection of the peptide, PEP:
GAG mixture, water or chondroitin sulfate solution to the ROI and (C) the orientation of how the needle was inserted into the femoral condylar cartilage.
The needle was retracted very slowly in stages, depositing approximately 50 µl of the solution
into the cavity created in the GAG depleted porcine condylar cartilage until the needle tip
reached the surface of the cartilage. The GAG depleted porcine condylar cartilage samples
injected with peptide and PEP: GAG mixtures were left to equilibrate for one day, in a moist
environment at 4 0C in the dark, before indentation testing. All controls (native porcine
condylar cartilage, native porcine condylar cartilage injected with water, native porcine
condylar cartilage injected only and GAG depleted porcine condylar cartilage samples
injected with chondroitin sulfate doped with fluorescein) were also stored in a moist
environment at 4 0C in the dark for one day, before indentation testing.
6.4.5 Biomechanical characterisation of porcine femoral condylar cartilage
6.4.5.1 Indentation testing - sample and equipment preparation
After the samples had been injected with the peptide, PEP: GAG mixture, water or
chondroitin sulfate and left to equilibrate (Section 6.4.4), the percentage deformation of the
treated GAG depleted and native cartilages was determined using the indentation method
described in Chapter 2; Section 2.2.6.2. The medium load (0.31 N) established as the
appropriate load in the previous chapter, was applied. PBS was added into the cup holder,
containing the PMMA fixed cartilage condyle, as described in Chapter 2; Section 2.2.6.2.
Flattest area of the porcine condylar cartilage.
(A) (B)
(C)

173
However, in this study the whole condyle was not completely submerged, instead PBS was
filled to just before the area where the porcine cartilage had been injected.
6.4.5.2 Cartilage thickness measurements
The thickness of the cartilage in all of the experimental and control groups was measured
using an Instron material testing machine and the measurements were always taken after
indentation testing, as outlined in Chapter 2; Section 2.2.6.4. Injected samples were allowed
to recover in a sealed Tupperware box moistened with PBS tissue, kept in the dark at 40C
overnight prior to thickness measurement.
6.4.5.3 Finite element method for derivation of material properties of porcine
condylar cartilage
Deformation data of the treated GAG depleted and native porcine condylar cartilage, along
with its cartilage thickness data were input into the FE model, which was used to derive the
equilibrium elastic modulus and permeability, as described in Chapter 2; Section 2.2.6.5.
6.4.6 Determination of self-assembly of peptides and PEP: GAG mixtures
in situ in GAG depleted porcine condylar cartilage.
6.4.6.1 Cryo-embedding
After the thickness of the cartilage in the treated samples had been measured, 9 mm plugs
were removed from the porcine femoral condyles within the prescribed ROI, as described in
Chapter 2; Section 2.2.2.3. Cartilage was removed from the bone and placed in cryo-plastic
moulds. The cartilage was covered in OCT embedding medium and then placed flat into a
freezer at -20 0C until set and required for sectioning.
Frozen cartilage tissue blocks embedded in OCT medium were removed from the freezer and
placed into the cryostat, which had been set to -25 0C. Additional OCT embedding medium
was applied to the back of the frozen cartilage block and pressed firmly onto a cryostat chuck.
The chuck was then placed onto the super cooling stage inside the cryostat for 5 mins and a
weight was applied to the top of the block until the frozen cartilage block had adhered evenly
to the chuck. The chuck with the embedded frozen cartilage tissue was mounted into the
chuck holder in the required orientation and the sample was fastened. The angle of the
cutting blade was set to 40 and then moved towards the embedded samples. The section
thickness was set to 100 µm. Cut sections were placed on Superfrost Plus+ slides by placing
the slide just above the freshly cut cartilage tissue and allowing the section to self -adhere to

174
the slide. Twelve sections of each cartilage sample were cut (4 per slide; 3 slides for each
sample).
Slides were then placed in 70 % alcohol (w/v) for one minute to remove the excess OCT
medium and then left to air dry. Samples containing fluorescein were covered in tin foil and
kept in the dark.
6.4.6.2 Fluorescence recovery after photobleaching (FRAP)
Slides containing sections of the GAG depleted porcine condylar cartilage injected with
fluorescently tagged peptide, PEP: GAG mixtures or GAG, were placed into a Zeiss confocal
microscope (LSM 800 Inverted). Injection sites were first located, before a region of interest
(ROI) was marked out next to the injection site, using the FRAP module tools on the Zeiss
confocal microscope. A second ROI was also marked out, as a control, away from the
injection site but in an area in which the fluorescently labelled peptide was visible. The ROI
near the injection site was bleached for 10 seconds with a focused high-powered laser bean
at a wavelength of 525 nm. The second ROI was not bleached, and was used as a control
reference. Subsequently, the diffusion of the surrounding ‘non -bleached’ fluorescent
molecules into the bleached area was recorded every 500 ms for 1 minute, until equilibrium
was reached. Recovery of the fluorescent intensity of the bleached ROI was plotted against
time to produce a recovery curve, which gave information on the mobility of the fluorescein
within the: GAG and peptide only samples as well as the PEP: GAG gel samples. The FRAP
analysis module on the Zeiss confocal microscope, was used to analyse the recovery curve to
determine the diffusion constant of the fluorescein. Examples of different recovery profiles
are shown in Figure 86 and were used to identify the self-assembly state of the peptides and
PEP: GAG mixtures by classifying the mobility of the fluorescein that had been tagged to the
peptide in the peptide samples and peptide in the PEP: GAG mix tures. Live screen shot
images of the bleaching process were also recorded.
Figure 86: Diffusion profiles for the intensity of fluorescein over a period of time: (A) highly mobile (not self-assembled) (B) intermediately mobile and (C) immobile (self-
assembled).
Flu
ore
sce
nce
Inte
nsit
y
Recovery Time
(A) (B) (C)
Highly mobile Intermediate Immobile
Bleaching occurring

175
6.5 Results
In this study, there were several groups of native and GAG depleted porcine condylar
cartilages into which different solutions were injected. The effects of injecting fluorescein-
tagged peptide doped P11-4 and P11-8 alone and in combination with GAG, at a molar ratio of
1:64 on the deformation properties of GAG depleted porcine condylar cartilage were
investigated. As a control, GAG depleted porcine condylar cartilage was injected with
chondroitin sulfate doped with fluorescein. In addition, the effects of injecting native porcine
condylar cartilage with water or just an injection with no solution were investigated. There
were three porcine femoral condyles (medial - n=3; lateral - n=3) used in all groups.
6.5.1 Preliminary study to determine the effects of injecting water and just
a needle (without water) on the deformation properties of native condylar
cartilage.
6.5.1.1 Cartilage thickness measurements
For each cartilage group (native, native water injection and native injection only) indented
with the medium load of 0.31 N; the cartilage thickness was measured for both medial (n=3)
and lateral (n=3) condyles. Cartilage thickness data for the medial and lateral condyles of all
groups is presented in Figure 87 and Figure 88, respectively. The data was analysed by one-
way analysis of variance which revealed no significant variation in the thickness of the
cartilage of the medial condyles of all the groups. However, in the lateral condyles the
thickness of the cartilage in the native cartilage group was significantly greater (p< 0.05) than
the thickness of the cartilage in the native injected only group.
Figure 87: Cartilage thickness measurement of the medial condyles for the: native, native water injected and native injected only groups (n=3 for all groups). Samples were
measured six times in the area of interest after indentation. Data is expressed as the mean (n=3) ± 95 % confidence limits.
0
0.5
1
1.5
2
2.5
3
Native Native water injected Native injected only
Car
tila
ge T
hic
kne
ss (
mm
)

176
Figure 88: Cartilage thickness measurement of the lateral condyles for the: native, native water injected and native injected only groups (n=3 for all groups). Samples were
measured six times in the area of interest after indentation. Data is expressed as the mean (n=3) ± 95 % confidence limits.
6.5.1.2 Percentage deformation
Deformation properties of all three groups under a load of 0.31 N; for both medial and lateral
porcine condyles are shown in Figure 89 to Figure 91. The percentage deformation of both
the medial and lateral condyles under a load of 0.31 N, over a period of 1 hour, is shown in
Figure 89 and Figure 90, respectively. The final percentage deformation (at 1 hour) of all the
groups, for both medial and lateral condyles is shown in Figure 91.
The effect of injecting water and just an injection without water, on the percentage
deformation of native condylar cartilage was determined by comparing the percentage
deformation at 1 hour with that of the native porcine condylar cartilage for (a) the medial
and (b) the lateral condyles. The data is presented in Figure 91.
The deformation curves of both medial and lateral condyles, over the duration of 1 hour
showed that the native condylar cartilage deformed the least. The data also showed that the
percentage deformation of the medial condylar cartilage samples of all groups had lower
deformation properties when compared to the lateral condylar cartilage samples. It was
observed that the native medial condylar cartilage injected with water reached equilibrium
faster (t = 1200 secs), when compared to native medial condylar cartilage injected without
water and the native medial condylar cartilage control.
0
0.5
1
1.5
2
2.5
3
Native Native water injected Native injected only
Car
tila
ge T
hic
kne
ss (
mm
)
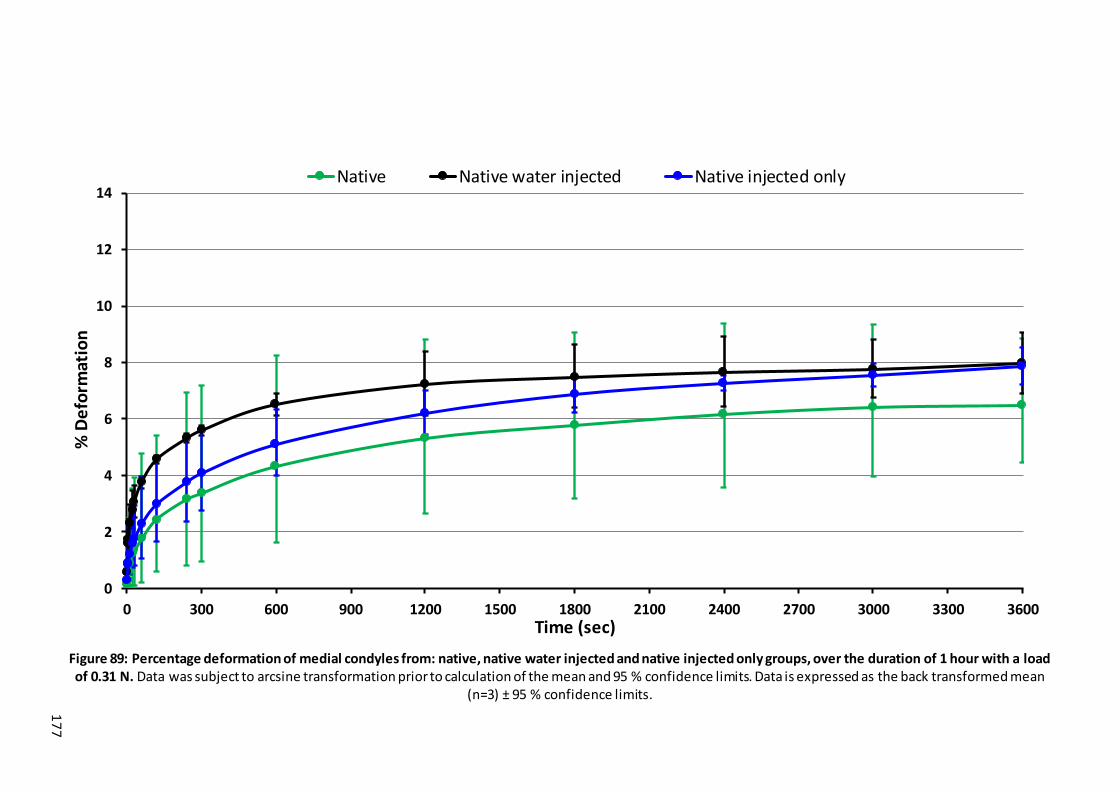
17
7
Figure 89: Percentage deformation of medial condyles from: native, native water injected and native injected only groups, over the duration of 1 hour with a load of 0.31 N. Data was subject to arcsine transformation prior to calculation of the mean and 95 % confidence limits. Data is expressed as the back transformed mean
(n=3) ± 95 % confidence limits.
0
2
4
6
8
10
12
14
0 300 600 900 1200 1500 1800 2100 2400 2700 3000 3300 3600
% D
efo
rmat
ion
Time (sec)
Native Native water injected Native injected only

17
8
Figure 90: Percentage deformation of lateral condyles from: native, native water injected and native injected only groups, over the duration of 1 hour with a load of 0.31 N. Data was subject to arcsine transformation prior to calculation of the mean and 95 % confidence limits. Data is expressed as the back transformed mean
(n=3) ± 95 % confidence limits.
0
2
4
6
8
10
12
14
0 300 600 900 1200 1500 1800 2100 2400 2700 3000 3300 3600
% D
efo
rmat
ion
Time (sec)
Native Native water injected Native injected only

17
9
Figure 91: Final percentage deformation at 1 hour of: native, native water injected and native injected only groups, for the medial and lateral condyles, with a load of 0.31 N. Data was subject to arcsine transformation prior to calculation of the mean (n=3) and 95 % confidence limits. Data is expressed as the back transformed
mean (n=3) ± 95 % confidence limits.
0
2
4
6
8
10
12
14
16
Native Native water injected Native injected only
% D
efo
rmat
ion
Medial Lateral

180
The mean percentage deformation at 1 hour for the medial condyles of the native, native
water injected and native injection only condylar cartilage were 6.5 %, 8 % and 7.9 %,
respectively. For the lateral condyles, the mean percentage deformation was 5.9 %, 9.2 %
and 10.1 % for the native, native water injected and native injection only condylar cartilage.
To determine if the injection of water or just injections without water, had an effect on the
deformation properties of native porcine condylar cartilage, the percentage deformation
data at 1 hour was compared (Figure 91). Due to the small sample size (n=3) the data was
not subject to statistical analysis.
In the medial condyles the data showed that native medial condylar cartilage injected with
water or just injection without water appeared to have a minimal effect to increase the
deformation, only increasing the deformation by circa 1.5 % in both cases. For the lateral
condyles, there appeared to be a greater effect with the mean deformation increasing from
circa 6 % to 10 %, following the injection alone.

181
6.5.2 The effects of injecting P11-4 and P11-8 alone and in combination with
GAG, at a molar ratio of 1:64 on the deformation properties of GAG
depleted porcine condylar cartilage.
6.5.2.1 Cartilage thickness measurements
For each cartilage group (native, GAG depleted, GAG depleted chondroitin sulfate (CS)
injected only, P11-4: GAG injected, P11-4 only injected, P11-8: GAG injected and P11-8 only
injected) indented with the medium load of 0.31 N; the cartilage thickness was measured for
both medial (n=3) and lateral (n=3) condyles. Cartilage thickness data for the medial and
lateral condyles of all groups is presented in Figure 92 and Figure 93, respectively. Due to
small sample size (n=3) the cartilage thickness data for the medial and lateral condyles was
not subjected to statistical analysis. Nevertheless, the data for the medial condyles showed
that there was minimal variation in the cartilage thickness across all groups. In the lateral
condyles, there appeared to be one group (native, 1.9 mm) that had a slightly higher cartilage
thickness when compared to the rest of the groups which had an average thickness of around
1.7 mm.
Figure 92: Cartilage thickness measurement of the medial condyles for the: native, GAG depleted chondroitin sulfate (CS) injected only, GAG depleted, P11-4: GAG injected, P11-4
only injected, P11-8: GAG injected and P11-8 only injected groups (n=3 for all groups). Samples were measured six times in the area of interest after indentation. Data is
expressed as the mean (n=3) ± 95 % confidence limits.
0
0.5
1
1.5
2
2.5
3
Native GAGdepleted CSinjected only
GAGdepleted
P11-4: GAGinjected
P11-4 onlyinjected
P11-8: GAGinjected
P11-8 onlyinjected
Cart
ilage
Th
ickn
ess
(mm
)

182
Figure 93: Cartilage thickness measurement of the lateral condyles for the: native, GAG depleted chondroitin sulfate (CS) injected only, GAG depleted, P11-4: GAG injected, P11-4
only injected, P11-8: GAG injected and P11-8 only injected groups (n=3 for all groups). Samples were measured six times in the area of interest after indentation. Data is
expressed as the mean (n=3) ± 95 % confidence limits.
6.5.2.2 Percentage deformation
Deformation properties of all groups under a load of 0.31 N; for both medial and lateral
porcine condyles are shown in Figure 94 - Figure 98. The percentage deformation of the
medial and lateral condyles under a load of 0.31 N, over a period of 1 hour, is shown in Figure
94 and Figure 95, respectively. The final percentage deformation (at 1 hour) of all the groups
and the corresponding controls, for both medial and lateral condyles is shown in Figure 96.
The effect of injecting the peptides P11-4 and P11-8, and the PEP: GAG mixtures, on the
percentage deformation of GAG depleted condylar cartilage was determined by comparing
the percentage deformation at 1 hour with the GAG depleted and native porcine condylar
cartilage. The data is presented in Figure 97 and Figure 98, for the medial and lateral condyles
respectively.
The deformation curves of both medial and lateral condyles, over the duration of 1 hour
showed that the native condylar cartilage deformed the least and that the GAG depleted CS
injected condylar cartilage deformed the most. The data also showed that medial condylar
cartilage samples injected with P11-4: GAG and P11-8: GAG mixtures had lower deformation
properties compared to the GAG depleted condylar cartilage and in the lateral condylar
cartilage samples; injections of P11-4: GAG, P11-8: GAG and P11-8 also reduced the
deformation compared to the GAG depleted condylar cartilage samples.
0
0.5
1
1.5
2
2.5
3
Native GAGdepleted CSinjected only
GAGdepleted
P11-4: GAGinjected
P11-4 onlyinjected
P11-8: GAGinjected
P11-8 onlyinjected
Cart
ilage
Th
ickn
ess
(mm
)

18
3
Figure 94: Percentage deformation of medial condyles from: native, GAG depleted chondroitin sulfate (CS) injected only, GAG depleted, P11-4: GAG injected, P11-4 only injected, P11-8: GAG injected, P11-8 only injected groups, over the duration of 1 hour with a load of 0.31 N. Data was subject to arcsine transformation prior to
calculation of the mean and 95 % confidence limits. Data is expressed as the back transformed mean (n=3) ± 95 % confidence limits.
0
5
10
15
20
25
0 300 600 900 1200 1500 1800 2100 2400 2700 3000 3300 3600
% D
efo
rmat
ion
Time (sec)
Native GAG depleted GAG depleted CS injected onlyP11-4:GAG injected P11-4 only injected P11-8:GAG injectedP11-8 only injected

18
4
Figure 95: Percentage deformation of lateral condyles from: native, GAG depleted chondroitin sulfate (CS) injected only, GAG depleted, P11-4: GAG injected, P11-4 only injected, P11-8: GAG injected, P11-8 only injected groups, over the duration of 1 hour with a load of 0.31 N. Data was subject to arcsine transformation prior to
calculation of the mean and 95 % confidence limits. Data is expressed as the back transformed mean (n=3) ± 95 % confidence limits.
0
10
20
30
40
50
60
70
0 300 600 900 1200 1500 1800 2100 2400 2700 3000 3300 3600
% D
efo
rmat
ion
Time (sec)
Native GAG depleted GAG depleted CS injected only
P11-4:GAG injected P11-4 only injected P11-8:GAG injected
P11-8 only injected
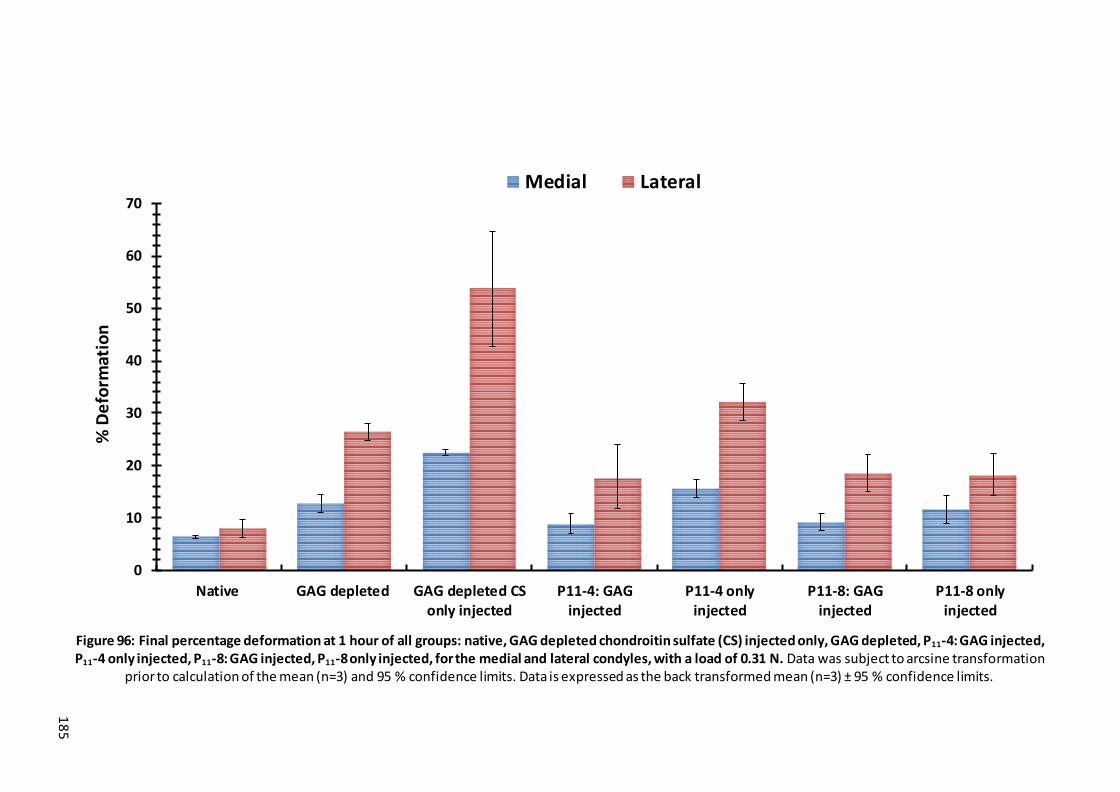
18
5
Figure 96: Final percentage deformation at 1 hour of all groups: native, GAG depleted chondroitin sulfate (CS) injected only, GAG depleted, P11-4: GAG injected, P11-4 only injected, P11-8: GAG injected, P11-8 only injected, for the medial and lateral condyles, with a load of 0.31 N. Data was subject to arcsine transformation
prior to calculation of the mean (n=3) and 95 % confidence limits. Data is expressed as the back transformed mean (n=3) ± 95 % confidence limits.
0
10
20
30
40
50
60
70
Native GAG depleted GAG depleted CSonly injected
P11-4: GAGinjected
P11-4 onlyinjected
P11-8: GAGinjected
P11-8 onlyinjected
% D
efo
rmat
ion
Medial Lateral

18
6
Figure 97: Final percentage deformation at 1 hour of medial condyles from: native, GAG depleted, GAG depleted chondroitin sulfate (CS) injected only, P11-4: GAG injected, P11-4 only injected, P11-8: GAG injected, P11-8 only injected, with a load of 0.31 N. Data was subject to arcsine transformation prior to calculation of the
mean and 95 % confidence limits and statistical analysis. Data is expressed as the back transformed mean (n=3) ± 95 % confide nce limits.
0
5
10
15
20
25
30
35
40
Native GAG depleted GAG depleted CSonly injected
P11-4: GAGinjected
P11-4 onlyinjected
P11-8: GAGinjected
P11-8 onlyinjected
% D
efo
rmat
ion

18
7
Figure 98: Final percentage deformation at 1 hour of lateral condyles from: native, GAG depleted, GAG depleted chondroitin sulfate (CS) injected only, P11-4: GAG injected, P11-4 only injected, P11-8: GAG injected, P11-8 only injected, with a load of 0.31 N. Data was subject to arcsine transformation prior to calculation of the
mean and 95 % confidence limits and statistical analysis. Data is expressed as the back transformed mean (n=3) ± 95 % confidence limits.
0
10
20
30
40
50
60
70
80
90
100
Native GAG depleted GAG depleted CSonly injected
P11-4: GAGinjected
P11-4 onlyinjected
P11-8: GAGinjected
P11-8 onlyinjected
% D
efo
rmat
ion

188
The injection of chondroitin sulfate into the GAG depleted porcine condylar cartilage had a
negative effect on the percentage deformation of the porcine condylar cartilage. An increase
in the percentage deformation of 43.6 % in the medial and 51 % in the lateral condyles was
observed when compared to the GAG depleted porcine condylar cartilage control. To
determine if the peptides P11-4 or P11-8, or PEP: GAG mixtures improved the deformation
properties of GAG depleted porcine condylar cartilage, the percentage deformation data at
1 hour between the PEP: GAG injected samples and the GAG depleted condylar cartilage,
was compared. Due to the small sample size (n=3) the data was not subject to statistical
analysis.
In the medial condyles, the data showed that injection of the GAG depleted condylar
cartilage with P11-4: GAG and P11-8: GAG, reduced the percentage deformation by 30.7 % and
27.8 % respectively, when compared to the GAG depleted condylar cartilage control.
However, when comparing the percentage deformation of GAG depleted porcine condylar
cartilage injected with P11-4: GAG and P11-8: GAG, minimal differences were seen between
the two, suggesting that neither of these two PEP: GAG mixtures were better than the other
at reducing the percentage deformation of the GAG depleted condylar cartilage. GAG
depleted condylar cartilage injected with P11-4 and chondroitin sulfate only both appeared
to increase the percentage deformation of GAG depleted condylar cartilage.
In the lateral condyles, the data showed that injection of the GAG depleted condylar cartilage
with P11-4: GAG, P11-8: GAG and P11-8 only, reduced the percentage deformation by 33.7 %,
30 % and 31.5 % respectively, when comparted to the GAG depleted condylar cartilage
control. However, when comparing the percentage deformation of the GAG depleted
condylar cartilage injected with P11-4: GAG, P11-8: GAG and P11-8 only, minimal differences
were seen, which again indicated that neither of the two PEP: GAG mixtures nor the peptide
only injection were significantly better than the others at reducing the percentage
deformation of the GAG depleted condylar cartilage. Nevertheless, the PEP: GAG mixtures
appeared to improve the deformation properties of GAG depleted lateral condylar cartilage,
which was not the case for the GAG depleted condylar cartilage samples injected with P11-4
and chondroitin sulfate only.
The percentage deformation data for the medial condyles showed that the GAG depleted
condylar cartilage injected with P11-4 only, P11-8 only, P11-8: GAG and chondroitin sulfate only
all appeared to have a higher percentage deformation (15.5, 11.5 and 9.1 %, respectively)
compared to the native condylar cartilage control (6.3 %). Although the GAG depleted
condylar cartilage injected with P11-4: GAG had a higher percentage deformation (8.7 %) than

189
the native condylar cartilage control, the difference between the two was less when
compared to the latter groups. This indicated that the P11-4: GAG mixture may be able to
restore the deformation properties of GAG depleted porcine medial condylar cartilage to
those of the native porcine medial condylar catilage. However, the percentage deformation
data of the lateral condyles for all the groups showed that the mean percentage
deformations were higher than the native lateral condylar cartilage control.
6.5.3 Equilibrium elastic modulus and permeability
An FE model was used to calculate the equilibrium elastic modulus and permeability using
the data from only the medial condyles, since the deformation curves in the lateral condyles
gave high creep deformation (creep deformation > 15 % of the porcine condylar cartilage
thickness). Hence the lateral condyle deformation data was excluded from being input into
the FE model, as high levels of deformation would lead to inaccurate predictions of the
equilibrium elastic modulus and permeability. The GAG depleted condylar cartilage samples
injected with chondroitin sulfate only, were also excluded from the FE model for the same
reasons.
Representative images of the deformation curve fittings for the GAG depleted porcine medial
condylar cartilage injected with P11-4: GAG, P11-4 only, P11-8: GAG and P11-8 only are shown
in Figure 99A-D. These curve fittings were used to calculate the equilibrium elastic modulus
and permeability of the samples.
Perusal of the data showed that the GAG depleted condylar cartilage injected with the PEP:
GAG (both P11-4 and P11-8) had lower deformation than the GAG depleted condylar cartilage
injected with the peptides alone. The curve fittings shown in Figure 99A-D, show how close
the FE model curve fitting was to the last 70% of the experimental deformation curve and
this was confirmed by the R2 values for the above graphs, which were: P11-4: GAG = 0.953;
P11-4 only = 0.954; P11-8: GAG = 0.951; P11-8 only = 0.954. The higher the value of R2 the closer
the fit between the experimental and FE model curves. Only samples with an R2 value greater
than 75% were accepted as relevant and accurate enough for this study.

190
Figure 99: Representative graphs of indentation characteristics obtained experimentally and through FEA model curve fitting of a medial porcine condyle under a load of 0.31 N.
(A): Curve fitting the deformation profile of a GAG depleted porcine medial condyle injected with P11-4: GAG (B): Curve fitting the deformation profile of a GAG depleted
porcine medial condyle injected with P11-4 only (C): Curve fitting the deformation profile of a GAG depleted porcine medial condyle injected with P11-8: GAG (D): Curve fitting the
deformation profile of a GAG depleted porcine medial condyle injected with P11-8 only.
The equilibrium elastic modulus and permeability values for the medial condyles of the GAG
depleted cartilage injected with P11-4: GAG, P11-8: GAG, P11-4 only, P11-8 only and their
corresponding native and GAG depleted condylar cartilage are shown in Figure 100. The data
was compared to determine differences between group means. This showed that the native
condylar cartilage exhibited a higher average equilibrium elastic modulus when compared to
the GAG depleted condylar cartilage injected with P11-8: GAG, P11-4 only, P11-8 only as well
as the GAG depleted condylar cartilage control. However, the data showed that the injection
of P11-4: GAG to the GAG depleted condylar cartilage had minimal effect on the mean elastic
modulus (0.43 MPa) when compared to the native condylar cartilage control (0.5 MPa). It
was also observed that the addition of the GAG to the P11-4 peptide, appeared to
substantially increase the equilibrium elastic modulus, hence stiffness, of the GAG depleted
condylar cartilage, which was not the case in the samples injected with the P11-8 peptide.
Nevertheless, both the PEP: GAG mixtures (P11-4: GAG and P11-8: GAG) appeared to be stiffer
than GAG depleted condylar cartilage control.
0
0.2
0.4
0.6
0 1200 2400 3600
De
form
ati
on
(mm
)
Time (Secs)
Experimental FEA(A)
0
0.2
0.4
0.6
0 1200 2400 3600
Def
orm
atio
n (m
m)
Time (Secs)
Experimental FEA(B)
0
0.2
0.4
0.6
0 1200 2400 3600
Def
orm
ati
on
(mm
)
Time (Secs)
Experimental FEA(C)
0
0.2
0.4
0.6
0 1200 2400 3600
De
form
atio
n (m
m)
Time (Secs)
Experimental FEA(D)

19
1
Figure 100: Elastic modulus and permeability of GAG depleted porcine medial condylar cartilage injected with P11-4: GAG, P11-4 only, P11-8: GAG, P11-8 only and their corresponding native and GAG depleted condylar cartilage controls, under a load of 0.31 N. Data is expressed as the mean (n=3) ± 95 % confidence limits. The
R2 values define how close the FE model curve fitting was to the last 70% of the experimental deformation curve , the closer the R2 value is to 1, the better the fit.
0
0.1
0.2
0.3
0.4
0.5
0.6
(P11-4) (P11-8) Elastic Modulus
Elas
tic
mo
du
lus
(M
Pa)
R2 = 0.95
R2 = 0.93
R2 = 0.92
R2 = 0.93R2 = 0.96
R2 = 0.93
0
1E-15
2E-15
3E-15
4E-15
5E-15
6E-15
7E-15
8E-15
(P11-8) (P11-4) Permeability
Pe
rme
ability (m
4/N
.s)
Native P11-4: GAG P11-4 only P11-8: GAG P11-8 only GAG depleted
R2 = 0.93
R2 = 0.95
R2 = 0.92
R2 = 0.93
R2 = 0.96 R2 = 0.93

192
6.5.4 Summary of the effects of injecting GAG-depleted porcine medial
condylar cartilage with peptides and PEP: GAG mixtures on the percentage
deformation, elastic modulus and permeability values for all groups tested.
A summary of the effects of injecting GAG depleted medial porcine condylar cartilage with
P11-4: GAG, P11-4 only, P11-8: GAG and P11-8 only when compared to native and GAG depleted
medial porcine condylar cartilage is presented in Table 29. The study suggests that the
injection of the P11-4: GAG mixture may be able to restore the biomechanical properties of
the GAG-depleted porcine medial condylar cartilage to levels that were not too different to
native porcine medial condylar cartilage.
Table 29: Summary table of the percentage deformation, elastic modulus and permeability and the difference between the GAG depleted medial porcine condylar
cartilage sample injected with P11-4: GAG, P11-4 only, P11-8: GAG and P11-8 only and the native and GAG depleted medial porcine condylar cartilage.
P11-4 alone P11-4:GAG P11-8 alone P11-8:GAG
Percentage
deformation
Vs GAG depleted ND ↓ ND ↓
Vs Native ↑ ND ↑ ↑
Permeability Vs GAG depleted ND ND ND ND
Vs Native ND ND ND ND
Elastic
modulus
Vs GAG depleted ND ↑ ND ↑
Vs Native ↓ ND ↓ ↓
Key: (↑) = higher; (↓) = lower; (ND) = no difference.
6.5.5 Fluorescence recovery after photobleaching (FRAP) analysis to
determine self-assembly of injected fluorescein-doped P11-4 and P11-8 and
fluorescein-doped PEP: GAG mixtures in GAG depleted condylar cartilage.
Representative images of GAG depleted porcine medial condylar cartilage injected with
fluorescein-tagged peptide doped P11-4: GAG and P11-4 only, and fluorescein-tagged peptide-
doped P11-8: GAG and P11-8 only, are presented in Figure 101, Figure 102, Figure 103 and
Figure 104, respectively. Images of GAG depleted cartilage injected with chondroitin sulfate
only, native and GAG depleted cartilage controls are presented in Figure 105, Figure 106 and
Figure 107, respectively. All images were captured after indentation testing had been
performed. Sections of the cartilage presented in these images were taken parallel to the
cartilage surface. Images of the injected cartilage samples were captured using both

193
transmitted light and with the fluorescein filter. For each cartilage sample that had been
injected with the fluorescein-tagged peptide, PEP: GAG mixture or fluorescein doped
chondroitin sulfate; images were taken before photobleaching (t=1 sec), immediately after
bleaching (t=6 secs) and after 1 min of recovery. A recovery curve was also recorded, which
showed the fluorescence intensity of the ROI that had been photobleached (red line/circle)
and the fluorescence intensity of the control ROI (green line/circle), over a period of 1 min.
6.5.5.1 GAG depleted porcine medial condylar cartilage injected with
fluorescein-tagged peptide-doped P114: GAG and fluorescein-tagged peptide-
doped P11-4 alone.
Images of GAG depleted condylar cartilage injected with fluorescein-tagged peptide-doped
P11-4: GAG, are presented in Figure 101. The injection sites of GAG depleted cartilage that
were injected with fluorescein-tagged peptide doped P11-4: GAG are shown in Figure 101 (A)
to (D). The green fluorescence present around the injection sites and surrounding areas was
due to the diffusion of the fluorescein-tagged P11-4: GAG throughout the thickness of the
cartilage. The bleached ROI outlined by the red circle in Figure 101 (B) was much darker,
when compared to the same ROI in Figure 101 (A), in which the GAG depleted cartilage
sample had not been bleached. GAG depleted cartilage samples injected with fluorescein-
tagged peptide-doped P11-4: GAG demonstrated no fluorescence recovery, which was
confirmed by the recovery curve shown in Figure 101 (F). The initial fluorescence intensity of
the bleached ROI and the control ROI was 100 and 106, respectively. After bleaching (t=6 s),
the fluorescence intensity of the bleached ROI was reduced to 79, and it recovered by 2% to
81 and remained at this intensity for the duration of the test (1 minute). However, the
fluorescence intensity of the control ROI steadily decreased over the duration of the
experiment, which was due to the inherent photo-bleaching of imaging the sample, over a
period of time. Nevertheless, the fluorescence intensity of the control ROI remained
relatively constant.

19
4
Figure 101: Representative FRAP images of GAG depleted porcine condylar cartilage injected with fluorescein-tagged peptide-doped P11-4: GAG. Red lines/circles highlight the ROIs that were bleached in each sample and the green lines/circles highlight the ROIs that were used as control areas in each sample.(A) Image of a GAG depleted condylar cartilage sample injected with fluorescein-tagged peptide-doped P11-4: GAG prior to bleaching (t=1 s), (B) Image of a GAG depleted condylar
cartilage sample injected with fluorescein-tagged peptide-doped P11-4: GAG immediately after bleaching (t=6 s), (C) Image of a GAG depleted condylar cartilage sample injected with fluorescein-tagged peptide-doped P11-4: GAG after recovery (t=60 s). (D) GAG depleted condylar cartilage injected with fluorescein-tagged peptide-doped P11-4: GAG, imaged with a fluorescein filter compared to (E) the same sample imaged in transmitted light. (F) Recovery curve for a GAG depleted medial condylar cartilage sample injected with fluorescein-tagged peptide-doped P11-4: GAG, which revealed no recovery in the bleached area. All images were
captured from sections of medial condyles.
0
50
100
150
0 0.5 1
Inte
nsi
ty
Time (min)
Bleached Control
(A) (B) (C)
(D) (E) (F)

195
Images of GAG depleted condylar cartilage injected with fluorescein-tagged peptide-doped
P11-4 on its own, are presented in Figure 102. The injection sites of GAG depleted cartilage
that were injected with fluorescein-tagged peptide-doped P11-4 alone are shown in Figure 102
(A) to (D). The green fluorescence present around the injection sites and surrounding areas
was due to the diffusion of the fluorescein-tagged P11-4 throughout the thickness of the
cartilage. The bleached ROI outlined by the red circle in Figure 102 (B) was much darker, when
compared to the same ROI in Figure 102 (A), in which the GAG depleted cartilage sample had
not been photobleached. GAG depleted cartilage samples injected with fluorescein-tagged
peptide-doped P11-4 alone, demonstrated no fluorescence recovery, which was confirmed by
the recovery curve in shown in Figure 102 (F). The initial fluorescence intensity for both
bleached ROI and the control ROI was 120. After bleaching (t=6 s), the fluorescent intensity of
the bleached ROI reduced to ~ 92, where it recovered by 0.7 % to ~ 93 and remained at this
intensity for the duration of the test (1 minute). The fluorescence intensity of the control ROI
remained constant throughout the test.
Figure 102: Representative FRAP images of porcine GAG depleted condylar cartilage injected with fluorescein-tagged peptide-doped P11-4 alone. Red lines/circles highlight the ROIs that were bleached in each sample and the green lines/circles highlight the ROIs that were used as control areas in each sample.(A) Image of a GAG depleted condylar cartilage
sample injected with fluorescein-tagged peptide-doped P11-4 alone prior to bleaching (t=1 s), (B) Image of a GAG depleted condylar cartilage sample injected with fluorescein-tagged peptide-doped P11-4 alone immediately after photobleaching (t=6 s), (C) Image of a GAG depleted condylar cartilage sample injected with fluorescein-tagged peptide-doped P11-4
alone after recovery (t=60 s). (D) GAG depleted condylar cartilage injected with fluorescein-tagged peptide-doped P11-4 alone, imaged with a fluorescent filter compared to (E) the same sample imaged in transmitted light. (F) Recovery curve for a GAG depleted condylar cartilage
sample injected with fluorescein-tagged peptide-doped P11-4 alone, which revealed no recovery in the bleached area. All images were captured from sections of medial condyles.
(A) (B) (C)
0
50
100
150
0 0.5 1Inte
nsi
ty
Time (min)
Bleached Control
(D) (F) (E)

196
6.5.5.2 GAG depleted condylar cartilage injected with fluorescein-tagged peptide-
doped P11-8: GAG and fluorescein-tagged peptide-doped P11-8 alone.
Images of GAG depleted condylar cartilage injected with fluorescein-tagged peptide-doped
P11-8: GAG are presented in Figure 103. Figure 103 (A) to (D) show the injection sites of GAG
depleted cartilage that was injected with fluorescein-tagged peptide-doped P11-8: GAG. The
green fluorescence seen around the injection sites and surrounding areas was due to the
diffusion of the fluorescein-tagged peptide-doped P11-8: GAG throughout the thickness of
the cartilage. The bleached ROI outlined by the red circle in Figure 103 (B) was much darker
due to the bleaching, when compared to the same ROI in Figure 103 (A), where the GAG
depleted cartilage sample had not been bleached. GAG depleted cartilage samples injected
with fluorescein-tagged peptide-doped P11-8: GAG demonstrated no fluorescence recovery,
which was confirmed by the recovery curve in Figure 103 (F). The initial fluorescence intensity
of both the bleached ROI and the control ROI was 108. After bleaching (t=6 s), the
fluorescence intensity of the bleached ROI reduced to ~ 89, where it recovered by 0.3 % to ~
90 and remained at this intensity for the duration of the test (1 minute). The fluorescence
intensity of control ROI stayed constant over the duration of the experiment.

197
Figure 103: Representative FRAP images of porcine GAG depleted condylar cartilage injected with fluorescein-tagged peptide-doped P11-8: GAG. Red lines/circles highlight the
ROIs that were bleached in each sample and the green lines/circles highlight the ROIs that were used as control areas in each sample. (A) Image of a GAG depleted condylar
cartilage sample injected with fluorescein-tagged peptide-doped P11-8: GAG prior to bleaching (t=1 s), (B) Image of a GAG depleted condylar cartilage sample injected with
fluorescein-tagged peptide-doped P11-8: GAG straight after bleaching (t=6 s), (C) Image of a GAG depleted condylar cartilage sample injected with fluorescein-tagged peptide-doped
P11-8: GAG after recovery (t=60 s). (D) GAG depleted condylar cartilage injected with fluorescein-tagged peptide-doped P11-8: GAG, imaged with a fluorescein filter compared to
(E) the same sample imaged in transmitted light. (F) Recovery curve for a GAG depleted condylar cartilage sample injected with fluorescein-tagged peptide-doped P11-8: GAG,
which revealed no recovery in the bleached area. All images were captured from sections of medial condyles.
Images of GAG depleted condylar cartilage injected with fluorescein-tagged peptide-doped
P11-8 on its own, are presented in Figure 104. Figure 104 (A) to (D) show the injection sites of
GAG depleted cartilage that was injected with fluorescein-tagged peptide-doped P11-8. The
bleached ROI outlined by the red circle in Figure 104 (B) was much darker, when compared
to the same ROI in Figure 104 (A), where the GAG depleted cartilage sample had not been
bleached. GAG depleted cartilage samples injected with fluorescein-tagged peptide-doped
P11-8 on its own, demonstrated no fluorescence recovery, which was confirmed by the
recovery curve in Figure 104 (F). The starting fluorescent intensity for the bleached ROI and
the control ROI was ~ 80 and ~ 82, respectively. After bleaching (t=6 s), the fluorescent
intensity of the bleached ROI as reduced to ~ 58, subsequently no fluorescence recovery was
0
50
100
150
0 0.5 1
Inte
nsi
tyTime (min)
Bleached Control
(A) (B) (C)
(D) (E) (F)

198
observed for the remainder of the test (1 minute). The fluorescent intensity of the control
ROI stayed constant throughout the test.
Figure 104: Representative FRAP images of porcine GAG depleted condylar cartilage injected with fluorescein-tagged peptide-doped P11-8 only. Red lines/circles highlight ROI
that were bleached in each sample and the green lines/circles highlight ROI that were used as control areas in each sample. (A) Image of a GAG depleted condylar cartilage
sample injected with fluorescein-tagged peptide-doped P11-8 only prior to bleaching (t=1 s), (B) Image of a GAG depleted condylar cartilage sample injected with fluorescein-tagged
peptide-doped immediately after bleaching (t=6 s), (C) Image of a GAG depleted condylar cartilage sample injected with fluorescein-tagged peptide-doped P11-8 only after recovery
(t=60 s). (D) GAG depleted condylar cartilage injected with fluorescein-tagged peptide-doped P11-8 only, imaged with a fluorescent filter compared to (E) the same sample imaged
in transmitted light. (F) Recovery curve for a GAG depleted condylar cartilage sample injected with fluorescein-tagged peptide-doped d P11-8 only, which revealed no recovery in
the bleached area. All images were taken from sections of medial condyles.
6.5.5.3 GAG depleted condylar cartilage injected with fluorescein-tagged CS alone.
Images of GAG depleted condylar cartilage injected with fluorescein-tagged chondroitin
sulfate, are presented in Figure 105. Figure 105 (A) to (D) show the injection sites of GAG
depleted cartilage that was injected with fluorescein-tagged chondroitin sulfate. The green
fluorescence surrounding the injection site was slightly more intense in these particular
samples, which could have been due to the increased mobility of the fluorescein-tagged
chondroitin sulfate without the peptide that allowed it to move more freely throughout the
thickness of the GAG depleted cartilage. The bleached ROI outlined by the red circle in Figure
105 (B) was darker, when compared to the same ROI in Figure 105 (A), in which the GAG
0
50
100
150
0 0.5 1
Inte
nsi
ty
Time (min)
Bleached Control
(A) (B) (C)
(D) (E) (F)

199
depleted cartilage sample had not been bleached. GAG depleted cartilage samples injected
with fluorescein-tagged chondroitin sulfate, demonstrated fluorescence recovery. The initial
fluorescence intensity for the bleached ROI and the control ROI was ~ 137 and ~ 139,
respectively. After bleaching (t=6 s), the fluorescence intensity of the bleached ROI reduced
to ~ 91. However, after 1 minute the sample had recovered by 88 % and after 2 minutes it
had fully recovered to its original fluorescence intensity. This was confirmed by Figure 105
(C), in which the bleached ROI (red circle) was no longer darkened and had returned to its
original shade of green. The fluorescence intensity of the control ROI stayed constant
throughout the test.
Figure 105: Representative FRAP images of porcine GAG depleted condylar cartilage injected with fluorescein-tagged chondroitin sulfate (CS). Red lines/circles highlight the ROIs that were bleached in each sample and the green lines/circles highlight the ROIs that were used as control areas in each sample. (A) Image of a GAG depleted condylar
cartilage sample injected with fluorescein-tagged CS prior to bleaching (t=1 s), (B) Image of a GAG depleted condylar cartilage sample injected with fluorescein-tagged CS straight after
bleaching (t=6 s), (C) Image of a GAG depleted condylar cartilage sample injected with fluorescein-tagged CS after recovery (t=60 s). (D) GAG depleted condylar cartilage injected
with fluorescein-tagged CS, imaged with a fluorescent filter compared to (E) the same sample imaged in transmitted light. (F) Recovery curve for a GAG depleted condylar cartilage sample injected with fluorescein-tagged CS, which revealed recovery in the
bleached area. All images were taken from sections of medial condyles.
0
100
200
0 1 2 3
Inte
nsi
ty
Time (min)
Bleached Control
(A) (B) (C)
(D) (E) (F)

200
6.5.5.4 Native condylar cartilage.
Images of untreated native condylar cartilage after indentation testing, are presented in
Figure 106. Tiled images of native cartilage sections cut perpendicular to the surface of
cartilage, viewed under transmitted light and a fluorescein filter are shown in Figure 106 (A)
and Figure 106 (B), respectively. No fluorescence was observed, in Figure 106 (B), as the
native condylar cartilage had not been exposed or injected with any florescent fluorophore,
prior to viewing it. Figure 106 (C) and (D) are zoomed in images (Mag x 25) of Figure 106 (A)
and (B) which also showed no fluorescence.
Figure 106: Representative images of native porcine condylar cartilage viewed under a fluorescein filter and transmitted light. (A) Tiled image of a native condylar cartilage sample viewed under transmitted light and (B) a fluorescein filter, which showed no
fluorescence. (C) Magnified image (x 25) of a native condylar cartilage sample viewed under transmitted light and (D) a fluorescein filter, which showed no fluorescence. All images
were taken from sections of medial condyles.
6.5.5.5 GAG depleted condylar cartilage.
Images of untreated GAG depleted condylar cartilage after indentation testing, are
presented in Figure 107. Tiled images of a GAG depleted cartilage section cut perpendicular
to the surface of cartilage, viewed under transmitted light and a fluorescein filter are shown
in Figure 107 (A) and Figure 107 (B), respectively. No fluorescence was observed, in Figure
107 (B), as the GAG depleted condylar cartilage had not been exposed or injected with any
florescent fluorophore, prior to viewing it. Figure 107 (C) and (D) are zoomed in images (Mag
x 25) of Figure 107 (A) and (B) which also showed no fluorescence.
(B)
(A)
(D)
(C)
500 µm
500 µm 200 µm
200 µm
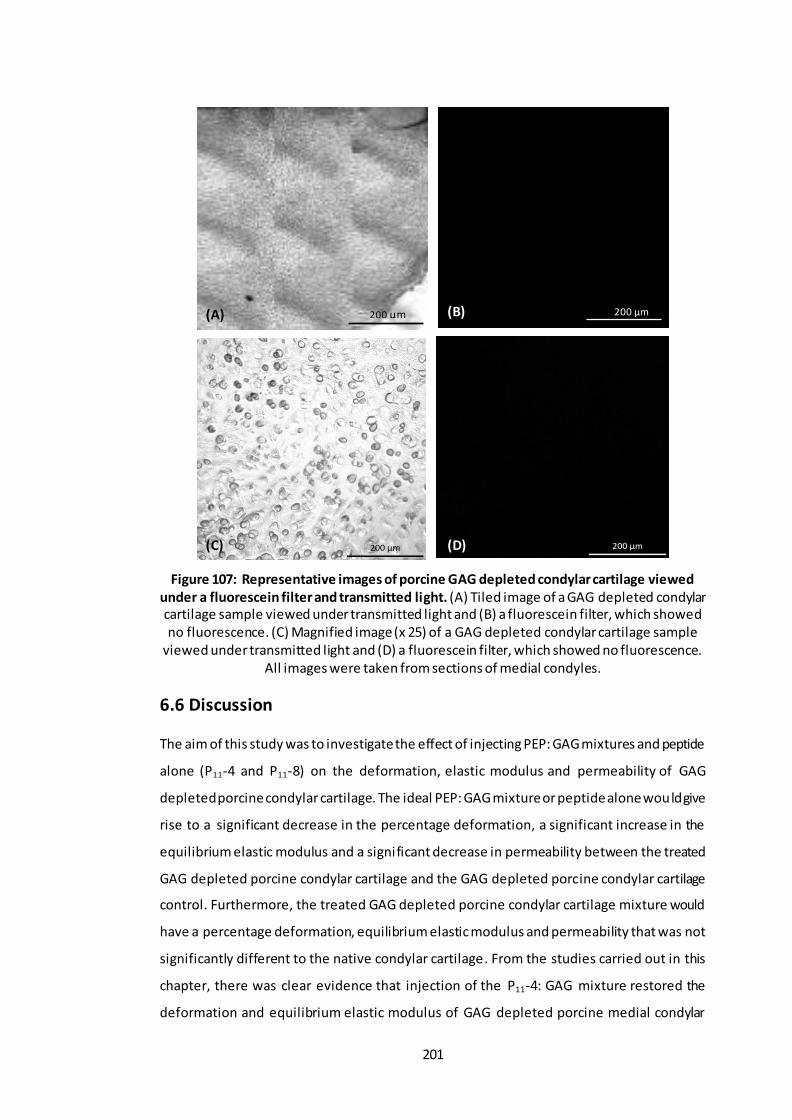
201
Figure 107: Representative images of porcine GAG depleted condylar cartilage viewed under a fluorescein filter and transmitted light. (A) Tiled image of a GAG depleted condylar cartilage sample viewed under transmitted light and (B) a fluorescein filter, which showed no fluorescence. (C) Magnified image (x 25) of a GAG depleted condylar cartilage sample
viewed under transmitted light and (D) a fluorescein filter, which showed no fluorescence. All images were taken from sections of medial condyles.
6.6 Discussion
The aim of this study was to investigate the effect of injecting PEP: GAG mixtures and peptide
alone (P11-4 and P11-8) on the deformation, elastic modulus and permeability of GAG
depleted porcine condylar cartilage. The ideal PEP: GAG mixture or peptide alone would give
rise to a significant decrease in the percentage deformation, a significant increase in the
equilibrium elastic modulus and a significant decrease in permeability between the treated
GAG depleted porcine condylar cartilage and the GAG depleted porcine condylar cartilage
control. Furthermore, the treated GAG depleted porcine condylar cartilage mixture would
have a percentage deformation, equilibrium elastic modulus and permeability that was not
significantly different to the native condylar cartilage. From the studies carried out in this
chapter, there was clear evidence that injection of the P11-4: GAG mixture restored the
deformation and equilibrium elastic modulus of GAG depleted porcine medial condylar
(A) (B)
(C) (D)
200 µm 200 µm

202
cartilage to levels that were not significantly different to those of native porcine medial
condylar cartilage, whilst remaining self-assembled in situ. Injection of the P11-8: GAG
mixture; however, restored the deformation properties of GAG depleted porcine medial
condylar cartilage but not the equilibrium elastic modulus. The P11-8: GAG mixture also
remained self-assembled in situ. Conclusions regarding the difference in the permeability
values could not be drawn, as the permeability values between the native and GAG depleted
porcine condylar cartilage controls were not significantly different.
It was observed that there was no significant difference in the cartilage thicknesses between
any of the medial condylar cartilage tested samples. No significant differences in the
thicknesses of the lateral condylar cartilage was observed in the majority of the groups.
However, the thickness of the native lateral condylar cartilage was significantly greater than
the GAG depleted lateral condylar cartilage injected with: CS only, P 11-8 and the native
condylar cartilage injected with no fluid. The reasons for this are unclear, however it is
possible that this was due to natural biological variation in the cartilage of these particular
porcine cartilage samples. Nonetheless, the porcine condylar cartilage thicknesses measured
in this study (medial: 2.2 - 2.4 mm; lateral: 1.6 – 1.9 mm) showed good agreement with the
ranges reported by Wayne et al. (1998), Fermor (2013) and the previous study carried out in
Chapter 5.
The effect of injecting P11-4: GAG and P11-8: GAG on the biomechanical properties of GAG
depleted condylar cartilage was investigated using indentation testing with a load of 0.31 N,
followed by FE analysis, from which the deformation, equilibrium elastic modulus and
permeability were calculated. Deformation curves for both medial and lateral condyles
showed that the native condylar cartilage exhibited the lowest deformation over a 1 hour
time period, when compared to all other groups. The GAG depleted condylar cartilage
injected with chondroitin sulfate only exhibited the highest deformation. The deformation
behaviour of the native porcine cartilage in this study remained the lowest of all groups and
was similar to the behaviour of native condylar cartilage reported in the literature (Katta et
al., 2008; Katta et al., 2009; Abdelgaied et al., 2015; Fermor et al., 2015), which may have
been due to the presence of GAGs within the tissue. However, the deformation behaviour of
GAG depleted condylar cartilage injected with chondroitin sulfate alone, was somewhat
strange, and it was not easily explained why injection of chondroitin sulfate alone caused the
percentage deformation of the GAG depleted cartilage to increase by such an extent (43.6 %
in the medial and 51 % in the lateral condyles), when compared to the GAG depleted cartilage
control. A possible explanation was the GAG depleted condylar cartilage may have had some
203
GAGs present/remaining (circa 50 g. mg-1; Chapter 4); which were likely not bound in large
aggregated molecules to hyaluronic acid chains as a result of the SDS treatment. The injection
of the highly negatively charged chondroitin sulfate; may have caused repulsion with the
remaining GAG molecules and/or negative cations, which could have contributed to the
increase in percentage deformation observed in both the medial and lateral condylar
cartilage. Similar to the previous study in Chapter 5, the deformation curve for the GAG
depleted porcine condylar cartilage exhibited higher deformation across the 1 hour time
period when compared to the native porcine condylar cartilage for both the medial and
lateral condyles. This was due to the reduced levels of aggregated GAGs in the GAG depleted
cartilage. Only GAGs attached to aggrecan which are linked to hyaluronic acid via a link
protein, contribute to the compressive resistance of cartilage (Muir, 1978; Han et al., 2011).
However, the treatment with SDS to produce the GAG depleted condylar cartilage model,
would have disrupted the link protein interaction with the hyaluronic acid, making any
remaining GAGs much more mobile and hence ineffective, which was why the GAG depleted
condylar cartilage exhibited higher deformation.
The effect of injecting native condylar cartilage with water and the effect of injecting without
any fluid were also investigated. It was found that these treatments did not affect the final
percentage deformation of native condylar cartilage, as no significant difference in the
percentage deformation were observed. Therefore, any effects observed from the GAG
depleted condylar cartilage samples injected with peptide, PEP: GAG or just GAG; were
considered to be due to the treatment with the substances themselves and not due to the
injection process.
Significant differences in the percentage deformation (after it had reached equilibrium, at 1
hour) were found between the GAG depleted porcine medial condylar cartilage and the GAG
depleted porcine medial condylar cartilage injected with P11-4: GAG and P11-8: GAG. Injection
of both PEP: GAG mixtures into medial and lateral GAG depleted condylar cartilage samples
significantly reduced the percentage deformation compared to the GAG depleted condylar
cartilage control. Furthermore, no significant difference in the percentage deformation was
found between the native porcine medial condylar cartilage and the GAG depleted porcine
medial condylar cartilage injected with P11-4: GAG, which was not the case for the GAG
depleted porcine condylar cartilage injected with P11-8: GAG. Therefore, injection of P11-4:
GAG restored the deformation properties of GAG depleted porcine condylar cartilage to a
level that was similar to and not significantly different to native porcine condylar cartilage.

204
The percentage deformation (after 1 hour) of GAG depleted porcine condylar cartilage
injected with P11-4 alone, in the lateral condyles, was significantly higher when compared to
the GAG depleted porcine lateral condylar cartilage control. Whereas, injection of P 11-8 on
its own into GAG depleted porcine condylar cartilage, significantly reduced the percentage
deformation (after 1 hour) of the lateral condyle when compared to the GAG depleted
porcine lateral condylar cartilage control. However, this was not the case in the medial
condyles where no significant effect of treatment with P11-4 or P11-8 alone was observed.
GAG depleted porcine condylar cartilage injected with P11-4: GAG had significantly lower
percentage deformation (after 1 hour) when compared to the GAG depleted porcine
condylar cartilage injected with P11-4 on its own, in both the medial and lateral condyles.
Conversely, no significant difference in the percentage deformation was observed between
the GAG depleted porcine condylar cartilage samples injected with P11-8: GAG and P11-8 on
its own, in either the medial and lateral condyles.
Analysis of the percentage deformation data for both medial and lateral condyles, showed
that injection of the PEP: GAG mixtures into GAG depleted porcine condylar cartilage, was
better at restoring the deformation properties of GAG depleted porcine condylar cartilage
when compared to the peptides on their own. The majority of lateral condyles groups tested,
were shown to have a percentage deformation greater than 15 %, which meant that any
derived data for the equilibrium elastic modulus and permeability would not be accurate and
therefore were excluded from the FE analysis. The higher percentage deformation seen in
the lateral condyles compared to the medial condyles was assumed to be due to differences
in thicknesses between the medial and lateral condyles.
An axisymmetric poroelastic FE model (described in Chapter 5), was used to curve fit the
experimental deformation data to determine the effect that injecting P11-4: GAG, P11-4 only;
P11-8: GAG and P11-8 only, had on the equilibrium elastic modulus and permeability of GAG
depleted porcine condylar cartilage.
The equilibrium elastic modulus was significantly greater in the native cartilage samples
when compared to all the other groups, with the exception of the GAG depleted porcine
condylar cartilage samples injected with P11-4: GAG. The finding that injection of P11-4: GAG
was able to restore the equilibrium elastic modulus of GAG depleted medial condylar
cartilage to a level similar to that of native cartilage, indicated that this PEP: GAG mixture
had the desired effect of restoring the biomechanical properties of GAG depleted porcine
medial condylar cartilage. On the other hand, injection of GAG depleted condylar cartilage
with P11-4 peptide on its own, significantly lowered the equilibrium elastic modulus when

205
compared to the GAG depleted porcine condylar cartilage control. It was therefore
concluded that the GAGs in the P11-4: GAG mixture contributed to improving the compressive
stiffness of the GAG depleted medial condylar cartilage, possibly by improving the gelation
properties of the peptide but also by providing increased osmotic swelling pressure.
Injection of the GAG depleted porcine medial condylar cartilage with P 11-8: GAG also
significantly increased the elastic modulus of the GAG depleted porcine condylar cartilage.
However, P11-8: GAG was not able to restore the compressive stiffness of the GAG depleted
porcine condylar cartilage to the same or similar level as the native porcine condylar
cartilage. The average equilibrium elastic modulus of the P11-4: GAG injected GAG depleted
condylar cartilage had a trend towards higher compressive stiffness than the samples
injected with P11-8: GAG, although this was not significantly different. This trend could have
been due to the net charge difference of these two peptides. P11-4 is negatively charged and
P11-8 is positively charged. The combination of these peptides with a highly negatively
charged GAG, chondroitin sulfate, could explain the difference seen in the compressive
stiffness of GAG depleted condylar cartilage. The combination of two negatively charged
substances (P11-4 and CS) could have caused high repulsive forces between the two
substances, hence contributing to the increase in compressive stiffness of the GAG depleted
condylar cartilage. This highly negatively charged PEP: GAG hydrogel could also have
interacted electrostatically with the naturally occurring ions present within the GAG depleted
condylar cartilage model. These ions were replaced in the GAG depleted model, at the end
of its GAG depletion process (Chapter 4; Section 4.3.3)); where they had been left to soak in
a 130 mM Na+ salt solution, containing all essential salts present in native cartilage, as
described by Urban (1994)). This interaction with the surrounding cations and anions, may
have provided the GAG depleted condylar cartilage injected with P11-4: GAG with resistance
to compression, by increasing the fluid phase load support that would be very low in cartilage
with GAGs depleted. It may be hypothesised that the P11-4: GAG hydrogel acted as a better
damper, during the fluid phase load support of the GAG depleted condylar cartilage by
retaining excess water within the cartilage tissue matrix; which is why its average equilibrium
elastic modulus, hence compressive stiffness was higher.
It was hypothesised that, due to the removal of GAGs from the GAG depleted condylar
cartilage, the permeability of the GAG depleted porcine condylar cartilage control would be
significantly higher than native cartilage. Similarly, as explained in Chapter 5, this was not
supported by the data obtained and no significant differences in the permeability between
any of the groups tested in this study was observed.

206
The relationship between the equilibrium elastic modulus and permeability values in this
study was that the higher the equilibrium elastic modulus, the lower the permeability value.
This can be explained by the cartilages ability to resist compressive forces. In native condylar
cartilage, which has all of its matrix components, the flow of intestinal fluid flow through the
matrix is restricted and controlled, hence it is less permeable to fluid and better able to
withstand compressive loads. However, cartilage in which the micro and macro structure has
been altered/removed, no longer has the ability to restrict or control the flow of interstitial
fluid, hence is more permeable and less able to resist compressive forces (Maroudas et al.,
1968; Maroudas et al., 1973; Maroudas and Venn, 1977; Muir, 1978; Buckwalter et al., 2005;
Franke et al., 2007; Wilson et al., 2007 ; Han et al., 2011).
It was important to determine whether the peptides and peptide GAG mixtures injected into
the GAG depleted condylar cartilage samples were self-assembled. In order to explore this,
FRAP analysis was used. The FRAP images captured over the duration of 1 minute and the
recovery curves, showed that the peptide and PEP: GAG mixtures remained self-assembled
in-situ, even after the cartilage samples had been indented with a load of 0.31 N. All the GAG
depleted condylar cartilage samples injected with peptide alone (P11-4 and P11-8) and PEP:
GAG mixtures (P11-4: GAG and P11-8: GAG) that had been bleached; demonstrated no
significant fluorescence recovery in the bleached ROI. The final images captured in the FRAP
experiments (t = 60 s) for samples injected with peptide and PEP: GAG mixtures, showed that
the bleached ROI remained darker than the image pre-bleach (t=0 s). Hence, the fluorophore
was not able to diffuse back from the non-bleached areas into the bleached areas, as the
fluorophore had been trapped within the self-assembled peptide or PEP: GAG gels. These
experiments confirmed that the fluorescently tagged peptides and PEP: GAG mixtures were
able to remain self-assembled within the cartilage tissue.
Bleached fluorophore molecules, that are not restricted and are able to move freely, are
replaced by non-bleached fluorophore molecules over time, resulting in a recovery in
fluorescent intensity of the bleached ROI, visualised in the recovery curve (Swift and Trinkle-
Mulcahy, 2004). The GAG depleted porcine condylar cartilage injected with the CS doped
fluorescein, demonstrated such behaviour. When the ROI in this sample was bleached at t=6
seconds, the fluorophore’s fluorescence intensity became much lower (darker) than the pre-
bleached ROI (t=0 seconds). However, the fluorescence intensity of the bleached ROI fully
recovered after t=60 seconds, which highlighted the high mobility of the fluorescein-tagged
CS within the cartilage sample. The fast recovery of the fluorescence intensity seen in
207
samples injected with fluorescein-tagged CS, supported the conclusions that the samples
injected with fluorescently tagged peptide and PEP: GAG, remained self-assembled in-situ.
Native and GAG depleted porcine condylar cartilage controls were also imaged under the
same fluorescein filter as well as transmitted light. This was carried out to demonstrate that
the fluorescence seen in the GAG depleted condylar cartilage injected with fluorescein-
tagged peptides P11-4: GAG, P11-4 only, P11-8: GAG and P11-8 only; could be solely attributed
to the fluorescence from the fluorescein used to tag the peptide and PEP: GAG mixtures and
not any auto-fluorescence that may have been present in the cartilage samples. The images
of the native and GAG depleted condylar cartilage controls, showed no fluorescence under
the fluorescein filter, confirming the validity of the data.
6.7 Conclusion
The successful delivery of P11-4 and P11-8 peptides and PEP: GAG mixtures into GAG depleted
condylar cartilage was demonstrated in this study. It was also shown that the minimally
invasive injection of a PEP: GAG mixture comprising P11-4 was able to restore the
biomechanical properties of GAG depleted porcine condylar cartilage. All peptide and PEP:
GAG mixtures injected remained self-assembled within the GAG depleted condylar cartilage,
even after a load of 0.31 N was applied; which was indicative of the strength of the gels but
also, the possible favourable interactions between the gels and surrounding cartilage matrix
that allowed the peptide hydrogels to remain self-assembled. It was further demonstrated
that the chondroitin sulfate GAG had an important role to play in the restoration of the
biomechanical properties of the GAG depleted condylar cartilage. This was attributed to its
highly negative charge and ability to regulate the osmotic pressure within the cartilage
matrix. It is hypothesised that the restoration of GAGs, being held in place by the self-
assembled P11-4 peptide: GAG hydrogel within the GAG depleted condylar cartilage, was key
to the improved compressive stiffness. It is important to note that the molar ratio of GAG
chosen in this study was low (1:64). Therefore, it is hypothesised that these improvements
could be amplified through the delivery of a higher GAG molar ratio (e.g. 1:16). Nevertheless,
the data obtained in this study indicated that the P11-4: GAG mixture, could be a suitable
candidate for the future treatment of early stage osteoarthritic cartilage.

208
Chapter 7 Conclusions and Future Studies
The net depletion of glycosaminoglycan in osteoarthritic cartilage has been linked with a loss
of biomechanical properties and function in vitro (Mankin and Lippiell, 1971; Otsuki et al.,
2008) and is considered to be a major contributor to the progression of OA (Bell et al., 2006).
Katta et al., proposed an approach to repair early cartilage degeneration by restoring GAG
levels in order to maintain the functional cartilage material properties. Chondroitin sulfate
alone was, however not able to restore the biomechanical properties of GAG deficient
articular cartilage (Katta, 2007). The aim of this study was to explore the use of a mixture of
chondroitin sulfate and self-assembling peptides for the restoration of the biomechanical
properties of GAG depleted cartilage; ideally to a level intrinsic to natural cartilage. It was
hypothesised, that the combination of SAPs and GAGs, would improve the biomechanical
properties of GAG depleted cartilage via the successful delivery and retention of the GAG
molecules by the self-assembled peptide to the tissue.
The study followed a systematic approach in which the self-assembly, fibril morphology and
biomechcanical properties of different peptides and PEP: GAG mixtures were explored
(Chapter 3), to select suitable candidates for further biological studies. A suitable in vitro GAG
depleted porcine cartilage model for testing the selected peptides and PEP: GAG mixtures
was then developed (Chapter 4), followed by the development of a method for
biomechanical evaluation of this model (Chapter 5). Lastly, the injection of the peptides and
PEP: GAG mixtures into GAG depleted porcine condylar cartilage was evaluated, through
mechanical indentation testing and FEA analysis, in an attempt to restore the biomechanical
properties (Chapter 6).
7.1 Major conclusions
In Chapter 3, three peptides (P11-4, P11-8 and P11-12) were studied at two different GAG molar
ratios (1:16 and 1:64) as well as in two ionic salt solutions (130mM and 230mM Na+ salt
solution). The salt solutions each contained a different concentration of Na+ ions, as well as
other salts found in cartilage tissue (Aggeli et al., 1997), which had not been previously
studied with these peptides. This novel experimental design, gave insight regarding how the
peptides and peptide: GAG mixutres would behave not only under normal physiological
conditions, but also within the environment of the surface layer of articular cartilage. The
FTIR and TEM studies identified that P11-4 and P11-8 peptides: along with their peptide: GAG
mixtures; exhibited a high percentage of β-sheet formation. It was also shown that they were

209
able to form characteristic self-supporting gels, able to produce characteristic entangled
fibrilar network morphology, similar to that of proteoglycan structures found in native
cartilage (Hardingham and Muir, 1974; Poole, 1997; Mow and Ateshian, 1997). In addition,
rheological studies revealed that the addition of chondroitin sulfate to the SAPS; as well as
alteration in the ionic strength of the surrounding solution, allowed for the mechanical
properties of the peptide-hydrogels to be tuned over a range of up to four orders of
magnitude. Addition of chondroitin sulfate to the peptides promoted a greater number of
fibrilar entanglements and junction points, rendering the P11-4 and P11-8 peptide-GAG
mixtures the stiffest of the three peptides. The study identified that the P11-4 and P11-8
peptide-GAG mixtures, demonstrated all the favourable characteristics of hydrogels with
potential ability to restore the biomechanical properties of GAG depleted cartilage.
A GAG depleted model of porcine femoral condylar cartilage was successfully developed in
Chapter 4. Histological analysis and GAG quantification highlighted that the use of the
chondroitinase ABC enzyme, painted onto the surface of porcine condylar cartilage produced
a mild GAG depleted cartilage model (model 1). Injection of chondroitinase ABC into porcine
condylar cartilage produced a moderate GAG depleted cartilage model (model 2). Washes in
low concentrations of SDS (0.1 % (w/v)) alongside PBS washes, was shown to produce a
severe GAG depleted cartilage model (model 3), in which a 75% reduction in GAG content of
the cartilage was observed, when compared to native cartilage. The development of these
models was novel and the models could be used to represent different stages of cartilage
degeneration in future studies. Model 3 was chosen as the most suitable model to take
forward for assessment of the effects of PEP: GAG mixtures, based on its low GAG content.
In Chapter 5, the focus was to develop an appropriate methodology for the indentation
testing of cartilage, to study differences in the biomechanical properties between native and
GAG depleted porcine condylar cartilage. The aim was to achieve a test method that gave
significant differences in the percentage deformation, equilibrium elastic modulus and
permeability between native and GAG depleted porcine condylar cartilages. The latter was
important because the intention was to inject SAPs and SAP: GAG mixtures into the GAG
depleted cartilage, to investigate the capacity of these injectable hydrogels to restore the
biomechanical properties of the GAG depleted cartilage, to values that were similar to native
porcine condylar cartilage. This study was unique, since previous indentation tests had only
been performed on porcine condylar cartilage pins (Katta et al., 2007; Katta et al., 2008;
Abdelgaied et al., 2015). The present study was undertaken on whole porcine femoral
condyles, both medial and lateral, to avoid any cut surfaces to the cartilage into which the

210
SAP: GAGs were to be injected. Injection of the peptides and peptide: GAG mixtures into
cartilage in which the collagen had been damaged by cutting; would likely have resulted in
leakage from the cut surfaces prior to self-assembly. Of the three loads tested, significant
differences in the deformation and equilibrium elastic modulus between the native and GAG
depleted porcine condylar cartilage were achieved using 0.11N and 0.31N loads. However,
the use of a 0.31 N load resulted in the greatest significant difference in the deformation
between native and GAG depleted porcine cartilage models. Consequently, this load was
used for future studies of the SAP: GAG mixtures, to assess their potential in restoring the
biomechanical properties of GAG depleted condylar cartilage.
In Chapter 6, the aim was to evaluate whether the peptides P11-4 and P11-8 and their PEP:
GAG mixtures at a molar ratio of 1:64, were able to restore the biomechanical properties of
GAG depleted condylar cartilage. The peptides and peptide: GAG mixtures were successfully
delivered into GAG depleted porcine condylar cartilage as visualised and confirmed by FRAP
analysis. No fluorescence recovery after bleaching was observed in either the peptide or PEP:
GAG injected samples, confirming the successful self -assembly of the SAPs. Histological
analysis and GAG quantification techniques were not performed to assess whether the GAG
had been successfully retained within the cartilage due to time constraints. However, the
biomechanical test data indirectly indicated that the GAG delivered together with the
peptides was retained. FRAP analysis of fluorescein-tagged chondroitin sulfate (GAG)
injected samples, showed that the GAG alone was not retained at the injection sites within
the cartilage and that it also reduced the deformation properties of GAG depleted porcine
condylar cartilage.
Interestingly, a recent study by Miles et al., demonstrated that injection of P11-12: GAG
hydrogels restored the biomechanical properties of denucleated bovine intervertebral discs
(Miles et al., 2016). The authors commented on the ability of the GAGs to enhance the
biomechanical properties of the hybrid gels by accelerating gelation kinetics and providing
favourable thermodynamic conditions for self-assembly, which supported the findings of the
present study. The indentation tests performed in this study, showed that injections of P11-
4: GAG restored the deformation properties and equilibrium elastic modulus of GAG
depleted porcine condylar cartilage, to levels that were not significantly different to those of
native porcine condylar cartilage.

211
7.2 Future studies
Although the aims of the studies performed in this thesis were largely met, further work is
required to gain a greater understanding of these novel peptide: GAG hydrogels, as a
potential minimally invasive therapy for the repair of osteoarthritic cartilage. Further testing
of higher GAG molar ratio combinations and additional models for testing the peptide: GAG
hydrogels are desirable.
7.2.1 Histological and GAG quantification of PEP: GAG treated cartilage.
Histological analysis and GAG quantification techniques were not performed to assess
whether the GAG had been successfully retained within the cartilage, due to time
constraints. Therefore, additional histological imaging and GAG quantification of: GAG
depleted condylar cartilage injected with PEP: GAG mixtures; GAG depleted condylar
cartilage (negative control); native condylar cartilage (positive control) and GAG depleted
condylar cartilage injected with chondroitin sulfate alone would be beneficial. These studies
would determine whether: (a) the GAG had been successfully retained within the cartilage
and where it was localised; and (b) if the net GAG content of the GAG depleted condylar
cartilage injected with PEP: GAG mixtures and/or chondroitin sulfate alone, had increased.
The data could then be compared to the native and GAG depleted condylar cartilage controls.
7.2.2 Testing of mild and moderate GAG depleted porcine cartilage
models.
In Chapter 4, three different GAG depleted porcine condylar cartilage models were
developed which showed varying levels of GAG content. These models provide potential
models of earlier stages of osteoarthritis, that could be used to test future cartilage repair
methods. However, due to time constraints it was not possible to determine the effects of
the SAP: GAG mixtures on the biomechanical properties of the mild and moderate GAG
depleted porcine condylar cartilage (models 1 and 2). It would be useful to determine the
efficacy of the PEP: GAG mixtures in restoring the biomechanical properties of these mild
and moderate GAG depleted models, representative of different stages of osteoarthritic
cartilage degeneration.
7.2.3 Testing of higher GAG molar ratio of PEP: GAG mixtures – 1:16
The lower molar ratio of GAG (1:64) was used in the PEP: GAG mixtures studied in Chapter 6
to evaluate the initial hypothesis. It was the intention to carry out further studies of PEP:
GAG mixtures with a higher molar ratio of chondroitin sulfate, however, this was not possible

212
due to time constraints. Given the improvements in the biomechanical properties of GAG
depleted porcine condylar cartilage observed with the lower GAG molar ratio; it might be
hypothesised that because of the role of the GAGs in the improved gelation kinetics and
biomechanical properties of the SAP: GAG hydrogels; these improvements could be
amplified through the delivery of a higher GAG molar ratio (e.g. 1:16). This could be tested
in further studies using the methods developed in this thesis.
7.2.4 Development of friction test to study the bio-tribological properties
of the PEP: GAG mixtures.
Regrettably, the development of an appropriate methodology for studying the
biotribological properties of native and GAG depleted condylar cartilage was not undertaken.
It has been reported in the literature that the coefficient of friction of cartilage increases with
GAG depletion (Katta et al., 2008), which is likely due to reduced biphasic and boundary
lubrication (Forster and Fisher, 1996; Mow and Ateshian, 1997). A study at the University of
Leeds, carried out frictional tests using a pendulum friction simulator. The study showed
elevated friction and wear of the medial compartmental bovine knee without a meniscus,
when compared to the intact joint (McCann et al., 2009). Therefore, additional frictional test
like the latter, which identify any difference in the frictional properties between GAG
depleted and native condylar cartilages would have been beneficial. This in turn would,
evaluate whether or not the SAP: GAG mixtures contributed to improvement in the biphasic
and boundary lubrication regimes in GAG depleted condylar cartilage.
7.2.5 Use of natural whole joint GAG depleted models in knee simulator to
investigate the effects of PEP: GAG mixtures on function.
Recent work at the University of Leeds, has led to the development and validation of a
natural whole joint knee simulator. The tribological function and biomechanical properties
of the natural porcine knee joint has been successfully evaluated using this simulator; which
is currently being adapted for evaluation of natural human knee joints (Liu et al., 2015). The
significance of this study is that this natural knee joint simulation model could be used as a
tool to assess the future novel early stage cartilage and meniscus repair interventions.
Therefore, future studies should aim to evaluate the tribological and biomechanical function
of native, GAG depleted and GAG depleted porcine femoral cartilage treated with the PEP:
GAG mixtures. Moreover, once adapted for use with human knee joints, the whole knee joint
simulation model could be used to determine the efficacy of the PEP: GAG mixtures in
restoring the biomechanical properties of human osteoarthritic cartilage.

213
7.2.6 Leakage study to the asses the stability of the PEP: GAG gel over a
prolonged time period.
The reversible properties of the P11-X family of SAPs, is due to changes in the equilibrium
environment, which has been reported in the literature (Aggeli et al., 2003; Carrick et al.,
2007). These properties could cause the breakdown of the self-assembled hydrogels into
monomeric components, thus, leading to the leakage of GAGs into the surrounding tissue.
Hence, following injection of PEP: GAG mixtures into GAG depleted cartilage the
biomechanical properties of the SAP: GAG treated GAG depleted cartilage may decrease over
time. Therefore, it would be important to undertake a study to determine whether the GAG
was lost from the PEP: GAG treated cartilage over time. This could be carried out in whole
joint models, preferably under cyclic loading. The study should investigate GAG leakage into
the surrounding lubricant, at different time points during and after friction and
biomechanical tests. The study will show the ability of the SAP: GAG mixtures to retain the
GAG within the GAG depleted cartilage under physiological conditions. Similarly,
fluorescently labelled SAPs could be used to calculate the concentration of SAP leakage
during these studies.
7.3 Potential for Clinical Translation
Self-assembling peptides have been widely used in tissue engine ering and biomedical
applications, as discussed in Chapter (1). Clinical translation of these materials, has been
achieved. The peptide group at the University of Leeds demonstrated the utility of P 11-4 in
enamel remineralisation of human teeth (Kirkham et al., 2007) and then tested the clinical
safety of P11-4 in patients with caries lesions (Brunton et al., 2013). The study showed no
biocompatibility issues nor cytotoxic effects, which was confirmed in other studies (Wilshaw
et al., 2008; Kyle et al., 2010; Maude et al., 2011). The studies of Kirkham et al. (2007) and
Brunton et al. (2013) led to the successful commercialisation of P11-4 for caries treatment by
Credentis in Zurich, Switzerland. Hence, there is good evidence that biomedical applications
of the P11-X series of peptides can be translated for patient benefit. The present study has
highlighted the potential of P11-4: GAG mixtures as a potential minimally invasive injection
for the treatment of early stages of osteoarthritic cartilage. However, substantial barriers
remain that must be overcome to enable successful commercial/clinical translation.

214
7.3.1 Arthroscopic delivery system
Although in this study SAP: GAG mixtures were successfully delivered into GAG depleted
condylar cartilage, efforts should be made to optimise the delivery of this therapeutic
mixture to: (1) attain further diffusion of the SAP: GAG mixture within the cartilage and (2)
cause less damage to the cartilage articular surface. This could be achieved through re -design
of the needle tip used to inject these SAP: GAG mixtures, whereby the needle could have
more than one orifice along the length of the needle. This would improve the area in which
the SAP: GAG mixture was able to diffuse into, following injection. Another solution might be
to investigate different injection entry points into the cartilage to reach the desired
treatment location. Entry from non-loading bearing areas could be a starting point, with
variation in the injection angle to determine the effects on the biomechanical properties of
the treated area, after injection.
7.3.2 Pre-clinical studies in animal models of osteoarthritis.
Following successful pre-clinical laboratory studies in natural whole joint models (Section
7.2.5) it would be necessary to carry out pre-clinical studies in an appropriate large animal
model, such as sheep, to predict the clinical performance of SAP: GAG treatment. Induced
OA models in animals, either through surgical techniques or injection methods; which act to
stimulate intra-articular inflammation, direct matrix damage, or chondrocyte toxicity are
documented in the literature (Teeple et al., 2013; Kuyinu et al., 2016). Injection of the SAP:
GAG mixtures into these large animal induced OA joint models will provide more accurate
representation of the ability of this novel therapy to improve the biomechanical properties
of OA cartilage. This could be evaluated through biotribological and biomechanical tests in
whole joint simulators, following sacrifice of the animals. Subject to acceptable performance
in these studies, the SAP: GAG mixture therapy could be taken forward to pre-market medical
device clinical trials to assess their clinical safety and utility in humans.
7.4 Significance of the study
In conclusion, this study has produced relevant GAG depleted condylar cartilage models
which can be used to evaluate the restorative potential future cartilage repair methods;
whilst highlighting the efficacy of SAP: GAG mixtures in restoration of the biomechanical
properties of GAG depleted cartilage. This study has shown that the use of P11-4 in
combination with chondroitin sulfate has future potential for development as a minimally
invasive treatment for early stage osteoarthritis.

215
References
Abdelgaied, A., Stanley, M., Galfe, M., Berry, H., Ingham, E., and Fisher, J. 2015. Comparison of the biomechanical tensile and compressive properties of decellularised and natural porcine meniscus. Journal ofBiomechanics. 48, pp.1389-96.
Aggeli, A., Bell, M., Boden, N., Keen, J. N., McLeish, T. C. B. et al. 1997. Engineering of peptide b-sheet nanotapes. Journal of Material Chemistry. 7(7), pp.1135-45.
Aggeli, A., Bell, M., Carrick, L. M., Fishwick, C. W., Harding, R. et al. 2003. pH as a trigger of peptide beta-sheet self-assembly and reversible switching between nematic and isotropic phases. J Am Chem Soc. 125(32), pp.9619-9628.
Aggeli, A., Nyrkova, I. A., Bell, M., Harding, R., Carrick, L. et al. 2001. Hierarchical self -assembly of chiral rod-like molecules as a model for peptide beta-sheet tapes, ribbons, fibrils, and fibers. Proc Natl Acad Sci USA. 98(21), pp.11857-62.
Aggelli, A. 2000. Lecture 8: 1D Self Assembly of peptides into β-sheet tapes. Leeds: Universtiy of Leeds.
Akizuki, S., Mow, V. C., Muller, F., Pita, J. C., and Howell, D. S. 1987. Tensile properties of human knee joint cartilage. II. Correlations between weight bearing and tissue pathology and the kinetics of swelling. J Orthop Res. 5(2), pp.173 – 86.
Akizuki, S., Mow, V. C., Muller, F., Pita, J. C., Howell, D. S., and Manicourt, D. H. 1986. Tensile properties of human knee joint cartilage: I. Influence of ionic conditions, weight bearing, and fibrillation on the tensile modulu. Journal of Orthopeadic Research. 4(4), pp.379-92.
Alberts, B., Bray, D., Lewis, J., Raff, M., Roberts, K., and Watson, J. 1994. Molecular Biology of the cell. United States: Taylor & Francis.
Alberts, B., Bray, D., Lewis, J., Raff, M., Roberts, K., and Watson, J. D. 2002. The Extracellular Matrix of Animals: After Secretion, Fibrillar Procollagen Molecules Are Cleaved to Collagen Molecules, Which Assemble into Fibrils. In: Molecular biology of the cell (4th edition), New York: Garland Science Publishing.
Albrecht, C., Tichy, B., Nürnberger, S., Hosiner, S., Zak, L., Aldrian, S., and Marlovits, S. 2011. Gene expression and cell differentiation in matrix-associated chondrocyte transplantation grafts: a comparative study. Osteoarthritis and Cartilage. 19(10), pp.1219-1227.
Alcaraz, M. J., Megías, J., García-Arnandis, I., Clérigues, V., and Guillén, M. I. 2010. New molecular targets for the treatment of osteoarthritis. Biochem Pharmacol. 80(1), pp.13-21.
Almeida, H. V., Eswaramoorthy, R., Cunniffe, G. M., Buckley, C. T., O’Brien, F. J., and Kelly, D. J. 2016. Fibrin hydrogels functionalized with cartilage extracellular matrix and incorporating freshly isolated stromal cells as an injectable for cartilage regeneration. Acta Biomaterialia. 36, pp.55-62.
Alsalameh, S., Mollenhauer, J., Hain, N., Stock, K. P., Kalden, J. R., and Burmester, G. R. 1990. Cellular immune response toward human articular chondrocytes. T cell reactivities against chondrocyte and fibroblast membranes in destructive joint diseases. Arthritis Rheum. 33(10), pp.1477-1486.
Altman, R. D., Akermark, C., Beaulieu, A. D., and Schnitzer, T. 2004. Efficacy and safety of a single intra-articular injection of non-animal stabilized hyaluronic acid (NASHA) in patients with osteoarthritis of the knee. Osteoarthritis Cartilage. 12(8), pp.642-649.

216
Altman, R. D., Hochberg, M., Murphy, W. A. Jr., Wolfe, F., and Lequesne, M. 1995. Atlas of individual radiographic features in osteoarthritis. Osteoarthritis Cartilage. 3(A), pp.3-70.
Anderson, C. E., Ludowieg, J., Harper, H. A., and Engleman, E. P. 1964. The Composition of the organic component of human articular cartilage: relationship to age and degenerative joint disease. J Bone Joint Surg Am. 46(6), pp.1176–1183.
Andriacchi, T. P. 1994. Dynamics of knee malalignment [Review]. Orthop Clin North Am. 25(3), pp.395-403.
Andriacchi, T. P., Koo, S., and Scanlan, S. F. 2009. Gait mechanics influence healthy cartilage morphology and osteoarthritis of the knee. J Bone Joint Surg Am. 91(Suppl 1), pp.95-101.
Anika Therapeutics. Hyalograft C Autograft. [online]. Available from World Wide Web: <http://www.anikatherapeutics.com/products/jointhealth/hyalograft.html>
Arand, M., Friedberg, T., and Oesch, F. 1992. Colorimetric quantitation of trace amounts of sodium lauryl sulfate in the presence of nucleic acids and proteins. Analytical Biochemistry. 207, pp.73-75.
Arden, N. and Nevitt, M. C. 2006. Osteoarthritis: Epidemiology. Best Pract Res Clin Rheumatol. 20(1), pp.3-25.
Arrondo, J. L. R., Muga, A., Castresana, J., and Goni, F. M. 1993. Quantitaive studies of the structure of proteins in solution by Fourirt transform infrared spectroscopy. Progress in Biophysics and Molecular Biology. 59, pp.23-56.
Arthritis Research UK. 2013. Osteoarthritis in General Practise: Data and perspectives. Chesterfield: Arthritis Research UK.
Ashkavand, Z., Malekinejad, H., and Vishwanath, B. S. 2013. The pathophysiology of osteoarthritis. J Pharma Res. 7(1), pp.132-138.
Ateshian, G. A. 1997. A theoretical formulation for boundary firction in articular cartilage. J Biomech Eng. 119(1), pp.81-6.
Ateshian, G. A., Lai, W. M., Zhu, W. B., and Mow, V. C. 1994. An asymptotic solution for the contact of two biphasic cartilage layers. J. Biomechanics. 27(11), pp.1347-1360.
Ateshian, G. A., Soltz, M. A., Mauck, R. L., Basalo, I. M., Hung, C. T., and Lai, W. M. 2003. The role of osmotic pressure and tension-compression nonlinearity in the frictional response of articular cartilage. Transport in Porous Media. 50(1), pp.5-33.
Ateshian, G. A. and Wang, H. 1997. Rolling resistance of articular cartilage due to interstitial fluid flow. Proc Inst Mech Eng H. 211(5), pp.419– 24.
Athanasiou, K. A., Agarwal, A., and Dzida, F. J. 1994. Comparative study of the intrinsic mechanical properties of the human acetabular and femoral head cartilage. J Orthop Res. 12(3), pp.340-9.
Athanasiou, K., Darling, E. M., and Hu, J. C. 2009. Articular Cartilage Tissue Engineering. Morgan & Claypool.
Athanasiou, K., Rosenwasser, M., Buckwalter, J., Malinin, T., and Mow, V. 1991. Interspecies Comparisons of in situ Intrinsic Mechanical Properties of Distal Femoral Cartilage. Journal of Orthopeadic Research. 9, pp.330-340.
Atkinson, H.D.E. 2017. The negatives of knee replacement surgery: complications and the dissatisfied patient. Orthopaedics and Trauma. 31(1), pp.25-33.

217
Axelrod, D., Koppel, D.E., Schlessinger, J., Elson, E., and Webb, W.W. 1976. Mobility measurement by analysis of fluorescence photobleaching recovery kinetics. Biophys. J. 16, pp.1055-1069.
Ayral, X., Pickering, E. H., woodworth, T. G., Mackillop, N., and Dougados, M. 2005. Synovitis a potential predictive factor of structural progression of medial tibiofemoral knee osteoarthritis - results of a 1 year longitudinal arthroscopic study in 422 patients. Osteoarthritis Cartilage. 13(5), pp.361-67.
Bach, V. L. J. and Hunter, D. J. 2014. The epidemiology of osteoarthritis. Best Practice & Research Clinical Rheumatology. 28(1), pp.5-15.
Balakrishnan, B., Joshi, N., Jayakrishnan, A., and Banerjee, R. 2014. Self -crosslinked oxidized alginate/gelatin hydrogel as injectable, adhesive biomimetic scaffolds for cartilage regeneration. Acta Biomaterialia. 10, pp.3650-3663.
Barnes, H. A. 2000. A handbook of elementary rheology. Aberystwyth: The University of Wales, Institute of Non-Newtonian Fluid Mechanics, Department of Mathematics.
Barnes Baili. 2011. Histo Connective Tissue 2. [online]. Available from World Wide Web: <http://www.studyblue.com/notes/note/n/histo-connective-tissue-2/deck/995003>
Barth, A. 2000. The infrared absorption of amino acid side chains. Progress in Biophysics & Molecular Biology. 74, pp.141-173.
Barth, A. 2007. Infrared spectroscopy of proteins. Biochimica et Biophysica Acta (BBA) - Bioenergetics. 1767(9), pp.1073-1101.
Bartlett, W., Skinner, J. A., Gooding, C. R., Carrington, R. W., Flanagan, A. M., Briggs, T. W., and Bentley, G. 2005. Autologous chondrocyte implantation versus matrix -induced autologous chondrocyte implantation for osteochondral defects of the knee: a prospective, randomised study. J Bone Joint Surg Br. 87(5), pp.640-645.
Basalo, I. M., Mauck, R. L., Kelly, T.-A. N., Nicoll, S. B., Chen, F. H., Hung, C. T., and Ateshian, G. A. 2004. Cartilage interstitial fluid load support in unconfined compression following enzymatic digestion. J. Biomech. Engng. 126(6), pp.779-786.
Basalo, I. M., Raj, D., Krishnan, R., Chen, F. H., Hung, C. T., and Ateshian, G. A. 2005. Effects of enzymatic degradation on the frictional response of articular cartilage in stress relaxation. J. Biomechanics. 38(6), pp.1343-1349.
Bassani, R. and Piccigallo, B. 1992. Hydrostatic Lubrication. Italy: Elsevier Science.
Bastard, J. P., Jardel, C., Bruckert, E., Blondy, P., Capeau, J. et al. 2008. Elevated levels of interleukin 6 are reduced in serum and subcutaneous adipose tissue of obese women after weight loss. J Clin Endocrinol Metab. 85(9), pp.3338-42.
Bayliss, M. T., Osborne, D., Woodhouse, S., and Davidson, C. 1999. Sulfation of Chondroitin Sulfate in Human Articular Cartilage: the effect of age, topographical position and zone of cartialge on tissue composition. J Biol Chem. 274(22), pp.15892-15900.
Beane, O. S. and Darling, E. M. 2012. Isolation, Characterization, and Differentiation of Stem Cells for Cartilage Regeneration. Annals of Biomedical Engineering. 40(10), pp.2079-2097.
Bell, C. J., Carrick, L. M., Katta, J., Jin, Z., Ingham, E. et al. 2006. Self-assembling peptides as injectable lubricants for osteoarthritis. J Biomed Mater Res A. 78(2), pp.236-46.
Bell, C. J., Ingham, E., and Fisher, J. 2006. Influence of hyaluronic acid on the time dependent friction response of articular cartilage under different conditions. Proc Inst Mech Eng H. 220(1), pp.23-31.

218
Benito, M. J., Veale, D. J., FitzGerald, O., Van den Berg, W. B., and Bresnihan, B. 2005. Synovial tissue inflammation in early and late osteoarthritis. Ann Rheum Dis. 64(9), pp.1263-67.
Bentley, G., Biant, L. C., Carrington, R. W. J., Akmal, M., Goldberg, A. et al. 2003. A prospective, randomised comparison of autologous chondrocyte implantation versus mosaicplasty for osteochondral defects in the knee. J Bone Joint Surg Br. 85(2), pp.223-30.
Bentley, G., Biant, L. C., Vijayan, S., Macmull, S., Skinner, J. A., and Carrington, R. W. J. 2012. Minimum ten-year results of a prospective randomised study of autologous chondrocyte implantation versus mosaicplasty for symptomatic articular cartilage lesions of the knee. J Bone Joint Surg Br. 94(4), pp.504-509.
Berenbaum, F. 2013. Osteoarthritis as an inflammatory disease (osteoarthritis is not osteoarthrosis!). Osteoarthritis Cartilage. 21(1), pp.16-21.
Bergschmidt, P., Ellenrieder, M., Bader, R., Kluess, D., Finze, S., Schwemmer, B., and Mittelmeier, W. 2016. Prospective comparative clinical study of ceramic and metallic femoral components for total knee arthroplasty over a five-year follow-up period. The Knee. 23(5), pp.871-876.
Berg, J. M., Tymoczko, J. L., and Stryer, L. 2002. Biochemistry (5th edition). New York: Freeman, W. H.
Bhattacharjee, M., Coburn, J., Centola, M., Murab, S., Barbero, A. et al. 2015. Tissue engineering strategies to study cartilage development, degeneration and regeneration. Advanced Drug Delivery Reviews. 84, pp.107-122.
BioTissue - BIOSEED®-C. [online]. Available from World Wide Web: <http://www.biotissue.de/news/25092016/>
BioTissue - BIOSEED®-C. [online]. Available from World Wide Web: <http://www.biotissue.de/bioseed/patients/bioseed-c/treatment-with-bioseed-c/>
Blom, A. B., van Lent, P. L., Holthuysen, A. E., van der Kraan, P. M., Roth, J., van Rooijen, N., and van den Berg, W. B. 2004. Synovial lining macrophages mediate osteophyte formation during experimental osteoarthritis. Osteoarthritis Cartilage. 12(8), pp.627-35.
Blom, A. B., van Lent, P. L., Libregts, S., Holthuysen, A. E., van der Kraan, P. M., van Rooijen, N., and van den Berg, W. B. 2007. Crucial role of macrophages in matrix metalloproteinase-mediated cartilage destruction during experimental osteoarthritis: involvement of matrix metalloproteinase 3. Arthritis Rheum. 56(1), pp.147-157.
Bluteau, G., Conrozier, T., Mathieu, P., Vignon, E., Herbage, D., and Mallein-Gerin, F. 2001. Matrix metalloproteinase 1, 3, 13 and aggrecanase 1 and 2 are differentially expressed in experimental osteoarthritis. Biochim Biophys Acta. 1526(2), pp.147-58.
Bock, H. C., Michaeli, P., Browned, C., Schultz, W., Kresse, H., Herken, R., and Miosge, N. 2001. The small proteoglycans decorin and biglycan in human articular cartilage of late -stage osteoarthritis. Osteoarthritis Cartilage. 9(7), pp.654-63.
Bonassar, L. J., Grodzinsky, A. J., Srinivasan, A., Davila, S. G., and Trippel, S. B. 2000. Mechanical and physicochemical regulation of the action of insulin-like growth factor-I on articular cartilage. Arch Biochem Biophys. 379(1), pp.57-63.
Bondeson, J., Wainwright, S. D., Lauder, S., Amos, N., and Hughes, C. E. 2006. The role of synovial macrophages and macrophage-produced cytokines in driving aggrecanases, matrix metalloproteinases, and other destructive and inflammatory responses in osteoarthritis. Arthritis Res Ther. 8(6), p.R187.
219
Borrás-Verdera, A., Calcedo-Bernal, V., Ojeda-Levenfeld, J., and Clavel-Sainz, C. 2013. Efficacy and safety of a single intra-articular injection of 2% hyaluronic acid plus mannitol injection in knee osteoarthritis over a 6-month period. Rev Esp Cir Ortop Traumatol. 56(4), pp.274-280.
Boschetti, F., Pennati, G., Gervaso, F., Peretti, G. M., and Dubini, G. 2004. Biomechanical properties of human articular cartilage under compressive loads. Biorheology. 41(3-4), pp.159-66.
Bradley, M. 2007. Curve Fitting in Raman and IR Spectroscopy: Basic Theory of Line Shapes and Applications. Thermo Fisher Scientific.
Branden, C. and Tooze, J. 1999. Introduction to protien structure. New York: Garland Pub.
Brandt, K. D., Myers, S. L., Burr, D., and Albrecht, M. 1991. Osteoarthritic changes in canine articular cartilage, subchondral bone, and synovium fifty-four months after transection of the anterior cruciate ligament. Arthritis Rheum. 34(12), pp.1560-70.
Brinker, M. R. and Miller, M. D. 1999. Fundamentals of orthopaedics. Philadelphia: WB Saunders.
Brittberg, M., Lindahl, A., Nilsson, A., Ohlsson, C., Isaksson, O., and Peterson, L. 1994. Treatment of deep cartilage defects in the knee with autologous chondrocyte transplantation. N Engl J Med. 331(14), pp.889-95.
Brown, T. D. and Shaw, T. D. 1983. In vitro contact stress distributions in the natural human hip. Biomech. 16(6), pp.373-84.
Brunton, P. A., Davies, R. P., Burke, J. L., Smith, A., Aggeli, A., Brookes, S. J., and Kirkham, J. 2013. Treatment of early caries lesions using biomimetic self-assembling peptides - A clinical safety trial. Br Dent J. 215(4), p.E6.
Buckland-Wright, C. 2004. Subchondral bone changes in hand and knee osteoarthritis detected by radiography. Osteoarthritis Cartilage. 12(Suppl A), pp.S10-19.
Buckwalter, J.A., Mankin, H. J., and Grodzinsky, A. J. 2005. Articular Cartilage and Osteoarthritis. Instr Course Lect. 54, pp.465-480.
Bullough, P. G. 2004. The role of joint architecture in the etiology of arthritis. Osteoarthritis Cartilage. 12(Suppl A), pp.S2-9.
Burnett, S., Hart, D. J., Cooper, C., and Spector, T. D. 1994. A Radiographic Atlas of Osteoarthritis. London: Springer.
Burr, D. B. 2004. Anatomy and physiology of the mineralized tissues: role in the pathogenesis of osteoarthrosis. Osteoarthritis Cartialge. 12(Suppl A), pp.S20-30.
Cai, S. and Singh, B. R. 2004. A Distinct Utility of Amide III Infrared Band for Secondary Structure Estimation of Aqueous Protein Solutions Using Partial Least Square Methods. Biochemistry. 43, pp.2541-2549.
Calo, E. and Khutoryanskiy, V. V. 2016. Biomedical applications of hydrogels: A review of patents and commercial products. European Polymer Journal. 65, pp.252-267.
Campbell, K. P., MacLennan, D.H., and Jorgensen, A. O. 1983. Staining of the Ca2+-binding proteins, calsequestrin, calmodulin, troponin C, and S-100, with the cationic carbocyanine dye “Stains-all.”. Journal of Biological Chemistry. 68, pp.11267–11273.
Campoccia, D., Doherty, P., Radice, M., Brun, P., Abatangelo, G., and Williams, D. F. 1998. Semisynthetic resorbable materials from hyaluronan esterification. Biomaterials. 19, pp.2101-2127.

220
Cancedda, R., Dozin, B., Giannoni, P., and Quarto, R. 2003. Tissue engineering and cell therapy of cartilage and bone. Matrix Biol. 22(1), pp.81-91.
Caplan, M. R., Moore, P. N., Zhang, S. G., Kamm, R. D., and Lauffenburger, D. A. 2000. Self assembly of beta sheet protein governed by rel ief of electrostatic replusion relative to van de Waals attraction. Biomacromolecules. 1, pp.627-631.
Caplan, M. R., Schwartzfarb, E. M., Zhang, S. G., Kamm, R. D., and Lauffenburger, D. A. 2002. Control of self-assembling oligopeptide matrix formation through systematic variation of amino acis sequence. Biomaterials. 23, pp.219-227.
Carrick, L. M., Aggeli, A., Boden, N., Fisher, J., Ingham, E., and Waigh, T. A. 2007. Effect of ionic strength on the self-assembly, morphology and gelation of pH responsive b-sheet tape-forming peptides. Tetrahedron. 63, pp.7457-7467.
Carter, D. R., Beaupre, G. S., Wong, M., Smith, R. L., Andriacchi, T. P., and Schurman, D. J. 2004. The mechanobiology of articular cartilage development and degeneration. Clin Orthop Relat Res. 427, pp.S69-77.
Chadjichristos, C., Ghayor, C., Kypriotou, M., Martin, G., Renard, E. et al. 2003. Sp1 and Sp3 transcription factors mediate interleukin-1β down-regulation of human type II collagen gene expression in articular chondrocytes. J Biol Chem. 278(41), pp.39762-39772.
Chahal, J., Gross, A. E., Gross, C., Mall, N., Dwyer, T. et al. 2013. Outcomes of Osteochondral Allograft Transplantation in the Knee. Arthroscopy. 29(3), pp.575-588.
Chang, K. V., Hsiao, M. Y., Chen, W. S., Wang, T. G., and Chien, K. L. 2013. Effectiveness of Intra-Articular Hyaluronic Acid for Ankle Osteoarthritis Treatment: A Systematic Review and Meta-Analysis. Arch Phys Med Rehabil. 94(5), pp.951-60.
Chan, S. M., Neu, C. P., Duraine, G., Komvopoulos, K., and Reddi, A. H. 2010. Atomic force microscope investigation of the boundary-lubricant layer in articular cartilage. Osteoarthritis Cartilage. 18(7), pp.956-63.
Chaudhari, A. M., Briant, P. L., Bevill, S. L., Koo, S., and Andriacchi, T. P. 2008. Knee kinematics, cartilage morphology, and osteoarthritis after ACL injury. Med Sci Sports Exerc. 40(2), pp.215-222.
Chauffier, K., Laiguillon, M. C., Bougault, C., Gosset, M., Priam, S. et al. 2012. Induction of the chemokine IL-8/Kc by the articular cartilage: possible influence on osteoarthritis. Joint Bone Spine. 79(6), pp.604-9.
Chee, A., Shi, P., Cha, T., Kao, T. H., Yand, A. H. et al. 2016. Cell Therapy with Human Dermal Fibroblasts Enhances Intervertebral Disk Repair and Decreases Inflammation in the Rabbit Model. Global Spine Journal. 6, pp.771-779.
Chen, A. C., Nguyen, T. T., and Sah, R. L. 1997. Streaming potentials during the confined compression creep test of normal and proteoglycan-depleted cartilage. Ann. Biomed. Engng. 25(2), pp.269-277.
Chen, J., Wang, C., Lü, S., Wu, J., Guo, X. et al. 2005. In vivo chondrogenesis of adult bone-marrow-derived autologous mesenchymal stem cells. Cell and Tissue Research. 319, pp.429-438.
Cherubino, P., Grassi, F. A., and Bulgheroni, P. 2003. Autologous chondrocyte implantation using a bilayer collagen membrane a preliminary report. J Orthop Surg (Hong Kong). 11(1), pp.10-15.
Chevalier, X., Jerosch, J., Goupille, P., van Dijk, N., Luyten, F. P. et al. 2010. Single, intra-articular treatment with 6 ml hylan G-F 20 in patients with symptomatic primary

221
osteoarthritis of the knee: a randomised, multicentre, double-blind, placebo controlled trial. Ann Rheum Dis. 69(1), pp.113-119.
Chirgadze, Y. N., Fedorov, O. V., and Trushina, N. P. 1975. Estimation of amino acid residue side-chain absorption in the infrared spectra of protein solutions in heavy water. Biopolymers. 14, pp.679-694.
Chung, C. and Burdick, J. A. 2008. Engineering cartilage tissue. Adv Drug Deliv Rev. 60(2), pp.243-262.
Chung, C., Mesa, J., Miller, G. J., Randolph, M. A., Gill, T. J., and Burdick, J. A. 2006. Effects of auricular chondrocyte expansion on neocartilage formation in photocrosslinked hyaluronic acid networks. Tissue Eng. 12(9), pp.2665-2673.
Clarkin, C. E., Allen, S., J., Kuiper N.,.T., Wheeler B, P., Wheeler-Jones C., and A., Pitsillides A. 2011. Regulation of UDP-glucose dehydrogenase is sufficient to modulate hyaluronan production and release, control sulfated GAG synthesis, and promote chondrogenesis. Journal of Cell Physiology. 226, pp.749-761.
Coles, J. M., Chang, D. P., and Zauscher, S. 2010. Molecular mechanisms of aqueous boundary lubrication by mucinous glycoproteins. Current Opinion in Colloid & Interface Science. 15(6), pp.406-416.
Collin, E. C., Grad, S., Zeugolis, D. I., Vinatier, C. S., Clouet, J. R. et al. 2011. An injectable vehicle for nucleus pulposus cell-based therapy. Biomaterials. 32(11), pp.2862-70.
Cooper, C., Egger, P., Coggon, D., Hart, D. J., Masud, T., and Cicuttini, F. 1996. Generalized osteoarthritis in women: pattern of joint involvement and approaches to definition for epidemiological studies. Journal of Rheumatology. 23, pp.1938-42.
Cornish, J., Callon, K., Lin, C., Xiao, C., Mulvey, T, Cooper, G., and Reid, I. 1999. Trifluoroacetate, a contaminant in purified proteins, inhibits proliferation of osteoblasts and chondrocytes. American Journal of Physiology - Endocrinology And Metabolism. 277, pp.E779-E783.
Correa, D. and Lietman, S. A. 2017. Articular cartilage repair: Current needs, methods and research directions. Seminars in Cell & Developmental Biology. 62, pp.67-77.
Cremer, M. A., Rosloniec, E. F., and Kang, A. H. 1998. The cartilage collagens: a review of their structure, organization, and role in the pathogenesis of experimental arthritis in animals and in human rheumatic disease. J Mol Med. 76(3-4), pp.275–288.
Crockett, R., Grubelnik, A., Roos, S., Dora, C., Born, W., and Troxler, H. 2007. Biochemical composition of the superficial layer of articular cartilage. J Biomed Mater Res A. 82(4), pp.958-64.
Danion, F., Varraine, E., Bonnard, M., and Pailhous, J. 2003. Stride variability in human gait: the effect of stride frequency and stride length. Gait Posture. 18(1), pp.69-77.
Das, U. N. 2001. Is obesity an inflammatory condition? Nutrition. 17(11-12), pp.953-66.
Deschamps, A. A., Grijpma, D. W., and Feijen, J. 2001. Poly(ethylene oxide)/poly(butylene terephthalate) segmented block copolymers: the effect of copolymer composition on physical properties and degradation behavior. Polymer. 42(23), pp.9335-9345.
Detterline, A. J., Goldberg, S., Bach, B. R. Jr., and Cole, B. J. 2005. Treatment Options for Articular Cartilage Defects of the Knee. Orthop Nurs. 24(5), pp.361-366.
Dowson, D. 1995. Elastohydrodynamic and micro-elastohydrodynamic lubrication. Wear. 190(2), pp.125-138.

222
Dudhia, J. 2005. Aggrecan, aging and assembly in articular cartilage. Cell Mol Life Sci. 62(19-20), pp.2241-56.
Duffy, J. 2015. Rheology - More than just viscosity. Malvern.
Duffy, J. 2016. A basic introduction to rheology. Worcestershire: Malvern Instruments Limited.
Dumond, H., Presle, N., Pottie, P., Pacquelet, S., Terlain, B. et al. 2004. Site specific changes in gene expression and cartilage metabolism during early experimental osteoarthritis. Osteoarthritis Cartilage. 12(4), pp.284-95.
Du, W. J., Reppel, L., Leger, L., Schenowitz, C., Huselstein, C. et al. 2016. Mesenchymal Stem Cells Derived from Human Bone Marrow and Adipose Tissue Maintain Their Immunosuppressive Properties After Chondrogenic Differentiation: Role of HLA-G. Stem Cells Dev. 25(19), pp.1454-1469.
Dury, J. L. and Mooney, D. J. 2003. Hydrogels for tissue engineering: scaffold design variables and applications. Biomaterials. 24(24), pp.4337-4351.
El Sayed, K., Haisch, A., John, T., Marzahn, U., Lohan, A. et al. 2010. Heterotopic autologous chondrocyte transplantation- a realistic approach to support articular cartilage repair? Tissue Eng Part B Rev. 16(6), pp.603-616.
El Sayed, K., Marzahn, U., John, T., Hoyer, M., Zreiqat, H. et al. 2013. PGA-associated heterotopic chondrocyte cocultures: implications of nasoseptal and auricular chondrocytes in articular cartilage repair. J Tissue Eng Regen Med. 7(1), pp.61-72.
Elder, B.D., Kim, D.H., and Athanasiou, K.A. 2010. Developing an articular cartilage decellularisation process toward facet joint cartilage replacement. Neurosurgery. 66, pp.722-727.
Emans, P. J., Jansen, E. J., van Iersel, D., Welting, T. J., Woodfield, T. B. et al. 2012. Tissue-engineered constructs: the effect of scaffold architecture in osteochondral repair. Journal of Tissue Engineering and Regenerative Medicine. 7(9), pp.751-6.
Erggelet, C., Sittinger, M., and Lahm, A. 2003. The arthroscopic implantation of autologous chondrocytes for the treatment of fullthickness cartilage defects of the knee joint. Arthroscopy. 19(1), pp.108-110.
Erickson, G., Gimble, J. M., Franklin, D. M., Rice, H. E., Awad, H., and Guilak, F. 2002. Chondrogenic potential of adipose tissue-derived stromal cells in vitro and in vivo. Biochemical and Biophysical Research Communications. 290, pp.763-769.
Facchini, A., Lisignoli, G., Cristino, S., Roseti, L., De Franceschi, L., Marconi, E., and Grigolo, B. 2006. Human chondrocytes and Mesenchymal stem cells grown onto engineered scaffold. Biorheology. 43(3-4), pp.471-480.
Farahat, M. N., Yanni, G., Poston, R., and Panayi, G. S. 1993. Cytokine expression in synovial membranes of patients with rheumatoid arthritis and osteoarthritis. Ann Rheum Dis. 52(12), pp.870-875.
Farndale, R. W., Sayers, C. A., and Barrett, A. J. 1982. A direct spectrophotometric microassay for sulfated glycosaminoglycans in cartilage cultures. Connective Tissue Research. 9(4), pp.247-8.
Farquhar, T., Xia, Y., Mann, K., Bertram, J., Burton-Wurster, N., Jelinski, L., and Lust, G. 1996. Swelling and Fibronectin accumulation in articular cartilage explants after cyclical impact. J Orthop Res. 14(3), pp.417-423.

223
Fellah, B. H., Weiss, P., Gauthier, O., Rouillon, T., Pilet, P., Daculsi, G., and Layrolle, P. 2006. Bone repair using a new injectable self-crosslinkable bone substitute. J Orthop Res. 24(4), pp.628-35.
Felson, D. 1993. The course of osteoarthritis and factors that affect it. Rheum Dis Clin North Am. 19, pp.607-15.
Felson, D.T., Lawrence, R.C., Dieppe, P.A., Hirsch, R., Helmick, C.G. et al. 2000. Osteoarthritis: new insights. Part 1: the disease and its risk factors. Ann Intern Med. 133(8), pp.635– 46.
Felson, D. T., Zhang, Y., Anthony, J. M., Naimark, A., and Anderson, J. J. 1992. Weight loss reduces the risk for symptomatic knee osteoarthritis in women. Ann Intern Med. 116(7), pp.535-9.
Fermor, H. L., Russel, S. L., Williams, S., Fisher, J., and Ingham, I. 2015. Development and characterisation of a decellularised bovine osteochondral biomaterial for cartilage repair. J Mater Sci: Mater Med. 26(5), p.186.
Fernandes, J. C., Martel-Pelletier, J., Lascau-Coman, V., Moldovan, F., Jovanovic, D., and Raynauld, J. P. 2002. Collagenase-1 and collagenase-3 synthesis in normal and early experimental osteoarthritic canine cartilage: an immunohistochemical study. J Rheumatol. 10(9), pp.722-33.
Fernandes, J. C., Martel-Pelletier, J., and Pelletier, J. P. 2003. The role of cytokines in osteoarthritis pathophysiology. Biorheology. 39(1-2), pp.237-46.
Firth, A., Aggeli, A., Burke, J. L., Yang, X., and Kirkham, J. 2006. Biomimetic self -assembling peptides as injectable scaffolds for hard tissue engineering. Nanomedicine. 1(2), pp.189-199.
Fishwick, C. W. G., Beevers, A. J., Carrick, L. M., Whitehouse, C. D., Aggeli, A., and Boden, N. 2003. Structures of Helical β-Tapes and Twisted Ribbons: The Role of Side-Chain Interactions on Twist and Bend Behavior. Nano Letters. 3(11), pp.1475-1479.
Fontan, F. R., Piuzzi, N. S., Chahla, J., Payne, K. A., LaPrade, R. F., Muschler, G. F., and Garrido, P. G. 2017. Stem and Progenitor Cells for Cartilage Repair: Source, Safety, Evidence, and Efficacy. Operative Techniques in Sports Medicine. 25(1), pp.25-33.
Forster, H. and Fisher, J. 1996. The influence of loading time and lubricant on the friction of articular cartilage. Proc Inst Mech Eng H. 210(2), pp.109-119.
Franke, O., Durst, K., Maier, V., Go¨ken, M., Birkholz, T. et al. 2007. Mechanical properties of hyaline and repair cartilage studied by nanoindentation. Acta Biomaterialia. 3, pp.873-881.
French, M. M., Rose, S., Canseco, J., and Athanasiou, K. A. 2004. Chondrogenic differentiation of adult dermal fibroblasts. Annals of Biomedical Engineering. 32, pp.50-56.
Furuzawa-Carballeda, J. and Alcocer-varela, J. 1999. Interleukin-8, interleukin-10, intercellular adhesion molecule-1 and vascular cell adhesion molecule-1 expression levels are higher in synovial tissue from patients with rheumatoid arthritis than in osteoarthritis. Scand J Immunol. 50(2), pp.215-222.
Galler, K. M., Cavender, A., Yuwono, V., Dong, H., Shi, S. et al. 2008. Self -assembling peptide amphiphile nanofibers as a scaffold for dental stem cells. Tissue Eng Part A. 14(12), pp.2051-8.
Galler, K. M., Hartgerink, J. D., Cavender, A. C., Schmalz, G., and D'Souza, R. N. 2012. A customized self-assembling peptide hydrogel for dental pulp tissue engineering. Tissue Eng Part A. 18(1-2), pp.176-84.
Gibson, A. J., McDonnell, S. M., and Price, A. J. 2006. Matrix-Induced Autologous Chondrocyte Implantation. Oper Tech Orthop. 16(4), pp.262-265.

224
Gibson, J. N., White, M. D., Chapman, V. M., and Strachan, R. K. 1992. Arthroscopic lavage and debridement for osteoarthritis of the knee. J Bone Joint Surg Br. 74(4), pp.534-7.
Glasoe, P. K. and Long, F. A. 1960. Use of glass electrodes to measure aciditi es in deuterium oxide. The Journal of Physical Chemistry. 64, pp.188-9.
Gleghorn, J.P. and Bonassar, L. J. 2008. Lubrication mode analysis of articular cartilage using Stribeck surfaces. J Biomech. 41(9), pp.1910-8.
Gobbi, A., Kon, E., Berruto, M., Filardo, G., Delcogliano, M. et al. 2009. Patellofemoral Full-Thickness Chondral Defects Treated With Second-Generation Autologous Chondrocyte Implantation. Am J Sports Med. 37(6), pp.1083-92.
Goldring, M. B. and Goldring, S. R. 2010. Articular cartilage and subchondral bone in the pathogenesis of osteoarthritis. Ann N Y Acad Sci. 1192, pp.230-37.
Goldring, M. B. and Marcu, K. B. 2009. Cartilage homeostasis in healthy and rheumatic diseases. Arthritis Res Ther . 11, p.224.
Goldwasser, M., Astley, T., van der Rest, M., and Glorieux, F. H. 1982. Analysis of the type of collagen present in osteoarthritic human cartilage. Clin Orthop Relat Res. 167, pp.296-302.
Gooding, C. R., Bartlett, W., Bentley, G., Skinner, J. A., Carrington, R., and Flanagan, A. 2006. A prospective, ranomised study comparing two techniques of autologous chondrocyte implantation for osteochondral defects in the knee: Periosteum covered versus type I/III collagen covered. Knee. 13(3), pp.203-210.
Gosset, M., Berenbaum, F., Levy, A., Pigenet, A., Thirion, S., Saffar, J. L., and Jacques, C. 2006. Prostaglandin E2 synthesis in cartilage explants under compression: mPGES-1 is a mechanosensitive gene. Arthritis Res Ther. 8(4), p.R135.
Gouze, J. N., Bordji, K., Gulberti, S., Terlain, B., Netter, P. et al. 2001. Interleukin-1β down-regulates the expression of glucuronosyltransferase I, a key enzyme priming glycosaminoglycan biosynthesis: influence of glucosamine on interleukin-1β-mediated effects in rat chondrocytes. Arthritis Rheum. 44(2), pp.351-360.
Greene, G. W., Banquy, X., Lee, D. W., Lowrey, D. D., Yu, J., and Israelachvili, J. N. 2011. Adaptive mechanically controlled lubrication mechanism found in articular joints. Proc Natl Acad Sci. 108(3), pp.5255-5259.
Grigolo, B., Lisignoli, G., Piacentini, A., Fiorini, M., Gobbi, P. et al. 2002. Evidence for redifferentiation of human chondrocytes grown on a hyaluronan-based biomaterial (HYAff 11): molecular, immunohistochemical and ultrastructural analysis. Biomaterials. 23(4), pp.1187-95.
Grigolo, B., Roseti, L., Fiorini, M., Fini, M., Giavaresi, G. et al. 2001. Transplantation of chondrocytes seeded on a hyaluronan derivative (HYAFF® 11) into cartilage defects in rabbits. Biomaterials. 22(17), pp.2417-2424.
Groh, M. M. and Herrera, J. 2009. A comprehensive review of hip labral tears. Curr Rev Musculoskelet Med. 2(2), pp.105–117.
Guilak, F. 2011. Biomechanical factors in osteoarthritis. Best Pract Res Clin Rheumatol. 25(6), pp.815-23.
Guilak, F., Meyer, B. C., Ratcliffe, A., and Mow, V. C. 1994. The effects of matrix compression on proteoglycan metabolism in articular cartilage explants. Osteoarthritis Cartilage. 2(2), pp.91-101.

225
Guilak, F., Setton, L. A., and Kraus, V. B. 2000. Structure and function of articular cartilage. In: et al W.E. GARRETT, (ed). Principles And Practice Of Orthopaedic Sports Medicine, Philadelphia: Lippincott Williams & Wilkins.
Gullbrand, S. E., Schaer, T. P., Agarwal, P., Bendigo, J. R., Dodge, G. R. et al. 2017. Translation of an injectable triple-interpenetrating-network hydrogel for intervertebral disc regeneration in a goat model. Acta Biomaterialia. 60, pp.201-209.
Haene, R., Qamirani, E., Story, R. A., Pinsker, E., and Daniels, T. R. 2012. Intermediate outcomes of fresh talar osteochondral allografts for treatment of large osteochondral lesions of the talus. Am J Bone Joint Surg. 94(12), pp.1105-10.
Hall, M.L., Krawczak, D.A., Simha, N.K., and Lewis, K.L. 2009. Effect of Dermatan Sulfate on the indentation and Tensile Properties of Articular Cartilage. Osteoarthritis Cartilage. 17(5), pp.655-661.
Halloran, J.P., Sibole, S., van Donkelaar, C.C., van Turnhout, M.C., Oomens, C.W. et al. 2012. Multiscale mechanics of articular cartilage: Potentials and challenge s of coupling musculoskeletal, joint and microscale computational models. Ann Biomed Eng. 40, pp.2456-2474.
Han, E., Chen, S. S., Klisch, S. M., and Sah, R. L. 2011. Contribution of Proteoglycan Osmotic Swelling Pressure to the Compressive Properties of Articular Cartilage. Biophysical Journal. 101, pp.916-924.
Hardingham, T. E. and Muir, H. 1974. Hyaluronic acid in cartilage and proteoglycan aggregation. Biochem J. 139(3), pp.565–581.
Harris, P. I. and Chapman, D. 1995. The conformational analysis of pepti des using fourier transform IR spectroscopy. Biopolymers. 37(4), pp.251-263.
Harris, J. D., Siston, R. A., Brophy, R. H., Lattermann, C., Carey, J. L., and Flanigan, D. C. 2011. Failures, re-operations, and complications after autologous chondrocyte implantation. Osteoarthritis Cartilage. 19(7), pp.779-791.
Hart, D. J., Spector, T.D., Brown, P., Wilson, P., Doyle, D. V., and Silman, A. J. 1991. Clinical signs of early osteoarthritis: reproducibility and relation to x ray changes in 541 women in the general population. Annals of Rheumatology. 50, pp.467-70.
Hayami, T., Funaki, H., Yaoeda, K., Mitui, K., Yamagiwa, H. et al. 2003. Expression of the cartilage derived anti-angiogenic factor chondromodulin-I decreases in the early stage of experimental osteoarthritis. J Rheumatol. 30(10), pp.2207-17.
Hayes, W. C. and Mockros, L. F. 1971. Viscoelastic properties of human articular cartilage. J Appl Physiol. 31(4), pp.562-8.
Hendriks, J., Guidoux, J., Verdonk, P., and Slynarski, K. 2013. First clinical experience with INSTRUCT – a single surgery, autologous cell based technology for cartilage repair. In: Conference: ICRS 2013. Izmir.
Hendriks, J. A. A., Moroni, L., Riesle, J., Wijn, J. R., and Blitterswijk, C. A. 2013. The effect of scaffold-cell entrapment capacity and physico-chemical properties on cartilage regeneration. Biomaterials. 34(17), pp.4259-4265.
He, B., Yuan, X., Zhou, A., Zhang, H., and Jiang, D. 2014. Designer functionalised self-assembling peptide nanofibre scaffolds for cartilage tissue engineering. Expert Rev Mol Med. 16, p.e12.
Hickery, M. S., Bayliss, M. T., Dudhia, J., Lewthwaite, J. C., Edwards, J. C., and Pitsillides, A. A. 2003. Age-related changes in the response of human articular cartilage to IL-1α and

226
transforming growth factor-β (TGF-β): chondrocytes exhibit a diminished sensitivity to TGF-β. Journal of Biological Chemistry. 278(52), pp.53063–53071.
Holland, T. A and Mikos, A. G. 2006. Biodegradable polymeric scaffolds- Improvements in bone tissue engineering through controlled drug delivery. Adv Biochem Eng Biotechnol. 102, pp.161-185.
Hooper, K. A., Macon, N. D., and Kohn, J. 1998. Comparative histological evaluation of new tyrosine-derived polymers and poly (L-lactic acid) as a function of polymer degradation. J Biomed Mater Res. 41(3), pp.443-54.
Hosseinkhani, H., Hong, P. D., and Yu, D. S. 2013. Self-Assembled Proteins and Peptides for Regenerative Medicine. Chem Rev. 113(7), pp.4837-4861.
Howell, D. S. 1986. Pathogenesis of osteoarthritis. Am J Med. 80, pp.24-8.
Hrabchak, C., Roulette, J., Moss, I., Woodhouse, K., Akens, M. et al. 2010. Assessment of biocompatibility and initial evaluation of genipin crosslinked elastin-like polypeptides in the treatment of an osteochondral knee defect in rabbits. Acta Biomaterialia. 6(6), pp.2108-2115.
Huang, B. J., Hu, J. C., and Athanasiou, K. A. 2016. Cell -based tissue engineering strategies used in the clinical repair of articular cartilage. Biomaterials. 98, pp.1-22.
Huang, J. I., Zuk, P. A., Jones, N. F., Zhu, M., Lorenz, H. P., Hedrick, M. H., and Benhaim, P. 2004. Chondrogenic potential of multipotential cells from human adipose tissue. Plastic and Reconstructive Surgery. 113, pp.585-594.
Huebner, J. L., Otterness, I. G., Freund, E. M., Caterson, B., and Kraus, V. B. 1998. Collagenase 1 and collagenase 3 expression in a guinea pig model of osteoarthritis. Arthritis Rheum. 41(5), pp.877-90.
Hunter, D. J. 2011. Osteoarthritis. Best Pract Res Clin Rheumatol. 25(6), pp.801-814.
Hunter, D. J. and Matthews, G. 2011. Emerging drugs for osteoarthritis. Expert Opin Emerg Drugs. 16(3), pp.479-491.
Hunziker, E. B. and Kapfinger, E. 1998. Removal of proteoglycans from the surface of defects in articular cartilage transiently enhances coverage by repair cells. J Bone Joint Surg Br. 80(1), pp.144-50.
Hwang, N. S., Kim, M. S., Sampattavanich, S., Baek, J. H., Zhang, Z., and Elisseeff, J. 2006. Effects of three-dimensional culture and growth factors on the chondrogenic differentiation of murine embryonic stem cells. Stem Cells. 24, pp.284-291.
Ishibashi, M., Hikita, A., Fujihara, Y., Takato, T., and Hoshi, K. 2017. Human auricular chondrocytes with high proliferation rate show high production of cartilage. Regenerative Therapy. 6, pp.21-28.
Israelachvil, J. N. 1992. Intermolecular and surface forces. London: Academic Press.
Issa, R. I. and Griffin, T. M. 2012. Pathobiology of obesity and osteoarthritis: integrating biomechanics and inflammation. Pathobiol Aging Age Relat Dis. 9(2), p.17470.
Jackson, M. and Mantsch, H. H. 1995. The Use and Misuse of FTIR Spectroscopy in the Determination of Protein Structure. Critical Reviews in Biochemistry and Molecular Biology. 30, pp.95-120.
Jackson, D. W., Simon, T. M., and Aberman, H. M. 2001. Symptomatic articular cartilage degeneration: the impact of the new milenium. Clin Orthop Relat Res. 391 Suppl, pp.S14-25.
227
Jaffe, F. F., Mankin, H. J., Weiss, C., and Zarins, A. 1974. Water binding in the articular cartilage of rabbits. J Bone Joint Surg Am, Vol. 56(5), pp.1031–1039.
Jansen, E. J., Pieper, J., Gijbels, M. J., Guldemond, N. A., Riesle, J. et al. 2008. PEOT/PBT based scaffolds with low mechanical properties improve cartilage repair tissue formation in osteochondral defects. Journal of Biomedical Materials Research Part A. 89(2), pp.444-52.
Jay, G. D. and Cha, C. J. 1999. The effect of phospholipase digestion upon the boundary lubricating ability of synovial fluid. J Rheumatol. 26(11), pp.2454-7.
Jeong, C. G. and Hollister, S. J. 2010. A comparison of the influence of material on in vitro cartilage tissue engineering with PCL, PGS, and POC 3D scaffold architecture seeded with chondrocytes. Biomaterials. 31(15), pp.4304-4312.
Jin, R., Moreira Teixeira, L. S., Dijkstra, P. J., Karperien, M., van Blitterswijk, C. A., Zhong, Z. Y., and Feijen, J. 2009. Injectable chitosan-based hydrogels for cartilage tissue engineering. Biomaterials. 30(13), pp.2544-2551.
Jin, Z. M., Pickard, J. E., Forster, H., Ingham, E., and Fisher, J. 2000. Frictional behaviour of bovine articular cartilage. Biorheology. 37(1-2), pp.57-63.
Johnson, T. S., Xu, J. W., Zaporojan, V. V., Mesa, J. M., Weinand, C. et al. 2004. Integrative repair of cartilage with articular and nonarticular chondrocytes. Tissue Engineering. 10, pp.1308-1315.
Johnstone, B., Alini, M., Cucchiarini, M., Dodge, G. R., Egl in, D. et al. 2013. Tissue Engineering for Articular Cartilage Repair - The State of the Art. Eur Cell Mater. 25, pp.248-267.
Jordan, J. M., Luta, G., Stabler, T., B., Renner. J., Dragomir, A. D., and Vilim, V. 2003. Ethnic and sex differences in serum levels of cartilage oligomeric matrix protein: the Johnston County Osteoarthritis Project. Arthritis & Rheumatism. 48, pp.675-81.
Kang, Y., Yang, J., Khan, S., Anissian, L., and Ameer, G. A. 2006. A new biodegradable polyester elastomer for cartilage tissue engineering. J Biomed Mater Res A. 77(2), pp.331-9.
Kapoor, M., Martel-Pelletier, J., Lajeunesse, D., Pelletier, J. P., and Fahmi, H. 2011. The role of proinflammatory cytokines in th pathophysiology of osteoarthritis. Nat Rev Rheumatol. 7(1), pp.33-42.
Katta, J. 2007. Self-assembling Peptide Networks for Treatment of Cartilage Degenerative Diseases. Leeds: University of Leeds.
Katta, J., Jin, Z., Ingham, E., and Fisher, J. 2008. Biotribology of articular cartilage —A review of the recent advances. Medical Engineering and Physics. 30, pp.1349-1363.
Katta, J., Jin, Z., Ingham, I., and Fisher, J. 2009. Effect of nominal stress on the long term friction, deformation and wear of native and glycosaminoglycan deficient articular cartilage. Osteoarthritis and Cartilage. 17, pp.662-668.
Katta, J., Pawaskar, S. S., Jin, Z. M., Ingham, E., and Fisher, J. 2007. Effect of load variation on the friction properties. Proceedings of the Institution of Mechanical Engineers, Part J: Journal of Engineering Tribology. 221(3), pp.175–181.
Katta, J., Stapleton, T., Ingham, E., Jin, Z. M., and Fisher, J. 2008. The effect of glycosaminoglycan depletion on the friction and deformation of articular cartilage. Proc Inst Mech Eng H. 222(1), pp.1-11.
Kellgren, J. H., Jeffrey, M. R., and Ball, J. 1963. The epidemiology of chronic rheumatism. Atlas of standard radiographs of arthritis. Oxford, UK: Blackwell Scientific Publications.

228
Kellgren, J. H. and Lawrence, J. S. 1957. Radiological assessment of osteo-arthrosis. Annals of the Rheumatic Diseases. 16(4), pp.494-502.
Kempson, G. E., Freeman, M. A., and Swanson, S. A. 1968. Tensile properties of articular cartilage. Nature. 220(5172), pp.1127-8.
Kempson, G. E., Freeman, M. A., and Swanson, S. A. 1971. The determination of a creep modulus for articular cartilage from indentation tests of the human femoral head. J. Biomech. 4(4), pp.239-50.
Kheir, E., Stapleton, T., Shaw, D., Jin, Z., Fisher, J., and Ingham, E. 2011. Development and characterization of an acellular porcine cartilage bone matrix for use in tissue engineering. J Biomed Mater Res. 99, pp.283-94.
Kim, J.E., Kim, S. H., and Jung, Y. 2015. In situ chondrogenic differentiation of bone marrow stromal cells in bioactive self-assembled peptide gels. J Biosci Bioeng. 120(1), pp.91-8.
Kim, S. E., Park, J. H., Cho, Y. W., Chung, H., Jeong, S. Y., Lee, E. B., and Kwon, I. C. 2003. Porous chitosan scaffold containing microspheres loaded with transforming growth factor-beta 1: implications for cartilage tissue engineering. J Control Release. 91(3), pp.365-374.
Kirkham, J., Firth, A., Vernals, D., Boden, N., Robinson, C. et al. 2007. Self -assembling Peptide Scaffolds Promote Enamel Remineralization. J Dent Res. 86(5), pp.426-430.
Kisiday, J., Jin, M., Kurz, B., Hung, H., Semino, C., Zhang, S., and Grodzinsky, A. J. 2002. Self-assembling peptide hydrogel fosters chondrocyte extracellular matrix production and cell division: Implications for cartilage tissue repair. Proc Natl Acad Sci USA. 99(15), pp.9996-10001.
Kleemann, R. U., Krocker, D., Cedraro, A., Tuischer, J., and Duda, G. N. 2005. Altered cartilage mechanics and histology in knee osteoarthritis: relation to clinical assessment (ICRS Grade). Osteoarthritis Cartilage. 13(11), pp.958-63.
Knutsen, G., Drogset, J. O., Engebretsen, L., Grøntvedt, T., Isaksen, V. et al. 2010. A randomized trial comparing autologous chondrocyte implantation with microfracture: findings at five years. J Sports Med. 38(1), pp.68-77.
Knutsen, G., Engebretsen, L., Ludvigsen, T.C., Drogset, J. O., Grøntvedt, T. et al. 2004. Autologous chondrocyte implantation compared with microfracture in the knee: A randomized trial. J Bone Joint Surg Am. 86(3), pp.455-464.
Kock, L. M., Schulz, R. M., van Donkelaar, C. C., Thummler, C. B., Bader, A., and Ito, K. 2009. RGD-dependent integrins are mechanotransducers in dynamically compressed tissue-engineered cartilage constructs. J Biomech. 42(13), pp.2177-82.
Kon, E., Delcogliano, A., Filardo, G., Montaperto, C., and Marcacci, M. 2008. Second generation issues in cartilage repair. Sports Med Arthrosc Rev. 16(4), pp.221-9.
Kon, E., Gobbi, A., Filardo, G., Delcogliano, M., Zaffagnini, S., and Marcacci, M. 2009. Arthroscopic second-generation autologous chondrocyte implantation compared with microfracture for chondral lesions of the knee: prospective nonrandomized study at 5 years. Am J Sports Med. 37(1), pp.33-41.
Kong, J. and Yu, S. 2007. Fourier Transform Infrared Spectroscopic Analysis of Protein Secondary Structures. Acta Biochimica et Biophysica Sinica. 39(8), pp.549-59.
Koppel, D.E., Axelrod, D., Schlessinger, J., Elson, E.L., and Webb, W.W. 1976. Dynamics of fluorescence marker concentration as a probe of mobility. Biophys. J. 16, pp.1315-1329.

229
Kramer, J., Hegert, C., Guan, K., Wobus, A. M., Müller, P. K., and Rohwedel, J. 2000. Embryonic stem cell-derived chondrogenic differentiation in vitro: activation by BMP-2 and BMP-4. Mechanisms of Development. 92, pp.193-205.
Krasnokutsky, S., Attur, M., Palmer, G., Samuels, J., and Abramson, S. B. 2008. Current concepts in the pathogenesis of osteoarthritis. Osteoarthritis Cartilage. 16(Suppl. 3), pp.S1-3.
Kreuz, P. C., Müller, S., Freymann, U., Erggelet, C., Niemeyer, P., Kaps, C., and Hirschmüller, A. 2011. Repair of Focal Cartilage Defects with Scaffold-Assisted Autologous Chondrocyte Grafts. The American Journal of Sports Medicine. 39(8), pp. 1697-1706.
Kreuz, P. C., Müller, S., Ossendorf, C., Kaps, C., and Erggelet, C. 2009. Treatment of focal degenerative cartilage defects with polymer-based autologous chondrocyte grafts: four-year clinical results. Arthritis Research & Therapy. 11(2), p.R33.
Kruger, T., Wohlrab, D., Reichel, H., and Hein, W. 2000. The effect of arthroscopic joint debridement in advanced arthrosis of the knee joint. Zentralbl Chir. 125(6), pp.490-3.
Kubelka, J. and Keiderling, T. A. 2001. Differentiation of β-Sheet-forming structures: An initio-based simulations of IR absorption and vibrational CD for model peptide and protein β-Sheets. ournal of the American Chemical Society. 123(48), pp.12048-58.
Kumagai, K., Suzuki, S., Kanri, Y., Matsubara, R., Fujii, K. et al. 2015. Spontaneously developed osteoarthritis in the temporomandibular joint in STR/ort mice. Biomed Rep. 3(4), pp.453-6.
Kunčická, L., Kocicha, R., and Lowe, T. C. 2017. Advances in metals and alloys for joint replacement. Progress in Materials Science. 88, pp.232-280.
Kuyinu, E. L., Narayanan, G., Nair, L. S., and Laurencin, C. T. 2016. Animal models of osteoarthritis: classification, update, and measurement of outcomes. J Orthop Surg Res. 11(19), pp.1-27.
Kyle, S., Aggeli, A., Ingham, E., and McPherson, M. J. 2009. Production of self-assembling biomaterials for tissue engineering. Trends Biotechnol. 27(7), pp.423-33.
Kyle, S., Aggeli, A., Ingham, E., and McPherson, M. J. 2010. Recombinant self -assembling peptides as biomaterials for tissue engineering. Biomaterials. 31(36), pp.9395-9405.
Kyle, S., Aggeli, A., Ingham, E., and McPherson, M. J. 2010. Recombinant self -assembling peptides as biomaterials for tissue engineering. Biomaterials. 31(36), pp.9395-9405.
Laffargue, P., Delalande, J. L., Maillet, M., Vanhecke, C., and Decoulx, J. 1999. Reconstruction of the anterior cruciate ligament: Arthrotomy versus arthroscopy. Rev Chir Orthop Reparatrice Appar Mot. 85(4), pp.367-373.
Lahiji, A., Sohrabi, A., Hungerford, D., and Frondoza, C. 2000. Chitosan supports the expression of extracellular matrix proteins in human osteoblasts and chondrocytes. J Biomed Mater Res. 51, pp.586-95.
Lai, W. M., Hou, J. S., and Mow, V. C. 1991. A triphasic theory for the swelling and deformation behaviors of articular cartilage. J Biomech Eng. 113(3), pp.245-58.
Lai, W. M., Mow, V. C., and Roth, V. 1981. Effects of nonlinear strain-dependent permeability and rate of compression on the stress behavior of articular cartilage. J Biomech Eng. 103(2), pp.61-6.
Lark, M. W., Bayne, E. K., J., Flanagan., Harper, C. F., Hoerrner, L. A., Hutchinson, N. I. et al. 1997. Aggrecan degradation in human cartilage. Evidence for both matrix metalloproteinase and aggrecanase activity in normal, osteoarthritic, and rheumatoid joints. J Clin Invest. 100(1), pp.93 –106.

230
Le Graverand, M. P., Eggerer, J., Vignon, E., Otterness, I. G., Barclay, L., and Hart, D. A. 2002. Assessment of specific mRNA levels in cartilage regions in a lapine model of osteoarthritis. J Orthop Res. 20(3), pp.535-44.
Leddy, H. and Guilak, F. 2003. Site-Specific Molecular Diffusion in Articular Cartilage Measured using Fluorescence Recovery after Photobleaching. Annals of Biomedical Engineering. 31, pp.753-760.
Lee, A. S., Ellman, M. B., Yan, D., Kroin, J. S., Cole, B. J., van Wijnen, A. J., and Im, H. J. 2013. A current review of molecular mechanisms regarding osteoarthritis and pain. Gene. 527(2), pp.440-447.
Lee, J. E., Kim, S. E., Kwon, I. C., Ahn, H. J., Cho, H. et al. 2004. Effects of a chitosan scaffold containing TGF-beta 1 encapsulated chitosan microspheres on in vitro chondrocyte culture. Artif Organs. 28(9), pp.829-839.
Lee, S. H. and Shin, H. 2007. Matrices and scaffolds for delivery of bioactive molecules in bone and cartilage tissue engineering. Adv Drug Deliv Rev. 59(4-5), pp.339-359.
Lee, K. H., Song, S. U., Hwang, T. S., Yi, Y., Oh, I. S. et al. 2001. Regeneration of hyaline cartilage by cell-mediated gene therapy using transforming growth factor beta 1-producing fibroblasts. Human Gene Therapy. 12, pp.1805-1813.
Leighton, R., Akermark, C., Therrien, R., Richardson, J. B, Andersson, M., Todman, M. G., and Arden, N. K. 2014. NASHA hyaluronic acid vs. methylprednisolone for knee osteoarthritis: a prospective, multi-centre, randomized, non-inferiority trial. Osteoarthritis Cartilage. 22(1), pp.17-25.
Li, W. J., Chiang, H., Kuo, Y. F., Lee, H. S., Jiang, C. C., and Tuan, R. S. 2009. Evaluation of articular cartilage repiar using biodegradeable nanfibrious scaffolds in a swine model: a pilot study. J Tissue Eng Regen Med. 3(1), pp.1-10.
Li, W. J., Danielson, K. G., Alexander, P. G., and Tuan, R. S. 2003. Biological response of chondrocytes cultured in three-dimensional nanofibrious poly(epsilon-caprolactone) scaffolds. J Biomed Mater Res. 67A, pp.1105-1114.
Li, Y., Tew, S. R., Russell, A. M., Gonzalez, K. R., Hardingham, T. E., and Hawkins, R. E. 2004. Transduction of passaged human articular chondrocytes with adenoviral, retroviral and lentiviral vectors and the effects of enhanced expression of SOX9. Tissue Engineering. 10, pp.575-584.
Little, C. B., Barai, A., Burkhardt, D., Smith, S. M., Fosang, A. J. et al. 2009. Matrix metalloproteinase 13-deficient mice are resistant to osteoarthritic cartilage erosion but not chondrocyte hypertrophy or osteophyte development. Arthritis Rheum. 60(12), pp.3723-33.
Li, W.J., Tuli, R., Okafor, C., Derfou, A., Daneilson, K. G., Hall, D. J., and Tuan, R. S. 2005. A three dimensional nanofibrious scaffold for cartilage tissue engineering using human mesenchymal stem cells. Biomaterials. 26, pp.599-609.
Liu, A., Jennings, L. M., Ingham, E., and Fisher, J. 2015. Tribology studies of the natural knee using ananimal model in a new whole joint natural knee simulator. Journal ofBiomechanics. 48, pp.3004-3011.
Liu, M., Zeng, X., Ma, C., Yi, H., Ali, Z. et al. 2017. Injectable hydrogels for cartilage and bone tissue engineering. Bone Research. 5(17014).
Livesley, P., Doherty, M., Needoff, M., and Moulton, A. 1991. Arthroscopic lavage of osteoarthritic knees. J Bone Joint Surg Br. 73(6), pp.922-6.

231
Lohan, A., Marzahan, U., Sayed, K. E., Haisch, A., Muller, R. D. et al. 2014. Osteochondral articular defect repair using auricle-derived autologous chondrocytes in a rabbit model. Annals of Anatomy. 196(5), pp.317-326.
Lohmander, L. S., Dahlberg, L., Ryd, L., and Heinegård, D. 1989. Increased levels of proteoglycan fragments in knee joint fluid after injury. Arthritis Rheum. 32(11), pp.1434–1442.
Longfield, M. D., Dowson, D., Walker, P. S., and Wright, V. 1969. Boosted l ubrication of human joints by fluid enrichment and entrapment. Biomed Eng. 4(11), pp.517-22.
Loo, Y., Wong, Y. C., Cai, E. Z., Ang, C. H., Raju, A. et al. 2014. Ultrashort peptide nanofibrous hydrogels for the acceleration of healing of burn wounds. Biomaterials. 35(17), pp.4805-14.
Lorenz, H. and Richter, W. 2006. Osteoarthritis: Cellular and molecular changes in degenerating cartilage. Prog Histochem Cytochem. 40(3), pp.135-163.
Lorenz, H., Wenz, W., Ivancic, M., Steck, E., and Richter, W. 2005. Early and stable upregulation of collagen type II, collagen type I and YKL40 expression levels in cartilage during early experimental osteoarthritis occurs independent of joint location and histological grading. Arthritis Res Ther. 7(1), pp.156-65.
Lum, L. and Elisseeff, J. 2003. Injectable Hydrogels for Cartilage Tissue Engineering. Topics in Tissue Engineering. 30, pp.1-25.
Lu, J. X., Prudhommeaux, F., Meunier, A., Sedel, L., and Guillemin, G. 1999. Effects of Chitosan on rat knee cartilages. Biomaterials. 20, pp.1937-1944.
Lu, X. L., Sun, D. D., Guo, X. E., Chen, F. H., Lai, W. M., and Mow, V. C. 2004. Indentation determined mechanoelectrochemical properties and fixed charge density of articular cartilage. Ann Biomed Eng. 32(3), pp.370-9.
Mak, A. F., Lai, W. M., and Mow, V. C. 1987. Biphasic indentation of articular cartilage – I. Theoretical analysis. J. Biomechanics. 20(7), pp.703-714.
Mankin, H. J. 1982. The response of articular cartilage to mechanical injury. J Bone Joint Surg Am. 64(3), pp.460–466.
Mankin, H. J. and Lippiell, L. 1971. The Glycosaminoglycans of Normal and Arthritic Cartilage. J Clin Invest. 50(8), pp.1712–1719.
Mankin, H. J., Mow, V. C., Buckwalter, J. A., Iannotti, J. P., and Ratcliffe, A. 1999. Articular cartilage structure, composition, and function (Chapter 17). In: Orthopedic basic science: biology and biomechanics of the musculoskeletal system, Rosemont : American Academy of Orthopaedic Surgeons, pp.444– 70.
Marcacci, M., Berruto, M., Brocchetta, D., Delcogliano, A., Ghinel li, D. et al. 2005. Articular cartilage engineering with Hyalograft C: 3-year clinical results. Clin Orthop Relat Res. 435, pp.96-105.
Marcacci, M., Zaffagnini, S., and Kon, E. 2002. Arthroscopic autologous chondrocyte transplantation: technical note. Knee Surg Sports Traumatol Arthrosc. 10(3), pp.154-9.
Marijnissen, A. C., van Roermund, P. M., TeKoppele, J. M., Bijlsma, J. W., and Lafeber, F. P. 2002. The canine ‘groove’ model, compared with the ACLT model of osteoarthritis. Osteoarthritis Cartilage. 10(2), pp.145-55.
Maroudas, A., Bullough, P., Swanson, S. A., and Freeman, M. A. 1968. The permeability of articular cartilage. J Bone Joint Surg Br. 50(1), pp.166-177.

232
Maroudas, A., Evans, H., and Almeida, L. 1973. Cartilage of the hip joint: Topographical variation of glycosaminoglycan content in normal and fibrillated tissue. Ann Rheum Dis. 32(1), pp.1-9.
Maroudas, A. and Venn, M. 1977. Chemical composition and swelling of normal and osteoarthrotic femoral head cartilage. Ann Rheum Diss. 36, pp.399-406.
Martel-Pelletier, J. 2004. Pathophysiology of osteoarthritis. Osteoarthritis Cartilage. 12(Suppl A), pp.S31-3.
Mason, S.J., Legge, G.E., and Kallie, C. S. 2005. Variability in the length and frequency of steps of sighted and visually impaired walkers. Journal of Visual Impairment and Blindness. 99(12), pp.741-754.
Matsiko, A., Levingstone, T, J., and O’Brien, F. J. 2013. Advanced Strategies for Articular Cartilage Defect Repair. Materials. 6(2), pp.637-668.
Maude, S., Ingham, E., and Aggeli, A. 2013. Biomimetic self-assembling peptides as scaffolds for soft tissue engineering. Nanomedicine. 8(5), pp.823-847.
Maude, S., Miles, D. E., Felton, S. H., Ingram, J., Carrick, L. M. et al. 2011. De novo designed positively charged tape-forming peptides: self-assembly and gelation in physiological solutions and their evaluation as 3D matrices for cell growth. Soft Matter. 7(18), pp.8085-99.
McCann, L., Ingham, E., Jin, Z., and Fisher, F. 2009. Influence of the meniscus on friction and degradation of cartilage in the natural knee joint. Osteoarthritis Cartilage. 17(8), pp.995–1000.
McCoy, A. M. 2015. Animal Models of Osteoarthritis: Comparisons and Key Considerations. Vet Pathol. 52(5), pp.803-18.
McCutchen, C. W. 1959. Sponge-hydrostatic and weeping bearings. Nature. 184, pp.1284--1285.
McDevitt, C., Gilbertson, E., and Muir, H. 1977. An experimental model of osteoarthritis; early morphological and biochemical changes. J Bone Joint Surg Br. 59(1), pp.24-35.
McGinley, B., Cushner, F., and Scott, W. 1999. Debridement arthroscopy. 10-year followup. Clin Orthop Relat Res. 367, pp.667-72.
McIlwraith, C. W., Frisbie, D. D., Kawcak, C. E., Fuller, C. J., Hurtig, M., and Cruz, A. 2010. The OARSI histopathology initiative recommendations for histological assessments of osteoarthritis in the horse. Osteoarthr Cartil. 18(Supp 3), pp.S93-105.
McNary, S. M., Athanasiou, K.A., and Reddi, A. H. 2012. Engineering Lubrication in Articular Cartilage. Tissue Eng Part B. 18(2), pp.88-99.
Mechanically Functional Scaffold Technology. 2015. [online]. Available from World Wide Web: <http://www.cellcotec.com/technology/mechanically-functional-scaffold/>
Meng, H., Chen, L., Ye, Z., Wang, S., and Zhao, X. 2009. The effect of a self-assembling peptide nanofiber scaffold (peptide) when used as a wound dressing for the treatment of deep second degree burns in rats. Biomed Mater Res B Appl Biomater. 89(2), pp.379-91.
Mesa, J. M., Zaporojan, V., Weinand, C., Johnson, T. S., Bonassar, L. et al. 2006. Tissue engineering cartilage with aged articular chondrocytes in vivo. Plastic and Reconstructive Surgery. 118, pp.41-49.
Messier, S. P. 1994. Osteoarthritis of the knee and associated factors of age and obesity: effects on gait. Med Sci Sports Exerc. 26(12), pp.1446-52.
233
Messier, S., Loeser, R., Mitchell, M. N., Valle, G., Morgan, T. P., Rejeski, W. J., and Ettinger, W. H. 2000. Exercise and weight loss in obese older adults with knee osteoarthritis: a preliminary study. J Am Geriatr Soc. 48(9).
Messner, K., Fahlgren, A., Persliden, J., and Andersson, B. 2001. Radiographic joint space narrowing and histologic changes in a rabbit meniscectomy model of early knee osteoarthrosis. Am J Sports Med. 29(2), pp.151-60.
Migliore, A. and Procopio, S. 2015. Effectiveness and utility of hyaluronic acid in osteoarthritis. Clin Cases Miner Bone Metab. 12(1), pp.31-33.
Milentijevic, D., Helfet, D. L., and Torzilli, P. A. 2003. Influence of stress magnitude onwater loss and chondrocyte viability in impacted articular cartilage. J Biomech Eng. 125(5), pp.594-601.
Miles, D. E. 2012. Self-assembling peptide/glycosaminoglycan hydrogels for spinal therapies. Leeds: University of Leeds.
Miles, D. E., Mitchell, E. A., Kapur, N., Beales, P. A., and Wilcox, R. K. 2016. Peptide:glycosaminoglycan hybrid hydrogels as an injectable intervention for spinal disc degeneration. Journal of Materials Chemistry B. 4(19), pp.3225-31.
Miller, K. L. and Clegg, D. O. 2011. Glucosamine and Chondroitin Sulfate. Rheum Dis Clin North Am. 37(1), pp.103-118.
Minas, T. 2001. Autologous chondrocyte implantation for focal chondral defects of the knee. Clin Orthop Relat Res. 391(Suppl 1), pp.S349-61.
Minas, T. and Bryant, T. 2005. The role of autologous chondrocyte implantation in the patellofemoral joint. Clin Orthop Relat Res. 436, pp.30-9.
Miosge, N., Hartmann, M., Maelicke, C., and Herken, R. 2004. Expression of collagen type I and type II in consecutive stages of human osteoarthritis. Histochem Cell Biol. 122(3), pp.229-36.
Mithoefer, K., Williams, R. J., Warren, R. F., Potter, H. G., Spock, C. R. et al. 2005. The microfracture technique for the treatment of articular cartilage lesions in the knee. A prospective cohort study. J Bone Joint Surg Am. 87(9), pp.1911-20.
Mobasheri, A., Lewis, R., Maxwell, J. E., Hill, C., Womack, M., and Barrett-Jolley, R. 2010. Characterization of a stretch-activated potassium channel in chondrocytes. J Cell Physiol. 223(2), pp.511-8.
Morgan, C. E., Dombrowski, A. W., Rubert Pérez, C. M., Bahnson, E. S., Tsihlis, N. D. et al. 2016. Tissue-Factor Targeted Peptide Amphiphile Nanofibers as an Injectable Therapy To Control Hemorrhage. ACS Nano. 10(1), pp.899-909.
Moroni, L., Hendriks, J. A., Schotel, R., Wijn, J. R., and Blitterswijk, C. A. 2007. Design of biphasic polymeric 3-dimensional fiber deposited scaffolds for cartilage tissue engineering applications. Tissue Eng. 13(2), pp.361-371.
Moskowitz, R. W., Altman, R. W., Hochberg, M. C., Buckwalter, J. A., and Goldberg, V. M. 2007. Osteoarthritis: diagnosis and medical/surgical management. Philadelphia: Lippincott Williams, and Wilkins.
Mouw, J. K., Case, N. D., Guldberg, R. E., Plaas, A. H., and Levenston, M. E. 2005. Variations in matrix composition and GAG fine structure among scaffolds for cartilage tissue engineering. Osteoarthiritis Cartilage. 13(9), pp.828-836.
Mow, V. C. and Ateshian, G. A. 1997. Friction, lubrication and wear of diarthrodial joints. New York: Raven Press.
234
Mow, V. C., Flatow, E. L., and Ateshian, G. A. 2000. Biomechanics. In: Orthopaedic basic science: Biology and biomechanics of the musculoskeletal system , American Academy of Orthopaedic Surgeons, pp.140-42.
Mow, V. C., Gibbs, M. C., Lai, W. M., Zhu, W. B., and Athanasiou, K. A. 1989. Biphasic indentation of articular cartilage – II. A numerical algorithm and an experimental study. J. Biomechanics. 22(8-9), pp.853-861.
Mow, V. C. and Hayes, W. C. 1997. Basic Orthopaedic Biomechanics. Philadelphia: Lippincott-Raven Press.
Mow, V. C., Holmes, M. H., and Lai, W. M. 1984. Fluid transport and mechanical properties of articular cartilage: a review. J Biomech. 17(5), pp.377-94.
Mow, V. C. and Hung, C. T. 1989. Biomechanics of articular cartilage. In: Basic biomechanics of the musculoskeletal system, Philadelphia: Lea & Febiger, pp.31-57.
Mow, V. C., Kuei, S. C., Lai, W. M., and Armstrong, C. G. 1980. Biphasic creep and stress relaxation of articular cartilage in compression? Theory and experiments. J Biomech Eng. 102(1), pp.73-84.
Mow, V. C. and Lai, W. M. 1980. Recent developments in Synovial Joint Biomechanics. SIAM Rev. 22(3), pp.275-317.
Mow, V. C., Lai, W. M., and Hou, J. S. 1990. Triphasic theory for swelling properties of hydrated charged soft biological tissues. Appl Mech Rev. 43(5), pp.S134 -S141.
Mow, V. C., Wang, C. C., and Hung, C.T. 1999. The extracellular matrix, interstitial fluid and ions as a mechanical signal tranducer in articular cartilage. Osteoarthr Cartil. 7, pp.41-58.
Muir, H. 1978. Proteoglycans of cartilage. J Clin Pathol Suppl (R Coll Pathol). 12, pp.67-81.
Mwale, F., Wertheimer, M. R., and Antoniou, J. 2008. Novel ni trogen rich polymers and chitosan for tissue engineering of intervertebral discs. Adv Sci Tech. 57, pp.117-124.
Myers, S. L., Brandt, K. D., Ehlich, J. W., Braunstein, E. M., Shelbourne, K. D., Heck, D.A., and Kalasinski, L. A. 1990. Synovial inflammation in patients with early osteoarthritis of the knee. J Rheumatol. 17(12), pp.1662-69.
Nakamura, S., Ito, H., Nakamura, K., Kuriyama, S., Furu, M., and Matsuda, S. 2017. Long-Term Durability of Ceramic Tri-Condylar Knee Implants: A Minimum 15-Year Follow-Up. The Journal of Arthroplasty. 32(6), pp.1874-1879.
Nakamura, H., Yoshino, S., Kato, T., Tsuruha, J., and Nishioka, K. 1999. T-cell mediated inflammatory pathway in osteoarthritis. Osteoarthritis Cartilage. 7(4), pp.401-2.
Nakayama, Y., Narita, T., Mori, A., Uesaka, S., Miyazaki, K., and Ito, H. 2002. The Effects of Age and Sex on Chondroitin Sulfates in Normal Synovial Fluid. Arthritis Rheum. 46(8), pp.2105-2108.
Nakayama, Y., Shirai, Y., Yoshihara, K., and Uesaka, S. 2000. Evaluation of Glycosaminoglycans Levels in normal joint fluid of the knee. J Nippon Med Sch. 67(2), pp.92-95.
Nehrer, S1., Dorotka, R., Domayer, S., Stelzeneder, D., and Kotz, R. 2009. Treatment of Full-Thickness Chondral Defects With Hyalograft C in the Knee : A Prospective Clinical Case Series With 2 to 7 Years' Follow-up. Am J Sports Med. 37(Suppl 1), pp.S81-7.
Neu, C. P., Komvopoulos, K., and Reddi, A. H. 2008. The interface of functional biotribology and regenerative medicine in synovial joints. Tissue Eng Part B Rev. 14(3), pp.235-47.
Neyret, P., Donell, S., and Dejour, H. 1994. Osteoarthritis of the knee following meniscectomy. Br J Rheumatol. 33(3), pp.267-8.

235
Ng, L., Grodzinsky, A. J, Patwari, P., Sandy, J., Plaas, A., and Ortiz, C. 2003. Individual cartilage aggrecan macromolecules and their constituent glycosaminoglycans visualized via atomic force microscopy. J Struct Biol. 143(3), pp.242-57.
Niemeyer, P., Lenz, P., Kreuz, P. C., Salzmann, G. M., Südkamp, N. P., Schmal, H., and Steinwachs, M. 2010. Chondrocyte-Seeded Type I/III Collagen Membrane for Autologous Chondrocyte Transplantation: Prospective 2-Year Results in Patients With Cartilage Defects of the Knee Joint. Arthroscopy. 26(8), pp.1074-1082.
Nietfeld, J. J., Wilbrink, B., Den Otter, W., Huber, J., and Huber-Bruning, O. 1990. the effect of human interleukin 1 on proteoglycan metabolism in human and porcine cartilage explants. J Rheumatol. 17(6), pp.818-26.
Noel, D., Djouad, F., Bouffi, C., Mrugala, D., and Jorgensen, C. 2007. Multipotent mesenchymal stromal cells and immune tolerance. Leukemia & Lymphoma. 48(7), pp.1283-1289.
Nukavarapu, S. P.; Dorcemus, D. L. 2013. Osteochondral tissue engineering: Current strategies and challenges. Biotechnol Adv. 31(5), pp.706-721.
Ontario, H. Q. 2005. Arthroscopic lavage and debridement for osteoarthritis of the knee: an evidence-based analysis. Ont Health Technol Assess Ser. 5(12), pp.1-37.
Ossendorf, C., Kaps, C., Kreuz, P. C., Burmester, G. R., Sittinger, M., and Erggelet, C. 2007. Treatment of posttraumatic and focal osteoarthritic cartilage defects of the knee with autologous polymer-based three-dimensional chondrocyte grafts: 2-year clinical results. Arthritis Research & Therapy. 9(R41), pp.1-11.
Otsuki, S., Nakajima, M., Lotz, M., and Kinoshita, M. 2008. Hyaluronic acid and chondroitin sulfate content of osteoarthritic human knee cartilage: site-specific correlation with weight-bearing force based on femorotibial angle measurement. J Orthop Res. 26(9), pp.1194-8.
Ozeki, M., Kuroda, S., Kon, K., and Kasugai, S. 2011. Differentiation of bone marrow stromal cells into osteoblasts in a self-assembling peptide hydrogel: in vitro and in vivo studies. J Biomater Appl. 25(7), pp.663-84.
Panossian, A., Ashiku, S., Kirchhoff, C.H., Randolph, M. A., and Yaremchuk, M. J. 2001. Effects of cell concentration and growth period on articular and ear chondrocyte transplants for tissue engineering. Plastic and Reconstructive Surgery. 108, pp.392-402.
Park, S., Krishnan, R., Nicoll, S. B., and Ateshian, G. A. 2003. Cartilage interstitial fluid load support in unconfined compression. J Biomech. 36(12), pp.1785-96.
Pawaskar, S. S., Fisher, J., and Jin, Z. 2010. Robust and general method for determining surface fluid flow boundary conditions in articular cartilage contact mechanics modelling. Journal of Biomechanical Engineering transactions of the American Society of Mechanical Engineers. 132, pp.1-8.
Pawaskar, S. S., Grosland, N. M., Ingham, E., Fisher, J., and Jin, Z. 2011. Hemiarthroplasty of hip joint: An experimental validation using porcine acetabulum. Journal of Biomechanics. 44, pp.1536-1542.
Pelletier, J., Boileau, C., Altman, R. D., and Martel-Pelletier, J. 2010. Experimental models of osteoarthritis: usefulness in the development of disease-modifying osteoarthritis drugs/agents. Therapy. 7(6), pp.621-34.
Pelletier, J. P., Martel-Pelletier, J., Ghandur-Mnaymneh, L., Howell, D. S., and Woessner, Jr. J. F. 1985. Role of synovial membrane inflammation in cartilage matrix breakdown in the Pond-Nuki dog model of osteoarthritis. Arthritis Rheum. 33(10), pp.554-61.

236
Pelton, J. T. and McLean, L. R. 2000. Spectroscopic methods for analysis of protein secondary structure. Analytical Biochemistry. 277, pp.167-176.
Pfander, D., R., Rahmanzadeh., and Scheller, E. E. 1999. Presence and distribution of collagen II, collagen I, fibronectin, and tenascin in rabbit normal and osteoarthritic cartilage. J Rheumatol. 26(2), pp.386-94.
Pickard, J., Ingham, E., Egan, J., and Fisher, J. 1998. Investigation into the effect of proteoglycan molecules on the tribological properties of cartilage joint tissues. Proc. Instn Mech. Engrs, Part H: J. Engineering in Medicine. 212(H3), pp.177-182.
Pitsillides, A. A. and Beier, F. 2011. Cartilage biology in osteoarthritis - lessons from developmental biology. Nat Rev Rheumatol. 7(11), pp.654-663.
Pond, M. J. and Nuki, G. 1973. Experimentally induced osteoarthritis in the dog. Ann Rheum Dis. 32(4), pp.387-8.
Poole, C. A. 1997. Articular cartilage chondrons: form, function and failure. J Anat. 191(1), pp.1-13.
Poole, A. R., Pidoux, I., Reiner, A., and Rosenberg, L. 1982. An immunoelectron microscope study of the organization of proteoglycan monomer, link protein, and collagen in the matrix of articular cartilage. J Cell Biol. 93(3), pp.921–937.
Proctor, C., Schmidt, M., Whipple, R., Kelly, M., and Mow, V. 1989. Material Properties of the Normal Medial Bovine Menicus. J. Orthop. Res. 7, pp.771-782.
Radhakrishnan, J., Subramanian, A., Krishnan, U. M., and Sethuraman, S. 2017. Injectable and 3D Bioprinted Polysaccharide Hydrogels: From Cartilage to Osteochondral Tissue Engineering. Biomacromolecules. 18(1), pp.1-26.
Radin, E. L. and Rose, R. M. 1986. Role of subchondral bone in the initiation and progression of cartilage damage. Clin Orthop Relat Res. 213, pp.34-40.
Ramage, L., Nuki, G., and Salter, D. M. 2009. Signalling cascades in mechanotransduction: cell-matrix interactions and mechanical loading. Scand J Med Sci Sports. 19(4), pp.457-69.
Reboul, P., Pelletier, J. P., Tardif, G., Cloutier, J. M., and Martel -Pelletier, J. 1996. The new collagenase, collagenase-3, is expressed and synthesized by human chondrocytes but not by synoviocytes. A role in osteoarthritis. J Clin Invest. 97(9), pp.2011-9.
Ren, K., He, C., Li, G., and Chen, X. 2015. In-situ forming glycopolypeptide hydrogels as biomimetic scaffolds for cartilage tissue engineering. J Control Release. 213, pp.e64-5.
Rieppo, J., Toyras, J., Nieminen, M. T., Kovanen, V., Hyttinen, M. M. et al. 2003. Structure-function relationships in enzymatically modified articular cartilage. Cells Tissues Organs. 175(3), pp.121-32.
Rogers, B. A., David, L, A., and Briggs, T. W. 2010. Sequential outcome following autologous chondrocyte implantation of the knee: A six-year follow-up. Int Orthop. 34(7), p.55.
Rolfe, K. W., Martell, J. M., and Schmalzried, T. P. 2006. Joint reaction stress and osteoarthritis of the hip. In: 52nd Annual Meeting of the Orthopaedic Research Society. Los Angeles: The University of Chicago Hospitals.
Roth, S. H. and Fuller, P. 2011. Diclofenac sodium topical solution 1.5% w/w with dimethyl sulfoxide compared with placebo for the treatment of osteoarthriti s: pooled safety results. Postgradute Med. 123(6), pp.180-8.
Roth, V. and Mow, V. C. 1980. The intrinsic tensile behavior of the matrix of bovine articular cartilage and its variation with age. J Bone Joint Surg Am. 62(7), pp.1102-17.
237
Rozbruch, S., Wickiewicz, T., Di, C. E., and Potter, H. 1996. Osteonecrosis of the knee following arthroscopic laser meniscectomy. Arthroscopy. 12(2), pp.245-50.
Rusconi, F., Valton, E., Nguyen, R., and Dufourc, E. 2001. Quantification of sodium dodecyl sulfate in microliter-volume biochemical samples by visible light spectroscopy. Analytical Biochemistry. 295(1), pp.31-7.
Sakakibara, Y., Miura, T., Iwata, H., Kikuchi, T., Yamaguchi, T., Yoshimi, T., and Itoh, H. 1994. Effect of high-molecularweight sodium hyaluronate on immobilized rabbit knee. Clin Orthop Relat Res. 299, pp.282-92.
Saklatvala, J. 1986. Tumour necrosis factor alpha, stimulates resorption and inhibits synthesis of proteoglycan in cartilage. Nature. 322, pp.547-549.
Samouillan, V., Lamure, A., Maurel, E., Dandurand, J., Lacabanne, C., Ballarin, F., and Spina, M. 2000. Characterisation of elastin and collagen in aortic bioprostheses. Med Biol Eng Comput. 38, pp.226-231.
Sanchez, C., Pesesse, L., Gabay, O., Delcour, J. P., Msika, P., Baudouin, C., and Henrotin, Y. E. 2012. Regulation of subchondral bone osteoblast metabolism by cyclic compression. Arthritis Rheum. 64(4), pp.1193-203.
Sandell, L. J. and Aigner, T. 2001. Articular cartilage and changes in arthritis. An introduction: cell biology of osteoarthritis. Arthritis Res. 3(2), pp.107-13.
Sandy, J. D., Barrach, H. J., Flanner, C. R., and Plaas, A. H. 1987. The biosynthetic response of the mature chondrocyte in early osteoarthritis. J Rheumatol. 14, pp.16-19.
Sasada, T., Abe, T., Morita, M., and Mabuchi, K. 2005. Role of chondroitin sulfate in the low friction property of articular cartilages. In Proceedings of the Fifth Kobe International Forum on Biotribology, Kobe, Japan., pp.64-67.
Scanzello, C. R., Umoh, E., Pessler, F., Diaz-Torne, C., Miles, T. et al. 2009. Local cytokine profiles in knee osteoarthritis: elevated synovial fluid interleukin-15 differentiates early from endstage disease. Osteoarthritis Cartilage. 17(8), pp.1040-48.
Schinagl, R. M., Gurskis, D., Chen, A. C., and Sah, R. L. 1997. Depth-dependent confined compression modulus of full-thickness bovine articular cartilage. J Orthop Res. 15(4), pp.499-506.
Schiphof, D., Boers, M., and Bierma-Zeinstra, S. M. 2008. Differences in descriptions of Kellgren and Lawrence grades of knee osteoarthritis. Ann Rheum Dis. 67, pp.1034-36.
Schmidt, M. B., Mow, V. C., Chun, L. E., and Eyre, D. R. 1990. Effects of proteoglycan extraction on the tensile behavior of articular cartilage. J Orthop Res. 8(3), pp.353-63.
Schneider, A., Garlick, J. A., and Egles, C. 2008. Self-assembling peptide nanofiber scaffolds accelerate wound healing. PLoS One. 3(1), p.e1410.
Scott, W. W. Jr., Lethbridge-Cejku, M., Reichle, R., Wigley, F. M., and Tobin, J. D., Hochberg, M.C. 1993. Reliability of grading scales for individual radiographic features of osteoarthritis of the knee. The Baltimore longitudinal study of aging atlas of knee osteoarthritis. Investigate Radiology. 28, pp.497-501.
Séguin, C. A. and Bernier, S. M. 2003. TNF-α suppresses link protein and type II collagen expression in chondrocytes: Role of MEK1/2 and NF-κB signaling pathways. J Cell Physiol. 197(3), pp.356-69.
Sellam, J. and Berenbaum, F. 2010. The role of synovitis in pathophysiology and clinical symptoms of osteoarthritis. Nat Rev Rheumatol. 6(11), pp.625-35.

238
Semino, C. E. 2008. Self-assembling Peptides: From Bio-inspired Materials to Bone Regeneration. J Dent Res. 87(7), pp.606-616.
Seshadri, S., Khurana, R., and Fink, A. L. 1999. Fourier transform infrared spectroscopy in analysis of protein deposits. Methods in Enzymology. 309, pp.559-576.
Shaha, R. N., Shah, N. A, Lim, M. M. R., Hsieh, C., Nuber, G., and Stupp, S. I. 2010. Supramolecular design of self-assembling nanofibers for cartilage regeneration. PNAS. 107(8), pp.3293–3298.
Sharif, M., Osborne, D. J., Meadows, K., Woodhouse, S. M., Colvin, E. M., Shepstone, L., and Dieppe, P. A. 1996. The relevance of chondroitin and keratan sulphate markers in normal and arthirtic synocial fluid. Br J Rheumatol. 35, pp.951-957.
Shen, G. 2005. The role of type X collagen in facilitating and regulating endochondral ossification of articular cartilage. J Orthod Craniofac Res. 8(1), pp.11-17.
Sherman, A. L., Ojeda-Correal, G., and Mena, J. 2012. Use of Glucosamine and Chondroitin in Persons With Osteoarthritis. PM R. 4(5), pp.S110-S116.
Short, A. R., Koralla, D., Deshmukh, A., Wissel, B., Stocker, B. et al. 2015. Hydrogels That Allow and Facilitate Bone Repair, Remodeling, and Regeneration. J Mater Chem B Mater Biol Med. 3(40), pp.7818-7830.
Siebert, F. and Hildebrandt, P. 2007. Vibrational Spectroscopy in Life Science. Wiley-VCH.
Silver, F. H., Bradica, G., and Tria, A. J. 2001a. Viscoelastic behavior of osteoarthritic cartilage. Connect Tissue Res. 42(3), pp.223-233.
Silver, F. H., Bradica, G., and Tria, A. 2004. Do changes in the mechanical properties of articular cartilage promote catabolic destruction of cartilage and osteoarthritis? Matrix Biol. 23(7), pp.467-476.
Slynarski, K., Widuchowski, W., Snow, M., and Verdonk, P. 2015. Primary chondrocytes and bone marrow cells on a 3D co-polymer scaffold: 2-year results of a prospective, multicenter, single-arm clinical trial in patients with cartilage defects of the knee. Revue de Chirurgie Orthopédique et Traumatologique. 101(8), pp.e17-e18.
Smith, H. 2005. Autologous Chondrocyte Transplantation / Implantation Versus Existing treatments. [online]. Available from World Wide Web: <http://www.active-trial.org.uk/ChondralDefects.htm>
Smith, M. D., Triantafillou, S., Parker, A., Youssef, P. P., and Coleman, M. 1997. Synovial membrane inflammation and cytokine production in patients with early osteoarthritis. J Rheumatol. 24(2), pp.365-371.
Solheim, E., Hegna, J., Oyen, J., Austgulen, O. K., Harlem, T., and Strand, T. 2010. Osteochondral autografting (mosaicplasty) in articular cartilage defects in the knee: results at 5 to 9 years. Knee. 17(1), pp.84-87.
Soppimath, K. S., Aminabhavi, T. M., Dave, A. M., Kumbar, S. G., and Rudzinski, W. E. 2002. Stimulus-responsive smart hydrogels as novel drug delivery systems. Drug Dev Ind Pharm. 28(8), pp.957-974.
Sprague, N. F. 1981. Arthroscopic debridement for degenerative knee joint disease. Clin Orthop. 160, pp.118-23.
Squires, G. R., Okouneff, S., Ionescu, M., and Poole, A. R. 2003. The pathobiology of focal lesion development in aging human articular cartilage and molecular matrix changes characteristic of osteoarthritis. Arthritis Rheum. 48(5), pp.1261-70.

239
Stapleton, T, Ingram, J, Katta, J, Knight, R, Korossis, S, Fisher, J, and Ingham, E. 2008. Development and characterisation of an acellular porcine medial meniscus for use in tissue engineering. Tissue Eng Part A. 14(4), pp.505-18.
Stephanopoulos, N., Ortony, J. H., and Stupp, S. I. 2013. Self -assembly for the synthesis of functional biomaterials. Acta Materialia. 61(3), pp.912-930.
Steplewski, A., Hintze, V., and Fertala, A. 2007. Molecular basis of organization of collagen fibrils. J Struct Biol. 157(2), pp.297-307.
Stolz, M., Raiteri, R., Daniels, A.U., VanLandingham, M.R., Baschong, W., and Aebi, U. 2004. Dynamic Elastic Modulus of Porcine Articular Cartilage Determined at Two Different Levels of Tissue Organization by Indentation-Type Atomic Force Microscopy. Biophysical Journal. 86(5), pp.3269-3283.
Strand, V., Simon, L. S., Dougados, M., Sands, G. H., Bhadra, P., Breazna, A., and Immitt, J. 2011. Treatment of osteoarthritis with continuous versus intermittent celecoxib. J Rheumatol. 38(12), pp.2625-34.
Stuart, B. H. 2004. Infrared Spectroscopy: Fundamentals and Applications. Wiley.
Stuart, B. H. and George, B. McIntyre, P. 1996. Modern Infrared Spectroscopy, Volume 40 of Analytical Chemistry by Open Learning. John Wiley & Sons.
Suh, J. and Matthew, H. 2001. Application of chitosan-based polysaccharide biomaterials in cartilage tissue engineering: a review. Biomaterials. 21, pp.2589-98.
Susi, H. 1972. Infrared spectroscopy - Conformation. Methods in Enzymology. 26, pp.455-472.
Susi, H. and Byler, D. M. 1986. Resolution-enhanced Fourier transform infrared spectroscopy of enzymes. Methods in Enzymology. 130, pp.290-311.
Sutton, S., Clutterbuck, A., Harris, P., Gent, T., Freeman, S. et al. 2009. The contribution of the synovium, synovial derived inflammatory cytokines and neuropeptides to the pathogenesis of osteoarthritis. Vet J. 179(1), pp.10-24.
Swann, A. C. and Seedhom, B. B. 1989. Improved techniques for measuring the indentation and thickness of articular cartilage. Proc Inst Mech Eng H. 203(3), pp.143-50.
Swift, S. R and Trinkle-Mulcahy, L. 2004. Basic principles of FRAP, FLIM and FRET. Proc. Royal Mic. Soc. 39, pp.3-10.
Swoboda, B. 2001. Epidemiological arthrosis research. Orthopade. 30(11), pp.834-40.
Tabib, W., Beaufils, P., Blin, J., Tremoulet, J., and Hardy, P. 1999. Arthroscopic meniscectomy with Ho-Yag laser versus mechanical meniscectomy. Mid-term results of a randomized prospective study of 80 meniscectomies. Rev Chir Orthop Reparatrice Appar Mot. 85(7), pp.713-21.
Tao, H., Wu, Y., Li, H., Wang, C., Zhang, Y. et al. 2015. BMP7-Based Functionalized Self-Assembling Peptides for Nucleus Pulposus Tissue Engineering. ACS Appl. Mater. Interfaces,. 7(31), pp.17076-17087.
Tatman, P. D., Gerull, W., Sweeney-Easter, S., Davis, J. I., Gee, A. O., and Kim, D. H. 2015. Multiscale Biofabrication of Articular Cartilage: Bioinspired and Biomimetic Approaches. Tissue Eng Part B Rev. 21(6), pp.543-59.
Tay, A. G., Farhadi, J., Suetterlin, R., Pierer, G., Heberer, M., and Martin, I. 2004. Cell yield, proliferation, and postexpansion differentiation capacity of human ear, nasal, and rib chondrocytes. Tissue Engineering. 10, pp.762-770.

240
Teeple, E., Jay, G. D., Elsaid, K. A., and Fleming, B. C. 2013. Animal Models of Osteoarthritis: Challenges of Model Selection and Analysis. AAPS J. 15(2), pp. 438–446.
Teixeira, L. S. M., Patterson, J., and Luyte, F. P. 2014. Skeletal tissue regeneration: where can hydrogels play a role? International Orthopaedics. 38(9), pp.1861-1876.
Temple-Wong, M. M., Bae, W. C., Chen, M. Q., Bugbee, W. D., Amiel, D. et al. 2009. Biomechanical, structural, and biochemical indices of degenerative and osteoarthritic deterioration of adult human articular cartilage of the femoral condyle. Osteoarthritis Cartilage. 17(11), pp.1469-1476.
The Center for Orthopaedics & Sports Medicine. 2003. ACI: General Information. [online]. Available from World Wide Web: <http://www.arthroscopy.com/sp08024.htm>
The collagen molecule: Collagen structure. 2014. [online]. Available from World Wide Web: <https://www.proto-col.com/blog/2014/07/collagen/>
The INSTRUCT Products. 2015. [online]. Available from World Wide Web: <http://www.cellcotec.com/technology/instruct-products/>
Therapeutic trajectory following intra-articular hyaluronic acid injection in knee osteoarthritis - meta-analysis. 2011. R.R. Bannuru, N.S. Natov, U.R. Dasi, C.H. Schmid, T.E. McAlindon. 19, pp.611-619.
Thorpe, A. A., Boyes, V. L., Sammon, C., and Le Maitre, C. L. 2016. Thermally triggered injectable hydrogel, which induces mesenchymal stem cell differentiation to nucleus pulposus cells: Potential for regeneration of the intervertebral disc. Acta Biomater. 36, pp.99-111.
Tortorella, M. D., Malfait, A. M., Deccico, C., and Arner, E. 2001. The role of ADAM-TS4 (aggrecanase-1) and ADAM-TS5 (aggrecanase-2) in a model of cartilage degradation. Osteoarthritis Cartilage. 9(6), pp.539-552.
Tortorella, M. D., Pratta, M., Liu, R. Q., Austin, J., Ross, O. H. et al. 2000. Sites of aggrecan cleavage by recombinant human aggrecanase-1 (ADAMTS-4). J Biol Chem. 275(24), pp.18566– 73.
Torzilli, P. A. and Grigiene, R. 1998. Continuous cyclic load reduces proteoglycan release from articular cartilage. Osteoarthritis Cartilage. 6(4), pp.260-8.
Torzilli, P. A., Grigiene, R., Borrelli, Jr. J., and Helfet, D. L. 1999. Effect of impact load on articular cartilage: cell metabolism and viability, and matrix water content. J Biomech Eng. 121(5), pp.433-41.
Trattnig, S., Ba-Ssalamah, A., Pinker, K., Plank, C., Vecsei, V., and Marlovits, S. 2005. Matrix-based autologous chondrocyte implantation for cartilage repair: noninvasive monitoring by high-resolution magnetic resonance imaging. Magn Reson Imaging. 23, pp.779-787.
Tu, R. S. and Tirrell, M. 2004. Bottom-up design of biomimetic assemblies. Adv Drug Deliv Rev. 56(11), pp.1537-1563.
Ulijn, R. V. and Smith, A. M. 2008. Designing peptide based nanomaterials. Chem Soc Rev. 37(4), pp.664-675.
University of Arizona. 2001. Peptide Bond Formation. [online]. Available from World Wide Web: <http://www.blc.arizona.edu/courses/schaffer/182/peptidebond.HTM>
Urban, J. P. 1994. The Chondrocyte: a cell under presure. British Journal of Rheumatology. 33, pp.901-908.

241
Vacanti, C. A., Langer, R., Schloo, B., and Vacanti, J. P. 1991. Synthetic Polymers seeded with chondorcytes provides a template for new cartilage formation. Plast Reconstr Surg. 88, pp.753-759.
Van den Berg, W. B. 1997. Lessons for joint destruction from animal models. Curr Opin Rheumatol. 9(3), pp.221-8.
Van Lent, P. L., Blom, A. B., van der Kraan, P., Holthuysen, A. E., Vitters, E. et al. 2004. Crucial role of synovial lining macrophages in the promotion of transforming growth factor beta-mediated osteophyte formation. Arthritis Rheum. 50(1), pp.103-11.
Van Osch, G. J., Mandi, E.W., Jahr, H., Koevoet, W., Nolst-Trenite, G., and Verhaar, J. A. 2004. Considerations on the use of ear chondrocytes as donor chondrocytes for cartilage tissue engineering. Biorheology. 41, pp.411-421.
Vangsness, C. T. Jr., Spiker, W., and Erickson, J. 2009. A Review of Evidence -Based Medicine for Glucosamine and Chondroitin Sulfate Use in Knee Osteoarthritis. Arthroscopy. 25(1), pp.86-94.
Varaprasad, K., Raghavendra, G. M., Jayaramudu, T., Yallapu, M. M., and Sadiku, R. 2017. A mini review on hydrogels classification and recent developments in miscellaneous applications. Materials Science and Engineering: C. 79, pp.958-971.
Vasiliadis, H. S. and Tsikopoulos, K. 2017. Glucosamine and chondroitin for the treatment of osteoarthritis. World J Orthop. 18(8), pp.1-11.
Veje, K., Hyllested-Winge, J. L., and Ostergaard, K. 2003. Topographic and zonal distribution of tenascin in human articular cartilage from femoral heads: normal versus mild and severe osteoarthritis. Osteoarthritis Cartilage. 11(3), pp.217-27.
Versier, G. and Dubrana, F. 2011. Treatment of knee cartilage defect in 2010. Orthop Traumatol Surg Res. 97(8), pp.S140-S153.
Vinatier, C. and Guicheux, J. 2016. Cartilage tissue engineering: From biomaterials and stem cells to osteoarthtitis treatments. Annals of Physical and Rehabilitation Medicine. 59, pp.139-144.
Vincent, K. R., Conrad, B. P., Fregly, B. J., and Vincent, H. K. 2012. The Pathophysiology of Osteoarthritis: A Mechanical Perspective on the Knee Joint. PM R. 4(5 Supp), pp.S3-9.
Visser, M., Bouter, L. M., McQuillan, G. M., Wener, M. H., and Harris, T. B. 1999. Elevated C-reactive protein levels in overweight and obese adults. JAMA. 282(22), pp.2131-5.
Voet, D. and Voet, J. G. 1995. Biochemistry. New York: John Wiley and Sons.
Voss, B., El-Othmani, M. M, Schnur, A. K., Botchway, A., Mihalko, W. M., and Saleh, K. J. 2016. A Meta-Analysis Comparing All-Polyethylene Tibial Component to Metal-Backed Tibial Component in Total Knee Arthroplasty: Assessing Survivorship and Functional Outcomes. The Journal of Arthroplasty. 31(11), pp.2628-2636.
Wachs, R. A., Hoogenboezem, E. N., Huda, H. I., Xin, S., Porvasnik, S. L., and Schmidt, C. E. 2017. Creation of an injectable in situ gelling native extracellular matrix for nucleus pulposus tissue engineering. The Spine Journal. 17(3), pp.435-444.
Walker, P. S., Dowson, D., Longfield, M. D., and Wright, V. 1968. Boosted lubrication in synovial joints by fluid entrapment and enrichment. Ann Rheum Dis. 27(6), pp.512-20.
Walsh, D. A., Bonnet, C.S., Turner, E.L., Wilson, D., Situ, M., and McWilliams, D. F. 2007. Angiogenesis in the synovium and at the osteochondral junction in osteoarthritis. Osteoarthritis Cartilage. 15, pp.743-51.

242
Wan, S., Borland, S., Richardson, S. M., Merry, C. L. R., Saiani, A., and Gough, J. E. 2016. Self-assembling peptide hydrogel for intervertebral disc tissue engineering. Acta Biomaterialia. 46, pp.29-40.
Wang, J. H., Jia, F., Gilbert, T. W., and Woo, S. L. 2003. Cell orientation determines the alignment of cell-produced collagenous matrix. J Biomech. 36(1), pp.97 –102.
Wilder, F. V., Hall, B. J., Barrett, J. P. Jr., and Lemrow, N. B. 2002. History of acute knee injury and osteoarthritis of the knee: a prospective epidemiological assessment. The Clearwater Osteoarthritis Study. Osteoarthritis & Cartilage. 10, pp.911-6.
Williams, D. A., Farrell, M. J., Cunningham, J., Gracely, R. H., Ambrose, K., and Cupps, T. 2004. Knee pain and radiographic osteoarthritis interact in the prediction of levels of self-reported disability. Arthritis & Rheumatism. 51, pp.558-61.
Williams, D. H. and Fleming, I. 1995. Spectroscopic methods in organic chemistry. Maidenhead: McGraw-Hill Book Company.
Williams, A., Sharma, L., McKenzie, C. A., Prasad, P. V., and Burstein, D. 2005. Delayed gadolinium-enhanced magnetic resonance imaging of cartilage in knee osteoarthritis: Findings at different radiographic stages of disease and relationship to malalignment. Arthritis & Rheumatism. 52, pp.3528-35.
Wilshaw, S. P., Aggeli, A., Fisher, J., and Ingham, E. 2008. The biocompatibility and immunogenicity of self-assembling peptides for use in tissue engineering and regenrative applications. Tissue Eng Part A. 14, pp.785-785.
Wilson, W., Huyghe, J. M., and Donkelaar, C. C. v. 2007. Depth-dependent compressive equilibrium properties of articular cartilage explained by its composition. Biomechan Model Mechanobiol. 6, pp.43-53.
Wise, B. L., Niu, J., Yang, M., Lane, N. E., Harvey, W. et al. 2012. Patterns of compartment involvement in tibiofemoral osteoarthritis in men and women and in Caucasians and African Americans. Arthritis Care Res. 64(4), pp.847-52.
Withdrawal Assessment Report: Hyalograft C Autograft. 2013. London.
Wu, J. L., Liao, C. Y. Zhang, J., Cheng, W. Z., Zhou, N., Wang, S., and Wan, S. 2011. Incorporation of protein-loaded microspheres into chitosan–polycaprolactone scaffolds for controlled release. Carbohydr Polym. 86(2), pp.1048-1054.
Xavier, J. R., Thakur, T., Desai, P., Jaiswal, M. K., Sears, N. et al. 2015. Bioactive nanoengineered hydrogels for bone tissue engineering: a growth-factor-free approach. ACS Nano. 9(3), pp.109-18.
Xie, Z., Aphale, N. V., Kadapure, T. D., Wadajkar, A. S., Orr, S. et al. 2015. Design of antimicrobial peptides conjugated biodegradable citric acid derived hydrogels for wound healing. J Biomed Mater Res A. 103(12), pp.3907-18.
Xu, F. F., Wang, Y. C., Sun, S., Ho, A. S., Lee, D. et al. 2015. Comparison between self-assembling peptide nanofiber scaffold (SAPNS) and fibrin sealant in neurosurgical hemostasis. Clin Transl Sci. 8(5), pp.490-4.
Yamagata, T., Saito, H., Habuchi, O., and Suski, S. 1968. Purification and Properties of Bacterial Chondroitinases and Chondrosulfatases. The Journal of Biological Chemistry. 243(7), pp.1523-1535.
Yan, L. P., Wang, Y. J., Ren, L., Wu, G., Caridade, S. G. et al. 2010. Genipin-cross-linked collagen/chitosan biomimetic scaffolds for articular cartilage tissue engineering applications. J Biomed Mater Res A. 95(2), pp.465-475.

243
Young, A. A., Smith, M. M., Smith, S. M., Cake, M. A., Ghosh, P. et al. 2005. Regional assessment of articular cartilage gene expression and small proteoglycan metabolism in an animal model of osteoarthritis. Arthritis Res Ther. 7(4), pp.852-61.
Zanetti, M., Ratcliffe, A., and Watt, F. M. 1985. Two subpopulations of differentiated chondrocytes identified with a monoclonal antibody to keratan sulfate. J Cell Biol. 101(1), pp.53-59.
Zaslav, K., Cole, B., Brewster, R., DeBerardino, T., Farr, J., Fowler, P., and Nissen, C. 2009. A prospective study of autologous chondrocyte implantation in patients with failed prior treatment for articular cartilage defect of the knee e results of the Study of the Treatment of Articular Repair (STAR) Clinical Trial. Am J Sports Med. 37(1), pp.42-55.
Zhang, S., Gelain, F., and Zhao, X. 2005. Designer self-assembling peptide nanofiber scaffolds for 3D tissue cell cultures. Semin Cancer Biol. 15(5), pp.413-420.
Zhang, Y. and Jordan, J. M. 2010. Epidemiology of Osteoarthritis. Clin Geriatr Med. 26(3), pp.355–369.
Zhang, Y., Xu, L., Nevitt, M.C., Aliabadi, P., Yu, W., and Qin, M. 2001. Comparison of the prevalence of knee osteoarthritis between the elderly Chinese population in Beijing and whites in the United States: The Beijing Osteoarthritis Study. Arthritis & Rheumatism. 44, pp.2065-71.
Zhao, G., Yin, S., Liu, G., Cen, L., Sun, J. et al. 2009. In vitro engineering of fibrocartilage using CDMP1 induced dermal fibroblasts and polyglycolide. Biomaterials. 30(19), pp.3241-50.
Copyright © 2022 FDOKUMEN