Usefulness of extra-articular ultrasound applied to systemic ...
Upload
independentCategory
view
3download
0
23Na MRI Accurately Measures Fixed Charge Density inArticular Cartilage
Erik M. Shapiro,* Arijitt Borthakur, Alexander Gougoutas, and Ravinder Reddy
One of the initiating steps of osteoarthritis is the loss of pro-teoglycan (PG) molecules from the cartilage matrix. Onemethod for assessing cartilage integrity, therefore, is to mea-sure the PG content or fixed charge density (FCD) of cartilage.This report shows the feasibility of calculating FCD by 23Na MRIand introduces MRI protocols for human studies, in vivo. 23NaMRI was used to measure the sodium concentration insidebovine patellar cartilage. The sodium concentration was thenconverted to FCD (mM) by considering ideal Donnan equilib-rium. These FCD measurements were compared to FCD mea-surements obtained through standard dimethylmethylene bluePG assays. There was a high correlation (slope � 0.89, r2 � 0.81)between the FCD measurements obtained by 23Na MRI andthose obtained by the PG assays. These methods were thenemployed in quantifying the FCD of articular cartilage of humanvolunteers in vivo. Two imaging protocols were compared: oneusing a birdcage coil, the other using a transmit/receive surfacecoil. Both methodologies gave similar results, with the averagesodium concentration of normal human patellar cartilage rang-ing from ��240 to 260 mM. This corresponds to FCDs of –158mM to –182 mM. Magn Reson Med 47:284–291, 2002.© 2002 Wiley-Liss, Inc.
Osteoarthritis (OA) is a metabolically active joint disorderof multiple etiologies. It is generally described as degrada-tion of the cartilage matrix with symptoms of joint stiffnessand swelling, bony enlargements, and pain. Biochemi-cally, it is associated with reduced proteoglycan (PG) con-tent, increased water content, and changes in the arrange-ment of collagen molecules. OA affects over 40 millionAmericans and more than 80% of people age 55 and older(1). As there is no cure for OA, an early diagnosis wouldallow for many treatment options, including the adminis-tration of possible chondroprotective agents, strategies formechanical stress reduction, changes in physical activity,and occupational changes. Additionally, proper monitor-ing of cartilage health during the drug discovery process isthe only way to evaluate potential therapeutic agents dur-ing development.
It has been well established that one of the primarystages of cartilage degeneration is the loss of PG from theextracellular matrix. This has been demonstrated by study-ing natural and induced PG depletion in animal models forOA (2–5), and diseased human specimens (6–9), and bylaboratory PG depletions on ex vivo specimens using en-zymes (10–14). This loss can be correlated to the severity
of the disease based on histological grading schemes (8).Additionally, it has been found that the PG produced bythe chondrocytes in osteoarthritic cartilage is similar tojuvenile PG with respect to both the amount of chon-droitin-6-sulfate and chondroitin-4-sulfate, and to theamount of keratan sulfate produced (15). Furthermore, PGfragments can be found in synovial fluid (16).
Several experimental MRI methods aimed at achievingearly indications of cartilage degeneration have been re-ported. These methods all measure PG content indirectlythrough a charged diffusible tracer compound. Manganeseions (17,18) and nitroxide free radicals (2) interact electro-statically with the negatively charged PG and distributeaccording to where the PG occurs in the cartilage. Oncedistributed, they produce a relaxation enhancement effecton the water to create contrast. However, these two speciesare toxic and no safe delivery system has yet been devised.
The most popular contrast agent being used to measureFCD in cartilage, in vivo, is negatively charged Gd-(DTPA)2– (11,19–24). As opposed to the previously men-tioned contrast agents, this ion maps the absence of PG inthe cartilage. The rationale for this is that the negativelycharged PG will repel Gd(DTPA)2– unless there is a va-cancy. This vacancy allows Gd(DTPA)2– to enter the car-tilage and distribute according to the degree of PG loss. Asa paramagnetic contrast agent, Gd(DTPA)2– relaxes thewater associated with it much more efficiently, causing adrop in T1 and a change in the signal intensity. In calcu-lating FCD by this method, one computes a T1 map basedon post-Gd(DTPA)2– injection images and calculates theconcentration of contrast agent in the tissue (25). ThisGd(DTPA)2– concentration is then related to glycosamino-glycan concentration ([GAG]). However, there are someproblems associated with this technique. First, effectivepenetration of the contrast agent requires several hours,accompanied by joint exercise. Second, maps must beacquired quickly so that the contrast agent concentrationdoes not change during the experiment. Third, thismethod currently assumes that the relaxivity of Gd-(DTPA)2– in cartilage is equal to the relaxivity of Gd-(DTPA)2– in saline. However, it has recently been shownthat the relaxivity of Gd(DTPA)2– depends on the macro-molecular content of the tissue (26), and it is well knownthat the macromolecular content of articular cartilage var-ies with depth. This suggests that the relaxivity of Gd-(DTPA)2– is not constant throughout the tissue, which willlead to errors in quantifying [GAG]. Additionally, the spec-ificity of [GAG] quantitation may be in question becausecollagen depletion may alter the relaxivity of the contrastagent, which in turn would be manifested in the GAGmeasurement. Lastly, possible interactions of the contrastagent with potential chondroprotective agents have to bemeasured.
Department of Radiology, University of Pennsylvania, Philadelphia, Pennsyl-vania.Grant sponsor: NIH; Grant numbers: RR02305; R01-AR45242-01.*Correspondence to: Erik M. Shapiro, Ph.D., National Institutes of Health,National Institute for Neurological Disorders and Stroke, Laboratory for Func-tional and Molecular Imaging, 10 Center Drive, B10/B1D118, Bethesda, MD20892. E-mail: [email protected] 11 July 2001; revised 21 September 2001; accepted 24 September2001.
Magnetic Resonance in Medicine 47:284–291 (2002)
© 2002 Wiley-Liss, Inc.DOI 10.1002/mrm.10054
284

One major consequence associated with the loss of PG isthe loss of sodium ions from the tissue. The loss of thenegatively charged PG lowers the FCD in the tissue,thereby releasing positively charged sodium ions. Thisloss can be calculated by considering ideal Donnan equi-librium:
FCD(mM) ��Na�
bath�2
�Na�tissue�
� �Na�tissue�, [1]
where [Na�bath] is the sodium concentration in the bath
and [Na�tissue] is the sodium concentration in the tissue
(27). [Na�bath] in synovial fluid is typically 140–150 mM,
while in phosphate-buffered saline (PBS) it is 154 mM.Normal human cartilage FCD ranges from � –50 to –250mM, depending on age and location (28).
23Na NMR spectroscopy has extensively been used tostudy PG-depleted cartilage (11,12,27,29–35). Many ofthese studies showed that the relaxation times of the 23Nanuclei are altered in degraded cartilage, or that the signalintensity of the 23Na MR image is less intense for degradedcartilage. For example, Lesperance et al. (27) showed that23Na NMR spectroscopy can track FCD in cartilage plugs.They also obtained a low-resolution sodium image of acartilage specimen, but FCD was not calculated. Insko etal. (12) not only showed the progressive loss of sodiumNMR signal with increased PG degradation, but also dem-onstrated changes in the 23Na relaxation times. Anotherexperiment by Reddy et al. (30) showed that trypsin deg-radation of the PG in cartilage decreases the sodium inten-sity in a 23Na MRI image. Furthermore, several studieshave shown 23Na MRI and MRS to be completely feasiblein vivo (30,32,36,37).
The objective of the experiments detailed in this workwere to: 1) compare the FCD calculations obtained through23Na MRI with those obtained by standard chemical PGassays, 2) optimize RF coils and strategies for in vivoapplications of this method, and 3) demonstrate the feasi-bility of in vivo quantitation of FCD by 23Na MRI.
MATERIALS AND METHODS
In Vitro FCD Mapping
Nine whole veal patellae were carefully split down thelong axis, through the cartilage and bone, yielding twoconnected halves. Acrylic dishes were built with imper-meable dividers in the center, creating two separate cham-bers. The patellae were placed in the dish, cartilage sidedown, with the divider wedged in the break in the patel-lae. One chamber contained a trypsin and PBS solution,while the other had only PBS. Trypsin concentrationswere 20, 50, or 200 �g/ml. Degradation lasted 2 hr. Afterdegradation, the patellae were soaked in fresh PBS toremove the trypsin and then imaged.
Imaging experiments were performed on a 4.0T GESigna Scanner at the University of Pennsylvania Hospital.The resonance frequency of 23Na at 4.0T is 45 MHz. So-dium quantitation was performed by co-imaging the patel-lae with saline/agarose calibration phantoms as generallydescribed and validated previously (38). These phantoms
were 150, 200, 250, and 300 mM NaCl in 10% agarose. A23Na 3D gradient-echo pulse sequence was employed witha 7-cm solenoid volume coil, TR � 80 ms, TE � 2.4 ms,FOV � 16 � 16 cm, 256 � 64 matrix size, slice thickness �4.0 mm, and NEX � 16. The TR was chosen to be 80 ms toavoid potential problems associated with an increase in23Na T1 in degraded cartilage (12). The frequency-encodedirection was chosen to place the highest resolutionthrough the depth of the cartilage. The 256 � 64 matrixwas reconstructed to 256 � 256 by standard GE recon-struction methods. A calibration curve correlating pixelintensity with [Na] was calculated from the phantoms,with compensation forT*2 differences between the phan-toms and the cartilage. A 5.5-msT*2 was used for the carti-lage, and a 9-msT*2 was used for the phantoms. No dispar-ity of theT*2 for degraded vs. nondegraded cartilage waspresent, as the broadening of the 23Na line due to magneticfield inhomogeneities outweighed the change in linewidthdue to degradation. T1 compensation was not necessarybecause the images were acquired with TR � 4 T1’s. Thiscalibration curve was then applied to the 23Na MR image,yielding pixel values in concentration units (millimolarsodium). The solid content of the cartilage was compen-sated for by assuming an overall water volume fraction of0.82 (39). FCD was then calculated by equations derivedassuming ideal Donnan equilibrium.
Following imaging, the two cartilage halves were priedoff the bone and digested separately with 0.5 mg/ml pa-pain in PBS overnight at 60°C. Standard dimethylmethyl-ene blue (DMMB) assays on both the cartilage and thesoaking mediums were performed (40). These providedmeasurements of total [GAG], which allowed the compu-tation of FCD. The DMMB solution was prepared by thefollowing procedure: 8 mg of DMMB was added to496.5 ml of doubly-deionized water which contained 1 gsodium formate, 2.5 ml ethanol, and 1 ml formic acid(pH � 3.6, A535 � 0.47). Absorbances at 535 nm weremeasured with a Spectronic UV1 Spectrophotometer(Thermo Spectronic, Rochester, NY). Absorbance was cal-ibrated vs. known concentrations of chondroitin sulfate C(Sigma Chemicals, St. Louis, MO), which ranged from
FIG. 1. Setup for a surface coil experiment in which the phantomsare placed on top of the kneecap. The calibration curve is generatedfrom the plane within the phantoms that is equidistant from the coilas the patellar cartilage.
23Na MRI Accurately Measures FCD 285
0–300 �g/ml in PBS. Then 50 �l of each calibration point(N � 6) was added to 2 ml of the DMMB medium in a4.5-ml methacrylate cuvette, and the % transmittance wasread immediately. The standard curve was generated byplotting the absorbance of each calibration point vs. themass of the chondroitin sulfate. Referencing the spectrom-
eter to zero concentration was accomplished with 50 �lPBS in 2 ml DMMB medium. The samples from both thepapain digestions and the degradation media were madeby bringing 15 �l of the papain digestions or 5 �l of thedegradation media up to 50 �l total volume with PBS, andadding 2 ml DMMB. The % transmittance was read imme-diately and the amount of [GAG] was determined from thestandard curve. The total [GAG] for each specimen wascalculated by adding the [GAG] determined from the deg-radation media with that determined from the papain di-gest. [GAG] in the control sides was determined solelyfrom the papain digest medium. FCD was calculated from[GAG] by assuming 2 moles of negative charge per mole ofchondroitin sulfate (one sulfate and one carboxylate) and amolecular weight of chondroitin sulfate of 502.5 g/mole(11,27). The calculation of FCD from the PG assay is shownin Eq. [2]:
FCD(mM) ��GAG�mg/L� � �2
502.5�mg/mmol. [2]
FCD was calculated from the 23Na MR images using Eq. [1].
Human Imaging Protocols
Two human imaging protocols were tested. All humanexperiments were performed under an IRB-approved tech-nical development protocol. The first imaging protocolinvolved the use of a quadrature birdcage that was 17 cmin diameter and 12.5 cm long, with 16 struts. Three so-dium calibration phantoms, 150, 200, and 250 mM NaCl in10% agarose, were simultaneously imaged with the entireknee joint of five healthy volunteers. The phantoms wereplaced on the side of the patella. Imaging parameters wereas follows: data matrix � 256 � 64, 16 slices, FOV �20 cm, slice thickness � 6.0 mm, NEX � 22, TR � 80 ms,
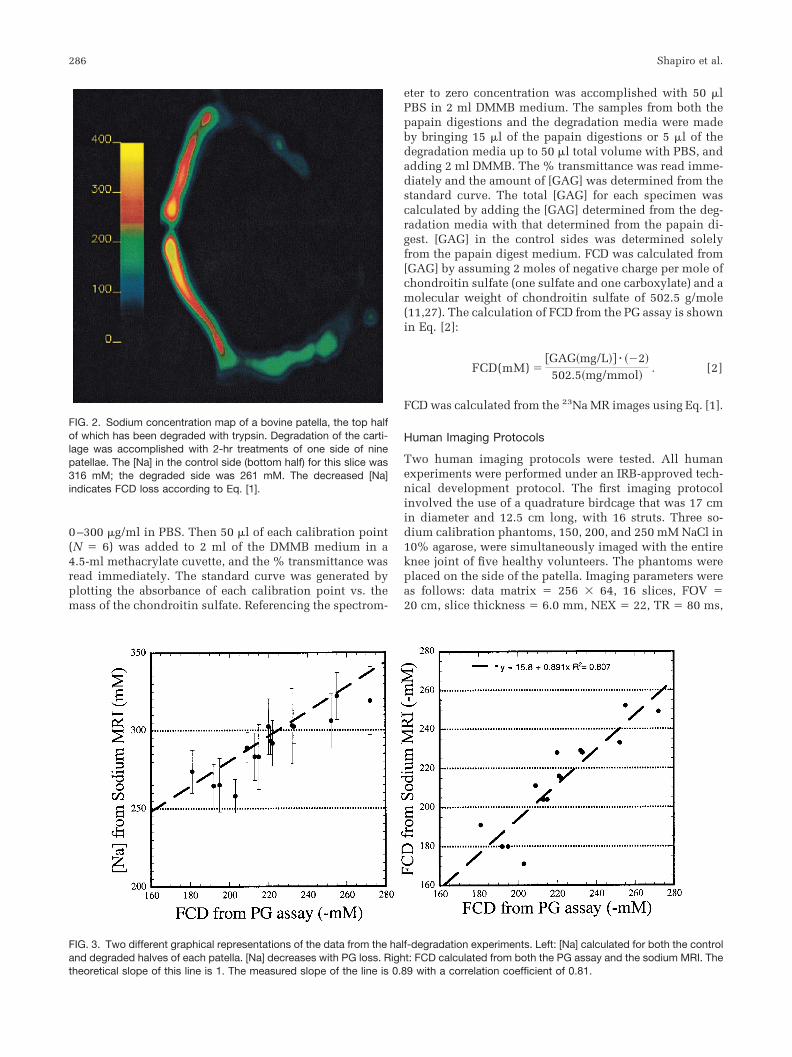
FIG. 2. Sodium concentration map of a bovine patella, the top halfof which has been degraded with trypsin. Degradation of the carti-lage was accomplished with 2-hr treatments of one side of ninepatellae. The [Na] in the control side (bottom half) for this slice was316 mM; the degraded side was 261 mM. The decreased [Na]indicates FCD loss according to Eq. [1].
FIG. 3. Two different graphical representations of the data from the half-degradation experiments. Left: [Na] calculated for both the controland degraded halves of each patella. [Na] decreases with PG loss. Right: FCD calculated from both the PG assay and the sodium MRI. Thetheoretical slope of this line is 1. The measured slope of the line is 0.89 with a correlation coefficient of 0.81.
286 Shapiro et al.

TE � 2.4 ms, and flip angle � 90°. The 256 � 64 matrixwas reconstructed to 256 � 256 by standard GE recon-struction methods. The number of averages was chosen tobe 22 to achieve a sufficient signal-to-noise ratio (SNR),while limiting the duration to 30 min. A 4.5-msT*2 wasused in the [Na] map calculation, as initial results with invitro human samples indicated this reducedT*2 comparedto bovine samples.
The second protocol is depicted in Fig. 1, and was asfollows. Four sodium phantoms were constructed as rect-angular bars, 60 � 60 � 10 mm. The concentrations were100, 150, 200, and 250 mM in 10% agarose. An 8-cm-diameter surface coil was placed on the patella of threehealthy volunteers so as to position the patellar cartilage�2 cm from the coil. Two high [Na] phantoms were placedat the edge of the coil to mark its position in the images.The four calibration phantoms were placed on the kneecapand included in the FOV. The imaging parameters wereidentical to the birdcage coil experiments except for theacquisition time, which was 22 min. Fewer sums (16 NEX)were needed compared with the birdcage coil experimentsto yield images of adequate SNR. After acquiring the im-ages, the calibration curve was generated by using regionsof interest (ROIs) in the phantoms that were as far awayfrom the coil as the plane of the patellar cartilage. Thiscurve was then applied to the image, yielding [Na] maps.
RESULTS AND DISCUSSION
Treatment of one side of the bovine patellae with trypsin,in addition to biological variability, yielded samples witha broad range of FCD. This was beneficial for many rea-sons, but most of all for generating many unique datapoints. Previous studies have concentrated on distinguish-ing between degraded halves and nondegraded halves ofpatellar cartilage sections and measuring changes in PG.However, in this study the focus was on quantitativelymeasuring the FCD by 23Na MRI, regardless of whether thecartilage was degraded or not. This is the type of measure-ment we would perform as part of an in vivo screeningprogram to evaluate cartilage integrity.
The image in Fig. 2 is a [Na] map calculated from arepresentative slice from a 3D 23Na MRI data set, showingthe degraded side (top) and the control side (bottom). It
can be seen in the image that the sodium content, reflectedby the barscale in the image, is lower in the degraded sidethan the control side. The average [Na] on the degradedside was 261 mM, while it was 316 mM on the controlside, with minima of �150 mM on the peripheral edges ofthe tissue. These [Na] measurements correspond to aver-age FCDs of –192 mM and –260 mM, respectively, ascalculated from Eq. [1]. [Na] was highest in the center ofthe cartilage, for both the degraded and the control sides.As was expected, this corresponded to the areas of highestPG content in cartilage.
The bovine degradation experimental data are summedup in two similar figures. Figure 3 (left) shows the average[Na] calculated from eight complete 23Na MRI data sets,plotted against the FCD calculated by the PG assay. Six-teen data points were used, arising from both halves ofeight patellae. One patella was not used because it was anoutlier. This was established using Chauvenet’s criterion,
FIG. 4. a: Axial proton fat-suppressedfast spin-echo image of a human kneejoint. Two phantoms are included in theFOV: a water phantom (bright and right),and a fat phantom (dark and left). b: Axial23Na MRI of the same knee joint. Threephantoms are included in the FOV. Thecenter phantom is shaded because it isthe end of the tube. The threshold wasadjusted to yield maximum contrast be-tween the cartilage and the surroundingtissue, thereby maximizing the signal in-tensities in the other two phantoms.
FIG. 5. Five calibration curves from different slices in a 23Na MRI 3Ddata set.
23Na MRI Accurately Measures FCD 287
with the source of the error being possible leaking of thedegradation chamber (41). The dashed line is the calcu-lated [Na] fitted using Eq. [1]. The bathing medium wasPBS, so [Nabath] in Eq. [1] was 154 mM. It can be seen herethat the measured [Na] are close to the predicted values,using ideal Donnan equilibrium, with the majority of theaverages being slightly less than the predicted values.However, one should not assume error in the 23Na MRIfrom this, as the PG assay is never considered to be 100%quantitative. The PG assay suffers from several inherenterrors, mainly involving precipitation of the DMMB-GAGcomplex and the nonlinearity present in the GAG calibra-tion curves (42).
Figure 3 (right) is a plot of the average FCD calculatedfrom each complete 23Na MRI data set vs. the FCD calcu-lated by the PG assay. The theoretical slope of the line is1 if we assume both measurements should give the sameanswer. We obtained a slope of 0.89, with a high correla-tion (r2 � 0.81). We conclude from this that it is possible tomeasure FCD in cartilage with 23Na MRI with an accuracyof at least 90%, with respect to those calculations per-formed with a PG assay. This is the first time that FCD hasbeen calculated from a 23Na MRI experiment.
Figure 4 shows anatomical 1H and 23Na MR images ofthe human knee joint. The proton image is shown to ac-
quaint the reader with a more recognizable anatomicalview and to provide a reference for delineation of thecartilage boundaries. Strikingly present in the two imagesare the well defined cartilage layers, particularly in the23Na image. The SNR of the cartilage in the 23Na image is�12:1. Typically, given a patellar length of �30–40 mmand a slice thickness of 6 mm, one would expect to get fourto six slices of the patella in a given data set. As the 23NaMRI was acquired as a 3D data set, a single calibrationcurve was generated and used to process all of the data inthe data set. For the above data set, six slices including thepatella were obtained, with the phantoms appearing wholein five of them. Calibration curves for these five slices werecalculated and averaged to yield the master calibrationcurve that was applied to the entire data set. The meanbackground intensity in the image was used as the y inter-cept. The calibration curves are shown in Fig. 5. This hadthe advantage of removing potential errors in the calcula-tion of [Na] due to spatial imperfections in the phantoms.The robustness of the 23Na MRI can be seen in the slopesof the lines from the different slices. The standard devia-tion of the slope for all of the slices was 1.5% of the mean.
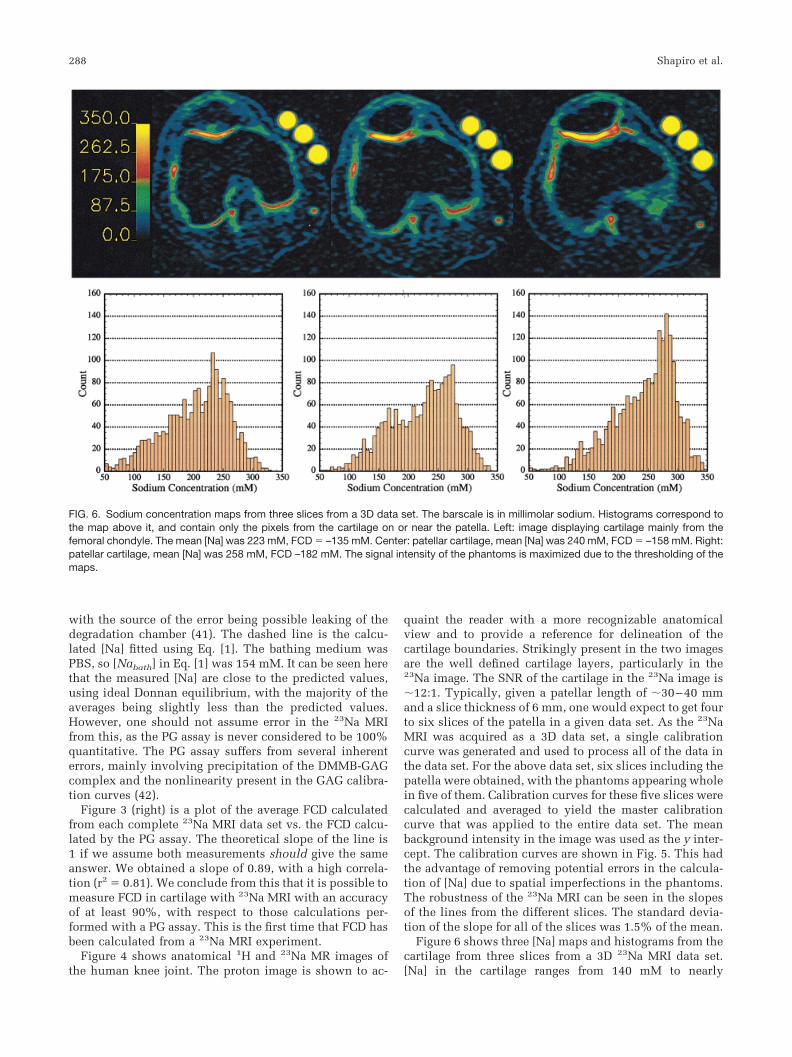
Figure 6 shows three [Na] maps and histograms from thecartilage from three slices from a 3D 23Na MRI data set.[Na] in the cartilage ranges from 140 mM to nearly
FIG. 6. Sodium concentration maps from three slices from a 3D data set. The barscale is in millimolar sodium. Histograms correspond tothe map above it, and contain only the pixels from the cartilage on or near the patella. Left: image displaying cartilage mainly from thefemoral chondyle. The mean [Na] was 223 mM, FCD � –135 mM. Center: patellar cartilage, mean [Na] was 240 mM, FCD � –158 mM. Right:patellar cartilage, mean [Na] was 258 mM, FCD –182 mM. The signal intensity of the phantoms is maximized due to the thresholding of themaps.
288 Shapiro et al.
350 mM, corresponding to a maximum FCD of � –270mM. [Na] was higher in the interior layers of the cartilage,with the maximal values being in the center region of thepatella. Lower [Na] can be seen in other structures and atthe edges of the cartilage where there is an interface withother tissues. This phenomenon was observed on all fivepatellae imaged. [Na] was higher in the patella than in thefemoral chondyle. However, this may be a somewhat arti-factual measurement due to the extreme thinness and cur-vature of the chondyle, leading to partial volume effectsand underestimation of [Na]. This would also be true forthe far medial and lateral facets of the patella.
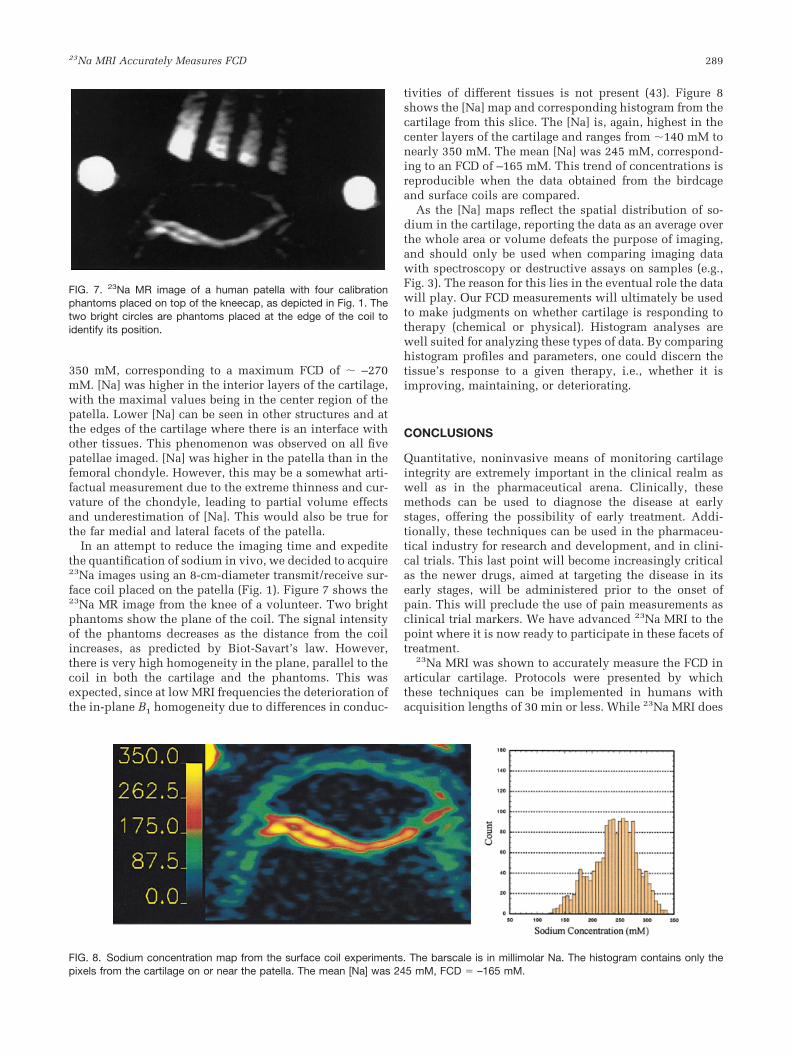
In an attempt to reduce the imaging time and expeditethe quantification of sodium in vivo, we decided to acquire23Na images using an 8-cm-diameter transmit/receive sur-face coil placed on the patella (Fig. 1). Figure 7 shows the23Na MR image from the knee of a volunteer. Two brightphantoms show the plane of the coil. The signal intensityof the phantoms decreases as the distance from the coilincreases, as predicted by Biot-Savart’s law. However,there is very high homogeneity in the plane, parallel to thecoil in both the cartilage and the phantoms. This wasexpected, since at low MRI frequencies the deterioration ofthe in-plane B1 homogeneity due to differences in conduc-
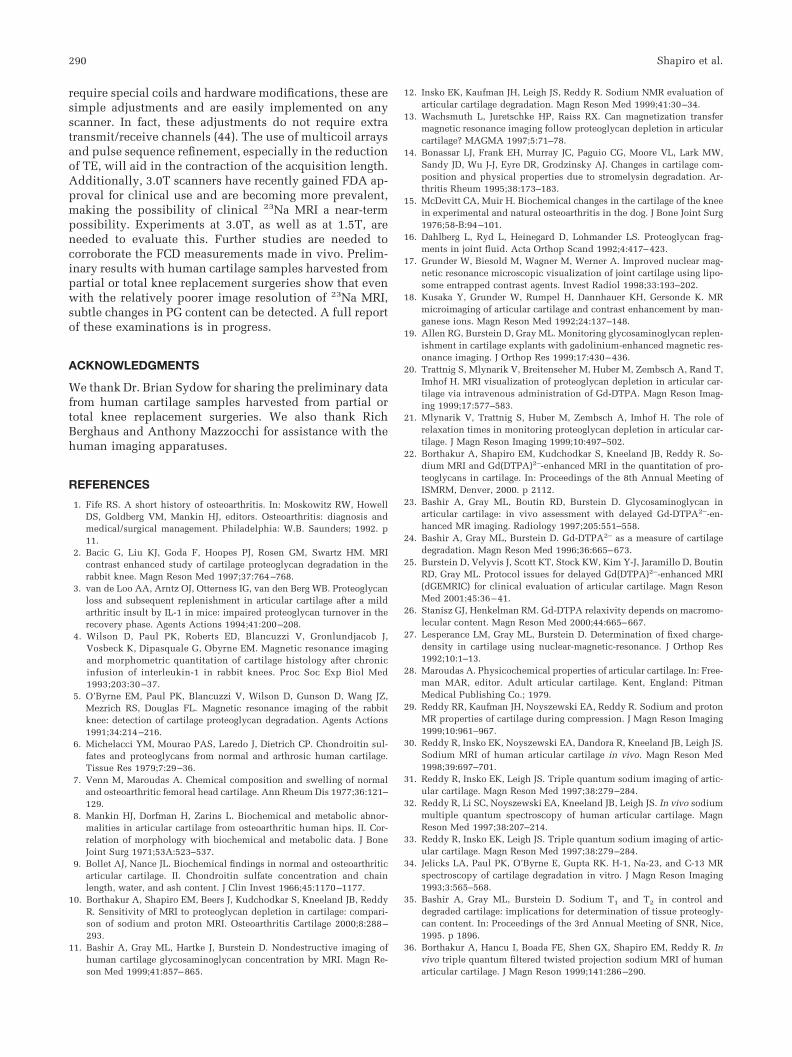
tivities of different tissues is not present (43). Figure 8shows the [Na] map and corresponding histogram from thecartilage from this slice. The [Na] is, again, highest in thecenter layers of the cartilage and ranges from �140 mM tonearly 350 mM. The mean [Na] was 245 mM, correspond-ing to an FCD of –165 mM. This trend of concentrations isreproducible when the data obtained from the birdcageand surface coils are compared.
As the [Na] maps reflect the spatial distribution of so-dium in the cartilage, reporting the data as an average overthe whole area or volume defeats the purpose of imaging,and should only be used when comparing imaging datawith spectroscopy or destructive assays on samples (e.g.,Fig. 3). The reason for this lies in the eventual role the datawill play. Our FCD measurements will ultimately be usedto make judgments on whether cartilage is responding totherapy (chemical or physical). Histogram analyses arewell suited for analyzing these types of data. By comparinghistogram profiles and parameters, one could discern thetissue’s response to a given therapy, i.e., whether it isimproving, maintaining, or deteriorating.
CONCLUSIONS
Quantitative, noninvasive means of monitoring cartilageintegrity are extremely important in the clinical realm aswell as in the pharmaceutical arena. Clinically, thesemethods can be used to diagnose the disease at earlystages, offering the possibility of early treatment. Addi-tionally, these techniques can be used in the pharmaceu-tical industry for research and development, and in clini-cal trials. This last point will become increasingly criticalas the newer drugs, aimed at targeting the disease in itsearly stages, will be administered prior to the onset ofpain. This will preclude the use of pain measurements asclinical trial markers. We have advanced 23Na MRI to thepoint where it is now ready to participate in these facets oftreatment.
23Na MRI was shown to accurately measure the FCD inarticular cartilage. Protocols were presented by whichthese techniques can be implemented in humans withacquisition lengths of 30 min or less. While 23Na MRI does
FIG. 7. 23Na MR image of a human patella with four calibrationphantoms placed on top of the kneecap, as depicted in Fig. 1. Thetwo bright circles are phantoms placed at the edge of the coil toidentify its position.
FIG. 8. Sodium concentration map from the surface coil experiments. The barscale is in millimolar Na. The histogram contains only thepixels from the cartilage on or near the patella. The mean [Na] was 245 mM, FCD � –165 mM.
23Na MRI Accurately Measures FCD 289
require special coils and hardware modifications, these aresimple adjustments and are easily implemented on anyscanner. In fact, these adjustments do not require extratransmit/receive channels (44). The use of multicoil arraysand pulse sequence refinement, especially in the reductionof TE, will aid in the contraction of the acquisition length.Additionally, 3.0T scanners have recently gained FDA ap-proval for clinical use and are becoming more prevalent,making the possibility of clinical 23Na MRI a near-termpossibility. Experiments at 3.0T, as well as at 1.5T, areneeded to evaluate this. Further studies are needed tocorroborate the FCD measurements made in vivo. Prelim-inary results with human cartilage samples harvested frompartial or total knee replacement surgeries show that evenwith the relatively poorer image resolution of 23Na MRI,subtle changes in PG content can be detected. A full reportof these examinations is in progress.
ACKNOWLEDGMENTS
We thank Dr. Brian Sydow for sharing the preliminary datafrom human cartilage samples harvested from partial ortotal knee replacement surgeries. We also thank RichBerghaus and Anthony Mazzocchi for assistance with thehuman imaging apparatuses.
REFERENCES
1. Fife RS. A short history of osteoarthritis. In: Moskowitz RW, HowellDS, Goldberg VM, Mankin HJ, editors. Osteoarthritis: diagnosis andmedical/surgical management. Philadelphia: W.B. Saunders; 1992. p11.
2. Bacic G, Liu KJ, Goda F, Hoopes PJ, Rosen GM, Swartz HM. MRIcontrast enhanced study of cartilage proteoglycan degradation in therabbit knee. Magn Reson Med 1997;37:764–768.
3. van de Loo AA, Arntz OJ, Otterness IG, van den Berg WB. Proteoglycanloss and subsequent replenishment in articular cartilage after a mildarthritic insult by IL-1 in mice: impaired proteoglycan turnover in therecovery phase. Agents Actions 1994;41:200–208.
4. Wilson D, Paul PK, Roberts ED, Blancuzzi V, Gronlundjacob J,Vosbeck K, Dipasquale G, Obyrne EM. Magnetic resonance imagingand morphometric quantitation of cartilage histology after chronicinfusion of interleukin-1 in rabbit knees. Proc Soc Exp Biol Med1993;203:30 –37.
5. O’Byrne EM, Paul PK, Blancuzzi V, Wilson D, Gunson D, Wang JZ,Mezrich RS, Douglas FL. Magnetic resonance imaging of the rabbitknee: detection of cartilage proteoglycan degradation. Agents Actions1991;34:214–216.
6. Michelacci YM, Mourao PAS, Laredo J, Dietrich CP. Chondroitin sul-fates and proteoglycans from normal and arthrosic human cartilage.Tissue Res 1979;7:29–36.
7. Venn M, Maroudas A. Chemical composition and swelling of normaland osteoarthritic femoral head cartilage. Ann Rheum Dis 1977;36:121–129.
8. Mankin HJ, Dorfman H, Zarins L. Biochemical and metabolic abnor-malities in articular cartilage from osteoarthritic human hips. II. Cor-relation of morphology with biochemical and metabolic data. J BoneJoint Surg 1971;53A:523–537.
9. Bollet AJ, Nance JL. Biochemical findings in normal and osteoarthriticarticular cartilage. II. Chondroitin sulfate concentration and chainlength, water, and ash content. J Clin Invest 1966;45:1170–1177.
10. Borthakur A, Shapiro EM, Beers J, Kudchodkar S, Kneeland JB, ReddyR. Sensitivity of MRI to proteoglycan depletion in cartilage: compari-son of sodium and proton MRI. Osteoarthritis Cartilage 2000;8:288–293.
11. Bashir A, Gray ML, Hartke J, Burstein D. Nondestructive imaging ofhuman cartilage glycosaminoglycan concentration by MRI. Magn Re-son Med 1999;41:857–865.
12. Insko EK, Kaufman JH, Leigh JS, Reddy R. Sodium NMR evaluation ofarticular cartilage degradation. Magn Reson Med 1999;41:30–34.
13. Wachsmuth L, Juretschke HP, Raiss RX. Can magnetization transfermagnetic resonance imaging follow proteoglycan depletion in articularcartilage? MAGMA 1997;5:71–78.
14. Bonassar LJ, Frank EH, Murray JC, Paguio CG, Moore VL, Lark MW,Sandy JD, Wu J-J, Eyre DR, Grodzinsky AJ. Changes in cartilage com-position and physical properties due to stromelysin degradation. Ar-thritis Rheum 1995;38:173–183.
15. McDevitt CA, Muir H. Biochemical changes in the cartilage of the kneein experimental and natural osteoarthritis in the dog. J Bone Joint Surg1976;58-B:94–101.
16. Dahlberg L, Ryd L, Heinegard D, Lohmander LS. Proteoglycan frag-ments in joint fluid. Acta Orthop Scand 1992;4:417–423.
17. Grunder W, Biesold M, Wagner M, Werner A. Improved nuclear mag-netic resonance microscopic visualization of joint cartilage using lipo-some entrapped contrast agents. Invest Radiol 1998;33:193–202.
18. Kusaka Y, Grunder W, Rumpel H, Dannhauer KH, Gersonde K. MRmicroimaging of articular cartilage and contrast enhancement by man-ganese ions. Magn Reson Med 1992;24:137–148.
19. Allen RG, Burstein D, Gray ML. Monitoring glycosaminoglycan replen-ishment in cartilage explants with gadolinium-enhanced magnetic res-onance imaging. J Orthop Res 1999;17:430–436.
20. Trattnig S, Mlynarik V, Breitenseher M, Huber M, Zembsch A, Rand T,Imhof H. MRI visualization of proteoglycan depletion in articular car-tilage via intravenous administration of Gd-DTPA. Magn Reson Imag-ing 1999;17:577–583.
21. Mlynarik V, Trattnig S, Huber M, Zembsch A, Imhof H. The role ofrelaxation times in monitoring proteoglycan depletion in articular car-tilage. J Magn Reson Imaging 1999;10:497–502.
22. Borthakur A, Shapiro EM, Kudchodkar S, Kneeland JB, Reddy R. So-dium MRI and Gd(DTPA)2–-enhanced MRI in the quantitation of pro-teoglycans in cartilage. In: Proceedings of the 8th Annual Meeting ofISMRM, Denver, 2000. p 2112.
23. Bashir A, Gray ML, Boutin RD, Burstein D. Glycosaminoglycan inarticular cartilage: in vivo assessment with delayed Gd-DTPA2–-en-hanced MR imaging. Radiology 1997;205:551–558.
24. Bashir A, Gray ML, Burstein D. Gd-DTPA2– as a measure of cartilagedegradation. Magn Reson Med 1996;36:665–673.
25. Burstein D, Velyvis J, Scott KT, Stock KW, Kim Y-J, Jaramillo D, BoutinRD, Gray ML. Protocol issues for delayed Gd(DTPA)2–-enhanced MRI(dGEMRIC) for clinical evaluation of articular cartilage. Magn ResonMed 2001;45:36–41.
26. Stanisz GJ, Henkelman RM. Gd-DTPA relaxivity depends on macromo-lecular content. Magn Reson Med 2000;44:665–667.
27. Lesperance LM, Gray ML, Burstein D. Determination of fixed charge-density in cartilage using nuclear-magnetic-resonance. J Orthop Res1992;10:1–13.
28. Maroudas A. Physicochemical properties of articular cartilage. In: Free-man MAR, editor. Adult articular cartilage. Kent, England: PitmanMedical Publishing Co.; 1979.
29. Reddy RR, Kaufman JH, Noyszewski EA, Reddy R. Sodium and protonMR properties of cartilage during compression. J Magn Reson Imaging1999;10:961–967.
30. Reddy R, Insko EK, Noyszewski EA, Dandora R, Kneeland JB, Leigh JS.Sodium MRI of human articular cartilage in vivo. Magn Reson Med1998;39:697–701.
31. Reddy R, Insko EK, Leigh JS. Triple quantum sodium imaging of artic-ular cartilage. Magn Reson Med 1997;38:279–284.
32. Reddy R, Li SC, Noyszewski EA, Kneeland JB, Leigh JS. In vivo sodiummultiple quantum spectroscopy of human articular cartilage. MagnReson Med 1997;38:207–214.
33. Reddy R, Insko EK, Leigh JS. Triple quantum sodium imaging of artic-ular cartilage. Magn Reson Med 1997;38:279–284.
34. Jelicks LA, Paul PK, O’Byrne E, Gupta RK. H-1, Na-23, and C-13 MRspectroscopy of cartilage degradation in vitro. J Magn Reson Imaging1993;3:565–568.
35. Bashir A, Gray ML, Burstein D. Sodium T1 and T2 in control anddegraded cartilage: implications for determination of tissue proteogly-can content. In: Proceedings of the 3rd Annual Meeting of SNR, Nice,1995. p 1896.
36. Borthakur A, Hancu I, Boada FE, Shen GX, Shapiro EM, Reddy R. Invivo triple quantum filtered twisted projection sodium MRI of humanarticular cartilage. J Magn Reson 1999;141:286–290.
290 Shapiro et al.

37. Granot J. Sodium imaging of human body organs and extremities invivo. Radiology 1988;167:547–550.
38. Shapiro EM, Borthakur A, Dandora R, Kriss A, Leigh JS, Reddy R.Sodium visibility and quantitation in intact bovine articular cartilageusing high field 23Na MRI and MRS. J Magn Reson 2000;142:24–31.
39. Shapiro EM, Borthakur A, Kaufman JH, Leigh JS, Reddy R. Water distri-bution patterns inside bovine articular cartilage as visualized by 1H mag-netic resonance imaging. Osteoarthritis Cartilage 2001;9:533–538.
40. Farndale RW, Sayers CA, Barrett AJ. A direct spectrophotometric mi-croassay for sulfated glycosaminoglycans in cartilage cultures. ConnectTissue Res 1982;9:247–248.
41. Bevington PR, Robinson DK. Data reduction and error analysis for thephysical sciences, 2nd ed. New York: McGraw Hill; 1992.
42. Goldberg RL, Kolibas LM. An improved method for determining pro-teoglycans synthesized by chondrocytes in culture. Connect Tissue Res1990;24:256–275.
43. Collins CM, Smith MB. Calculations of B1 distribution, SNR, and SARfor a surface coil adjacent to an anatomically-accurate human bodymodel. Magn Reson Med 2001;45:692–699.
44. Bolinger L, Mizsei G, Cecil K, Englander S. Sodium imaging of thebreast at 4.0T. In: Proceedings of the 6th Annual Meeting of ISMRM,Sydney, Australia, 1998. p 1923.
23Na MRI Accurately Measures FCD 291
Copyright © 2022 FDOKUMEN