Viscoelastic deformation of articular cartilage during impact loading
7
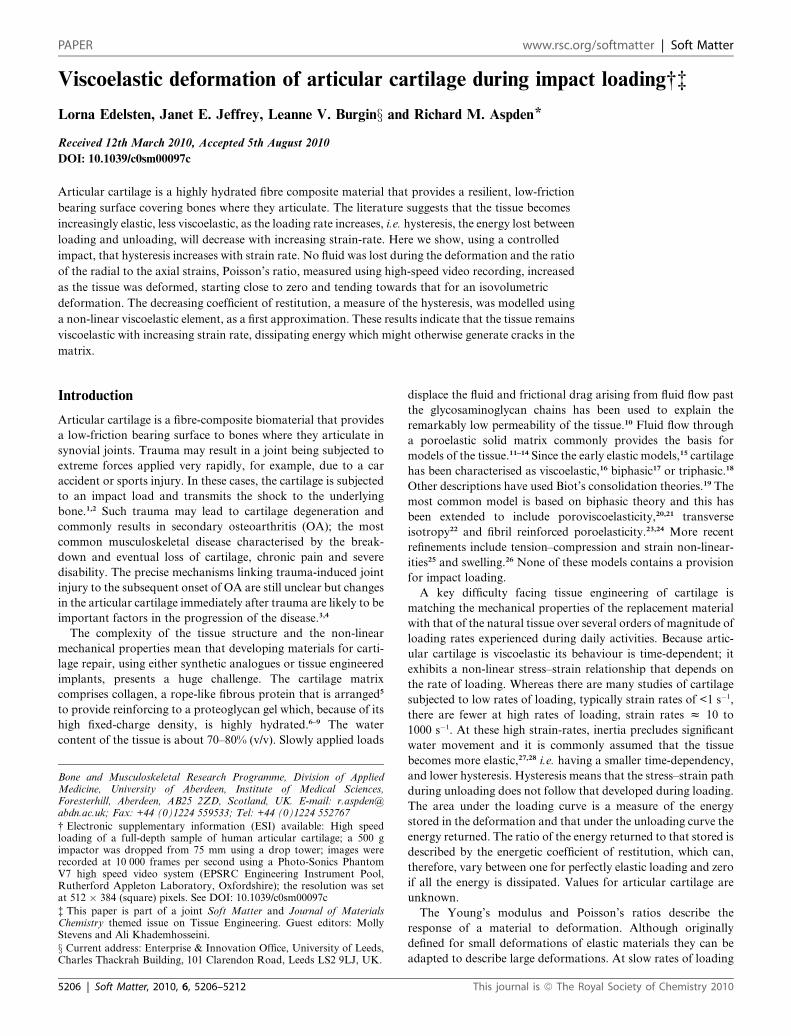
Viscoelastic deformation of articular cartilage during impact loading†‡ Lorna Edelsten, Janet E. Jeffrey, Leanne V. Burginx and Richard M. Aspden * Received 12th March 2010, Accepted 5th August 2010 DOI: 10.1039/c0sm00097c Articular cartilage is a highly hydrated fibre composite material that provides a resilient, low-friction bearing surface covering bones where they articulate. The literature suggests that the tissue becomes increasingly elastic, less viscoelastic, as the loading rate increases, i.e. hysteresis, the energy lost between loading and unloading, will decrease with increasing strain-rate. Here we show, using a controlled impact, that hysteresis increases with strain rate. No fluid was lost during the deformation and the ratio of the radial to the axial strains, Poisson’s ratio, measured using high-speed video recording, increased as the tissue was deformed, starting close to zero and tending towards that for an isovolumetric deformation. The decreasing coefficient of restitution, a measure of the hysteresis, was modelled using a non-linear viscoelastic element, as a first approximation. These results indicate that the tissue remains viscoelastic with increasing strain rate, dissipating energy which might otherwise generate cracks in the matrix. Introduction Articular cartilage is a fibre-composite biomaterial that provides a low-friction bearing surface to bones where they articulate in synovial joints. Trauma may result in a joint being subjected to extreme forces applied very rapidly, for example, due to a car accident or sports injury. In these cases, the cartilage is subjected to an impact load and transmits the shock to the underlying bone. 1,2 Such trauma may lead to cartilage degeneration and commonly results in secondary osteoarthritis (OA); the most common musculoskeletal disease characterised by the break- down and eventual loss of cartilage, chronic pain and severe disability. The precise mechanisms linking trauma-induced joint injury to the subsequent onset of OA are still unclear but changes in the articular cartilage immediately after trauma are likely to be important factors in the progression of the disease. 3,4 The complexity of the tissue structure and the non-linear mechanical properties mean that developing materials for carti- lage repair, using either synthetic analogues or tissue engineered implants, presents a huge challenge. The cartilage matrix comprises collagen, a rope-like fibrous protein that is arranged 5 to provide reinforcing to a proteoglycan gel which, because of its high fixed-charge density, is highly hydrated. 6–9 The water content of the tissue is about 70–80% (v/v). Slowly applied loads displace the fluid and frictional drag arising from fluid flow past the glycosaminoglycan chains has been used to explain the remarkably low permeability of the tissue. 10 Fluid flow through a poroelastic solid matrix commonly provides the basis for models of the tissue. 11–14 Since the early elastic models, 15 cartilage has been characterised as viscoelastic, 16 biphasic 17 or triphasic. 18 Other descriptions have used Biot’s consolidation theories. 19 The most common model is based on biphasic theory and this has been extended to include poroviscoelasticity, 20,21 transverse isotropy 22 and fibril reinforced poroelasticity. 23,24 More recent refinements include tension–compression and strain non-linear- ities 25 and swelling. 26 None of these models contains a provision for impact loading. A key difficulty facing tissue engineering of cartilage is matching the mechanical properties of the replacement material with that of the natural tissue over several orders of magnitude of loading rates experienced during daily activities. Because artic- ular cartilage is viscoelastic its behaviour is time-dependent; it exhibits a non-linear stress–strain relationship that depends on the rate of loading. Whereas there are many studies of cartilage subjected to low rates of loading, typically strain rates of <1 s 1 , there are fewer at high rates of loading, strain rates z 10 to 1000 s 1 . At these high strain-rates, inertia precludes significant water movement and it is commonly assumed that the tissue becomes more elastic, 27,28 i.e. having a smaller time-dependency, and lower hysteresis. Hysteresis means that the stress–strain path during unloading does not follow that developed during loading. The area under the loading curve is a measure of the energy stored in the deformation and that under the unloading curve the energy returned. The ratio of the energy returned to that stored is described by the energetic coefficient of restitution, which can, therefore, vary between one for perfectly elastic loading and zero if all the energy is dissipated. Values for articular cartilage are unknown. The Young’s modulus and Poisson’s ratios describe the response of a material to deformation. Although originally defined for small deformations of elastic materials they can be adapted to describe large deformations. At slow rates of loading Bone and Musculoskeletal Research Programme, Division of Applied Medicine, University of Aberdeen, Institute of Medical Sciences, Foresterhill, Aberdeen, AB25 2ZD, Scotland, UK. E-mail: r.aspden@ abdn.ac.uk; Fax: +44 (0)1224 559533; Tel: +44 (0)1224 552767 † Electronic supplementary information (ESI) available: High speed loading of a full-depth sample of human articular cartilage; a 500 g impactor was dropped from 75 mm using a drop tower; images were recorded at 10 000 frames per second using a Photo-Sonics Phantom V7 high speed video system (EPSRC Engineering Instrument Pool, Rutherford Appleton Laboratory, Oxfordshire); the resolution was set at 512 384 (square) pixels. See DOI: 10.1039/c0sm00097c ‡ This paper is part of a joint Soft Matter and Journal of Materials Chemistry themed issue on Tissue Engineering. Guest editors: Molly Stevens and Ali Khademhosseini. x Current address: Enterprise & Innovation Office, University of Leeds, Charles Thackrah Building, 101 Clarendon Road, Leeds LS2 9LJ, UK. 5206 | Soft Matter , 2010, 6, 5206–5212 This journal is ª The Royal Society of Chemistry 2010 PAPER www.rsc.org/softmatter | Soft Matter
Transcript of Viscoelastic deformation of articular cartilage during impact loading
PAPER www.rsc.org/softmatter | Soft Matter
Viscoelastic deformation of articular cartilage during impact loading†‡
Lorna Edelsten, Janet E. Jeffrey, Leanne V. Burginx and Richard M. Aspden*
Received 12th March 2010, Accepted 5th August 2010
DOI: 10.1039/c0sm00097c
Articular cartilage is a highly hydrated fibre composite material that provides a resilient, low-friction
bearing surface covering bones where they articulate. The literature suggests that the tissue becomes
increasingly elastic, less viscoelastic, as the loading rate increases, i.e. hysteresis, the energy lost between
loading and unloading, will decrease with increasing strain-rate. Here we show, using a controlled
impact, that hysteresis increases with strain rate. No fluid was lost during the deformation and the ratio
of the radial to the axial strains, Poisson’s ratio, measured using high-speed video recording, increased
as the tissue was deformed, starting close to zero and tending towards that for an isovolumetric
deformation. The decreasing coefficient of restitution, a measure of the hysteresis, was modelled using
a non-linear viscoelastic element, as a first approximation. These results indicate that the tissue remains
viscoelastic with increasing strain rate, dissipating energy which might otherwise generate cracks in the
matrix.
Introduction
Articular cartilage is a fibre-composite biomaterial that provides
a low-friction bearing surface to bones where they articulate in
synovial joints. Trauma may result in a joint being subjected to
extreme forces applied very rapidly, for example, due to a car
accident or sports injury. In these cases, the cartilage is subjected
to an impact load and transmits the shock to the underlying
bone.1,2 Such trauma may lead to cartilage degeneration and
commonly results in secondary osteoarthritis (OA); the most
common musculoskeletal disease characterised by the break-
down and eventual loss of cartilage, chronic pain and severe
disability. The precise mechanisms linking trauma-induced joint
injury to the subsequent onset of OA are still unclear but changes
in the articular cartilage immediately after trauma are likely to be
important factors in the progression of the disease.3,4
The complexity of the tissue structure and the non-linear
mechanical properties mean that developing materials for carti-
lage repair, using either synthetic analogues or tissue engineered
implants, presents a huge challenge. The cartilage matrix
comprises collagen, a rope-like fibrous protein that is arranged5
to provide reinforcing to a proteoglycan gel which, because of its
high fixed-charge density, is highly hydrated.6–9 The water
content of the tissue is about 70–80% (v/v). Slowly applied loads
Bone and Musculoskeletal Research Programme, Division of AppliedMedicine, University of Aberdeen, Institute of Medical Sciences,Foresterhill, Aberdeen, AB25 2ZD, Scotland, UK. E-mail: [email protected]; Fax: +44 (0)1224 559533; Tel: +44 (0)1224 552767
† Electronic supplementary information (ESI) available: High speedloading of a full-depth sample of human articular cartilage; a 500 gimpactor was dropped from 75 mm using a drop tower; images wererecorded at 10 000 frames per second using a Photo-Sonics PhantomV7 high speed video system (EPSRC Engineering Instrument Pool,Rutherford Appleton Laboratory, Oxfordshire); the resolution was setat 512 � 384 (square) pixels. See DOI: 10.1039/c0sm00097c
‡ This paper is part of a joint Soft Matter and Journal of MaterialsChemistry themed issue on Tissue Engineering. Guest editors: MollyStevens and Ali Khademhosseini.
x Current address: Enterprise & Innovation Office, University of Leeds,Charles Thackrah Building, 101 Clarendon Road, Leeds LS2 9LJ, UK.
5206 | Soft Matter, 2010, 6, 5206–5212
displace the fluid and frictional drag arising from fluid flow past
the glycosaminoglycan chains has been used to explain the
remarkably low permeability of the tissue.10 Fluid flow through
a poroelastic solid matrix commonly provides the basis for
models of the tissue.11–14 Since the early elastic models,15 cartilage
has been characterised as viscoelastic,16 biphasic17 or triphasic.18
Other descriptions have used Biot’s consolidation theories.19 The
most common model is based on biphasic theory and this has
been extended to include poroviscoelasticity,20,21 transverse
isotropy22 and fibril reinforced poroelasticity.23,24 More recent
refinements include tension–compression and strain non-linear-
ities25 and swelling.26 None of these models contains a provision
for impact loading.
A key difficulty facing tissue engineering of cartilage is
matching the mechanical properties of the replacement material
with that of the natural tissue over several orders of magnitude of
loading rates experienced during daily activities. Because artic-
ular cartilage is viscoelastic its behaviour is time-dependent; it
exhibits a non-linear stress–strain relationship that depends on
the rate of loading. Whereas there are many studies of cartilage
subjected to low rates of loading, typically strain rates of <1 s�1,
there are fewer at high rates of loading, strain rates z 10 to
1000 s�1. At these high strain-rates, inertia precludes significant
water movement and it is commonly assumed that the tissue
becomes more elastic,27,28 i.e. having a smaller time-dependency,
and lower hysteresis. Hysteresis means that the stress–strain path
during unloading does not follow that developed during loading.
The area under the loading curve is a measure of the energy
stored in the deformation and that under the unloading curve the
energy returned. The ratio of the energy returned to that stored is
described by the energetic coefficient of restitution, which can,
therefore, vary between one for perfectly elastic loading and zero
if all the energy is dissipated. Values for articular cartilage are
unknown.
The Young’s modulus and Poisson’s ratios describe the
response of a material to deformation. Although originally
defined for small deformations of elastic materials they can be
adapted to describe large deformations. At slow rates of loading
This journal is ª The Royal Society of Chemistry 2010

the measured Young’s modulus of cartilage is typically quoted as
approximately 1–10 MPa.29–31 The stress–strain relationship,
however, is not linear and values at high rates of loading depend
on the stress as well as on the rate of loading. Maximum moduli,
calculated at the steepest part of the stress–strain curve, are
reported in the range up to about 200 MPa.32–35 At large strain
rates, however, the modulus has been reported to lose much of its
dependency on strain rate.28,35 In an isotropic material Poisson’s
ratio is the negative ratio of transverse to applied longitudinal
strain. It has been measured in cartilage subjected to slow rates of
compression and estimates vary from almost zero to 0.5
depending upon the approach adopted (Table 1). Similar values
have been calculated using biphasic theory in which one of the
variables is ns, the Poisson’s ratio of the solid matrix through
which fluid flows.13 Although it is commonly assumed that
Poisson’s ratio has to be less than 0.5, this is only true for
isotropic, homogenous materials subjected to small strains. For
many modelling purposes it has been assumed that cartilage is
isotropic and incompressible, i.e. experiencing no volume
change, resulting in a value for ns of 0.5.36 There appears to have
been no previous attempt to measure Poisson’s ratio in cartilage
undergoing large strain deformations at high rates of loading.
In this study, we try to address some of these gaps in our
understanding and report preliminary measurements of
Table 1 Published values of Poisson’s ratio measured and calculated for acalculated on the assumption of a poroelastic model in which Poisson’s ratio ito a constitutive equation. Figures are derived from quasi-static testing, and onmin and strain dependence as shown
Study
Tissue
Calculated
Jurvelin et al.43 BovineChahine et al.44 Bovine
HumanKiviranta et al.45 Human
HumanJurvelin et al.46 Human
Cao et al.47 Mouse
Direct optical measurement
Jurvelin et al.43 BovineJin & Lewis48 Bovine
Laasanen et al.49 Bovine
Korhonen et al.50 Bovine
Demarteau et al.51 Bovine
Human
This journal is ª The Royal Society of Chemistry 2010
Poisson’s ratio as a function of longitudinal strain in samples of
articular cartilage subjected to an impact load and examine the
role of hysteresis and the energetic coefficient of restitution. The
hypothesis being tested is that cartilage behaves more elastically
as strain-rate increases. We also present a simple theoretical
analysis to approximate an impact on a viscoelastic material. The
data presented and the modelling indicate that articular cartilage
behaves like a non-linear viscoelastic material at high strain
rates.
Experimental details
Two experiments were performed: high-speed video recording of
impact loading on human cartilage to measure tissue deforma-
tion and a series of impact loadings on bovine cartilage to
measure the energetic coefficient of restitution. For the high
speed video study, articular cartilage was obtained from femoral
heads of two patients (both aged 85, one male and one female)
undergoing hemiarthroplasty following a fractured neck of
femur attributed to osteoporosis. Local Ethics Committee
approval was obtained for the use of this surgical material which
would otherwise have been discarded. The articular cartilage
showed no evidence of fibrillation. Nine, full-depth cartilage
samples, 5 mm in diameter, were removed from sites over the
rticular cartilage. Measured values tend to be larger than those valuess assumed to be for that of the solid matrix and is derived by fitting curvesnly one study measures anisotropy, maximum nmax and minimum values
Valuens
Humeral head 0.174 � 0.106Humeral head, range 0.027–0.065Mean 0.13 � 0.07Femoral head 0.14 � 0.09Metatarsophalangeal 0.30 � 0.07Patella 0.15 � 0.04Femoral groove, normal 0.158 � 0.148Tangential 0.180 � 0.046Tibial plateau 0.2
n
Humeral head 0.185 � 0.065Patella, instantaneous 0.503 � 0.028Patella, equilibrium 0.463 � 0.073Patella 0.24 � 0.09Tibia 0.38 � 0.08Medial femoral condyle 0.30 � 0.1Medial patella groove 0.21 � 0.05Lateral patella groove 0.19 � 0.04Humeral head 0.15 � 0.06Patella 0.16 � 0.05Medial femoral condyle 0.21 � 0.05Humeral head20% strain, nmin 0.075 � 0.05120% strain, nmax 0.17 � 0.0540% strain, nmin 0.10 � 0.0640% strain, nmax 0.17 � 0.06Femoral head20% strain, nmin 0.059 � 0.03720% strain, nmax 0.17 � 0.0540% strain, nmin 0.077 � 0.03440% strain, nmax 0.19 � 0.06
Soft Matter, 2010, 6, 5206–5212 | 5207

femoral head using a cork borer and scalpel37 and stored in
phosphate-buffered saline (PBS) to maintain hydration until
testing. Just prior to testing, each sample was gently dried using
damp gauze to remove surface water. Data for the coefficients of
restitution were obtained from young bovine cartilage used as
part of a previous study in which 83 samples of 5 mm diameter
from the medial metacarpal joint surface were tested.35 All testing
was done on the same day as tissue was removed from the joint.
An instrumented drop tower was used to apply a single defined
impact to each articular cartilage sample. The energy and speed
of impact were determined by the mass and drop height of the
impactor.3,38 The deceleration of the impactor and the force
applied were measured at 50 kHz by an accelerometer attached
to the impactor and a force transducer underneath the sample,
respectively. Force data were converted to engineering stress, s,
by dividing by the original cross-sectional area of the sample.
Accelerometer data were integrated twice, to find the displace-
ment, and divided by the original thickness of the sample to
determine the engineering strain, 3. The mean strain rate was
calculated from the maximum strain divided by the duration of
the impact to that point. A full description of the data collection
and analysis methods have been presented elsewhere.38
For high-speed video recording, six samples (3 from each
patient) were tested at each drop height of 25, 50 and 75 mm
using a 500 g impactor. A Photo-Sonics Phantom V7 high speed
video system (EPSRC Engineering Instrument Pool, Rutherford
Appleton Laboratory, Oxfordshire) was used to record the
deformation of the cartilage during impact. The impacts were
recorded at 10 600 frames per second with a resolution of 512 �384 square pixels. Before recording, the vertical and horizontal
distances were calibrated by recording images of a ruler placed
where the specimen would be. The camera was focused on this
plane and not subsequently adjusted once the ruler was removed
and replaced by a specimen. After recording, images were
transferred to a PC for analysis using Image Pro Plus (version
5.0, Media Cybernetics, Wokingham Berkshire, UK). The
measurement tool within the software was calibrated vertically
and horizontally on the images of the ruler. These calibrations, as
expected, always produced the same factor for both directions.
The distance of the camera from the object and the depth of field
were such that the front and the middle of the sample were in
focus. Measurements of the height and width of each sample
were made from each frame (Fig. 1). The height was measured at
three sites because the front of the loading platen was not in focus
and consequently the top and bottom edges of the sample were
not always clear. The longitudinal, 3z, and radial, 3r, strains were
Fig. 1 Dimensions of each cartilage sample were measured as shown
above in each frame following calibration of the camera; the thickness
was the mean of three measurements and the width was taken across the
widest point of the sample.
5208 | Soft Matter, 2010, 6, 5206–5212
determined from the change in dimension divided by the initial
dimension. Poisson’s ratio, n, was calculated at each time point
from n ¼ �3r/3z.
From each of the bovine cartilage samples a force–displace-
ment curve was produced for loading and unloading phases as
described previously.35 Unloading was the unconstrained
rebound of the impactor. The impactor mass was 100 g. Drop
heights used and the number of samples tested, N, were 25 mm
(N¼ 21), 50 mm (N¼ 23), 80 mm (N¼ 20) and 100 mm (N¼ 19).
The energy of deformation, Wc, was found from the area under
the loading curve by integrating to the maximum strain (Origin
Software, Version 6.1; Aston Scientific Ltd, Stoke Mandeville),
and the energy released during restitution, Wr, by integrating the
unloading curve from this point back to zero strain. The square
of the energetic coefficient of restitution is then given by e*2 ¼
�Wr/Wc.39 For a perfectly elastic collision e* ¼ 1, and for
a plastic collision, in which all the kinetic energy is dissipated,
e* ¼ 0. Least squares curve fitting was done using SigmaPlot
(v.10, Systat Software Inc.).
Results and discussion
Poisson’s ratio
Articular cartilage deforms non-linearly when subjected to an
impact load and a typical impact is shown in the ESI video†.
Stress and strain data recorded from adjacent sites in the same
femoral head for three different drop heights of an impactor are
shown in Fig. 2 and it can be seen that the peak stress does not
coincide with the peak strain. The initial parts of the loading
curves lie very close together but the peak strain increases as the
drop height is increased. The mean values of the maximum
longitudinal strain, radial strain, and Poisson’s ratio calculated
from the high-speed video images are shown in Table 2 for each
drop height, along with the mean strain rate. Strain rates were
considerably greater for samples from femoral head B because
Fig. 2 Typical stress–strain curves for a 0.5 kg mass dropped from 25, 50
and 75 mm onto samples from one individual showing the dependency on
impact velocity. Unloading is represented by the unconstrained rebound.
This journal is ª The Royal Society of Chemistry 2010

Table 2 Mean values (standard deviation) of the maximum longitudinal strain, 3z, calculated from the accelerometer, compared with that measuredfrom the images, the corresponding maximum radial strain, 3r, and Poisson’s ratio, n, at maximum strain. The strain rate is calculated from the maximumstrain divided by the time taken to achieve that strain. Data are from 3 samples from each of two femoral heads, except one sample was lost due totriggering problems from each femoral head subjected to a 75 mm drop
Drop height Femoral headInstrumented drop tower
Image analysis
Strain rate/s�13z 3z 3r n
25 mm A �0.471 (0.028) �0.475 (0.031) 0.41 (0.15) 0.86 (0.28) 222 (11)25 mm B �0.421 (0.020) �0.376 (0.095) 0.235 (0.094) 0.63 (0.19) 322 (7)50 mm A �0.625 (0.016) �0.637 (0.015) 0.606 (0.040) 0.95 (0.05) 339 (66)50 mm B �0.527 (0.072) �0.475 (0.046) 0.24 (0.13) 0.49 (0.22) 458 (35)75 mm A �0.691 (0.003) �0.681 (0.050) 0.640 (0.033) 0.94 (0.02) 418 (81)75 mm B �0.558 (0.022) �0.521 (0.015) 0.53 (0.10) 1.03 (0.22) 527 (20)
the mean thickness of the cartilage over the femoral head was
1.65 (2.4) mm compared with 2.30 (0.12) mm for samples from
femoral head A. Longitudinal strain values calculated from the
Fig. 3 Plots of Poisson’s ratio as a function of longitudinal strain from each
75 mm. Compressive strain traditionally takes a negative sign but is shown
theoretical ratio calculated for an isovolumetric deformation of a homogeneo
This journal is ª The Royal Society of Chemistry 2010
accelerometer are also shown in Table 2 and were almost iden-
tical to those measured from the images. The variation of Pois-
son’s ratio with applied strain for each drop height is shown in
femoral head, A and B, for drop heights of (a) 25 mm, (b) 50 mm and (c)
positive here for convenience. Also shown as a solid line is a plot of the
us, isotropic material.
Soft Matter, 2010, 6, 5206–5212 | 5209

Fig. 4 A non-linear viscoelastic element predicts a coefficient of resti-
tution that decreases with increasing impact velocity. The data points are
from 4 drop heights for a 0.1 kg impactor onto bovine articular cartilage
and the curve is that fitted from eqn (5) with c/k ¼ 1.402 (standard error
0.092, R2 ¼ 0.87).
Fig. 5 Impact of a mass, M, onto a sample represented by a non-linear
Kelvin–Voigt viscoelastic element comprising a spring, with spring
constant k, in parallel with a dashpot, in which the damping coefficient
depends on displacement, using a damping coefficient of c.
Fig. 3. There was considerable variability but values typically
increased from close to zero and, at large strains, approximated
the theoretical value for an isovolumetric deformation calculated
from:
n ¼ 1
3z
1�
ffiffiffiffiffiffiffiffiffiffiffiffi1
1þ 3z
s !(1)
where 3z is the engineering strain (deformation/original dimen-
sion) in the axial direction. Engineering strains were used in
preference to logarithmic strains to enable comparison with
previous studies. Using logarithmic, or Hencky, strain (et ¼ ln
(xi/x0)), where xi and x0 are the deformed and original dimen-
sions respectively results in Poisson’s ratio being constant and
equal to 0.5 for all applied strains for an isovolumetric defor-
mation. Graphs showing Poisson’s ratio calculated using loga-
rithmic strains are shown in the ESI†. Having only one camera
meant that anisotropic deformations could not be recorded and
this, together with the bulging of the edge of the sample,
precluded the calculation of accurate volume changes and
anisotropic Poisson’s ratios that will be addressed in future
studies.
The initially low values of Poisson’s ratio indicate that the
volume of the tissue is not preserved during the deformation but
may be close to that expected for constant volume towards the
end of the loading phase as the loading rate falls to zero. Despite
the high water content of cartilage no water was seen to be
ejected from the sample during testing. Care was taken to remove
only surface water before testing using a moistened gauze.40 In
a previous study of bovine tissue we weighed the samples before
and after testing and found no measurable mass loss within the
resolution of the balance (0.01 mg, sample mass z 20 mg).35
Despite the large deformations, axial compressive strains of the
order of 50%, these data support there being no bulk flow of
water through the matrix during the test.
Hysteresis
Hysteresis was large and the area between the loading and
unloading parts of the curves increased with impact velocity,
although much of this was due to the increase in maximum strain
due to the unconstrained impact. A decreasing value for the
coefficient of restitution, however, indicated that hysteresis was
actually increasing. The area under the unloading curve is the
energy returned to the impactor by the rebound and the imaging
shows that contact was maintained between the sample and the
impactor throughout the unloading phase. These results show
that the increasingly elastic behaviour of cartilage anticipated
from the literature,27,28 which would result in a reduction in
hysteresis, does not occur. Testing was done in unconfined
compression whereas in vivo the surrounding tissue will afford
considerable support to the loaded region and restrict lateral
deformation. This will make the tissue to appear stiffer and it
may make it appear more elastic.41,42 This effect remains to be
tested in future studies.
Coefficient of restitution
The coefficient of restitution data from bovine cartilage has been
presented in a different form elsewhere35 but mean values are
5210 | Soft Matter, 2010, 6, 5206–5212
shown here plotted as a function of impact velocity u0 (Fig. 4).
The coefficient of restitution, e*, decreases with increasing impact
velocity. To investigate the effects of an impact load on a visco-
elastic material, Stronge39 has presented an analysis of an impact
on a Maxwell element, i.e. a spring and dashpot in series. The
Maxwell element is the simplest linear viscoelastic model and
generates a restoring force that increases smoothly with
compression. In addition, some kinetic energy of normal relative
motion is restored during restitution. The coefficient of
This journal is ª The Royal Society of Chemistry 2010
restitution, however, does not depend on the impact velocity.
Introducing a non-linear dashpot, in which the damping force
depends not only on the velocity but also on the displacement, is
one way in which this limitation can be overcome. Combining
a non-linear dashpot in parallel with a spring produces a varia-
tion on a Kelvin–Voigt model for viscoelasticity in which the
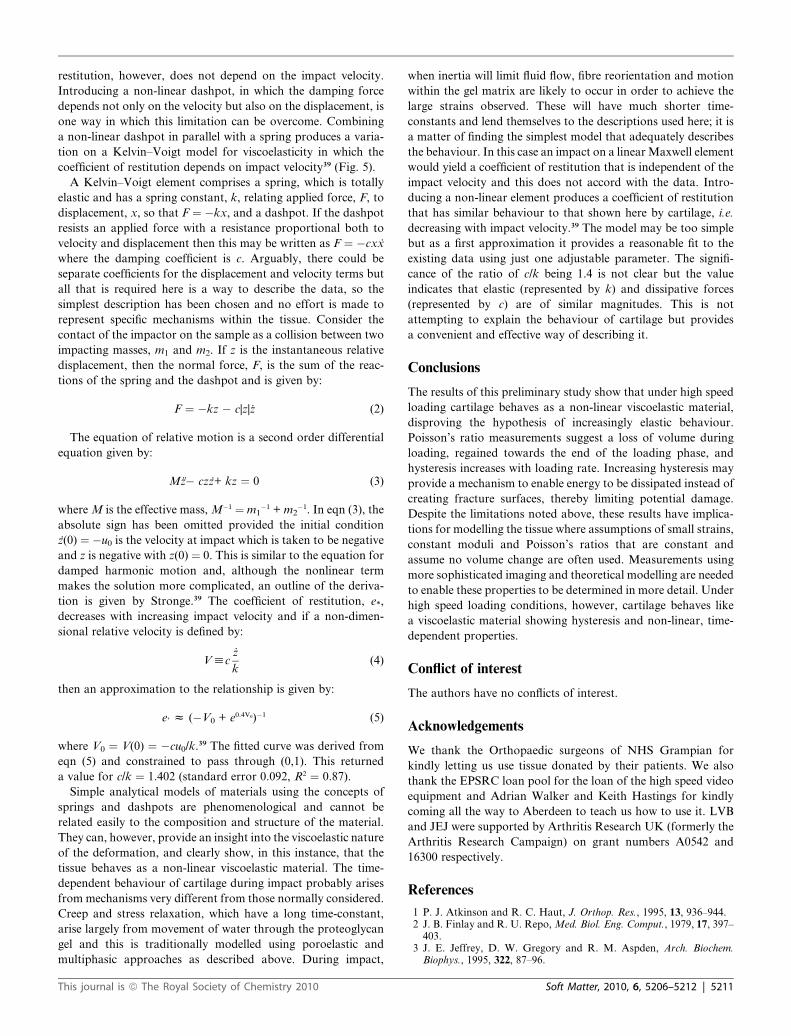
coefficient of restitution depends on impact velocity39 (Fig. 5).
A Kelvin–Voigt element comprises a spring, which is totally
elastic and has a spring constant, k, relating applied force, F, to
displacement, x, so that F ¼ �kx, and a dashpot. If the dashpot
resists an applied force with a resistance proportional both to
velocity and displacement then this may be written as F ¼ �cxx
where the damping coefficient is c. Arguably, there could be
separate coefficients for the displacement and velocity terms but
all that is required here is a way to describe the data, so the
simplest description has been chosen and no effort is made to
represent specific mechanisms within the tissue. Consider the
contact of the impactor on the sample as a collision between two
impacting masses, m1 and m2. If z is the instantaneous relative
displacement, then the normal force, F, is the sum of the reac-
tions of the spring and the dashpot and is given by:
F ¼ �kz � c|z|z (2)
The equation of relative motion is a second order differential
equation given by:
Mz� czz+ kz ¼ 0 (3)
where M is the effective mass, M�1 ¼ m1�1 + m2
�1. In eqn (3), the
absolute sign has been omitted provided the initial condition
z(0) ¼ �u0 is the velocity at impact which is taken to be negative
and z is negative with z(0) ¼ 0. This is similar to the equation for
damped harmonic motion and, although the nonlinear term
makes the solution more complicated, an outline of the deriva-
tion is given by Stronge.39 The coefficient of restitution, e*,
decreases with increasing impact velocity and if a non-dimen-
sional relative velocity is defined by:
Vhc_z
k(4)
then an approximation to the relationship is given by:
e’ z (�V0 + e0.4V0)�1 (5)
where V0 ¼ V(0) ¼ �cu0/k.39 The fitted curve was derived from
eqn (5) and constrained to pass through (0,1). This returned
a value for c/k ¼ 1.402 (standard error 0.092, R2 ¼ 0.87).
Simple analytical models of materials using the concepts of
springs and dashpots are phenomenological and cannot be
related easily to the composition and structure of the material.
They can, however, provide an insight into the viscoelastic nature
of the deformation, and clearly show, in this instance, that the
tissue behaves as a non-linear viscoelastic material. The time-
dependent behaviour of cartilage during impact probably arises
from mechanisms very different from those normally considered.
Creep and stress relaxation, which have a long time-constant,
arise largely from movement of water through the proteoglycan
gel and this is traditionally modelled using poroelastic and
multiphasic approaches as described above. During impact,
This journal is ª The Royal Society of Chemistry 2010
when inertia will limit fluid flow, fibre reorientation and motion
within the gel matrix are likely to occur in order to achieve the
large strains observed. These will have much shorter time-
constants and lend themselves to the descriptions used here; it is
a matter of finding the simplest model that adequately describes
the behaviour. In this case an impact on a linear Maxwell element
would yield a coefficient of restitution that is independent of the
impact velocity and this does not accord with the data. Intro-
ducing a non-linear element produces a coefficient of restitution
that has similar behaviour to that shown here by cartilage, i.e.
decreasing with impact velocity.39 The model may be too simple
but as a first approximation it provides a reasonable fit to the
existing data using just one adjustable parameter. The signifi-
cance of the ratio of c/k being 1.4 is not clear but the value
indicates that elastic (represented by k) and dissipative forces
(represented by c) are of similar magnitudes. This is not
attempting to explain the behaviour of cartilage but provides
a convenient and effective way of describing it.
Conclusions
The results of this preliminary study show that under high speed
loading cartilage behaves as a non-linear viscoelastic material,
disproving the hypothesis of increasingly elastic behaviour.
Poisson’s ratio measurements suggest a loss of volume during
loading, regained towards the end of the loading phase, and
hysteresis increases with loading rate. Increasing hysteresis may
provide a mechanism to enable energy to be dissipated instead of
creating fracture surfaces, thereby limiting potential damage.
Despite the limitations noted above, these results have implica-
tions for modelling the tissue where assumptions of small strains,
constant moduli and Poisson’s ratios that are constant and
assume no volume change are often used. Measurements using
more sophisticated imaging and theoretical modelling are needed
to enable these properties to be determined in more detail. Under
high speed loading conditions, however, cartilage behaves like
a viscoelastic material showing hysteresis and non-linear, time-
dependent properties.
Conflict of interest
The authors have no conflicts of interest.
Acknowledgements
We thank the Orthopaedic surgeons of NHS Grampian for
kindly letting us use tissue donated by their patients. We also
thank the EPSRC loan pool for the loan of the high speed video
equipment and Adrian Walker and Keith Hastings for kindly
coming all the way to Aberdeen to teach us how to use it. LVB
and JEJ were supported by Arthritis Research UK (formerly the
Arthritis Research Campaign) on grant numbers A0542 and
16300 respectively.
References
1 P. J. Atkinson and R. C. Haut, J. Orthop. Res., 1995, 13, 936–944.2 J. B. Finlay and R. U. Repo, Med. Biol. Eng. Comput., 1979, 17, 397–
403.3 J. E. Jeffrey, D. W. Gregory and R. M. Aspden, Arch. Biochem.
Biophys., 1995, 322, 87–96.
Soft Matter, 2010, 6, 5206–5212 | 5211

4 J. E. Jeffrey, L. A. Thompson and R. M. Aspden, Biochim. Biophys.Acta, Lipids Lipid Metab., 1997, 1334, 223–232.
5 R. M. Aspden and D. W. L. Hukins, Proc. R. Soc. London, Ser. B,1981, 212, 299–304.
6 R. M. Aspden and D. W. L. Hukins, Matrix, 1989, 9, 486–488.7 R. M. Aspden, Proc. R. Soc. London, Ser. B, 1994, 258, 195–200.8 K. L. Goh, J. R. Meakin, R. M. Aspden and D. W. Hukins, J. Theor.
Biol., 2007, 245, 305–311.9 D. W. L. Hukins and R. M. Aspden, Trends Biochem. Sci., 1985, 10,
260–264.10 I. S. Kovach, Biophys. Chem., 1996, 59, 61–73.11 F. Boschetti, F. Gervaso, G. Pennati, G. M. Peretti, P. Vena and
G. Dubini, Biorheology, 2006, 43, 235–247.12 V. C. Mow, M. C. Gibbs, W. M. Lai, W. B. Zhu and
K. A. Athanasiou, J. Biomech., 1989, 22, 853–861.13 A. F. Mak, W. M. Lai and V. C. Mow, J. Biomech., 1987, 20, 703–714.14 A. Oloyede and N. D. Broom, Connect. Tissue Res., 1994, 31, 75–86.15 W. C. Hayes, L. M. Keer, G. Herrmann and L. F. Mockros,
J. Biomech., 1972, 5, 541–551.16 J. R. Parsons and J. Black, J. Biomech., 1977, 10, 21–29.17 V. C. Mow, S. C. Kuei, W. M. Lai and C. G. Armstrong, J. Biomech.
Eng., 1980, 102, 73–84.18 W. M. Lai, J. S. Hou and V. C. Mow, J. Biomech. Eng., 1991, 113,
245–258.19 A. Oloyede and N. D. Broom, Clin. Biomech., 1991, 6, 206–212.20 A. F. Mak, J. Biomech. Eng., 1986, 108, 123–130.21 A. F. Mak, Biorheology, 1986, 23, 371–383.22 B. Cohen, W. M. Lai and V. C. Mow, J. Biomech. Eng., 1998, 120,
491–496.23 L. P. Li, J. Soulhat, M. D. Buschmann and A. Shirazi-Adl, Clin.
Biomech., 1999, 14, 673–682.24 J. Soulhat, M. D. Buschmann and A. Shirazi-Adl, J. Biomech. Eng.,
1999, 121, 340–347.25 F. Boschetti, G. Pennati, F. Gervaso, G. M. Peretti and G. Dubini,
Biorheology, 2004, 41, 159–166.26 W. Wilson, C. C. Van Donkelaar, R. B. van and R. Huiskes,
J. Biomech., 2005, 38, 1195–1204.27 C. G. Armstrong, Proc. Inst. Mech. Eng. [H], 1986, 15, 55–61.28 A. Oloyede, R. Flachsmann and N. D. Broom, Connect. Tissue Res.,
1992, 27, 211–214.29 D. E. Shepherd and B. B. Seedhom, Rheumatology, 1999, 38, 124–132.
5212 | Soft Matter, 2010, 6, 5206–5212
30 M. K. Barker and B. B. Seedhom, Rheumatology, 2001, 40, 274–284.31 G. E. Kempson, in Adult Articular Cartilage, ed. M. A. R. Freeman,
Pitman Medical, Tunbridge Wells, 2nd edn, 1979, pp. 333–414.32 J. E. Jeffrey and R. M. Aspden, Proc. Inst. Mech. Eng. [H], 2006, 220,
677–686.33 E. L. Radin, I. L. Paul and M. Lowy, J. Bone Jt. Surg., 1970, 52A,
444–456.34 G. R. Higginson and J. E. Snaith, Proc. Inst. Mech. Eng. [H], 1979, 8,
11–14.35 L. V. Burgin and R. M. Aspden, J. Mater. Sci.: Mater. Med., 2008,
19, 703–711.36 J. J. Garcia, N. J. Altiero and R. C. Haut, J. Biomech. Eng., 1998, 120,
608–613.37 R. J. Lewis, A. K. MacFarland, S. Anandavijayan and R. M. Aspden,
Osteoarthritis Cartilage, 1998, 6, 383–392.38 L. V. Burgin and R. M. Aspden, Med. Eng. Phys., 2007, 29, 525–530.39 W. J. Stronge, in Impact Mechanics, Cambridge University Press,
Cambridge, 2000.40 A. Maroudas, in Methods in Cartilage Research, ed. A. Maroudas and
K. E. Kuettner, Academic Press Ltd., London, 1990, ch. 53, pp. 211–219.
41 R. M. Aspden, J. Mater. Sci.: Mater. Med., 1990, 1, 100–104.42 R. M. Aspden, J. Biomech., 1990, 23, 623.43 J. S. Jurvelin, M. D. Buschmann and E. B. Hunziker, J. Biomech.,
1997, 30, 235–241.44 N. O. Chahine, C. C. Wang, C. T. Hung and G. A. Ateshian,
J. Biomech., 2004, 37, 1251–1261.45 P. Kiviranta, J. Rieppo, R. K. Korhonen, P. Julkunen, J. Toyras and
J. S. Jurvelin, J. Orthop. Res., 2006, 24, 690–699.46 J. S. Jurvelin, M. D. Buschmann and E. B. Hunziker, Proc. Inst.
Mech. Eng. [H], 2003, 217, 215–219.47 L. Cao, I. Youn, F. Guilak and L. A. Setton, J. Biomech. Eng., 2006,
128, 766–771.48 H. Jin and J. L. Lewis, J. Biomech. Eng., 2004, 126, 138–145.49 M. S. Laasanen, J. T€oyras, R. K. Korhonen, J. Rieppo,
S. Saarakkala, M. T. Nieminen, J. Hirvonen and J. S. Jurvelin,Biorheology, 2003, 40, 133–140.
50 R. K. Korhonen, M. S. Laasanen, J. Toyras, J. Rieppo, J. Hirvonen,H. J. Helminen and J. S. Jurvelin, J. Biomech., 2002, 35, 903–909.
51 O. Demarteau, L. Pillet, A. Inaebnit, O. Borens and T. M. Quinn,Osteoarthritis Cartilage, 2006, 14, 589–596.
This journal is ª The Royal Society of Chemistry 2010