INTERNAL VISCOELASTIC LOADING IN CAT PAPILLARY ...
12
INTERNAL VISCOELASTIC LOADING IN CAT PAPILLARY MUSCLE YU-LAM CHIu, EDMUND W. BALLOU, AND LINCOLN E. FORD Department of Medicine, University of Chicago, Chicago, Illinois 60637 ABSTRACT The passive mechanical properties of myocardium were defined by measuring force responses to rapid length ramps applied to unstimulated cat papillary muscles. The immediate force changes following these ramps recovered partially to their initial value, suggesting a series combination of viscous element and spring. Because the stretched muscle can bear force at rest, the viscous element must be in parallel with an additional spring. The instantaneous extension-force curves measured at different lengths were nonlinear, and could be made to superimpose by a simple horizontal shift. This finding suggests that the same spring was being measured at each length, and that this spring was in series with both the viscous element and its parallel spring (Voigt configuration), so that the parallel spring is held nearly rigid by the viscous element during rapid steps. The series spring in the passive muscle could account for most of the series elastic recoil in the active muscle, suggesting that the same spring is in series with both the contractile elements and the viscous element. It is postulated that the viscous element might be coupled to the contractile elements by a compliance, so that the load imposed on the contractile elements by the passive structures is viscoelastic rather than purely viscous. Such a viscoelastic load would give the muscle a length-independent, early diastolic restoring force. The possibility is discussed that the length-independent restoring force would allow some of the energy liberated during active shortening to be stored and released during relaxation. INTRODUCTION Since introduced by Abbott and Mommaerts in 1959, the papillary muscle has been widely used to study the physio- logical properties of myocardium. Mechanical studies of the preparation are complicated by a stiff parallel com- pliance over a portion of its functioning range and a relatively large series compliance, most of which resides in the crushed tissue where the muscle is gripped. Correction of the measured muscle force and velocity to obtain contractile element force and velocity depends on the arrangement of parallel and series elasticities assumed for the muscle (Hefner and Bowen, 1967; Pollack, 1970). In an effort to define the arrangement, we have made a servo system capable of performing critically damped force or length steps that are complete within 1-2 ms. When such steps are applied to papillary muscle, the immediate responses of both the active and passive muscle are domi- nated by the passive viscoelastic properties of the prepara- tion. Analysis of these responses requires an accurate description of the compliance of the crushed tissue at the ends of the muscle where the preparation is gripped, and so we have devoted a substantial effort to defining the mechanical properties of this artifactually produced com- pliance. The present paper describes the passive properties of the papillary muscle and their possible physiological role. The following paper describes their effect on the mechanical capabilities of the activated preparation, BIOPHYS. J. e Biophysical Society * 0006-3495/82/11/109/12 Volume 40 November 1982 109-120 METHODS Preparation Adult cats were anesthetized with an intraperitoneal injection of 125-250 mg sodium pentobarbital and the hearts excised. Right ventricular papillary muscles were selected to have a free length between the attachments of at least 5 mm, and a diameter <1.1 mm. This selection yielded muscles with a mean cross-sectional area of <1 mm2. Muscles were rejected immediately if the ratio of passive force to actively developed force >0.2 at the length where maximum active force was developed (L,,.). This ratio was <0.15 in all muscles finally studied. During dissection, care was taken to keep the muscle well irrigated with oxygenated physiologic salt solution. After dissection and mounting, the muscles were maintained at 26°-280C and stimulated regularly every 4 s, approximately the optimum frequency for both force development and data collection. To standardize conditions, the muscles were stimulated to contract isometrically for at least seven beats between each isotonic contraction. When passive properties were studied, the eighth stimulus was inhibited and the steps were applied at the same time in the stimulus cycle as when active contractions were studied, so as to relate the passive properties as closely as possible to the active responses. The muscles contracted reproducibly for 16-24 h, and during that time, 1,000-2,000 isotonic contractions were studied. Muscle Attachments. Both ends of the muscle were gripped with 25-jum thick platinum foil clips, larger but similar in shape to those described by Ford et al. (1977). A silk suture was tied around the chordae tendineae to prevent the tendons from slipping out of the clips. A sufficient amount of ventricular tissue was left at the other end to prevent slippage. The size of the clips was selected in each experiment to fit the muscle. In general, the clip at the tendon end was -0.5 mm wide when closed and the other clip was three to four times wider. The preparation $1.00 109
-
Upload
khangminh22 -
Category
Documents
-
view
0 -
download
0
Transcript of INTERNAL VISCOELASTIC LOADING IN CAT PAPILLARY ...

INTERNAL VISCOELASTIC LOADING IN CAT PAPILLARY
MUSCLE
YU-LAM CHIu, EDMUND W. BALLOU, AND LINCOLN E. FORDDepartment ofMedicine, University of Chicago, Chicago, Illinois 60637
ABSTRACT The passive mechanical properties of myocardium were defined by measuring force responses to rapidlength ramps applied to unstimulated cat papillary muscles. The immediate force changes following these ramps
recovered partially to their initial value, suggesting a series combination of viscous element and spring. Because thestretched muscle can bear force at rest, the viscous element must be in parallel with an additional spring. Theinstantaneous extension-force curves measured at different lengths were nonlinear, and could be made to superimposeby a simple horizontal shift. This finding suggests that the same spring was being measured at each length, and that thisspring was in series with both the viscous element and its parallel spring (Voigt configuration), so that the parallel springis held nearly rigid by the viscous element during rapid steps. The series spring in the passive muscle could account formost of the series elastic recoil in the active muscle, suggesting that the same spring is in series with both the contractileelements and the viscous element. It is postulated that the viscous element might be coupled to the contractile elementsby a compliance, so that the load imposed on the contractile elements by the passive structures is viscoelastic rather thanpurely viscous. Such a viscoelastic load would give the muscle a length-independent, early diastolic restoring force. Thepossibility is discussed that the length-independent restoring force would allow some of the energy liberated duringactive shortening to be stored and released during relaxation.
INTRODUCTION
Since introduced by Abbott and Mommaerts in 1959, thepapillary muscle has been widely used to study the physio-logical properties of myocardium. Mechanical studies ofthe preparation are complicated by a stiff parallel com-pliance over a portion of its functioning range and arelatively large series compliance, most of which resides inthe crushed tissue where the muscle is gripped. Correctionof the measured muscle force and velocity to obtaincontractile element force and velocity depends on thearrangement of parallel and series elasticities assumed forthe muscle (Hefner and Bowen, 1967; Pollack, 1970). Inan effort to define the arrangement, we have made a servosystem capable of performing critically damped force orlength steps that are complete within 1-2 ms. When suchsteps are applied to papillary muscle, the immediateresponses of both the active and passive muscle are domi-nated by the passive viscoelastic properties of the prepara-tion. Analysis of these responses requires an accuratedescription of the compliance of the crushed tissue at theends of the muscle where the preparation is gripped, and sowe have devoted a substantial effort to defining themechanical properties of this artifactually produced com-pliance. The present paper describes the passive propertiesof the papillary muscle and their possible physiologicalrole. The following paper describes their effect on themechanical capabilities of the activated preparation,
BIOPHYS. J. e Biophysical Society * 0006-3495/82/11/109/12Volume 40 November 1982 109-120
METHODS
PreparationAdult cats were anesthetized with an intraperitoneal injection of 125-250mg sodium pentobarbital and the hearts excised. Right ventricularpapillary muscles were selected to have a free length between theattachments of at least 5 mm, and a diameter <1.1 mm. This selectionyielded muscles with a mean cross-sectional area of <1 mm2. Muscleswere rejected immediately if the ratio of passive force to activelydeveloped force >0.2 at the length where maximum active force wasdeveloped (L,,.). This ratio was <0.15 in all muscles finally studied.During dissection, care was taken to keep the muscle well irrigated withoxygenated physiologic salt solution. After dissection and mounting, themuscles were maintained at 26°-280C and stimulated regularly every 4 s,approximately the optimum frequency for both force development anddata collection. To standardize conditions, the muscles were stimulated tocontract isometrically for at least seven beats between each isotoniccontraction. When passive properties were studied, the eighth stimuluswas inhibited and the steps were applied at the same time in the stimuluscycle as when active contractions were studied, so as to relate the passiveproperties as closely as possible to the active responses. The musclescontracted reproducibly for 16-24 h, and during that time, 1,000-2,000isotonic contractions were studied.
Muscle Attachments. Both ends of the muscle were grippedwith 25-jum thick platinum foil clips, larger but similar in shape to thosedescribed by Ford et al. (1977). A silk suture was tied around the chordaetendineae to prevent the tendons from slipping out of the clips. Asufficient amount of ventricular tissue was left at the other end to preventslippage. The size of the clips was selected in each experiment to fit themuscle. In general, the clip at the tendon end was -0.5 mm wide whenclosed and the other clip was three to four times wider. The preparation
$1.00 109

was mounted on the apparatus by passing holes in the clips over hooks(1 25-Aim thick) attached to the motor and transducer. The lighter clip atthe tendon end was always placed over the transducer hook.
Fiber Measurement and Photography. Muscle length anddiameter were measured with a reticle in the eyepiece of a dissectingmicroscope set at a total magnification of lOx (Nikon, Inc., InstrumentDiv., Garden City, NJ, model SM-5). In several fibers, carbon granuleswere placed on the surface of the muscle and their movement was used toassess stretching of the compliant ends of the muscle as well as shearingwithin the muscle. To resolve the time course of this movement, cinephotographs of the muscle were taken with a Bolex (Yverdon, Switzer-land) 16-mm camera focused down one eyepiece of the microscope andrun at 64 frames per second.
At the end of the experiment, the muscle was cut out of its attachmentsand weighed. The mean cross-sectional area was determined as weight .(1.05 x L,.), 1.05 gm/cm3 being taken as the density of muscle.
Stimuli. Stimuli were 1-ms duration square pulses passedthrough 3 x 10-mm bright platinum electrodes held against the sides ofthe trough, parallel to the muscle. A 5-KQ potentiometer in series with theelectrodes and a 12 V source was adjusted to give pulses slightly abovethreshold.
Apparatus
Servo Motor and Force Transducer. The rotating coil motorwas identical to that described by Ford et al. (1977) except that it had aslightly shorter extension arm, 30 instead of 41 mm. A canteleveredpiezoelectric force transducer (Chiu et al., 1978) with a 4-mm free lengthof piezoelectric element and a 6-mm glass extension was used. Thetransducer had a compliance of 2.5 ,m/g and a natural resonance of 8KHz, which was sufficiently high that no effort was made to damp it. Thehumidity in the air above the trough tended to short circuit the capacita-tive electrodes in the sensing element. To minimize this current leak, dryair was blown over the transducer throughout the experiment. When usedin this manner, the output of the transducer decayed to the base line witha time constant >25 s following a force step. This decay introduced amaximum error of 2% in the absolute value of force during anycontraction, and an error of <1% in the force during the period ofrecording following a length perturbation. This transducer was used inspite of its inability to produce a steady DC signal because of its highresonant frequency, which is required when the transducer is used toproduce force steps in a servo loop.
Servo SystemThe servo system was very similar to that described by Ford et al. (1977)except that it did not include a sarcomere-length sensor and it did includea delayed-gain amplifier in parallel with the main servo amplifier. Thisadditional amplifier increased the steady-state stiffness of the systemwithout causing the instability that would be created by a similarly highinstantaneous loop gain (Gordon et al., 1966, p. 152). The position of themotor arm could be controlled either by a signal from the motor's internalposition sensor (position control) or by the force signal (force control).Switching between the two types of control was accomplished by a diodeswitching network identical to that used by Ford et al. (1977). In studyingactivated muscle, force was allowed to develop isometrically with thesystem in position control, and then the system was switched into forcecontrol, with force held constant at a fraction of the isometric levelimmediately before the step while the muscle shortened. In studying thepassive muscle, single steps were made from one length to another, withthe system only in position control.
To eliminate base line drift from the force signal and establish areproducible force reference, the output of the force amplifier was passedthrough a "track and hold" circuit (Nakajima et al., 1976). This device
substracted the input from itself, holding the output to zero until a pulsewas applied at the time the muscle was stimulated. With this pulsepresent, the output began at zero and tracked the input signal. The zeroreference is therefore the level of force immediately before stimulation,irrespective of the rest force. The absolute level of rest force wasdetermined by applying sufficiently large releases to make the restingmuscle go slack, and measuring the drop in force. Slackness wasdetermined by showing that an increase in step size produced no furtherdrop in force.
Timing. The timing of all events, including muscle stimula-tion, triggering recording devices, setting camera exposures, and switch-ing of servo system was controlled by digital logic modules made byBRS/LVE Inc. of Beltsville, MD.
RecordingFour types of recordings were made: 35-mm film records of oscilloscopetracings used as permanent, hard records; strip chart recording of forceand length, used to assess muscle performance during the experiments;digital records made by computer and stored on floppy disks; andtransient recordings obtained with a Physical Data, Inc. (Beaverton, OR)513A recorder and displayed on a second oscilloscope immediately aftereach step. These last records were used to judge the speed and quality ofthe steps, and when necessary, to adjust parameters in the servo-loop.
Computer Recording. Analog-to-digital conversion and datastorage was performed by a PDP 11/10 computer (Digital EquipmentCorporation, Marlboro, MA) with an AR 11 input-output device. Typi-cally, 250 10-bit words were sampled sequentially in each of fourchannels, usually at intervals of 200 ,us/channel, recording 10 samples asa base line before the contraction began and 240 samples starting 10sample intervals before the step. In some experiments, data were taken inat 1/4 the above rate, and in all experiments some records were also takenof force and length at 1/20 the normal speed to record entire contractionseach time the length was changed. The four data channels were force,length, and two channels of high gain length used to determine velocity.Force and length signals were amplified and offset so as to nearly fill theinput voltage range of the computer (± 2.5 V) when the largest changes inthe experiments were encountered. The gain settings of these amplifierswere rarely changed during an experiment.
Velocity Recording. Velocity was determined by digitallydifferentiating the length signal. To provide a reasonable degree ofvelocity resolution, the length trace was amplified and fed into twoseparate channels with one offset from the other by -90% of the inputvoltage range. The gain of this amplified length trace was adjustedrepeatedly for different steps so that, as a minimum, it nearly saturatedone input channel, and as a maximum, never quite fully saturated bothinputs. The amplifier gain could be increased manually by successivefactors of two.
Digital Data Storage. Although data were taken into thecomputer with 10 bit analog-to-digital converters, they were stored ineight-bit, byte form for economy. Because velocity never exceeded 255,only the eight least significant bits needed to be stored. The force and lowgain length data were packed into byte form by subtracting the minimumvalue in the trace and successively dividing by two, until the maximumwas <256. This procedure provided a minimum resolution of 1/128 overan eightfold range of data values.
Data display. Oscilloscope displays used in the followingfigures are from digital data stored in the computer and later reconvertedto analog signals. In some displays, the velocity data has been smoothed
BIOPHYSICAL JOURNAL VOLUME 40 1982110
and amplified using the formula (Kendall, 1976, p. 31).
Xi,= - [7Xj + 6(Xi- + Xi+,)
+ 3(Xi,2 + Xi+2) - 2(X, 3 + Xi+3)]* (1)
This provides a digital filter at I KHz. Calculations were always madeon unfiltered data or on data averaged over a specific period of time, asdescribed in the text.
RESULTS
Results were based on data from seven papillary muscleshaving the characteristics shown in Table I. Rest tensionaveraged 6.1 ± 2.3 SD mN/mm2 at Lmax (the length wheremaximum active force was developed) and decreased to37% (I/e) at a length between 0.9 and 0.95 L., Theproperties of the passive (unstimulated) muscle weredefined by applying length ramps completed within 2-10ms and studying the resultant force responses. The proper-ties of the active (stimulated) muscle were defined usingsteps from an isometric length to an isotonic force and bothlength and velocities were studied. These steps were com-plete within 1-2 ms.
The data obtained were analyzed with the goal ofconstructing a conceptual model to simulate the papillarymuscle. First, the basic three-component model was identi-fied, and, as fine points of the data were analyzed,additional refinements of this basic model were made.Also, comparisons between the active and passive musclewere made to study the relationship between the contrac-tile elements and the passive elements.
Length Steps Applied to the Passive Muscle
Extension-force characteristics. When a rapidlength step (either lengthening or shortening) was appliedto the resting muscle, the force change immediately follow-ing the step was greater than that measured in the steadystate. A response to a shortening ramp is shown in Fig. 1(inset); a lengthening ramp would produce similar but
TABLE IPAPILLARY MUSCLES
Muscle Length Weight Cross Developed Restnumber section tension tension
mm mg mm2 N/mm2 mN/mm21 5.0 5.0 0.95 60 5.42 6.0 5.8 0.92 37 6.83 6.4 6.5 0.97 37 2.94 6.0 6.3 1.00 90 5.55 -5.4 2.0 0.35 85 6.66 6.0 1.2 0.19 60 5.07 5.3 2.8 0.50 68 10.4
mean 5.7 4.2 0.70 62 6.1
All measurements made at L,.o.
opposite responses. The force change has four distinctstages (Fig. 1, inset): At the beginning of the ramp, thereis a small, nearly instantaneous drop in force (stage 1).This is followed (stage 2) by a smooth continuous decreasein force for the duration of length change. At the end of theramp, there is a small, rapid increase in force (stage 3),similar in size and time course to the force drop at thebeginning. Finally, there is the slow, gradual phase of forcerecovery towards the steady state after length change hasbeen completed (stage 4). (These stages are not at allrelated to the four "phases" used in the following paper todescribe the transients of the active muscle).
The "immediate" force responses (Fig. 1: 0, -) weremeasured as the force immediately following the ramp,after the nearly instantaneous small jump in force (stage 3)had ended, but before the start of the slow recoverytowards the steady state. Releases were made from threedifferent initial lengths. The steady-state forces (x, ---)were measured after the muscle had remained at eachlength for many minutes. The muscle shown was chosenbecause it had a measurable rest force over a compara-tively long range of length.
Arrangement of Elasticity and Viscosity. Theslow force recovery demonstrated above requires a seriescombination of an elastic element (spring), and a viscouselement (dashpot). Because the muscle bears force at restand because a simple dashpot is freely extensible in thesteady state, the viscous element must be in parallel withanother spring. This spring (labeled p in Fig. 2) couldeither be added in series (Voigt configuration, Fig. 2 A) orin parallel (Maxwell configuration, Fig. 2 B) with the firstspring (spring s). The immediate extension-force curves:~~~~~~~~~~~~~~~~
LE.NMTH (A~
FIGURE I Extension-force characteristics of passive muscle. The recordsin the inset show the way in which the measurements are made. The fourstages, labeled 1-4, are described in the text. Fi, the immediate forceresponse is measured -1 ms after the ramp ended. F,, the steady-stateforce is measured by applying sufficiently large release to make themuscle go slack, and measuring the drop in force. Solid curves and 0represent immediate force levels following a 2 ms ramp starting fromthree different initial lengths (x). Interrupted curve and x, the steady-state force in the muscle after it had remained at each length for manyminutes. The three solid curves represent the same exponential functionshifted horizontally. Muscle No. 2, same muscle used in Figs. 4, 5, 6, and 8.
CHIU ET AL. Viscoelasticity in Heart Muscle III

A B C D E
SE 5S 1:S * $
PE P p p p p p p p d
F AS'I 6IjJS
p dds2 s2
FIGURE 2 Arrangements of springs and viscous elements. Springs thatwould remain extended during shortening are represented as coils, todistinguish them from those that would become compressed, drawn asfolding structures. Arguments are presented in the text to show that A,the Voigt configuration, is a more likely representation of the muscle thanB, the Maxwell configuration. C-F show additions made to A. C showshow the contractile elements of the stimulated muscle, CE, are related tothe passive components. The designations s and p stand for series andparallel, respectively, because of the relationship of the different compo-nents to the contractile elements. Further evidence suggests that the seriesspring is lightly damped, hence the addition of dashpot s in D. Anargument is made that the parallel viscosity is actually viscoelastic, and sospring d has been added in E. Finally, the possibility is considered that thedamped series spring is two separate springs, one at each end of themuscle, and that ends may have different amounts of damping. Thisarrangement is shown in F.
obtained at different lengths shown above were found to benearly identical in that they could be made to superimposeby a simple horizontal shift. This suggests that the samespring was being measured at each length. The Voigtmodel will produce this response because the viscouselement is nearly rigid during rapid length changes andonly the spring in series with it (spring s) changes length.
The extent to which the immediate extension-forcecurves obtained at different lengths could be superimposedwas assessed quantitatively by comparing curves obtainedat two lengths in the seven muscles. The longer length wasL.,, and the shorter length was such that the rest forcewas 34-43% of that at L,-. In two muscles, both stretchesand releases were performed, in the remaining five, onlyreleases were studied. The extension-force curves obtainedat the two lengths were fitted by a least-squares techniqueto an exponential function of the form
T= (T +TI)oeL/k To (2)
where Ti is the initial rest force at length L, and T is theforce at length L = Li + AL. To and k are constantsdetermined by the fitting procedure. These constants rep-resent, respectively, the force asymptote approached atshort lengths and the length constant (the length changerequired to produce an e-fold force change). If twodifferent curves have the same To and k they are superim-posable. When the values of the T. fitted to the curve forthe longer length was compared to the To of the shorterlength they were found to be nearly the same. Paired t-teston the differences between the two groups of To showedthat they were insignificant, with p > 0.9. The averagevalues of To was 0.01 times the rest force at L4,. Pairedt-tests of the differences of the k values also showed thatthey were insignificant (p > 0.9). k averaged 0.2 Lmax
±0.002 SD at Lmax and 1.03 times this value at the shorterlength.'
Defining Parameters ofthe Model. The param-eters of the springs in the Voigt model are determined asfollows: The immediate extension-force curves wereassumed to be determined by the series spring (s) alone, sothat constants used to fit the instantaneous curves wereused to describe it. The steady-state compliance of theoverall model in Fig. 2 A is the sum of the compliances(dL/dT = 1/stiffness) of the two springs in series. Theextension-force characteristics of the parallel spring (p)alone was therefore determined by subtracting the com-pliance of the immediate curves from the steady-statecompliance. In terms of Fig. 1, this was done by subtract-ing, horizontally at each level of force, the length of theimmediate curve from the length of the steady-statecurve.The stiffness of the two springs thus specifies both the
immediate and the steady-state forces for all lengthchanges. The time course of approach to the steady-state isdetermined by the viscous element. For simplicity, it wasassumed to be a simple dashpot and was described by aconstant, Q such that
Q = T . dL/dt (3)
where dL/dt is the rate of length change of the dashpot andT the force across it. The value of Q was chosen such thatthe calculated response most closely resembled the data.
The force responses for the model were calculated by anumerical Runge-Kutta (Carnahan et al., 1969, p. 361)solutions of Eqs. 2 and 3 (see Appendix), using thedigitized length record as a driving function. The value of
'The observation that the average force asymptote, T., was very nearlyzero implies that the immediate stiffness, dT/dL, was approximatelyproportional to Ti and approached zero at short lengths. This findingargues strongly against the Maxwell configuration (Fig. 2 B). In thisconfiguration, the spring s in series with the viscosity becomes compressedduring shortening steps, and for this reason it is drawn as a foldingstructure in Fig. 2 B. Such an element is likely to become more stiff as it iscompressed, while the data would require it to become less stiff, makingthe Maxwell model qualitatively unlikely. A quantitative argumentagainst the Maxwell configuration is based on two considerations: (a)that the two springs in this configuration are in parallel, so that theirstiffness is additive, and (b) that the viscous elements are fully extensiblein the steady-state. Because of the extensibility, the series spring in theMaxwell configuration returns to its rest position and length steps appliedto the overall muscle at any length are always applied to the compressivespring starting at the same, unstressed length. The instantaneous stiff-ness, therefore, should be the sum of the steady-state stiffness, which isdependent on muscle length, and the stiffness of the compressive spring,which is independent of muscle length. When steps are made fromprogressively shorter initial lengths, where the steady-state stiffnessapproaches zero, the instantaneous stiffness should approach the constantvalue of the compressive spring and be independent of the initial length ortension, instead of being proportional to initial force and dependent oninitial length, as found in these experiments.
BIOPHYSICAL JOURNAL VOLUME 40 1982112

the damping factor, Q, in Eq. 3 was adjusted to match therate of partial force recovery following a length step. Theconstants k and T. in Eq. 2 used to describe the seriesspring were also adjusted slightly to account for the forcerecovery during the step. An example of a family of stepsincluding two stretches and two releases, matched in thisway, is shown in Fig. 3 A. The upper four pairs of tracesare the paired calculated and observed force responses. Themiddle four traces are the differences between the pairedresponses. The bottom four traces are the superposedlength records. As shown, the model fits the data moder-ately well.
The damping constants for the parallel viscosity deter-
A.... ...........
the~~~untmlae mucl. Upe panl,orpis offrerepne. The
5 5
b: ....! ..i ... .. ~.............
...-... !-.-.. ~-S -~~-_ -_-
FIGURE~~3oTim cors of r;_Spne to foc an legt stp.Aoc
noisier trace in each pair is the data and the quieter trace is the calculatedresponse, as described in the text. Middle panel, difference betweencalculated and observed force at the same amplification. Lower panel, thefour length records superimposed. The rapid force changes at thebeginning and end of the length ramp, stages 1 and 3, are not as large asthose in the inset of Fig. 1 because the ramps are five times slower. Theyare clearly seen in the difference records, however, as would be expectedsince the calculated responses do not yet attempt to account for these veryrapid changes. B, length responses to four force steps applied to activatedmuscle during four different twitches. Upper panel, superimposed forcerecords. First 4 ins, opposite bottom of the calibration bar, are base lineforce recorded before stimulation. The recording is not continuous, butwaits until 8 ms before the force step, so that the next 8 mns are isometricforce recorded immediately before release. Remainder of trace is isotonicforce following the step. The isotonic force in the largest step goes belowthe base line rest force. Middle panel, superimposed length records.Lower panel, length minus calculated series elastic recoil. Muscle No. 5,same muscle used in Fig. 8.
mined by this procedure averaged 45 ± 10 SD (mN.s/mm2. Lmax) in six muscles.
Fig. 3 A shows that partial force recovery is more rapidfollowing a large stretch than a large release. This differ-ence is due to the exponential nature of the springs, whichare stiffer at higher forces. The nonlinearity of the springsdoes not permit the use of a single time constant to describerecovery speed.
Force Steps Applied to the Active MuscleTo study the relationship of the contractile element to thepassive structures, isotonic force steps were applied toisometrically contracting muscles. Fig. 3 B shows theshortening responses to four steps applied to the activemuscle. These responses include a period of early rapidshortening attributed to shortening of the series spring(series elastic recoil) followed by a slower, isotonic short-ening. The steps were made at Lmax early in the twitch,when developed force was -25% of its maximum, and didnot exceed the greatest force achieved during stretches ofthe passive muscle. In addition, the isotonic force followingthe largest force step was well below the initial force baseline, so that the ranges of force in the active and passivemuscle were directly comparable. The parameters used todescribe the series spring in the passive muscle (thecalculated force response in the upper panel of Fig. 3 A)were also used to calculate the series elastic recoil in theactive muscle. When this calculated amount of shorteningwas subtracted from the length data, isotonic shorteningappears to begin without a rapid initial step from theisometric base line (lowest panel in Fig. 3 B), showing thatthe series springs in the active and passive muscles weresimiliar. This similarity was evaluated further by compar-ing the calculated and measured shortening in 20 forcesteps in each of 7 muscles. 10 steps to different isotonicloads were made early in the contraction and 10 steps weremade at the time of peak force. In the 140 steps examined,the calculated shortening averaged 0.98 ± 0.11 SD of themeasured value. This similarity between the series springin the active and passive muscle, suggests that the samespring is being measured under both conditions, i.e., thatthe spring in series with the passive viscosity is also in serieswith the contractile elements (Fig. 2 C). This conclusion isreinforced by the consideration that the heavily dampedspring (spring p) seen in the passive muscle is unlikely to bein series with the contractile elements. If it were, very littlerapid series elastic recoil would be observed. The proposedarrangement places the viscous element in parallel with thecontractile element, as shown in Fig. 2 C. Because of theserelationships to the contractile elements, the elements inthe lower half of Fig. 2 are labeled PE, for parallelelements, and those in the upper half are labeled SE forseries elements, with the individual components labeled pand s, respectively.
CHIU ET AL. Viscoelasticity in Heart Muscle 113
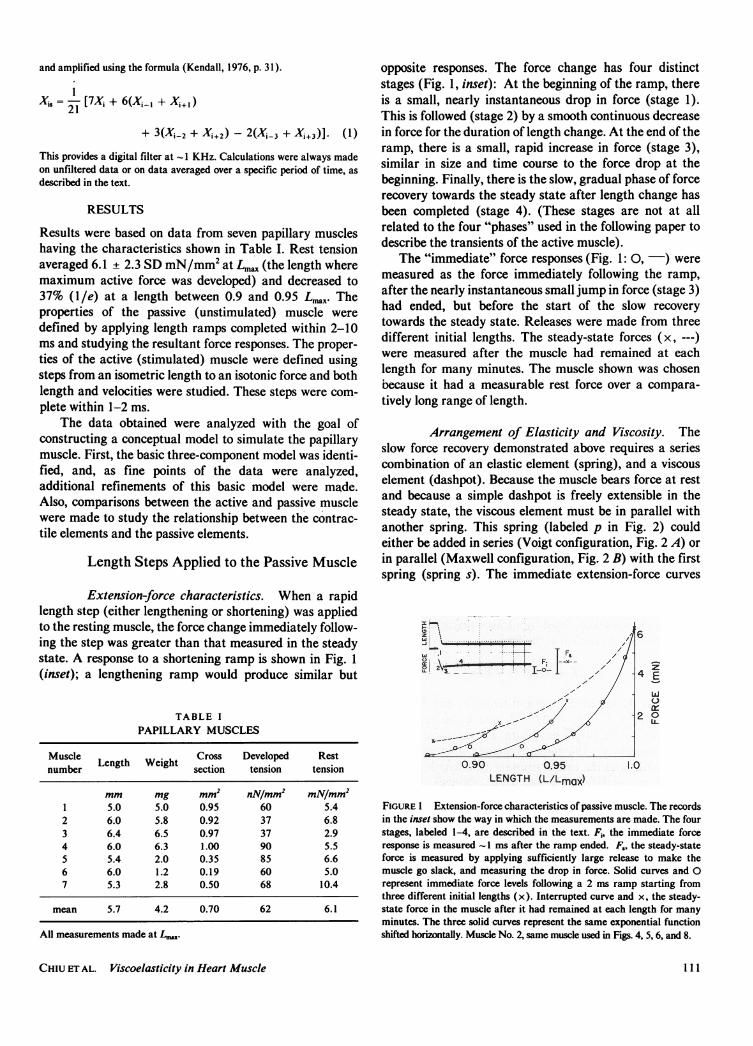
Series Elastic DampingThe length responses to steps made early in the contrac-tion, as in Fig. 3 B, were easier to analyze than those madelater in the contraction. The later steps resulted in a lengthtrace that was considerably rounded, so that it was difficultto determine where the series elastic recoil ended and theisotonic shortening began (Fig. 4). Two factors contributedto this rounding; (a) the rate of isotonic shortening declinedprogressively throughout the trace and (b) the series elasticrecoil persisted for several milliseconds after the stepended, with no discontinuity at the end of the step. Both ofthese features were greatest in steps to the lowest loads,and are more evident in the velocity traces (lower mosttrace in Fig. 4). The persistence of the recoil is also betterseen when the same records are displayed at a faster sweepspeed (Fig. 4 B).
The persistence of the series elastic recoil can beattributed to very light damping of the series spring (Fig.2 D). The damping constant in this case was calculated tobe 200-300 times less than that of the parallel viscosity, sothat the recoil persisted for only a brief time, <3-4 msbeyond the end of the step. Additional evidence for seriesdamping could be found in high speed records of forceresponses during rapid length ramps applied to the passivemuscle. There was a rapid drop in force at the onset of ashortening step and a rapid rise at the end. Small changesof this sort are seen in Fig. 3 A, but are more obvious inFig. 5, where the length changes are five times faster.
........
'
................... , ,_m.
FIGURE 5 Force responses to shortening ramps of passive muscle. Threesizes of ramp, displayed at two sweep speeds each. The records in theleft-hand panels (A, B, C) are displayed in the right-hand panels (D, E,F) at a 2'b times faster speed. Upper trace, length. Second trace, force.Third trace, calculated force response on same scale. Fourth trace,difference between calculated and measured force response, on 2 1/2times larger scale. The disagreement between the calculated response andthe data in the lowest panel is attributed to the muscle going slack at theend of the ramp. The constants used to describe the component in themodel are listed in Table II.
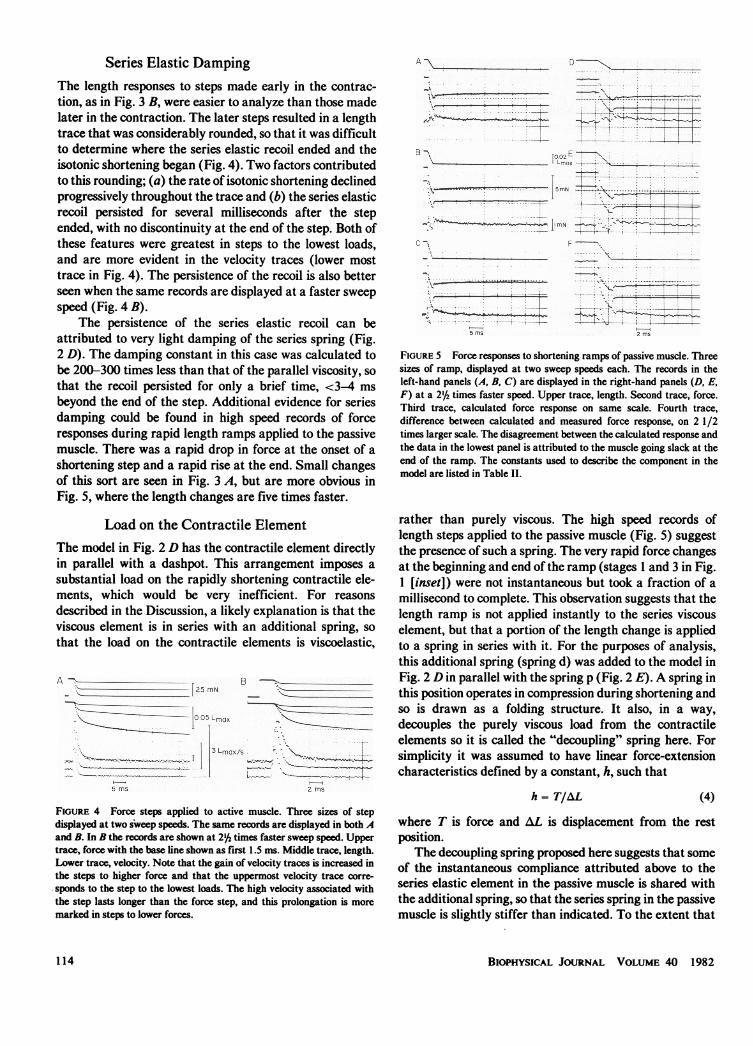
Load on the Contractile ElementThe model in Fig. 2 D has the contractile element directlyin parallel with a dashpot. This arrangement imposes asubstantial load on the rapidly shortening contractile ele-ments, which would be very inefficient. For reasonsdescribed in the Discussion, a likely explanation is that theviscous element is in series with an additional spring, sothat the load on the contractile elements is viscoelastic,
A -_-_-_-_- B ___-_-:__:-:-
: -:s*;....~~~~~~~~~~~~~~~~~~~~~~~~~~~~~~~~~~~~~~~~~~~~~~~~~~~~~~~~~~~.....
:9.w _^91 l~~~ 3Lm:X^=,5 2w- Sm
FIGURE 4 Force steps applied to active muscle. Three sizes of stepdisplayed at two sweep speeds. The same records are displayed in both Aand B. In B the records are shown at 2%4 times faster sweep speed. Uppertrace, force with the base line shown as first 1.5 ms. Middle trace, length.Lower trace, velocity. Note that the gain of velocity traces is increased inthe steps to higher force and that the uppermost velocity trace corre-sponds to the step to the lowest loads. The high velocity associated withthe step lasts longer than the force step, and this prolongation is moremarked in steps to lower forces.
rather than purely viscous. The high speed records oflength steps applied to the passive muscle (Fig. 5) suggestthe presence of such a spring. The very rapid force changesat the beginning and end of the ramp (stages 1 and 3 in Fig.1 [inset]) were not instantaneous but took a fraction of amillisecond to complete. This observation suggests that thelength ramp is not applied instantly to the series viscouselement, but that a portion of the length change is appliedto a spring in series with it. For the purposes of analysis,this additional spring (spring d) was added to the model inFig. 2 D in parallel with the spring p (Fig. 2 E). A spring inthis position operates in compression during shortening andso is drawn as a folding structure. It also, in a way,decouples the purely viscous load from the contractileelements so it is called the "decoupling" spring here. Forsimplicity it was assumed to have linear force-extensioncharacteristics defined by a constant, h, such that
h = T/AL (4)where T is force and AL is displacement from the restposition.
The decoupling spring proposed here suggests that someof the instantaneous compliance attributed above to theseries elastic element in the passive muscle is shared withthe additional spring, so that the series spring in the passivemuscle is slightly stiffer than indicated. To the extent that
BIOPHYSICAL JOURNAL VOLUME 40 1982114
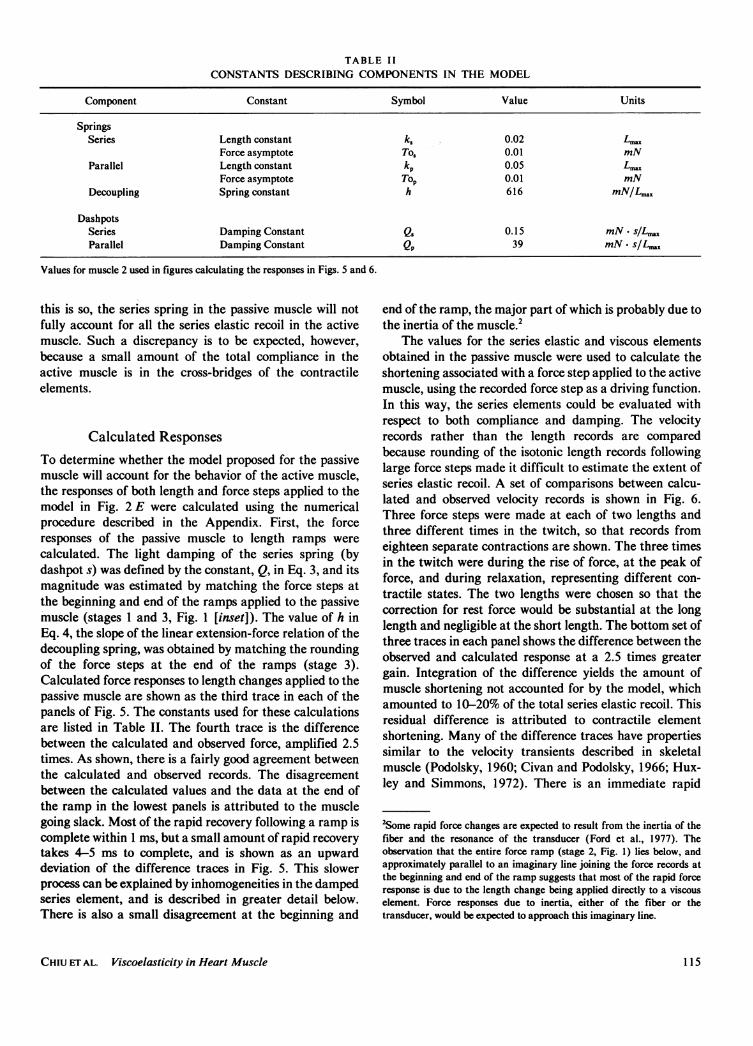
TABLE IICONSTANTS DESCRIBING COMPONENTS IN THE MODEL
Component Constant Symbol Value Units
SpringsSeries Length constant k, 0.02 L..
Force asymptote To. 0.01 mNParallel Length constant kp 0.05 L..
Force asymptote Top 0.01 mNDecoupling Spring constant h 616 mN/L,.x
DashpotsSeries Damping Constant Q, 0.15 mNN*s.L.,Parallel Damping Constant Qp 39 mNNs.L.x
Values for muscle 2 used in figures calculating the responses in Figs. 5 and 6.
this is so, the series spring in the passive muscle will notfully account for all the series elastic recoil in the activemuscle. Such a discrepancy is to be expected, however,because a small amount of the total compliance in theactive muscle is in the cross-bridges of the contractileelements.
Calculated ResponsesTo determine whether the model proposed for the passivemuscle will account for the behavior of the active muscle,the responses of both length and force steps applied to themodel in Fig. 2 E were calculated using the numericalprocedure described in the Appendix. First, the forceresponses of the passive muscle to length ramps werecalculated. The light damping of the series spring (bydashpot s) was defined by the constant, Q, in Eq. 3, and itsmagnitude was estimated by matching the force steps atthe beginning and end of the ramps applied to the passivemuscle (stages 1 and 3, Fig. 1 [inset]). The value of h inEq. 4, the slope of the linear extension-force relation of thedecoupling spring, was obtained by matching the roundingof the force steps at the end of the ramps (stage 3).Calculated force responses to length changes applied to thepassive muscle are shown as the third trace in each of thepanels of Fig. 5. The constants used for these calculationsare listed in Table II. The fourth trace is the differencebetween the calculated and observed force, amplified 2.5times. As shown, there is a fairly good agreement betweenthe calculated and observed records. The disagreementbetween the calculated values and the data at the end ofthe ramp in the lowest panels is attributed to the musclegoing slack. Most of the rapid recovery following a ramp iscomplete within 1 ms, but a small amount of rapid recoverytakes 4-5 ms to complete, and is shown as an upwarddeviation of the difference traces in Fig. 5. This slowerprocess can be explained by inhomogeneities in the dampedseries element, and is described in greater detail below.There is also a small disagreement at the beginning and
end of the ramp, the major part of which is probably due tothe inertia of the muscle.2
The values for the series elastic and viscous elementsobtained in the passive muscle were used to calculate theshortening associated with a force step applied to the activemuscle, using the recorded force step as a driving function.In this way, the series elements could be evaluated withrespect to both compliance and damping. The velocityrecords rather than the length records are comparedbecause rounding of the isotonic length records followinglarge force steps made it difficult to estimate the extent ofseries elastic recoil. A set of comparisons between calcu-lated and observed velocity records is shown in Fig. 6.Three force steps were made at each of two lengths andthree different times in the twitch, so that records fromeighteen separate contractions are shown. The three timesin the twitch were during the rise of force, at the peak offorce, and during relaxation, representing different con-tractile states. The two lengths were chosen so that thecorrection for rest force would be substantial at the longlength and negligible at the short length. The bottom set ofthree traces in each panel shows the difference between theobserved and calculated response at a 2.5 times greatergain. Integration of the difference yields the amount ofmuscle shortening not accounted for by the model, whichamounted to 10-20% of the total series elastic recoil. Thisresidual difference is attributed to contractile elementshortening. Many of the difference traces have propertiessimilar to the velocity transients described in skeletalmuscle (Podolsky, 1960; Civan and Podolsky, 1966; Hux-ley and Simmons, 1972). There is an immediate rapid
2Some rapid force changes are expected to result from the inertia of thefiber and the resonance of the transducer (Ford et al., 1977). Theobservation that the entire force ramp (stage 2, Fig. 1) lies below, andapproximately parallel to an imaginary line joining the force records atthe beginning and end of the ramp suggests that most of the rapid forceresponse is due to the length change being applied directly to a viscouselement. Force responses due to inertia, either of the fiber or thetransducer, would be expected to approach this imaginary line.
CHIU ET AL. Viscoelasticity in Heart Muscle 115

100 % LMOX
BE - -- -- - ~~~~....._.F
. . e~~~~ ......._
... .........
92% Lnx
. . ;L: ..S s Ls................
E_ _ _ _ _ __..........
_~ :
spring were distributed into several components. To testthis hypothesis, the series elements in Fig. 2 E were dividedinto two damped springs of equal compliance and dampingfactors that were different by a factor of 6 (Fig. 2 F). Sucha division might be envisioned physically as representingthe compliance at the two ends of the muscle, with thetendon end having less damping than the crushed tissue atthe other end. The total compliance of these two elementswas equal to that of the single element used in calculatingthe records shown in Fig. 5. The response to a rapid lengthramp applied to the passive muscle was calculated using anextension of the method described in the Appendix. Asshown in Fig. 7 A, there is better agreement than when asingle, lumped series element is used.
Because one of the main purposes of this analysis was toassess the contribution of damped series element recoil tothe measured velocity, the recoil velocity of the distributedseries compliance was also calculated. The case of thelargest force step in Fig. 4 is shown in Fig. 7 B. As
_ -;;..:;;: ?
I I
SIO ..
x .... _ , ... ..
_-- .i..... ... ...
N. 7
;. ..........
B
FIGURE 6 Damped series elastic recoil velocity. Three force stepsapplied at each of three times after stimulation, two different lengths. A,200 ms, 100% 4xL.. B, 400 ms 100% L. (same steps as in Fig. 4). C, 700ms 100%o L.. D, 200 ms, 92% L,... E, 400 ms, 92% L,..xv F, 800 ms, 92%L... Upper traces in each panel, the three force steps superimposed.Middle traces, the three velocity records paired with the calculateddamped series elastic recoil. The lower record in each pair is thecalculated recoil. The lower traces in each panel are the differencesbetween the two on a 2 1/2 times greater scale. These difference traceshave been digitally filtered, which accounts for the negative deflection atthe onset of the step. The velocity gains are increased for the steps tohigher force, with the calibration bars all having the same value.
shortening following the step, followed by a decline ofvelocity and then acceleration to the isotonic level. Fig. 6also shows that the damped series elastic recoil ends by5-10 ms after the onset of the step.
Distributed Series ComplianceFig. 5 shows a slight mismatch between the calculated andobserved force responses immediately following ramps
applied to the passive muscle. As mentioned above, the fitcould be improved by assuming that the series dashpot and
Lmaxj
LMoXA
zms
FIGURE 7 Effect of distributed series compliance. A, Length stepsapplied to passive muscle. Same step as middle panel in Fig. 5. Top trace,the length step. Second trace, the measured force response. Third trace,force response calculated on the basis of compliance lumped into a singleelement. Fourth trace, force response calculated on the basis of the samecompliance distributed between two elements having equal complianceand damping factors different by a factor of 6. Fifth trace, differencebetween real response and response calculated as the basis of a lumpedcompliance. Sixth trace, difference between real response and responsecalculated for a distributed compliance. Bottom trace, difference betweenthe two calculated responses. B, Force step applied to the active muscle.Same step as the largest step in Fig. 7 E. Top trace, force. Second trace,measured velocity. Third trace, recoil velocity of the lumped element.Fourth trace, recoil velocity of the distributed element. Fifth trace,difference between the measured velocity and the recoil of the lumpedseries element. Sixth trace, difference between the measured velocity andthe recoil of the distributed compliance. Bottom trace, difference betweenthe two calculated recoil velocities. All the difference traces are displayedat 2 1/2 times the gain of the responses.
BIOPHYSICAL JOURNAL VOLUME 40 1982
RISOf
TENS
a
116

illustrated, the difference between the responses of thelumped and distributed elements is very small, and con-fined mainly to the very early response. In both cases, thevelocity of the series element is zero by 7-8 ms after theonset of the step.
Magnitude of Series Elastic Extension. Amajor problem with the study of cardiac muscle is that thecompliant series spring allows the contractile elements toshorten substantially during the development of isometricforce. Observations made at the peak of the twitch aretherefore appropriate to a much shorter sarcomere lengththan those made early in the twitch. The nonlinear natureof the series spring described here suggests that it would bestretched enormously (> 15% Lmax) if muscle force were torise from zero to its isometric maximum, because the serieselement is very compliant near zero force. Very muchsmaller changes of sarcomere spacing were actuallyencountered during an isometric twitch. At long lengths,there is a finite rest force, so that force does not begin atzero; at shorter lengths, where there is little rest force,maximum force is not achieved. In the muscles used here,the maximum series elastic extension seen at LmaX wasestimated to be 3-4% Lmax. At shorter lengths, where restforce was lower and the series element more compliant,5-6% L.X extension occurred as isometric force developed.These values agree with microscopic observations of thecontracting muscle.
Localization of the Series Elastic Element.Carbon granules were placed on the muscles and observedduring isometric contractions and releases to zero load. Nogranules were observed to move by >2% Lx duringisometric contractions, and the greatest relative movementoccurred at the ends of the muscle, where granules could beseen to move away from the edge of the clip. Figs. 8 A, B,and C show 16-mm cine photographs of the muscle at rest,at the peak of force development, and -25 mm afterrelease to zero load, respectively. Carbon granules at theright-hand end moved away from the clip by -1.5% Lmaxduring isometric force development, and returned to theirrest position following the release. There were also transpo-sitions of granules relative to each other in the center of themuscle, indicating internal shear. These findings suggestthat most of the series compliance could be accounted forby extracellular tissue, and that much of this was at theends of the muscle, but the film records lacked sufficientresolution to follow the course of damped elastic recoil atthe ends of the muscle.
DISCUSSION
The main conclusion of this study is that the contractileelements of cardiac muscle are in parallel with a substan-tial viscous element. "Creep" or stress relaxation suggest-ing the presence of a viscous element has been describedbefore (Hefner and Bowen, 1967; Little and Wead, 1971;
X~~-H
1mmFIGURE 8 Photographs of muscle. A, at rest; B, at the peak of isometricforce; and C, -25 ms after release to near zero force. The arrow at righthand end indicates a carbon granule that has moved relative to the clip by-1.5% L,., during the development of tension and returned to it's restposition following the release.
Pinto and Patitucci, 1977) but no previous effort has beenmade to relate the responsible viscous element to othercomponents. The arrangement described here may help toresolve some of the questions regarding the type of modelused to represent cardiac muscle. Hefner and Bowen(1967) fou~nd that the instantaneous compliance of thetotal passive muscle was approximately equal to the serieselastic compliance measured in the active muscle, as wasfound in the present study. They interpreted this finding asstrongly supporting the Maxwell configuration. They rea-soned that if the springs were arranged in the Voigtconfiguration, the parallel elasticity would have to benearly rigid, and therefore could not accommodate exten-sion of the contractile elements. This conclusion is inconsis-tent with the microscopic observations of Krueger andPollack (1975), as well as those described here, and withthe more recent results from Hefner's laboratory (Donaldet al., 1980) showing that a substantial fraction of theseries elasticity of the papillary muscle is in its ends, andtherefore likely to be in series with all other structures,including those responsible for the parallel elasticity. Thepresent finding that the parallel element is sufficientlydamped to be nearly rigid during a step can reconcileHefner and Bowen's (1967) results with the Voigt model.
Implications of Parallel Damping. The conclu-sion that there is a substantial viscosity in parallel with thecontractile elements during diastole raises the question ofwhether it might be a part of the contractile apparatus,some form of residual activation. Two observations suggest
CHIU ET AL. Viscoelasticity in Heart Muscle 117
that the viscosity is not due to residual activation: (a) thespeed of recovery following a large release is much slowerthan expected for activated myofilaments, and (b) the levelof activation would have to be inordinately high. Thismechanism requires that a substantial fraction, two-thirdsor more, of the rest force be due to resting activation.
It should be mentioned that there is evidence forresidual activation in resting skeletal muscle, but the levelsare much lower than those required to account for thepresent results. Hill (1968) has shown that the short rangeinstantaneous stiffness of resting skeletal muscle is greaterthan the steady-state stiffness, and the greater stiffness isattributed to cross-bridges that remain attached in theresting muscle. Hill's findings are qualitatively similar tothose described here. Similarly, Ford et al. (1977, p. 484),have shown that resting muscle contains a parallel viscositythat disappears on activation. In both cases, the magnitudeof the force response is much smaller in skeletal muscle,but the resting viscosity is qualitatively similar to thatdescribed here. The much larger force responses describedhere as compared with those in skeletal muscle suggest thatthe major part of the viscosity is probably due to somethingother than the contractile apparatus.
Viscosity in parallel with the contractile elements mightexplain a variable diastolic compliance. In the intactventricle, viscosity will slow filling and alter the relation-ship between pre-load and end-diastolic fiber length. Sinceend-systolic volume varies directly with afterload (Sagawa,1978), end-diastolic compliance would appear to begreater at higher afterloads if the rate of filling werepartially limited by viscosity. Such an inverse relationshipbetween end-diastolic compliance and afterload has beenreported by Gilmore et al. (1966) and Janicki and Weber(1977).
Decoupling SpringA parallel viscosity of the magnitude measured here willimpose a considerable load on the actively shorteningmuscle. This load would cause a wasteful expenditure ofenergy if it were coupled rigidly to the contractile elements.The position of the compressive spring in Figs. 2 E and F ispostulated to explain how the working muscle might avoidthis energy waste. Such a spring would allow the contrac-tile elements to shorten for some distance before meetingthe full resistance of the viscous load. It would also allowsome of the energy of contraction to be stored in passivestructures and used to hasten diastolic muscle elongationand ventricular filling.
Additional evidence for viscoelasticity in the myocar-dium comes from several other sources. The followingpaper shows that such passive viscoelastic resistance toshortening can account for many of the time-dependentchanges in the force-velocity characteristics of the acti-vated muscle. Tamiya et al. (1979) found that the rate ofisotonic elongation following an afterload twitch in isolatedpapillary muscle contraction was dependent solely on the
distance shortened, and was independent of muscle lengthor contractile state. A viscoelastic element in parallel withthe contractile elements would produce such a result.Pressures below atmospheric are seen in the intact, work-ing ventricle (Brecher, 1958). The muscle must, therefore,contain a compressible compliance that provides arestoring force in early diastole. If this compliance were inseries with a viscous element, the restoring force would beindependent of initial muscle length. Weiss et al. (1976)have shown that the speed of relaxation of the isolatedventricle is correlated directly with the extent of circumfer-ential fiber shortening, independent of end-systolic fiberlength. Their experiments were done on excised hearts thatwere neurally and hormonally isolated from the remainderof the animal and likely to have been in a constant inotropicstate. They concluded that their findings were most easilyexplained by a viscoelastic element in parallel with theshortening contractile elements, but hastened to add that,at the time of their writing, evidence for such a viscoelastic-ity in muscle was lacking.
Series ElementsThe measured damping of the series element was so smallthat it prolonged the recoil by only a few milliseconds. Thislight damping might be expected to occur, because most ofthe series compliance resides in the crushed tissue at theends of the muscle. It has not been reported previously,probably because its observation requires a degree of timeresolution not formerly available. An exact comparison ofthe properties of the series elements in experiments fromdifferent laboratories is probably impossible because of thewide variation in the methods of gripping the tissue.
The finding that the extension-force characteristics ofthe series elements were identical in the active and passivemuscle was somewhat unsatisfactory because a smallamount of the series compliances measured in the activemuscle would be expected to be in the cross-bridges of thecontractile elements. The total compliance in the activemuscle should be somewhat greater than the series com-pliance in the passive muscle. This contradiction wasresolved by postulating that some of the apparent seriescompliance in the passive muscle was in the decouplingspring of the parallel viscoelastic element. The complianceof this decoupling spring is not much greater than the totalsarcomere compliance measured in isometric skeletal mus-cle, (Huxley and Simmons, 1971; Ford et al., 1977). Itseems unlikely that >15-30% of the series elastic recoilseen here is due to contractile element shortening, however,because the extent of shortening associated with the recoilis three to six times larger than the sarcomere compliancemeasured in skeletal muscle (Ford et al., 1981).
Description and Location of Elements inthe Model
The functions used to describe the elements in the modelwere the simplest that could be used. Exponential functions
BIOPHYSICAL JOURNAL VOLUME 40 1982118

were used to describe extensible springs, both because theyhave given good descriptions of the stress-strain character-istics of the series elasticity in papillary muscles in the past(Parmley and Sonnenblick, 1967; Forman et al., 1972) andbecause they can give a reasonably good description of thecurved functions using only two constants. The quality ofthe fitted traces indicates that those choices were reason-able.
It seems likely that most of the series compliance in themuscle resides in the crushed tissue at the ends, althoughthe observation of shear along the muscle suggests someadditional compliance in the cell-to-cell connections. Eq. 3seems a reasonable description of the damping in theseelements, inasmuch as the damping results from fluidmoving through the interstices of the connective tissue andwould resemble a simple dashpot. The nature of theparallel springs and dashpot is less well understood. If thisparallel viscosity is a useful adaptation that aids ventricu-lar filling, it would be reasonable to suppose that it is due toa well-organized structure, which would not be found inskeletal muscle, where such a viscoelasticity would provideno functional benefit. The further possibility must beconsidered that the viscosity is due to a plastic structurewhich changes shape as the result of the formation andbreaking of chemical bonds, in which case Eq. 3 would onlybe an approximate description of its behavior.
integration:
VI =(T + Tom)/Qs
I + (Ti + TO) eA4/ks e(T+T.)t/(k,.Q,)VI.-Q
(A3)
where V, is the SE velocity and AL; the total SE length change at the pointwhen the force step just reached its final value; both were given by theRunge-Kutta method above. This is the point of switching over fromsolving Eq. A2 by numerical method to direct solution.
Force Response to a Length Ramp-Applied to the PassiveMuscle. Because the SE and PE are in series, (Fig. 2 E) the force acrossthem is the same and equal to the muscle force (7). The series componentforce is made up of the series spring and viscous element force as in Eq.A2 above. The parallel component force is the sum of the force in theparallel spring, the force in the contractile element that is zero and theforce in the linear decoupling spring (spring d) and dashpot arrangementwhose combined instantaneous force-extension relationship is describedby
dLp/dt = Td/QP + 1/h * dTd/dt. (A4)
The parallel element length is equal to the total muscle length (L) minusthe series element length
Lp =L-L, (A5)
or
ALP = AL - AL,. (A6)
APPENDIX
Length and force changes in the muscle were calculated using the modelin Fig. 2 E. Eq. 2 in the text was used to describe the extension-forcecharacteristics of the two springs in parallel with the viscous elements, thesubscripts s and p are used to identify them either as the series or parallelspring. The subscript d denotes the decoupling spring that is in series withthe parallel viscosity, Eq. 4. The force-velocity relationship of the twoviscous elements are described by Eq. 3, again with the subscripts s and pto distinguish them.
Series Elastic Recoil. The overall force on the muscle (7)equals the force on the entire series element which in turn is the sum of theforces on the series spring and the dashpot in parallel, so that
T= [(T,, + Ti)eA4/4- Ts] + [Q dt] (Al)
or
dAL, - [T + Ts- (Tos + Tjs) eA4/1]/Q.dt,
(A2)
where AL, = 4 -L. L, and Ti, are the initial SE length and force justbefore the quick release. T5, is also equal to Ti, the initial muscle force.During the force step, Eq. A2 cannot be solved analytically because T isarbitrarily determined by the step, so a fourth-order Runge-Kuttaalgorithm (Carnahan et al., 1969, p. 361) was used to evaluate AL,numerically with the initial condition being AL. = 0. AL, was thendifferentiated to give V,, the recoil velocity. When the force step was 98%complete it was assumed to have attained its final value, i.e., T is constantthereafter. This allows Eq. A2 to be solved exactly for V, by direct
The force in the decoupling spring and dashpot is given by the muscleforce minus the parallel spring force so that
Td = T - Tp. (A7)
Substituting Eq. Al for T and the spring equation (Eq. 2 in text) for Tpinto Eq. A7 gives an expression for Td in terms of A4 and AL4, but ALpcan be expressed in terms of AL (Eq. A6) so that
Td= A -TO6+ QS dt _-[BJ-Tp] (A8)
where
A = (T,, + Ti,) eA4'k"
and
B = (Top + Tip) e(AL - A4)/kp
substituting Eq. A8 and the derivatives of Eqs. A5 and A8 into A4 yields asecond-order differential equation in AL,
d2A4QAL,(.Q. A __dt2 h) dt h - k+ h kp )
1 ~~~~~dALrB 1+ -[A- Ts-B + TOP]- d |h + 1 = 0. (A9)
This can be reduced to two simultaneous first order differential equationsby substituting Yfor (dA4)/(dt) in Eq. A9
dAL,dt
(A10)
CHIU ET AL. Viscoelasticity in Heart Muscle 119

and
dYY
I(Alk, + Blkp) + h
I +l I
hf dAL( B[(A - B) - (To - Top)] h.k+ | (All)
These two equations can be solved simultaneously using the fourth-orderRunge-Kutta method. The initial conditions are AL, = 0, Y= (dAL,)/(dt)= 0, and Tip = Ti, = Tj = muscle force before the ramp. (dAL)/(dt) is theslope of the length ramp and is equal to zero after it ends. Finally, bysubstituting the values of AL, and (dA4)/(dt) calculated above into Eq.Al, the total muscle force could be obtained.
We thank Mr. Jules Quinlan for technical help and Drs. Alan J. Bradyand Richard D. Coulson for comments on the manuscript.
Dr. Ford was an Established Investigator of the American Heart Associa-tion. Dr. Ballou was a Post-doctoral Fellow of the Chicago HeartAssociation. The work was supported by United States Public HealthService grant HL-20592 and a grant from the American Heart Associa-tion.
Receivedfor publication 21 May 1981 and in revisedform 10 November1981.
REFERENCES
Abbott, B. C., and W. F. H. M. Mommaerts. 1959. A study of inotropicmechanisms in the papillary muscle preparation. J. Gen. Physiol.42:533-551.
Brecher, G. A. 1958. Critical review of recent work on ventriculardiastolic suction. Circ. Res. 6:554-566.
Carnahan, B., H. A. Luther, and J. O. Wilkes. 1969. Applied NumericalMethods. John Wiley & Sons, Inc., New York. 1-604.
Chiu, Y.-L., S. Karwash, and L. E. Ford. 1978. A piezo electric forcetransducer for single muscle cells. Am. J. Physiol. 235:C143-146.
Civan, M. M., and R. J. Podolsky. 1966. Contraction kinetics of striatedmuscle fibres following quick changes in load. J. Physiol. (Lond.).184:511-534.
Donald, T. C., D. N. S. Reeves, R. C. Reeves, A. A. Walker, and L. L.Hefner. 1980. Effect of damaged ends in papillary muscle prepara-tions. Am. J. Physiol. 238:H14-H23.
Forman, R., L. E. Ford, and E. H. Sonnenblick. 1972. Effect of musclelength on the force-velocity relationship of tetanized cardiac muscle.Circ. Res. 31:195-206.
Ford, L. E., A. F. Huxley, and R. M. Simmons. 1977. Tension responsesto sudden length change in stimulated frog muscle fibres near slacklength. J. Physiol. (Lond.). 269:441-515.
Ford, L. E., A. F. Huxley, and R. M. Simmons. 1981. The relationbetween stiffness and filament overlap in stimulated frog muscle fibers.J. Physiol. (Lond.). 311:219-249.
Gilmore, J. P., H. E. Cingolani, R. R. Taylor, and R. H. McDonald, Jr.1966. Physical factors and cardiac adaption. Am. J. Physiol.211:1219-1226.
Gordon, A. M., A. F. Huxley, and F. J. Julian. 1966. Tension develop-ment in highly stretched vertebrate muscle fibres. J. Physiol. (Lond.).184:143-169.
Hefner, L. L., and T. E. Bowen, Jr. 1967. Elastic components of catpapillary muscle. Am. J. Physiol. 212:1221-1227.
Hill, D. K. 1968. Tension due to interaction between the sliding filamentsin resting striated muscle. The effect of stimulation. J. Physiol.(Lond.). 199:637-684.
Huxley, A. F., and R. M. Simmons. 1971. Proposed mechanism of forcegeneration in striated muscle. Nature (Lond.). 233:533-538.
Huxley, A. F., and R. M. Simmons. 1972. Mechanical transients and theorigin of muscular force. Cold Spring Harbor Symp. Quant. Biol.37:669-680.
Janicki, J. S., and K. T. Weber. 1977. Ejection pressure and the diastolicleft ventricular pressure-volume relation. Am. J. Physiol. 232:H545-H552.
Kendall, M. G. 1976. Time Series. 2nd edition. C. Griffin & Co. Ltd.,London. 1-197.
Krueger, J. W., and G. H. Pollack. 1975. Myocardial sarcomeredynamics during isometric contraction. J. Physiol. (Lond.). 251:627-643.
Little, R. C., and W. B. Wead. 1971. Diastolic viscoelastic properties ofactive and quiescent cardiac muscle. Am. J. Physiol. 221:1120-1125.
Nakajima, S., A. Gilai, and D. Dingeman. 1976. Dye absorption changesin single muscle fibers: an application of an automatic balancingcircuit. PfliUgers Arch. Eur. J. Physiol. 362:285-287.
Parmley, W. W., and E. H. Sonnenblick. 1967. Series elasticity in heartmuscle: its relation to contractile element velocity and proposed musclemodels. Circ. Res. 20:112-123.
Pinto, J. G., and P. J. Patitucci. 1977. Creep in cardiac muscle. Am. J.Physiol. 232:H553-563.
Podolsky, R. J. 1960. Kinetics of muscular contraction: the approach tothe steady state. Nature (Lond.). 188:666-668.
Pollack, G. H. 1970. Maximum velocity as an index of contractility incardiac muscle. Circ. Res. 26:111-127.
Sagawa, K. 1978. The ventricular pressure-volume diagram revisited.Circ. Res. 43:677-687.
Tamiya, K., M. Sugawara, and Y. Sakurai. 1979. Maximum lengtheningvelocity during isotonic relaxation at preload in canine papillarymuscle. Am. J. Physiol. 237:H83-H89.
Weiss, J. L., J. W. Frederiksen, and M. L. Weisfeldt. 1976. Hemody-namic determinants of the time-course of fall in canine left ventricularpressure. J. Clin. Invest. 58:751-760.
120 BIOPHYSICAL JOURNAL VOLUME 40 1982