Degradome expression profiling in human articular cartilage
14
Open Access Available online http://arthritis-research.com/content/11/3/R96 Page 1 of 14 (page number not for citation purposes) Vol 11 No 3 Research article Degradome expression profiling in human articular cartilage Tracey E Swingler 1 , Jasmine G Waters 1 , Rosemary K Davidson 1 , Caroline J Pennington 1 , Xose S Puente 2 , Clare Darrah 3 , Adele Cooper 3 , Simon T Donell 3 , Geoffrey R Guile 4 , Wenjia Wang 4 and Ian M Clark 1 1 School of Biological Sciences, University of East Anglia, Earlham Road, Norwich NR4 7TJ, UK 2 Departamento de Bioquímica y Biología Molecular, Facultad de Medicina, Universidad de Oviedo, 33006 Oviedo, Spain 3 Institute of Orthopaedics, Norfolk & Norwich University Hospital, Colney Lane, Norwich NR4 7UY, UK 4 School of Computing Sciences, University of East Anglia, Earlham Road, Norwich NR4 7TJ, UK Corresponding author: Ian M Clark, [email protected] Received: 16 Apr 2009 Revisions requested: 4 Jun 2009 Revisions received: 10 Jun 2009 Accepted: 23 Jun 2009 Published: 23 Jun 2009 Arthritis Research & Therapy 2009, 11:R96 (doi:10.1186/ar2741) This article is online at: http://arthritis-research.com/content/11/3/R96 © 2009 Swingler et al.; licensee BioMed Central Ltd. This is an open access article distributed under the terms of the Creative Commons Attribution License (http://creativecommons.org/licenses/by/2.0 ), which permits unrestricted use, distribution, and reproduction in any medium, provided the original work is properly cited. Abstract Introduction The molecular mechanisms underlying cartilage destruction in osteoarthritis are poorly understood. Proteolysis is a key feature in the turnover and degradation of cartilage extracellular matrix where the focus of research has been on the metzincin family of metalloproteinases. However, there is strong evidence to indicate important roles for other catalytic classes of proteases, with both extracellular and intracellular activities. The aim of this study was to profile the expression of the majority of protease genes in all catalytic classes in normal human cartilage and that from patients with osteoarthritis (OA) using a quantitative method. Methods Human cartilage was obtained from femoral heads at joint replacement for either osteoarthritis or following fracture to the neck of femur (NOF). Total RNA was purified, and expression of genes assayed using Taqman ® low-density array quantitative RT-PCR. Results A total of 538 protease genes were profiled, of which 431 were expressed in cartilage. A total of 179 genes were differentially expressed in OA versus NOF cartilage: eight aspartic proteases, 44 cysteine proteases, 76 metalloproteases, 46 serine proteases and five threonine proteases. Wilcoxon ranking as well as the LogitBoost-NR machine learning approach were used to assign significance to each gene, with the most highly ranked genes broadly similar using each method. Conclusions This study is the most complete quantitative analysis of protease gene expression in cartilage to date. The data help give direction to future research on the specific function(s) of individual proteases or protease families in cartilage and may help to refine anti-proteolytic strategies in OA. Introduction Osteoarthritis (OA) is a debilitating degenerative joint disease where degradation of articular cartilage is a key feature [1]. Given the current demographic trend toward an older popula- tion, OA – for which age is an important risk factor – will be an increasing health and economic burden on society. The molecular mechanisms underlying cartilage destruction in OA are poorly understood (see for example [1]). Cartilage is made up of two main extracellular matrix macromolecules: type II collagen and aggrecan, a large aggregating proteoglycan. The former endows the cartilage with its tensile strength, whilst the latter enables cartilage to resist compression. Quan- titatively more minor components (for example, type IX, type XI and type VI collagens, biglycan, decorin, cartilage oligomeric matrix protein) also have important roles in controlling the supramolecular organization of the matrix. Normal cartilage extracellular matrix is in a state of dynamic equilibrium, with a balance between synthesis and degradation. For the degrada- tive process there is a balance between proteases that ADAM: a disintegrin and metalloproteinase domain; ADAMTS: a disintegrin and metalloproteinase domain with thrombospondin motifs; Ct: threshold cycle; IGF: insulin-like growth factor; IL: interleukin; MMP: matrix metalloproteinase; NOF: neck of femur; OA: osteoarthritis; PBS: phosphate-buffered saline; PCR: polymerase chain reaction; RAMP: regeneration-associated muscle protease; RT: reverse transcriptase; SUMO: small ubiquitin-like mod- ifier; TNF: tumour necrosis factor.
-
Upload
independent -
Category
Documents
-
view
1 -
download
0
Transcript of Degradome expression profiling in human articular cartilage
Available online http://arthritis-research.com/content/11/3/R96
Open AccessVol 11 No 3Research articleDegradome expression profiling in human articular cartilageTracey E Swingler1, Jasmine G Waters1, Rosemary K Davidson1, Caroline J Pennington1, Xose S Puente2, Clare Darrah3, Adele Cooper3, Simon T Donell3, Geoffrey R Guile4, Wenjia Wang4 and Ian M Clark1
1School of Biological Sciences, University of East Anglia, Earlham Road, Norwich NR4 7TJ, UK2Departamento de Bioquímica y Biología Molecular, Facultad de Medicina, Universidad de Oviedo, 33006 Oviedo, Spain3Institute of Orthopaedics, Norfolk & Norwich University Hospital, Colney Lane, Norwich NR4 7UY, UK4School of Computing Sciences, University of East Anglia, Earlham Road, Norwich NR4 7TJ, UK
Corresponding author: Ian M Clark, [email protected]
Received: 16 Apr 2009 Revisions requested: 4 Jun 2009 Revisions received: 10 Jun 2009 Accepted: 23 Jun 2009 Published: 23 Jun 2009
Arthritis Research & Therapy 2009, 11:R96 (doi:10.1186/ar2741)This article is online at: http://arthritis-research.com/content/11/3/R96© 2009 Swingler et al.; licensee BioMed Central Ltd. This is an open access article distributed under the terms of the Creative Commons Attribution License (http://creativecommons.org/licenses/by/2.0), which permits unrestricted use, distribution, and reproduction in any medium, provided the original work is properly cited.
Abstract
Introduction The molecular mechanisms underlying cartilagedestruction in osteoarthritis are poorly understood. Proteolysisis a key feature in the turnover and degradation of cartilageextracellular matrix where the focus of research has been on themetzincin family of metalloproteinases. However, there is strongevidence to indicate important roles for other catalytic classes ofproteases, with both extracellular and intracellular activities. Theaim of this study was to profile the expression of the majority ofprotease genes in all catalytic classes in normal human cartilageand that from patients with osteoarthritis (OA) using aquantitative method.
Methods Human cartilage was obtained from femoral heads atjoint replacement for either osteoarthritis or following fracture tothe neck of femur (NOF). Total RNA was purified, andexpression of genes assayed using Taqman® low-density arrayquantitative RT-PCR.
Results A total of 538 protease genes were profiled, of which431 were expressed in cartilage. A total of 179 genes weredifferentially expressed in OA versus NOF cartilage: eightaspartic proteases, 44 cysteine proteases, 76metalloproteases, 46 serine proteases and five threonineproteases. Wilcoxon ranking as well as the LogitBoost-NRmachine learning approach were used to assign significance toeach gene, with the most highly ranked genes broadly similarusing each method.
Conclusions This study is the most complete quantitativeanalysis of protease gene expression in cartilage to date. Thedata help give direction to future research on the specificfunction(s) of individual proteases or protease families incartilage and may help to refine anti-proteolytic strategies in OA.
IntroductionOsteoarthritis (OA) is a debilitating degenerative joint diseasewhere degradation of articular cartilage is a key feature [1].Given the current demographic trend toward an older popula-tion, OA – for which age is an important risk factor – will be anincreasing health and economic burden on society.
The molecular mechanisms underlying cartilage destruction inOA are poorly understood (see for example [1]). Cartilage ismade up of two main extracellular matrix macromolecules: type
II collagen and aggrecan, a large aggregating proteoglycan.The former endows the cartilage with its tensile strength,whilst the latter enables cartilage to resist compression. Quan-titatively more minor components (for example, type IX, type XIand type VI collagens, biglycan, decorin, cartilage oligomericmatrix protein) also have important roles in controlling thesupramolecular organization of the matrix. Normal cartilageextracellular matrix is in a state of dynamic equilibrium, with abalance between synthesis and degradation. For the degrada-tive process there is a balance between proteases that
Page 1 of 14(page number not for citation purposes)
ADAM: a disintegrin and metalloproteinase domain; ADAMTS: a disintegrin and metalloproteinase domain with thrombospondin motifs; Ct: threshold cycle; IGF: insulin-like growth factor; IL: interleukin; MMP: matrix metalloproteinase; NOF: neck of femur; OA: osteoarthritis; PBS: phosphate-buffered saline; PCR: polymerase chain reaction; RAMP: regeneration-associated muscle protease; RT: reverse transcriptase; SUMO: small ubiquitin-like mod-ifier; TNF: tumour necrosis factor.

Arthritis Research & Therapy Vol 11 No 3 Swingler et al.
degrade the extracellular matrix and their inhibitors. In OA, thedogma is that a disruption of this balance, in favour of proteol-ysis, leads to pathological cartilage destruction [2].
Cartilage destruction in OA is thought to be mediated by twomain enzyme families; the matrix metalloproteinases (MMPs)are thought to be responsible for cartilage collagen break-down, whilst enzymes from the ADAMTS (a disintegrin andmetalloproteinase domain with thrombospondin motifs) familyare thought to mediate cartilage aggrecan loss [3]. Whilstthere is strong evidence to support this tenet, there is also evi-dence that indicates a role for enzymes in other catalyticclasses. Examples include serine proteases, which coulddirectly degrade the extracellular matrix or could be involved inpotentially rate-limiting activation of proMMPs [4]; similarly,cathepsin K, capable of degrading the collagen triple helix, hasalso been implicated in cartilage degradation (see for example[5]).
With the completion of the sequencing of several mammaliangenomes, the full complement of protease genes has beenelucidated [6]. There are 570 human protease genes (notincluding pseudogenes): 21 aspartate proteases, 154cysteine proteases, 191 metalloproteases, 176 serine pro-teases and 28 threonine proteases.
The present study therefore aimed to profile as many of thesegenes as possible in human cartilage using a quantitative andsensitive RT-PCR approach, and to compare normal tissuewith that from patients with OA.
Materials and methodsCollection of human cartilage and RNA purificationHuman articular cartilage was obtained from femoral heads ofpatients undergoing total-hip-replacement surgery at the Nor-folk and Norwich University Hospital (Norwich, UK). Samplesfrom patients with OA (n = 12, six female patients and six malepatients; age range, 37 to 86 years; median age, 72 years;mean age ± standard error of the mean, 68.8 ± 4.2 years)were compared with cartilage from patients undergoing hipreplacement following fracture to the neck of femur (NOF) (n= 12, six female patients and six male patients; age range, 68to 94 years; median age, 84 years; mean age ± standard errorof the mean, 81.8 ± 2.4 years). OA was diagnosed using theclinical history and an examination of the patient, coupled withX-ray findings; confirmation of gross pathology was made atthe time of joint removal. The fracture patients had no knownhistory of joint disease and their cartilage was free of lesions;80% of these patients underwent surgery within 36 hours offracture. This study was performed with Ethical Committeeapproval, and all patients provided informed consent.
Intact femoral heads were washed in sterile PBS. Cartilagesamples were removed from the femoral head using a razorblade, chopped into pieces of 2 to 5 mm, and were snap-fro-
zen in liquid nitrogen within 15 to 30 minutes of surgery. Thecartilage was weighed and ground under liquid nitrogen usingthe Type 6750 Freezer Mill (Spex Certiprep, Glen Creston,Stanmore, UK). RNA was purified essentially following David-son and colleagues [7]. TRIzol® reagent (Invitrogen Life Tech-nologies, Paisley, UK) was added to ground cartilage (1 ml/0.2g cartilage), mixed thoroughly and incubated at room temper-ature for 5 minutes. Ground cartilage was pelleted at 9,500 ×g for 10 minutes at 4°C, and the supernatant was recovered.Then 300 μl chloroform was added per 0.5 ml TRIzol®, vor-texed for 15 seconds and incubated at room temperature for10 minutes. TRIzol®/chloroform solution was centrifuged at9,500 × g for 15 minutes at 4°C, and the aqueous layer wasrecovered into a fresh tube. Then 0.5× volume, 100% ethanolwas added and mixed. Using the RNeasy Mini Kit (Qiagen,Crawley, UK), samples were applied to spin columns and cen-trifuged at 9,500 × g for 15 seconds, and the flow-throughwas discarded. Columns were then washed and elutedaccording to the manufacturer's instructions. RNA sampleswere quantified using the NanoDrop® spectrophotometer(NanoDrop Technologies, Wilmington, Delaware, USA) andwere stored at -80°C. cDNA was synthesized from 2 μg totalRNA using Superscript II reverse transcriptase (Invitrogen)and random hexamers according to the manufacturer'sinstructions. cDNA was stored at -20°C.
Quantitative RT-PCR and Taqman® low-density arraysQuantitative RT-PCR was performed as previously described[7]. Prior to low-density array analysis, samples were assayedfor 18S rRNA to ensure that all samples were within 1.5threshold cycle (Ct) of the median value as a baseline qualitycontrol. Samples were also assayed for genes previouslyshown to be differentially expressed in OA cartilage comparedwith NOF (MMP28 and ADAMTS16).
Custom-designed microfluidic Taqman® low-density arrayswere obtained from Applied Biosystems (Warrington, UK) withprimer sets designed to amplify with similar efficiencies, allow-ing comparison between genes. The arrays contained 538protease assays across two microfluidic cards along with 12housekeeping genes on each card. The Taqman® low-densityarrays were used according to the manufacturer's protocol.Briefly, 800 ng cDNA was added to 2× TaqMan® Master Mix(Applied Biosystems) and was loaded onto each card by cen-trifugation. Relative quantification of genes on the cards wasperformed using the ABI Prism® 7900 HT (Applied Biosys-tems, Warrington, UK) sequence detection system under thefollowing cycling conditions: 50°C for 2 minutes, 94.5°C for10 minutes, then 40 cycles of 97°C for 30 seconds, and59.7°C for 1 minute. The data were analysed using Statminersoftware (Integromics, Philadelphia, Pennsylvania, USA). ThegeNorm facility within Statminer identified succinate dehydro-genase subunit A as the most stable housekeeping gene, andthe data were therefore normalized to succinate dehydroge-nase subunit A expression.
Page 2 of 14(page number not for citation purposes)

Available online http://arthritis-research.com/content/11/3/R96
Statistical analysesStatistical analysis was by Mann – Whitney U test (eitherSPSS 16.0, SPSS, Woking, UK, or GraphPad Prism 4,GraphPad Software, La Jolla, USA) or using the LogitBoost-NR algorithm as described below.
Machine learning approach for analysing gene expression dataMachine learning methods were applied to the analysis ofgene expression data because of their high dimensionality andcomplexity: in this case, 538 genes and 24 samples.
LogitBoost-NR ensemble for classification of samplesA machine learning ensemble can be simply viewed as a com-bination of a number of models that have been trained inde-pendently from the available data of a given problem and thenwork collectively in order to produce better solutions. The prin-ciple behind ensemble learning is that although a classificationalgorithm may only be able to produce a model with slightlybetter accuracy than random guessing, if several such modelsare produced and combined into an ensemble, their combinedaccuracy will be greater than any single classifier, providingthey are sufficiently diverse from each other to avoid makingsimilar errors, and boosting algorithms are designed with theaim of producing a high level of diversity.
Ensemble classification methods such as boosting have beenapplied to the classification of gene expression data and haveproduced more accurate results [8] than the individual modelsthat work alone. Boosting algorithms such as LogitBoost [9]iteratively employ another classification algorithm known asthe base learner to learn from the data samples and generatea series of models. In the case of gene expression data, themost common base learner used is the decision tree or deci-sion stump, which is a decision tree consisting of a singlenode. Initially all samples are assigned equal weights for train-ing the first model or classifier. Then the accuracy of the pro-duced model is measured and the weights of individualsamples are adjusted so that the weights of misclassified sam-ples are increased (that is, boosted) while those of correctlyclassified samples are reduced. At the next iteration the baselearner will concentrate on learning the information repre-sented by the misclassified samples. This boosting processgoes on until a preset stopping criterion (such as either all ofthe samples have been learned correctly or a fixed number ofiterations) is met. After the boosting process a series of mod-els is therefore produced with the sample weights being pos-sibly adjusted at each iteration. These models are thencombined to form an ensemble of classifiers. The ensemble isthen validated and tested using different data samples beforebeing used for classifying new samples by combining the out-puts of the models by simple majority or weighted voting.
The LogitBoost-NR algorithm [10] is an extension of Logit-Boost [9] and was specifically designed for the classification
of gene expression data. This was achieved by incorporatingfeature nonreplacement, where the data features (genes) usedto construct a model at a given round of boosting are not avail-able at subsequent rounds. This ensures that the models con-structed at different boosting rounds use different genes,which helps to achieve a high diversity between the models inthe ensemble. Such an approach is particularly appropriate inconditions such as OA where many genes may be significantto the pathology of the disease. Boosting algorithms are alsoable to produce accurate predictive ensembles when thenumber of features (genes) in the data is much larger than thenumber of samples, as is the usually the case with geneexpression data, whereas conventional techniques such aslogistic regression are unable to do this. More details of theLogitBoost-NR methodology can be found in Additional datafile 1.
Boosting ensemble for gene selection/rankingThe particular genes used in a classification ensemble pro-duced by boosting as described above can be reasonablyassumed to be the most important in the pathology of the dis-ease in question, and a method for ranking genes based onLogitBoost-NR is described in Guile and Wang [10]. In thismethod a training dataset consisting of the data for two-thirdsof the samples is randomly partitioned from a complete data-set. The LogitBoost-NR algorithm with decision stumps asbase learner is then applied for 25 iterations of boosting toconstruct a classification ensemble using 25 different genes.The process is repeated for 50 different random partitions ofthe data and the genes are scored according to the frequencyof their presence in the ensembles generated. A gene used inall 50 ensembles therefore receives a score of 50, while agene that is only used once receives a score of 1. The genesare then ranked according to their scores.
This ranking method was found to be much more effective thanthe Wilcoxon test for selecting the genes most useful for pre-dictive classification of DNA microarray data [10]. We appliedthis method to the gene expression data obtained for thepresent study to obtain a ranking of the genes. We tested thisby performing predictive classification using the top-rankedgenes with LogitBoost-NR. Because of the small number ofsamples available in the present study compared with themicroarray datasets originally used for developing the Logit-Boost-NR classification and gene selection methods [8,10],we used equal-sized training and testing datasets of the datawhen making the train:test splits, rather than two-thirds:one-third.
ResultsAt the time of assay design, the Taqman® low-density array for-mat allowed us to assay 538 of the 570 human proteases(94%; 21 aspartic proteases, 139 cysteine proteases, 188metalloproteases, 162 serine proteases and 28 threonine pro-teases). At the time of writing there are an additional 15 assays
Page 3 of 14(page number not for citation purposes)
Arthritis Research & Therapy Vol 11 No 3 Swingler et al.
available in this format, so 553 genes could now be assayed(97%). These 538 assays were split across two Taqman® low-density array cards along with a number of controls (for exam-ple, replicates, housekeeping genes, extracellular matrixgenes).
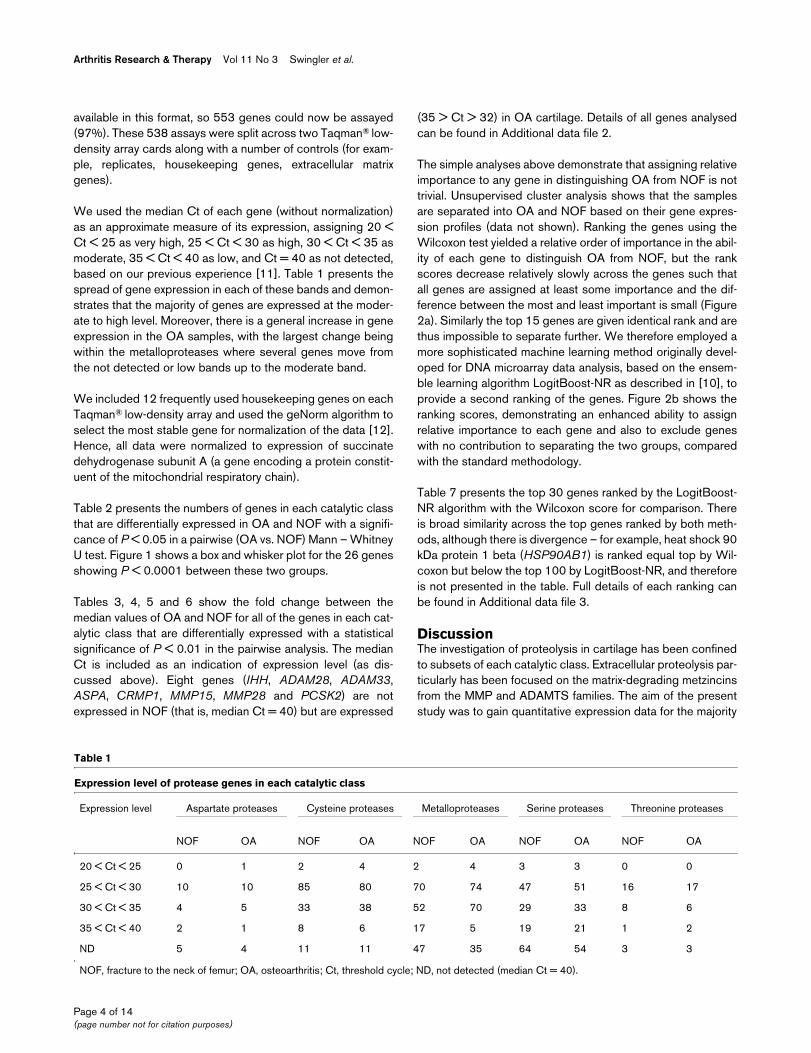
We used the median Ct of each gene (without normalization)as an approximate measure of its expression, assigning 20 <Ct < 25 as very high, 25 < Ct < 30 as high, 30 < Ct < 35 asmoderate, 35 < Ct < 40 as low, and Ct = 40 as not detected,based on our previous experience [11]. Table 1 presents thespread of gene expression in each of these bands and demon-strates that the majority of genes are expressed at the moder-ate to high level. Moreover, there is a general increase in geneexpression in the OA samples, with the largest change beingwithin the metalloproteases where several genes move fromthe not detected or low bands up to the moderate band.
We included 12 frequently used housekeeping genes on eachTaqman® low-density array and used the geNorm algorithm toselect the most stable gene for normalization of the data [12].Hence, all data were normalized to expression of succinatedehydrogenase subunit A (a gene encoding a protein constit-uent of the mitochondrial respiratory chain).
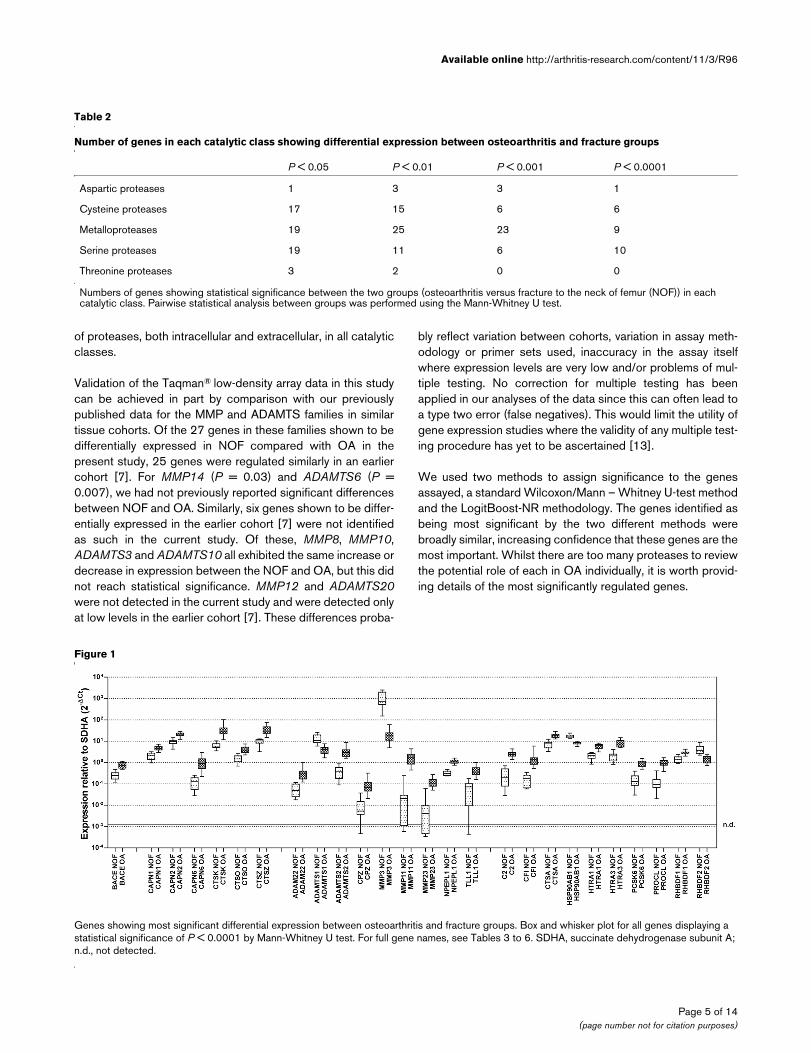
Table 2 presents the numbers of genes in each catalytic classthat are differentially expressed in OA and NOF with a signifi-cance of P < 0.05 in a pairwise (OA vs. NOF) Mann – WhitneyU test. Figure 1 shows a box and whisker plot for the 26 genesshowing P < 0.0001 between these two groups.
Tables 3, 4, 5 and 6 show the fold change between themedian values of OA and NOF for all of the genes in each cat-alytic class that are differentially expressed with a statisticalsignificance of P < 0.01 in the pairwise analysis. The medianCt is included as an indication of expression level (as dis-cussed above). Eight genes (IHH, ADAM28, ADAM33,ASPA, CRMP1, MMP15, MMP28 and PCSK2) are notexpressed in NOF (that is, median Ct = 40) but are expressed
(35 > Ct > 32) in OA cartilage. Details of all genes analysedcan be found in Additional data file 2.
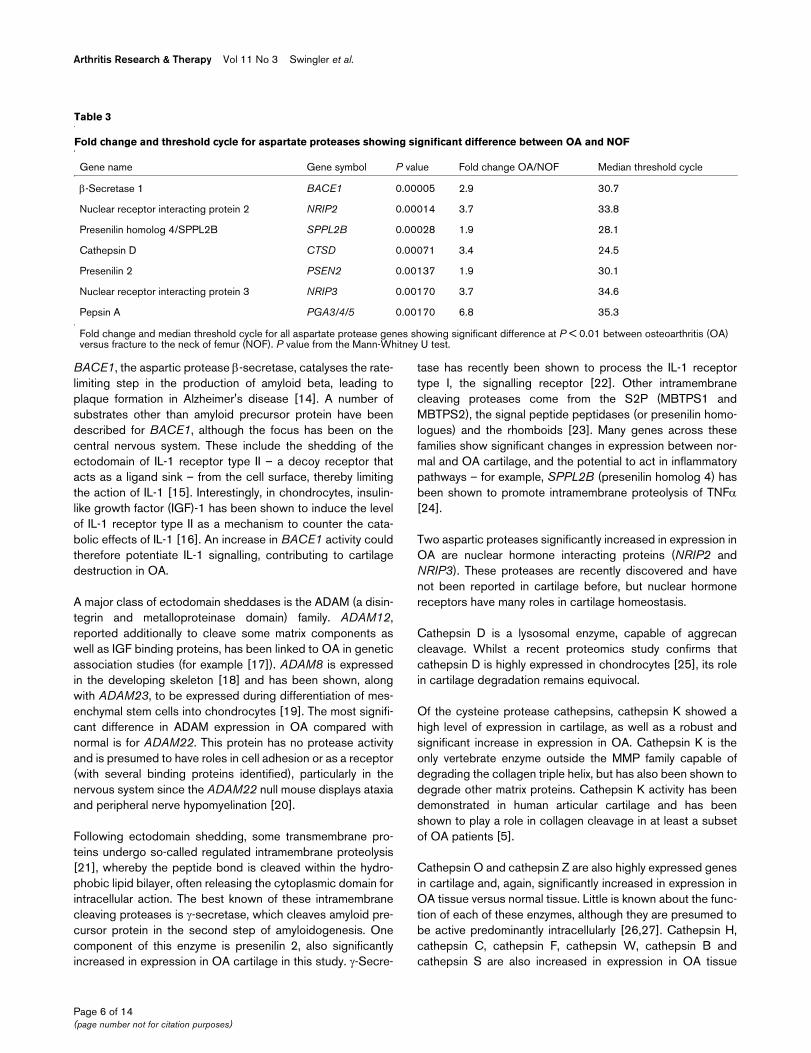
The simple analyses above demonstrate that assigning relativeimportance to any gene in distinguishing OA from NOF is nottrivial. Unsupervised cluster analysis shows that the samplesare separated into OA and NOF based on their gene expres-sion profiles (data not shown). Ranking the genes using theWilcoxon test yielded a relative order of importance in the abil-ity of each gene to distinguish OA from NOF, but the rankscores decrease relatively slowly across the genes such thatall genes are assigned at least some importance and the dif-ference between the most and least important is small (Figure2a). Similarly the top 15 genes are given identical rank and arethus impossible to separate further. We therefore employed amore sophisticated machine learning method originally devel-oped for DNA microarray data analysis, based on the ensem-ble learning algorithm LogitBoost-NR as described in [10], toprovide a second ranking of the genes. Figure 2b shows theranking scores, demonstrating an enhanced ability to assignrelative importance to each gene and also to exclude geneswith no contribution to separating the two groups, comparedwith the standard methodology.
Table 7 presents the top 30 genes ranked by the LogitBoost-NR algorithm with the Wilcoxon score for comparison. Thereis broad similarity across the top genes ranked by both meth-ods, although there is divergence – for example, heat shock 90kDa protein 1 beta (HSP90AB1) is ranked equal top by Wil-coxon but below the top 100 by LogitBoost-NR, and thereforeis not presented in the table. Full details of each ranking canbe found in Additional data file 3.
DiscussionThe investigation of proteolysis in cartilage has been confinedto subsets of each catalytic class. Extracellular proteolysis par-ticularly has been focused on the matrix-degrading metzincinsfrom the MMP and ADAMTS families. The aim of the presentstudy was to gain quantitative expression data for the majority
Table 1
Expression level of protease genes in each catalytic class
Expression level Aspartate proteases Cysteine proteases Metalloproteases Serine proteases Threonine proteases
NOF OA NOF OA NOF OA NOF OA NOF OA
20 < Ct < 25 0 1 2 4 2 4 3 3 0 0
25 < Ct < 30 10 10 85 80 70 74 47 51 16 17
30 < Ct < 35 4 5 33 38 52 70 29 33 8 6
35 < Ct < 40 2 1 8 6 17 5 19 21 1 2
ND 5 4 11 11 47 35 64 54 3 3
NOF, fracture to the neck of femur; OA, osteoarthritis; Ct, threshold cycle; ND, not detected (median Ct = 40).
Page 4 of 14(page number not for citation purposes)
Available online http://arthritis-research.com/content/11/3/R96
of proteases, both intracellular and extracellular, in all catalyticclasses.
Validation of the Taqman® low-density array data in this studycan be achieved in part by comparison with our previouslypublished data for the MMP and ADAMTS families in similartissue cohorts. Of the 27 genes in these families shown to bedifferentially expressed in NOF compared with OA in thepresent study, 25 genes were regulated similarly in an earliercohort [7]. For MMP14 (P = 0.03) and ADAMTS6 (P =0.007), we had not previously reported significant differencesbetween NOF and OA. Similarly, six genes shown to be differ-entially expressed in the earlier cohort [7] were not identifiedas such in the current study. Of these, MMP8, MMP10,ADAMTS3 and ADAMTS10 all exhibited the same increase ordecrease in expression between the NOF and OA, but this didnot reach statistical significance. MMP12 and ADAMTS20were not detected in the current study and were detected onlyat low levels in the earlier cohort [7]. These differences proba-
bly reflect variation between cohorts, variation in assay meth-odology or primer sets used, inaccuracy in the assay itselfwhere expression levels are very low and/or problems of mul-tiple testing. No correction for multiple testing has beenapplied in our analyses of the data since this can often lead toa type two error (false negatives). This would limit the utility ofgene expression studies where the validity of any multiple test-ing procedure has yet to be ascertained [13].
We used two methods to assign significance to the genesassayed, a standard Wilcoxon/Mann – Whitney U-test methodand the LogitBoost-NR methodology. The genes identified asbeing most significant by the two different methods werebroadly similar, increasing confidence that these genes are themost important. Whilst there are too many proteases to reviewthe potential role of each in OA individually, it is worth provid-ing details of the most significantly regulated genes.
Table 2
Number of genes in each catalytic class showing differential expression between osteoarthritis and fracture groups
P < 0.05 P < 0.01 P < 0.001 P < 0.0001
Aspartic proteases 1 3 3 1
Cysteine proteases 17 15 6 6
Metalloproteases 19 25 23 9
Serine proteases 19 11 6 10
Threonine proteases 3 2 0 0
Numbers of genes showing statistical significance between the two groups (osteoarthritis versus fracture to the neck of femur (NOF)) in each catalytic class. Pairwise statistical analysis between groups was performed using the Mann-Whitney U test.
Figure 1
Genes showing most significant differential expression between osteoarthritis and fracture groupsGenes showing most significant differential expression between osteoarthritis and fracture groups. Box and whisker plot for all genes displaying a statistical significance of P < 0.0001 by Mann-Whitney U test. For full gene names, see Tables 3 to 6. SDHA, succinate dehydrogenase subunit A; n.d., not detected.
Page 5 of 14(page number not for citation purposes)
Arthritis Research & Therapy Vol 11 No 3 Swingler et al.
BACE1, the aspartic protease β-secretase, catalyses the rate-limiting step in the production of amyloid beta, leading toplaque formation in Alzheimer's disease [14]. A number ofsubstrates other than amyloid precursor protein have beendescribed for BACE1, although the focus has been on thecentral nervous system. These include the shedding of theectodomain of IL-1 receptor type II – a decoy receptor thatacts as a ligand sink – from the cell surface, thereby limitingthe action of IL-1 [15]. Interestingly, in chondrocytes, insulin-like growth factor (IGF)-1 has been shown to induce the levelof IL-1 receptor type II as a mechanism to counter the cata-bolic effects of IL-1 [16]. An increase in BACE1 activity couldtherefore potentiate IL-1 signalling, contributing to cartilagedestruction in OA.
A major class of ectodomain sheddases is the ADAM (a disin-tegrin and metalloproteinase domain) family. ADAM12,reported additionally to cleave some matrix components aswell as IGF binding proteins, has been linked to OA in geneticassociation studies (for example [17]). ADAM8 is expressedin the developing skeleton [18] and has been shown, alongwith ADAM23, to be expressed during differentiation of mes-enchymal stem cells into chondrocytes [19]. The most signifi-cant difference in ADAM expression in OA compared withnormal is for ADAM22. This protein has no protease activityand is presumed to have roles in cell adhesion or as a receptor(with several binding proteins identified), particularly in thenervous system since the ADAM22 null mouse displays ataxiaand peripheral nerve hypomyelination [20].
Following ectodomain shedding, some transmembrane pro-teins undergo so-called regulated intramembrane proteolysis[21], whereby the peptide bond is cleaved within the hydro-phobic lipid bilayer, often releasing the cytoplasmic domain forintracellular action. The best known of these intramembranecleaving proteases is γ-secretase, which cleaves amyloid pre-cursor protein in the second step of amyloidogenesis. Onecomponent of this enzyme is presenilin 2, also significantlyincreased in expression in OA cartilage in this study. γ-Secre-
tase has recently been shown to process the IL-1 receptortype I, the signalling receptor [22]. Other intramembranecleaving proteases come from the S2P (MBTPS1 andMBTPS2), the signal peptide peptidases (or presenilin homo-logues) and the rhomboids [23]. Many genes across thesefamilies show significant changes in expression between nor-mal and OA cartilage, and the potential to act in inflammatorypathways – for example, SPPL2B (presenilin homolog 4) hasbeen shown to promote intramembrane proteolysis of TNFα[24].
Two aspartic proteases significantly increased in expression inOA are nuclear hormone interacting proteins (NRIP2 andNRIP3). These proteases are recently discovered and havenot been reported in cartilage before, but nuclear hormonereceptors have many roles in cartilage homeostasis.
Cathepsin D is a lysosomal enzyme, capable of aggrecancleavage. Whilst a recent proteomics study confirms thatcathepsin D is highly expressed in chondrocytes [25], its rolein cartilage degradation remains equivocal.
Of the cysteine protease cathepsins, cathepsin K showed ahigh level of expression in cartilage, as well as a robust andsignificant increase in expression in OA. Cathepsin K is theonly vertebrate enzyme outside the MMP family capable ofdegrading the collagen triple helix, but has also been shown todegrade other matrix proteins. Cathepsin K activity has beendemonstrated in human articular cartilage and has beenshown to play a role in collagen cleavage in at least a subsetof OA patients [5].
Cathepsin O and cathepsin Z are also highly expressed genesin cartilage and, again, significantly increased in expression inOA tissue versus normal tissue. Little is known about the func-tion of each of these enzymes, although they are presumed tobe active predominantly intracellularly [26,27]. Cathepsin H,cathepsin C, cathepsin F, cathepsin W, cathepsin B andcathepsin S are also increased in expression in OA tissue
Table 3
Fold change and threshold cycle for aspartate proteases showing significant difference between OA and NOF
Gene name Gene symbol P value Fold change OA/NOF Median threshold cycle
β-Secretase 1 BACE1 0.00005 2.9 30.7
Nuclear receptor interacting protein 2 NRIP2 0.00014 3.7 33.8
Presenilin homolog 4/SPPL2B SPPL2B 0.00028 1.9 28.1
Cathepsin D CTSD 0.00071 3.4 24.5
Presenilin 2 PSEN2 0.00137 1.9 30.1
Nuclear receptor interacting protein 3 NRIP3 0.00170 3.7 34.6
Pepsin A PGA3/4/5 0.00170 6.8 35.3
Fold change and median threshold cycle for all aspartate protease genes showing significant difference at P < 0.01 between osteoarthritis (OA) versus fracture to the neck of femur (NOF). P value from the Mann-Whitney U test.
Page 6 of 14(page number not for citation purposes)
Available online http://arthritis-research.com/content/11/3/R96
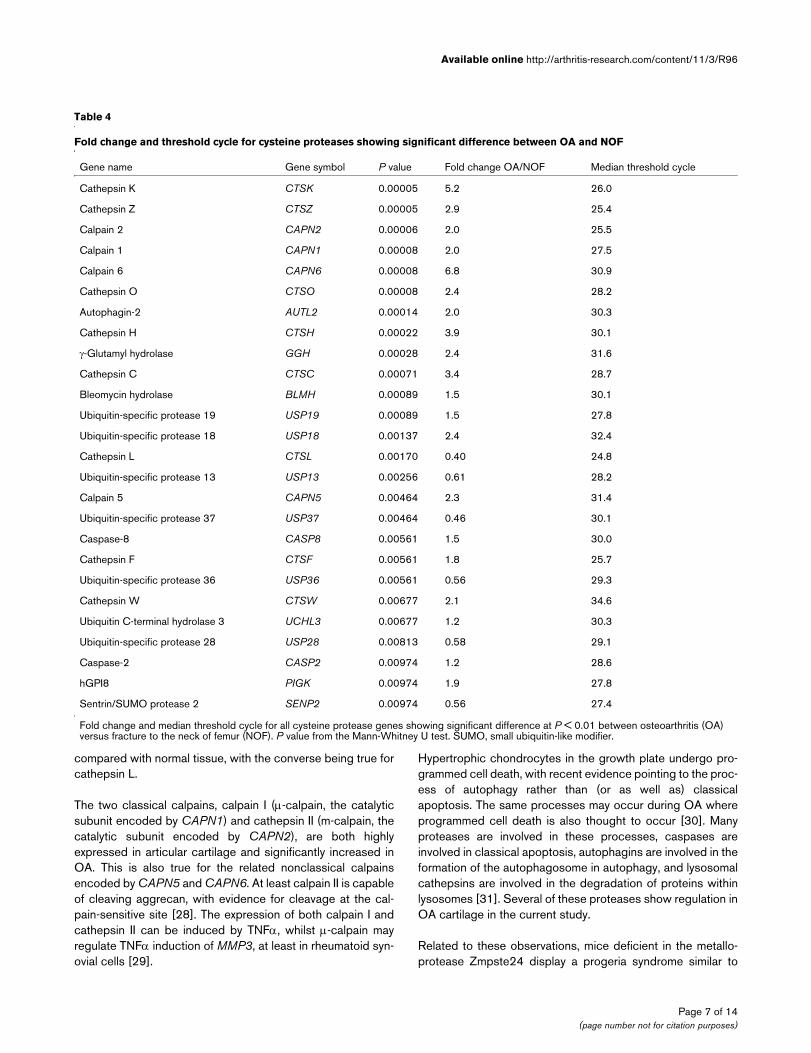
compared with normal tissue, with the converse being true forcathepsin L.
The two classical calpains, calpain I (μ-calpain, the catalyticsubunit encoded by CAPN1) and cathepsin II (m-calpain, thecatalytic subunit encoded by CAPN2), are both highlyexpressed in articular cartilage and significantly increased inOA. This is also true for the related nonclassical calpainsencoded by CAPN5 and CAPN6. At least calpain II is capableof cleaving aggrecan, with evidence for cleavage at the cal-pain-sensitive site [28]. The expression of both calpain I andcathepsin II can be induced by TNFα, whilst μ-calpain mayregulate TNFα induction of MMP3, at least in rheumatoid syn-ovial cells [29].
Hypertrophic chondrocytes in the growth plate undergo pro-grammed cell death, with recent evidence pointing to the proc-ess of autophagy rather than (or as well as) classicalapoptosis. The same processes may occur during OA whereprogrammed cell death is also thought to occur [30]. Manyproteases are involved in these processes, caspases areinvolved in classical apoptosis, autophagins are involved in theformation of the autophagosome in autophagy, and lysosomalcathepsins are involved in the degradation of proteins withinlysosomes [31]. Several of these proteases show regulation inOA cartilage in the current study.
Related to these observations, mice deficient in the metallo-protease Zmpste24 display a progeria syndrome similar to
Table 4
Fold change and threshold cycle for cysteine proteases showing significant difference between OA and NOF
Gene name Gene symbol P value Fold change OA/NOF Median threshold cycle
Cathepsin K CTSK 0.00005 5.2 26.0
Cathepsin Z CTSZ 0.00005 2.9 25.4
Calpain 2 CAPN2 0.00006 2.0 25.5
Calpain 1 CAPN1 0.00008 2.0 27.5
Calpain 6 CAPN6 0.00008 6.8 30.9
Cathepsin O CTSO 0.00008 2.4 28.2
Autophagin-2 AUTL2 0.00014 2.0 30.3
Cathepsin H CTSH 0.00022 3.9 30.1
γ-Glutamyl hydrolase GGH 0.00028 2.4 31.6
Cathepsin C CTSC 0.00071 3.4 28.7
Bleomycin hydrolase BLMH 0.00089 1.5 30.1
Ubiquitin-specific protease 19 USP19 0.00089 1.5 27.8
Ubiquitin-specific protease 18 USP18 0.00137 2.4 32.4
Cathepsin L CTSL 0.00170 0.40 24.8
Ubiquitin-specific protease 13 USP13 0.00256 0.61 28.2
Calpain 5 CAPN5 0.00464 2.3 31.4
Ubiquitin-specific protease 37 USP37 0.00464 0.46 30.1
Caspase-8 CASP8 0.00561 1.5 30.0
Cathepsin F CTSF 0.00561 1.8 25.7
Ubiquitin-specific protease 36 USP36 0.00561 0.56 29.3
Cathepsin W CTSW 0.00677 2.1 34.6
Ubiquitin C-terminal hydrolase 3 UCHL3 0.00677 1.2 30.3
Ubiquitin-specific protease 28 USP28 0.00813 0.58 29.1
Caspase-2 CASP2 0.00974 1.2 28.6
hGPI8 PIGK 0.00974 1.9 27.8
Sentrin/SUMO protease 2 SENP2 0.00974 0.56 27.4
Fold change and median threshold cycle for all cysteine protease genes showing significant difference at P < 0.01 between osteoarthritis (OA) versus fracture to the neck of femur (NOF). P value from the Mann-Whitney U test. SUMO, small ubiquitin-like modifier.
Page 7 of 14(page number not for citation purposes)

Arthritis Research & Therapy Vol 11 No 3 Swingler et al.
Table 5
Fold change and threshold cycle for metalloproteases showing significant difference between OA and NOF
Gene name Gene symbol P value Fold change OA/NOF Median threshold cycle
ADAM22 ADAM22 0.00005 6.0 32.3
ADAMTS2 ADAMTS2 0.00005 8.1 29.1
Aminopeptidase-like 1 NPEPL1 0.00005 3.7 30.2
Stromelysin 1 MMP3 0.00005 0.03 22.5
Stromelysin 3 MMP11 0.00005 81.4 31.0
MMP23A/B MMP23A/B 0.00006 24.7 34.2
Mammalian tolloid-like 1 protein TLL1 0.00006 4.9 31.9
ADAMTS1 ADAMTS1 0.00008 0.37 26.3
Carboxypeptidase Z CPZ 0.00008 12.6 35.0
Procollagen C-proteinase BMP1 0.00011 2.9 29.2
MT3-MMP MMP16 0.00014 6.9 31.2
ADAMTS14 ADAMTS14 0.00017 11.2 33.5
ADAMTS16 ADAMTS16 0.00017 19.6 33.7
Aminopeptidase N ANPEP 0.00017 5.3 27.2
Dihydropyrimidinase-related protein 2 DPYSL2 0.00022 2.2 25.1
Pappalysin-2 PAPPA2 0.00022 0.28 30.4
Plasma Glu-carboxypeptidase PGCP 0.00022 2.9 29.9
Cytosol alanyl aminopeptidase NPEPPS 0.00028 0.69 25.7
Gelatinase A MMP2 0.00036 9.7 24.4
Leucyl aminopeptidase LAP3 0.00045 1.6 28.9
ADAMTS9 ADAMTS9 0.00057 0.10 30.4
Gelatinase B MMP9 0.00057 31.9 31.3
Aminopeptidase B-like 1 RNPEPL1 0.00071 2.1 29.5
Membrane dipeptidase 2 DPEP2 0.00071 5.6 35.1
NAALADASE II NAALAD2 0.00071 3.0 35.0
PM20D2 peptidase PM20D2 0.00071 0.36 27.6
ADAM12 ADAM12 0.00089 4.0 27.6
MMP19 MMP19 0.00089 16.5 29.8
MMP21 MMP21 0.00089 3.2 34.1
Carboxypeptidase X1 CPXM1 0.00137 36.1 31.6
ADAMTS12 ADAMTS12 0.00170 20.3 32.3
Adipocyte-enhanced binding protein 1 AEBP1 0.00170 2.2 24.6
Collagenase 3 MMP13 0.00170 26.0 27.1
ADAM9 ADAM9 0.00256 1.8 27.3
FACE-2/RCE1 FACE2 0.00256 0.80 29.6
X-Pro dipeptidase PEPD 0.00256 2.1 31.2
Leukotriene A4 hydrolase LTA4H 0.00313 0.51 26.7
NAALADASE like 2 NAALADL2 0.00313 3.8 31.0
Neprilysin MME 0.00313 9.8 30.9
Page 8 of 14(page number not for citation purposes)
Available onl ine http://arthritis-research.com/content/11/3/R96
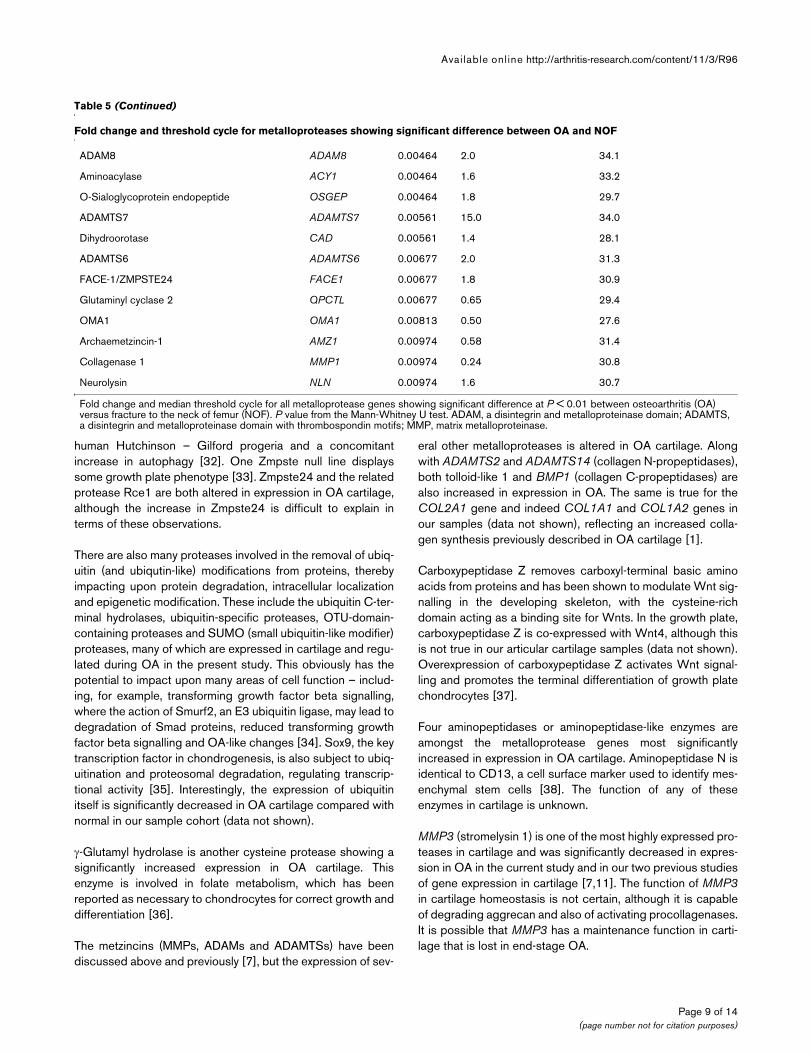
human Hutchinson – Gilford progeria and a concomitantincrease in autophagy [32]. One Zmpste null line displayssome growth plate phenotype [33]. Zmpste24 and the relatedprotease Rce1 are both altered in expression in OA cartilage,although the increase in Zmpste24 is difficult to explain interms of these observations.
There are also many proteases involved in the removal of ubiq-uitin (and ubiqutin-like) modifications from proteins, therebyimpacting upon protein degradation, intracellular localizationand epigenetic modification. These include the ubiquitin C-ter-minal hydrolases, ubiquitin-specific proteases, OTU-domain-containing proteases and SUMO (small ubiquitin-like modifier)proteases, many of which are expressed in cartilage and regu-lated during OA in the present study. This obviously has thepotential to impact upon many areas of cell function – includ-ing, for example, transforming growth factor beta signalling,where the action of Smurf2, an E3 ubiquitin ligase, may lead todegradation of Smad proteins, reduced transforming growthfactor beta signalling and OA-like changes [34]. Sox9, the keytranscription factor in chondrogenesis, is also subject to ubiq-uitination and proteosomal degradation, regulating transcrip-tional activity [35]. Interestingly, the expression of ubiquitinitself is significantly decreased in OA cartilage compared withnormal in our sample cohort (data not shown).
γ-Glutamyl hydrolase is another cysteine protease showing asignificantly increased expression in OA cartilage. Thisenzyme is involved in folate metabolism, which has beenreported as necessary to chondrocytes for correct growth anddifferentiation [36].
The metzincins (MMPs, ADAMs and ADAMTSs) have beendiscussed above and previously [7], but the expression of sev-
eral other metalloproteases is altered in OA cartilage. Alongwith ADAMTS2 and ADAMTS14 (collagen N-propeptidases),both tolloid-like 1 and BMP1 (collagen C-propeptidases) arealso increased in expression in OA. The same is true for theCOL2A1 gene and indeed COL1A1 and COL1A2 genes inour samples (data not shown), reflecting an increased colla-gen synthesis previously described in OA cartilage [1].
Carboxypeptidase Z removes carboxyl-terminal basic aminoacids from proteins and has been shown to modulate Wnt sig-nalling in the developing skeleton, with the cysteine-richdomain acting as a binding site for Wnts. In the growth plate,carboxypeptidase Z is co-expressed with Wnt4, although thisis not true in our articular cartilage samples (data not shown).Overexpression of carboxypeptidase Z activates Wnt signal-ling and promotes the terminal differentiation of growth platechondrocytes [37].
Four aminopeptidases or aminopeptidase-like enzymes areamongst the metalloprotease genes most significantlyincreased in expression in OA cartilage. Aminopeptidase N isidentical to CD13, a cell surface marker used to identify mes-enchymal stem cells [38]. The function of any of theseenzymes in cartilage is unknown.
MMP3 (stromelysin 1) is one of the most highly expressed pro-teases in cartilage and was significantly decreased in expres-sion in OA in the current study and in our two previous studiesof gene expression in cartilage [7,11]. The function of MMP3in cartilage homeostasis is not certain, although it is capableof degrading aggrecan and also of activating procollagenases.It is possible that MMP3 has a maintenance function in carti-lage that is lost in end-stage OA.
ADAM8 ADAM8 0.00464 2.0 34.1
Aminoacylase ACY1 0.00464 1.6 33.2
O-Sialoglycoprotein endopeptide OSGEP 0.00464 1.8 29.7
ADAMTS7 ADAMTS7 0.00561 15.0 34.0
Dihydroorotase CAD 0.00561 1.4 28.1
ADAMTS6 ADAMTS6 0.00677 2.0 31.3
FACE-1/ZMPSTE24 FACE1 0.00677 1.8 30.9
Glutaminyl cyclase 2 QPCTL 0.00677 0.65 29.4
OMA1 OMA1 0.00813 0.50 27.6
Archaemetzincin-1 AMZ1 0.00974 0.58 31.4
Collagenase 1 MMP1 0.00974 0.24 30.8
Neurolysin NLN 0.00974 1.6 30.7
Fold change and median threshold cycle for all metalloprotease genes showing significant difference at P < 0.01 between osteoarthritis (OA) versus fracture to the neck of femur (NOF). P value from the Mann-Whitney U test. ADAM, a disintegrin and metalloproteinase domain; ADAMTS, a disintegrin and metalloproteinase domain with thrombospondin motifs; MMP, matrix metalloproteinase.
Table 5 (Continued)
Fold change and threshold cycle for metalloproteases showing significant difference between OA and NOF
Page 9 of 14(page number not for citation purposes)
Arthritis Research & Therapy Vol 11 No 3 Swingler et al.
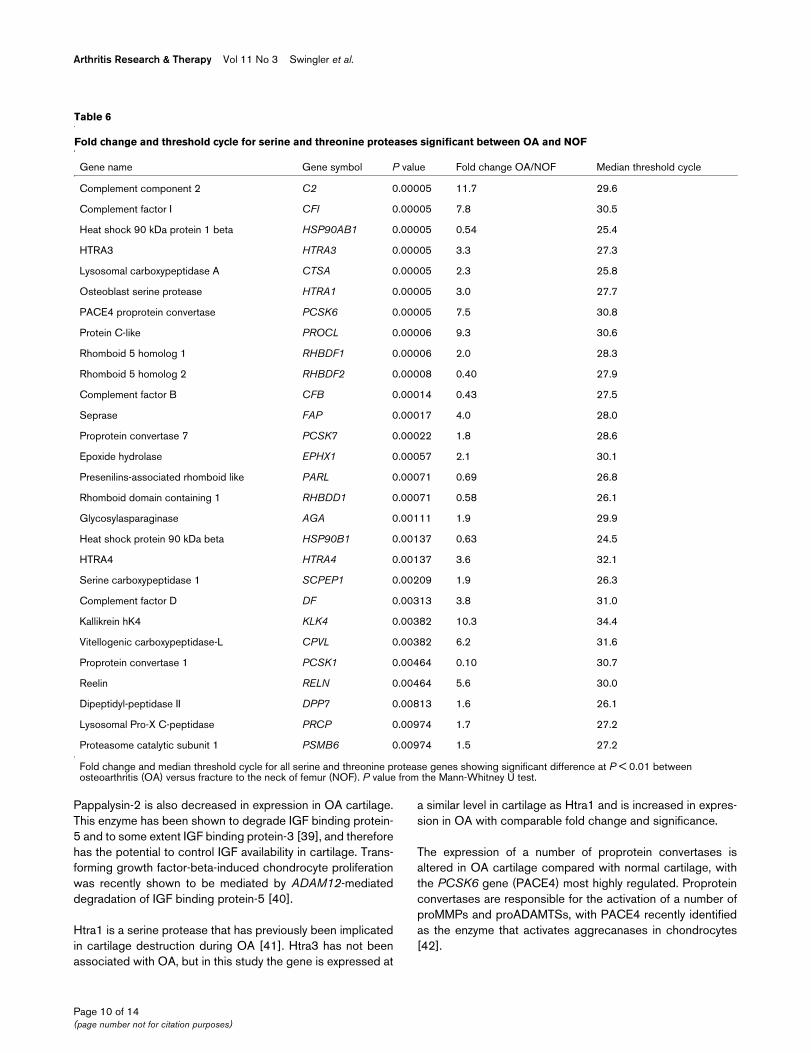
Pappalysin-2 is also decreased in expression in OA cartilage.This enzyme has been shown to degrade IGF binding protein-5 and to some extent IGF binding protein-3 [39], and thereforehas the potential to control IGF availability in cartilage. Trans-forming growth factor-beta-induced chondrocyte proliferationwas recently shown to be mediated by ADAM12-mediateddegradation of IGF binding protein-5 [40].
Htra1 is a serine protease that has previously been implicatedin cartilage destruction during OA [41]. Htra3 has not beenassociated with OA, but in this study the gene is expressed at
a similar level in cartilage as Htra1 and is increased in expres-sion in OA with comparable fold change and significance.
The expression of a number of proprotein convertases isaltered in OA cartilage compared with normal cartilage, withthe PCSK6 gene (PACE4) most highly regulated. Proproteinconvertases are responsible for the activation of a number ofproMMPs and proADAMTSs, with PACE4 recently identifiedas the enzyme that activates aggrecanases in chondrocytes[42].
Table 6
Fold change and threshold cycle for serine and threonine proteases significant between OA and NOF
Gene name Gene symbol P value Fold change OA/NOF Median threshold cycle
Complement component 2 C2 0.00005 11.7 29.6
Complement factor I CFI 0.00005 7.8 30.5
Heat shock 90 kDa protein 1 beta HSP90AB1 0.00005 0.54 25.4
HTRA3 HTRA3 0.00005 3.3 27.3
Lysosomal carboxypeptidase A CTSA 0.00005 2.3 25.8
Osteoblast serine protease HTRA1 0.00005 3.0 27.7
PACE4 proprotein convertase PCSK6 0.00005 7.5 30.8
Protein C-like PROCL 0.00006 9.3 30.6
Rhomboid 5 homolog 1 RHBDF1 0.00006 2.0 28.3
Rhomboid 5 homolog 2 RHBDF2 0.00008 0.40 27.9
Complement factor B CFB 0.00014 0.43 27.5
Seprase FAP 0.00017 4.0 28.0
Proprotein convertase 7 PCSK7 0.00022 1.8 28.6
Epoxide hydrolase EPHX1 0.00057 2.1 30.1
Presenilins-associated rhomboid like PARL 0.00071 0.69 26.8
Rhomboid domain containing 1 RHBDD1 0.00071 0.58 26.1
Glycosylasparaginase AGA 0.00111 1.9 29.9
Heat shock protein 90 kDa beta HSP90B1 0.00137 0.63 24.5
HTRA4 HTRA4 0.00137 3.6 32.1
Serine carboxypeptidase 1 SCPEP1 0.00209 1.9 26.3
Complement factor D DF 0.00313 3.8 31.0
Kallikrein hK4 KLK4 0.00382 10.3 34.4
Vitellogenic carboxypeptidase-L CPVL 0.00382 6.2 31.6
Proprotein convertase 1 PCSK1 0.00464 0.10 30.7
Reelin RELN 0.00464 5.6 30.0
Dipeptidyl-peptidase II DPP7 0.00813 1.6 26.1
Lysosomal Pro-X C-peptidase PRCP 0.00974 1.7 27.2
Proteasome catalytic subunit 1 PSMB6 0.00974 1.5 27.2
Fold change and median threshold cycle for all serine and threonine protease genes showing significant difference at P < 0.01 between osteoarthritis (OA) versus fracture to the neck of femur (NOF). P value from the Mann-Whitney U test.
Page 10 of 14(page number not for citation purposes)

Available online http://arthritis-research.com/content/11/3/R96
Four genes encoding complement factors are regulated in OAcartilage compared with normal, with CFI, C2 and DF increas-ing and CFB decreasing. In the complement pathway, C2 ispart of the classical pathway and CFB and DF are part of thealternative pathway with CFI inhibiting C3b. CFI was alsorecently described as increasing in expression in the lesionsite of an OA knee compared with macroscopically normal car-tilage from the same knee [43]. Other relevant functions forcomplement factors in OA have also been described, withC1s recently identified as the protease in OA synovial fluidresponsible for cleavage of IGF binding protein-5 [44]. DF,also known as adipsin, is used as a marker of adipose cellsand may be a readout for the differentiation status of thechondrocytes in OA cartilage.
PROCL is also called 'regeneration-associated muscle pro-tease' or RAMP, and is induced in regenerating skeletal mus-cle in mice, as well as being lower in muscle cell lines derivedfrom Duchenne muscular dystrophy patients compared with a
normal cell line [45]. This protease may therefore have a rolein tissue regeneration, pertinent to cartilage in OA.
As already briefly discussed above, several members of therhomboid family of intramembrane proteases are expressed incartilage and altered in expression in OA. RHBDF1 hasrecently been implicated in signalling from the epidermalgrowth factor receptor [46] that is implicated in skeletal devel-
Figure 2
Ranking of genesRanking of genes. (a) Rank scores by the Wilcoxon text. (b) Rank scores by the LogitBoost-NR algorithm.
Table 7
Ranking of genes using the LogitBoost-NR algorithm compared with the Wilcoxon test
Gene symbol Rank by LogitBoost-NR Rank by Wilcoxon
BACE1 50 132
CTSK 50 132
CTSZ 50 132
MMP3 49 132
MMP11 49 132
ADAM22 47 132
ADAMTS2 46 132
CAPN2 37 131
MMP23A 35 131
ADAMTS1 34 130
TLL1 33 131
NPEPL1 32 132
CTSO 30 130
CAPN6 28 130
CAPN1 26 130
NPEPPS 26 125
CTSH 22 126
BMP1 21 129
NRIP2 21 128
MMP16 20 128
C2 18 132
AUTL2 18 128
CTSD 17 121
CFI 16 132
PROCL 16 131
CPZ 15 130
USP19 14 120
MMP2 13 124
SPPL2B 13 122
HTRA1 12 132
For the top 30 genes ranked by LogitBoost-NR. For full gene names, see Tables 3 to 6.
Page 11 of 14(page number not for citation purposes)
Arthritis Research & Therapy Vol 11 No 3 Swingler et al.
opment, as well as in autophagy [47]. PARL, a mitochondrialrhomboid, is a regulator of apoptosis [48].
We have previously shown fibroblast activation protein alphato be elevated in OA cartilage and by inflammatory stimuli inchondrocytes [49].
The gene encoded by Hsp90AB1 is a cytoplasmic heat shockprotein, whilst that encoded by Hsp90B1 is located in theendoplasmic reticulum; both genes are highly expressed incartilage and significantly increased in OA. Heat shock pro-teins act as molecular chaperones, and their induction mayindicate a level of cell stress. Heat shock protein 90 has alsobeen shown to mediate IGF-1 and IL-1β signalling in chondro-cytes, and to contribute to the expression of the MMP13 gene[50].
ConclusionsThere are myriad possibilities for protease function in cartilagemetabolism, which may alter in OA, but a number of thesecome to the fore in the results and discussion above: directproteolysis of extracellular matrix proteins or proteoglycans;activation of other proteases; regulation of cell signalling (forexample, via IGF or IL-1); apoptosis and/or autophagy; and,related to this, intracellular degradation of proteins.
The present study is the most complete quantitative analysisof protease gene expression in cartilage to date. The data helpgive direction to future research on the specific function(s) ofindividual proteases or protease families in normal cartilageand in OA.
Competing interestsThe authors declare that they have no competing interests.
Authors' contributionsTES helped to design and coordinate the study, collected andprocessed tissue samples, performed real-time PCR, analyseddata and helped draft the manuscript. JGW helped in collect-ing and processing tissue samples. RKD helped in collectingand processing tissue samples, and advised running and inter-preting low-density arrays. CJP and XSP designed the low-density arrays. CD and AC took patient consent and coordi-nated tissue collection. STD helped design and coordinate thestudy, tissue collection and interpretation of data. GRG andWW undertook data analysis, particularly with respect tomachine learning algorithms. IMC helped conceive, designand coordinate the study, analysed data and helped to draftthe manuscript. All authors read and approved the final manu-script.
Additional files
AcknowledgementsThe present work was supported by grants from the Dunhill Medical Trust and the Arthritis Research Campaign, UK.
References1. Wieland HA, Michaelis M, Kirschbaum BJ, Rudolphi KA: Osteoar-
thritis – an untreatable disease? Nat Rev Drug Discov 2005,4:331-344.
2. Rengel Y, Ospelt C, Gay S: Proteinases in the joint: clinical rel-evance of proteinases in joint destruction. Arthritis Res Ther2007, 9:221.
3. Rowan AD, Litherland GJ, Hui W, Milner JM: Metalloproteases aspotential therapeutic targets in arthritis treatment. Expert OpinTher Targets 2008, 12:1-18.
4. Milner JM, Elliott SF, Cawston TE: Activation of procollagenasesis a key control point in cartilage collagen degradation: inter-action of serine and metalloproteinase pathways. ArthritisRheum 2001, 44:2084-2096.
5. Dejica VM, Mort JS, Laverty S, Percival MD, Antoniou J, Zukor DJ,Poole AR: Cleavage of type II collagen by cathepsin K in humanosteoarthritic cartilage. Am J Pathol 2008, 173:161-169.
6. Quesada V, Ordonez GR, Sanchez LM, Puente XS, Lopez-Otin C:The Degradome database: mammalian proteases and dis-eases of proteolysis. Nucleic Acids Res 2008, 37:D239-D243.
7. Davidson RK, Waters JG, Kevorkian L, Darrah C, Cooper A, DonellST, Clark IM: Expression profiling of metalloproteinases andtheir inhibitors in synovium and cartilage. Arthritis Res Ther2006, 8:R124.
8. Guile G, Wang W: Relationship between depth of decisiontrees and boosting performance. Proceedings of the IEEE Inter-national Joint Conference on Neural Networks: 1–8 June 2008;Hong Kong 2008:2267-2274.
9. Friedman J, Hastie T, Tibshirani R: Additive logistic regression: astatistical view of boosting. Annals Stat 2000, 28:337-407.
The following Additional files are available online:
Additional data file 1Word file containing a table that lists full details of the LogitBoost-NR algorithms for gene selection and sample classification from gene expression data.See http://www.biomedcentral.com/content/supplementary/ar2741-S1.doc
Additional data file 2Excel file containing a spreadsheet of expression data for all protease genes assayed (median threshold cycle (Ct) of NOF and OA, fold difference and P values).See http://www.biomedcentral.com/content/supplementary/ar2741-S2.xls
Additional data file 3Excel file containing a spreadsheet of the rank order for all protease genes assayed by the LogitBoost-NR algorithm and the Wilcoxon test.See http://www.biomedcentral.com/content/supplementary/ar2741-S3.xls
Page 12 of 14(page number not for citation purposes)
Available online http://arthritis-research.com/content/11/3/R96
10. Guile G, Wang W: Boosting for feature selection for microarraydata analysis. Proceedings of the IEEE International Joint Con-ference on Neural Networks: 1–8 June 2008; Hong Kong2008:2559-2563.
11. Kevorkian L, Young DA, Darrah C, Donell ST, Shepstone L, PorterS, Brockbank SM, Edwards DR, Parker AE, Clark IM: Expressionprofiling of metalloproteinases and their inhibitors in cartilage.Arthritis Rheum 2004, 50:131-141.
12. Vandesompele J, De Preter K, Pattyn F, Poppe B, Van Roy N, DePaepe A, Speleman F: Accurate normalization of real-timequantitative RT-PCR data by geometric averaging of multipleinternal control genes. Genome Biol 2002, 3:RESEARCH0034.
13. Bretz F, Landgrebe J, Brunner E: Multiplicity issues in microarrayexperiments. Methods Inf Med 2005, 44:431-437.
14. Stockley JH, O'Neill C: Understanding BACE1: essential pro-tease for amyloid-beta production in Alzheimer's disease. CellMol Life Sci 2008, 65:3265-3289.
15. Kuhn PH, Marjaux E, Imhof A, De Strooper B, Haass C, Lich-tenthaler SF: Regulated intramembrane proteolysis of theinterleukin-1 receptor II by alpha-, beta-, and gamma-secre-tase. J Biol Chem 2007, 282:11982-11995.
16. Wang J, Elewaut D, Veys EM, Verbruggen G: Insulin-like growthfactor 1-induced interleukin-1 receptor II overrides the activityof interleukin-1 and controls the homeostasis of the extracel-lular matrix of cartilage. Arthritis Rheum 2003, 48:1281-1291.
17. Valdes AM, Hassett G, Hart DJ, Spector TD: Radiographic pro-gression of lumbar spine disc degeneration is influenced byvariation at inflammatory genes: a candidate SNP associationstudy in the Chingford cohort. Spine 2005, 30:2445-2451.
18. Kelly K, Hutchinson G, Nebenius-Oosthuizen D, Smith AJ, BartschJW, Horiuchi K, Rittger A, Manova K, Docherty AJ, Blobel CP: Met-alloprotease-disintegrin ADAM8: expression analysis and tar-geted deletion in mice. Dev Dyn 2005, 232:221-231.
19. Djouad F, Delorme B, Maurice M, Bony C, Apparailly F, Louis-Plence P, Canovas F, Charbord P, Noel D, Jorgensen C: Microen-vironmental changes during differentiation of mesenchymalstem cells towards chondrocytes. Arthritis Res Ther 2007,9:R33.
20. Sagane K, Hayakawa K, Kai J, Hirohashi T, Takahashi E, MiyamotoN, Ino M, Oki T, Yamazaki K, Nagasu T: Ataxia and peripheralnerve hypomyelination in ADAM22-deficient mice. BMC Neu-rosci 2005, 6:33.
21. Brown MS, Ye J, Rawson RB, Goldstein JL: Regulated intramem-brane proteolysis: a control mechanism conserved from bac-teria to humans. Cell 2000, 100:391-398.
22. Elzinga BM, Twomey C, Powell JC, Harte F, McCarthy JV: Theinterleukin-1 receptor type-1 is a substrate for gamma-secre-tase dependent regulated intramembrane proteolysis. J BiolChem 2009, 284:1394-1409.
23. Spasic D, Annaert W: Building gamma-secretase: the bits andpieces. J Cell Sci 2008, 121:413-420.
24. Friedmann E, Hauben E, Maylandt K, Schleeger S, Vreugde S,Lichtenthaler SF, Kuhn PH, Stauffer D, Rovelli G, Martoglio B:SPPL2a and SPPL2b promote intramembrane proteolysis ofTNFα in activated dendritic cells to trigger IL-12 production.Nat Cell Biol 2006, 8:843-848.
25. Ruiz-Romero C, Lopez-Armada MJ, Blanco FJ: Proteomic charac-terization of human normal articular chondrocytes: a noveltool for the study of osteoarthritis and other rheumatic dis-eases. Proteomics 2005, 5:3048-3059.
26. Santamaria I, Pendas AM, Velasco G, Lopez-Otin C: Genomicstructure and chromosomal localization of the human cathep-sin O gene (CTSO). Genomics 1998, 53:231-234.
27. Santamaria I, Velasco G, Pendas AM, Fueyo A, Lopez-Otin C:Cathepsin Z, a novel human cysteine proteinase with a shortpropeptide domain and a unique chromosomal location. J BiolChem 1998, 273:16816-16823.
28. Maehara H, Suzuki K, Sasaki T, Oshita H, Wada E, Inoue T,Shimizu K: G1 – G2 aggrecan product that can be generated byM-calpain on truncation at Ala709 – Ala710 is present abun-dantly in human articular cartilage. J Biochem 2007,141:469-477.
29. Morita M, Banno Y, Dohjima T, Nozawa S, Fushimi K, Fan DG,Ohno T, Miyazawa K, Liu N, Shimizu K: Mu-calpain is involved inthe regulation of TNF-alpha-induced matrix metalloprotein-ase-3 release in a rheumatoid synovial cell line. Biochem Bio-phys Res Commun 2006, 343:937-942.
30. Del Carlo M Jr, Loeser RF: Cell death in osteoarthritis. CurrRheumatol Rep 2008, 10:37-42.
31. Marino G, Lopez-Otin C: Autophagy: molecular mechanisms,physiological functions and relevance in human pathology.Cell Mol Life Sci 2004, 61:1439-1454.
32. Marino G, Lopez-Otin C: Autophagy and aging: new lessonsfrom progeroid mice. Autophagy 2008, 4:807-809.
33. Pendas AM, Zhou Z, Cadinanos J, Freije JM, Wang J, Hultenby K,Astudillo A, Wernerson A, Rodriguez F, Tryggvason K, Lopez-OtinC: Defective prelamin A processing and muscular and adi-pocyte alterations in Zmpste24 metalloproteinase-deficientmice. Nat Genet 2002, 31:94-99.
34. Wu Q, Kim KO, Sampson ER, Chen D, Awad H, O'Brien T, PuzasJE, Drissi H, Schwarz EM, O'Keefe RJ, Zuscik MJ, Rosier RN:Induction of an osteoarthritis-like phenotype and degradationof phosphorylated Smad3 by Smurf2 in transgenic mice.Arthritis Rheum 2008, 58:3132-3144.
35. Akiyama H, Kamitani T, Yang X, Kandyil R, Bridgewater LC, FellousM, Mori-Akiyama Y, de Crombrugghe B: The transcription factorSox9 is degraded by the ubiquitin-proteasome system andstabilized by a mutation in a ubiquitin-target site. Matrix Biol2005, 23:499-505.
36. Kappen C, Mello MA, Finnell RH, Salbaum JM: Folate modulatesHox gene-controlled skeletal phenotypes. Genesis 2004,39:155-166.
37. Wang L, Shao YY, Ballock RT: Carboxypeptidase Z (CPZ) linksthyroid hormone and Wnt signaling pathways in growth platechondrocytes. J Bone Miner Res 2009, 24:265-273.
38. Olivier EN, Rybicki AC, Bouhassira EE: Differentiation of humanembryonic stem cells into bipotent mesenchymal stem cells.Stem Cells 2006, 24:1914-1922.
39. Overgaard MT, Boldt HB, Laursen LS, Sottrup-Jensen L, ConoverCA, Oxvig C: Pregnancy-associated plasma protein-A2 (PAPP-A2), a novel insulin-like growth factor-binding protein-5 protei-nase. J Biol Chem 2001, 276:21849-21853.
40. Okada A, Mochizuki S, Yatabe T, Kimura T, Shiomi T, Fujita Y, Mat-sumoto H, Sehara-Fujisawa A, Iwamoto Y, Okada Y: ADAM-12(meltrin alpha) is involved in chondrocyte proliferation viacleavage of insulin-like growth factor binding protein 5 in oste-oarthritic cartilage. Arthritis Rheum 2008, 58:778-789.
41. Grau S, Richards PJ, Kerr B, Hughes C, Caterson B, Williams AS,Junker U, Jones SA, Clausen T, Ehrmann M: The role of humanHtrA1 in arthritic disease. J Biol Chem 2006, 281:6124-6129.
42. Malfait AM, Arner EC, Song RH, Alston JT, Markosyan S, Staten N,Yang Z, Griggs DW, Tortorella MD: Proprotein convertase acti-vation of aggrecanases in cartilage in situ. Arch Biochem Bio-phys 2008, 478:43-51.
43. Geyer M, Grassel S, Straub RH, Schett G, Dinser R, Grifka J, GayS, Neumann E, Muller-Ladner U: Differential transcriptome anal-ysis of intraarticular lesional vs intact cartilage reveals newcandidate genes in osteoarthritis pathophysiology. Osteoar-thritis Cartilage 2009, 17:328-335.
44. Busby WH Jr, Yocum SA, Rowland M, Kellner D, Lazerwith S,Sverdrup F, Yates M, Radabaugh M, Clemmons DR: Complement1s is the serine protease that cleaves IGFBP-5 in human oste-oarthritic joint fluid. Osteoarthritis Cartilage 2009, 17:547-555.
45. Nakayama Y, Nara N, Kawakita Y, Takeshima Y, Arakawa M, KatohM, Morita S, Iwatsuki K, Tanaka K, Okamoto S, Kitamura T, Seki N,Matsuda R, Matsuo M, Saito K, Hara T: Cloning of cDNA encod-ing a regeneration-associated muscle protease whoseexpression is attenuated in cell lines derived from Duchennemuscular dystrophy patients. Am J Pathol 2004,164:1773-1782.
46. Zou H, Thomas SM, Yan ZW, Grandis JR, Vogt A, Li LY: Humanrhomboid family-1 gene RHBDF1 participates in GPCR-medi-ated transactivation of EGFR growth signals in head and necksquamous cancer cells. Faseb J 2009, 23:425-432.
47. Yan Z, Zou H, Tian F, Grandis JR, Mixson AJ, Lu PY, Li LY: Humanrhomboid family-1 gene silencing causes apoptosis orautophagy to epithelial cancer cells and inhibits xenografttumor growth. Mol Cancer Ther 2008, 7:1355-1364.
48. Cipolat S, Rudka T, Hartmann D, Costa V, Serneels L, CraessaertsK, Metzger K, Frezza C, Annaert W, D'Adamio L, Derks C,Dejaegere T, Pellegrin L, D'Hooge R, Scorrano L, De Strooper B:Mitochondrial rhomboid PARL regulates cytochrome c releaseduring apoptosis via OPA1-dependent cristae remodeling.Cell 2006, 126:163-175.
Page 13 of 14(page number not for citation purposes)
http://www.ncbi.nlm.nih.gov/entrez/query.fcgi?cmd=Retrieve&db=PubMed&dopt=Abstract&list_uids=9790772
http://www.ncbi.nlm.nih.gov/entrez/query.fcgi?cmd=Retrieve&db=PubMed&dopt=Abstract&list_uids=9790772
http://www.ncbi.nlm.nih.gov/entrez/query.fcgi?cmd=Retrieve&db=PubMed&dopt=Abstract&list_uids=9790772
http://www.ncbi.nlm.nih.gov/entrez/query.fcgi?cmd=Retrieve&db=PubMed&dopt=Abstract&list_uids=9642240
http://www.ncbi.nlm.nih.gov/entrez/query.fcgi?cmd=Retrieve&db=PubMed&dopt=Abstract&list_uids=9642240
Arthritis Research & Therapy Vol 11 No 3 Swingler et al.
49. Milner JM, Kevorkian L, Young DA, Jones D, Wait R, Donell ST,Barksby E, Patterson AM, Middleton J, Cravatt BF, Clark IM,Rowan AD, Cawston TE: Fibroblast activation protein alpha isexpressed by chondrocytes following a pro-inflammatorystimulus and is elevated in osteoarthritis. Arthritis Res Ther2006, 8:R23.
50. Fan Z, Tardif G, Hum D, Duval N, Pelletier JP, Martel-Pelletier J:Hsp90β and p130cas: novel regulatory factors of MMP-13expression in human osteoarthritic chondrocytes. Ann RheumDis 2009, 68:976-982.
51. Dettling M, Bühlmann P: Boosting for tumor classification withgene expression data. Bioinformatics 2003, 19:1061-1069.
52. Long PM, Vega VB: Boosting and microarray data. MachineLearning 2003, 52:31-44.
53. Guile GR, Wang W: Enhancing boosting by feature non-replacement for microarraydata analysis. Proceedings of theIEEE International Joint Conference on Neural Networks: 12–17August; Orlando 2007:430-435.
Page 14 of 14(page number not for citation purposes)