
Maintenance of “stem cell” features of cartilage cell sub ...
23
RESEARCH Open Access Maintenance of “stem cell” features of cartilage cell sub-populations during in vitro propagation Karin Benz 1* , Claudia Stippich 1 , Christian Freudigmann 1 , Juergen A Mollenhauer 1,2,3 and Wilhelm K Aicher 4 Abstract Background: The discovery of mesenchymal stem cells (MSCs) or MSC-like cells in cartilage tissue does not tie in well with the established view that MSCs derive from a perivascular niche. The presence of MSCs may raise concerns about specificity and application safety, particularly in terms of the regulatory site. The aim of the present study was to investigate the benefits or possible risks of the MSC-like properties of cells isolated from cartilage in the context of autologous chondrocyte implantation. Methods: Chondrocytic cells were isolated from cartilage or intervertebral disc tissue. Flow cytometry was used to analyze the expression of cell surface antigens. MSC-like cells were either enriched or depleted by means of magnetic cell sorting (MACS) involving the monoclonal antibodies W5C5/SUSD2 and W8B2/MSCA-1. We addressed the issues of prolonged expansion of such cells as well as the influence of culture medium as a trigger for selecting a single cell type. Established protocols were used to study in vitro differentiation. In addition to histological and biochemical assessment, the acquired phenotypes were also evaluated on the mRNA transcript level. Results: In the studied cells, we found strongly analogous expression of antigens typically expressed on MSCs, including CD49e, CD73, CD90, CD105, CD140b and CD166. The expression of W5C5 and W8B2 antigens in cartilage cell sub-populations did not correlate with multi-potency. We demonstrated that a chondroid precursor, but not a bona fide multipotent mesenchymal, cell type can be obtained under established in vitro culture conditions. The culture media used for expansion influenced the cell phenotype. Conclusions: The risk of adverse adipose or osseous differentiation is not posed by expanded chondrocyte cultures, even after enrichment of putative MSC-like cell populations by MACS. It is possible that this limited “stemness” in chondrocytes, expanded for use in ACI, may instead be beneficial as it allows re-differentiation under appropriate conditions despite prolonged times in culture. Keywords: Stem cells, Chondrocytes, Disc cells, Autologous chondrocyte implantation, Magnetic sorting, Differentiation Introduction Mesenchymal stem cells (MSCs), also referred to as mesen- chymal stromal cells, are undifferentiated cells present in various adult tissues. The multi-potent differentiation cap- acity of human MSCs was first described by Pittenger et al. at the turn of the 20th century [1]. MSCs represent a prom- ising candidate cell population in regenerative medicine and published reports of their application in numerous cases demonstrate their therapeutic potential in the regen- eration of all skeletal tissues, as well as of soft tissue organs. One particular advantage of MSCs is that they can be used when cells from the target tissue for regeneration are not available for developing cellular therapy. This is the case in intervertebral disc degeneration and MSC therapy repre- sents a promising tool. Cartilage and cartilaginous tissues are predominant in regenerative medicine due to the fact that they comprise a simple, homogenous tissue involving only one cell type, the chondrocyte. Consequently, autologous chondrocyte implantation (ACI) became an established cell-based med- ical procedure for repairing cartilage defects, and, like bone marrow transplantation, it obviously represents a key technology in regenerative medicine. Recent reports have * Correspondence: [email protected] 1 NMI Natural and Medical Sciences Institute at the University of Tuebingen, Markwiesenstr. 55, Reutlingen 72770, Germany Full list of author information is available at the end of the article © 2013 Benz et al.; licensee BioMed Central Ltd. This is an Open Access article distributed under the terms of the Creative Commons Attribution License (http://creativecommons.org/licenses/by/2.0), which permits unrestricted use, distribution, and reproduction in any medium, provided the original work is properly cited. Benz et al. Journal of Translational Medicine 2013, 11:27 http://www.translational-medicine.com/content/11/1/27
-
Upload
khangminh22 -
Category
Documents
-
view
0 -
download
0
Transcript of Maintenance of “stem cell” features of cartilage cell sub ...
Benz et al. Journal of Translational Medicine 2013, 11:27http://www.translational-medicine.com/content/11/1/27
RESEARCH Open Access
Maintenance of “stem cell” features of cartilagecell sub-populations during in vitro propagationKarin Benz1*, Claudia Stippich1, Christian Freudigmann1, Juergen A Mollenhauer1,2,3 and Wilhelm K Aicher4
Abstract
Background: The discovery of mesenchymal stem cells (MSCs) or MSC-like cells in cartilage tissue does not tie inwell with the established view that MSCs derive from a perivascular niche. The presence of MSCs may raiseconcerns about specificity and application safety, particularly in terms of the regulatory site. The aim of the presentstudy was to investigate the benefits or possible risks of the MSC-like properties of cells isolated from cartilage inthe context of autologous chondrocyte implantation.
Methods: Chondrocytic cells were isolated from cartilage or intervertebral disc tissue. Flow cytometry was used toanalyze the expression of cell surface antigens. MSC-like cells were either enriched or depleted by means ofmagnetic cell sorting (MACS) involving the monoclonal antibodies W5C5/SUSD2 and W8B2/MSCA-1. We addressedthe issues of prolonged expansion of such cells as well as the influence of culture medium as a trigger for selectinga single cell type. Established protocols were used to study in vitro differentiation. In addition to histological andbiochemical assessment, the acquired phenotypes were also evaluated on the mRNA transcript level.
Results: In the studied cells, we found strongly analogous expression of antigens typically expressed on MSCs,including CD49e, CD73, CD90, CD105, CD140b and CD166. The expression of W5C5 and W8B2 antigens in cartilagecell sub-populations did not correlate with multi-potency. We demonstrated that a chondroid precursor, but not abona fide multipotent mesenchymal, cell type can be obtained under established in vitro culture conditions. Theculture media used for expansion influenced the cell phenotype.
Conclusions: The risk of adverse adipose or osseous differentiation is not posed by expanded chondrocytecultures, even after enrichment of putative MSC-like cell populations by MACS. It is possible that this limited“stemness” in chondrocytes, expanded for use in ACI, may instead be beneficial as it allows re-differentiation underappropriate conditions despite prolonged times in culture.
Keywords: Stem cells, Chondrocytes, Disc cells, Autologous chondrocyte implantation, Magnetic sorting,Differentiation
IntroductionMesenchymal stem cells (MSCs), also referred to as mesen-chymal stromal cells, are undifferentiated cells present invarious adult tissues. The multi-potent differentiation cap-acity of human MSCs was first described by Pittenger et al.at the turn of the 20th century [1]. MSCs represent a prom-ising candidate cell population in regenerative medicineand published reports of their application in numerouscases demonstrate their therapeutic potential in the regen-eration of all skeletal tissues, as well as of soft tissue organs.
* Correspondence: [email protected] Natural and Medical Sciences Institute at the University of Tuebingen,Markwiesenstr. 55, Reutlingen 72770, GermanyFull list of author information is available at the end of the article
© 2013 Benz et al.; licensee BioMed Central LtCommons Attribution License (http://creativecreproduction in any medium, provided the or
One particular advantage of MSCs is that they can be usedwhen cells from the target tissue for regeneration are notavailable for developing cellular therapy. This is the case inintervertebral disc degeneration and MSC therapy repre-sents a promising tool.Cartilage and cartilaginous tissues are predominant in
regenerative medicine due to the fact that they comprise asimple, homogenous tissue involving only one cell type,the chondrocyte. Consequently, autologous chondrocyteimplantation (ACI) became an established cell-based med-ical procedure for repairing cartilage defects, and, likebone marrow transplantation, it obviously represents a keytechnology in regenerative medicine. Recent reports have
d. This is an Open Access article distributed under the terms of the Creativeommons.org/licenses/by/2.0), which permits unrestricted use, distribution, andiginal work is properly cited.
Benz et al. Journal of Translational Medicine 2013, 11:27 Page 2 of 23http://www.translational-medicine.com/content/11/1/27
shown that MSCs or undifferentiated progenitor cellsare present in cartilage and intervertebral disc tissue [2-8].Evidently, cartilage contains not only functionally differen-tiated cells (chondrocytes) but also undifferentiated pro-genitors or stromal stem cells. This raises the questionabout whether ACI should still be considered a chondro-cyte implantation or whether it is more correctly a stemcell therapy.The discovery of MSC-like cells in cartilage tissue is
significant because it questions the prevailing view thatMSC isolated from bone marrow or any other organ ortissue derived essentially from a perivascular niche [9-12].The cellular component of the perivascular niche thatfunctions as a stem cell in the postnatal organism is thepericyte [9,13]. Once this concept was established, asearch began for perivascular niches harboring MSCsand published reports described such niches in severaltissues, including human brain tissue [14,15]. Articularcartilage, however, is an avascular tissue devoid of bloodvessels (in healthy tissue), a fact that raises the questionabout the cellular nature and function of MSC-like cellswithin cartilaginous tissues.The source of cells for ACI is cartilage [16] or, for disc
repair, is disc (prolapse) tissue [17], with the cells usuallybeing expanded in vitro and subsequently re-implanted.Alterations in cell properties may occur during in vitromanipulation. Expansion may favor particular cell types,and, in terms of chondrocytes, this in vitro expansionhas historically been described as progressive, and atleast partly irreversible, de-differentiation and cellularageing [18,19]. Changes occur as early as in the first pas-sage [20]. When incubated in three-dimensional con-structs, cells may regain their chondrocytic phenotype[21]. However, beyond a certain number of cell dou-blings or passages, this phenotypic loss is apparentlyirreversible [22,23]. Pelttari et al. showed that chondro-cytes which underwent more than six population dou-blings in vitro lost the capacity to form stable ectopiccartilage [24].On the other hand, this phenomenon may also be
described as the regression towards an undifferentiatedcell type with higher plasticity which, however, shows aneed for specific induction of the cartilage phenotype.Up-regulation of markers regarded as distinctive forMSCs (CD10, CD90, CD105, and CD166) on articularchondrocytes monolayer cultures supports the theory ofa reversion to a primitive phenotype [25]. The existenceof chondrocyte subpopulations with phenotypic plasti-city, that are capable of generating a chondrogenic, adi-pogenic, and osteogenic lineage, has been reported byseveral authors [8,26-29].From a regulatory perspective, it is essential to clarify
these cell biological aspects of ACI, particularly in viewof future MSC applications in cartilage and disc repair.
The aim of the present study was to evaluate the “stemcell” features or “stemness” of chondrocytes populationsand identify whether they are advantageous or notwithin the context of ACI.To address this issue, the MSC sub-population hy-
pothesis was tested by means of selective enrichment ordepletion of cells presenting MSC antigens, using MACStechnology, from freshly-isolated primary cultured cells.Subsequently prolonged expansion was done and ananalysis of the differentiation capacity followed eachstage. The influence of culture medium as a trigger forselection towards a single cell type was also addressed.MSC surface antigens as detected by monoclonal anti-
bodies (mAb) clone W5C5 (alias SUSD2, shushi domainprotein 2) or W8B2 (alias MSC antigen-1 (MSCA-1) ortissue non-specific alkaline phosphatase (TNAP)),known to correlate with specific phenotypic skeletalcharacteristics, have been used to generate subpopula-tions. It has been suggested that MSCA-1+/CD56+MSCs are an attractive starting population for ACI be-cause differentiation experiments had shown that chon-drocytes were predominantly derived from this subset[30]. However, the MSCA-1+ fraction of human jawperiosteum-derived cells showed a significantly higherosteogenic capacity than the negative fraction [31]. Theantigen recognized by the W5C5 antibody is SUSD2(Sivasubramaniyan, et al.: Prospective isolation ofmesenchymal stem cells from human bone marrowusing novel antibodies directed against Sushi domaincontaining protein 2 (SUSD2), submitted); the antibodydescribes distinct MSC subpopulations and can be usedfor the prospective isolation of highly-purified bone mar-row MSCs [32]. Very recently, W5C5 epitope /SUSD2was identified as a single marker capable of purifyingendometrial MSCs, possessing MSC properties and re-constituting endometrial tissue in vitro [33].We, therefore, investigated whether the selection of
cartilage-derived cells by MSC-specific mAbs yielded achondroid precursor cell type or multi-potent MSC-likecells. We hypothesized that the results would provideevidence about whether in vitro expanded chondrocytecultures are associated with a risk of adverse adipose orosseous differentiation or not, especially after enrich-ment of putative MSC-like cell populations.
Materials and methodsArticular chondrocyte and intervertebral disc cell isolationand cultureCell isolation and culture were performed as describedin [34,35].Briefly, macroscopically normal appearing cartilage
was carefully harvested from the tibial plateau and fromthe condyles. Tissue samples were washed in phosphatebuffered saline (PBS; BioWhittaker; Verviers, Belgium)
Benz et al. Journal of Translational Medicine 2013, 11:27 Page 3 of 23http://www.translational-medicine.com/content/11/1/27
and then minced. Extracellular matrix was enzymaticallydegraded overnight using collagenase B (Roche; Mannheim,Germany) and hyaluronidase (Serva; Heidelberg, Germany).Isolated cells were filtered through a cell strainer and aftercentrifugation the cells were resuspended and used forMACS separation (see below) or expanded in primaryculture. To this end, 0.5 x 10⁶ cells were plated in a 75 cm2
cell culture flask in DMEM/Ham’s F12 (Lonza; Cologne,Germany) chondrocyte culture medium (CM) supple-mented with 10% FCS or human AB serum (HS; IKET;UKT, Tuebingen, Germany) as indicated, 150 μM ascorbicacid-2-phosphate (Sigma-Aldrich; Munich, Germany),100 U/ml penicillin, 100 μg/ml streptomycin (PAA; Pasching,Austria). The culture was kept at 37°C in humidified atmos-phere and 5% CO2. The cells were harvested at 80 - 90%confluence by trypsin-EDTA (Lonza; Cologne, Germany)treatment. The harvested cells (“P0 cells”) were used forMACS separation. All human tissues were obtained fromthe BG Trauma Center in Tuebingen (approved by thelocal ethics committee and informed consent from allindividuals). Details for donors and cell culture condi-tions are summarized in Additional file 1: Table S1.
Cell surface antigen profileTo investigate if chondrocytes and disc cells express typ-ical MSC surface markers flow cytometry was per-formed. Therefore phenotype profiling was performedwith P0 cells. The cells were detached, washed, incu-bated on ice with phycoerythrin (PE)-conjugated mono-clonal antibodies directed against CD34, CD45, CD49e,CD73, CD90, CD105, CD140b, CD166, CD271, W8B2(MSCA-1), W5C5 (SUSD2), according manufacturer’sinstructions (for further information see Additional file1: Table S2) and analyzed by flow cytometry (CytomixFC500; Beckman Coulter; Krefeld, Germany). Addition-ally for comparison with P0 profiles, surface antigen pro-files of chondrocyte subpopulations after expansion > 8population doublings (pds) were performed using thesame protocol.
Enrichment of cells using W5C5- and W8B2-coupledmagnetic microbeadsW5C5+ and W8B2+ cell populations were enriched bymagnetic separation using the MACSW technology. Themagnetic labeling and the magnetic separation wereperformed according to the supplyers protocol # 130-093-583 for the anti-MSCA-1 (W8B2, Microbead Kit,Miltenyi Biotech, Bergisch Gladbach, Germany). Briefly,human chondrocytes or human disc cells directly afterenzymatic digestion or from first passage (P0) wereattached to anti-W5C5 or anti-W8B2 microbeads, re-spectively, for 15 min. at 4°C. Magnetic separationresulted in three cell populations: the unsorted wholecells (unsorted), the positively enriched population
(pos. +) and the depleted (neg. -) fraction. To analyzethe quality of the separation flow cytometry (see above)based on the same antibodies was performed afterMACS separation.
Gene expression analysisThe gene expression analysis was performed in partsaccording to MIQE guidelines [36]. Total RNA wasextracted using the RNeasy mini kit plus DNase I diges-tion according to the manufacturer’s instructions (Qiagen;Hilden, Germany). RNA purity was determined by photo-metric measurement of the 260 nm/280 nm ratio of thesample using a Bio Photometer (Eppendorf #613125116,Hamburg, Germany). Complementary DNA (cDNA) wasobtained by reverse transcription of up to 1 μg total RNAusing the Reverse Transcriptase Core kit (Eurogentec;Cologne, Germany) with EuroScript reverse transcript-ase (Moloney Murine leukemia virus rev. transcriptase,50 U/μl) and oligo-dT primers. Reverse transcription wasperformed in a total volume of 50 μl at 48°C for 30 min. ina thermocycler (Whatman Biometra; Goettingen, Germany).Gene expression was analyzed by semi-quantitative real-
time PCR using an Applied Biosystems 7500 Fast Real-Time PCR System as described in [34]. The qPCR master-mix plus for SYBR green I (low ROX) kit from Eurogentecwas used. Primers were designed with the primer express2.0 software (Applied Biosciences; Darmstadt, Germany),except primers for type II collagen (Col2A1) [37], andwere obtained from BIOTEZ. Sequences of all primersused are summarized in Additional file 1: Table S3.Glyceraldehyde-3-phosphate dehydrogenase (GAPDH) wasused as reference gene. Quantification cycles (Cq values)were determined for each gene using Sequence DetectionSystem software (Applied Biosystems) [38]. PCR efficiencies(E) were calculated for each primer pair using a calibrationcurve. Relative gene expression was calculated according tothe following equation:
relative mRNA expression ¼ ECq reference geneð Þ
ECq marker geneð Þ :
Analysis of the chondrogenic state of differentiation aftersortingFive x 105 cells were embedded into 500 μl humanserum albumin – hyaluronan (HSA-HA) hydrogel dir-ectly after the MACS separation. HSA-HA preparationand cell embedding in hydrogels are described in [34].The gels were overlaid with either 1.5 ml chondrocyteculture medium (CM) or chondrogenic induction medium(DMEM high glucose, 4.5 g/l (Invitrogen), 100 U/ml peni-cillin, 100 μg/ml streptomycin, 4 mM L-glutamine, 1 mMsodium-pyruvate, 170 μM ascorbic acid 2-phosphate,0.1 μM dexamethasone, 1 × ITS supplement, 0.35 mM L-
Benz et al. Journal of Translational Medicine 2013, 11:27 Page 4 of 23http://www.translational-medicine.com/content/11/1/27
proline (all from Sigma-Aldrich) and 10 ng/ml TGF-β3(Miltenyi Biotech) and cultured for six weeks. Mediumwas changed twice a week for a total culture time of sixweeks. Cell culture supernatants were collected for bio-chemical analysis. Subsequently, the gels were either fro-zen for biochemical analysis, or digested with proteinase K(3 mg/ml; Sigma-Aldrich) for about 15 min. at 37°C torecover the cells for gene expression analysis. The digestwas centrifuged and the cell pellet lysed in 350 μl lysisbuffer (RLT-buffer, Qiagen; Hilden, Germany).
Biochemical analysisTo analyze the extracellular matrix production the glyco-saminoglycan (GAG) content was determined in thedigested hydrogels and in the supernatants. Hydrogelswere digested with 1 mg/ml papain (Sigma-Aldrich) in0.1 M Na-acetate, 0.01 M L-cysteine, 0.05 M Na2-EDTA,and 0.2 M NaCl (pH 6.0) at 60°C overnight and stored at−80°C. Culture supernatants were used without digestion.Supernatants were freeze-dried and stored at −80°C. Formeasurement the supernatants were re-constituted withH20 and thereby concentrated by a factor of 5. The GAGcontent was measured by the dimethylmethyleneblue (DMB)assay, including guanidinium hydrochloride in the proto-col and using chondroitin-4-sulfate (Sigma-Aldrich) as astandard [39]. Proteoglycan content was normalized toDNA content and expressed as μg GAG/ μg DNA. TheDNA content in the hydrogels was determined using thePicoGreen fluorescent dye (Molecular Probes/Invitrogen).Standard curves were generated at the time of each meas-urement using known concentrations of phage lambdaDNA (Eppendorf; Hamburg, Germany). DNA content wasexpressed as μg DNA.
Analysis of replicative capacity - cell growth curvesCells were plated at a starting cell density (6.7 x 10³
cells/cm2), cultivated to reach confluence (80 – 90%),and harvested using trypsin/EDTA. The cell number wasdetermined. The number of population doublings (pds)was calculated using the following equation: log (cellnumber at harvest/seeding cell number)/log2. A cell ali-quot was used for gene expression analysis. Cells wereexpanded for several passages under identical conditionsuntil they underwent at least 8 to 10 pds after MACSseparation. Then the cells were used for differentiationexperiments. Two cultures were additionally expandedin mesenchymal stem cell growth medium (MSCGM,Promocell; Heidelberg, Germany) to test the influence ofthe medium. These cultures are marked in the results bythe suffix “MSCGM” to the culture number.Growth curves were calculated as a function of popu-
lation doublings over the cultivation time. To describechanges in the cellular phenotype dependent from thepopulation doublings, the expression of collagen type I
α2 (COL1a2), collagen type II α21 (COL2a1), SRY (sexdetermining region Y)-box 9 (SOX9), and core-bindingfactor subunit alpha-1 (CBFA1, also known as Runt-related transcription factor 2 (RUNX2)) was analyzeddirectly after MACS, after 4 +/− 1 pds, and after > 8 pds.
In vitro differentiation protocols and related read-outassaysTo analyze the differentiation potential, cells wereinduced to differentiate in the adipogenic, osteogenicand chondrogenic lineage.
Adipogenic inductionFor adipogenic induction a commercially available adi-pogenic differentiation medium was used (Promocell #C-28011) and the differentiation performed accordingto the manufacturer’s instructions. Briefly, 3.15 x 10⁴
cells/cm2 were plated in a tissue culture plate using MSCGrowth Medium. Cells were allowed to reach 80 – 90%confluence, and then the medium was exchanged for MSCadipogenic differentiation medium. Controls were main-tained in MSC growth medium. After induction the cellswere cultured for three weeks, medium was changed twicea week. At the end of the culture period cells culturedin 24-well plates for gene expression analysis were lyseddirectly with 500 μl lysis buffer per well (RLT buffer,Quiagen; Hilden, Germany). Cells cultured in 96-wellplates were used for Oilred O staining and were pro-cessed as described below.
Gene expressionThe induction of adipogenic specific genes, Peroxisomeproliferator-activated receptor gamma (PPARγ2) andadiponectin, was analyzed by semi-quantitative real-timePCR in cell cultures after adipogenic induction and com-pared to controls.
Oil red O stainingTo localize lipid droplets, cell layers were fixed in 4%paraformaldehyde, incubated in 60% n-propanol, andthen stained in Oil Red O solution for 10 minutes. Cellswere washed and cell nuclei counterstained with Mayershaemalaun solution for 3–5 minutes. Cell layers wererinsed with tap water to develop the blue nuclei stainingand then microscopically observed.
Osteogenic inductionFor osteogenic induction a commercially available osteo-genic differentiation medium was used (Promocell # C-28013) and the differentiation performed according tothe manufacturer’s instructions and as described under“adipogenic induction” with the exception that cells wereallowed to reach > 100% confluence before the mediumwas exchanged for osteogenic differentiation medium.

Benz et al. Journal of Translational Medicine 2013, 11:27 Page 5 of 23http://www.translational-medicine.com/content/11/1/27
Cells cultured in 96-well plates were used for the deter-mination of alkaline phosphatase (ALP) activity and Ali-zarin Red staining and were processed as describedbelow.
Gene expressionThe induction of osteogenic specific genes, CBFA1 andALP, was analyzed as described above.
Quantitative assay of ALP activityALP activity was determined using p-nitrophenyl phos-phate as substrate. Cell cultures (triplicates in 96-wellplates) were washed and incubated with 100 μl 0.01%Triton X-100 for 30 min. at 4°C. 50 μl of the lysate wastransferred into another 96-well plate and mixed with50 μl of 0.01% Triton X-100. Then 200 μl p-nitrophenylphosphate were added per well and the plate was incu-bated for ≥ 30 min. at RT. The absorbance at 405 nmwas measured using a Pherastar plate reader (BMG Labtech,Offenburg, Germany). Serial dilutions of p-nitrophenol wereused for the standard curve. The ALP activity was expressedas substrate conversion per time [pmol/min.] and was nor-malized to the DNA content [μg] of the corresponding well.
Alizarin red stainingTo identify mineral deposits by Alizarin Red S, the cellmonolayers were washed and fixed with ice-cold 50%methanol, 50% acetone and were then air dried. Afterwashing the cells were stained with 40 mM Alizarin RedS (pH 4.0) for 20 minutes. After extensive washing thecell layer was dehydrated with ice-cold 100% ethanoland air-dried before microscopically examination.
Chondrogenic inductionChondrogenic differentiation potential of the cells wasanalyzed in HSA-HA hydrogels. HSA-HA preparationand cell embedding into hydrogels are described in [34].Five x 105 cells were embedded into 500 μl hydrogel.After a few minutes of polymerization the gels were cul-tured in 1.5 ml chondrogenic induction medium (seeabove). Controls were cultured in the same mediumwithout TGF-β3. Hydrogels were cultured for fourweeks; medium was changed twice a week. Cell culturesupernatants were collected for biochemical analysis.After four weeks the gels were frozen for biochemicalanalysis and digested with proteinase K to recover thecells for gene expression analysis respectively.
Gene expressionThe induction of chondrogenic specific genes SOX9, COL2a1,and aggrecan (ACAN) was analyzed as described above.
StatisticsGene expression data were used as logarithmic values toobtain data which follow Gaussian distribution.Statistical analysis was not necessary for differentiation
of chondrocytes (Figure 1), cell surface antigen expression(Figure 2), and cell growth and morpholgy (Figure 3). Forresults presented in Figure 4: One Way Analysis of Vari-ance (ANOVA) was performed if data passed normalitytest (Tukey-Kramer Multiple Comparisons Tests). If datadid not pass the normality test nonparametric ANOVAwas performed (Kruskal-Wallis Test). For results pre-sented in Figures 5, 6, 7 and 8: Two hypotheses weretested in the differentiation assays: 1) “There is a signifi-cant difference between control and induction condi-tions”. To confirm the first hypothesis an unpaired t-testcomparing all control samples with all induced sampleswas performed. When data did not pass the normalitytest, a Mann–Whitney test was used. 2) “There are differ-ences between the subpopulations/subgroups under thesame experimental conditions”. To confirm the secondhypothesis two ANOVAs were performed comparing un-sorted, W5C5+ and W5C5- populations either under con-trol or under induction conditions.Due to the small number of W8B2 +/− samples, they
were excluded from statistical analysis. In “Results”, theuse of the term “significant” relates to a p < 0.05 level ofsignificance.
ResultsFeasibility of MACS sorting of freshly isolated or pre-cultured primary chondrocytes and disc cellsTo prove the feasibility of the MACS technique of chon-drocytes and disc cells, directly from tissue digests or afterexpansion in primary culture, an experimental set-up wasinstalled as described below (Additional file 2: Figure S1).Cartilage or disc tissue was enzymatically digested and theisolated cells either used directly for MACS sorting orseeded into a primary culture. The primary cells wereexpanded until they reached 80 – 90% confluency andwere then analyzed by MACS. The obtained sub-populations were tested in a three-dimensional hydrogelwhich is already being used clinically (www.clinical-trials.gov; identifier:NCT01640457).
MACS with freshly isolated chondrocytesIn the first set of experiments, the magnetic separationof freshly-isolated chondrocytes after overnight enzym-atic digestion was examined. As the MACS technologyis available for clinical use, it is important to clarifywhether the cell sorting process could be embedded intoa clinical set-up, i.e. as a one-step operating procedure.All attempts to separate freshly-isolated cells by MACShave not been successful: the separation columns cloggedafter the cell suspension was applied to the separation

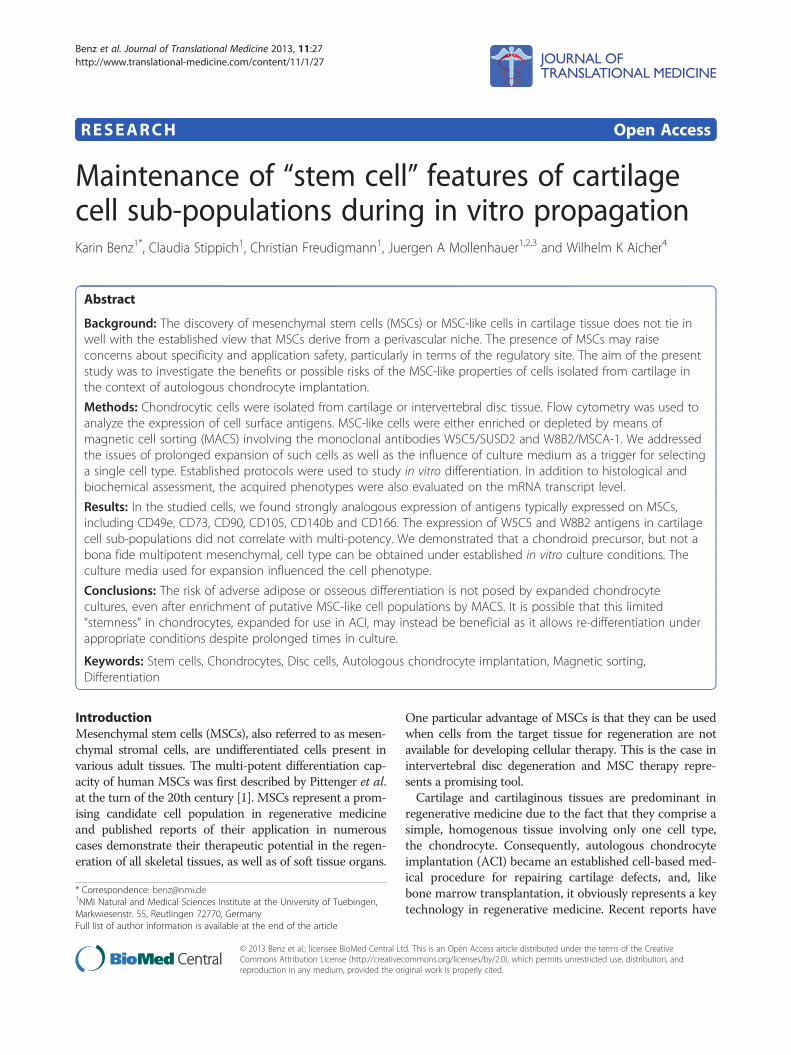
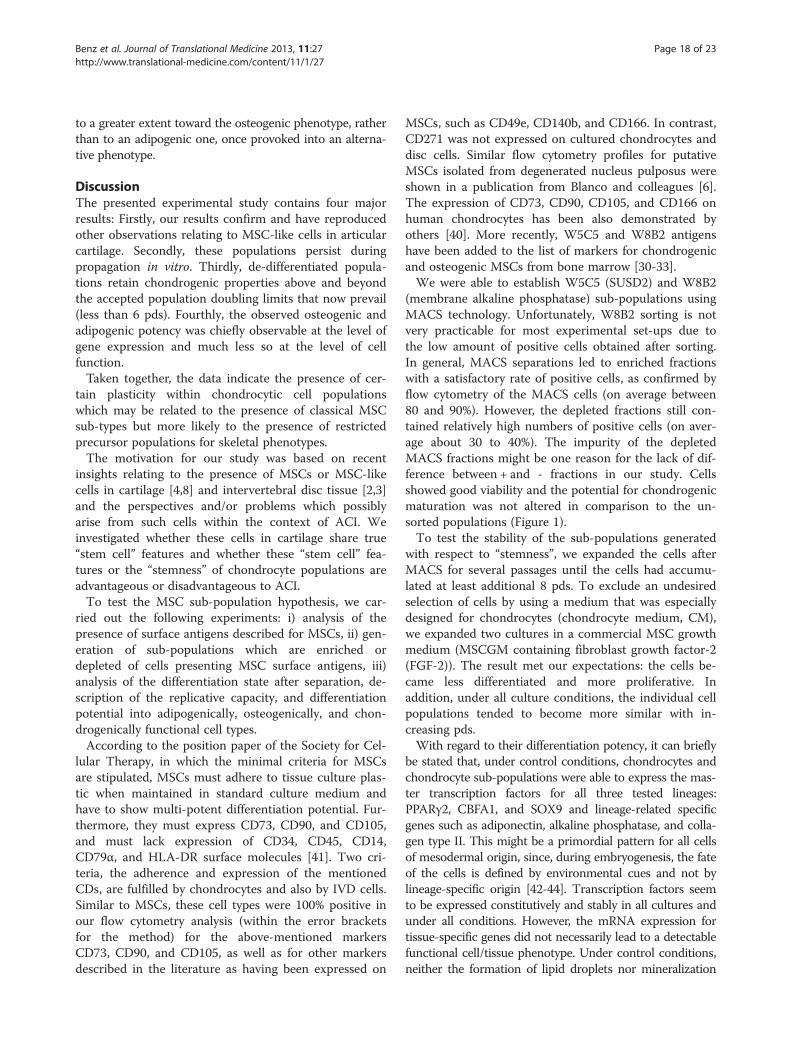
Figure 1 Differentiation of chondrocytes and sorted sub-populations. Expression of mRNA in primary expanded human chondroyctes afterMACS separation (P0), and subsequent passage in monolayer (P1 ML) or in hydrogel culture (P1 Gel). The P1 ML cells were cultured inchondrocyte medium (CM) until they had reached approx. 80% confluence (about 1 week), hydrogels were maintained in CM for 6 weeks. Theexpression of collagen type I (COL1), type II (COL2), and aggrecan (ACAN) was analyzed and the ratio of COL2/COL1 was calculated as a measureto describe the chondrogenic phenotype of the cells as indicated. Box plots represent 25% / 75% percentiles, mean values (dotted lines) andmedian values (hairlines). Lower right: the cumulated glycosaminoglycan production from cells in hydrogel culture was determined. GAG contentwas measured in the hydrogel and in the combined medium supernatant of the six-week cultures and normalized to the corresponding DNAcontent in the hydrogel. Mean values and standard deviation are shown (n = 3 cultures).
Benz et al. Journal of Translational Medicine 2013, 11:27 Page 6 of 23http://www.translational-medicine.com/content/11/1/27
columns, and it was not possible to carry out the essentialwashing steps. Instead, the cells had to be pushed out bymeans of a plunger and then layered on to a new column.Following this, it was occasionally possible to proceed suc-cessfully and to carry out the separation. The recovery ratewas only about 40% and the percentage of positive cells wasbelow 10% of all cells. In the majority of cases, however,successful separation could not be achieved. Therefore, themagnetic separation of freshly-isolated chondrocytes wasnot considered to be a reliable and efficient method.
MACS with primary expanded chondrocytes / disc cellsConsequently, the magnetic separation was carried outusing cells from primary expanded cultures. The results
of the recovery, efficiency and quality of the separationare summarized in Table 1.With primary chondrocytes and primary disc cells
MACS sorting using W5C5 and W8B2 microbeads wasfeasible and led to satisfying results. On average, approx.60% of the cells initially used could be recovered. Thepercentage of W5C5 positive cells was 20.2% ± 8.0 forchondrocytes and 13.3% ± 3.9 for disc cells. After W8B2sorting, only 5.8% ± 1.7 positive chondrocytes wereobtained: in other words, on average, only 0.8 x 10⁶ cellswere in the bound fraction (positive fraction) of a typicalcell preparation. However sufficient cell numbers werenot obtained and therefore re-differentiation of W8B2cells in hydrogels was not pursued. Only W5C5-
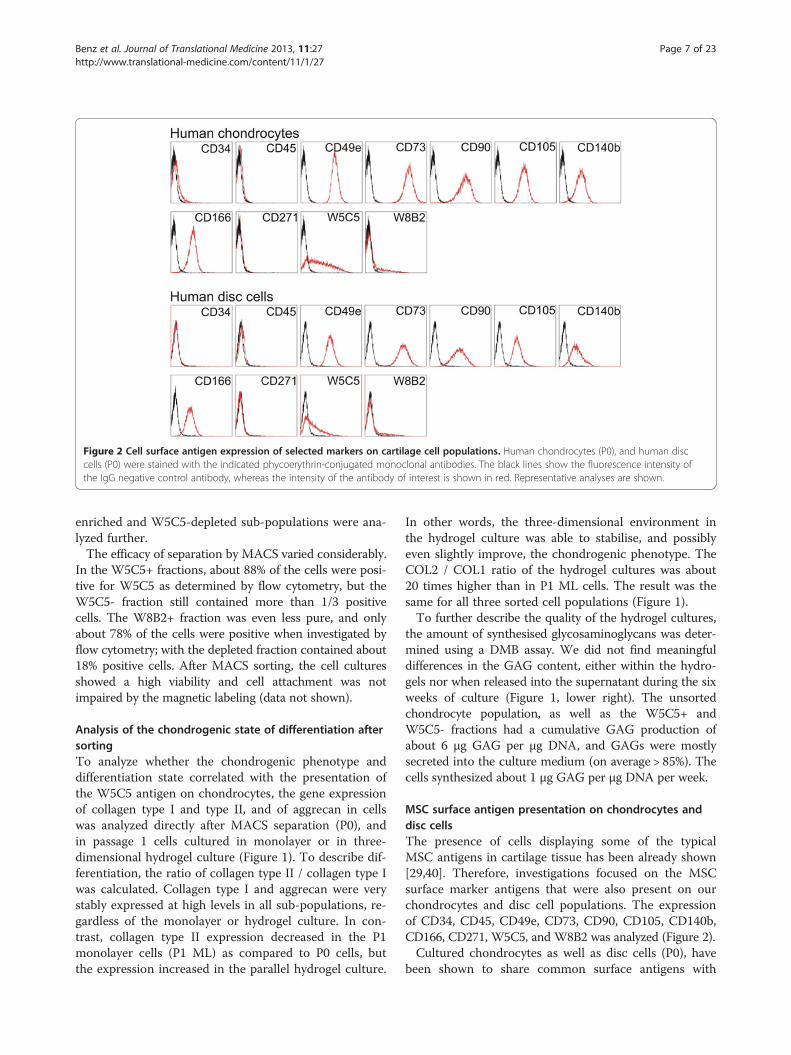
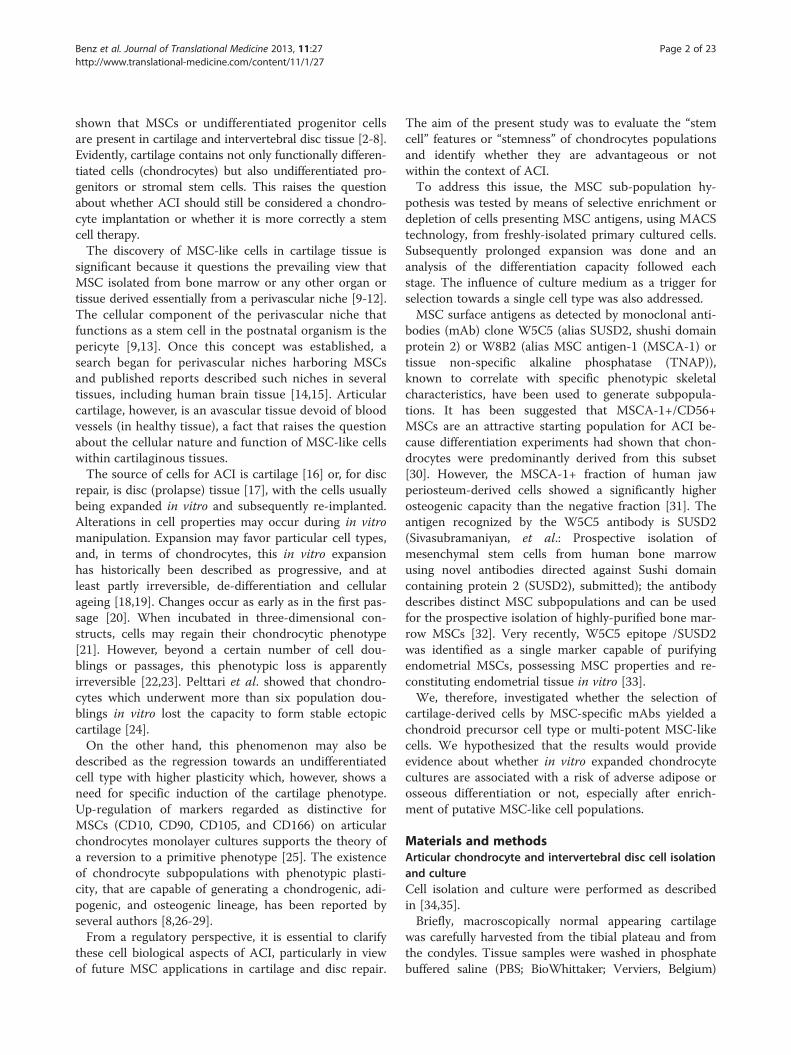
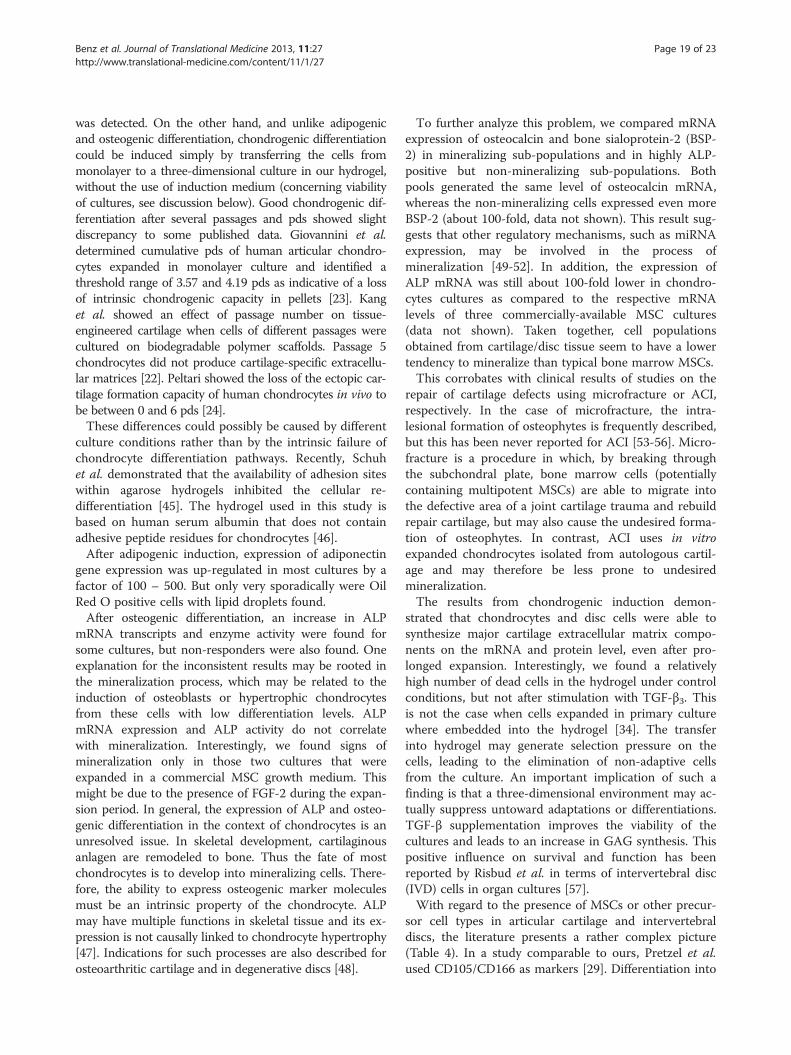
Figure 2 Cell surface antigen expression of selected markers on cartilage cell populations. Human chondrocytes (P0), and human disccells (P0) were stained with the indicated phycoerythrin-conjugated monoclonal antibodies. The black lines show the fluorescence intensity ofthe IgG negative control antibody, whereas the intensity of the antibody of interest is shown in red. Representative analyses are shown.
Benz et al. Journal of Translational Medicine 2013, 11:27 Page 7 of 23http://www.translational-medicine.com/content/11/1/27
enriched and W5C5-depleted sub-populations were ana-lyzed further.The efficacy of separation by MACS varied considerably.
In the W5C5+ fractions, about 88% of the cells were posi-tive for W5C5 as determined by flow cytometry, but theW5C5- fraction still contained more than 1/3 positivecells. The W8B2+ fraction was even less pure, and onlyabout 78% of the cells were positive when investigated byflow cytometry; with the depleted fraction contained about18% positive cells. After MACS sorting, the cell culturesshowed a high viability and cell attachment was notimpaired by the magnetic labeling (data not shown).
Analysis of the chondrogenic state of differentiation aftersortingTo analyze whether the chondrogenic phenotype anddifferentiation state correlated with the presentation ofthe W5C5 antigen on chondrocytes, the gene expressionof collagen type I and type II, and of aggrecan in cellswas analyzed directly after MACS separation (P0), andin passage 1 cells cultured in monolayer or in three-dimensional hydrogel culture (Figure 1). To describe dif-ferentiation, the ratio of collagen type II / collagen type Iwas calculated. Collagen type I and aggrecan were verystably expressed at high levels in all sub-populations, re-gardless of the monolayer or hydrogel culture. In con-trast, collagen type II expression decreased in the P1monolayer cells (P1 ML) as compared to P0 cells, butthe expression increased in the parallel hydrogel culture.
In other words, the three-dimensional environment inthe hydrogel culture was able to stabilise, and possiblyeven slightly improve, the chondrogenic phenotype. TheCOL2 / COL1 ratio of the hydrogel cultures was about20 times higher than in P1 ML cells. The result was thesame for all three sorted cell populations (Figure 1).To further describe the quality of the hydrogel cultures,
the amount of synthesised glycosaminoglycans was deter-mined using a DMB assay. We did not find meaningfuldifferences in the GAG content, either within the hydro-gels nor when released into the supernatant during the sixweeks of culture (Figure 1, lower right). The unsortedchondrocyte population, as well as the W5C5+ andW5C5- fractions had a cumulative GAG production ofabout 6 μg GAG per μg DNA, and GAGs were mostlysecreted into the culture medium (on average > 85%). Thecells synthesized about 1 μg GAG per μg DNA per week.
MSC surface antigen presentation on chondrocytes anddisc cellsThe presence of cells displaying some of the typicalMSC antigens in cartilage tissue has been already shown[29,40]. Therefore, investigations focused on the MSCsurface marker antigens that were also present on ourchondrocytes and disc cell populations. The expressionof CD34, CD45, CD49e, CD73, CD90, CD105, CD140b,CD166, CD271, W5C5, and W8B2 was analyzed (Figure 2).Cultured chondrocytes as well as disc cells (P0), have
been shown to share common surface antigens with
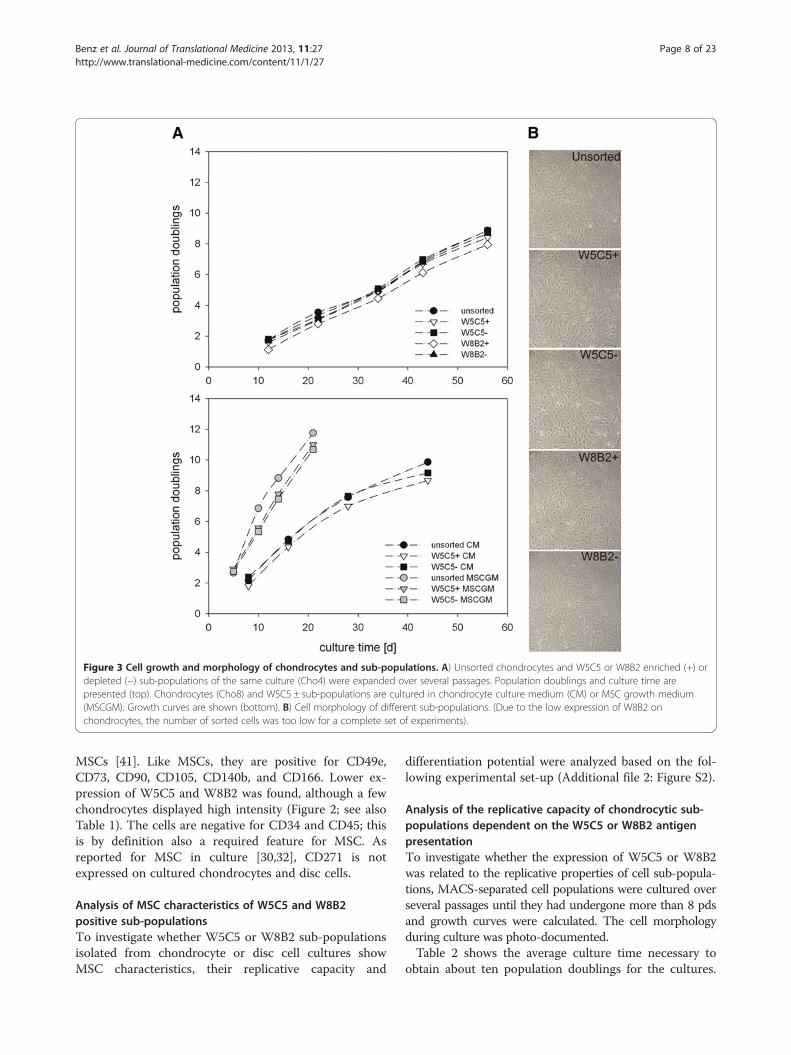
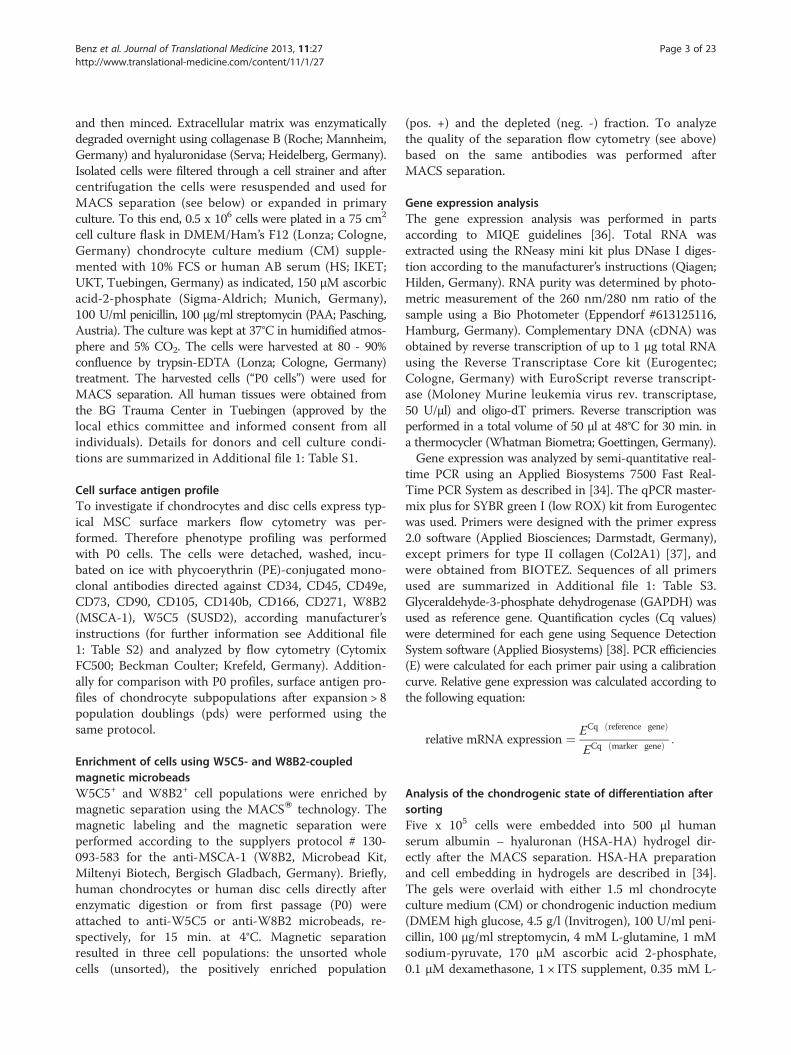
Figure 3 Cell growth and morphology of chondrocytes and sub-populations. A) Unsorted chondrocytes and W5C5 or W8B2 enriched (+) ordepleted (−) sub-populations of the same culture (Cho4) were expanded over several passages. Population doublings and culture time arepresented (top). Chondrocytes (Cho8) and W5C5 ± sub-populations are cultured in chondrocyte culture medium (CM) or MSC growth medium(MSCGM). Growth curves are shown (bottom). B) Cell morphology of different sub-populations. (Due to the low expression of W8B2 onchondrocytes, the number of sorted cells was too low for a complete set of experiments).
Benz et al. Journal of Translational Medicine 2013, 11:27 Page 8 of 23http://www.translational-medicine.com/content/11/1/27
MSCs [41]. Like MSCs, they are positive for CD49e,CD73, CD90, CD105, CD140b, and CD166. Lower ex-pression of W5C5 and W8B2 was found, although a fewchondrocytes displayed high intensity (Figure 2; see alsoTable 1). The cells are negative for CD34 and CD45; thisis by definition also a required feature for MSC. Asreported for MSC in culture [30,32], CD271 is notexpressed on cultured chondrocytes and disc cells.
Analysis of MSC characteristics of W5C5 and W8B2positive sub-populationsTo investigate whether W5C5 or W8B2 sub-populationsisolated from chondrocyte or disc cell cultures showMSC characteristics, their replicative capacity and
differentiation potential were analyzed based on the fol-lowing experimental set-up (Additional file 2: Figure S2).
Analysis of the replicative capacity of chondrocytic sub-populations dependent on the W5C5 or W8B2 antigenpresentationTo investigate whether the expression of W5C5 or W8B2was related to the replicative properties of cell sub-popula-tions, MACS-separated cell populations were cultured overseveral passages until they had undergone more than 8 pdsand growth curves were calculated. The cell morphologyduring culture was photo-documented.Table 2 shows the average culture time necessary to
obtain about ten population doublings for the cultures.
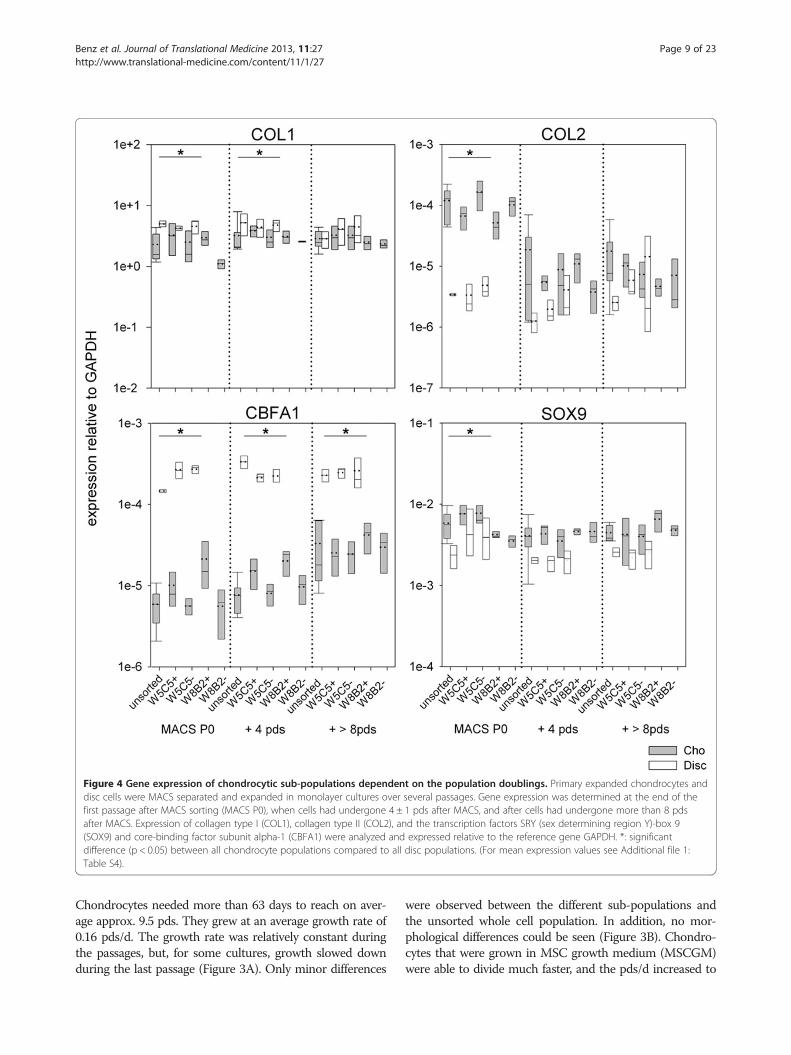
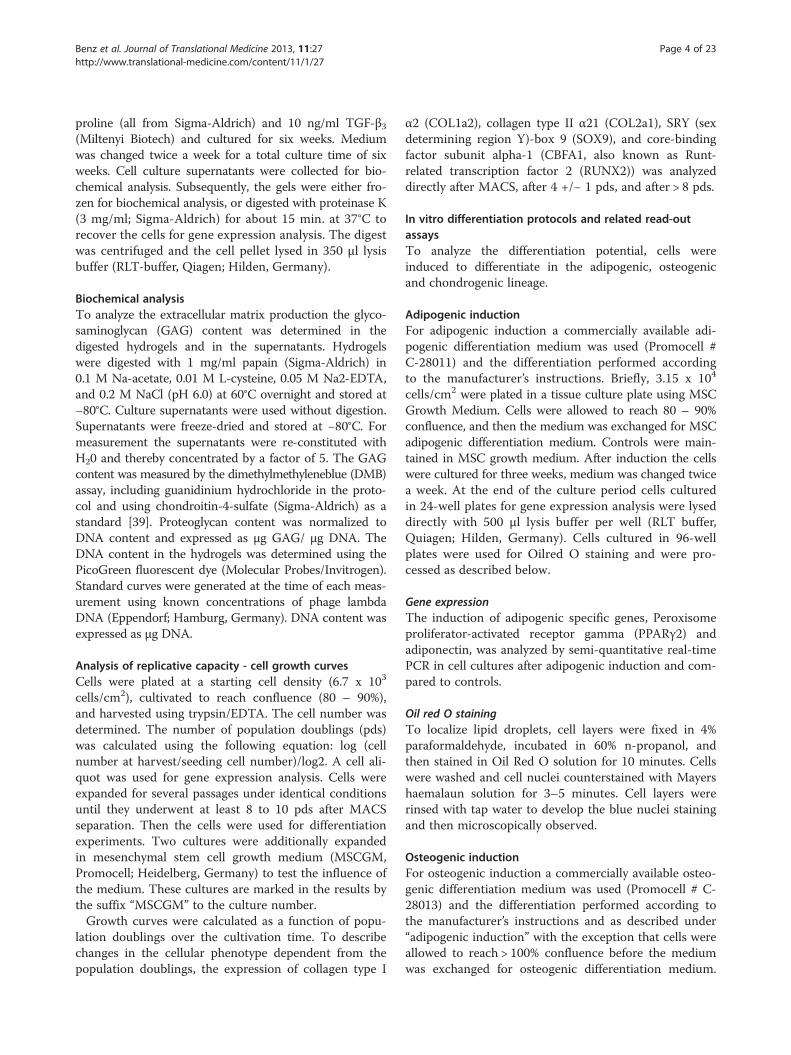
Figure 4 Gene expression of chondrocytic sub-populations dependent on the population doublings. Primary expanded chondrocytes anddisc cells were MACS separated and expanded in monolayer cultures over several passages. Gene expression was determined at the end of thefirst passage after MACS sorting (MACS P0), when cells had undergone 4 ± 1 pds after MACS, and after cells had undergone more than 8 pdsafter MACS. Expression of collagen type I (COL1), collagen type II (COL2), and the transcription factors SRY (sex determining region Y)-box 9(SOX9) and core-binding factor subunit alpha-1 (CBFA1) were analyzed and expressed relative to the reference gene GAPDH. *: significantdifference (p < 0.05) between all chondrocyte populations compared to all disc populations. (For mean expression values see Additional file 1:Table S4).
Benz et al. Journal of Translational Medicine 2013, 11:27 Page 9 of 23http://www.translational-medicine.com/content/11/1/27
Chondrocytes needed more than 63 days to reach on aver-age approx. 9.5 pds. They grew at an average growth rate of0.16 pds/d. The growth rate was relatively constant duringthe passages, but, for some cultures, growth slowed downduring the last passage (Figure 3A). Only minor differences
were observed between the different sub-populations andthe unsorted whole cell population. In addition, no mor-phological differences could be seen (Figure 3B). Chondro-cytes that were grown in MSC growth medium (MSCGM)were able to divide much faster, and the pds/d increased to
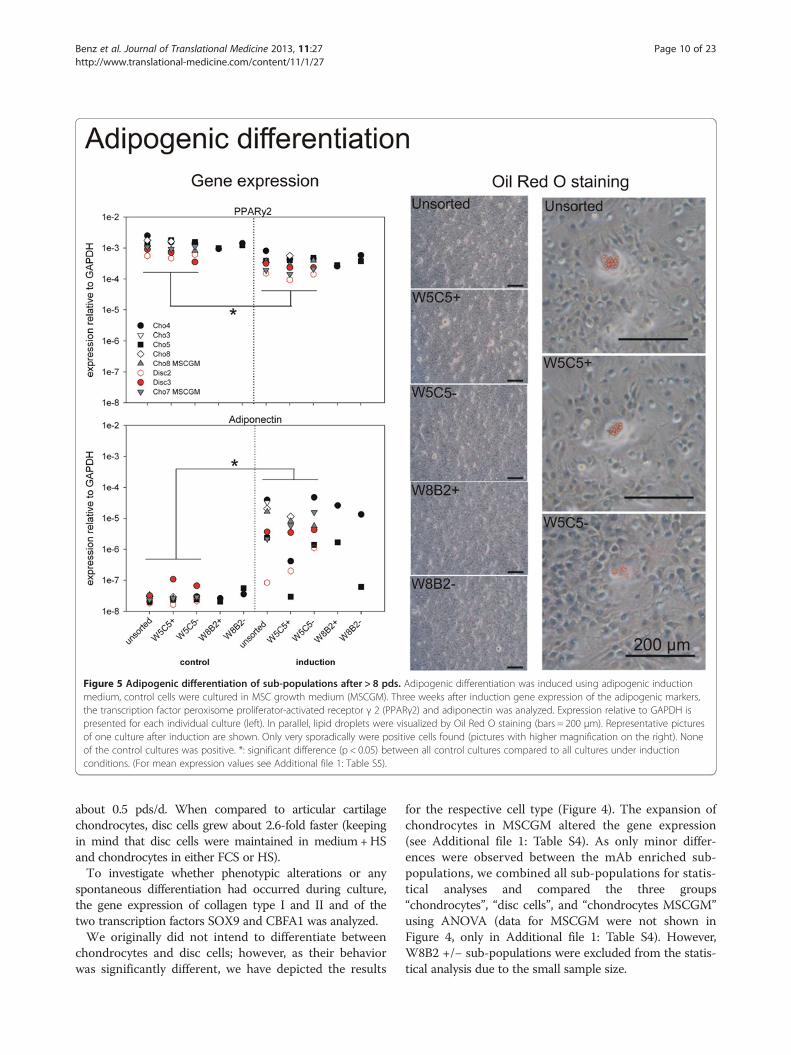
Figure 5 Adipogenic differentiation of sub-populations after > 8 pds. Adipogenic differentiation was induced using adipogenic inductionmedium, control cells were cultured in MSC growth medium (MSCGM). Three weeks after induction gene expression of the adipogenic markers,the transcription factor peroxisome proliferator-activated receptor γ 2 (PPARγ2) and adiponectin was analyzed. Expression relative to GAPDH ispresented for each individual culture (left). In parallel, lipid droplets were visualized by Oil Red O staining (bars = 200 μm). Representative picturesof one culture after induction are shown. Only very sporadically were positive cells found (pictures with higher magnification on the right). Noneof the control cultures was positive. *: significant difference (p < 0.05) between all control cultures compared to all cultures under inductionconditions. (For mean expression values see Additional file 1: Table S5).
Benz et al. Journal of Translational Medicine 2013, 11:27 Page 10 of 23http://www.translational-medicine.com/content/11/1/27
about 0.5 pds/d. When compared to articular cartilagechondrocytes, disc cells grew about 2.6-fold faster (keepingin mind that disc cells were maintained in medium+HSand chondrocytes in either FCS or HS).To investigate whether phenotypic alterations or any
spontaneous differentiation had occurred during culture,the gene expression of collagen type I and II and of thetwo transcription factors SOX9 and CBFA1 was analyzed.We originally did not intend to differentiate between
chondrocytes and disc cells; however, as their behaviorwas significantly different, we have depicted the results
for the respective cell type (Figure 4). The expansion ofchondrocytes in MSCGM altered the gene expression(see Additional file 1: Table S4). As only minor differ-ences were observed between the mAb enriched sub-populations, we combined all sub-populations for statis-tical analyses and compared the three groups“chondrocytes”, “disc cells”, and “chondrocytes MSCGM”using ANOVA (data for MSCGM were not shown inFigure 4, only in Additional file 1: Table S4). However,W8B2 +/− sub-populations were excluded from the statis-tical analysis due to the small sample size.

Figure 6 Osteogenic differentiation of sub-populations after > 8 pds. Osteogenic differentiation was induced using osteogenic inductionmedium, control cells were cultured in MSC growth medium (MSCGM). Three weeks after induction gene expression of the osteogenic markers,the transcription factor core-binding factor subunit alpha-1 (CBFA1) and alkaline phosphatase (ALP) were analyzed. Expression relative to GAPDHis presented for each individual culture (top). ALP activity was determined in the cell lysates at the end of the culture and was normalized to thecorresponding DNA content in the well. In parallel, mineralization was visualized by Alizarin Red staining (bar = 200 μm). Representative picturesof four induced cultures are shown. None of the control cultures was positive. *: significant difference (p < 0.05) between all control culturescompared to all cultures under induction conditions. (For mean expression values see Additional file 1: Table S6).
Benz et al. Journal of Translational Medicine 2013, 11:27 Page 11 of 23http://www.translational-medicine.com/content/11/1/27
On first view, a very uniform expression of collagentype I and SOX9 in chondrocytes and disc cells wasobserved (Figure 4). These genes were expressed at com-parable levels, regardless of the population doublings thecells had undergone. Collagen type I expression variedonly in the range of one decade, SOX9 actually only by a
factor of 4. COL1 expression was slightly but sig-nificantly (p < 0.05) higher in disc cells compared tochondrocytes in P0 after MACS and, in cells culturedfor additional 4 pds. SOX9 expression was significantlylower in PO discs cells after MACS. Collagen type IIexpression also differed significantly in PO cells.

Figure 7 Chondrogenic differentiation of sub-populations after > 8 pds. Chondrogenic differentiation was performed in hydrogels andinduced with TGFβ3, control cells were cultured in hydrogels in the same medium without TGFβ3. Four weeks after induction gene expression ofthe chondrogenic markers, the transcription factor SRY (sex determining region Y)-box 9 (SOX9), collagen type II (COL2) was analyzed andcompared to the expression of the cells before being embedded into the hydrogels (ML > 8pds). Expression relative to GAPDH is shown for eachindividual culture (top). Quantification cycles (Cq) for GAPDH expression are shown in the box plot. GAG synthesis (GAG content of the hydrogel+ content in the cumulated culture supernatants) is presented as normalized to the DNA content (lower right). Boxes represent 25% / 75%percentiles, whisker 5% / 95% percentiles, mean (dotted line) and median (solid line) values. *: significant difference (p < 0.05) between all ML > 8pds cultures compared to all gel control cultures and compared to gel cultures under induction conditions. (For mean expression values seeAdditional file 1: Tables S7 and S8).
Benz et al. Journal of Translational Medicine 2013, 11:27 Page 12 of 23http://www.translational-medicine.com/content/11/1/27
Expression was 30-fold higher in chondrocytes com-pared to disc cells. In chondrocytes, the collagen type IIexpression decreased with increasing pds, but remainedmore or less constant in disc cells. These results demon-strate once again that the progressive de-differentiationprocess of chondrocytes results in a lower ratio of colla-gen type II to collagen type I. It also shows that, with in-creasing pds, the cells became increasingly homogenous.
In contrast, disc cells remained phenotypically morestable.CBFA1 expression in disc cell was significantly higher
than in chondrocytes, regardless of the stage of the expan-sion process. Disc cells showed an almost constant meanexpression ranging from 2.39 to 2.49 x 10⁻⁴ relative toGAPDH independent from the expansion state. In chon-drocytes the CBFA1 expression increased slightly, from a
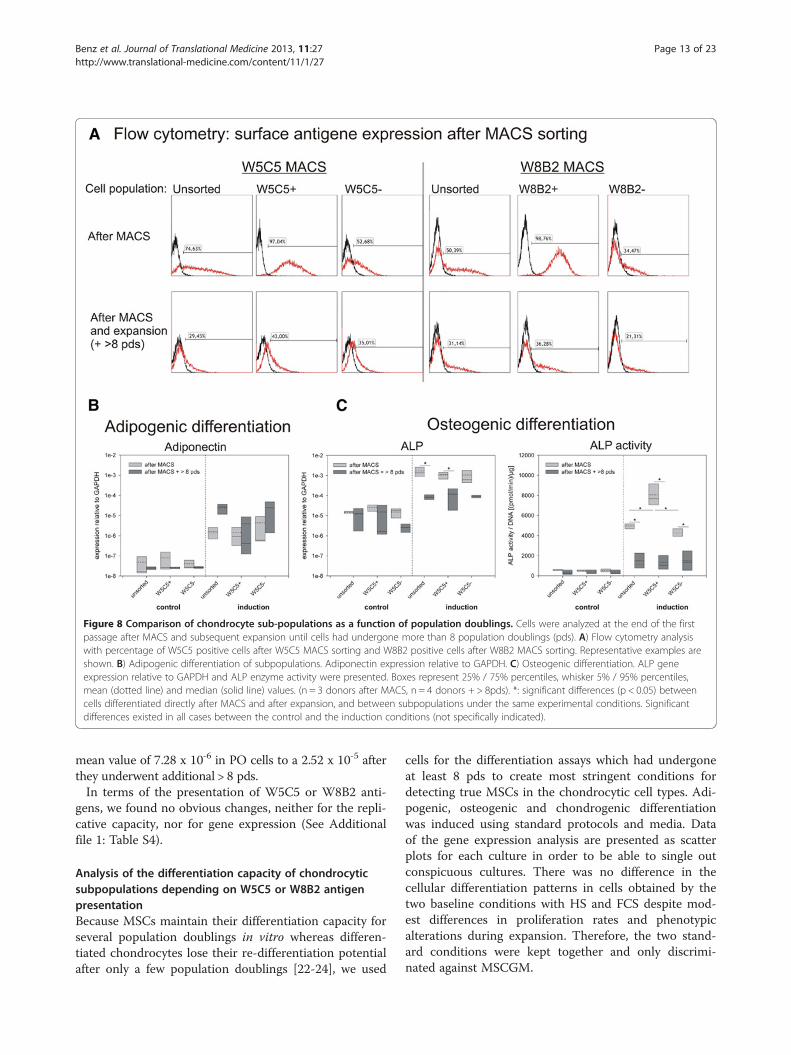
Figure 8 Comparison of chondrocyte sub-populations as a function of population doublings. Cells were analyzed at the end of the firstpassage after MACS and subsequent expansion until cells had undergone more than 8 population doublings (pds). A) Flow cytometry analysiswith percentage of W5C5 positive cells after W5C5 MACS sorting and W8B2 positive cells after W8B2 MACS sorting. Representative examples areshown. B) Adipogenic differentiation of subpopulations. Adiponectin expression relative to GAPDH. C) Osteogenic differentiation. ALP geneexpression relative to GAPDH and ALP enzyme activity were presented. Boxes represent 25% / 75% percentiles, whisker 5% / 95% percentiles,mean (dotted line) and median (solid line) values. (n = 3 donors after MACS, n = 4 donors + > 8pds). *: significant differences (p < 0.05) betweencells differentiated directly after MACS and after expansion, and between subpopulations under the same experimental conditions. Significantdifferences existed in all cases between the control and the induction conditions (not specifically indicated).
Benz et al. Journal of Translational Medicine 2013, 11:27 Page 13 of 23http://www.translational-medicine.com/content/11/1/27
mean value of 7.28 x 10⁻⁶ in PO cells to a 2.52 x 10⁻⁵ afterthey underwent additional > 8 pds.In terms of the presentation of W5C5 or W8B2 anti-
gens, we found no obvious changes, neither for the repli-cative capacity, nor for gene expression (See Additionalfile 1: Table S4).
Analysis of the differentiation capacity of chondrocyticsubpopulations depending on W5C5 or W8B2 antigenpresentationBecause MSCs maintain their differentiation capacity forseveral population doublings in vitro whereas differen-tiated chondrocytes lose their re-differentiation potentialafter only a few population doublings [22-24], we used
cells for the differentiation assays which had undergoneat least 8 pds to create most stringent conditions fordetecting true MSCs in the chondrocytic cell types. Adi-pogenic, osteogenic and chondrogenic differentiationwas induced using standard protocols and media. Dataof the gene expression analysis are presented as scatterplots for each culture in order to be able to single outconspicuous cultures. There was no difference in thecellular differentiation patterns in cells obtained by thetwo baseline conditions with HS and FCS despite mod-est differences in proliferation rates and phenotypicalterations during expansion. Therefore, the two stand-ard conditions were kept together and only discrimi-nated against MSCGM.
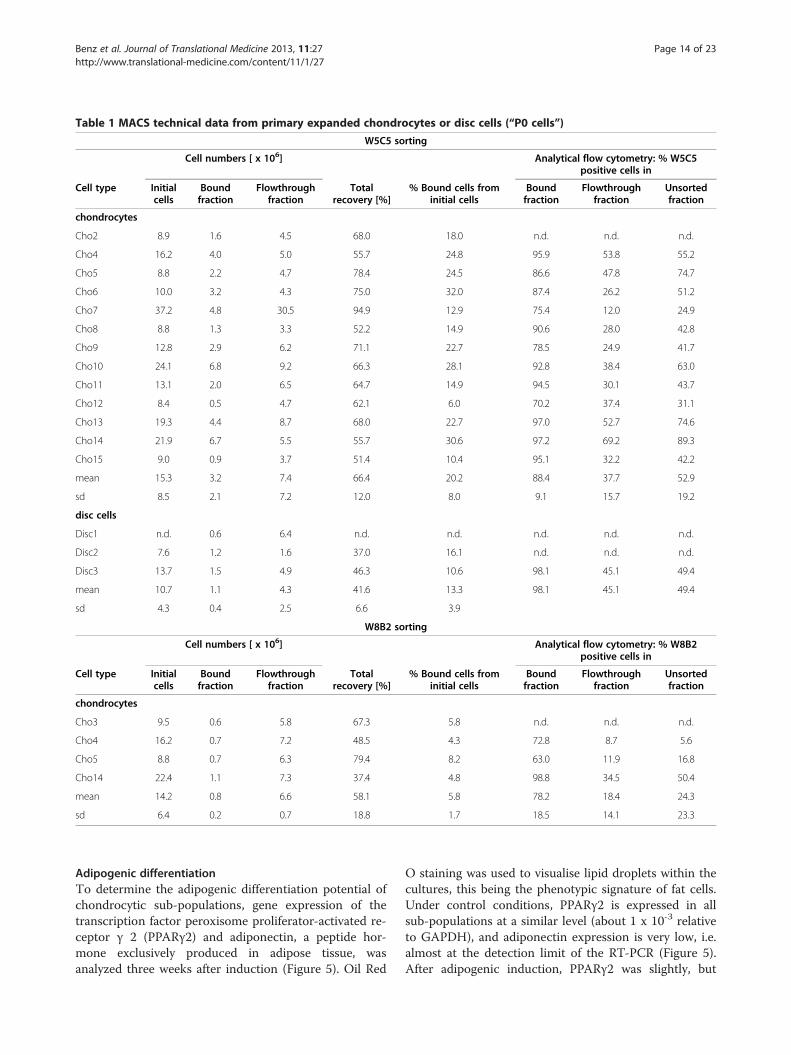
Table 1 MACS technical data from primary expanded chondrocytes or disc cells (“P0 cells”)
W5C5 sorting
Cell numbers [ x 106] Analytical flow cytometry: % W5C5positive cells in
Cell type Initialcells
Boundfraction
Flowthroughfraction
Totalrecovery [%]
% Bound cells frominitial cells
Boundfraction
Flowthroughfraction
Unsortedfraction
chondrocytes
Cho2 8.9 1.6 4.5 68.0 18.0 n.d. n.d. n.d.
Cho4 16.2 4.0 5.0 55.7 24.8 95.9 53.8 55.2
Cho5 8.8 2.2 4.7 78.4 24.5 86.6 47.8 74.7
Cho6 10.0 3.2 4.3 75.0 32.0 87.4 26.2 51.2
Cho7 37.2 4.8 30.5 94.9 12.9 75.4 12.0 24.9
Cho8 8.8 1.3 3.3 52.2 14.9 90.6 28.0 42.8
Cho9 12.8 2.9 6.2 71.1 22.7 78.5 24.9 41.7
Cho10 24.1 6.8 9.2 66.3 28.1 92.8 38.4 63.0
Cho11 13.1 2.0 6.5 64.7 14.9 94.5 30.1 43.7
Cho12 8.4 0.5 4.7 62.1 6.0 70.2 37.4 31.1
Cho13 19.3 4.4 8.7 68.0 22.7 97.0 52.7 74.6
Cho14 21.9 6.7 5.5 55.7 30.6 97.2 69.2 89.3
Cho15 9.0 0.9 3.7 51.4 10.4 95.1 32.2 42.2
mean 15.3 3.2 7.4 66.4 20.2 88.4 37.7 52.9
sd 8.5 2.1 7.2 12.0 8.0 9.1 15.7 19.2
disc cells
Disc1 n.d. 0.6 6.4 n.d. n.d. n.d. n.d. n.d.
Disc2 7.6 1.2 1.6 37.0 16.1 n.d. n.d. n.d.
Disc3 13.7 1.5 4.9 46.3 10.6 98.1 45.1 49.4
mean 10.7 1.1 4.3 41.6 13.3 98.1 45.1 49.4
sd 4.3 0.4 2.5 6.6 3.9
W8B2 sorting
Cell numbers [ x 106] Analytical flow cytometry: % W8B2positive cells in
Cell type Initialcells
Boundfraction
Flowthroughfraction
Totalrecovery [%]
% Bound cells frominitial cells
Boundfraction
Flowthroughfraction
Unsortedfraction
chondrocytes
Cho3 9.5 0.6 5.8 67.3 5.8 n.d. n.d. n.d.
Cho4 16.2 0.7 7.2 48.5 4.3 72.8 8.7 5.6
Cho5 8.8 0.7 6.3 79.4 8.2 63.0 11.9 16.8
Cho14 22.4 1.1 7.3 37.4 4.8 98.8 34.5 50.4
mean 14.2 0.8 6.6 58.1 5.8 78.2 18.4 24.3
sd 6.4 0.2 0.7 18.8 1.7 18.5 14.1 23.3
Benz et al. Journal of Translational Medicine 2013, 11:27 Page 14 of 23http://www.translational-medicine.com/content/11/1/27
Adipogenic differentiationTo determine the adipogenic differentiation potential ofchondrocytic sub-populations, gene expression of thetranscription factor peroxisome proliferator-activated re-ceptor γ 2 (PPARγ2) and adiponectin, a peptide hor-mone exclusively produced in adipose tissue, wasanalyzed three weeks after induction (Figure 5). Oil Red
O staining was used to visualise lipid droplets within thecultures, this being the phenotypic signature of fat cells.Under control conditions, PPARγ2 is expressed in allsub-populations at a similar level (about 1 x 10⁻³ relativeto GAPDH), and adiponectin expression is very low, i.e.almost at the detection limit of the RT-PCR (Figure 5).After adipogenic induction, PPARγ2 was slightly, but
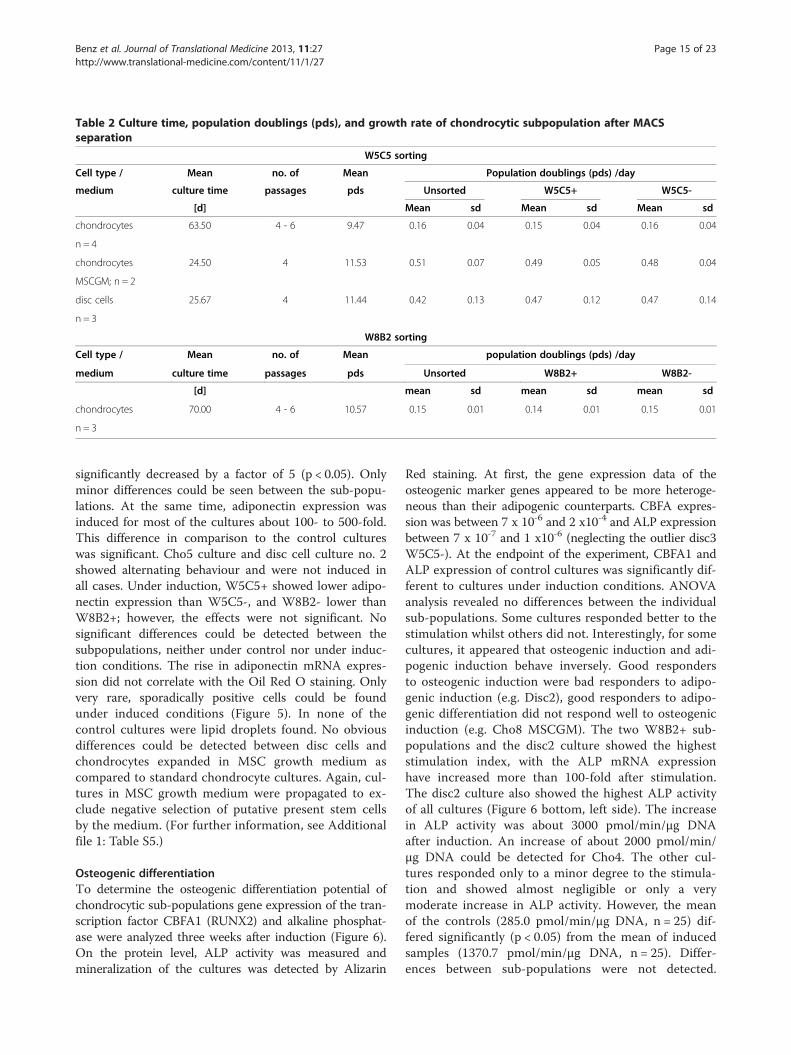
Table 2 Culture time, population doublings (pds), and growth rate of chondrocytic subpopulation after MACSseparation
W5C5 sorting
Cell type / Mean no. of Mean Population doublings (pds) /day
medium culture time passages pds Unsorted W5C5+ W5C5-
[d] Mean sd Mean sd Mean sd
chondrocytes 63.50 4 - 6 9.47 0.16 0.04 0.15 0.04 0.16 0.04
n = 4
chondrocytes 24.50 4 11.53 0.51 0.07 0.49 0.05 0.48 0.04
MSCGM; n = 2
disc cells 25.67 4 11.44 0.42 0.13 0.47 0.12 0.47 0.14
n = 3
W8B2 sorting
Cell type / Mean no. of Mean population doublings (pds) /day
medium culture time passages pds Unsorted W8B2+ W8B2-
[d] mean sd mean sd mean sd
chondrocytes 70.00 4 - 6 10.57 0.15 0.01 0.14 0.01 0.15 0.01
n = 3
Benz et al. Journal of Translational Medicine 2013, 11:27 Page 15 of 23http://www.translational-medicine.com/content/11/1/27
significantly decreased by a factor of 5 (p < 0.05). Onlyminor differences could be seen between the sub-popu-lations. At the same time, adiponectin expression wasinduced for most of the cultures about 100- to 500-fold.This difference in comparison to the control cultureswas significant. Cho5 culture and disc cell culture no. 2showed alternating behaviour and were not induced inall cases. Under induction, W5C5+ showed lower adipo-nectin expression than W5C5-, and W8B2- lower thanW8B2+; however, the effects were not significant. Nosignificant differences could be detected between thesubpopulations, neither under control nor under induc-tion conditions. The rise in adiponectin mRNA expres-sion did not correlate with the Oil Red O staining. Onlyvery rare, sporadically positive cells could be foundunder induced conditions (Figure 5). In none of thecontrol cultures were lipid droplets found. No obviousdifferences could be detected between disc cells andchondrocytes expanded in MSC growth medium ascompared to standard chondrocyte cultures. Again, cul-tures in MSC growth medium were propagated to ex-clude negative selection of putative present stem cellsby the medium. (For further information, see Additionalfile 1: Table S5.)
Osteogenic differentiationTo determine the osteogenic differentiation potential ofchondrocytic sub-populations gene expression of the tran-scription factor CBFA1 (RUNX2) and alkaline phosphat-ase were analyzed three weeks after induction (Figure 6).On the protein level, ALP activity was measured andmineralization of the cultures was detected by Alizarin
Red staining. At first, the gene expression data of theosteogenic marker genes appeared to be more heteroge-neous than their adipogenic counterparts. CBFA expres-sion was between 7 x 10⁻⁶ and 2 x10⁻⁴ and ALP expressionbetween 7 x 10⁻⁷ and 1 x10⁻⁶ (neglecting the outlier disc3W5C5-). At the endpoint of the experiment, CBFA1 andALP expression of control cultures was significantly dif-ferent to cultures under induction conditions. ANOVAanalysis revealed no differences between the individualsub-populations. Some cultures responded better to thestimulation whilst others did not. Interestingly, for somecultures, it appeared that osteogenic induction and adi-pogenic induction behave inversely. Good respondersto osteogenic induction were bad responders to adipo-genic induction (e.g. Disc2), good responders to adipo-genic differentiation did not respond well to osteogenicinduction (e.g. Cho8 MSCGM). The two W8B2+ sub-populations and the disc2 culture showed the higheststimulation index, with the ALP mRNA expressionhave increased more than 100-fold after stimulation.The disc2 culture also showed the highest ALP activityof all cultures (Figure 6 bottom, left side). The increasein ALP activity was about 3000 pmol/min/μg DNAafter induction. An increase of about 2000 pmol/min/μg DNA could be detected for Cho4. The other cul-tures responded only to a minor degree to the stimula-tion and showed almost negligible or only a verymoderate increase in ALP activity. However, the meanof the controls (285.0 pmol/min/μg DNA, n = 25) dif-fered significantly (p < 0.05) from the mean of inducedsamples (1370.7 pmol/min/μg DNA, n = 25). Differ-ences between sub-populations were not detected.
Benz et al. Journal of Translational Medicine 2013, 11:27 Page 16 of 23http://www.translational-medicine.com/content/11/1/27
High ALP activity levels did not inevitably lead tomineralization (at least at the time-point of theanalysis). Disc2 as well as Cho4 cultures were negativein the Alizarin Red staining, showing no signs ofmineralization (Figure 6 bottom, right). Only two cul-tures were positive for Alizarin Red: both cultures wereexpanded in MSC growth medium (Cho7 MSCGM, Cho8MSCGM). But both showed only low ALP activity at thattime-point (three weeks after induction). The correspond-ing culture of Cho8, which was expanded in chondrocyteculture medium, was Alizarin Red negative. Not a singleculture was positive in the Alizarin Red staining undercontrol conditions, which demonstrates that no spontan-eous osteogenic differentiation occurred. (For furtherdetails, see Additional file 1: Table S6.)
Chondrogenic differentiationTo determine the chondrogenic differentiation potentialof chondrocytic sub-populations, a hydrogel system wasused. This hydrogel is already used in a clinical studyfor disc regeneration (www.clinicaltrials.gov; identifier:NCT01640457) and we recently described chondrogenicdifferentiation of human MSCs in this hydrogel [34].Four weeks after chondrogenic induction, the gene expres-sion of chondrogenic marker genes collagen type II(COL2), and the transcription factors SOX9 were deter-mined and compared to the level of monolayer (ML) cellsbefore being embedded into the hydrogels (Figure 7). Onthe protein level, the GAG synthesis was analyzed in thehydrogels and the cumulated culture supernatants. Theexpression rate of SOX9 was the highest in comparison tothe other transcription factors, CBFA1 and PPARγ2, andwas expressed very uniformly in all cultures at an averagevalue of 4 x 10⁻³ relative to GAPDH in monolayers, and of3 x 10-2 in hydrogels (Figure 7 top). Under both hydrogelconditions, cells showed a significantly higher SOX9 ex-pression as compared to the ML cells. In induced cells,this value decreased slightly to an average of 2 x 10⁻² com-pared to cells in control gels, but there was no significantdifference between the two gel groups. Under the sameexperimental conditions, no differences were found be-tween the sub-populations.The conversion of the two-dimensional monolayer
into the three-dimensional environment in the hydrogelwas sufficient to increase the collagen type II expressionsignificantly (p < 0.05). Compared to the expression valuesat the end of the expansion, cells in hydrogels showed ahigher collagen type II expression. In particular, both disccell cultures re-differentiated very well in the hydrogel,showing a more than 1000-fold higher expression com-pared to the state before hydrogel culture. The addition ofTGFβ3 to these hydrogel cultures did not improve colla-gen type II expression further. Collagen type II mRNAlevels were variable and no difference between control
and induction conditions could be detected. Expressionlevels ranged between 7 x 10⁻⁶ and 1 x 10⁻¹ in controls,and 1 x 10⁻⁵ and 6 x 10⁻² in induced cultures (see Add-itional file 1: Table S7). Compared to collagen type II,aggrecan mRNA expression values were very constant(data not shown). The average expression of all controlcultures (3.99 x 10⁻²) was almost the same as for theinduced cultures (3.64 x 10⁻²). Although no changes be-tween control gels and gels under induction conditionswere detected in the expression of the chondrogenic mar-ker genes, a significant increase in the expression of thereference gene GAPDH was measured (Figure 7 bottom).Quantification cycles (Cq) were around four cycles lower,meaning that 16-fold more GAPDH mRNA was presentin the cultures stimulated by TGFβ3 as compared to thecontrol cultures. This result was in accordance with anobservation made regarding the viability of these cells.For the disc3 culture, a live-dead-staining was performed atthe end of the chondrogenic differentiation. It defined theviability of control cells at about 36% (i.e., the majority ofcells failed to survive the 3D-culture conditions) whereasthe viability in the TGFβ3-stimulated cultures was about80% (data not shown). To control this finding we analyzedthe amount of RNA obtained after isolation. We found sig-nificantly (p < 0.05) lower RNA concentrations in the con-trols (mean: 10.6 μg/ml) compared to the induced samples(mean: 22.5 μg/ml). This result confirms the viability data.While aggrecan mRNA is constantly expressed in control
and induced cultures, a significant increase in GAG releasewas measured in the induced populations (p < 0.05). Thecumulated GAG content doubled in the induced popula-tions. A comparison of the sub-populations also showed nosignificant differences. An overview of the biochemical ana-lyses is presented in Table 3.The GAG synthesis rate per week ranged at about
1.8 μg GAG per μg DNA under control conditions. Thiswas higher than the amount produced by cells beingembedded into the hydrogel directly after MACS (about1 μg / μg DNA, see Figure 1). After induction, the synthe-sis was further increased to about 2.8 μg GAG / μg DNA.Thus, even after prolonged expansion, under appropriateconditions, chondrocytes and disc cells were able tosynthesize GAGs in a manner similar to cells with dis-tinctly lower population doublings. Chondrocytes culturedin MSC growth medium produced less GAG/DNA ascompared to chondrocytes cultured in chondrocytemedium. No difference was recorded between chondro-cytes and disc cells. (For additional details, see Additionalfile 1: Tables S7 and S8).
Expression of cell surface antigens and differentiationcapacity as a function of population doublings in vitroAs only minor differences between the sub-populationswere found after prolonged expansion, we additionally

Table 3 Biochemical analysis of hydrogel cultures after chondrogenic induction
Sample DNA hydrogel GAG hydrogel/DNA GAG supernatant/DNA GAG/DNA
[μg] [μg/μg] [μg/μg] [μg/μg]
Mean sd Mean sd Mean sd Mean sd
control
Ø 2.04 0.86 0.86 0.38 5.46 3.06 6.35 2.86
W5C5+ 2.55 0.78 0.83 0.21 3.27 2.54 4.10 2.65
W5C5- 2.16 0.68 1.03 0.14 5.23 4.05 6.25 4.06
W8B2+ 2.66 0.09 0.99 0.05 6.10 0.40 7.10 0.45
W8B2- 2.04 0.45 0.97 0.17 11.60 5.02 12.57 5.16
induction
Ø 2.42 1.08 1.79 0.49 10.48 4.26 12.27 4.63
W5C5+ 2.63 1.23 1.71 0.72 8.90 4.86 10.61 5.40
W5C5- 2.35 1.25 1.82 0.87 10.63 5.43 12.45 6.16
W8B2+ 3.27 0.70 1.79 0.57 9.36 2.00 11.15 2.57
W8B2- 3.36 0.26 1.68 0.39 8.42 1.37 10.10 1.75
Benz et al. Journal of Translational Medicine 2013, 11:27 Page 17 of 23http://www.translational-medicine.com/content/11/1/27
analyzed the adipogenic and osteogenic differentiation ofchondrocytes directly after MACS (chondrogenic differ-entiation capacity was already indirectly compared; seeFigures 1 and 7). Moreover, the surface antigen expres-sion was analyzed at these two time-points. Directlyafter MACS, the W5C5+ and the W8B2+ fraction con-tained more than 97% positive cells, as shown by flowcytometry (Figure 8A, top row). In addition, there wasno change in the proportions of distribution for W5C5+in W8B2-sorted cells and vice versa (data not shown).At the end of expansion in chondrocyte medium, boththe W5C5+ and the W8B2+ sub-populations lost a sub-stantial amount of antigen-positive cells or lost the ex-pression of the corresponding cell surface antigens(Figure 8A, bottom row). Finally, after more than 8 pdsin vitro, the expression profiles for all three populationswere more or less identical. This loss of antigen expressionwas not found for other MSC antigens, including CD49e,CD73, CD90, CD105, and CD166. Their expressionremained stable during this time-span (data not shown).Also, differentiation capacity changed depending on thecumulative population doublings of the cultures. Undercontrol conditions, the expression of adiponectin and al-kaline phosphatase did not differ significantly (p > 0.05)dependent on the pds of the cells (Figure 8B,C). TheALP activity was also constant. In both groups (the “afterMACS” group = “younger” and the “after MACS + > 8pds” group = “older”), induction led to a statistically sig-nificant increase in adiponectin and ALP gene expression,and ALP activity (p < 0.05). (For reasons of clarity thiswas not plotted into the graphs.) “Younger” and “older”cells did not differ in their response to adipogenic in-duction. However, the osteogenic induction was much
more pronounced in those cultures, which were differ-entiated directly after MACS. The average increase inALP gene expression after induction was about 9-foldhigher in all “younger” cell populations compared to“older” ones. The average ALP activity increased by afactor of 11 in “younger”, and increased only by a factorof 4 in the expanded “older” cultures. This effect wasstatistically significant for unsorted and W5C5+ popula-tions on ALP gene level and for all three sub-populationson ALP activity level (Figure 8C). A comparison of theindividual sub-populations under the same experimentalconditions showed that there were no differences undercontrol conditions. After osteogenic induction, the W5C5+fraction differed significantly from the unsorted and theW5C5- fraction with regard to ALP activity. Alizarin Redstaining indicating mineralization of the cultures was notconsistent in the cultures (as seen for the differentiationafter > 8 pds). One of three cultures was positive; twowere negative (data not shown). In the adipogenic induc-tion medium, both “younger” and “older” cells showed asignificant increase in adiponectin mRNA; however, theexpression remained at a very low level. In contrast to theosteogenic induction, the “younger” cells were more indu-cible directly after MACS; whereas the expanded “older”cells displayed a stronger response (this difference be-tween the two groups of cells after adipogenic inductionwas not significant). In none of the cultures could lipiddroplets be detected by means of Oil red O staining (datanot shown), a finding that demonstrates that genotypicalterations do not necessarily manifest themselves asphenotypic changes. To summarize the results of these dif-ferentiation experiments, it can be stated that the W5C5+cell populations, besides being highly chondrogenic, tend
Benz et al. Journal of Translational Medicine 2013, 11:27 Page 18 of 23http://www.translational-medicine.com/content/11/1/27
to a greater extent toward the osteogenic phenotype, ratherthan to an adipogenic one, once provoked into an alterna-tive phenotype.
DiscussionThe presented experimental study contains four majorresults: Firstly, our results confirm and have reproducedother observations relating to MSC-like cells in articularcartilage. Secondly, these populations persist duringpropagation in vitro. Thirdly, de-differentiated popula-tions retain chondrogenic properties above and beyondthe accepted population doubling limits that now prevail(less than 6 pds). Fourthly, the observed osteogenic andadipogenic potency was chiefly observable at the level ofgene expression and much less so at the level of cellfunction.Taken together, the data indicate the presence of cer-
tain plasticity within chondrocytic cell populationswhich may be related to the presence of classical MSCsub-types but more likely to the presence of restrictedprecursor populations for skeletal phenotypes.The motivation for our study was based on recent
insights relating to the presence of MSCs or MSC-likecells in cartilage [4,8] and intervertebral disc tissue [2,3]and the perspectives and/or problems which possiblyarise from such cells within the context of ACI. Weinvestigated whether these cells in cartilage share true“stem cell” features and whether these “stem cell” fea-tures or the “stemness” of chondrocyte populations areadvantageous or disadvantageous to ACI.To test the MSC sub-population hypothesis, we car-
ried out the following experiments: i) analysis of thepresence of surface antigens described for MSCs, ii) gen-eration of sub-populations which are enriched ordepleted of cells presenting MSC surface antigens, iii)analysis of the differentiation state after separation, de-scription of the replicative capacity, and differentiationpotential into adipogenically, osteogenically, and chon-drogenically functional cell types.According to the position paper of the Society for Cel-
lular Therapy, in which the minimal criteria for MSCsare stipulated, MSCs must adhere to tissue culture plas-tic when maintained in standard culture medium andhave to show multi-potent differentiation potential. Fur-thermore, they must express CD73, CD90, and CD105,and must lack expression of CD34, CD45, CD14,CD79α, and HLA-DR surface molecules [41]. Two cri-teria, the adherence and expression of the mentionedCDs, are fulfilled by chondrocytes and also by IVD cells.Similar to MSCs, these cell types were 100% positive inour flow cytometry analysis (within the error bracketsfor the method) for the above-mentioned markersCD73, CD90, and CD105, as well as for other markersdescribed in the literature as having been expressed on
MSCs, such as CD49e, CD140b, and CD166. In contrast,CD271 was not expressed on cultured chondrocytes anddisc cells. Similar flow cytometry profiles for putativeMSCs isolated from degenerated nucleus pulposus wereshown in a publication from Blanco and colleagues [6].The expression of CD73, CD90, CD105, and CD166 onhuman chondrocytes has been also demonstrated byothers [40]. More recently, W5C5 and W8B2 antigenshave been added to the list of markers for chondrogenicand osteogenic MSCs from bone marrow [30-33].We were able to establish W5C5 (SUSD2) and W8B2
(membrane alkaline phosphatase) sub-populations usingMACS technology. Unfortunately, W8B2 sorting is notvery practicable for most experimental set-ups due tothe low amount of positive cells obtained after sorting.In general, MACS separations led to enriched fractionswith a satisfactory rate of positive cells, as confirmed byflow cytometry of the MACS cells (on average between80 and 90%). However, the depleted fractions still con-tained relatively high numbers of positive cells (on aver-age about 30 to 40%). The impurity of the depletedMACS fractions might be one reason for the lack of dif-ference between + and - fractions in our study. Cellsshowed good viability and the potential for chondrogenicmaturation was not altered in comparison to the un-sorted populations (Figure 1).To test the stability of the sub-populations generated
with respect to “stemness”, we expanded the cells afterMACS for several passages until the cells had accumu-lated at least additional 8 pds. To exclude an undesiredselection of cells by using a medium that was especiallydesigned for chondrocytes (chondrocyte medium, CM),we expanded two cultures in a commercial MSC growthmedium (MSCGM containing fibroblast growth factor-2(FGF-2)). The result met our expectations: the cells be-came less differentiated and more proliferative. Inaddition, under all culture conditions, the individual cellpopulations tended to become more similar with in-creasing pds.With regard to their differentiation potency, it can briefly
be stated that, under control conditions, chondrocytes andchondrocyte sub-populations were able to express the mas-ter transcription factors for all three tested lineages:PPARγ2, CBFA1, and SOX9 and lineage-related specificgenes such as adiponectin, alkaline phosphatase, and colla-gen type II. This might be a primordial pattern for all cellsof mesodermal origin, since, during embryogenesis, the fateof the cells is defined by environmental cues and not bylineage-specific origin [42-44]. Transcription factors seemto be expressed constitutively and stably in all cultures andunder all conditions. However, the mRNA expression fortissue-specific genes did not necessarily lead to a detectablefunctional cell/tissue phenotype. Under control conditions,neither the formation of lipid droplets nor mineralization
Benz et al. Journal of Translational Medicine 2013, 11:27 Page 19 of 23http://www.translational-medicine.com/content/11/1/27
was detected. On the other hand, and unlike adipogenicand osteogenic differentiation, chondrogenic differentiationcould be induced simply by transferring the cells frommonolayer to a three-dimensional culture in our hydrogel,without the use of induction medium (concerning viabilityof cultures, see discussion below). Good chondrogenic dif-ferentiation after several passages and pds showed slightdiscrepancy to some published data. Giovannini et al.determined cumulative pds of human articular chondro-cytes expanded in monolayer culture and identified athreshold range of 3.57 and 4.19 pds as indicative of a lossof intrinsic chondrogenic capacity in pellets [23]. Kanget al. showed an effect of passage number on tissue-engineered cartilage when cells of different passages werecultured on biodegradable polymer scaffolds. Passage 5chondrocytes did not produce cartilage-specific extracellu-lar matrices [22]. Peltari showed the loss of the ectopic car-tilage formation capacity of human chondrocytes in vivo tobe between 0 and 6 pds [24].These differences could possibly be caused by different
culture conditions rather than by the intrinsic failure ofchondrocyte differentiation pathways. Recently, Schuhet al. demonstrated that the availability of adhesion siteswithin agarose hydrogels inhibited the cellular re-differentiation [45]. The hydrogel used in this study isbased on human serum albumin that does not containadhesive peptide residues for chondrocytes [46].After adipogenic induction, expression of adiponectin
gene expression was up-regulated in most cultures by afactor of 100 – 500. But only very sporadically were OilRed O positive cells with lipid droplets found.After osteogenic differentiation, an increase in ALP
mRNA transcripts and enzyme activity were found forsome cultures, but non-responders were also found. Oneexplanation for the inconsistent results may be rooted inthe mineralization process, which may be related to theinduction of osteoblasts or hypertrophic chondrocytesfrom these cells with low differentiation levels. ALPmRNA expression and ALP activity do not correlatewith mineralization. Interestingly, we found signs ofmineralization only in those two cultures that wereexpanded in a commercial MSC growth medium. Thismight be due to the presence of FGF-2 during the expan-sion period. In general, the expression of ALP and osteo-genic differentiation in the context of chondrocytes is anunresolved issue. In skeletal development, cartilaginousanlagen are remodeled to bone. Thus the fate of mostchondrocytes is to develop into mineralizing cells. There-fore, the ability to express osteogenic marker moleculesmust be an intrinsic property of the chondrocyte. ALPmay have multiple functions in skeletal tissue and its ex-pression is not causally linked to chondrocyte hypertrophy[47]. Indications for such processes are also described forosteoarthritic cartilage and in degenerative discs [48].
To further analyze this problem, we compared mRNAexpression of osteocalcin and bone sialoprotein-2 (BSP-2) in mineralizing sub-populations and in highly ALP-positive but non-mineralizing sub-populations. Bothpools generated the same level of osteocalcin mRNA,whereas the non-mineralizing cells expressed even moreBSP-2 (about 100-fold, data not shown). This result sug-gests that other regulatory mechanisms, such as miRNAexpression, may be involved in the process ofmineralization [49-52]. In addition, the expression ofALP mRNA was still about 100-fold lower in chondro-cytes cultures as compared to the respective mRNAlevels of three commercially-available MSC cultures(data not shown). Taken together, cell populationsobtained from cartilage/disc tissue seem to have a lowertendency to mineralize than typical bone marrow MSCs.This corrobates with clinical results of studies on the
repair of cartilage defects using microfracture or ACI,respectively. In the case of microfracture, the intra-lesional formation of osteophytes is frequently described,but this has been never reported for ACI [53-56]. Micro-fracture is a procedure in which, by breaking throughthe subchondral plate, bone marrow cells (potentiallycontaining multipotent MSCs) are able to migrate intothe defective area of a joint cartilage trauma and rebuildrepair cartilage, but may also cause the undesired forma-tion of osteophytes. In contrast, ACI uses in vitroexpanded chondrocytes isolated from autologous cartil-age and may therefore be less prone to undesiredmineralization.The results from chondrogenic induction demon-
strated that chondrocytes and disc cells were able tosynthesize major cartilage extracellular matrix compo-nents on the mRNA and protein level, even after pro-longed expansion. Interestingly, we found a relativelyhigh number of dead cells in the hydrogel under controlconditions, but not after stimulation with TGF-β3. Thisis not the case when cells expanded in primary culturewhere embedded into the hydrogel [34]. The transferinto hydrogel may generate selection pressure on thecells, leading to the elimination of non-adaptive cellsfrom the culture. An important implication of such afinding is that a three-dimensional environment may ac-tually suppress untoward adaptations or differentiations.TGF-β supplementation improves the viability of thecultures and leads to an increase in GAG synthesis. Thispositive influence on survival and function has beenreported by Risbud et al. in terms of intervertebral disc(IVD) cells in organ cultures [57].With regard to the presence of MSCs or other precur-
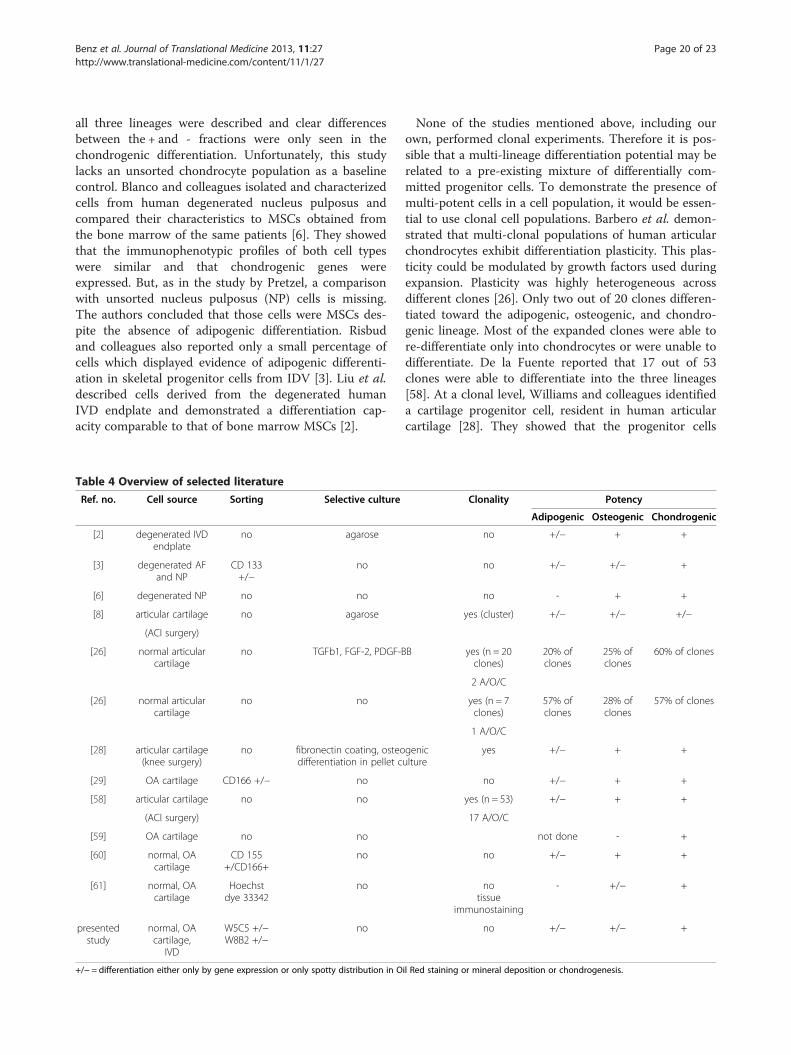
sor cell types in articular cartilage and intervertebraldiscs, the literature presents a rather complex picture(Table 4). In a study comparable to ours, Pretzel et al.used CD105/CD166 as markers [29]. Differentiation into
Benz et al. Journal of Translational Medicine 2013, 11:27 Page 20 of 23http://www.translational-medicine.com/content/11/1/27
all three lineages were described and clear differencesbetween the + and - fractions were only seen in thechondrogenic differentiation. Unfortunately, this studylacks an unsorted chondrocyte population as a baselinecontrol. Blanco and colleagues isolated and characterizedcells from human degenerated nucleus pulposus andcompared their characteristics to MSCs obtained fromthe bone marrow of the same patients [6]. They showedthat the immunophenotypic profiles of both cell typeswere similar and that chondrogenic genes wereexpressed. But, as in the study by Pretzel, a comparisonwith unsorted nucleus pulposus (NP) cells is missing.The authors concluded that those cells were MSCs des-pite the absence of adipogenic differentiation. Risbudand colleagues also reported only a small percentage ofcells which displayed evidence of adipogenic differenti-ation in skeletal progenitor cells from IDV [3]. Liu et al.described cells derived from the degenerated humanIVD endplate and demonstrated a differentiation cap-acity comparable to that of bone marrow MSCs [2].
Table 4 Overview of selected literature
Ref. no. Cell source Sorting Selective culture
[2] degenerated IVDendplate
no agarose
[3] degenerated AFand NP
CD 133+/−
no
[6] degenerated NP no no
[8] articular cartilage no agarose
(ACI surgery)
[26] normal articularcartilage
no TGFb1, FGF-2, PDGF-B
[26] normal articularcartilage
no no
[28] articular cartilage(knee surgery)
no fibronectin coating, osteodifferentiation in pellet c
[29] OA cartilage CD166 +/− no
[58] articular cartilage no no
(ACI surgery)
[59] OA cartilage no no
[60] normal, OAcartilage
CD 155+/CD166+
no
[61] normal, OAcartilage
Hoechstdye 33342
no
presentedstudy
normal, OAcartilage,
IVD
W5C5 +/−W8B2 +/−
no
+/− = differentiation either only by gene expression or only spotty distribution in O
None of the studies mentioned above, including ourown, performed clonal experiments. Therefore it is pos-sible that a multi-lineage differentiation potential may berelated to a pre-existing mixture of differentially com-mitted progenitor cells. To demonstrate the presence ofmulti-potent cells in a cell population, it would be essen-tial to use clonal cell populations. Barbero et al. demon-strated that multi-clonal populations of human articularchondrocytes exhibit differentiation plasticity. This plas-ticity could be modulated by growth factors used duringexpansion. Plasticity was highly heterogeneous acrossdifferent clones [26]. Only two out of 20 clones differen-tiated toward the adipogenic, osteogenic, and chondro-genic lineage. Most of the expanded clones were able tore-differentiate only into chondrocytes or were unable todifferentiate. De la Fuente reported that 17 out of 53clones were able to differentiate into the three lineages[58]. At a clonal level, Williams and colleagues identifieda cartilage progenitor cell, resident in human articularcartilage [28]. They showed that the progenitor cells
Clonality Potency
Adipogenic Osteogenic Chondrogenic
no +/− + +
no +/− +/− +
no - + +
yes (cluster) +/− +/− +/−
B yes (n = 20clones)
20% ofclones
25% ofclones
60% of clones
2 A/O/C
yes (n = 7clones)
57% ofclones
28% ofclones
57% of clones
1 A/O/C
geniculture
yes +/− + +
no +/− + +
yes (n = 53) +/− + +
17 A/O/C
not done - +
no +/− + +
notissue
immunostaining
- +/− +
no +/− +/− +
il Red staining or mineral deposition or chondrogenesis.
Benz et al. Journal of Translational Medicine 2013, 11:27 Page 21 of 23http://www.translational-medicine.com/content/11/1/27
have the capacity to differentiate into the adipogeniclineage, whilst retaining a restricted differential potentialduring osteogenic differentiation when investigated in a3D pellet culture system. However, as in our study, unse-lected chondrocytes were also positive for differentiationinto the three lineages. However, the overall efficacy ofdifferentiation seems to be very low in comparison toMSCs isolated from bone marrow.Our study revealed unexpectedly few differences be-
tween the sub-populations and the unselected chondro-cyte or disc cell cultures. During re-testing in thepresence of surface antigens, we observed a reversal inthe expression of the markers in the positive fraction,for both W5C5+ and W8B2+ cells, to a level defined bythe unsorted initial cells. This tendency was describedalso by Pretzel et al. for CD166+ cells [29]. Interestingly,other markers were expressed until expansion ended,with no change in proportions. To verify that we did nothave a bias against cells with stem cell characteristicsduring expansion, we repeated adipogenic and osteo-genic differentiation experiments directly after MACS ofthe expanded cells (PO, “younger”): we found that theolder cultures seemed to lose their osteogenic differenti-ation capacity, but gained adipogenic potential, as evi-denced by the levels of the explored functional tissuemarkers. The stability of such findings is underscored bya recent work including an inter-laboratory compa-rison on MSC differentiation, with the result that chon-drogenesis may even serve as a means of regulatorydemanded quality control measures [62]. As our cultureconditions apparently preserved chondrogenic featuresand suppressed osteogenic or adipogenic lineages,in vitro expansion of chondrocytes in ACI may actuallybe an advantage rather than a disadvantage for theformation of sound repair cartilage.
ConclusionThe expression of putative MSC marker genes on chon-drocytes and disc cells does not necessarily determine theplasticity of cells. W5C5 and W8B2 antigen expressionmight be of prognostic value to MSCs, but is not predictivein terms of cartilage and disc tissue-derived chondrocytes.Expression of MSC markers is, at best, an inclusive featureto characterize multi-potent stem cells, but not an exclu-sive criterion for chondrogenetic properties. Our resultsdemonstrate that, under established in vitro culture condi-tions, a chondroid precursor, but not a multi-potent mes-enchymal, cell type can be obtained. We demonstrate that,at a very low level, a certain kind of multi-differentiationpotential is present in the chondrocyte population afterstimulation, but the affinity to the chondrogenic lineage isstrongly pronounced. As a consequence, even after forcedenrichment of putative MSC-like cell populations, in vitro
expanded chondrocyte cultures do not pose a major risk ofadverse adipose or osseous differentiation, even when suchdifferentiation was induced in vitro. Appropriate cell cul-ture conditions during expansion (medium especiallydesigned for chondrocytes) and differentiation (hydrogeladapted to the need of chondrocytes/disc cells) favor thedevelopment of a chondrogenic phenotype – as proposedfor ACI. However, using a stem cell medium, it is possibleto generate a more osteogenic phenotype artificially. Insummary, it can be stated that the “stemness” of chondro-cytes expanded for use in ACI is not a potential risk, andrepresents an advantage instead, when cells are handled ina proper manner.
Additional file
Additional file 1: Table S1. Human tissues used for MACS / cellculture experiments. Table S2. Antibodies used for flow cytometry. TableS3. Primers used for gene expression analysis. Table S4. Gene expressionof chondrocytic subpopulations dependent on the population doublings.Table S5. Adipogenic differentiation: relative gene expression data.Table S6. Osteogenic differentiation: relative gene expression data. TableS7. Chondrogenic differentiation: relative gene expression data. TableS8. Chondrogenic differentiation: GAG synthesis.
Additional file 2: Figure S1. Experimental set-up for MACS sortingexperiments. Figure S2. Experimental set-up to characterise W5C5 andW8B2 positive subpopulations regarding MSC characteristics.
Competing interestsKB and JAM have applied for a patent relating to the application of thehydrogel material.
Authors’ contributionsKB contributed to the conception and design of the study, MACSexperiments, cell culture and differentiation experiments, biochemical andhistological analysis, interpretation of data, statistical analysis, writing themanuscript. CS carried out flow cytometry. CF carried out gene expressionanalysis. JAM helped conceive the study, participated in discussions andinterpretation of data, and in the drafting and revision of the manuscript.WKA took over supervision, discussion and interpretation of data, andrevision of the manuscript. All authors read and approved the finalmanuscript.
AcknowledgementsWe are grateful to TETEC AG for the generous supply of W5C5 microbeadsand antibody and to Priscilla Herrmann for correcting the manuscript as anative speaker. We thank Drs. Badke and Albrecht (BG Trauma Center,Tuebingen) for supplying us with human cartilage and disc tissue specimens.This work was supported by the German Ministry of Education and Research(BMBF, grant no. 01KQ0902A and B, grant no. 1315579A and B).
Author details1NMI Natural and Medical Sciences Institute at the University of Tuebingen,Markwiesenstr. 55, Reutlingen 72770, Germany. 2TETEC AG, Reutlingen,Germany. 3Rush University Medical Center, Chicago, IL, USA. 4KFO273,Department of Urology, University of Tuebingen Hospital, Tuebingen,Germany.
Received: 14 September 2012 Accepted: 21 January 2013Published: 30 January 2013
References1. Pittenger MF, Mackay AM, Beck SC, Jaiswal RK, Douglas R, Mosca JD,
Moorman MA, Simonetti DW, Craig S, Marshak DR: Multilineage potentialof adult human mesenchymal stem cells. Science 1999, 284:143–147.

Benz et al. Journal of Translational Medicine 2013, 11:27 Page 22 of 23http://www.translational-medicine.com/content/11/1/27
2. Liu LT, Huang B, Li CQ, Zhuang Y, Wang J, Zhou Y: Characteristics of stemcells derived from the degenerated human intervertebral disc cartilageendplate. PLoS One 2011, 6:e26285.
3. Risbud MV, Guttapalli A, Tsai TT, Lee JY, Danielson KG, Vaccaro AR, Albert TJ,Gazit Z, Gazit D, Shapiro IM: Evidence for skeletal progenitor cells in thedegenerate human intervertebral disc. Spine (Phila Pa 1976) 2007,32:2537–2544.
4. Hattori S, Oxford C, Reddi AH: Identification of superficial zone articularchondrocyte stem/progenitor cells. Biochem Biophys Res Commun 2007,358:99–103.
5. Koelling S, Kruegel J, Irmer M, Path JR, Sadowski B, Miro X, Miosge N:Migratory chondrogenic progenitor cells from repair tissue during thelater stages of human osteoarthritis. Cell Stem Cell 2009, 4:324–335.
6. Blanco JF, Graciani IF, Sanchez-Guijo FM, Muntion S, Hernandez-Campo P,Santamaria C, Carrancio S, Barbado MV, Cruz G, Gutierrez-Cosio S, et al:Isolation and characterization of mesenchymal stromal cells from humandegenerated nucleus pulposus: comparison with bone marrowmesenchymal stromal cells from the same subjects. Spine (Phila Pa 1976)2010, 35:2259–2265.
7. Tallheden T, Brittberg M, Peterson L, Lindahl A: Human articularchondrocytes–plasticity and differentiation potential. Cells Tissues Organs2006, 184:55–67.
8. Thornemo M, Tallheden T, Sjogren Jansson E, Larsson A, Lovstedt K,Nannmark U, Brittberg M, Lindahl A: Clonal populations of chondrocyteswith progenitor properties identified within human articular cartilage.Cells Tissues Organs 2005, 180:141–150.
9. da Silva ML, Caplan AI, Nardi NB: In search of the in vivo identity ofmesenchymal stem cells. Stem Cells 2008, 26:2287–2299.
10. da Silva ML, Chagastelles PC, Nardi NB: Mesenchymal stem cells reside invirtually all post-natal organs and tissues. J Cell Sci 2006, 119:2204–2213.
11. Shi S, Gronthos S: Perivascular niche of postnatal mesenchymal stemcells in human bone marrow and dental pulp. J Bone Miner Res 2003,18:696–704.
12. Zannettino AC, Paton S, Arthur A, Khor F, Itescu S, Gimble JM, Gronthos S:Multipotential human adipose-derived stromal stem cells exhibit aperivascular phenotype in vitro and in vivo. J Cell Physiol 2008,214:413–421.
13. Feng J, Mantesso A, Sharpe PT: Perivascular cells as mesenchymal stemcells. Expert Opin Biol Ther 2010, 10:1441–1451.
14. Crisan M, Yap S, Casteilla L, Chen CW, Corselli M, Park TS, Andriolo G, Sun B,Zheng B, Zhang L, et al: A perivascular origin for mesenchymal stem cellsin multiple human organs. Cell Stem Cell 2008, 3:301–313.
15. Paul G, Ozen I, Christophersen NS, Reinbothe T, Bengzon J, Visse E, JanssonK, Dannaeus K, Henriques-Oliveira C, Roybon L, et al: The adult humanbrain harbors multipotent perivascular mesenchymal stem cells. PLoSOne 2012, 7:e35577.
16. Brittberg M, Lindahl A, Nilsson A, Ohlsson C, Isaksson O, Peterson L:Treatment of deep cartilage defects in the knee with autologouschondrocyte transplantation. N Engl J Med 1994, 331:889–895.
17. Meisel HJ, Siodla V, Ganey T, Minkus Y, Hutton WC, Alasevic OJ: Clinicalexperience in cell-based therapeutics: disc chondrocyte transplantationA treatment for degenerated or damaged intervertebral disc. Biomol Eng2007, 24:5–21.
18. Mayne R, Vail MS, Mayne PM, Miller EJ: Changes in type of collagensynthesized as clones of chick chondrocytes grow and eventually losedivision capacity. Proc Natl Acad Sci U S A 1976, 73:1674–1678.
19. Benya PD, Padilla SR, Nimni ME: Independent regulation of collagen typesby chondrocytes during the loss of differentiated function in culture. Cell1978, 15:1313–1321.
20. Darling EM, Athanasiou KA: Rapid phenotypic changes in passagedarticular chondrocyte subpopulations. J Orthop Res 2005, 23:425–432.
21. Benya PD, Shaffer JD: Dedifferentiated chondrocytes reexpress thedifferentiated collagen phenotype when cultured in agarose gels. Cell1982, 30:215–224.
22. Kang SW, Yoo SP, Kim BS: Effect of chondrocyte passage number onhistological aspects of tissue-engineered cartilage. Biomed Mater Eng2007, 17:269–276.
23. Giovannini S, Diaz-Romero J, Aigner T, Mainil-Varlet P, Nesic D: Populationdoublings and percentage of S100-positive cells as predictors of in vitrochondrogenicity of expanded human articular chondrocytes. J Cell Physiol2010, 222:411–420.
24. Pelttari K, Lorenz H, Boeuf S, Templin MF, Bischel O, Goetzke K, Hsu HY,Steck E, Richter W: Secretion of matrix metalloproteinase 3 by expandedarticular chondrocytes as a predictor of ectopic cartilage formationcapacity in vivo. Arthritis Rheum 2008, 58:467–474.
25. Diaz-Romero J, Gaillard JP, Grogan SP, Nesic D, Trub T, Mainil-Varlet P:Immunophenotypic analysis of human articular chondrocytes: changesin surface markers associated with cell expansion in monolayer culture.J Cell Physiol 2005, 202:731–742.
26. Barbero A, Ploegert S, Heberer M, Martin I: Plasticity of clonal populationsof dedifferentiated adult human articular chondrocytes. Arthritis Rheum2003, 48:1315–1325.
27. Tallheden T, Dennis JE, Lennon DP, Sjogren-Jansson E, Caplan AI, Lindahl A:Phenotypic plasticity of human articular chondrocytes. J Bone Joint SurgAm 2003, 85-A(Suppl 2):93–100.
28. Williams R, Khan IM, Richardson K, Nelson L, McCarthy HE, Analbelsi T,Singhrao SK, Dowthwaite GP, Jones RE, Baird DM, et al: Identification andclonal characterisation of a progenitor cell sub-population in normalhuman articular cartilage. PLoS One 2010, 5:e13246.
29. Pretzel D, Linss S, Rochler S, Endres M, Kaps C, Alsalameh S, Kinne RW: Relativepercentage and zonal distribution of mesenchymal progenitor cells inhuman osteoarthritic and normal cartilage. Arthritis Res Ther 2011, 13:R64.
30. Battula VL, Treml S, Bareiss PM, Gieseke F, Roelofs H, de Zwart P, Muller I,Schewe B, Skutella T, Fibbe WE, et al: Isolation of functionally distinctmesenchymal stem cell subsets using antibodies against CD56, CD271,and mesenchymal stem cell antigen-1. Haematologica 2009, 94:173–184.
31. Alexander D, Schafer F, Olbrich M, Friedrich B, Buhring HJ, Hoffmann J,Reinert S: MSCA-1/TNAP selection of human jaw periosteal cells improvestheir mineralization capacity. Cell Physiol Biochem 2010, 26:1073–1080.
32. Buhring HJ, Battula VL, Treml S, Schewe B, Kanz L, Vogel W: Novel markersfor the prospective isolation of human MSC. Ann N Y Acad Sci 2007,1106:262–271.
33. Masuda H, Anwar SS, Buhring HJ, Rao JR, Gargett CE: A novel marker ofhuman endometrial mesenchymal stem-like cells. Cell Transplant 2012,21:2201–2214.
34. Benz K, Freudigmann C, Mueller J, Wurst H, Albrecht D, Badke A, GaissmaierC, Mollenhauer J: A polyethylene glycol-crosslinked serum albumin/hyaluronan hydrogel for the cultivation of chondrogenic cell types. AdvEng Mater 2010, 12:B539–551.
35. Benz K, Stippich C, Osswald C, Gaissmaier C, Lembert N, Badke A, Steck E,Aicher WK, Mollenhauer JA: Rheological and biological properties of ahydrogel support for cells intended for intervertebral disc repair. BMCMusculoskelet Disord 2012, 13:54.
36. Bustin SA, Benes V, Garson JA, Hellemans J, Huggett J, Kubista M, Mueller R,Nolan T, Pfaffl MW, Shipley GL, et al: The MIQE guidelines: minimuminformation for publication of quantitative real-time PCR experiments.Clin Chem 2009, 55:611–622.
37. Gebhard PM, Gehrsitz A, Bau B, Soder S, Eger W, Aigner T: Quantification ofexpression levels of cellular differentiation markers does not support ageneral shift in the cellular phenotype of osteoarthritic chondrocytes.J Orthop Res 2003, 21:96–101.
38. Altschul SF, Madden TL, Schaffer AA, Zhang J, Zhang Z, Miller W, Lipman DJ:Gapped BLAST and PSI-BLAST: a new generation of protein databasesearch programs. Nucleic Acids Res 1997, 25:3389–3402.
39. Chandrasekhar S, Esterman MA, Hoffman HA: Microdetermination ofproteoglycans and glycosaminoglycans in the presence of guanidinehydrochloride. Anal Biochem 1987, 161:103–108.
40. Cournil-Henrionnet C, Huselstein C, Wang Y, Galois L, Mainard D, Decot V,Netter P, Stoltz JF, Muller S, Gillet P, Watrin-Pinzano A: Phenotypic analysisof cell surface markers and gene expression of human mesenchymalstem cells and chondrocytes during monolayer expansion. Biorheology2008, 45:513–526.
41. Dominici M, Le Blanc K, Mueller I, Slaper-Cortenbach I, Marini F, Krause D,Deans R, Keating A, Prockop D, Horwitz E: Minimal criteria for definingmultipotent mesenchymal stromal cells. The international society forcellular therapy position statement. Cytotherapy 2006, 8:315–317.
42. Chou AI, Reza AT, Nicoll SB: Distinct intervertebral disc cell populationsadopt similar phenotypes in three-dimensional culture. Tissue Eng Part A2008, 14:2079–2087.
43. Lash J, Holtzer S, Holtzer H: An experimental analysis of the developmentof the spinal column. VI. Aspects of cartilage induction. Exp Cell Res 1957,13:292–303.

Benz et al. Journal of Translational Medicine 2013, 11:27 Page 23 of 23http://www.translational-medicine.com/content/11/1/27
44. Wolpert L: Principles of Develpoment. London, New York: Current BiologyLTD; 1998.
45. Schuh E, Hofmann S, Stok K, Notbohm H, Muller R, Rotter N: Chondrocyteredifferentiation in 3D: the effect of adhesion site density and substrateelasticity. J Biomed Mater Res A 2012, 100:38–47.
46. Kuschel C, Steuer H, Maurer AN, Kanzok B, Stoop R, Angres B: Cell adhesionprofiling using extracellular matrix protein microarrays. Biotechniques2006, 40:523–531.
47. Miyake T, Cameron AM, Hall BK: Variability of embryonic developmentamong three inbred strains of mice. Growth Dev Aging 1997, 61:141–155.
48. Rutges JP, Duit RA, Kummer JA, Oner FC, van Rijen MH, Verbout AJ,Castelein RM, Dhert WJ, Creemers LB: Hypertrophic differentiation andcalcification during intervertebral disc degeneration. Osteoarthr Cartil2010, 18:1487–1495.
49. Zhang ZJ, Zhang H, Kang Y, Sheng PY, Ma YC, Yang ZB, Zhang ZQ, Fu M,He AS, Liao WM: miRNA expression profile during osteogenicdifferentiation of human adipose-derived stem cells. J Cell Biochem 2012,113:888–898.
50. Schaap-Oziemlak AM, Raymakers RA, Bergevoet SM, Gilissen C, Jansen BJ,Adema GJ, Kogler G, le Sage C, Agami R, van der Reijden BA, Jansen JH:MicroRNA hsa-miR-135b regulates mineralization in osteogenicdifferentiation of human unrestricted somatic stem cells. Stem Cells Dev2010, 19:877–885.
51. Eskildsen T, Taipaleenmaki H, Stenvang J, Abdallah BM, Ditzel N, Nossent AY,Bak M, Kauppinen S, Kassem M: MicroRNA-138 regulates osteogenicdifferentiation of human stromal (mesenchymal) stem cells in vivo. ProcNatl Acad Sci U S A 2011, 108:6139–6144.
52. Zhang Y, Xie RL, Croce CM, Stein JL, Lian JB, van Wijnen AJ, Stein GS:A program of microRNAs controls osteogenic lineage progression bytargeting transcription factor Runx2. Proc Natl Acad Sci U S A 2011,108:9863–9868.
53. Proffen B, von Keudell A, Vavken P: Evidence-based therapy for cartilagelesions in the knee - regenerative treatment options. Z Orthop Unfall2012, 150:280–289.
54. Niemeyer P, Koestler W, Sudkamp NP: Problems and complications ofsurgical techniques for treatment of full-thickness cartilage defects.Z Orthop Unfall 2011, 149:45–51.
55. Dhollander AA, Verdonk PC, Lambrecht S, Almqvist KF, Elewaut D,Verbruggen G, Verdonk R: The combination of microfracture and a cell-free polymer-based implant immersed with autologous serum forcartilage defect coverage. Knee Surg Sports Traumatol Arthrosc 2011,20:1773–1780.
56. Fortier LA, Cole BJ, McIlwraith CW: Science and animal models of marrowstimulation for cartilage repair. J Knee Surg 2012, 25:3–8.
57. Risbud MV, Di Martino A, Guttapalli A, Seghatoleslami R, Denaro V, VaccaroAR, Albert TJ, Shapiro IM: Toward an optimum system for intervertebraldisc organ culture: TGF-beta 3 enhances nucleus pulposus and anulusfibrosus survival and function through modulation of TGF-beta-Rexpression and ERK signaling. Spine (Phila Pa 1976) 2006, 31:884–890.
58. de la Fuente R, Abad JL, Garcia-Castro J, Fernandez-Miguel G, Petriz J, RubioD, Vicario-Abejon C, Guillen P, Gonzalez MA, Bernad A: Dedifferentiatedadult articular chondrocytes: a population of human multipotentprimitive cells. Exp Cell Res 2004, 297:313–328.
59. Bernstein P, Sperling I, Corbeil D, Hempel U, Fickert S: Progenitor cells fromcartilage - no osteoarthritis-grade-specific differences in stem cell markerexpression. Biotechnol Prog 2012, Epub: 2012/11/23.
60. Alsalameh S, Amin R, Gemba T, Lotz M: Identification of mesenchymalprogenitor cells in normal and osteoarthritic human articular cartilage.Arthritis Rheum 2004, 50:1522–1532.
61. Grogan SP, Miyaki S, Asahara H, D’Lima DD, Lotz MK: Mesenchymalprogenitor cell markers in human articular cartilage: normal distributionand changes in osteoarthritis. Arthritis Res Ther 2009, 11:R85.
62. Müller J, Mollenhauer J, Tuan R, Benz K: Quality control for mesenchymalstromal cells: chondrogenesis as a standard condition? Rheumatology:Current Research 2012, S3:003.
doi:10.1186/1479-5876-11-27Cite this article as: Benz et al.: Maintenance of “stem cell” features ofcartilage cell sub-populations during in vitro propagation. Journal ofTranslational Medicine 2013 11:27.
Submit your next manuscript to BioMed Centraland take full advantage of:
• Convenient online submission
• Thorough peer review
• No space constraints or color figure charges
• Immediate publication on acceptance
• Inclusion in PubMed, CAS, Scopus and Google Scholar
• Research which is freely available for redistribution
Submit your manuscript at www.biomedcentral.com/submit


![Synthesis and Characterization of LiFePO[sub 4] and LiTi[sub 0.01]Fe[sub 0.99]PO[sub 4] Cathode Materials](https://static.fdokumen.com/doc/165x107/631dae063dc6529d5d079742/synthesis-and-characterization-of-lifeposub-4-and-litisub-001fesub-099posub.jpg)


![Structural and thermoelectric properties of Bi[sub 2]Sr[sub 2]Co[sub 2]O[sub y] thin films on LaAlO[sub 3] (100) and fused silica substrates](https://static.fdokumen.com/doc/165x107/634467196cfb3d406409325f/structural-and-thermoelectric-properties-of-bisub-2srsub-2cosub-2osub-y.jpg)

