Temperature and wavelength dependent trap filling in M< sub> 2 Si< sub> 5 N< sub> 8: Eu (M= Ca, Sr,...
8
Temperature and wavelength dependent trap filling in M 2 Si 5 N 8 :Eu (M ¼ Ca, Sr, Ba) persistent phosphors Philippe F. Smet a,b,n , Koen Van den Eeckhout a,b , Adrie J.J. Bos c , Erik van der Kolk c , Pieter Dorenbos c a LumiLab, Department of Solid State Sciences, Ghent University, Krijgslaan 281-S1, 9000 Gent, Belgium b Center for Nano- and Biophotonics (NB-Photonics), Ghent University, Belgium c Delft University of Technology, Faculty of Applied Sciences, 2629 JB Delft, The Netherlands article info Article history: Received 10 August 2011 Received in revised form 12 October 2011 Accepted 21 October 2011 Available online 4 November 2011 Keywords: Persistent luminescence Afterglow Thermoluminescence Trap filling Nitrides Rare earth abstract The evaluation of persistent phosphors is often focused on the processes right after the excitation, namely on the shape of the afterglow decay curve and the duration of the afterglow, in combination with thermoluminescence glow curve analysis. In this paper we study in detail the trap filling process in europium-doped alkaline earth silicon nitrides (Ca 2 Si 5 N 8 :Eu, Sr 2 Si 5 N 8 :Eu and Ba 2 Si 5 N 8 :Eu), i.e., how the persistent luminescence can be induced. Both the temperature at which the phosphors are excited and the spectral distribution of the excitation light on the ability to store energy in the phosphors’ lattices are investigated. We show that for these phosphors this storage process is thermally activated upon excitation in the lower 5d excited states of Eu 2þ , with the lowest thermal barrier for europium doped Ca 2 Si 5 N 8 . Also, the influence of co-doping with thulium on the trap filling and afterglow behavior is studied. Finally there exists a clear relation between the luminescence quenching temperature and the trap filling efficiency. The latter relation can be utilized to select new efficient 5d–4f based afterglow phosphors. & 2011 Elsevier B.V. All rights reserved. 1. Introduction The emission intensity of most luminescent materials drops to zero in less than a second after ending the excitation. Some materials, however, continue emitting light for minutes or even hours after the end of the excitation, a phenomenon known as persistent luminescence or afterglow. This continued light emis- sion without the need for a constant energy input is useful for many applications, the most notable being emergency signage [1], medical imaging [2], dials and displays, and decoration. Persistent phosphors emitting in the red or orange region of the visible spectrum are strongly desired in emergency signage, for displaying warning or stop signs, and in medical imaging, where the phosphors’ emission should be situated in the optical window of biological tissue [2,3]. Unfortunately, the large major- ity of known persistent luminescent materials are green (e.g. SrAl 2 O 4 :Eu,Dy [4]) or blue emitting (e.g. Sr 2 MgSi 2 O 7 :Eu,Dy [5]). The reason for this lack of efficient red persistent phosphors is twofold. Firstly, most persistent materials are based on oxides with Eu 2 þ as the emitting ion [6], and it is difficult to achieve a red-shift in oxides that is large enough to obtain red Eu 2 þ emission [7]. Secondly, the sensitivity of the human eye is lower for red light than it is for blue or green light. This effect is even more prominent at the low light intensity conditions typical for persistent luminescence applications. Hence, for red persistent phosphors to have the same apparent brightness as green or blue ones, they have to be considerably more efficient [8,9]. The second problem is inherent to human vision and cannot be evaded, but the first one can be tackled by choosing other host materials. For example, red persistent luminescence has been observed in CaS:Eu,Tm [15] and Ca 2 SiS 4 :Eu,Nd [16,17]. Recently, the family of alkaline earth nitrido-silicates, M 2 Si 5 N 8 :Eu (M¼ Ca, Sr, Ba) and their Tm-codoped variants were studied [10]. These materials are much more stable than the aforementioned sulfides and show a high quantum efficiency, which has led to extensive research into their use as conversion phosphors in white LEDs [11,12,18–28]. Recently, orange and reddish persistent lumines- cence was reported in these compounds, most notably in Ca 2 Si 5- N 8 :Eu,Tm [10,13,14,18,29,30]. Key parameters for the steady- state photoluminescence and the persistent luminescence of M 2 Si 5 N 8 :Eu(Tm) are given in Table 1. A great advantage of these Eu 2 þ -doped nitride materials is their very broad excitation spectrum, extending well into the visible range. This is promising for indoor applications where (near-)UV light is usually scarce, especially when lighting is based on phos- phor-converted LEDs. However, it does not necessarily mean that the persistent luminescence can also be obtained after exciting with visible light. After all, while the (steady-state) photoluminescence is caused by excited electrons in the Eu ions returning almost immediately to the ground state, the persistent luminescence is determined by acceptor states in the band gap of the material acting Contents lists available at SciVerse ScienceDirect journal homepage: www.elsevier.com/locate/jlumin Journal of Luminescence 0022-2313/$ - see front matter & 2011 Elsevier B.V. All rights reserved. doi:10.1016/j.jlumin.2011.10.022 n Corresponding author at: LumiLab, Department of Solid State Sciences, Ghent University, Krijgslaan 281-S1, 9000 Gent, Belgium. Tel.: þ32 9 264 43 53; fax: þ32 9 264 49 96. E-mail address: [email protected] (P.F. Smet). Journal of Luminescence 132 (2012) 682–689
Transcript of Temperature and wavelength dependent trap filling in M< sub> 2 Si< sub> 5 N< sub> 8: Eu (M= Ca, Sr,...
Journal of Luminescence 132 (2012) 682–689
Contents lists available at SciVerse ScienceDirect
Journal of Luminescence
0022-23
doi:10.1
n Corr
Univers
fax: þ3
E-m
journal homepage: www.elsevier.com/locate/jlumin
Temperature and wavelength dependent trap filling in M2Si5N8:Eu(M¼Ca, Sr, Ba) persistent phosphors
Philippe F. Smet a,b,n, Koen Van den Eeckhout a,b, Adrie J.J. Bos c, Erik van der Kolk c, Pieter Dorenbos c
a LumiLab, Department of Solid State Sciences, Ghent University, Krijgslaan 281-S1, 9000 Gent, Belgiumb Center for Nano- and Biophotonics (NB-Photonics), Ghent University, Belgiumc Delft University of Technology, Faculty of Applied Sciences, 2629 JB Delft, The Netherlands
a r t i c l e i n f o
Article history:
Received 10 August 2011
Received in revised form
12 October 2011
Accepted 21 October 2011Available online 4 November 2011
Keywords:
Persistent luminescence
Afterglow
Thermoluminescence
Trap filling
Nitrides
Rare earth
13/$ - see front matter & 2011 Elsevier B.V. A
016/j.jlumin.2011.10.022
esponding author at: LumiLab, Department o
ity, Krijgslaan 281-S1, 9000 Gent, Belgium. T
2 9 264 49 96.
ail address: [email protected] (P.F. Sme
a b s t r a c t
The evaluation of persistent phosphors is often focused on the processes right after the excitation, namely
on the shape of the afterglow decay curve and the duration of the afterglow, in combination with
thermoluminescence glow curve analysis. In this paper we study in detail the trap filling process in
europium-doped alkaline earth silicon nitrides (Ca2Si5N8:Eu, Sr2Si5N8:Eu and Ba2Si5N8:Eu), i.e., how the
persistent luminescence can be induced. Both the temperature at which the phosphors are excited and the
spectral distribution of the excitation light on the ability to store energy in the phosphors’ lattices are
investigated. We show that for these phosphors this storage process is thermally activated upon excitation
in the lower 5d excited states of Eu2þ , with the lowest thermal barrier for europium doped Ca2Si5N8. Also,
the influence of co-doping with thulium on the trap filling and afterglow behavior is studied. Finally there
exists a clear relation between the luminescence quenching temperature and the trap filling efficiency. The
latter relation can be utilized to select new efficient 5d–4f based afterglow phosphors.
& 2011 Elsevier B.V. All rights reserved.
1. Introduction
The emission intensity of most luminescent materials drops tozero in less than a second after ending the excitation. Somematerials, however, continue emitting light for minutes or evenhours after the end of the excitation, a phenomenon known aspersistent luminescence or afterglow. This continued light emis-sion without the need for a constant energy input is useful formany applications, the most notable being emergency signage [1],medical imaging [2], dials and displays, and decoration.
Persistent phosphors emitting in the red or orange region ofthe visible spectrum are strongly desired in emergency signage,for displaying warning or stop signs, and in medical imaging,where the phosphors’ emission should be situated in the opticalwindow of biological tissue [2,3]. Unfortunately, the large major-ity of known persistent luminescent materials are green (e.g.SrAl2O4:Eu,Dy [4]) or blue emitting (e.g. Sr2MgSi2O7:Eu,Dy [5]).The reason for this lack of efficient red persistent phosphors istwofold. Firstly, most persistent materials are based on oxideswith Eu2þ as the emitting ion [6], and it is difficult to achieve ared-shift in oxides that is large enough to obtain red Eu2þ
emission [7]. Secondly, the sensitivity of the human eye is lowerfor red light than it is for blue or green light. This effect is even
ll rights reserved.
f Solid State Sciences, Ghent
el.: þ32 9 264 43 53;
t).
more prominent at the low light intensity conditions typical forpersistent luminescence applications. Hence, for red persistentphosphors to have the same apparent brightness as green or blueones, they have to be considerably more efficient [8,9].
The second problem is inherent to human vision and cannot beevaded, but the first one can be tackled by choosing other hostmaterials. For example, red persistent luminescence has beenobserved in CaS:Eu,Tm [15] and Ca2SiS4:Eu,Nd [16,17]. Recently,the family of alkaline earth nitrido-silicates, M2Si5N8:Eu (M¼Ca,Sr, Ba) and their Tm-codoped variants were studied [10]. Thesematerials are much more stable than the aforementioned sulfidesand show a high quantum efficiency, which has led to extensiveresearch into their use as conversion phosphors in white LEDs[11,12,18–28]. Recently, orange and reddish persistent lumines-cence was reported in these compounds, most notably in Ca2Si5-
N8:Eu,Tm [10,13,14,18,29,30]. Key parameters for the steady-state photoluminescence and the persistent luminescence ofM2Si5N8:Eu(Tm) are given in Table 1.
A great advantage of these Eu2þ-doped nitride materials is theirvery broad excitation spectrum, extending well into the visiblerange. This is promising for indoor applications where (near-)UVlight is usually scarce, especially when lighting is based on phos-phor-converted LEDs. However, it does not necessarily mean thatthe persistent luminescence can also be obtained after exciting withvisible light. After all, while the (steady-state) photoluminescence iscaused by excited electrons in the Eu ions returning almostimmediately to the ground state, the persistent luminescence isdetermined by acceptor states in the band gap of the material acting

Table 1Key parameters for the photoluminescence and persistent luminescence in M2Si5N8:Eu, for low europium concentrations (1 M% or less). T1/2 is the
thermal quenching temperature, defined as the temperature for which the emission intensity has dropped to half of the low-temperature intensity.
The decay time is defined here as the time for the luminance to decrease to 0.32 mcd/m2 after excitation with a 1000 lx Xe arc source during 1 min.
Note: for the data marked with ‘#’ the excitation intensity and duration were not specified.
Ca2Si5N8:Eu Sr2Si5N8:Eu Ba2Si5N8:Eu Ref.
lem (nm) 610 620 580 [10]
Stokes shift (cm�1) 3800 (4000) 3700 (3700) 3500 (3400) [11], (this work)
T1/2 (K) 400 575 525 [12]
Band edge (nm) 250 265 280 [10]
Afterglow decay time (s) 150 80 400 [10]
(þTm: 2500) (þTm: 190) (þTm: 95) [13,14]
1200# 150#
(þTm: 3600)# (þTm: 500)#
Fig. 1. Schematic view of the experimental conditions for the study of the
influence of temperature during the excitation of persistent phosphors. See text
for further details.
P.F. Smet et al. / Journal of Luminescence 132 (2012) 682–689 683
as traps for the excited electrons, hereby delaying their return to theground state [6]. Because of these two distinct processes governingboth types of emission, it is not unlikely for the excitation spectrumof the steady-state photoluminescence to differ substantially fromthat of the persistent luminescence.
Thermoluminescence (TL) excitation spectroscopy is a conveni-ent way to study the excitation behavior of the persistent lumines-cence [31]. In this technique, a TL glow curve measurement isperformed for various (monochromatic) excitation wavelengths. Theintensity of the peaks appearing in the TL curves yields informationon the number of charge carriers trapped inside the material. If aglow peak appears for a specific excitation wavelength, we canconclude that the traps were filled by the excitation light, and hencethat persistent luminescence can be induced using this wavelength.If no glow peak appears, the traps could not be filled and nopersistent luminescence will be present either, even though thematerial might be fluorescent for this wavelength. When performingthese TL measurements for a large set of (evenly spread) excitationwavelengths, a TL excitation contour plot can be constructed, beinga two-dimensional plot of the TL emission intensity as a function ofexcitation wavelength and temperature. From these data an excita-tion spectrum can be extracted for the persistent luminescence, theso-called trap filling spectrum, by taking a cross-section at a certainglow peak or by integrating the total TL intensity for each excitationwavelength. This can then be compared to the excitation spectrumof the steady state photoluminescence. In this work we will showthat both types of spectra contain the same components, albeit witha different relative intensity. This is related to a thermal activationenergy, which is required to fill traps in the phosphor, at least whenexciting into the lowest 5d excited state.
2. Experimental setup
The powders were prepared using a solid state reaction at1400 1C for 3 h, under a reducing atmosphere (90% N2, 10% H2).For the host material, appropriate amounts of M3N2 (Alfa Aesarfor Ca3N2 (99%) and CERAC for Ba3N2 (99.7%) and Sr3N2 (99.5%))and a-Si3N4 (99.85%, Alfa Aesar) were mixed. To optimize thepersistent luminescence, a 2.5% deficit of Ca3N2 was used [10]. Forthe dopants, EuF3 and (if required) TmF3 (99.9%, Alfa Aesar) wereadded to the starting mixture. The powders were prepared with1 mol% of Eu and Tm (i.e. 1% substitution of the alkaline earthions). All materials were weighed, ground and mixed under aprotective N2 atmosphere in a glove box prior to the solid statereaction. After synthesis, all powders are stable under ambientatmosphere. X-ray diffraction measurements (not shown) con-firmed that the synthesized powders were crystalline, withoutthe presence of significant impurity phases. Only in the synthe-sized Ba2Si5N8:Eu powders we detected BaSi7N10 as an impurityphase. However, its bluish-green emission upon doping with Eu
was not detected in the emission spectrum nor in the afterglow,hence it does not affect the results presented below [32].
Thermoluminescence excitation spectra were obtained on thesetup described in detail in Ref. [31]. In brief, the setup consists ofthree parts. (i) a fiber-coupled grating monochromator in combina-tion with a Xe arc light source, which allows to direct monochromaticexcitation light towards the sample, (ii) a Risø Thermoluminescencereader (TL/OSL-DA-15) collecting the thermoluminescence glowcurves by means of (iii) a photomultiplier tube and suitable opticalfilters. The setup is fully automated and software controlled by a userinterface written in LabVIEWs. Typically, a measurement time of 8 hwas needed for the TL excitation contour plots shown in this work.All spectra were corrected for the wavelength-dependent opticaloutput of the excitation source. TL excitation contour plots werecollected with a heating rate of 5 K/s.
To study the influence of temperature on the trap filling ofpersistent phosphors, a dedicated experiment was conceived, shownin Fig. 1. A thermally emptied phosphor is first brought to tempera-ture Texc. At this temperature, the phosphor is excited by monochro-matic light during 30 s in the same setup as described above for theTL excitation measurements. At Texc, the afterglow is monitored by aPMT for 30 s. Then the sample is cooled, and a TL glow curve (heatingrate of 5 K/s) is collected. Due to the manual opening of the shutter infront of the PMT, the measurements of the afterglow did not start atexactly the same moment, but this does not compromise the results.
3. Results
3.1. Thermoluminescence excitation contour plots
Fig. 2 shows the thermoluminescence excitation contour plotsfor M2Si5N8:Eu phosphors (M¼Ca, Sr and Ba), without intention-ally added co-dopant(s). Each horizontal line in such a contourplot shows the TL glow curve obtained at a specific excitation

Fig. 2. Normalized TL excitation contour plots for M2Si5N8:Eu (M¼Ca, Sr, Ba) excited at room temperature.
Fig. 3. Normalized TL excitation contour plots for M2Si5N8:Eu,Tm (M¼Ca, Sr, Ba) excited at room temperature.
P.F. Smet et al. / Journal of Luminescence 132 (2012) 682–689684
wavelength. Each vertical cross-section shows a trap filling spectrum(obtained at a specific temperature). As described in Ref. [10], all theM2Si5N8:Eu phosphors show persistent luminescence to somedegree, with afterglow intensities in the order SroCaoBa. Uponexcitation of a thin phosphor layer with a 1000 lx Xe light source, theintensity drops already below 0.32 mcd/m2 after 1 (Sr) to 7 (Ba)minutes. For Ca2Si5N8:Eu we observe a broad range of excitationwavelengths which are able to fill traps in this phosphor (or putotherwise, to induce persistent luminescence, which is monitored byevaluating the TL emission). Two peaks can be discerned, one rangingfrom 250 to 350 nm, and a second one, albeit somewhat smaller,ranging from 375 to 525 nm. The shapes of the TL glow curves aresimilar irrespective of the excitation wavelength, with the TLintensity peaking near 75 1C. The glow curves are rather broad,extending to a relatively high temperature, which suggests thepresence of multiple trap depths. The TL curves extracted from theseTL excitation contour plots are discussed in more detail below.
For Sr2Si5N8:Eu, one observes a totally different behaviorcompared to Ca2Si5N8:Eu (Fig. 2). Excitation wavelengths below300 nm are required to efficiently fill traps in this phosphor, whileexcitation in the visible part of the spectrum does not lead tosignificant trap filling. The TL glow peak is even broader com-pared to Ca2Si5N8:Eu. For Ba2Si5N8:Eu an intermediate situation isobserved regarding the influence of the excitation wavelength,with excitation in the range from 250 to 350 nm being mostefficient, although the excitation band between 375 and 450 nmis not negligible. The rather well-defined TL glow curve shows amaximum at 78 1C.
In general, the afterglow intensity of persistent phosphors canbe enhanced by appropriately adding co-dopants [6]. Dysprosiumand neodymium are often used, as they increase the number oftrapping centers and/or lead to more suitable trap depths for aconsiderable fraction of the known Eu2þ-based persistent phos-phors. Nonetheless, the exact mechanism behind co-doping is stillunder debate [6].
The afterglow intensity of Ca2Si5N8:Eu phosphors can beincreased by a factor of 6 upon adding a small amount of Tm inthe synthesis reaction [10]. For Sr2Si5N8:Eu and Ba2Si5N8:Eu, theaddition of Tm leads to a slight decrease of the afterglow intensity[10]. To study this influence, TL excitation contour plots werecollected for all M2Si5N8:Eu,Tm compounds (Fig. 3). Compared tothe contour plots for M2Si5N8:Eu without the addition of Tm, theglobal picture regarding the position of the TL glow peaks and thesuitable excitation wavelengths remains the same, although aninteresting difference is observed in the broadness of the TL glowcurves, as will be discussed below.
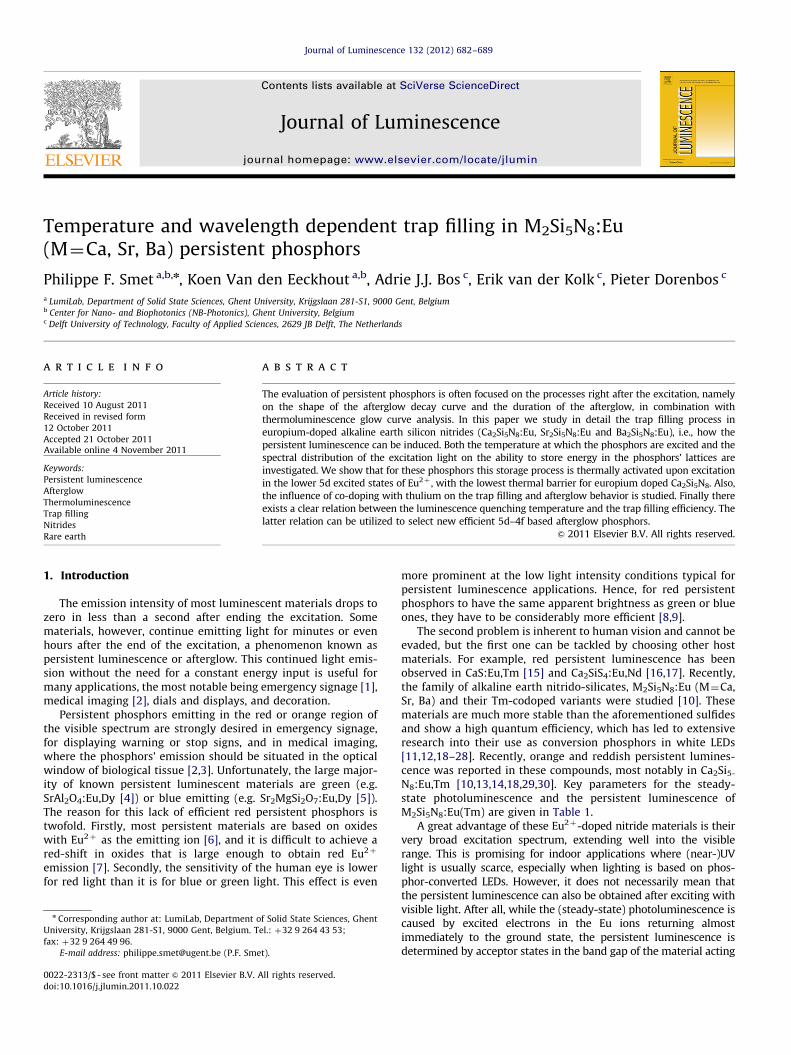
Fig. 4 shows the normalized TL glow curves for M2Si5N8:Eu andM2Si5N8:Eu,Tm, as obtained from the TL excitation contour plots. Itis clear that none of these TL spectra can be regarded as originatingfrom a single trap depth [33]. For the phosphors without Tm, the TLcurves are characterized by a peak at relatively low temperature(Ca: 75 1C, Sr: 95 1C, Ba: 78 1C) and, except for Ba2Si5N8:Eu, a second,less-defined contribution around 200–250 1C, which is too high forbeing relevant in the persistent luminescence. As mentioned before,the addition of Tm leads to narrower TL glow curves with a betterdefined glow peak. For Sr2Si5N8:Eu,Tm and Ba2Si5N8:Eu,Tm,
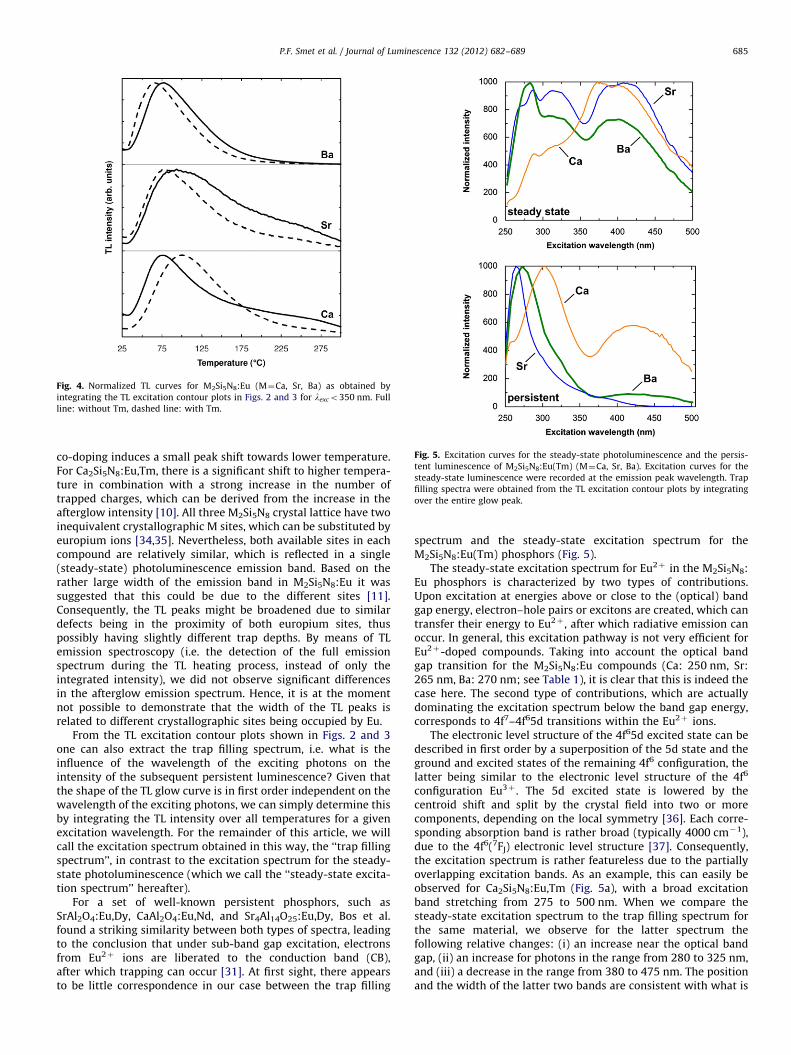
Fig. 4. Normalized TL curves for M2Si5N8:Eu (M¼Ca, Sr, Ba) as obtained by
integrating the TL excitation contour plots in Figs. 2 and 3 for lexco350 nm. Full
line: without Tm, dashed line: with Tm.
Fig. 5. Excitation curves for the steady-state photoluminescence and the persis-
tent luminescence of M2Si5N8:Eu(Tm) (M¼Ca, Sr, Ba). Excitation curves for the
steady-state luminescence were recorded at the emission peak wavelength. Trap
filling spectra were obtained from the TL excitation contour plots by integrating
over the entire glow peak.
P.F. Smet et al. / Journal of Luminescence 132 (2012) 682–689 685
co-doping induces a small peak shift towards lower temperature.For Ca2Si5N8:Eu,Tm, there is a significant shift to higher tempera-ture in combination with a strong increase in the number oftrapped charges, which can be derived from the increase in theafterglow intensity [10]. All three M2Si5N8 crystal lattice have twoinequivalent crystallographic M sites, which can be substituted byeuropium ions [34,35]. Nevertheless, both available sites in eachcompound are relatively similar, which is reflected in a single(steady-state) photoluminescence emission band. Based on therather large width of the emission band in M2Si5N8:Eu it wassuggested that this could be due to the different sites [11].Consequently, the TL peaks might be broadened due to similardefects being in the proximity of both europium sites, thuspossibly having slightly different trap depths. By means of TLemission spectroscopy (i.e. the detection of the full emissionspectrum during the TL heating process, instead of only theintegrated intensity), we did not observe significant differencesin the afterglow emission spectrum. Hence, it is at the momentnot possible to demonstrate that the width of the TL peaks isrelated to different crystallographic sites being occupied by Eu.
From the TL excitation contour plots shown in Figs. 2 and 3one can also extract the trap filling spectrum, i.e. what is theinfluence of the wavelength of the exciting photons on theintensity of the subsequent persistent luminescence? Given thatthe shape of the TL glow curve is in first order independent on thewavelength of the exciting photons, we can simply determine thisby integrating the TL intensity over all temperatures for a givenexcitation wavelength. For the remainder of this article, we willcall the excitation spectrum obtained in this way, the ‘‘trap fillingspectrum’’, in contrast to the excitation spectrum for the steady-state photoluminescence (which we call the ‘‘steady-state excita-tion spectrum’’ hereafter).
For a set of well-known persistent phosphors, such asSrAl2O4:Eu,Dy, CaAl2O4:Eu,Nd, and Sr4Al14O25:Eu,Dy, Bos et al.found a striking similarity between both types of spectra, leadingto the conclusion that under sub-band gap excitation, electronsfrom Eu2þ ions are liberated to the conduction band (CB),after which trapping can occur [31]. At first sight, there appearsto be little correspondence in our case between the trap filling
spectrum and the steady-state excitation spectrum for theM2Si5N8:Eu(Tm) phosphors (Fig. 5).
The steady-state excitation spectrum for Eu2þ in the M2Si5N8:Eu phosphors is characterized by two types of contributions.Upon excitation at energies above or close to the (optical) bandgap energy, electron–hole pairs or excitons are created, which cantransfer their energy to Eu2þ , after which radiative emission canoccur. In general, this excitation pathway is not very efficient forEu2þ-doped compounds. Taking into account the optical bandgap transition for the M2Si5N8:Eu compounds (Ca: 250 nm, Sr:265 nm, Ba: 270 nm; see Table 1), it is clear that this is indeed thecase here. The second type of contributions, which are actuallydominating the excitation spectrum below the band gap energy,corresponds to 4f7–4f65d transitions within the Eu2þ ions.
The electronic level structure of the 4f65d excited state can bedescribed in first order by a superposition of the 5d state and theground and excited states of the remaining 4f6 configuration, thelatter being similar to the electronic level structure of the 4f6
configuration Eu3þ . The 5d excited state is lowered by thecentroid shift and split by the crystal field into two or morecomponents, depending on the local symmetry [36]. Each corre-sponding absorption band is rather broad (typically 4000 cm�1),due to the 4f6(7FJ) electronic level structure [37]. Consequently,the excitation spectrum is rather featureless due to the partiallyoverlapping excitation bands. As an example, this can easily beobserved for Ca2Si5N8:Eu,Tm (Fig. 5a), with a broad excitationband stretching from 275 to 500 nm. When we compare thesteady-state excitation spectrum to the trap filling spectrum forthe same material, we observe for the latter spectrum thefollowing relative changes: (i) an increase near the optical bandgap, (ii) an increase for photons in the range from 280 to 325 nm,and (iii) a decrease in the range from 380 to 475 nm. The positionand the width of the latter two bands are consistent with what is

Fig. 7. Influence of excitation wavelength (lexc) and temperature during the
excitation (Texc) on the afterglow intensity and TL glow curve of Ca2Si5N8:Eu,Tm.
P.F. Smet et al. / Journal of Luminescence 132 (2012) 682–689686
expected for the transitions from the ground state to the (crystalfield split) 4f65d configuration. Hence, it is less efficient to createtrapped charges in this phosphor upon excitation via the lower 5dexcited states of Eu2þ .
For Ba2Si5N8:Eu and Sr2Si5N8:Eu, transitions near the bandedge now dominate the trap filling spectrum. Illuminating thepersistent phosphors with wavelengths longer than 400 nm ismuch less efficient in the case of Ba2Si5N8:Eu, while for Sr2Si5N8:Euthe trap filling is almost negligible.
In conclusion, we can say that the trap filling spectra for theM2Si5N8:Eu(Tm) phosphors show certain similarities with thesteady state excitation spectra, as the same excitation bands arepresent in both type of spectra, but that the relative contributionof the different pathways (i.e. to the lower and higher 5d states,and near the band-gap) is changed.
3.2. Temperature dependence of trap filling
The influence of temperature during excitation of the phos-phors (trap filling temperature, Texc) on the trap filling efficiencyin M2Si5N8:Eu(Tm) was also evaluated, using the experimentalconditions described in Fig. 1. We limited ourselves to the twophosphors with the highest afterglow intensity, namely Ba2Si5N8:Euand Ca2Si5N8:Eu,Tm.
Upon excitation of Ba2Si5N8:Eu at 285 nm, increasing thetemperature at which the excitation is performed leads to asimilar afterglow intensity, but the afterglow occurs faster(Fig. 6). Regarding the thermoluminescence glow curve, only thedeeper traps remain filled after the excitation at elevated tem-perature, resulting in a shift of the TL glow peak towards highertemperatures. These observations for the afterglow and the TLspectrum are in line with what can be expected for a phosphorwith multiple trap depths. When using 420 nm as the excitationlight, i.e. in the energetically lower 5d excited state of Eu2þ , thesituation is dramatically changed. Upon increasing the tempera-ture during the excitation, the afterglow increases monotonically,with about a fivefold increase when excited at 80 1C compared toroom temperature. Regarding the TL glow curve, the intensity ofthe glow peaks is strongly increased after excitation at increasedtemperature, indicating that significantly more charges were
Fig. 6. Influence of excitation wavelength (lexc) and temperature during the
excitation (Texc) on the afterglow intensity and TL glow curve of Ba2Si5N8:Eu.
trapped in the phosphor. Nevertheless, the position of the glowpeaks is very similar in comparison with the experiment per-formed with an excitation wavelength of 285 nm, suggesting thatthe same trap states are accessed, independently of the excitationwavelength. Clearly, filling trap states upon excitation into thelower 5d state of Eu2þ is a thermally activated process.
For Ca2Si5N8:Eu,Tm, the picture (Fig. 7) is rather similar forexcitation at 310 nm to the one for Ba2Si5N8:Eu (Fig. 6). Uponexcitation at 420 nm, into the lower 5d states of Eu2þ , oneobserves an increase of the occupation of deep traps. However,the influence of temperature during the excitation is considerablyless compared to Ba2Si5N8:Eu, pointing at a much lower thermalactivation energy for trapping.
The results for Ca2Si5N8:Eu (not shown) are similar to the onesfor Ca2Si5N8:Eu,Tm.
4. Discussion
From the above presented results, it is clear that thermolumi-nescence excitation spectroscopy is indeed a versatile technique tostudy persistent phosphors [31], especially if the temperature can bevaried at which the excitation is performed. From the thermolumi-nescence excitation contour plots shown in Figs. 2 and 3 the trapfilling spectra were derived, describing which wavelengths caninduce persistent luminescence (Fig. 5).
For all studied M2Si5N8:Eu phosphors, the trap filling spectrumdeviates from the steady-state excitation spectrum. Nevertheless,the same components (band gap excitation, higher and lower 5dlevels) are observed in both types of spectra, albeit with a differentrelative intensity. Excitation of Eu2þ to the lower 4f65d state is lesslikely to lead to energy storage in the lattice compared to excitationto the higher 5d states. The ability to induce persistent luminescencein the M2Si5N8:Eu phosphors upon excitation with visible lightdecreases in the order Ca4Ba4Sr. Excitation with photon energiesclose to or larger than the band gap leads to rather efficient energystorage, possibly due to the immediate trapping of the electron inthe traps, while the hole is being captured by Eu2þ , thereby formingEu3þ . The relatively low output of the excitation light source in therange from 250 to 270 nm, although being corrected for, could
P.F. Smet et al. / Journal of Luminescence 132 (2012) 682–689 687
deform somewhat the trap filling spectrum in this wavelengthregion. Therefore, we will now focus on excitation with sub bandgap energy.
In YAG:Ce,Yb a similar observation regarding the trap filling wasmade. In the case of Ce3þ , the excitation bands are much narrowercompared to Eu2þ , and are therefore easier to separate. Excitationvia the lowest 5d level (5d1) leads to strong photoluminescence, butnot to the filling of traps, even not upon heating the sample duringthe excitation to 140 1C [38]. This behavior was explained based onthe positions of the 5d excited states with respect to the conductionband, which the lowest 5d excited state lying relatively far belowthe bottom of the conduction band.
For Ca2Si5N8:Eu,Tm, our observations on the trap filling are inline with those of Lei et al., who recently studied the trap filling ofCa2Si5N8:Eu,Tm in the wavelength range from 240 to 500 nm,with a relatively large step size of 20 nm [13]. With the setupused in this work, we obtained a much higher spectral resolution,more clearly resolving the different excitation bands. Qualita-tively, the same results are obtained, i.e. a higher efficiency underexcitation with UV light compared to excitation in the visibleregion [13].
The persistent luminescence in Sr2Si5N8:Eu,Tm was studiedrecently by Teng et al. [14], although we cannot compare thethermoluminescence in this paper to our results, as only thermo-luminescence glow curves starting above 500 K were shown,which is above the temperature region relevant for the afterglow.Teng et al. also reported that the afterglow intensity increased forthe addition of Tm to Sr2Si5N8:Eu, although no influence of the Tmconcentration on the afterglow intensity was observed (studiedfrom 0.5 to 7.5 M percent). In our case, the addition of Tm slightlyincreases the afterglow intensity. Given that the trap depthdecreases upon co-doping (Fig. 4), the density of traps is pre-sumably somewhat increased by the addition of Tm.
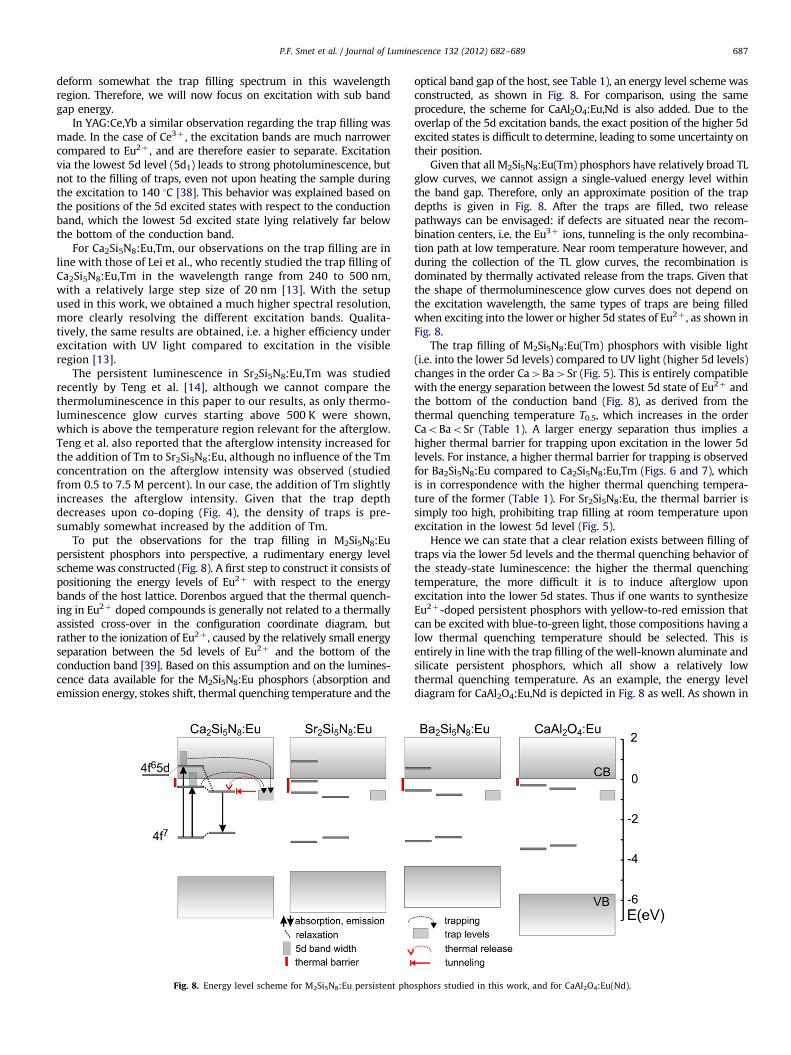
To put the observations for the trap filling in M2Si5N8:Eupersistent phosphors into perspective, a rudimentary energy levelscheme was constructed (Fig. 8). A first step to construct it consists ofpositioning the energy levels of Eu2þ with respect to the energybands of the host lattice. Dorenbos argued that the thermal quench-ing in Eu2þ doped compounds is generally not related to a thermallyassisted cross-over in the configuration coordinate diagram, butrather to the ionization of Eu2þ , caused by the relatively small energyseparation between the 5d levels of Eu2þ and the bottom of theconduction band [39]. Based on this assumption and on the lumines-cence data available for the M2Si5N8:Eu phosphors (absorption andemission energy, stokes shift, thermal quenching temperature and the
Fig. 8. Energy level scheme for M2Si5N8:Eu persistent pho
optical band gap of the host, see Table 1), an energy level scheme wasconstructed, as shown in Fig. 8. For comparison, using the sameprocedure, the scheme for CaAl2O4:Eu,Nd is also added. Due to theoverlap of the 5d excitation bands, the exact position of the higher 5dexcited states is difficult to determine, leading to some uncertainty ontheir position.
Given that all M2Si5N8:Eu(Tm) phosphors have relatively broad TLglow curves, we cannot assign a single-valued energy level withinthe band gap. Therefore, only an approximate position of the trapdepths is given in Fig. 8. After the traps are filled, two releasepathways can be envisaged: if defects are situated near the recom-bination centers, i.e. the Eu3þ ions, tunneling is the only recombina-tion path at low temperature. Near room temperature however, andduring the collection of the TL glow curves, the recombination isdominated by thermally activated release from the traps. Given thatthe shape of thermoluminescence glow curves does not depend onthe excitation wavelength, the same types of traps are being filledwhen exciting into the lower or higher 5d states of Eu2þ , as shown inFig. 8.
The trap filling of M2Si5N8:Eu(Tm) phosphors with visible light(i.e. into the lower 5d levels) compared to UV light (higher 5d levels)changes in the order Ca4Ba4Sr (Fig. 5). This is entirely compatiblewith the energy separation between the lowest 5d state of Eu2þ andthe bottom of the conduction band (Fig. 8), as derived from thethermal quenching temperature T0.5, which increases in the orderCaoBaoSr (Table 1). A larger energy separation thus implies ahigher thermal barrier for trapping upon excitation in the lower 5dlevels. For instance, a higher thermal barrier for trapping is observedfor Ba2Si5N8:Eu compared to Ca2Si5N8:Eu,Tm (Figs. 6 and 7), whichis in correspondence with the higher thermal quenching tempera-ture of the former (Table 1). For Sr2Si5N8:Eu, the thermal barrier issimply too high, prohibiting trap filling at room temperature uponexcitation in the lowest 5d level (Fig. 5).
Hence we can state that a clear relation exists between filling oftraps via the lower 5d levels and the thermal quenching behavior ofthe steady-state luminescence: the higher the thermal quenchingtemperature, the more difficult it is to induce afterglow uponexcitation into the lower 5d states. Thus if one wants to synthesizeEu2þ-doped persistent phosphors with yellow-to-red emission thatcan be excited with blue-to-green light, those compositions having alow thermal quenching temperature should be selected. This isentirely in line with the trap filling of the well-known aluminate andsilicate persistent phosphors, which all show a relatively lowthermal quenching temperature. As an example, the energy leveldiagram for CaAl2O4:Eu,Nd is depicted in Fig. 8 as well. As shown in
sphors studied in this work, and for CaAl2O4:Eu(Nd).
P.F. Smet et al. / Journal of Luminescence 132 (2012) 682–689688
Ref. [31], the trap filling spectrum of CaAl2O4:Eu,Nd is very similar tothe steady state excitation spectrum, pointing at the proximity of thelowest 5d excited state to the bottom of the conduction band and theabsence of a thermal barrier for trapping (at least around roomtemperature). Fully in line with our statement about the relationbetween the thermal quenching and the trap filling, CaAl2O4:Eu,Ndhas a thermal quenching temperature of 370 K. Similarly, quenchingtemperatures of 410 and 305 K have been reported for SrAl2O4:Euand Sr2MgSi2O7:Eu, respectively [39]. Obviously, the thermalquenching temperature should not be too low (e.g. near or belowroom temperature), as in that case the afterglow intensity is stronglyreduced, due to increased probability for non-radiative recombina-tion when trapped electrons are released.
A similar relationship between the ionization of (5d–4f)dopants and the luminescence thermal quenching behavior wasreported by van der Kolk et al. in the case of Lu2SiO5:Ce3þ [40]and GdAlO3:Ce3þ [41] single crystals by means of photoconduc-tivity measurements. Upon excitation into the lower 5d excitedstates of Ce3þ , lying clearly below the bottom of the CB, a thermalbarrier has to be overcome for ionization to occur. The barrierheight is similar to the activation energy governing the thermalquenching of the Ce3þ luminescence, clearly coupling bothprocesses. For excitation in the higher 5d excited states of Ce3þ ,lying in the CB, a significant photocurrent is observed at lowtemperature, due to immediate ionization after excitation.
The exact influence of Tm as co-dopant in M2Si5N8:Eu phos-phors on the defects and the afterglow behavior is not very clearand its study is out of the scope of this paper. In all phosphors, theaddition of Tm leads to a narrower trap depth distribution,judging on the width of the TL glow peaks. This could point at astabilizing role for the co-dopants, favoring the occurrence ofspecific defect centers. For the Sr and Ba compound, slightlyshallower traps are formed, while for Ca2Si5N8:Eu the TL glowpeak shifts to higher temperature, indicating higher trap depths.Also, the addition of Tm does not significantly alter the trapfilling, i.e. the Tm ions do not appear to influence the trappingpathway, which is in line with our conclusions that this occurs viathe 5d levels of Eu2þ . Finally, the possibility that Tm3þ ions act asthe trapping centers (thereby forming Tm2þ), in correspondenceto the situation in e.g. YPO4:Ce,RE [42], cannot be confirmed norrejected at this stage. Recently, no valence state change upontrapping was observed for Dy3þ in SrAl2O4:Eu2þ ,Dy3þ [43].Surely, further research into the physical and chemical nature ofthe trap states is required.
Studying the influence of the temperature and the spectraldistribution of the excitation light on the trap filling of persistentphosphors is not only interesting for getting a better grasp of thetrapping mechanism, it is also relevant from an application pointof view. When using persistent phosphors as emergency signage,they should ideally show equal performance in a wide tempera-ture range and by excitation with ambient light. Obviously,having phosphors with a thermally activated trapping process isnot favorable near room temperature, as this will deteriorate theafterglow brightness when being illuminated at relatively lowtemperature, as is the case to certain extent for the M2Si5N8:Euphosphors. Also, the phosphors should be excitable by ambientlight, irrespective of it being daylight (containing a lot of near UVlight) or artificial lighting. Especially, upon replacing incandescentand fluorescent lamps by phosphor-converted LEDs (light-emit-ting diodes) the amount of short-wavelength radiation, say below450 nm, is strongly reduced [44]. Hence, it is not guaranteed thatthe overlap between the emission spectrum of the LED and thetrap filling spectrum of the persistent phosphor is sufficientlylarge. Therefore, the often used evaluation procedure, using a Xearc lamp as an excitation source at room temperature, is certainlyuseful, but might not give a very accurate description of the
performance of persistent phosphors in real life applications.Although the trap filling of Ca2Si5N8:Eu,Tm is somewhat tem-perature dependent, it can very efficiently be excited with a largefraction of the visible spectrum. This is a clear advantage overEu3þ-based or Mn2þ-based phosphors, which require mostly UVexcitation, unless efficient sensitizers can be used. Compared toCr3þ-doped phosphors, which show emission at the very edge ofthe visible spectrum, the orange emission in Ca2Si5N8:Eu,Tm isstill in a wavelength range where the eye sensitivity is reasonablyhigh. Further tuning of the synthesis conditions and the composi-tion of this phosphor material is however required to enhance theafterglow intensity.
5. Conclusions
In this work we used thermoluminescence excitation spectro-scopy to study the trap filling behavior in M2Si5N8:Eu(Tm)persistent phosphors, in combination with a study on the influ-ence of temperature during the excitation. We showed that thetraps relevant for the afterglow can be filled after excitation intothe 5d energy levels of the Eu2þ dopants. For excitation into thelower 5d levels, a thermal barrier is present before trapping canoccur, while this is not the case upon excitation into the higher 5dlevels. The thermal barrier depends on the composition, withCa2Si5N8:Eu,Tm being the phosphor with the highest afterglowintensity and the lowest thermal barrier upon excitation withvisible light. This thermal barrier for the trap filling was related tothe position of the 5d excited states with respect to the conduc-tion band of the host lattice. We concluded that the quest forEu2þ-based long-wavelength persistent phosphors should focuson those compounds having a relatively low thermal quenchingtemperature, as this facilitates trap filling of the phosphors withvisible light.
Acknowledgments
PFS is indebted to the Fund for Scientific Research – Flanders(FWO-Vlaanderen) for a Mobility Grant to TU Delft. KVdE is aResearch Assistant for the BOF-UGent. Dirk Poelman is kindlyacknowledged for fruitful discussions.
References
[1] M. Saito, N. Adachi, H. Kondo, Opt. Express 15 (2007) 1621.[2] Q. le Masne de Chermont, C. Chaneac, J. Seguin, F. Pelle, S. Maıtrejean,
J.-P. Jolivet, D. Gourier, M. Bessodes, D. Scherman, Proc. Natl. Acad. Sci. 104(2007) 9266.
[3] T. Maldiney, C. Richard, J. Seguin, N. Wattier, M. Bessodes, D. Scherman, ACSNano 5 (2011) 854.
[4] T. Matsuzawa, Y. Aoki, N. Takeuchi, Y. Murayama, J. Electrochem. Soc. 143(1996) 2670.
[5] Y. Lin, Z. Tang, Z. Zhang, X. Wang, J. Zhang, J. Mater. Sci. Lett. 20 (2001) 1505.[6] K. Van den Eeckhout, P.F. Smet, D. Poelman, Materials 3 (2010) 2536.[7] P. Dorenbos, J. Lumin. 104 (2003) 239.[8] D. Poelman, N. Avci, P.F. Smet, Opt. Express 17 (2009) 358.[9] D. Poelman, P.F. Smet, Opt. Express 18 (2010) 26293.
[10] K. Van den Eeckhout, P.F. Smet, D. Poelman, Materials 4 (2011) 980.[11] Y.Q. Li, J.E.J. van Steen, J.W.H. van Krevel, G. Botty, A.C.A. Delsing, F.J. DiSalvo,
G. de With, H.T. Hintzen, J. Alloys Compd. 417 (2006) 273.[12] H.-L. Li, R.-J. Xie, N. Hirosaki, T. Takeda, G.-H. Zhou, Int. J. Appl. Ceram.
Technol. 6 (2009) 459.[13] B. Lei, K.-I. Machida, T. Horikawa, H. Hanzawa, N. Kijima, Y. Shimomura,
H. Yamamoto, J. Electrochem. Soc. 157 (2010) J196.[14] X. Teng, Y. Liu, Y. Liu, Y. Hu, H. He, W. Zhuang, J. Lumin. 130 (2010) 851.[15] D. Jia, W. Jia, D.R. Evans, W.M. Dennis, H. Liu, J. Zhu, W.M. Yen, J. Appl. Phys.
88 (2000) 3402.[16] P.F. Smet, N. Avci, D. Poelman, J. Electrochem. Soc. 156 (2009) H243.[17] P.F. Smet, I. Moreels, Z. Hens, D. Poelman, Materials 3 (2010) 2834.[18] H.A. Hoppe, H. Lutz, P. Morys, W. Schnick, A. Seilmeier, J. Phys. Chem. Solids
61 (2000) 2001.

P.F. Smet et al. / Journal of Luminescence 132 (2012) 682–689 689
[19] H.-L. Li, R.-J. Xie, N. Hirosaki, Y. Yajima, J. Electrochem. Soc. 155 (2008)J378.
[20] Y.Q. Li, G. de With, H.T. Hintzen, J. Solid State Chem. 181 (2008) 515.[21] R. Mueller-Mach, G. Mueller, M.R. Krames, H.A. Hoppe, F. Stadler, W. Schnick,
T. Juestel, P. Schmidt, Phys. Status Solidi (A) 202 (2005) 1727.[22] X. Piao, T. Horikawa, H. Hanzawa, K.-I. Machida, Appl. Phys. Lett. 88 (2006)
161908.[23] X. Piao, T. Horikawa, H. Hanzawa, K.-I. Machida, J. Electrochem. Soc. 153
(2006) H232.[24] X. Piao, K.-I. Machida, T. Horikawa, H. Hanzawa, Appl. Phys. Lett. 91 (2007)
041908.[25] W. Xiao-Dan, C. Li-Yan, L. Fa-Chun, C. Xiao-Long, C. Xue-Yuan, L. Quan-Lin,
Chin. Phys. B 18 (2009) 3555.[26] R.-J. Xie, N. Hirosaki, T. Suehiro, F.-F. Xu, M. Mitomo, Chem. Mater. 18 (2006)
5578.[27] M. Zeuner, F. Hintze, W. Schnick, Chem. Mater. 21 (2009) 336.[28] M. Zeuner, P.J. Schmidt, W. Schnick, Chem. Mater. 21 (2009) 2467.[29] Y. Miyamoto, H. Kato, Y. Honna, H. Yamamoto, K. Ohmi, J. Electrochem. Soc.
156 (2009) J235.[30] K. Van den Eeckhout, P.F. Smet, D. Poelman, J. Lumin. 129 (2009) 1140.
[31] A.J.J. Bos, R.M. van Duijvenvoorde, E. van der Kolk, W. Drozdowski, P. Dorenbos,J. Lumin. 131 (2011) 1465.
[32] Y.Q. Li, A.C.A. Delsing, R. Metslaar, G. de With, H.T. Hintzen, J. Alloys Compd.487 (2009) 28.
[33] A.J.J. Bos, Radiat. Meas. 41 (2006) S45.[34] T. Schlieper, W. Milius, W. Schnick, Z. Anorg. Allg. Chem. 621 (1995) 1380.[35] T. Schlieper, W. Schnick, Z. Anorg. Allg. Chem. 621 (1995) 1037.[36] P. Dorenbos, J. Phys.-Condens. Matter 15 (2003) 4797.[37] J.E. Van Haecke, P.F. Smet, D. Poelman, J. Lumin. 126 (2007) 508.[38] F.T. You, A.J.J. Bos, Q.F. Shi, S.H. Huang, P. Dorenbos, J. Phys.-Condens. Matter
23 (2011) 6.[39] P. Dorenbos, J. Phys.-Condens. Matter 17 (2005) 8103.[40] E. van der Kolk, S.A. Basun, G.F. Imbusch, W.M. Yen, Appl. Phys. Lett. 83
(2003) 1740.[41] E. van der Kolk, P. Dorenbos, J.T.M. de Haas, C.W.E. van Eijk, Phys. Rev. B 71
(2005).[42] A.J.J. Bos, P. Dorenbos, A. Bessiere, B. Viana, Radiat. Meas. 43 (2008) 222.[43] K. Korthout, K. Van den Eeckhout, J. Botterman, S. Nikitenko, D. Poelman,
P.F. Smet, Phys. Rev. B 84 (2011) 085140.[44] P.F. Smet, A.B. Parmentier, D. Poelman, J. Electrochem. Soc. 158 (2011) R37.

![Small anisotropy, weak thermal fluctuations, and high field superconductivity in Co-doped iron pnictide Ba(Fe[sub 1−x]Co[sub x])[sub 2]As[sub 2]](https://static.fdokumen.com/doc/165x107/633cc1de7000aa173d0630af/small-anisotropy-weak-thermal-fluctuations-and-high-field-superconductivity-in.jpg)


![Structural and thermoelectric properties of Bi[sub 2]Sr[sub 2]Co[sub 2]O[sub y] thin films on LaAlO[sub 3] (100) and fused silica substrates](https://static.fdokumen.com/doc/165x107/634467196cfb3d406409325f/structural-and-thermoelectric-properties-of-bisub-2srsub-2cosub-2osub-y.jpg)