Food gels filled with emulsion droplets - WUR eDepot
246
Food gels filled with emulsion droplets Linking large deformation properties to sensory perception Guido Sala
-
Upload
khangminh22 -
Category
Documents
-
view
1 -
download
0
Transcript of Food gels filled with emulsion droplets - WUR eDepot

Food gels filled with emulsion droplets
Linking large deformation properties to sensory perception
Guido Sala

Structure and Functionality The ‘Structure and Functionality’ program aims at elucidating how the sensory
characteristics and the stability of foods are related to the molecular properties of food
constituents and their mesoscopic interactions and structures.
The research described in this thesis was part of both WCFS projects ‘Engineered
Textures of Emulsions and Foams’ and ‘Dynamics of biopolymer networks and textures’.
Project Engineered Textures of Emulsions and Foams The aim of this project was to provide the industry with tools to simultaneously control the
oral perception and the stability of compound food products. To this end, mechanistic
knowledge was developed on factors and processes that determine the behaviour of
emulsions and foams in the mouth, and how this behaviour translates to perception.
Project Dynamics of biopolymer networks and textures The long-term goal of this project was to enable the industry to design and manufacture
microstructures responsible for specific mouth-feel performance and stability of semi-solid
composite food products, based on biopolymer networks. Material and mechanical
properties of semi-solid foods and ingredients were related to sensory attributes. The
research followed two approaches: the first was related to the identification of parameters
having an impact on the oral perception of the food product. The other research line
focussed on enabling these parameters to become engineered in food products, such that
they become available during oral processing.

Food gels filled with emulsion droplets
Linking large deformation properties to sensory perception
Guido Sala

WCFS publication, Programme Structure and Functionality, No. 43 (2007)
Also published as PhD Thesis, Wageningen University (2007)
ISBN: 978-90-8504-832-9

Ter nagedachtenis van Margreet van der Marel-Begeman


Guido Sala (2007)
Food gels filled with emulsion droplets
Linking large deformation properties to sensory perception
Key words: polymer gels, particle gels, emulsion, large deformation, friction, sensory
Abstract
This thesis reports studies on the large deformation and lubrication properties of emulsion-
filled gels and the way these properties are related to the sensory perception of the gels.
The design of the studies included polymer and particle gels containing oil droplets of
which the interaction with the gel matrix was varied, resulting in droplets either bound or
unbound to the matrix. The unique combination of gel matrices and droplet-matrix
interactions allowed to obtain a representative overview of the effect of the oil droplets on
the properties studied.
The molecular properties of the gel matrices determined the way the large
deformation properties of the gels depended on the deformation speed. Polymer gels
showed a predominantly elastic behaviour. Particle gels showed a more viscoelastic
behavior. The effect of the oil content on the Young’s modulus of the gels was modulated
by the droplet-matrix interactions, in agreement with existing theories. Bound droplets
increased the Young’s modulus of the filled gels, whereas unbound droplets decreased it.
Oil droplets embedded in the gel matrix acted as stress concentration nuclei. They also
increased energy dissipation due to friction between structural elements of the gel (oil
droplets and gel matrix). Stress concentration resulted in a decrease of the fracture strain
for all gels and in a decrease of the fracture stress for polymer gels. For gels with non-
aggregated bound droplets, a reduction in oil droplet size had the same effect on their
rheological properties as an increase in oil volume fraction.
The lubrication properties of the gels strongly depended on both the molecular and
functional properties of the gel matrix and the oil content. For each type of gel matrix, the
lubrication behaviour was affected by the ‘apparent viscosity’ of the broken gels, which in
turn depended on the droplet-matrix interactions.
The sensory perception of emulsion-filled gels appeared to be dominated by the
properties of the gel matrix and by the oil content. Polymer gels were perceived as more
melting, whereas particle gels were perceived as more rough. With increasing oil content
both types of gels became more creamy and spreadable. The increase in spreadability and
part of the increase in creaminess could be explained with the effect of the oil droplets on
the breakdown properties of the gels. Since for all gels the scores for creaminess increased
with increasing oil content, the release of oil droplets during oral processing could not
completely explain the perception of oil-related sensory attributes. It is therefore
concluded that the perception of these attributes is mediated by the lubrication properties
of the broken gel. The large deformation and lubrication behaviour of the gels were the
most important parameters related to sensory perception. Both parameters were affected
by the droplet-matrix interaction. As a matter of fact, the droplet-matrix interaction
affected the fracture behaviour of the filled gels, which was related to their spreadability,
and the ‘apparent viscosity’ of the broken gels, which controlled the lubrication properties
of these systems.

Table of contents
Page
Chapter 1 Introduction 1
Chapter 2 Gelation of emulsions stabilised by whey protein 21
aggregates
Chapter 3 Effect of droplet-matrix interactions on large 47
deformation properties of emulsion-filled gels
Chapter 4 Effect of matrix properties on the sensory 77
perception of emulsion-filled gels
Chapter 5 Deformation and fracture of emulsion-filled gels. 101
Effect of oil content and deformation speed.
Chapter 6 Deformation and fracture of emulsion-filled gels. 137
Effect of gelling agent concentration and oil droplet size.
Chapter 7 Oil droplet release from emulsion-filled gels in 165
relation to sensory perception
Chapter 8 Effect of droplet-matrix interactions on the 185
lubrication properties of sheared emulsion-filled gels
Summary and conclusive remarks 211
Samenvatting en slotopmerkingen 219
Dankwoord 227
List of publications 231
Curriculum vitae 233
Educational activities 235


Chapter 1
Introduction

Chapter 1
1.1 Food gels filled with emulsion droplets
A gel can be described as ‘a continuous network of macroscopic dimensions immersed in
a liquid medium and exhibiting no steady-state flow’ (Ziegler & Foegeding, 1990). This
definition applies to many different foods. Flory (1974) classified gels into four categories
on the basis of the structural elements of the continuous network:
1. Well-ordered lamellar structures.
2. Covalent polymer networks.
3. Polymer networks formed through physical aggregation.
4. Particulate, disordered structures.
The first class comprises inorganic gels from clays or other minerals and soap gels.
Good examples of covalent polymer gels are polyacrylamide gels and vulcanised rubbers.
Into the third class fall physical gels of entangled polymers, like gelatine and carrageenan
gels. Particulate (or particle) gels consist of clusters of aggregated particles forming a
continuous structure throughout the enclosing volume. Milk protein gels fall into this
class. Only the last two classes of gels are of relevance for food products.
A typical characteristic of foods is their complexity, due to the presence of many
different components and ingredients. Several food products can be described as gels
filled with emulsion droplets (or emulsion-filled gels). Milk is an emulsion of fat globules
in a colloidal suspension of casein micelles. Many different food products of the food
industry are based on the gelation of milk, resulting in a continuous matrix of
interconnected swollen casein particles entrapping dispersed fat globules. Each application
makes use of a specific physicochemical gelation mechanism. In cheese-making, gelation
is achieved by the enzymatic activity of rennet, which causes the removal of the
hydrophilic moiety of -casein. This results in the aggregation of casein by hydrophobic
and Van der Waals interactions (Sandra, Alexander & Dalgleish, 2007). Not only fresh
curd, but also cheese, the end product derived from further processing of curd, can be
described as a (strong) gel containing dispersed fat globules. In the production of yoghurt
and other acidified dairy products, inorganic calcium phosphate gradually dissolves as the
pH of milk decreases from the natural value of 6.7 (Donato, Alexander & Dalgleish,
2007). Furthermore, as the pH decreases the surface charges of the casein micelles are
protonated. This causes the collapse of the hydrophilic moiety of -casein, which results in
2

Introduction
the destabilisation of the casein colloidal suspension and, eventually, in milk gelation. In
several dairy desserts, polymers like gelatin or -carrageenan are added as ingredients.
These desserts usually contain dairy cream and can therefore be described as emulsion-
filled gels. Examples of these products are Bavarois desserts and other kinds of dairy
desserts, both whipped of non-whipped. For these products gelation does not involve
physicochemical changes of the casein micelles suspension, but it is the result of the sol-
gel transition occurring as the temperature of the system is decreased after dissolution of
the polymer (Walstra, 2003). The preparation of a number of meat products, like
Frankfurters and Bologna sausage, involves the disintegration of the raw materials, giving
rise to aqueous colloidal systems composed of a protein matrix in which solid compounds
like insoluble protein and fat particles are dispersed (Carballo, Solas & Colmenero, 1993).
When these systems are heated they undergo gelation. These products can also be
described as emulsion-filled gels.
Texture and flavour are a main components of the sensory properties of food
products. Texture can be defined as ‘all the rheological and structural (geometric and
surface) attributes of the product perceptible by means of mechanical, tactile and, where
appropriate, visual and auditory receptors’ (Lawless & Heymann, 1998). Fat plays an
essential role in the sensory perception of emulsion-filled gels. This is clearly shown by
the decrease in liking and acceptability accompanied by fat reduction in several different
foods (van den Oever, 2006). Cheese with reduced fat is perceived as ‘more waxy,
fracturable, chewy, hard and springy’ and ‘less sticky, cohesive, meltable and smooth’
than full-fat cheese (Gwartney, Foegeding & Larick, 2002). For yoghurt, the fat content is
found to affect sensory properties in all the categories, i.e. odour, flavour, taste and texture
(Folkenberg & Martens, 2003). Fat reduction results in a decrease of creaminess and sweet
taste perception and in an increase of astringency, bitter and sour taste. In frozen dairy
desserts creaminess decreases and wateriness and coarseness increase as result of fat
reduction (Specter & Setser, 1994). Low fat Frankfurters are drier and tougher than the
full-fat version (Sofos & Allen, 1977; Hand, Hollingsworth, Calkins & Mandigo, 1987;
Lee, Whiting & Jenkins, 1987).
Despite the important role played by fat in the texture and overall sensory perception
of emulsion-filled gels, consumer liking is often not directly and simply related to fat level
(van den Oever, 2006). This means that fat is involved in texture and sensory perception
mechanisms which can also be influenced by parameters independent of fat level. The
3

Chapter 1
control of these mechanisms requires thorough knowledge of both the effect of emulsion
droplets on the physicochemical and mechanical properties of emulsion-filled gels, and of
the role played by these properties in the sensory perception of these systems. These
aspects are at the moment not satisfactorily covered by the scientific literature.
1.2 Rheological characterisation of gels
Rheology deals with the relationships between forces and deformations of materials. In the
case of foods the goals are to ‘understand the effect of processing on products, to probe
the system’s structure and to reveal critical aspects of food texture’ (Foegeding & Drake,
2007). For rheological measurements of viscoelastic solid foods, three different regimes
can be distinguished based on the nature of the relationship between stress ( ) and strain
( ) (Figure 1.1). In the first regime (I), called the linear regime, a linear relation between
stress and strain can be observed; in other words Hooke’s law is obeyed. In the second
regime (II) the relationship between stress and strain is nonlinear. Beyond the nonlinear
regime fracture of the material occurs (fracture regime, III). Measurements performed in
the linear regime are called small-deformation measurements. In the linear regime, the
deformation applied does not affect the structure of the material, and the ratio between
stress and the accompanying strain is independent of the strain (van Vliet, 1999).
Measurements performed in the nonlinear and fracture regimes are called large-
deformation measurements, or, when they are mainly focussed on the determination of the
fracture properties of the material, fracture measurements.
The rheological properties of gels have mainly been studied at small deformation.
This holds also for the effect of emulsion droplets on the rheological properties of
emulsion-filled gels (van Vliet, 1988; Dickinson, 1995, 1996, 1997; Chen, 1998, 1999;
Chen & Dickinson, 1999; Chen, Dickinson & Edwards, 1999; Dickinson, 1999).
However, when aiming at linking rheological properties to texture characteristics and
sensory perception, large deformation measurements are more relevant: eating obviously
involves large deformations (Luyten, van Vliet & Walstra, 1992). For certain kinds of
food, like cheese, rheological properties determined in the nonlinear and fracture regimes
show a high degree of correlation with sensory properties (Foegeding et al., 2007).
4

Introduction
0
0
Strain
Str
ess
I III II
0
0
Strain
Str
ess
I III II
Figure 1.1 – Rheological regimes for viscoelastic solids.
Three different types of deformation can be distinguished: all-sided (isotropic)
compression, simple shear and uniaxial compression or extension. The deformation
applied in measurements is often not simply one of these types, but a combination of them
(Luyten et al., 1992; Hamann, Zhang, Daubert, Foegeding & Diehl, 2006). The four main
techniques used for the measurement of large deformation and fracture properties are:
uniaxial compression and tension, bending and torsion (Luyten et al., 1992; Hamann et al.,
2006; Truong & Daubert, 2000). Uniaxial compression is the most used technique for food
products because it is easy to perform. Furthermore, uniaxial compression largely reflects
what happens during chewing. With this technique fracture can start both within and at the
outside of the sample. Tension tests apply a similar, but opposite deformation as compared
to compression measurements. With this technique fracture starts almost always at the
outside of the sample, and therefore fracturing can be observed more easily than for
uniaxial compression measurements. Tension tests are not frequently used for food
products because of the difficulty to grip the sample. Strong attachment of the specimen to
the machine and specific specimen shapes are required to relieve the stress at the point of
attachment. Both requirements are difficult to achieve with food material, especially with
gels. In bending tests the applied deformation consists of a combination of compression,
extension and shear. Fracture almost always starts at the surface of the deformed part of
the specimen. Torsion measurements produce a pure shear stress, maintaining volume and
shape of the specimen during testing. The specimens should be capstan-shaped. This,
5

Chapter 1
together with the need of strong attachment of the specimen to the machine, results in
tedious sample preparation. As a consequence torsion tests are not widely used for food
products.
For isotropic materials the Young’s modulus as determined in the linear region
should be independent of the measurement technique (Luyten et al., 1992). However, for
fracture parameters differences can be observed between results from different techniques.
Fracture stress and fracture strain measured in uniaxial compression and torsion tests are
often in good agreement (Hamann et al., 2006). The fracture stress is often independent of
the technique applied (Hamann et al., 2006). Fracture stress values observed in tension
and bending tests tend to be lower than those measured in compression and torsion tests
(Luyten et al., 1992; Hamann et al., 2006). Samples tested by tension and bending usually
fracture at lower strain than those tested by compression and torsion.
1.3 Sensory characterisation of gels
Several different methods have been used for the sensory characterisation of food
products. Nowadays three main groups of sensory tests can be distinguished:
discrimination tests, acceptance (or affective) tests, and descriptive analysis (Stone &
Sidel, 2004). Discrimination tests are used to verify whether two products are perceived as
different. This can be useful when optimising the production process, or when substituting
ingredients of a product already on the market. Some of the methods used for
discrimination tests are well known, such as the paired-comparison test and the triangle
test. The information that can be obtained with these tests is rather limited. For this reason
discrimination tests usually precede other sensory tests. The aim of acceptance tests is to
measure the liking of or preference for a product (Stone et al., 2004). Preference can be
measured either directly, by comparison between two or more products, or indirectly, on
the basis of the scores obtained in a multi-product test. Acceptance tests are often applied
during the introduction of new products, usually before a large scale test such as a
marketing research. Descriptive analysis is the most sophisticated kind of sensory test
presently available (Stone et al., 2004). It provides a complete quantitative sensory
description of a set of products. This allows to map product similarities and differences
and to determine the sensory attributes relevant for acceptance. Furthermore, the results of
descriptive analysis enable researchers to relate specific product properties to specific
6
Introduction
sensory attributes. Unlike discrimination and acceptance tests, descriptive analysis
requires qualified subjects, having an enhanced ability to perceive taste, aroma and texture
differences. Different methodologies are used for descriptive analysis. For research
purposes the most powerful methodology is the Quantitative Descriptive Analysis (QDA).
This methodology requires only a limited number of subjects (typically 10-12). They
should be highly skilled, since they should be able to describe all sensory properties of a
product and to evaluate several products in one session. The subjects create a specific
sensory vocabulary to describe product properties. For each evaluated product all
attributes listed in this vocabulary receive a score. The scores are subsequently analysed
by the analysis of variance method or principal component analysis.
The vocabulary created by QDA sensory panels for the description of the
properties of gels can vary widely. The odour and taste attributes are mainly related to
other ingredients present in the gel than the gelling agents. Mouthfeel terms, describing
gel firmness and strength (‘deformable’, ‘elastic’, ‘firm’, ‘fracture force’, ‘chewiness’,
‘springy’, ‘cohesive’, ‘short’) are usually present in this vocabulary (Autio, Kuuva,
Roininen & Lahteenmaki, 2002; Gwartney et al., 2002; Pereira, Singh, Munro &
Luckman, 2003; Barrangou, Drake, Daubert & Foegeding, 2006; Foegeding et al., 2007;
van den Berg, van Vliet, van der Linden, van Boekel & van de Velde, 2007). This first
group of mouthfeel terms is usually connected to concentration and molecular properties
of the gelling agent and to the presence of other ingredients with an effect on firmness and
strength. A second group of mouthfeel attributes can be selected by the QDA panel to
describe (i) possible release of water from the gel during mastication (‘watery’,
‘separating’), (ii) creation of a coating layer in the mouth after oral processing (‘sticky’,
‘coating’), (iii) melting of the gels during breakdown (‘melting’), (iv) presence of particles
in the broken gel (‘mealy’, ‘grainy’) or (v) other specific sensations (‘slippery’,
‘spreadable’, ‘smooth’, ‘creamy’, ‘fatty’) (Autio et al., 2002; Gwartney et al., 2002;
Pereira et al., 2003; Foegeding et al., 2007; van den Berg et al., 2007). Mouthfeel
attributes of this second group are related to the molecular and functional properties of
both gelling agents and other ingredients under oral processing conditions. Afterfeel
attributes, i.e. sensory attributes describing the sensations perceived after oral processing
of the gels, are directly connected to the second group of mouthfeel attributes.
In literature the sensory characterisation of gels is generally complemented by the
study of correlations with instrumental measurements, both at small and large
7

Chapter 1
deformations. Instrumental measurements usually correlate well with sensory attributes
describing gel firmness and strength (Autio et al., 2002; Gwartney et al., 2002; Pereira et
al., 2003; Barrangou et al., 2006; Foegeding et al., 2007; van den Berg et al., 2007).
Correlations between instrumental measurements and sensory attributes require a
mechanistic link. This is of particular importance for sensory attributes of the second
group. Coincidental correlations without a plausible mechanistic link are one of the main
obstacles for understanding the sensory perception of foods (Foegeding et al., 2007).
1.4 Aim of the thesis
The emulsion droplets embedded in the matrix remarkably affect the rheological
behaviour and the functional properties of the filled gels. So far, the effect of the droplets
on rheological properties has been studied mainly at small deformations. The effect of the
droplets on large deformation properties is still not completely clear. This makes it
difficult to formulate mechanistic hypotheses on the sensory perception of emulsion-filled
gels. For instance, it is still not clear whether the emulsion droplets are directly perceived
or whether it is their effect on mechanical behaviour that dominates sensory perception. In
order to gain control of the sensory perception of emulsion-filled these aspects must be
clarified.
The aim of this thesis is to unveil the most important effects of emulsion droplets on
the mechanical properties of model emulsion-filled gels resembling real food products,
and to formulate a hypothesis on the role played by these properties in sensory perception
mechanisms. The envisaged results could represent a tool for the food industry to engineer
emulsion-filled gels with desired sensory properties and to overcome the difficulties
related to the development of reduced fat foods. The knowledge of sensory perception
mechanisms related to the presence of emulsion droplets in the gel matrix is of basic
importance to find ingredients able to mimic the effect of the droplets.
8

Introduction
1.5 Description of the gel systems studied
1.5.1 Combinations gelling agents-emulsions
For this thesis, several model gel systems resembling real food products were selected.
Models for both polymer and particle gels were optimised. As examples for polymer gels,
gelatine and -carrageenan were chosen. These two polymers were both selected because
they represent different breakdown and viscoelastic behaviours. Emulsion-filled gels
prepared with these polymers can be compared to several different types of dairy desserts.
As an example of particle gels acid-induced, cold-set whey protein isolate (WPI) gels
were chosen. The structure of emulsion-filled WPI gels roughly resembles that of set
yoghurt and of rennet milk curd.
For emulsion-filled gels, the emulsifying agent adsorbed onto the surface of the oil
droplet determines the interactions between oil droplet and gel matrix (Chen & Dickinson,
1999). When, for instance, attractive electrostatic interactions occur between emulsifying
agent and gelling agent, the oil droplets will be bound to the gel matrix. Therefore, the
droplet-matrix interactions of the filled gels studied were varied by changing the
emulsifying agent used for emulsion preparation. In Table 1.1 the various combinations of
gel matrices and emulsifying agents are reported.
Table 1.1 – Combinations between gel matrices and emulsifying agents studied in this thesis.
Gelling agent
Emulsifying agent Gelatin -carrageenan WPI
Native WPI Bound Unbound
WPI aggregates Bound
Lysozyme Bound Bound
Lactoferrin Bound
Tween 20 Unbound
9

Chapter 1
The preparation procedure and the composition of gelatin and -carrageenan gels
slightly evolved during the period in which the experimental measurements were
performed. The ageing time of gelatin gels increased from 24 (chapters 3, 4 and 7) to 48
(chapters 5, 6 and 8) hours. As a result, the latter gels showed slightly higher moduli, but
the fracture properties did not significantly change. Therefore, the results obtained with
the two different ageing times are comparable. This modification of the preparation
procedure was introduced because it facilitates the extraction of the gels from the tubes in
which they were prepared. Kappa-carrageenan gels were firstly prepared with a gelling
agent concentration of 0.75 wt% and in a 10 mM KCl solution (chapters 3 and 4). The
gelling agent concentration was later decreased to 0.60 wt% and the concentration of the
KCl solution was increased to 30 mM (chapters 5, 6, 7 and 8). This resulted in a gel with a
longer gelation time and facilitated the preparation of gels containing emulsion droplets.
The modification of the composition of -carrageenan gels did not significantly affect the
Young’s modulus and the fracture properties of the gels.
1.5.2 Molecular and functional properties of the gelling agent
1.5.2.1 Gelatine
Gelatine is a heterogeneous product derived from the controlled acid or alkaline
hydrolysis of collagen (Harris, 1990; Simon, Grohens, Vandanjon, Bourseau, Balnois &
Levesque, 2003; Walstra, 2003). Its composition and its functional properties are
influenced by source, age and type of collagen. The molecular structure of collagen
consists of a triple helix with three discrete -chains in which glycine residues occupy
every third site, leaving a space that on the other two chains can be occupied by
hydroxyproline and proline residues. This sequence makes the formation of interchain
hydrogen bonds possible.
Commercial gelatines are characterized by two parameters:
- bloom value (function of the gel strength at a certain concentration and at 10°C,
measured after keeping the gel at this temperature for 18 hours)
- viscosity of a solution with the same concentration used for the bloom value and at
the temperature of 60°C.
Gelatine is insoluble in cold water and liquid foods (e.g. milk, juices). Nevertheless, in
these fluids it will swell and absorb water up to its own weight. A presoaking in cold
10

Introduction
water allows lower temperatures to be used for complete dissolution. The preparation of
solutions without presoaking requires temperatures of 60-80°C, whilst after presoaking
temperatures of 50-60°C are sufficient. The duration of the presoaking treatment depends
on the size of the gelatine granules and on the molecular properties of the gelatine.
Upon cooling, junctions involving triple helices form, and the interactions among
helices increase, resulting in gel formation. The formation of junctions is a slow process
and the modulus of the gel can keep increasing for several days. The minimum
concentration for gel formation is about 1 wt%. The gel strength is affected by gelatine
concentration, pH, gelation time and temperature, gelatine and gel composition.
1.5.2.2 Carrageenans
The term carrageenan refers to a group of linear sulphated galactan polysaccharides
extracted from red marine seaweeds (Rhodophyceae) (Stephen, Phillips & Williams,
2006). The basic unit of carrageenans is a repeating disaccharide sequence consisting of -
d-galactopyranose residues linked through positions 1 and 3 (A residues), and -
galactopyranose residues linked through positions 1 and 4 (B residues). Carrageenans can
be differentiated on the basis of content and position of ester sulphated substitutes. From a
commercial point of view only kappa ( ), iota ( ) and lambda ( ) are relevant. The
substitutions of these carrageenans are as follows (Figure 1.2):
- : one sulphate group at C4 of the 1,3 linked residue and presence of the 3,6-
anhydrobridge linkage;
- : one sulphate group at C4 of the 1,3 linked residue, one at C2 of the 1,4; presence
of the 3,6-ether linkage;
- : at C2 of the 1,3 linked residue hydroxyl groups in 30% and sulphate groups in
70% of the cases; one sulphate group at C2 and one at C6 of the 1,4 linked
residue; absence of the 3,6-ether linkage.
Native carrageenans from different sources contain mixtures of the polysaccharides
variants and intermediate hybrids with different degree of anhydration and 2-sulphation of
the 1,4 linked residues.
Kappa-carrageenans form solutions that are gelled by potassium ions. Solutions of
are gelled by calcium ions. Lambda-carrageenans do not form gels. The functional
properties of these carrageenans can be summarized as follows:
11

Chapter 1
- : has the highest gelation power and in water and milk it gives strong, brittle gels
with remarkable syneresis; for complete solubilisation a temperature of 75°C is
required;
- : in water and milk it forms elastic gels with low syneresis; heating to 60°C is
required for complete solubilisation;
- : due to its high sulphate content, it is the most soluble in cold water and milk,
providing high viscosity and stability.
OOO
O
OHOH
OH-O3SO
O
k-carrageenan
OOO
O
OSO3
-OH
OH-O3SO
O
-carrageenan
O
O
OSO3-
OHHO
-O3SO
O
HO
OSO3
-
O
-carrageenan
OOO
O
OHOH
OH-O3SO
O
OOO
O
OHOH
OH-O3SO
O
k-carrageenan
OOO
O
OSO3
-OH
OH-O3SO
O
OOO
O
OSO3
-OH
OH-O3SO
O
-carrageenan
O
O
OSO3-
OHHO
-O3SO
O
HO
OSO3
-
O
O
O
OSO3-
OHHO
-O3SO
O
HO
OSO3
-
O
-carrageenan
Figure 1.2 – Chemical structure of three types of carrageenans.
On cooling, hot solutions of gelling carrageenans set to gels. This happens because of
the association of molecular chains into double helices. At temperatures above the gelling
point, the formation of helices is prevented by thermal agitation. In this situation, the
polymer assumes a random coil structure. At first the polymer chains associate in double
helices to give small ordered domains. In order for these domains to aggregate in a three-
dimensional network, the presence of cations (the most effective being potassium for -
carrageenan and calcium for -carrageenan) that lock together helical regions of adjacent
domains is required. In presence of calcium ions k-carrageenan gels are rigid and subject
to syneresis. With potassium as only counterion, syneresis is prevented.
Electrostatic interactions can occur between the negatively charged carrageenans and
positively charged sites on proteins. An example of this phenomenon is the specific
12

Introduction
interaction between k-carrageenans and k-casein at pH values above the isoelectric point
of the protein, which results in the formation of a gel.
1.5.2.3 Whey Protein Isolates (WPI)
The main whey proteins present in milk are -lactoglobulin (3.2 g/ kg), -lactalbumin (1.2
g/ kg), immunoglobulins (0.7 g/ kg) and bovine serum albumin (0.4 g/ kg) (Walstra,
Wouters & Geurts, 2005). Beta-lactoglobulin (molecular mass: 18.3 kDa) is present in
milk and in aqueous solutions with pH in the range 3.5-5.2 as reversible dimer. It consists
of 162 amino acid residues and contains one free thiol group and two disulphide bonds
(Kinsella, 1984). The isoelectric point (pI) of the protein is 5. This protein is heat
sensitive: at 30°C dimers dissociate and above 55°C a progressive unfolding of the
globular structure occurs, exposing cysteine and hydrophobic groups and allowing
primary and secondary aggregation. Moreover, it undergoes molecular modifications at
different pH values. It is stable to denaturation at pH 2, it forms octomers in the same pH
range at 0°C and it becomes unstable and prone to denaturation at pH higher than 8.
Alpha-lactalbumin (molecular mass 14.2 kDa) is a calcium-binding metallo-
protein, consisting of 123 amino acids residues and with a pI of 4.2-4.5. It is an almost
spherical, very compact globular protein whose structure is stabilised by four disulphide
bonds. Calcium binding induces major changes in the tertiary structure of the protein. The
molecule is stable between pH 5.4 and 9.0. Between pH 4.0 and 5.0 it shows low
solubility and below 4.0 and above 9.0 it undergoes molecular changes. Alpha-
lactalbumin is the most heat-stable of the main whey proteins. Removal of calcium
reduces its heat stability.
Immunoglobulins are large, extremely heat-sensitive globular proteins. A treatment
at 70°C for 30 minutes denatures them completely. They exist either as monomer or as
polymer, the basic unit consisting of four polypeptide chains molecules, two identical light
chains (molecular mass about 20 kDa) and two identical heavy chains (molecular mass 50-
60 kDa). The chains are linked by disulphide bonds. The different types of
immunoglobulins are distinguished by differences in amino acid sequences in the
constant regions of the heavy chains.
The molecular structure of bovine serum albumin (molecular mass 66.2 Da) is
stabilised by 17 disulphide groups. Only one free thiol group is present. This globular
13

Chapter 1
protein is essentially monomeric, even though dimers and higher polymers occur. At pH
lower than 4 the molecule undergoes acid denaturation because of charge repulsion.
By ultrafiltration and diafiltration techniques whey protein concentrate (WPC)
powders with high protein content (> 80 %) can be obtained. Further purification with
these techniques results in WPI with protein concentration 98%. Gelation of solutions of
whey proteins can be induced in several ways (Totosaus, Montejano, Salazar & Guerrero,
2002). Heat-induced gelation is one of the most studied phenomena in food science. Whey
protein gels can also be formed by acid and salt induced cold gelation of heat-denatured
dispersions, high-pressure treatment, urea addition and transglutaminase-catalysed
covalent cross-linking.
Heat-induced gelation occurs at 70-80°C, provided that the protein content is
sufficient. Gel formation does not occur at protein concentration lower than 5% and firm
gels are prepared only with concentrations higher than 8%. Gelation temperature and gel
strength are influenced by:
- ionic strength;
- protein content;
- pH;
- type of ions present;
- total solid content.
The pH assumes a particular role in the heat induced gelation of whey protein. With
regard to gel strength, the optimal value is 7. At this pH and between the range 6-7, a
white, curdy gel is formed. Below pH 5 and above 7 not only the gelation time/
temperature increases, but translucent gels are obtained. Translucent gels are firmer and
less prone to syneresis. Gel produced at pH 6.0-6.5 can sustain a considerable
compression (80%) without fracturing and partially recovering the original shape. Being
easily compressed, the gel strength of these systems is limited. Gels prepared by addition
of phosphates and at pH 7 are much more rigid and gelatin-like, but more susceptible to
fracture. Variations of the temperature, both above 100°C and at freezing temperature,
have limited effects on gel characteristics.
Cold gelation has been studied for preheated solutions of -lactoglobulin, WPC
and WPI (Vreeker, Hoekstra, Den Boer & Agterof, 1992; Barbut & Foegeding, 1993;
Barbut, 1995; Sato, Nakamura, Nishiya, Kawanari & Nakajima, 1995; Hongsprabhas &
Barbut, 1996; Roff & Foegeding, 1996; Elofsson, Dejmek, Paulsson & Burling, 1997;
14

Introduction
Hongsprabhas, Barbut & Marangoni, 1999; Alting, 2003). In cold gelation the heat-
induced activation step is uncoupled from gel formation. In the first step of the cold
gelation process a solution of native whey proteins is heated at pH far from the pI, at low
ionic strength and at concentrations too low for gel formation. This results in a stable
dispersion of protein aggregates. The protein concentration during heating determines the
physicochemical properties of the aggregates and, therefore the rheological properties of
the gels. In a second step gelation of the diluted aggregates dispersion occurs at ambient
temperature by decreasing the pH or increasing the ionic strength of the solvent.
The preparation of emulsion-filled whey protein gels by heat induced gelation
implies the addition of the emulsion to the whey protein solution before heating. This
means that also the added emulsion undergoes a severe heat treatment, which could cause
modifications of the emulsifying agents used for emulsion preparation. When proteins are
chosen as emulsifying agent, this could result in the denaturation of the proteins adsorbed
on the surface of the emulsion droplets. In the preparation of emulsion-filled whey protein
gels by cold gelation the emulsion is added to the protein aggregates dispersion before
acidification of salt addition. Therefore, the emulsion does not undergo heating and
possible modifications of the emulsifying agents are prevented. This represents an
important advantage. Therefore, in this thesis whey protein gels were prepared by acid-
induced cold gelation.
1.6 Outline of the thesis
This thesis reports studies on the effect of oil droplets on both the mechanical and sensory
properties of emulsions-filled gels resembling real food products.
In chapter 2 the optimisation of the preparation of WPI emulsion-filled gels is
described. In this chapter the difficulties to achieve stable systems and the
physicochemical mechanisms causing phase separation in emulsion-filled gels are
discussed. The rheological properties both at small and large deformations are presented.
Chapter 3 deals with the large deformation properties at constant compression
speed of gelatin, -carrageenan and WPI gels containing emulsion droplets with varying
interactions with the gel matrix. The microstructure of these gels, as studied by Confocal
Scanning Laser Microscopy (CLSM), is discussed in relation to the physicochemical
15

Chapter 1
mechanisms leading to oil droplet aggregation. The effect of oil droplet aggregation on
large deformation properties of gelatin and WPI gels is also studied.
Chapter 4 reports the results of an explorative sensory study in which gelatin, -
carrageenan, mixed / -carrageenan and WPI gels containing emulsion droplets with
varying interactions with the gel matrix are characterised. The effect of both oil content
and kind of gel matrix on sensory perception is discussed. An attempt is made to correlate
the scores of mouthfeel attributes with instrumental measurements performed at constant
compression speed. For gelatin gels the effect of oil droplet aggregation on sensory
perception is covered.
In chapter 5 the large deformation and viscoelastic properties of gels with
increasing oil concentration are studied with particular attention to the rate of deformation.
In chapter 6 the same properties are studied for gels with constant oil concentration, but
varying gelling agent concentration and oil droplet size. For both chapters the gels studied
were gelatin, -carrageenan and WPI gels containing emulsion droplets with varying
interactions with the gel matrix.
Chapter 7 deals with the role of the release of oil droplets during oral processing in
the sensory perception of gelatin, -carrageenan and WPI gels containing emulsion
droplets with varying interactions with the gel matrix. The analytical method optimised for
the quantification of the release of oil droplets in vitro upon gel shearing is presented in
detail.
Finally, in chapter 8 the friction properties of emulsion-filled gels are studied. The
roles played by the individual gel components and by saliva are discussed. Furthermore,
the mechanism relating the interaction between oil droplets and gel matrix to the friction
properties of the gels is explained. In this study the gels were broken so as to resemble a
sheared gel resulting from oral processing.
16

Introduction
1.7 References
Alting, A. C. (2003). Cold gelation of globular proteins. Wageningen: Wageningen University.
Autio, K., Kuuva, T., Roininen, K. & Lahteenmaki, L. (2002). Rheological properties,
microstructure and sensory perception of high-amylose starch-pectin mixed gels. Journal
of Texture Studies, 33(6), 473-486.
Barbut, S. & Foegeding, E. A. (1993). Ca2+-Induced gelation of pre-heated whey-protein isolate.
Journal of Food Science, 58(4), 867-871.
Barbut, S. (1995). Effects of calcium level on the structure of pre-heated whey protein isolate gels.
Food Science and Technology-Lebensmittel-Wissenschaft & Technologie, 28(6), 598-603.
Barrangou, L. M., Drake, M. A., Daubert, C. R. & Foegeding, E. A. (2006). Sensory texture
related to large-strain rheological properties of agar/glycerol gels as a model food. Journal
of Texture Studies, 37(3), 241-262.
Carballo, J., Solas, M. T. & Colmenero, F. J. (1993). Effects of different levels of fat on
rheological changes and microstructure of meat batters during heat processing. Zeitschrift
Fur Lebensmittel-Untersuchung Und-Forschung, 197(2), 109-113.
Chen, J. & Dickinson, E. (1998). Viscoelastic properties of heat-set whey protein emulsion gels.
Journal of Texture Studies, 29, 285-304.
Chen, J. & Dickinson, E. (1999). Effect of surface character of filler particles on rheology of heat-
set whey protein emulsion gels. Colloids and Surfaces B: Biointerfaces, 12, 373-381.
Chen, J. & Dickinson, E. (1999). Effect of surface character of filler particles on rheology of heat-
set whey protein emulsion gels. Colloids and Surfaces B-Biointerfaces, 12(3-6), 373-381.
Chen, J., Dickinson, E. & Edwards, M. (1999). Rheology of acid-induced sodium caseinate
stabilized emulsion gels. Journal of Texture Studies, 30(4), 377-396.
Dickinson, E., Chen, J. (1999). Heat-set whey protein emulsion gels: role of active and inactive
filler particles. Journal of Dispersion Science and Technology, 20(1&2), 197-213.
Dickinson, E., Hong S.-T. (1995). Influence of water-soluble non-ionic emulsifiers on the
rheology of heat-set protein stabilized emulsion gels. Journal of Agriculture and Food
Chemistry, 43, 2560-2566.
Dickinson, E. & Hong S.-T. (1997). Influence of an anionic surfactant on the rheology of heat-set
-lactoglobulin-stabilized emulsion gels. Colloids and Surfaces A: Physicochemical and
Engineering Aspects, 127, 1-10.
Dickinson, E., Hong S.-T. & Yamamoto, Y. (1996). Rheology of heat-set emulsion gels containing
-lactoglobulin and small-molecule surfactants. Netherlands Milk & Dairy Journal,, 50,
199-207.
Donato, L., Alexander, M. & Dalgleish, D. G. (2007). Acid gelation in heated and unheated milks:
Interactions between serum protein complexes and the surfaces of casein micelles. Journal
of Agricultural and Food Chemistry, 55(10), 4160-4168.
17

Chapter 1
Elofsson, C., Dejmek, P., Paulsson, M. & Burling, H. (1997). Characterization of a cold-gelling
whey protein concentrate. International Dairy Journal, 7(8-9), 601-608.
Flory, P. J. (1974). Gelling and gelling processes. Faraday Discussions of the Chemical Society,
57, 7-18.
Foegeding, E. A. & Drake, M. A. (2007). Invited review: Sensory and mechanical properties of
cheese texture. Journal of Dairy Science, 90(4), 1611-1624.
Folkenberg, D. M. & Martens, M. (2003). Sensory properties of low fat yoghurts. Part A: Effect of
fat content, fermentation culture and addition of non-fat dry milk on the sensory properties
of plain yoghurts. Milchwissenschaft-Milk Science International, 58(1-2), 48-51.
Gwartney, E., Foegeding, E. A. & Larick, D. K. (2002). The texture of commercial full-fat and
reduced-fat cheese. Journal of Food Science, 67(2), 812-816.
Hamann, D. D., Zhang, J. H., Daubert, C. R., Foegeding, E. A. & Diehl, K. C. (2006). Analysis of
compression, tension and torsion for testing food gel fracture properties. Journal of
Texture Studies, 37(6), 620-639.
Hand, L. W., Hollingsworth, C. A., Calkins, C. R. & Mandigo, R. W. (1987). Effects of
preblending, reduced fat and salt levels on Frankfurter characteristics. Journal of Food
Science, 52(5), 1149-1151.
Harris, P. (1990). Food Gels. London: Elsevier Science Publishers LTD.
Hongsprabhas, P. & Barbut, S. (1996). Ca2+-induced gelation of whey protein isolate: Effects of
pre-heating. Food Research International, 29(2), 135-139.
Hongsprabhas, P., Barbut, S. & Marangoni, A. G. (1999). The structure of cold-set whey protein
isolate gels prepared with Ca++. Food Science and Technology-Lebensmittel-Wissenschaft
& Technologie, 32(4), 196-202.
Kinsella, J. E. (1984). Milk-Proteins - Physicochemical and functional properties. CRC Critical
Reviews in Food Science and Nutrition, 21(3), 197-262.
Lawless, H. T. & Heymann, H. (1998). Sensory evaluation of food. New York: Chapman & Hall.
Lee, C. M., Whiting, R. C. & Jenkins, R. K. (1987). Texture and sensory evaluations of
Frankfurters made with different formulations and processes. Journal of Food Science,
52(4), 896-900.
Luyten, H., Vanvliet, T. & Walstra, P. (1992). Comparison of various methods to evaluate fracture
phenomena in food materials. Journal of Texture Studies, 23(3), 245-266.
Pereira, R. B., Singh, H., Munro, P. A. & Luckman, M. S. (2003). Sensory and instrumental
textural characteristics of acid milk gels. International Dairy Journal, 13(8), 655-667.
Roff, C. F. & Foegeding, E. A. (1996). Dicationic-induced gelation of pre-denatured whey protein
isolate. Food Hydrocolloids, 10(2), 193-198.
Sandra, S., Alexander, M. & Dalgleish, D. G. (2007). The rennet coagulation mechanism of skim
milk as observed by transmission diffusing wave spectroscopy. Journal of Colloid and
Interface Science, 308(2), 364-373.
18

Introduction
Sato, K., Nakamura, M., Nishiya, T., Kawanari, M. & Nakajima, I. (1995). Preparation of a gel of
partially heat-denatured whey-protein by proteolytic digestion. Milchwissenschaft-Milk
Science International, 50(7), 389-392.
Simon, A., Grohens, Y., Vandanjon, L., Bourseau, P., Balnois, E. & Levesque, G. (2003). A
comparative study of the rheological and structural properties of gelatin gels of
mammalian and fish origins. Macromolecular Symposia, 203, 331-338.
Sofos, J. N. & Allen, C. E. (1977). Effects of lean meat source and levels of fat and soy protein on
properties of Wiener-type pProducts. Journal of Food Science, 42(4), 875-878.
Specter, S. E. & Setser, C. S. (1994). Sensory and physical-properties of a reduced-calorie frozen
dessert system made with milk-fat and sucrose substitutes. Journal of Dairy Science,
77(3), 708-717.
Stephen, A. M., Phillips, G. O. & Williams, P. A. (2006). Food polysaccharides and their
applications. Boca Raton: CRC.
Stone, H. & Sidel, J. L. (2004). Sensory evaluation practices. London: Elsevier Academic Press.
Totosaus, A., Montejano, J. G., Salazar, J. A. & Guerrero, I. (2002). A review of physical and
chemical protein-gel induction. International Journal of Food Science and Technology,
37(6), 589-601.
Truong, V. D. & Daubert, C. R. (2000). Comparative study of large strain methods for assessing
failure characteristics of selected food gels. Journal of Texture Studies, 31(3), 335-353.
van den Berg, L., van Vliet, T., van der Linden, E., van Boekel, M. & van de Velde, F. (2007).
Breakdown properties and sensory perception of whey proteins/polysaccharide mixed gels
as a function of microstructure. Food Hydrocolloids, 21(5-6), 961-976.
van den Oever, G. J. (2006). Fat reduction in foods: Microstructure control of oral texture, taste,
and aroma in reduced oil systems. In Food Lipids: Chemistry, Flavor, and Texture. (Vol.
920) 171-189.
van Vliet, T. (1988). Rheological properties of filled gels. Influence of filler matrix interaction.
Colloid & Polymer Science, 266, 518-524.
van Vliet, T. (1999). Factors determining small-deformation behaviour of gels. In Dickinson, E. &
Rodriguez Patino, J. M., Food emulsions and foams. Interfaces, interactions and stability.
Cambridge: Royal Society of Chemistry.
Vreeker, R., Hoekstra, L. L., Denboer, D. C. & Agterof, W. G. M. (1992). Fractal aggregation of
whey proteins. Food Hydrocolloids, 6(5), 423-435.
Walstra, P. (2003). Physical Chemistry of Foods New York: Marcel Dekker Inc.
Walstra, P., Wouters, J. T. M. & Geurts, T. J. (2005). Dairy science and technology. Boca Raton:
CRC.
Ziegler, G. R. & Foegeding, E. A. (1990). The gelation of proteins. In Kinsella, J. E., Advances in
Food and Nutrition Research. (Vol. 34) (pp. 203-298). Academic Press.
19


P. Rosa, G. Sala, T. van Vliet, F. van de Velde (2006). Cold gelation of whey protein emulsions,
Journal of Texture Studies, 37, 516-537.
Chapter 2
Gelation of emulsions stabilised by whey protein aggregates
Chapter 2
Abstract
Stable and homogeneous emulsion-filled gels were prepared by cold gelation of whey
protein isolate (WPI) emulsions. A suspension of heat denatured WPI (soluble WPI
aggregates) was mixed with a 40 wt% oil-in-water emulsion to obtain gels with varying
concentrations of WPI aggregates and oil. For emulsions stabilised by native WPI,
creaming was observed upon mixing of the emulsion with a suspension of WPI
aggregates, likely as a result of depletion flocculation induced by the differences in size
between the droplets and aggregates. For emulsions stabilised by soluble WPI aggregates,
the obtained filled suspension was stable against creaming and homogeneous emulsion-
filled gels with varying protein and oil concentrations were obtained. Large deformation
properties of the emulsion-filled cold-set WPI gels were determined by uniaxial
compression. With increasing oil concentration the fracture stress increased slightly,
whereas the fracture strain decreased slightly. Small deformation properties were
determined by oscillatory rheology. The storage modulus after 16 hours of acidification
was taken as a measure of the gel stiffness. Experimental results were in good agreement
with predictions according to the van der Poel’s theory for the effect of oil concentration
on the stiffness of the filled gels. Especially, the influence of the modulus of the matrix on
the effect of the oil droplets was in good agreement with the van der Poel’s theory.
22

Whey protein gels
2.1 Introduction
Upon handling and consumption of food, large deformation and fracture properties are
more important than the behaviour at small deformation (van Vliet & Walstra, 1995; van
Vliet, 2002). Both functional properties, such as shaping, cutting, slicing and spoonability,
and eating characteristics are related to large deformation and fracture properties. The
firmness of a gel depends, for example, on the apparent modulus at large deformation and
on fracture or yield stress. Some eating characteristics are related to the yield and fracture
properties and to the apparent large deformation modulus at the relevant strain rate.
In spite of the relevance of large deformation properties of food products for their
sensory characteristics, the theories presently available for the modelling of the
rheological properties of emulsion-filled gels are based on small deformation
measurements. The van der Poel method for calculating the shear modulus of particulate
composites (van der Poel, 1958; Smith, 1974; Smith, 1975) has been also applied for the
characterisation of emulsion-filled gels (van Vliet, 1988). Since the method only holds for
composites with homogeneously distributed fillers, the agreement between experimental
results and calculated data varies widely. Van Vliet (1988) reported that for acid milk gels
with emulsion droplets behaving as active fillers, the experimental effect of the oil
concentration was largely underestimated by the van der Poel method. On the other hand,
the effect of filler concentration was well predicted for polyvinyl alcohol – Congo red gels
(van Vliet, 1988). The discrepancy between the predicted effect of the filler concentration
on gel modulus and experimental results for heat-set whey protein gels was also attributed
to the aggregation of the emulsion droplets (Chen & Dickinson, 1998).
The rheological properties of gels filled with emulsion droplets depend on the
mechanical properties of both the gel matrix and the filler particles, the emulsion droplet
concentration and the nature of the filler-matrix interactions (Tolstoguzov & Braudo,
1983; van Vliet, 1988). Depending on their effect on gel rheology, filler particles can be
classified as either active of inactive (Ring & Stainsby, 1982). Active fillers interact with
the gel matrix and increase the gel strength. Inactive fillers have little chemical affinity for
the molecules forming the gel matrix and do not strengthen the material. The possibility of
interaction between filler and gel matrix depend on the surface properties of the filler
matrix, especially the nature of the stabilising agent (Dickinson & Chen, 1999). The effect
of the filler also depends on the modulus of the filler particles, the higher the elastic
23

Chapter 2
modulus of the filler the higher the effect of the filler (van der Poel, 1958; van Vliet,
1988). Anisometric particles have a larger effect on the elastic modulus than spherical
particles. Furthermore, in the case of filler particles aggregation, the effective size of the
particles and their anisometry increase. In some cases the formation of an intermediate
layer with a depleted polymer concentration and, thus, a lower modulus, is observed
around the particle, see for example (van Vliet, 1988).
Protein gels, in particular whey protein gels, have numerous applications in food
products, often in combination with other ingredients. Since gelation is an important
functional property that contributes to the appearance, water-holding capacity and texture
of food, considerable attention has been paid to protein gelation. Protein gels can be
obtained in different ways (Totosaus et al., 2002). Heat-induced gelation is the most
common way to produce protein gels. Cold gelation of globular proteins, especially whey
proteins, is a method to prepare protein gels with varying textures in a controllable way
(Alting et al., 2004; Weijers et al., 2006). This two-step process allows controlling the
properties of the protein aggregates and final gel texture independently.
The cold gelation process involves two steps: firstly the preparation of protein
aggregates by heating a protein suspension and secondly gelation of these aggregates by
gradually lowering the pH of the suspension to a pH below the iso-electric point of the
proteins. The heating step has two critical parameters: the protein concentration and the
temperature/time profile. The concentration is kept below the gelation concentration to
obtain soluble protein aggregates. The heating temperature and time are selected to yield
95 to 100% protein aggregates. The protein concentration during this heating step
determines the physical / chemical properties of the aggregates and, thereby, the
rheological properties of the final gel (Alting et al., 2003b). In the next step the protein
aggregates are diluted to an appropriate concentration to obtain a desired texture of the gel
upon acidification the control of the oil content and droplet size of the filler particles
independently from the textural properties of the protein matrix (van de Velde, 2004).
Emulsion-filled heat-set gels have attracted enormous attention in the scientific
literature over the last decades. Not only filled whey protein gels have been described, but
also soy protein (Kim et al., 2001) and egg yolk gels (Koidis et al., 2002). Recently, the
first paper on cold gelation of oil-in-water emulsions was published (Sok Line et al.,
2005). The authors used calcium-induced gelation of -lactoglobulin to obtain emulsion-
filled gels. Reactive -lactoglobulin aggregates, obtained after heat treatment, were used
24

Whey protein gels
to prepare the oil-in-water emulsion, which gelled upon addition of calcium chloride. The
effect of the oil and CaCl2 concentration were studied at constant overall protein
concentration.
The aim of this chapter was to study the effect of the concentration of emulsion
droplets on the small and large deformation properties of emulsion-filled WPI gels
prepared by cold gelation. Acid-induced cold gelation of whey protein isolate was used to
prepare emulsion-filled gels in which oil content and droplet size were independently
varied from the mechanical properties of the protein matrix. Therefore, well characterised
o/w emulsions stabilised with native WPI or heat-denatured WPI dispersions and different
droplet sizes were mixed with the active protein aggregates before acidification The
rheological properties of these acid-induced cold-set whey protein emulsion-filled gels
were determined at small and large deformations. The elastic modulus of the gels
measured at small deformation was compared to predictions based on the van der Poel
method. The microstructures of these gels were determined by Confocal Laser Scanning
Microscopy (CLSM) to monitor the distribution of the oil droplets in the gel matrix.
2.2 Materials and methods
2.2.1 Materials
Whey protein isolate (WPI) was purchased from Davisco International Inc. (BiproTM
, La
Sueur, MN, USA). Glucono- -lactone (GDL) and Rhodamine B were obtained from
Sigma Chemicals. BODIPY® 581/591 C11 (4,4-difluoro-5-(4-phenyl-1,3-butadienyl)-4-
bora-3a,4a-diaza-s-indacene-3-undecanoic acid) was purchased from Molecular Probes
(Leiden, The Netherlands). Commercial peanut oil of food grade quality (density 0.92)
was obtained from a local retailer. All ingredients were used without purification. Water
purified by reverse osmosis (RO) was used in all cases.
2.2.2 Preparation of WPI aggregates
WPI aggregates were prepared according to published methods (Alting, 2003). WPI was
dissolved in RO water at a concentration of 9 wt% and stirred for at least 2 hours at room
temperature, until all protein was dissolved. Reactive WPI aggregates were prepared by
heating the solution in a water bath for 2 hours at 68.5 ºC and cooling to room temperature
25

Chapter 2
by running tap water. This heat treatment results in over 95% aggregation of the proteins
(Alting et al., 2003b). The WPI aggregates solutions were stored at 4 ºC until use
(typically within 1 week).
2.2.3 Preparation of O/W emulsions
Four different oil-in-water emulsions were prepared, their compositions are given in Table
2.1. A 2.7 wt% WPI solution was prepared by dissolving the powdered protein in RO
water at room temperature and stirring until all protein was dissolved (typically within
1h). This solution was used without further treatment. A 9 wt% WPI aggregates solution
was prepared as described above, and diluted to a 2.7 wt% solution with an appropriate
amount of RO water. Oil-in-water emulsions were prepared at room temperature by
homogenising weighed amounts of peanut oil (40 wt%) and aqueous phase (60 wt%). Pre-
emulsions were prepared with an Ultra Turrax Polytron (KINEMATICA AG,
Switzerland). The pre-emulsions were homogenized using a Laboratory Homogenizer
Ariete (Model NS1001L – PANDA, Niro Soavia S.P.A., Italy) operating at a pressure as
indicated in Table 2.1.
The droplet size distribution of the different emulsions was measured using a
Malvern MasterSizer X (Malvern Instruments Ltd., Malvern, UK) and the mean droplet
size is reported as the volume-to-surface diameter:
N
i
ii
N
i
ii
dn
dn
d
1
2
1
3
32 , (2.1)
where ni is the number of droplets with diameter di and N is the total number of
droplets.
26

Whey protein gels
Table 2.1 - Some characteristics of the preparation and properties of the different emulsions (60
wt% aqueous phase, 40 wt% oil) prepared under different experimental conditions.
Emulsion WPI
Concentration
WPI (wt%)a
Pressure
(bar)b
d3,2 ( m)c
Creaming rate
(µm/ day)
Emulsion A Native 2.7 300 1.36 0.12 80
Emulsion B Aggregates 2.7 300 2.00 0.23 320
Emulsion C Aggregates 9 300 1.29 0.11 14
Emulsion D Aggregates 9 400 + 440 0.77 0.07 1
a) Protein concentration in the aqueous phase;
b) Homogenisation pressure;
c) Volume-surface average diameter;
d) Creaming rate at 1xg.
2.2.4 Determination of the interfacial tension
The equilibrium interfacial tension ( OW) between peanut oil and WPI aggregates
dispersion (9 wt%) was determined using an automated drop tensiometer, ADT, (IT
Concept, Longessainge, France). With this method, an oil droplet is formed in an aqueous
solution, and the OW is determined by axi-symmetric drop-shape analysis. This
experiment was performed in the rising drop configuration at 25 °C. The OW value
determined after 50 min equilibration is reported.
2.2.5 Preparation of emulsion-filled acidified protein gels
Emulsion-filled acidified protein gels with different protein and oil concentrations were
prepared according to the method described below. First, the 9 wt% WPI aggregates
solution was diluted with RO water to the desired concentration of WPI aggregates. Next,
GDL was added as a powder in the appropriate amount to induce cold gelation and to
reach a final pH of around 4.8 (concentrations according to Alting et al. (2003a), as
indicated in Table 2.2). After stirring for about 2 min, the required amount of emulsion
was added. The final composition of the filled protein gels was 3% to 8.9 wt% WPI
aggregates in the aqueous phase and between 0% and 35 wt% peanut oil in the total
sample.
27

Chapter 2
Test pieces for the compression tests were formed in 60mL syringes (diameter of
26.4 mm) coated with a thin layer of paraffin oil, while gels for small deformation
rheology were formed in the measuring device. Acidification took place for at least 16
hours at 25°C. Aliquots for microstructural analysis were mixed with a dye solution and
poured into special glass cells.
Table 2.2 - Composition of the emulsion-filled gels and applied GDL concentration.
WPI concentration in the
aqueous phase
(wt %)
GDL concentration in the
aqueous phase
(wt %)
Concentration peanut oil
based on the total sample
(wt %)
3 0.22 0 - 15
5 0.36 0 - 25
7 0.49 0 - 30
8.9 0.62 0 - 35
2.2.6 Creaming behaviour
Emulsion-filled suspensions with the same composition as the emulsion-filled gels (see
above) were prepared without the addition of GDL. The stability against creaming of the
four different emulsions, the filled suspensions, and the filled gels were measured at room
temperature with two methods. Following the first method, the back scattering intensity of
incident laser light was measured along the height of an optical glass tube at different
times, using a Turbiscan MA 2000 (Ramonville St. Agne, France). Following the second
method, the transmission profiles along the height of a LUM PC rectangular synthetic cell
at different times were obtained using a LUMiFuge 116 at a speed of 3000 rpm (1147 g)
and 1772 rpm (400 g), and using a factor light of 3.00. These profiles give a qualitative
indication of the distribution of the oil droplets along the height of the tube.
2.2.7 Large deformation experiments
After acidification ( 20 h) the gels were removed from the syringe and cut with a wire
(specimen height: 25 mm). Uniaxial compression tests were performed with an Instron
28

Whey protein gels
universal testing system (model 5543, Instron Corp.) between two parallel plates
(diameter: 150 mm) lubricated with a thin layer of paraffin oil. Fracture measurements
were done at ambient temperature (23 1 C), applying compression at a crosshead
velocity of 1.0 mm/s up to a linear strain of 95%. Eight replicates were measured and the
mean values for fracture stress and strain were calculated. The specimen’s absolute
deformation is expressed as the Hencky’s or true strain ( H) (Peleg, 1987):
Ho
HdH
H
H
Ho
H ln1
(2.2)
where Ho is the initial specimen height and H is the final height after deformation. The
overall stress acting on the sample during compression is expressed as the so-called true
stress t:
A
Ft (2.3)
where F is the force measured during compression and A is the cross-sectional area of the
sample. The true stress accounts for the continuous change in the cross-sectional area
assuming no change in cylindrical shape and constant volume during the compression.
2.2.8 Small deformation experiments
Small deformation properties of the filled gels were determined in dynamic oscillation
with a Carrimed CSL2 500 Rheometer (TA Instruments a division of Waters, Etten-Leur,
The Netherlands) using a concentric cylinder geometry (inner radius 8.60 mm, outer
radius 9.33 mm). Immediately after GDL addition, the samples were transferred to the
rheometer and their surface was covered with a thin layer of paraffin oil to prevent
evaporation. The development of the storage modulus (G’) and the loss modulus (G”)
during gelation was recorded during 16 hours at 25 °C at a strain of 1% and a frequency of
1 Hz. After this step, a strain sweep was recorded at increasing strain from 0.1% to 500%
to verify the linear region. The loss tangent, tan , was calculated by (van Vliet, 1995):
'
"tan
G
G. (2.4)
29

Chapter 2
2.2.9 Confocal Laser Scanning Microscopy (CLSM)
Samples for microstructural analysis were stained with Rhodamine B (0.2% solution; 10
µL per mL sample) to visualise the protein phase or with BODIPY® 581/591 C11
(1 mg mL-1
solution; 10 µL per mL sample) to visualise the oil phase. CLSM-images were
recorded on a LEICA TCS SP Confocal Laser Scanning Microscope (Leica Microsystems
CMS GmbH., Manheim, Germany), equipped with an inverted microscope (model Leica
DM IRBE), in the single photon mode with an Ar/Kr visible light laser. A Leica objective
lens (63x/UV/1.25NA/water immersion/PL APO) was used. The excitation wavelength
was set at 568 nm. The emission maxima of Rhodamine B and BODIPY® 581/591 C11 are
respectively 625 nm and 591 nm (Haugland, 2002; van de Velde et al., 2003). Digital
image files were acquired in multiple tif formats and in 1024x1024 pixel resolution.
2.2.10 Statistical analysis
Analysis of variance (ANOVA) was calculated using STATISTICA (release 7.0; StatSoft
Inc., USA, 2004).
2.3 Results and Discussion
2.3.1 Characterisation of the emulsions
Both native WPI and WPI aggregates were used to prepare WPI-stabilised stock
emulsions. The different stock emulsions were prepared according to the compositions
and process conditions indicated in Table 2.1. To obtain emulsions with a comparable
droplet size distribution, a higher concentration of WPI aggregates was required compared
to native WPI (compare emulsions A to C). Emulsions with smaller droplets were
prepared by applying a higher homogenisation pressure (compare emulsions C and D).
Under the conditions applied, e.g. 9 wt% WPI aggregates and a droplet size around 1 µm,
the protein concentration was sufficient to cover all oil droplets. After removal of the oil
droplets by centrifugation the aqueous phase still contained protein (data not shown).
CLSM images showed that the emulsions were homogeneous and non-aggregated (Figure
2.1). Moreover, the emulsions were stable for more than one week as determined by the
backscattering profiles measured using the Turbiscan (data not shown) and by the
30

Whey protein gels
creaming rates obtained upon centrifugation (Lumifuge; Table 2.1). The latter has been
recalculated to creaming rates under normal gravity forces. No aggregation of the
emulsion droplets was observed upon storage of the stock emulsions during one week
(CLSM imaging and droplet size distribution). The letter code used throughout this paper
to identify the different stock emulsions is described in Table 2.1.
2.3.2 Stability and instability of emulsion-filled gels
As described in the introduction, emulsion-filled cold-set protein gels were obtained by
acidification of an emulsion-filled suspension of protein aggregates. This emulsion-filled
suspension was obtained by mixing an emulsion with a concentrated WPI aggregate
suspension. Remarkable differences were observed upon mixing WPI aggregates with
emulsions stabilised by either native WPI or WPI aggregates. The native WPI stabilised
emulsions exhibited creaming of the emulsion droplets, whereas the WPI aggregate
stabilised emulsions were stable.
The back scattering profiles (Turbiscan; data not shown) at different times for the
emulsion-filled suspensions (before acidification) were typical for creaming of a
flocculated emulsion. Over time the oil droplets moved upward due to gravity, which
caused an increase in the back scattering at the top of the sample and a decrease at the
bottom. After a certain time, all the oil droplets reached the upper phase and became
closely packed together, forming a creamed layer. Likely, the mixture of WPI aggregates
and native WPI stabilised emulsion became unstable due to the differences in size and
shape between the aggregates and the oil droplets, leading to depletion-flocculation. This
caused phase separation in a few hours or minutes depending on WPI and oil
concentrations.
When the mixed suspensions were acidified by addition of GDL, the creaming of
the system was retarded. Moreover, the mixture gelled before phase separation was
complete. Acidification of the filled suspension resulted in an increase of the viscosity of
the aqueous phase due to the reduction of the electrostatic repulsion between the protein
aggregates. Next, the gel formed and the emulsion droplets became entrapped in the
matrix. This process resulted in a heterogeneous filled gel (Figure 2.1).
The emulsion-filled gels prepared from emulsions stabilised with WPI-aggregates
were stable, as shown by their back scattering profiles (Turbiscan; data not shown). The
31

Chapter 2
microstructure of these filled-gels as determined by Confocal Laser Scanning Microscopy
(CLSM; Figure 2.1) showed a homogeneous distribution of the emulsion droplets over the
height of the sample.
Figure 2.1 - CLSM images taken along the height of emulsion-filled gels containing emulsions
droplets stabilised by native WPI (left; emulsion A) and by WPI-aggregates (right; emulsion C);
images stained with Rhodamine B showing the protein; total height of the cuvet 38 mm. On the
left and right side: the original emulsions stained with Bodipy C11 showing the oil phase. Image
size: 160µm x 160 µm.
As the filled gels containing WPI aggregates stabilised emulsions were stable
during the gelation period, the creaming rates of the emulsion droplets in the filled
suspensions, i.e. before acid-induced gelation, were determined at 1147xg using the
LUMiFuge. Figure 2.1 shows the creaming rate at 1 g as a function of WPI and oil
concentration. The creaming rate of these filled suspensions was very low (below 0.2 mm/
day). For higher WPI / oil concentrations the creaming rate was lower, indicating that the
dispersions with a higher protein and oil concentration were more stable. Thus the
emulsion-filled suspension prepared from emulsions stabilised with WPI-aggregates were
stable during the gelation period of 16 hours.
32

Whey protein gels
The decrease in creaming rate at increasing protein and oil concentrations can be
related to an increase in the viscosity of the suspensions and to the repulsion between
protein aggregates and protein adsorbed on the oil droplet surface. Unfortunately, the
conformation of the protein aggregates absorbed on the droplet surface is not elucidated.
Furthermore, the thickness of the absorbed protein layer on the droplet surface is higher in
the case of aggregated proteins (d is around 60 to 80 nm) compared to native proteins (size
is around 3 nm). Therefore, the density of an aggregate-stabilised emulsion droplet is
higher than that of a native protein stabilised emulsion droplet. Thus in the case of
aggregate stabilised emulsions the density differences is lower, which results in a lower
creaming rate.
0.00
0.05
0.10
0.15
0.20
0 10 20 30 40
Oil concentration (wt%)
Cream
ing
rate
(m
m/d
ay)
Figure 2.2 - Creaming rates at 1 g of the filled solutions prepared from emulsion stabilised by
WPI-aggregates (Emulsion C) with different concentrations of WPI and oil ( 3 wt% WPI, 5
wt% WPI, 7 wt% WPI, 8.9 wt% WPI).
2.3.3 Small deformation properties
The development of the dynamic moduli of the emulsion-filled protein gels with 5 wt%
WPI and different oil fractions was followed during gelation. In Figure 2.3A results for
the storage modulus (G’) are shown. The initial increase in storage modulus did not differ
remarkably between gels with and without oil. Over time, with decreasing pH, the storage
modulus started to increase, indicating that a gel was formed. The storage modulus of the
emulsion-filled gels increased faster than that of the gel without oil. After gelation, a strain
sweep was recorded to verify the strain value selected for the gelation measurements.
33

Chapter 2
Figure 2.3B shows that the storage modulus of the gels was not affected by the strain up to
a strain of 4 to 10% depending on the oil fraction. Thus, the gelation measurements carried
out at 1% strain fall within the linear region. Moreover, Figure 2.3B shows that the critical
strain decreases with increasing oil content.
0
2000
4000
6000
8000
0000
0
2000
4000
6000
8000
0.1 1 10 100
Strain (%)
G' (P
a)
0 20000 40000 6
Time (s)
G' (P
a)
A B
Figure 2.3 - Storage modulus (G’) of the emulsion-filled gels with 5 wt% WPI aggregates for
different oil concentrations (Emulsion C (d32 = 1.3 m)): A: Gelation followed in time; B: Strain
dependency ( 0 wt% oil, 10 wt% oil, 20 wt% oil).
The values for the dynamic moduli and the loss tangent (tan ) 16h after GDL
addition were used to evaluate the effect of both protein and oil concentration on the
properties of emulsion-filled gels. The measured storage moduli (G’) are given in Figure
2.4 and Table 2.3. The final values of the loss tangent (tan ) were about the same for the
different gels (values around 0.14), implying visco-elastic behaviour.
34

Whey protein gels
100
1000
10000
100000
1000000
0 0.1 0.2 0.3 0.4
Oil fraction (w/w)
G' (P
a)
Figure 2.4 - Storage modulus (G’) of emulsion-filled gels with different protein concentrations as
a function of the oil fraction (Emulsion C (d32 = 1.29 m)); ( 3 wt% WPI, 5 wt% WPI, 7
wt% WPI, 8.9 wt% WPI).
Table 2.3 - Storage modulus, G’ (kPa), of the emulsion filled WPI gels.
WPI concentration (wt% )
3 5 7 8.9
Oil (wt %)
1.3 µm 0.8 µm 1.3 µm 1.3 µm 0.8 µm 1.3 µm
8 1.4 5.2 5.2 14.5 26.5 26.5
10 1.9 7.4 6.3 15.3 31.0 26.2
15 2.3 23.8
17.5 28.7
20 8.7 7.0 17.1 32.7 31.0
30 16.8 36.6 28.5
The storage modulus (Figure 2.4) increased strongly with protein concentration.
This increase can be explained by an increase in protein-protein interactions, which gave
rise to a stronger network (Alting et al., 2003a). At higher oil concentration the storage
modulus was slightly larger. This means that the dispersed oil droplets did not act as space
fillers, but helped to build up the gel matrix structure through interaction between protein
molecules at the droplet surface and those in the gel matrix, so they behaved as active
35

Chapter 2
fillers (van Vliet, 1988). During gel formation, the GDL added gives a pH-decrease to a
pH below the isoelectric point of the WPI (5.1 for -lactoglobulin), which leads to
reduction of the electrostatic repulsion between the aggregates and thereby promotion of
aggregation through non covalent interactions (Alting et al., 2000). Apparently, the WPI
aggregates adsorbed at the O/W interface of the droplets are able to interact with those
present in the bulk. In addition, even at low pH, covalent cross links between aggregates
in the protein matrix are formed via thiol-disulfide rearrangements (Alting et al., 2003b).
Covalent interaction may also occur between protein aggregates on the oil droplet surface
and those in the gel matrix.
2.3.4 Modelling of the experimental results
The experimentally observed effect of oil fraction on the storage modulus was
compared with theoretical predictions according to van der Poel’s theory. This theory
allows to calculate the shear modulus of composite materials containing particles non-
interacting with each other. The original theory was simplified by Smith (Smith, 1975).
The increase in gel modulus with filler content depends among others on the ratio (M)
between the storage modulus of the filler material (G’f) that of the gel matrix (G’m):
'
'
m
f
G
GM . (2.5)
In the case of emulsion-filled gels, the storage modulus of the dispersed oil
droplets depends on their size and interfacial tension according to (van Vliet, 1988):
RG f
2' , (2.6)
where is the oil/ water phase interfacial tension and R is the radius of the droplet.
The relation between the modulus of the composite (G’) and that of the matrix
(G’m) as a function of the oil concentration can be obtained using the second-order
solution of the van der Poel’s formula as simplified by Smith:
)1)(108(
)1)(1(151
'
'
MvQ
Mv
G
G
m
m
m
, (2.7)
where is the volume fraction of oil droplets and Q = (8-10vm)M + 7 – 5vm (vm is the
Poisson ratio of the matrix, which was taken to be equal to 0.5).
36

Whey protein gels
Equation 7 was used to calculate the ratio between the storage modulus of the
filled gels (G’) and the storage modulus of the matrix gel (G’matrix) as a function of oil and
protein concentration. Figure 2.5 shows the results of these calculations together with the
experimental results. The oil/ water phase (9 wt% WPI aggregates at pH 6.7) interfacial
tension was measured using an automated drop tensiometer. Values between 1 mN.m-1
and 10 mN.m-1
were obtained. These values are very low for a system consisting of an oil
and a protein solution. They may be caused by the possible presence of mono- and
diglycerides in the peanut oil, that was used without previous purification. In order to
calculate the modulus of the oil droplets, a value of 6 mN.m-1
was used.
The van der Poel’s theory correctly predicted the effect of the stiffness of the
protein matrix on the stiffness of the emulsion-filled gels. As shown in Figure 2.5, the
increase in storage modulus with oil concentration was more pronounced for lower protein
concentrations, i.e. matrices with a lower stiffness. Moreover, for the emulsion-filled gel
containing 9 wt% WPI in the water phase a slight decrease in the modulus was observed.
Figure 2.6 shows the storage modulus of the protein matrix as a function of the protein
concentration in the aqueous phase. From this curve it was calculated that at a protein
concentration of 7.8 wt% the moduli G’matrix and G’filler were equal. G’filler of emulsion C
was calculated to be 18.6 kPa. This value agrees well with the results for the filled gels
containing 7 wt% WPI aggregates in the aqueous phase (Figure 2.5). Thus, the ratio
between the moduli of the matrix (G’matrix) and filler (G’filler) is an important parameter
determining the properties of emulsion-filled gels.
37

Chapter 2
0
0.5
1
1.5
2
2.5
3
0 0.1 0.2 0.3 0.4 0.5
Oil fraction (w/w)
G' /
G' m
Figure 2.5 - Influence of oil fraction on the ratio (G’ / Gm’) for emulsion-filled gels with different
protein concentrations in the aqueous phase (Emulsion C (d32 = 1.3 m)). The points are
experimental results and the lines are calculated results from van der Poel’s theory ( 3 wt%
WPI, 5 wt% WPI, 7 wt% WPI, 8.9 wt% WPI).
100
1000
10000
100000
0 4 8
Concentration WPI (% w/w)
G' (P
a)
12
Figure 2.6 - Storage modulus (G’) of the protein matrix plotted as a function of the concentration
of WPI aggregates in the aqueous phase.
As the size of the emulsion droplets is directly related to their stiffness, the effect
of the droplet size was also investigated. As can be derived from equation 6, smaller
emulsion droplets are stiffer and thus should result in a more pronounced increase in the
stiffness of the composite. Figure 2.7 shows the storage moduli of two emulsion-filled gels
with different droplet sizes. A reduction of the droplet size from 1.3 m to 0.8 m had
only a slight effect on the observed increase in the storage modulus of the 5 wt% and 9
38

Whey protein gels
wt% WPI gel. As predicted, the gels with smaller oil droplets were slightly stiffer
compared to those with the bigger droplets.
100
1000
10000
100000
1000000
0 0.1 0.2 0.3 0.4
Oil fraction (w/w)
G' (P
a)
Figure 2.7 - Storage modulus (G’) of emulsion-filled gels as function of the oil fraction for
different protein concentrations and droplet sizes (Emulsions C and D) (Black symbols: d3,2 =
1.29 m, Grey symbols: d3,2 = 0.77 m, 5 wt% WPI, 8.9 wt% WPI).
Concluding, the van der Poel’s theory correctly predicted the effects of both the
matrix stiffness and droplet properties on the stiffness of the emulsion-filled gels.
However, Figure 2.5 also shows that for all protein and oil concentrations studied, the
experimental values of the ratio (G’ / Gm’) were slightly higher than predicted by the van
der Poel’s theory. This small discrepancy between the experimental results and theory
may be caused by several factors such as errors in the calculated droplet stiffness. The
estimate of the interfacial tension used for this calculation may have played an important
role in this respect.
2.3.5 Large deformation properties
2.3.5.1 Effect of homogenisation on WPI gels
In the case of emulsions stabilised with WPI-aggregates, the aggregates in the
stock emulsion will take part in the protein matrix forming the filled-gel. As these
aggregates are homogenised during the preparation of the emulsion, the effect of this
homogenisation step on the fracture properties of WPI gels was studied. WPI-aggregate
solutions were homogenised under the conditions used for the emulsion preparation and
39

Chapter 2
subsequently used to prepare emulsion-free protein gels. The fracture properties of the
gels prepared from homogenised aggregates were compared with of those of the untreated
aggregates (Table 2.4). An analysis of variance did not show any statistical differences
between the reference gels and the gels prepared from homogenised aggregates.
Therefore, we concluded that the homogenisation step did not affect the properties of the
aggregates used to stabilise the emulsions.
Table 2.4 - Fracture properties of WPI gels.
Gel type Property Mean value
reference
Mean value
homogenised
p-value
Modulus (kPa) 3.4 3.2 0.361
Fracture stress (kPa) 3.7 3.4 0.119
WPI 9-3
True fracture strain (-) 1.10 1.05 0.112
Modulus (kPa) 9.5 9.3 0.693
Fracture stress (kPa) 8.6 7.4 0.419
WPI 9-5
True fracture strain (-) 1.29 1.17 0.158
2.3.5.2 Filled gels
Fracture stress and strain, which are a measure of the strength of the material and
its deformability before fracture occurs, are important quality characteristics of solid and
solid-like food products (Kim et al., 2001). Therefore, the fracture properties of the
emulsion-filled protein gels with different protein and oil concentrations were studied for
two droplet sizes (d32 = 1.3 m and d32 = 0.8 m; see Table 2.2) by uniaxial compression.
A crosshead speed of 1 mm/s was selected to be relevant for compression speeds that
occur in the mouth during palating of semi-solid foods. A detailed study on the effect of
compression speed on the fracture properties of emulsion filled gels will be described in
chapter 5 (Sala et al., to be published). Figure 2.8 shows the fracture stress and strain of
the emulsion-filled protein gels as a function of the oil fraction for different protein
concentrations. The observed increase in the true stress with increasing protein
Modulus (kPa) 23.7 23.5 0.831 WPI 9-
Fracture stress (kPa) 17.7 19.3 0.556
7
True fracture strain (-) 1.30 1.57 0.065
40

Whey protein gels
concentration is in agreement with the published data for the cold gelation of globular
proteins (Alting et al., 2003a).
In general, Figure 2.8 shows a slight effect of the addition of emulsion droplets on the
fracture properties of the emulsion-filled gels. In the case of the highest protein
concentrations (7% and 8.9% WPI), a small increase in the fracture stress is observed with
increasing oil concentration. On the other hand, at low protein concentrations (3% and 5%
WPI) the fracture stress slightly decreases with increasing oil concentration. The fracture
strain decreases with the increase of the oil concentration, so that the gels with higher oil
content are somewhat more brittle. This is in agreement with the observed decrease in
critical strain as measured by small deformation measurements (Figure 2.3B). Although
the effect of the oil concentration on fracture properties was small, the differences were
statistically significant. Moreover, Figure 2.8 shows that the size of the oil droplets did not
have a large effect on fracture properties.
0
9
18
27
36
45
0 10 20 30 40
Oil concentration (wt%)
Tru
e F
ractu
re S
tress (
kP
a)
0
0.5
1
1.5
2
0 10 20 30 40
Oil concentration (wt%)
Tru
e F
ractu
re S
train
A B
Figure 2.8 - Effect of oil droplet size and WPI concentration on fracture properties of emulsion-
filled protein gels as a function of oil concentration (Emulsions C and D): A: True fracture stress;
B: True fracture strain ( 3 wt% WPI, 5 wt% WPI, 7 wt% WPI, 8.9 wt% WPI). d32 =
1.3 m (closed symbols) and d32 = 0.8 m (open symbols). Error bars represent the standard
deviation of the 8 replicates.
41

Chapter 2
2.4 Conclusions
Stable and homogeneous emulsion-filled gels with different protein and oil concentrations
can prepared by cold gelation of emulsions obtained by mixing suspensions of soluble
WPI aggregates with 40 wt% oil-in-water stock emulsions stabilised with the same WPI
aggregates. With increasing oil concentration the fracture stress of these gels increases
slightly, whereas the fracture strain slightly decreases. The experimental results for the
storage modulus (G’) after 16 hours of acidification are in good agreement with
predictions for the influence of oil and protein concentration on the stiffness of filled gel
according to the van der Poel’s theory for calculating the shear modulus of particulate
composites.
2.5 Acknowledgements
Saskia de Jong-Kok (WCFS/NIZO food research) is acknowledged for her help with the
rheological experiments and helpful discussions. Jan Benjamins (WCFS) is acknowledged
for performing the interfacial tension measurements at Wageningen University.
2.6 References
Alting, A.C. (2003). Cold gelation of globular proteins. Thesis, Wageningen University,
Wageningen.
Alting, A.C., Hamer, R.J., de Kruif, C.G., & Visschers, R.W. (2000). Formation of disulphide
bonds in acid-induced gels of pre-heated whey protein isolate. Journal of Agricultural and
Food Chemistry, 48 (10), 5001-5007.
Alting, A.C., Hamer, R.J., de Kruif, C.G., & Visschers, R.W. (2003a). Cold-set globular protein
gels: Interactions, structure and rheology as a function of protein concentration. Journal of
Agricultural and Food Chemistry, 51 (10), 3150-3156.
Alting, A.C., Hamer, R.J., de Kruif, C.G., Paques, M., & Visschers, R.W. (2003b). Number of
thiol groups rather than the size of the aggregates determines the hardness of cold set whey
protein gels. Food Hydrocolloids, 17 (4), 469-479.
Alting, A.C., Weijers, M., de Hoog, E.H.A., van de Pijpekamp, A.M., Cohen-Stuart, M.A., Hamer,
R.J., de Kruif, C.G., & Visschers, R.W. (2004). Acid-induced cold gelation of globular
proteins: effects of protein aggregate characteristics and disulfide bonding on rheological
properties. Journal of Agricultural and Food Chemistry, 52 (3), 623-631.
42

Whey protein gels
Chen, J., & Dickinson, E. (1998). Viscoelastic properties of heat-set whey protein emulsion gels.
Journal of Texture Studies, 29 285-304.
Dickinson, E., & Chen, J. (1999). Heat-set whey protein emulsion gels: role of active and inactive
filler particles. Journal of Dispersion Science and Technology, 20 (1&2), 197-213.
Haugland, R.P. (2002). Handbook of fluorescent probes and research chemicals. Eugene, OR,
USA: Molecular Probes Inc.
Kim, K.-H., Renkema, J.M.S., & van Vliet, T. (2001). Rheological properties of soybean protein
isolate gels containing emulsion droplets. Food Hydrocolloids, 15 (3), 295-302.
Koidis, A., Paraskevopoulou, A., & Kiosseoglou, V. (2002). Fracture and textural properties of
low fat egg yolk gels containing emulsion droplets. Food Hydrocolloids, 16 (6), 673-678.
Peleg, M. (1987). The basics of solid foods rheology. In H.R. Moskowitz, Food texture -
Instrumental and sensory measurements (Vol. (pp. 3-33). New York: Marcel Dekker.
Ring, S., & Stainsby, G. (1982). Filler reinforcement of gels. Progress in Food and Nutrition
Science, 6 232-329.
Smith, J.C. (1974). Correction and extension of the van der Poel method for calculating the shear
modulus of particulate composite. Journal of Research of the National Bureau of Standard,
78A (3), 355-361.
Smith, J.C. (1975). Simplification of the van der Poel's formula for the shear modulus of
particulate composite. Journal of Research of the National Bureau of Standard, 79A (2), 419-
423.
Sok Line, V.L., Remondetto, G.E., & Subirade, M. (2005). Cold gelation of beta-lactoglobulin oil-
in-water emulsions. Food Hydrocolloids, 19 (2), 269-278.
Tolstoguzov, V.B., & Braudo, E.E. (1983). Fabricated foodstuffs as multicomponent gels. Journal
of Texture Studies, 14 183-212.
Totosaus, A., Montejano, J.G., Salazar, J.A., & Guerrero, I. (2002). A review of physical and
chemical protein-gel induction. International Journal of Food Science & Technology, 37 (6),
589-601.
van de Velde, F. (2004). Process of preparing a water-continuous filled gel composition. EP
1645192 (12-04-2006).
van de Velde, F., Weinbreck, F., Edelman, M.W., Van der Linden, E., & Tromp, R.H. (2003).
Visualisation of biopolymer mixtures using confocal scanning laser microscopy (CSLM) and
covalent labelling techniques. Colloids and Surfaces B: Biointerfaces, 31 (1-4), 159-168.
van der Poel, C. (1958). On the rheology of concentrated dispersion. Rheologica Acta, 1 198-205.
van Vliet, T. (1988). Rheological properties of filled gels. Influence of filler matrix interaction.
Colloid & Polymer Science, 266 518-524.
43

Chapter 2
van Vliet, T. (1995). Mechanical properties of concentrated food gels. In E. Dickinson, & D.
Lorient, Food macromolecules and colloids (pp. 447-455). Cambridge: The Royal Society of
Chemistry.
van Vliet, T. (2002). On the relation between texture perception and fundamental mechanical
parameters for liquids and time dependent solids. Food Quality and Preference, 13 (4), 227-
236.
van Vliet, T., & Walstra, P. (1995). Large deformation and fracture behaviour of gels. Faraday
Dsicussions, 101 359-370.
Weijers, M., van de Velde, F., Stijnman, A., van de Pijpekamp, A., & Visschers, R.W. (2006).
Structure and rheological properties of acid-induced egg white protein gels. Food
Hydrocolloids, 20 (2-3), 146-159.
44

Whey protein gels
2.7 Appendix
Van der Poel developed a formula to estimate the shear modulus of a particulate
composite (van der Poel, 1958), which was simplified by Smith (Smith, 1975). According
to this theory, the storage modulus of the filled gels can be calculated using the following
equation:
02 XX , (2.A1)
where , and are given by:
23/23/7 1)1(126)1(38 MPMQSP (2.A2A)
185.7135.435.17 3/7 MSPMMP (2.A2B)
125.131 MP (2.A2C)
where is the volume fraction of oil droplets, P = 9.5M + 8, S = 166.25M – 9.5P and
Q = (8-10vm)M + 7 – 5vm (vm is the Poisson ratio which was taken to be equal to 0.5)
(Chen et al., 1998). When this equation is solved for X the positive root is equal to (G’ /
Gm’) – 1.)
The second-order solution can be written as (Smith, 1975):
)1)(108(
)1)(1(151
'
'
MvQ
Mv
G
G
m
m
m
. (2.A3)
45


G. Sala, G.A. van Aken, M. Cohen Stuart, F. van de Velde (2007). Effect of droplet-matrix
interactions on large deformation properties of emulsion-filled gels, Journal of Texture Studies,38,
511-535.
Chapter 3
Effect of droplet-matrix interactions on large deformation properties of
emulsion-filled gels

Chapter 3
Abstract
The aim of this chapter was to identify the effect of droplet-matrix interactions on the
large deformation properties of emulsion-filled gels. A study was carried out on the
behaviour in compression of gelatine, whey protein isolate (WPI) and -carrageenan gels
containing bound and unbound emulsion droplets. For gelatine gels, emulsions stabilised
with WPI and lysozyme induced an increase of the modulus, while emulsions stabilised
with Tween induced a decrease of the modulus. It was concluded that in the first two cases
the oil droplets were bound to the gel matrix and that in the latter case the oil droplets
were unbound. For WPI gels, emulsions stabilised with WPI aggregates, lysozyme and a
low concentration of Tween induced an increase of the modulus (bound droplets). The
modulus variations observed for -carrageenan gels were mainly related to interactions
between -carrageenan and the emulsifying agent present in the aqueous phase. Theories
based on the effect of the oil content on modulus satisfactorily fitted the trend of the
experimental results, both for bound and unbound droplets. The fracture strain decreased
with increasing oil concentration for droplets bound to the matrix and remained constant
for unbound droplets. The fracture stress was unaffected by bound droplets and decreased
in the case of unbound droplets. Theories describing the effect of filler content on fracture
strain and stress failed to predict the experimental results. This was attributed to the small
size of the oil droplets of the emulsions used in this study, which was similar to the size of
the inherent defects present in the gel network.
48

Droplet-matrix interactions
3.1 Introduction
3.1.1 Filled gels
The rheological properties of emulsion-filled gels systems depend on the properties of
both the gel matrix and the oil droplets, the oil droplet concentration and the nature of the
droplet-matrix interactions (Tolstoguzov & Braudo, 1983; van Vliet, 1988). Oil droplets
entrapped in a gel matrix behave as particles. Typically, a protein-stabilised oil droplet
with a diameter of 1 m has a shear modulus of about 40 kPa (van Vliet 1988). Depending
on their effect on gel modulus, filler particles were classified as either active or inactive
(Ring & Stainsby, 1982). Active fillers are bound to the gel matrix and, depending on the
ratio between their modulus and that of the matrix, they either increase or decrease the gel
modulus. Inactive fillers have little chemical or physical affinity to the molecules forming
the gel matrix and always decrease the gel modulus. This terminology can be confusing.
As a matter of fact, when the modulus of the fillers is smaller than that of the matrix both
bound and unbound fillers have the same effect on gel modulus (i.e. the gel modulus
decreases at increasing filler concentration). Therefore, in this study the terms bound and
unbound will be used instead of active and inactive.
The interactions between filler and gel matrix depend on the surface properties of
the filler particles, in particular the nature of the stabilising agent (Dickinson & Chen,
1999). This aspect has been studied in different kinds of food gels matrices.
Most data available in literature on emulsion-filled gels concern heat-set whey
protein gels and acid-induced skimmed milk/casein gels. Both small and large
deformation properties of these gels have been studied. In heat-set whey protein gels, oil
droplets stabilised by whey protein were found to behave as active fillers, whereas oil
droplets stabilised by a non-ionic surfactant (polyoxyethylene sorbitan monolaurate,
Tween 20) weakened the gel (Dickinson, Hong & Yamamoto, 1996; Yang, Chen &
Chang, 1998; Chen & Dickinson, 1999; Dickinson et al., 1999; Chen, Dickinson, Langton
& Hermansson, 2000). Compression measurements on heat-set whey protein gels showed
similar phenomena (McClements, 1993). For heat-induced whey protein gels (Langley,
1989) the introduction of glass spheres resulted in different behaviour, depending on the
surface properties of the glass. Spheres with a hydrophilic surface induced a larger
increase of the fracture stress than hydrophobic spheres. Furthermore, gels with
hydrophobic particles fractured adjacent to the sphere surface, indicating weak interaction
49

Chapter 3
between the sphere and the gel matrix. For gels with hydrophilic spheres, fracture
occurred within the gel matrix. This showed that the spheres were strongly bound to the
gel matrix. In acid-induced skimmed milk/casein gels emulsions stabilised by caseinate,
whey protein or skimmed milk powder behaved as active fillers, increasing modulus (van
Vliet, 1988; Xiong, Aguilera & Kinsella, 1991a; Xiong & Kinsella, 1991b; Chen,
Dickinson & Edwards, 1999) and compression stress (Aguilera & Kinsella, 1991; Xiong
et al., 1991a; Xiong et al., 1991b) as compared to gels without emulsions. Washed natural
milk fat globules decreased the modulus of these gels (van Vliet, 1988), whilst emulsions
stabilised by Tween 80 only slightly increased modulus and compressive stress (Xiong et
al., 1991b).
Fewer studies are available with regard to other gel matrices. In transglutaminase-
induced soy protein gels (Matsumura, Kang, Sakamoto, Motoki & Mori, 1993) and heat-
set soy protein gels (Kim, 2001), oil droplets stabilised with the same protein behaved as
active filler. In agar gels containing emulsion droplets stabilised by fatty acids of
polyglycerolesters (Kim, 1996) an increase of the droplet size and concentration resulted
in a decrease of the fracture stress and strain measured in compression tests.
Literature data on the rheological properties of emulsion-filled gels mostly analyse
the effect of oil droplets on the properties of a particular kind of gel, but do not offer much
consistent insight in the underlying mechanisms. In this chapter, we fill this gap by
studying the effects of the interactions between oil droplets and gel matrix on the large
deformation properties of both particle and polymer gels. The systems studied consisted of
acid-induced cold-set WPI, gelatine, and -carrageenan gels to which emulsions stabilised
with native WPI, WPI aggregates, lysozyme and Tween were added. This approach
allowed to systematically vary the interactions between oil droplets and the gel matrix.
Moreover, for WPI and gelatine gels it was possible to control the aggregation of the oil
droplets. Therefore, the effect of oil droplet aggregation on large deformation properties
could also be studied for samples with constant composition. The validity of theories
describing the effect of filler content on elastic modulus, fracture strain and fracture stress
of composite materials was tested by comparing experimental data and theoretical
predictions.
50

Droplet-matrix interactions
3.1.2 Theories predicting the effect of filler content on modulus
Most studies published in literature on emulsion-filled gels describe the effect of
oil droplets on storage modulus as determined by small deformations rheological
measurements. For the prediction of the experimental results, both the van der Poel (van
der Poel, 1958; Smith, 1974, 1975) and the Kerner (Kerner, 1956; Lipatov, 1977) theories
have been applied (Brownsey, Ellis, Ridout & Ring, 1987; van Vliet, 1988). These
theories were chosen because of their wide applicability and the good prediction of
experimental data for polymer dispersions containing filler particles. Both theories assume
the matrix to be completely adherent to the fillers (i.e. the fillers to behave as bound
fillers) and the filler particles to be non-interacting with each other and homogeneously
distributed through the gel network. The similarity between the two theories can be seen in
Figure 3.1.
0.0
0.5
1.0
1.5
2.0
2.5
3.0
0 10 20 30 40 50
Filler concentration (% v/v)
G’ g
/ G
’ m
Figure 3.1 – Effect of filler concentration on modulus as calculated according to the van der Poel
theory (continuous line), the Kerner theory (broken bold line) and the Kerner theory corrected for
the maximum packing of the fillers (dotted thin line). (G’g: modulus of the filled gel; G’m :modulus
of the matrix; ratio between filler and matrix modulus: 7.5).
The theories predict the modulus of filled gels at a given filler concentration
(volume fraction), for given moduli of gel matrix (G’m) and filler particles (G’f). In the
case of bound fillers, three different situations can be described:
- G’f > G’m: under deformation, the filler particles deform less than the matrix; as
a consequence, the modulus of the filled gel is higher than that of the matrix;
51

Chapter 3
- G’f = G’m: under deformation, the filler particles deform equally to the matrix;
as a consequence, the modulus of the filled gel is equal to that of the matrix and
independent of the filler concentration;
- G’f <G’m: under deformation, the filler particles deform more than the matrix;
as a consequence, the modulus of the filled gel is lower than that of the matrix.
Following van Vliet (1988), the modulus of the oil droplets can be estimated by the
Laplace pressure, 2 /R, where is the interfacial tension and R the droplet radius. Van
Vliet proposed a modification of the van der Poel theory for the calculation of the modulus
of gels containing unbound oil droplets by setting the effective filler modulus to zero. In
Figure 3.2 the effect of filler concentration on the modulus of filled gels is shown for the
different situations as described above.
Oil droplet aggregation is usually held responsible for deviations between the
experimental data and the theories. This was reported for acid milk gels (van Vliet, 1988)
and for heat-set whey protein gels (Chen & Dickinson, 1998) with emulsion droplets
bound to the gel matrix. In both cases, the effect of oil droplet aggregation on the modulus
was ascribed to a higher effective volume fraction of the fillers as compared to non-
aggregated oil droplets.
0.0
0.5
1.0
1.5
2.0
2.5
0 10 20 30 40 50
Filler concentration (% v/v)
G’ g
/ G
’ m
Figure 3.2 – Effect of filler concentration on modulus as calculated according to the van der Poel
theory (G’g: modulus of the filled gel; G’m: modulus of the matrix; G’f = 7.5 G’m: bold line; G’f =
G’m: thin line; G’f < G’m: dotted line).
52

Droplet-matrix interactions
3.1.3 Theories predicting the effect of filler content on fracture properties
The theory for filled polymers of Nielsen (1966) describes the effect of filler
particles bound to the polymer matrix on fracture strain. The fillers are assumed to be
rigid, non-deformable particles, while the polymer matrix is assumed to be deformable.
Shear effects around the filler, triaxial stresses in the polymer and effects due to the
Poisson ratio are neglected. Furthermore, the size of the fillers is not taken into
consideration. The theory is developed for tensile measurements and assumes the polymer
to break at the same elongation in the filled system as the bulk unfilled polymer does.
Under these conditions, the actual (fracture) strain in the matrix is larger than the nominal
strain (i.e. the strain applied to the sample) by a factor which depends on the filler volume.
Therefore, the nominal fracture strain will decrease with increasing filler phase volume as
shown in Figure 3.3. By combining his own theory on the effect of fillers on fracture
stress with the theory of Sato and Furukawa on the effect on modulus, Nielsen described
also the effect of fillers on the fracture strain in the case of no adhesion between filler and
polymer (unbound droplets) (Nielsen, 1966). The theory of Nielsen on fracture stress
contains a not well defined ‘stress concentration function’(S), which should be estimated.
This stress concentration function can have a maximum value of 1 when there is no
concentration and is usually expected to have a value of the order of 0.5. Unfortunately,
Nielsen did not describe the criteria necessary to estimate S. This introduces a subjective
element that makes the theory unsuitable for predictive purposes. The curve reported in
Figure 3.3 for the case of unbound droplets was calculated assuming a stress concentration
function of 1.
53

Chapter 3
0.0
0.2
0.4
0.6
0.8
1.0
1.2
0 10 20 30 40 50
Filler concentration (vol%)
f /
m
Figure 3.3– Effect of filler concentration on fracture strain as calculated according to the Nielsen
theory for perfect adhesion (thick line) and no adhesion (thin line) between filler and polymer
phase ( f: fracture strain of the filled gel; m: fracture strain of the gel matrix).
Ross-Murphy and Todd (1983) proposed a theory to describe the effect of filler
concentration on fracture stress. This theory is a combination of the Nielsen theory on
fracture strain and the Landel theory on modulus. Like the Nielsen theory on fracture
strain, it assumes the matrix to be deformable and the filler particles to be completely non-
deformable and perfectly adherent to the matrix (bound droplets). Furthermore, this theory
assumes the modulus to be constant at all deformations (strain-hardening is not taken into
account) and always to increase with increasing filler concentration. Therefore, the
fracture stress can either increase or decrease with increasing phase volume of the filler,
depending on the relative effect of the filler on modulus and strain. This theory was used
to explain the effect of glass beads in gelatine gels. The effects of particle size on fracture
stress depended upon volume fraction. At low volume fraction small effects were
observed. At increasing volume fraction, samples containing larger particles showed lower
fracture stress.
54

Droplet-matrix interactions
0.3
0.5
0.7
0.9
1.1
1.3
1.5
1.7
1.9
0 10 20 30 40 50
Filler concentration (% v/v)
f/
m
Figure 3.4 – Effect of filler concentration on fracture stress as calculated according to the Ross-
Murphy and Todd theory (continuous bold line) and the Langley and Green theory (broken line)
for the case of perfect adhesion between filler and polymer phase and the Nielsen theory
(continuous thin line) for the case of no adhesion ( f : fracture stress of the filled gel; m: fracture
stress of the gel matrix).
Langley and Green (1989), in a study on whey protein gels filled with glass beads
and emulsion droplets, proposed a modification of the Ross-Murphy and Todd formula
which takes into account the maximum packing volume of the filler. Furthermore, they
modified the theory to account for the variation of the maximum packing of the glass
beads due to protein adsorption, in this way introducing the effect of the filler particle size.
Figure 3.4 shows a comparison between the Ross-Murphy and Todd and the Langley and
Green theories. In the same figure, a curve describing the effect of filler on fracture stress
following the theory of Nielsen for fillers unbound to the matrix is shown. For this curve,
a stress concentration function of 1 was assumed.
55

Chapter 3
3.2 Materials and methods
3.2.1 Materials
Powdered whey protein isolate (WPI, BiproTM
) was obtained from Davisco International
Inc. (La Sueur, MN, USA). Kappa-carrageenan was kindly donated by CP Kelco (Lille
Skensved, Denmark). The -carrageenan sample consisted of 93% mol -units and 7%
mol -units, as determined by NMR spectrometry (van de Velde, Pereira & Rollema,
2004). The counter-ions present in the product consisted of a mixture of potassium,
sodium and calcium (de Jong & van de Velde, 2007). Porcine skin gelatine PBG 07
(bloom 280, isoelectric point 8-9) was kindly provided by PB gelatines (Vilvoorde,
Belgium). Tween 20 (Polyoxyethylene sorbitan monolaurate, in the text referred to as
Tween) and lysozyme were obtained from Sigma (Sigma-Aldrich Chemie BV,
Zwijndrecht, The Netherlands). Dimodan HR (distilled saturated monoglycerides) was
obtained from Danisco International Inc. (Aarde, Denmark). Medium Chain Triglycerides
(MCT) MIGLYOL 812N oil was purchased from Internatio BN (Mechelen, Belgium).
Potassium chloride (p.a.) was obtained from Merck (Darmstadt, Germany). Glucono- -
lactone (GDL) was kindly donated by Purac (Gorinchem, The Netherlands). All materials
were used without further purification. All solutions were prepared with demineralised
water.
3.2.2 Sample preparation
3.2.2.1 Emulsions
WPI solutions were prepared by adding the weighed protein to the required amount of
water. Subsequently, the solutions were gently stirred for 2 hours. Stock emulsions,
consisting of 40 wt% MCT oil and 60 wt% aqueous phase containing 1 wt% WPI, were
prepared by pre-homogenising the ingredients using an Ultra Turrax (Polytron,
Kinematica AG, Lucerne, Switzerland) homogeniser. Pre-emulsions were further
processed using a laboratory homogeniser (Ariete, Model NS1001L 2K – Panda 2K, Niro
Soavi S.p.A, Parma, Italy). KCl was added to the emulsion used for the preparation of -
carrageenan, up to a concentration of 10 mM in the aqueous phase.
56

Droplet-matrix interactions
The same procedure was used for the preparation of the emulsion stabilised with
Tween and lysozyme. The concentrations of emulsifying agent in the aqueous phase were
0.5 and 2 wt% for Tween and 2 wt% for lysozyme.
Emulsions stabilised with WPI aggregates were prepared as described above, but
using a 3 wt% WPI aggregates dispersion as continuous phase. This dispersion was
prepared by heating a 9 wt% WPI solution at 68.5°C for 2 hours and subsequent cooling to
room temperature with tap water and diluting to 3 wt%.
Emulsions stabilised with WPI aggregates in the water phase and Dimodan HR in
the oil phase were prepared by dissolving 1 wt% Dimodan in the oil at 80°C for 1 hour.
After cooling the oil to 50°C and heating a 3 wt% WPI aggregates dispersion to the same
temperature, the emulsion was prepared by Ultra Turrax pre-homogenisation followed by
a homogenisation step in the homogenizer, which was preheated at 50°C.
The droplet size distribution of the obtained emulsions was measured using a
Malvern Mastersizer 2000 (Malvern Instruments Ltd., Malvern, UK). The volume-surface
average or Sauter diameter (d3,2) of the droplets of the emulsions used for the preparation
of the filled gels is reported in Table 3.1.
Table 3.1 – Volume-surface average diameter (Sauter diameter) of the emulsions used for the
preparation of the filled gels.
Em
the w
ulsifying agent in
ater phase
Emulsifying agent
in the oil phase
d3,2
( m)
1 wt% WPI - 1.13±0.05
wt% WPI aggr. - 1.10±0.05 3
3 wt% WPI aggr. 1 wt% Dimodan HR 0.95±0.05
2 wt% Lysozyme - 1.31±0.05
0.5 wt% Tween - 1.40±0.05
2 wt% Tween - 1.26±0.05
57
Chapter 3
3.2.2.2 Gels
WPI (3 wt%) and gelatine (4 wt%) gels were prepared in demineralised water. Kappa-
carrageenan (0.75 wt%) gels were prepared in a 10 mM KCl solution. Samples were
prepared without emulsion and with different oil concentrations (5, 10, 20 wt%). In all
samples the concentration of the gelling agent in the aqueous phase was kept constant.
The gelation of the WPI gels was induced by addition of GDL (0.22 wt% in the case
of a WPI aggregates dispersion with a concentration of 3 wt%) to the WPI dispersion and
to the WPI dispersion/emulsion mix and incubation at 25°C for 17 hours. The WPI
dispersion was prepared as described above.
For the carrageenan and gelatine gels, the gelling agent was allowed to hydrate for 2
hours under gentle stirring at room temperature. The samples were subsequently dissolved
by heating at 80°C for 30 minutes and cooled to 45°C. Prior to emulsion addition, the
emulsion was heated to 45°C. After mixing, the samples were allowed to gel at room
temperatures in 60 ml plastic syringes (internal diameter 26.4 mm) coated with a thin
paraffin oil film. By mixing the emulsion with the gelatine solution at 20°C, gelatine
samples with non-aggregated emulsion droplets were prepared.
In order to distinguish the effect of oil droplets on gel properties from that of the
residual emulsifying agent present in the aqueous phase of the emulsions added to the
gels, emulsion-free samples were prepared containing the same amount of emulsifying
agents as present in the filled gels with 20 wt% emulsion.
3.2.3 pH measurement
The pH of the gels was measured with a Knick Portamess 911 pH pH-meter (Knick
Elektronische Messgeräte, GmbH & Co. KG, Berlin, Germany), by inserting the electrode
directly into the gel and waiting until a constant value was reached. The measurement was
performed at room temperature. The experimental error was within 0.05 pH units.
3.2.4 Large deformation experiments
Uni-axial compression tests were performed on gel pieces of 25 mm height with an
Instron universal testing machine (Model 5543, Instron International Ldt., Edegem ,
Belgium) equipped with a plate-plate geometry. In order to prevent friction between the
58

Droplet-matrix interactions
plates and the samples, the plates were lubricated with a thin layer of paraffin oil. The
measurements were performed at a constant deformation speed of 1 mm/s and up to a
compression strain of 80%.
3.2.5 Confocal Laser Scanning Microscopy (CLSM)
Samples for microstructural analyses were stained with Rhodamine B (0.2 wt% solution;
10 µL per mL sample) to visualise the protein phase. CLSM-images were recorded on a
LEICA TCS SP Confocal Laser Scanning Microscope (Leica Microsystems CMS GmbH.,
Manheim, Germany), equipped with an inverted microscope (model Leica DM IRBE),
used in the single photon mode with an Ar/Kr visible light laser. A Leica objective lens
(63x/UV/1.25NA/water immersion/PL APO) was used. The excitation wavelength was set
at 568 nm. The emission maximum of Rhodamine B is at 625 nm. Digital image files were
acquired in tagged image file format and at 1024x1024 pixel resolution.
3.3 Results
3.3.1 Effect of emulsifying agents on large deformation properties of the gel matrix
The modulus and the fracture properties of gel samples without emulsion but containing
the same amount of emulsifying agents as that present in filled gels with 20 wt% emulsion
were compared to those of gels without emulsifying agents (Table 3.2).
Lysozyme was the emulsifying agent with the largest effect on the gel properties.
The different effects of lysozyme on the three gels can be explained by the different
molecular interactions of this ingredient with the gelling agents. For gelatine gels, at the
measured pH (Table 3.3) both gelatine (isoelectric point 8-9) and lysozyme (isoelectric
point ~ 10) display a net positive charge. Consequently, electrostatic repulsion is expected
between gelatine and lysozyme, which would disturb the formation of the gelatine gel
network, explaining the observed decrease in modulus and fracture stress. For WPI gels,
lysozyme induced a decrease of both fracture strain and stress. At the pH of these gels
(Table 3.3), which was slightly lower than the isoelectric point of whey protein (~ 5), both
proteins have a positive net charge and would repel each other. This could explain the
observed weakening of the gel.
59

Chapter 3
Table 3.2 – Effect of emulsifying agents (at the same concentration as that present in the gel with
20 wt% emulsion) on modulus and fracture properties.
Gel type Emulsifying agent Modulus (kPa) Fracture stress
(kPa)
Fracture strain
(mm/mm)
No emulsifier 3.2 ± 0.2 10.9 ± 2.5 1.28 ± 0.12
WPI 3.2 ± 0.2 11.3 ± 1.1 1.25 ± 0.03
Lysozyme 2.7 ± 0.1 7.9 ± 0.5 1.25 ± 0.02
Gelatin
2% Tween 3.1 ± 0.2 8.3 ± 0.9 1.18 ± 0.07
No emulsifier 5.2 ± 0.1 5.7 ± 1.2 1.09 ± 0.05
Lysozyme 5.7 ± 0.6 3.4 ± 0.5 0.72± 0.11
WPI
0.5% Tween 4.5 ± 0.4 6.7 ± 0.7 1.23 ± 0.08
No emulsifier 5.2 ± 0.5 9.5 ± 1.2 0.56 ± 0.03
WPI 5.2 ± 0.4 9.1 ± 1.6 0.59 ± 0.06
WPI aggreg. 3.5 ± 0.5 7.7 ± 1.3 0.61 ± 0.05
Lysozyme 25.4 ± 0.9 8.3 ± 0.3 0.44 ± 0.05
-carrageenan
2% Tween 5.2 ± 0.6 7.5 ± 1.4 0.57 ± 0.03
When adding a lysozyme solution to a solution of -carrageenan, fibrous structures were
formed instantaneously within the gel network. These structures were probably similar to
the coacervates formed by lysozyme and -carrageenan as reported by Yang et al. (1998).
The presence of these fibres led to a strengthening of the gel matrix, which was
responsible for an increase in modulus of the filled gels.
Regarding -carrageenan gels, WPI aggregates affected the gel modulus (Table
3.2), but the fracture properties remained unchanged. At the pH of the gels (Table 3.3), -
carrageenan is negatively charged. Therefore, WPI aggregates, which are negatively
charged spherical particles with a diameter around 50-60 nm, are not incorporated in the
three-dimensional structure of the gel.
In general, the emulsifying agents appeared to have only a limited direct effect on
the rheological properties of the gels. Only for lysozyme a clear effect on the properties of
all gelled matrices was observed. This was taken into account when interpreting the effect
of lysozyme-stabilised emulsions on large deformation properties.
60

Droplet-matrix interactions
Table 3.3 – pH of the gels samples (the experimental error is 0.05 pH units).
Emulsifying agent
Gel type
Oil
content
(wt%)
WPI WPI
aggr.
WPI aggr.+
Dimodan
Lysozyme 0.5 wt%
Tween
2 wt%
Tween
Gelatin 0 5.37 - - 5.57 5.42 5.43
5 5.43 - - 5.43 5.50 5.42
10 5.61 - - 5.47 5.48 5.43
20 5.73 - - 5.39 5.48 5.44
WPI 0 - 4.95 4.95 4.97 4.95 -
5 - 4.93 4.92 4.92 4.91 -
10 - 4.92 4.90 4.98 4.93 -
20 - 4.92 4.91 4.84 4.93 -
-carrageenan 0 8.42 8.50 - 8.73 8.81 8.81
5 8.10 8.01 - 8.65 8.90 8.77
10 7.95 7.73 - 8.38 8.93 8.74
20 7.62 7.56 - 7.65 8.77 8.63
-: not studied
3.3.2 Effect of oil droplets on gel modulus
The Young’s modulus of gels containing different emulsions is shown in Figure 3.5 as a
function of the oil concentration. This figure also shows the curves representing the data
as predicted by the van der Poel theory (for the filler concentrations studied, the van der
Poel and the Kerner theories give comparable results) for bound fillers with a diameter
comparable to that of the added emulsion droplets and for unbound fillers. For the
calculations of van der Poel theory, the shear modulus of the gel matrix is normally used.
The estimation of the modulus of the oil droplets (bound droplets) by the Laplace pressure
as suggested by van Vliet provides a value of shear modulus (van Vliet 1988). With the
large deformation measurements carried out in this work, the Young’s modulus of the gels
was obtained. Therefore, the shear modulus of the oil droplets as calculated following van
Vliet (a value of 20 mM/m was assumed for the surface tension between oil and water
phase) was multiplied by a factor 3 in order to obtain an estimate of their Young’s
modulus (assuming a Poisson ratio of 0.5, the Young’s modulus is 3 times larger than the
shear modulus).
61

Chapter 3
By using various emulsifying agents, a variation in gel modulus was observed,
especially for gelatine gels (Figure 3.5A). In gelatine and WPI gels the emulsion droplets
were mainly bound to the gel matrix, inducing an increase in gel modulus. This occurred
also in cases where no interactions between oil droplets and gel matrix were expected, like
in samples containing lysozyme-stabilised emulsions. In gelatine gels, emulsion droplets
stabilised with 2 wt% Tween were unbound to the matrix and induced a decrease of the
gel modulus. In WPI gels, emulsions stabilised with 2 wt% Tween caused extensive phase
separation during gel formation, which made it impossible to produce suitable samples.
For -carrageenan gels, most emulsions induced a slight decrease of the gel modulus,
indicating that the oil droplets were not bound to the matrix. The increase of the modulus
for samples containing lysozyme-stabilised emulsions could entirely be ascribed to the
effect of the fibrous structures formed by -carrageenan and the lysozyme present in the
water phase of the emulsion (Table 3.2, Figure 3.5C).
The deviations between the experimental results and the van der Poel theory as
observed in the present work were similar to those previously reported by other authors
for both bound and unbound fillers. Because of the similarity between the van der Poel
and the Kerner theories in the oil content range considered, this holds also for the Kerner
theory. The discrepancy between experimental results and theory was mostly within the
standard deviation of the experimental data.
62

Droplet-matrix interactions
0
1
2
3
4
5
6
7
8
9
10
0 5 10 15 20 25
Oil concentration (% v/v)
Mo
du
lus (
kP
a)
0
1
2
3
4
5
6
7
8
9
10
0 5 10 15 20 25
Oil concentration (% v/v)
Mo
du
lus (
kP
a)
A B
0
5
10
15
20
25
0 5 10 15 20 25
Oil concentration (% v/v)
Mo
du
lus (
kP
a)
C
Figure 3.5 - Effect of oil concentration on the Young’s modulus of gels (A: gelatine; B: WPI; C:
-carrageenan) containing emulsions stabilised with different emulsifying agents ( : WPI; WPI
aggregates; : lysozyme; : 0.5 wt% Tween; X: 2 wt% Tween). In all graphs the bold line
represents the data predicted with the van der Poel theory for gels containing emulsion droplets
with a diameter of 1 m. The broken line of figure A and C represent the data predicted with the
van der Poel theory by using a filler modulus of zero.
3.3.3 Effect of oil droplets on fracture properties
Increasing the oil concentration in the case of bound droplets (e.g. gelatine gels
with WPI-stabilised emulsions, WPI gels with WPI aggregates-stabilised emulsions) led to
a decrease of the fracture strain (Figure 3.6). On the other hand, an increase of the oil
concentration for unbound droplets (e.g. gelatine gels with Tween-stabilised emulsions, -
63

Chapter 3
carrageenan gels with WPI stabilised emulsions) induced only slight variations in fracture
strain (Figure 3.6). For bound droplets, the effective fracture strain increased with
increasing oil concentration, resulting in a decrease of the nominal fracture strain. As a
result, the gels became more brittle. For both gel systems with oil droplets bound and
unbound to the matrix, the Nielsen theory overestimated the effect of oil droplets on
fracture strain (Figure 3.6).
Figure 3.7 shows the effect of oil concentration on fracture stress, together with the
curves representing the expected values as calculated with the Langley and Green theory
for bound droplets and with the Nielsen theory for unbound droplets. For gelatine (Figure
3.7A) and WPI gels (Figure 3.7B), the fracture stress was unaffected by the oil content.
An exception was found for gelatine gels containing 2 wt% Tween stabilised emulsion
(unbound droplets), for which a decrease of the fracture stress with increasing oil
concentration was observed. The minor effect observed for gelatine and WPI gels with
bound droplets qualitatively agrees with the Langley and Green, although the stress
decrease at low filler concentrations was not observed. The Nielsen theory on the effect of
unbound droplets on fracture stress underestimated the experimental results for gelatine
gels containing a 2% Tween stabilised emulsion. For -carrageenan gels, a decrease in
fracture stress with increasing emulsion concentration was observed (Figure 3.7C),
roughly following the trend predicted by the Nielsen theory for unbound droplets.
Bound droplets seem to cause a slight decrease of the fracture strain and not to
affect the fracture stress, whereas unbound droplets have no effect on fracture strain and
induce a decrease of the fracture stress. However, the observed effects are relatively small
and in general are not correctly predicted by the existing theories.
64
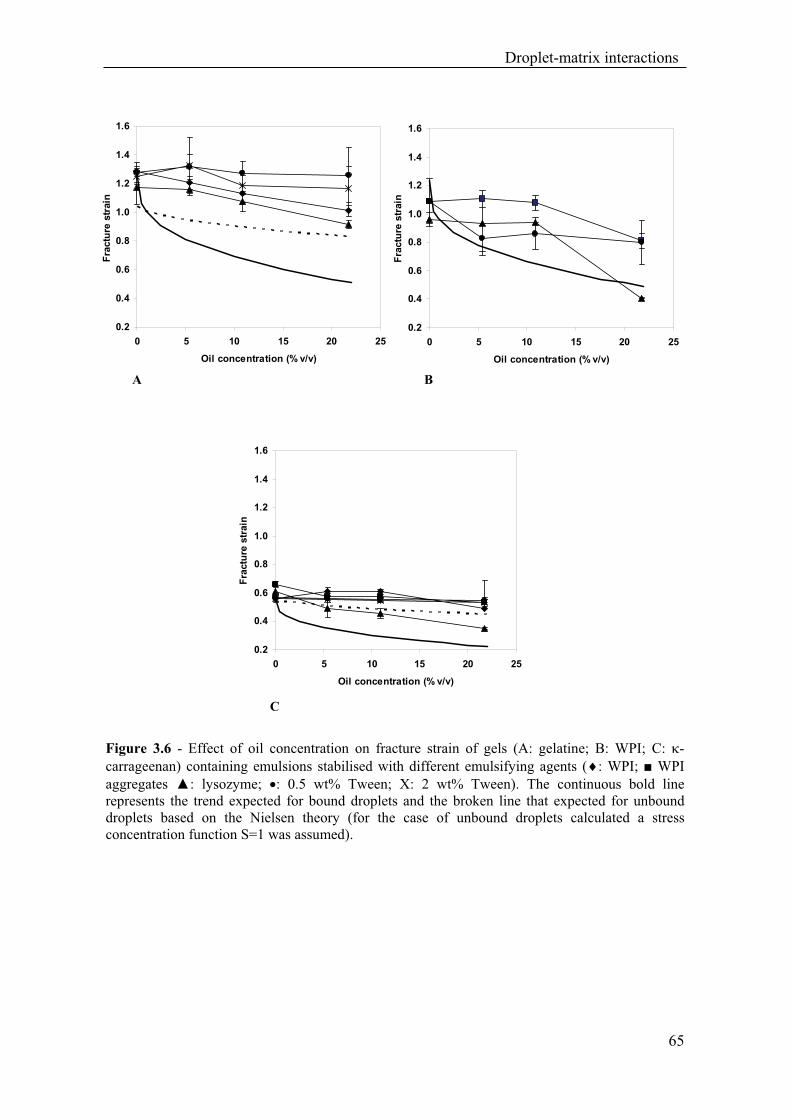
Droplet-matrix interactions
0.2
0.4
0.6
0.8
1.0
1.2
1.4
1.6
0 5 10 15 20 25
Oil concentration (% v/v)
Fractu
re s
train
0.2
0.4
0.6
0.8
1.0
1.2
1.4
1.6
0 5 10 15 20 25
Oil concentration (% v/v)
Fractu
re s
train
A B
0.2
0.4
0.6
0.8
1.0
1.2
1.4
1.6
0 5 10 15 20 25
Oil concentration (% v/v)
Fractu
re s
train
C
Figure 3.6 - Effect of oil concentration on fracture strain of gels (A: gelatine; B: WPI; C: -
carrageenan) containing emulsions stabilised with different emulsifying agents ( : WPI; WPI
aggregates : lysozyme; : 0.5 wt% Tween; X: 2 wt% Tween). The continuous bold line
represents the trend expected for bound droplets and the broken line that expected for unbound
droplets based on the Nielsen theory (for the case of unbound droplets calculated a stress
concentration function S=1 was assumed).
65

Chapter 3
0
2
4
6
8
10
12
14
16
0 5 10 15 20 25
Oil concentration (% v/v)
Fractu
re s
tress (
kP
a)
0
2
4
6
8
10
12
14
16
0 5 10 15 20 25
Oil concentration (% v/v)
Fractu
re s
tress (
kP
a)
A B
0
2
4
6
8
10
12
14
16
0 5 10 15 20 25
Oil concentration (% v/v)
Fractu
re s
tress (
kP
a)
C
Figure 3.7 - Effect of oil concentration on fracture stress of gels (A: gelatine; B: WPI; C: -
carrageenan) containing emulsions stabilised with different emulsifying agents ( : WPI; WPI
aggregates; : lysozyme; : 0.5 wt% Tween; X: 2 wt% Tween). The continuous bold line
represent the trend expected based on the Langley and Green theory for bound droplets and the
broken line the trend expected based on the Nielsen theory for unbound droplets (calculated
assuming a stress concentration function S=1).
66

Droplet-matrix interactions
3.3.4 Effects of oil droplet aggregation on gel properties
Aggregation of emulsion droplets is reported to affect the rheological properties of
emulsion-filled gels by inducing an increase of the effective volume of the fillers (Walstra,
2003). Also the anisometry of the aggregates affects the rheological properties of the gels.
Anisometric particles tend to result in a higher storage modulus than spherical particles.
Large deformation properties are remarkably influenced by the shape of the fillers, but
published data are conflicting (Walstra, 2003).
For gelatine and WPI gels, simple variations of the gel preparation procedures,
taking advantage of the gel formation kinetics and the modification of the oil-water
interface composition, allowed control of the oil droplet aggregation. For these gels the
effect of droplet aggregation on modulus and breakdown properties could be studied by
comparing samples with aggregated droplets to others with non-aggregated droplets. The
oil droplet size in these two types of gels was comparable.
Gelatine gel samples with non-aggregated and aggregated emulsion droplets were
obtained by changing the temperature at which a native WPI stabilised emulsion was
mixed to the gelatine solution. A decrease of the temperature of a gelatine solution induces
both an increase of the viscosity and a decrease of the time required for gel formation.
These two phenomena both retard the aggregation of emulsion droplets driven by van der
Waals and depletion interactions. By mixing at 20°C, a gel with non-aggregated droplets
was obtained, while by mixing at 45°C the droplets present in the sample appeared
clustered into large aggregates with loose structure and an average diameter of 20-40 m
(Figure 3.8). Taking into account the attractive interaction between gelatine and the
droplets, the presence of gelatine within these weak, large aggregates would be expected.
The Young’s modulus of gelatine gels with aggregated droplets was consistently higher
than that of gels with non-aggregated droplets (Figure 3.10A). No effects were observed
on fracture properties. The presence of these aggregates result in an increase of the
effective volume of the droplet aggregates due to the entrapped matrix.
67

Chapter 3
A B
Figure 3.8 - CLSM images of gelatine gels containing a WPI stabilised emulsion mixed with the
gelatine matrix at different temperatures (5 wt% oil; A: 20°C; B: 45°C) (image size 39.7 X 39.7
m).
In order to prepare WPI emulsion-filled gels with non-aggregated oil droplets the
procedure described in chapter 2 (Rosa, Sala, van Vliet & van de Velde, 2006) was
followed. This work showed that addition of WPI-stabilised emulsions to a WPI
aggregates dispersion results in phase separation because of depletion-flocculation
phenomena. This could be prevented by using a certain concentration of WPI aggregates
instead of native WPI to prepare the emulsion. A possible explanation for this effect is a
thicker layer of protein adsorbed at the oil/ water interface, which would increase the
steric repulsion between the droplets. To assess the effect of emulsion droplet aggregation
on the properties of WPI gels, an oil-soluble emulsifier (a mixture of saturated
monoglycerides) was added to the oil phase. Thereby it was assumed that the oil-soluble
emulsifying agent would partially displace protein from the oil/water interface, creating
patches with less or even no protein, where the droplets could make contact with others by
hydrophobic interactions (Benjamins, Zoet & van Aken, submitted). Figure 3.9 shows a
comparison between a gel prepared with a 3 wt% WPI aggregates-stabilised emulsion and
one with an emulsion prepared with the same concentration of WPI and with 1 wt%
monoglycerides in the oil phase. The oil droplet aggregates present in samples prepared
with monoglycerides had an average diameter of 5-10 m and consisted of 6-20 droplets.
For WPI gels, the modulus of samples with non-aggregated droplets was not significantly
different from that of gels with aggregated droplets (Figure 3.10B). Also, for these gels no
68

Droplet-matrix interactions
effects were observed on fracture properties. For these gels, the lack of effect of droplet
aggregation on the modulus as compared to gelatine gels could be related to the small size
of the aggregates, resulting in a more limited increase of the effective volume of the
droplet aggregates. An alternative explanation could be the weakness of the oil droplet
aggregates. The aggregation could induce also in this case an increase of the effective
volume of the fillers. Nevertheless, the Young’s modulus of the aggregates could be lower
than that of the oil droplets, counterbalancing the effect of the increase in effective
volume.
4 m
A B 4 m
Figure 3.9 - CLSM images of WPI gels containing emulsions prepared with different emulsifying
agents (5 wt% oil; A: 3 wt% WPI aggregates; B: 3 wt% WPI aggregates + 1 wt% Dimodan HR in
the oil phase) (image size 39.7 X 39.7 m).
4 m
69

Chapter 3
0
1
2
3
4
5
6
7
8
9
10
0 5 10 15 20 25
Oil concentration (% v/v)
Mo
du
lus (
kP
a)
0
1
2
3
4
5
6
7
8
9
10
0 5 10 15 20 25
Oil concentration (% v/v)
Mo
du
lus (
kP
a)
A B
Figure 3.10 - Effect of oil droplet aggregation on gel modulus at different oil concentrations: A:
gelatine with a WPI stabilised emulsion; B: WPI with a WPI aggregates stabilised emulsion ( :
non-aggregated droplets; : aggregated droplets).
3.4 Discussion
The typical shear modulus of a protein-stabilised oil droplet with a diameter of 1 m is
about 40 kPa. The shear modulus of real food products varies from 0.5-5 kPa in dairy
puddings to 140-2000 kPa in pressed semi-hard cheeses. This thesis focuses on the first
type of food products, in which the modulus of the oil droplets exceeds that of the matrix.
For this type of foods, a clear difference can be expected between systems in which the oil
droplets are bound to the gel matrix and systems in which the droplets are unbound.
The van der Poel and the Kerner theories, normally used to predict the effect of oil
droplets on the shear modulus of filled gels, can also be used for the prediction of the
effect of oil droplets on the Young’s modulus of filled gels as obtained in large
deformation compression measurements. The use of these theories requires knowledge on
the interactions between oil droplets and gel matrix. For droplets bound to the matrix, a
droplet modulus as derived from the Laplace equation can be used for the calculations. To
calculate the effect of droplets on the Young’s modulus of filled gels, the modulus of the
droplets as obtained from the Laplace equation can be multiplied by a factor 3. For
unbound droplets, a modulus of zero can be used for the calculations. The interactions
70

Droplet-matrix interactions
between oil droplets and gel matrix are related to the interactions between the emulsifying
agents used for emulsion preparation and the gelling agents. The prediction of the
interactions between emulsifying agents and gelling agents based on their molecular
properties is difficult. Therefore, the van der Poel and the Kerner theories can be used for
the prediction of the effect of oil concentration on gel modulus after ascertaining the type
of interactions between oil droplets and gel matrix by means of rheological measurements.
For droplets with a modulus exceeding that of the matrix, only two extremes (bound
or unbound) could be obtained by varying the surface properties of the emulsion droplets.
A slight variation of the interactions between droplets and matrix for a given type of filler
does not have a noticeable effect on gel modulus. Hence, a modification of the surface
properties of the emulsion droplets will not result in a variation of the gel modulus as
measured at large deformation within a range between the maximum (bound droplets) and
minimum (unbound droplets) values that can be obtained. Similarly, in reverse, the
strength of the binding between droplets and matrix can not be deduced from
measurements of the modulus at large deformation. Rheological measurements at small
deformation are likely to be more suitable to detect differences in the modulus of
emulsion-filled gels related to different interactions between oil droplets and gel matrix.
The fracture strain decreases with increasing oil content for gels with bound
droplets and is unaffected by the oil content in the case of gels with unbound droplets. A
qualitatively similar indication is supplied by the theory of Nielsen (1966). Following
Nielsen, in the case of perfect adhesion between filler and matrix (bound droplets) a larger
decrease of the fracture strain with increasing filler concentration would be expected as
compared to the case of no adhesion (unbound droplets) and without stress concentration.
Nevertheless, Nielsen still predicts a decrease of the strain with increasing filler
concentration also in the case of no adhesion (Figure 3.3). Furthermore, in case of stress
concentration (S<1) the decrease in fracture strain for unbound droplet could be even
larger than for bound droplets. The Nielsen theory, which largely overestimated the
experimental results, assumes a homogeneous structure of the gel matrix. The observed
limited effect of fillers on strain may indicate that the size of the emulsion droplets used in
this study was comparable to (or smaller than) that of the inherent structure defects present
in the gel matrix. Oil droplets fitting in existing structure defects or creating defects with
similar size would not significantly disrupt the gel network. This would impair the basic
assumption of the Nielsen theory, i.e. that the actual strain induced in the matrix is larger
71

Chapter 3
than the nominal strain by a factor which depends on the filler volume. Concerning the
case of gels with unbound fillers, the lack of physical foundation for the concentration
function S undermines this specific part of the theory and makes it a mere fit model.
The fracture stress is unaffected by an increase of the concentration of bound
droplets and decreases with increasing concentrations of unbound droplets. For bound
droplets, the minor effects observed with increasing oil concentration above a few percent
qualitatively agree with both the theory of Langley and Green (1989) and that of Ross-
Murphy and Todd (1983). Nevertheless, the sharp stress decrease at low filler
concentrations predicted by both theories was not observed in this work. Actually, this
sharp decrease is also not shown in the experimental data reported in the work of Langley
and Green. As a matter of fact, these authors did not analyse gel samples without fillers,
missing the effect of addition of a low amount of fillers on fracture parameters. An
analysis of both the theories of Langley and Green and that of Ross-Murphy and Todd
reveals that the sharp decrease of the fracture stress at low filler concentration is directly
related to the sharp decrease in fracture strain described by the Nielsen theory. Therefore,
the failure of both the theories of Langley and Green and that of Ross-Murphy and Todd
in predicting the effect of fillers on fracture stress is related to the failure of the Nielsen
theory in predicting the effect of fillers on fracture strain. For unbound droplets, the
Nielsen theory only qualitatively predicts the experimental results. Also for the fracture
stress, the discrepancy between experimental results and theoretical predictions can likely
be related to the small size of the emulsion droplets as compared to the size of structure
defects in the gel matrix. From these findings can be concluded that the Nielsen theory on
fracture strain and the theories of Langley and Green and Ross-Murphy and Todd on
fracture stress are not suitable for the prediction of the effect on fillers on the fracture
properties of gels containing emulsion droplets. For gels with bound droplets, the most
evident effect of the decrease of fracture strain with increasing oil concentration is an
increased brittleness. For gels with unbound droplets, the decrease of fracture stress with
increasing oil concentration results in an increased spreadability of the gels.
The forces responsible for the formation of emulsion droplet aggregates present in
the gels studied in this work can be mainly attributed to hydrophobic, van der Waals and
depletion interactions. For gels containing bound droplets, aggregation of the oil droplets
present in the gel matrix only affects the gel modulus, to an extent related to the size and
to the stiffness of the aggregates. Larger aggregates induce an increase of the effective
72

Droplet-matrix interactions
volume of the fillers, resulting in an increase of the modulus. A similar effect can be
expected when aggregation occurs in gels containing unbound droplets. In this case, larger
aggregates are likely to induce a decrease of the modulus and of the fracture strain of the
gels.
3.5 Conclusions
In this study the modulus of emulsion-filled gels with three different gelling agents is
varied by changing the interactions between oil droplets and gel matrix. As a result, the
modulus varies between two extremes: with bound droplets the modulus increases,
whereas with unbound droplets it decreases. The experimental results can be well fitted by
available theories, but the predictive value of the theories depends on knowledge about the
interactions between oil droplet and gel matrix. The effect of oil droplets on fracture
properties is minor, and theories previously applied to similar systems fails to predict the
experimental data. The aggregation of oil droplets present in the gel only affects the gel
modulus. The extent of the effect of aggregation is related to the size and the stiffness of
the aggregates.
3.6 Acknowledgments
Jan Klok (WCFS/ NIZO food research) is acknowledged for the CLSM observations and
Ton van Vliet (WCFS/ WUR) for reading the manuscript and for his helpful comments.
3.7 References
Aguilera, J. M. & Kinsella, J. E. (1991). Compression Strength Of Dairy Gels And Microstructural
Interpretation. Journal of Food Science, 56(5), 1224-1228.
Benjamins, J., Zoet, F. D. & van Aken, G. A. Composition and structure of interfacial layers
consisting of proteins and monoglycerides in relation to emulsion stability and structure.
Submitted for publication.
Brownsey, G. J., Ellis, H. S., Ridout, M. J. & Ring, S. G. (1987). Elasticity and failure in
composite gels. Journal of Rheology, 31(8), 635-649.
73

Chapter 3
Chen, J. & Dickinson, E. (1998). Viscoelastic properties of heat-set whey protein emulsion gels.
Journal of Texture Studies, 29, 285-304.
Chen, J. & Dickinson, E. (1999). Effect of surface character of filler particles on rheology of heat-
set whey protein emulsion gels. Colloids and Surfaces B: Biointerfaces, 12, 373-381.
Chen, J., Dickinson, E., Langton, M. & Hermansson, A.-M. (2000). Mechanical properties and
microstructure of heat-set whey protein gels: effect of emulsifiers. Lebensmittel
Wissenschaft Und Technologie, 33, 299-307.
Chen, J. S., Dickinson, E. & Edwards, M. (1999). Rheology of acid-induced sodium caseinate
stabilized emulsion gels. Journal of Texture Studies, 30(4), 377-396.
de Jong, S. & van de Velde, F., (2007). Charge density of polysaccharide controls microstructure
and large deformation properties of mixed gels. Food Hydrocolloids, 21, 1172-1187.
Dickinson, E. & Hong, S.-T., 1995. Influence of water-soluble nonionic emulsifier on the rheology
of heat-set protein stabilised emulsion gels, J. Agric. Food Chem., 43, 2560-2566.
Dickinson, E., Hong, S.-T. & Yamamoto, Y. (1996). Rheology of heat-set emulsion gels
containing -lactoglobulin and small-molecule surfactants. Netherlands Milk & Dairy
Journal, 50, 199-207.
Dickinson, E. & Chen, J. (1999). Heat-set whey protein emulsion gels: role of active and inactive
filler particles. Journal of Dispersion Science and Technology, 20(1&2), 197-213.
Kerner, E. H. (1956). Elastic and thermo-elastic properties of composite media. Proceedings of the
Physical Society of London, 69b, 808-813.
Kim, K.-H., Gohtani, S., Yamano, Y. (1996). Effects of oil droplets in physical and sensory
properties of o/w emulsion agar gels. Journal of Texture Studies, 27, 655-670.
Kim, K.-H., Renkema, J.M.S., Vliet, T. Van (2001). Rheological properties of soybean protein
isolate gels containing emulsion droplets. Food Hydrocolloids, 15, 295-302.
Langley, K. R., Green, M.L. (1989). Compression strength and fracture properties of model
particulate food composites in relation to their microstructure and particle-matrix
interaction. Journal of Texture Studies, 20, 191-207.
Lipatov, Y. (1977). Advances in Polymer Science (New York).
Matsumura, Y., Kang, I. J., Sakamoto, H., Motoki, M. & Mori, T. (1993). Filler effects of oil
droplets on the viscoelastic properties of emulsion gels. Food Hydrocolloids, 3, 227-240.
McClements, D. J., Monahan, F.J. Kinsella, J.E. (1993). Effect of emulsion droplets on rheology
of whey protein isolate gels. Journal of Texture Studies, 24, 411-422.
Nielsen, L. E. (1966). Simple theory of stress-strain properties of filled polymers. Journal of
Applied Polymer Science, 10, 97-103.
Ring, S. & Stainsby, G. (1982). Filler reinforcement of gels. Progress in Food and Nutrition
Science, 6, 232-329.
Rosa, P., Sala, G., van Vliet, T. & van de Velde, F. (2006). Cold gelation of whey protein
emulsions. Journal of Texture Studies, 37, 516-537.
74

Droplet-matrix interactions
Ross-Murphy, S. B. & Todd, S. (1983). Ultimate tensile measurement of filled gelatin gels.
Polymer, 24, 481-486.
Smith, J. C. (1974). Correction and extension of the van der Poel method for calculating the shear
modulus of particulate composite. Journal of Research of the National Bureau of
Standard, 78A(3), 355-361.
Smith, J. C. (1975). Simplification of the van der Poel's formula for the shear modulus of
particulate composite. Journal of Research of the National Bureau of Standard, 419-423.
Tolstoguzov, V. B. & Braudo, E. E. (1983). Fabricated foodstuffs as multicomponent gels. Journal
of Texture Studies, 14, 183-212.
van de Velde, F., Pereira, L. & Rollema, H. S. (2004). The revised chemical NMR shift data of
carrageenans. Carbohydrate Research, 339(13), 2309-2313.
van der Poel, C. (1958). On the rheology of concentrated dispersion. Rheologica Acta, 1, 198-205.
van Vliet, T. (1988). Rheological properties of filled gels. Influence of filler matrix interaction.
Colloid & Polymer Science, 266, 518-524.
Walstra, P. (2003). Physical chemistry of foods (New York).
Xiong, Y. L., Aguilera, J. M. & Kinsella, J. E. (1991a). Emulsified Milkfat Effects On Rheology
Of Acid-Induced Milk Gels. Journal of Food Science, 56(4), 920-925.
Xiong, Y. L. & Kinsella, J. E. (1991b). Influence Of Fat Globule-Membrane Composition And Fat
Type On The Rheological Properties Of Milk Based Composite Gels. 2 Results.
Milchwissenschaft-Milk Science International, 46(4), 207-212.
Yang, C. C., Chen, C. C. & Chang, H. M. (1998). Separation of egg white lysozyme by anionic
polysaccharides. Journal of Food Science, 63, 962-965.
75


G. Sala, R.A. de Wijk, F. van de Velde, G.A. van Aken (2008). Matrix properties affect the
sensory perception of emulsion-filled gels, Food Hydrocolloids, 22 (3), 353-363.
Chapter 4
Effect of matrix properties on the sensory perception
of emulsion-filled gels

Chapter 4
Abstract
The breakdown properties and sensory perception of emulsion-filled gels with different
matrices were studied at varying emulsion concentrations. The gel matrices used were
cold-set whey protein isolate (WPI), gelatine, -carrageenan and a mixture of -
carrageenan and -carrageenan. The oil-in-water emulsions added to the gels were either
stabilised by native WPI or WPI aggregates. The emulsion droplets were homogeneously
distributed in WPI gels, slightly aggregated in mixed / -carrageenan and extensively
aggregated in -carrageenan gels. For gelatine, gels with equal composition but with
either non-aggregated or aggregated emulsion droplets could be prepared by changes in
processing conditions. The gel modulus as determined by large deformation experiments
increased at increasing emulsion concentration for WPI and gelatine gels, but decreased
for -carrageenan gels. For mixed / -carrageenan no effect of the emulsion
concentration on gel modulus was observed. Based on these observations, we concluded
that the emulsion droplets were bound to the matrix in WPI and gelatine gels and unbound
in carrageenan gels. Most of the mouthfeel attributes generated by a Quantitative
Descriptive Analysis (QDA) sensory panel discriminated between emulsion concentrations
and different types of gel matrix. At increasing emulsion concentration the perceived
creaminess of the samples increased. For gelatine, -carrageenan and mixed / -
carrageenan gels, i.e. for gels that melt at the oral processing temperature or containing
unbound oil droplets, the creaminess scores were consistently higher than for WPI gels,
which were perceived as more rough. For gelatine gels, no effect of oil droplet
aggregation on sensory perception was found.
78

Matrix effect on sensory perception
4.1 Introduction
The effect of oil content and droplet size on the rheological and breakdown properties of
emulsion-filled gels has been studied in several systems. The study of the connection
between sensory and rheological properties has been attempted for gels, emulsions, and
semi-solid complex foods with yielding behaviour, but for emulsion-filled gels this aspect
did not receive much attention. For these systems, the perception of the gel matrix and that
of the emulsion droplets are likely to influence each other. Furthermore, also the
interaction between gel matrix and emulsion droplets is likely to affect the overall
perception.
The sensory perception and mechanical properties of gelatine gels were studied at
varying gelatine concentration (Munoz, Pangborn & Noble, 1986a). By increasing the
gelatine concentration, the firmness and cohesiveness as assessed by manual and oral
shear and compression increased, while the extent of breakdown in the mouth decreased.
The manual compression and biting with the front teeth could discriminate well across
gelatine concentrations. An increased gelatine concentration induced an increase of the
maximum force applied during breakdown measurements, but did not affect elasticity,
cohesiveness or the strain at yielding and fracture. The same research group studied also
the sensory and mechanical properties of sodium alginate and -carrageenan gels (Munoz,
Pangborn & Noble, 1986b). Gelatine was the most elastic and firmest of the considered
gels and broke down during mastication in a few large pieces. Kappa-carrageenan was the
least elastic and least firm and broke down during mastication in several small pieces.
In agar gels an increase of the oil content and of the size of the oil droplets
stabilised by fatty acids polyglycerol esters induced a decrease of fracture stress and strain
measured by compression tests (Kim et al., 1996). The sensory evaluation indicated the
gels with larger droplets to be softer and oilier, showing that the fillers were not bound to
the gel matrix.
Non-oral sensory attributes (e.g. surface water, flowability, firmness, give,
resistance) of milk gels with different texture properties and containing emulsions
prepared with different oils were well correlated to data obtained from compression test
and syneresis measurements (Pereira, Singh, Munro & Luckman, 2003). The texture
characteristics of the gels were modulated by changing the preparation procedure (heat-
treatment and total solids). Nevertheless, the approach followed in this study did not
79

Chapter 4
provide information on the link between textural and rheological properties and consumer
sensory perception.
In a comparison between stranded and particulate WPI emulsion-filled gels, only
the firmness as sensed with the first bite, the number of chews and the time to swallow
were correlated to the oil content of the gels. The other sensory texture attributes were all
correlated to the gel structure type (Gwartney, Larick & Foegeding, 2004). In the systems
studied, an increase of oil content was related to an increase of gel firmness.
Literature data on the sensory perception and breakdown properties of emulsion-
filled gels mostly analyse the effect of oil droplets on the properties of a particular kind of
gel, but do not offer an explanation for the mechanisms linking gel characteristics and
sensory attributes. In this chapter, we want to fill this gap by unravelling the role of the gel
matrix and that of the interaction between oil droplets and matrix in the sensory perception
of emulsion-filled gels. To this end, gels with matrices with different rheological
properties were evaluated by a sensory panel trained according to the principles of
Quantitative Descriptive Analysis (QDA). Kappa-carrageenan, a mixture of -
carrageenan and -carrageenan, cold-set whey protein isolate and gelatine gels were
chosen as matrices with a wide variety of parameters concerning elasticity, brittleness and
yielding properties.
4.2 Materials and methods
4.2.1 Materials
Powdered whey protein isolate (WPI; BiproTM
) was obtained from Davisco International
Inc. (La Sueur, MN, USA). Kappa-carrageenan and -carrageenan were kindly donated by
CP Kelco (Lille Skensved, Denmark). The -carrageenan sample consisted of 93% mol -
units and 7% mol -units, while the -carrageenan sample consisted of 100% -units, as
determined by NMR spectrometry (van de Velde, Pereira & Rollema, 2004). Gelatine
PBG 07 (bloom 280, 5.41 mPa s) was kindly provided by PB gelatines (Vilvoorde,
Belgium). Medium Chain Triglycerides (MCT) MIGLYOL 812N oil was purchased from
Internatio BN (Mechelen, Belgium). KCl (p.a.) was obtained from Merck (Darmstadt,
Germany). Glucono- -lactone (GDL; GluconalTM
) was kindly donated by Purac
(Gorinchem, The Netherlands). Saccharin was from Acatris Netherlands B.V. (The
80

Matrix effect on sensory perception
Netherlands). Vanilla flavour was donated by Danisco (Grinsted, Denmark). All materials
were used without further purification. All solutions were prepared with demineralised
water.
4.2.2 Sample preparation
4.2.2.1 Emulsions
WPI solutions were prepared by adding the protein to the required amount of water.
Subsequently, the solutions were gently stirred for 2 hours at room temperature. Stock
emulsions, containing 40 wt% MCT oil and 1 wt% WPI in the water phase, were prepared
by pre-homogenising the ingredients using an Ultra Turrax (Polytron, Switzerland). Pre-
emulsions were further processed using a laboratory homogenizer (Ariete, Model
NS1001L – Panda, Niro Soavi S.p.A, Italy). The volume-surface average or Sauter
diameter (d3,2) of the droplets of this emulsion was 0.62 0.05 m. To the emulsion used
for the preparation of -carrageenan and mixed / -carrageenan gels, KCl was added to
reach a concentration of 10 mM in the water phase.
Emulsions stabilised with WPI aggregates were prepared as described above, but
using a 3 wt% WPI aggregates dispersion as continuous phase. This dispersion was
prepared by heating a 9 wt% WPI solution at 68.5°C for 2 hours and subsequently cooling
to room temperature with tap water and diluting to 3 wt%. This preparation procedure
induces a denaturation of the whey protein >95% (Alting, 2003). The Sauter diameter of
the droplets of this emulsion was 0.92 0.05 m.
The droplet size distribution of the stock emulsions was measured using a Malvern
MasterSizer X (Malvern Instruments, USA).
4.2.2.2 Gels
Gels were prepared with the following concentrations of the gelling agents in the aqueous
phase:
- -carrageenan: 0.75 wt% (in 10 mM KCl);
- mixed / -carrageenan: 0.5 wt% - carrageenan + 0.5 wt% -carrageenan (in 10
mM KCl);
81

Chapter 4
- acid-induced, cold-set WPI gels: 3 wt% (in water);
- gelatine: 4 wt% (in water).
The concentrations of the gelling agents were chosen in such a way that the gels had
similar apparent firmness. As shown further on, this appeared to correspond to similar
fracture stress rather than similar elasticity. As sweetening agent saccharin (0.012 wt%)
was added to emulsions and gels solutions. As tasting agent vanilla (0.033 wt%) was used
in both emulsions and gels.
The cold gelation of the WPI gels was induced by addition of a suitable amount of
GDL (0.22 wt% WPI aggregates dispersion with a concentration of 3 wt%) to the WPI
dispersion and to the WPI dispersion/emulsion mix and incubation at 25°C for 17 hours
(Rosa, Sala, van Vliet & van de Velde, 2006). The WPI dispersion was prepared as
described above.
For carrageenan and gelatine gels, the gelling agent was allowed to hydrate for 2 hours
under gentle stirring at room temperature. The samples were subsequently dissolved by
heating at 80°C for 30 minutes and cooled to 45°C. Prior to emulsion addition, the
emulsion was also heated to 45°C. After mixing, the liquid samples were allowed to gel at
room temperature. Gelatine samples with non-aggregated emulsion droplets were prepared
by mixing the emulsion with the gelatine solution at 20°C. The final pH of the gels is
reported in Table 4.1.
The samples for breakdown measurements were allowed to gel in 60 ml plastic
syringes (internal diameter 26.4 mm) coated with a thin paraffin oil film. The samples for
the QDA evaluation, prepared under food-grade and sterile conditions, were allowed to
gel in lidded plastic cups with a capacity of 50 ml.
Table 4.1 – pH of the studied gels.
pH
Oil content 0 5 20
WPI 4.88 4.77 4.67
-carrageenan 8.35 7.88 7.51
/ -carrageenan 8.21 7.93 7.59
Gelatin 5.34 5.33 5.68
82

Matrix effect on sensory perception
4.2.3 Large deformation experiments
Uni-axial compression tests were performed approximately 24 hours after preparation at
the same moment of the QDA evaluation. Gel pieces of about 25 mm height were used for
the measurements with an Instron 5543 machine (Instron Corporation, USA) equipped
with a plate-plate geometry. The plates were lubricated with a thin layer of paraffin oil.
The measurements were performed at room temperature, at a constant deformation speed
of 1 mm/s and up to a compression strain of 80%. The mentioned deformation speed was
already used for the study described in chapter 2 (Rosa et al., 2006), after ascertaining the
limited effect of compression speed on fracture parameters. For gelatine gels 4 pieces per
specimen and 2 specimens were analysed. For the other gels at least 4 pieces per specimen
and 1 specimen were used for measurement.
4.2.4 Confocal Laser Scanning Microscopy (CLSM)
Samples for microstructural analyses were stained with Rhodamine B (0.2 wt% solution;
10 µL per mL sample) to visualise the protein phase. CLSM-images were recorded on a
LEICA TCS SP Confocal Laser Scanning Microscope, equipped with an inverted
microscope (model Leica DM IRBE), used in the single photon mode with an Ar/Kr
visible light laser. A Leica objective lens (63x/UV/1.25NA/water immersion/PL APO)
was used. The excitation wavelength was set at 568 nm. The emission maximum of
Rhodamine B is at 625 nm. Digital image files were acquired in multiple tif formats at
1024x1024 pixel resolution.
4.2.5 Quantitative Descriptive Analysis
4.2.5.1 Assessors/ sensory attributes
The sensory characteristics of the gels were investigated with the use of a sensory panel
trained according to the principles of Quantitative Descriptive Analysis (QDA) (Stone &
Sidel, 1985). The panel consisted of nine females aged between 22 and 49 and with above-
average scores on all selection tests. These tests included tests of odor identification, odor
memory, and verbal creativity, and a series of texture tests in which the ability of the
panelist to assess fattiness, roughness, and particle size was measured. All panelists had
previously been trained for the assessment of the sensory properties of oil-in-water
83

Chapter 4
emulsions. Panelists were seated in sensory booths with appropriate ventilation and
lighting. The products were assessed semi-monadically in duplicate on visual analogue
scales. The presentation order was randomly assigned per panellist. Acquisition of the
panelist's responses was done by computer using FIZZ software (Biosystemes, 1998). In 4
2-hr sessions the panel was presented and trained with a set of 8 samples of emulsion-
filled gels. During these training sessions descriptive attributes were generated that were
used to profile 10 emulsion-filled gel samples with 4 reference samples without emulsion.
Each gel was served in portions of 40 ml in plastic beakers (volume 50 ml) at an average
rate of one sample per 5 minutes. The attributes were generated in Dutch and subsequently
translated in English. During profiling the attributes appeared per category on a monitor
placed in front of the panelist with the attributes on the left and a 100-point response scale
anchored at the extremes on the right. The panelist used a mouse to indicate the perceived
strength of each attribute. Each product was first smelled after which the odor attributes
were rated. Next, the product was taken into the mouth after which the taste/flavor and
mouthfeel attributes were rated in the order in which they were perceived. Finally, the
product was spat out. The after feel attributes were rated and the panelists rinsed their
mouths with acidified water before evaluating the next sample.
4.2.5.2 Data analysis
The relationships between sensory attributes and gel samples characteristics were
summarized using Principal Component Analysis (PCA) (Unscrambler, Camo Inc.,
Corvallis, U.S.A). PCA facilitates the identification of attribute synonyms and covariate
attributes. Relationships between specific attributes were statistically modeled using
Partial Least Squares Regression or PLSR (Unscrambler Vs. 7.5, Camo Inc., Corvallis,
U.S.A). The effects of changes in ingredient composition on individual sensory attributes
were analyzed using a factorial ANOVA (SPSS, SPSS Inc, Chicago, U.S.A.), carried out
on the raw sensory data. In addition to the four gelling agents main effects and second
order interactions, the ANOVA included a random panelist effect and a session effect.
Because the ANOVA was carried out on the raw sensory data, it was possible to carry out
tests of significance for all effects.
84

Matrix effect on sensory perception
85
4.3 Results and Discussion
4.3.1 Microstructure
Microstructure analysis was carried out to determine the distribution of the oil droplets in
the gel matrix. Oil droplets were homogeneously distributed in the matrix of WPI gels
(Figure 4.1A), whereas droplet aggregates were observed in -carrageenan (Figure 4.1B)
and mixed / -carrageenan (Figure 4.1C) gels. In -carrageenan gels the aggregation was
much more extensive than in mixed / -carrageenan gels. For gelatine gels, the oil droplet
aggregation was successfully varied by changing the temperature at which the emulsion
was mixed with the gelatine solution. When this operation was performed at 45°C, droplet
aggregation was observed (Figure 4.2A). By decreasing the temperature of both the
emulsion and the gelatine solution to 20°C prior to mixing, the aggregation of the oil
droplets was prevented (Figure 4.2B). A decrease of the temperature of a gelatine solution
resulted in both an increase of the viscosity and a decrease of the gel setting time. Hence,
droplet aggregation caused by weak forces, such as van der Waals interactions, could be
avoided by decreasing the mixing temperature.
A B C
Figure 4.1 – CLSM image of WPI (A), -carrageenan (B) and / -carrageenan (C) gels with 5
wt% emulsion (image size 39.7 X 39.7 m).

Chapter 4
A B
Figure 4.2 – CLSM image of gelatine gel with 5 wt% emulsion (A= prepared at 45°C; B=
prepared at 20°C; image size 39.7 X 39.7 m).
4.3.2 Elastic modulus
Figure 4.3 shows the stress vs. strain curves of the studied gels without emulsion droplets.
Samples with comparable elastic modulus (initial slope of the curve), but different fracture
properties were successfully prepared for -carrageenan and WPI gels, but not for gelatine
and / -carrageenan gels. For -carrageenan, at concentrations lower than 0.75 wt% the
obtained gels were too weak to be handled. For gelatine gels a modulus comparable to that
of -carrageenan could not be achieved because at gelatine concentrations higher than 4
wt% extremely elastic and tough samples that were difficult to chew were obtained. The
high viscosity of / -carrageenan gels prepared at concentrations higher than 1 wt%
restrained the mixing of the emulsion with the gel matrix. The chosen gel types covered a
wide range of breakdown behaviours. This allowed a broad comparison among gel
matrices and yielded conclusive results of the effects of oil droplets on both the
breakdown and sensory properties of emulsion-filled gels.
In Figure 4.4 the effect of emulsion content on modulus is shown for all the studied
systems. For WPI and gelatine an increase of the modulus was observed at increasing
emulsion concentration. For gelatine samples with aggregated emulsion droplets, this
increase was larger than for the gels with non-aggregated droplets. In -carrageenan gels,
an increase of emulsion content induced a substantial decrease of the modulus. In mixed
/ -carrageenan gels the modulus appeared independent of the emulsion concentration.
86

Matrix effect on sensory perception
87
0
1
2
3
4
5
6
7
8
9
10
0 20 40 60 80 100
Compressive strain (%)
Tru
e s
tress (
kP
a)
Figure 4.3 – Breakdown curves of the gels without emulsion ( WPI; -carrageenan;
/ -carrageenan; gelatine).
Van Vliet (1988) defined emulsion droplets present in a gel as active fillers when
they are bound to the matrix. At increasing concentration of active filler the gel modulus
increases. Oil droplets unbound to the gel matrix and inducing a decrease of the gel
modulus were defined as inactive fillers. Based on these definitions, the emulsion droplets
present in WPI and gelatine gels behaved as active fillers and those present in -
carrageenan gels as inactive fillers. The interactions between oil droplets and gel matrix
were unclear for mixed / -carrageenan gels. A detailed explanation of the interactions
between oil droplets and gel matrix in the different gels is given below.
The pH has a large effect on the protonation and charge of the biopolymers at the
droplets surfaces and in the gel matrix and, consequently, determines the electrostatic
interactions between the surface of oil droplets stabilised with protein and the gel matrix.
Therefore, for all studied samples the pH was measured (Table 4.1). The isoelectric point
of whey proteins is about 5. At pH above this value, the net charge of whey proteins is
negative. At pH lower than the isoelectric point, the net charge of whey proteins is
positive.

Chapter 4
0
2
4
6
8
10
12
0 5 10 15 20 25
Oil concentration (wt%)
Mo
du
lus (
kP
a)
Figure 4.4 - Effect of oil concentration on modulus ( : WPI; -carrageenan; : / -
carrageenan; : gelatine aggregated droplets; : gelatine non-aggregated droplets).
For WPI gels, the oil droplets were stabilised with the same protein material as the
gel matrix. As a consequence, no strong electrostatic interaction can occur between the
emulsion droplets and the gel matrix. The interactions between these two elements of the
gel systems are of the same nature as those responsible for gel formation, i.e. hydrophobic
interactions and sulphur bridges (covalent cross linking). The emulsion droplets present in
the gel act as active fillers because of these forces and bonds.
Gelatine gels had a pH around 5.3. At this pH, gelatine (isoelectric point~ 8.7) and
the whey protein adsorbed on the surface of the emulsion droplets are oppositely charged
and attractive electrostatic interactions occur. This explains the observation that the
droplets of the emulsion used for the filled gelatine gels acted as active fillers, inducing an
increase of the gel modulus. The droplet aggregates present in the gels prepared by mixing
gelatine solution and emulsion at high temperature (Figure 4.2) were probably formed by
relatively weak forces, such as van der Waals interactions. Taking into account the
attractive interaction between gelatine and oil droplets, the presence of gelatine within
these weak, large aggregates can be expected. The presence of these aggregates results in
an increase of the effective volume of the droplet aggregates due to the entrapped matrix.
This can explain the fact that the elastic modulus of gelatine gels with aggregated droplets
was higher than that of gels with non-aggregated droplets (Figure 4.4).
88

Matrix effect on sensory perception
89
The pH of -carrageenan gels was about 8. Kappa-carrageenan is a polyanionic
polymer whose negative charge is determined by the presence of sulphur groups in the
polysaccharide chain. At the mentioned pH, the -carrageenan gel matrix and the WPI
protein covering the oil droplet are both negatively charged. Therefore, repulsive
electrostatic interactions are expected. Depletion forces are also likely to be involved in
the formation of droplet aggregates in these -carrageenan gels. Similar considerations can
be made for mixed / -carrageenan gels. For these samples, the lower degree of
aggregation of the emulsion droplets can be related to the lower sensitivity of -
lactoglobulin (main component of WPI) stabilised emulsions to -carrageenan induced
depletion-flocculation phenomena as compared with -carrageenan (Gu, Decker &
McClements, 2005). This property of -carrageenan, more densely charged than -
carrageenan, was related to its ability to form highly charged interfacial membranes on the
droplet surface.
Using only two different emulsions prepared both with the same basic emulsifier, a
wide range of interactions oil droplets-gel matrix could be obtained. This was possible
because of the different physicochemical properties of the gel matrices under study. Even
though the mechanisms responsible for interactions were different, basically two gel
systems with oil droplets bound (WPI and gelatine) and unbound ( -carrageenan and
/ carrageenan) to the gel matrix could be obtained.
4.3.3 Fracture behaviour
The effect of oil content on fracture stress is shown in Figure 4.5A. For -carrageenan and
mixed / -carrageenan gels, increasing the oil content caused a decrease of the fracture
stress. This further demonstrates that in -carrageenan gels, as well as in mixed / -
carrageenan gels, the emulsion droplets are not connected to the matrix and weaken the
gel network. In WPI gels a slight increase of the fracture stress was observed at increasing
emulsion concentration. For gelatine gels no clear correlation was found between fracture
stress and emulsion content.

Chapter 4
0.0
0.2
0.4
0.6
0.8
1.0
1.2
1.4
1.6
1.8
0 5 10 15 20 25
Oil concentration (wt%)
Fractu
re s
train
8
6
4
2
0
10
12
14
0 5 10 15 20 25
Oil concentration (wt%)
Fractu
re s
tress (
kP
a)
A B
Figure 4.5 - Effect of oil concentration on fracture stress (A) and fracture strain (B) ( : WPI; -
carrageenan; : / -carrageenan; : gelatine aggregated droplets; : gelatine non-aggregated
droplets).
The effect of emulsion concentration on fracture strain is shown in Figure 4.5B. The
presence of emulsion droplets in the gel matrix caused all the tested gels, except -
carrageenan gels, to become more brittle. This phenomenon is in accordance with the data
reported by other authors (Langley et al., 1989; Kim et al., 1996) and it is caused by stress
concentration at the filler surface during fracture propagation. In gels in which the droplets
are not connected, as in -carrageenan gels, this does not appear to happen. The higher the
fracture strain of the gel without oil droplets, the larger the effect of the emulsion on
brittleness. For gelatine gels the aggregation of the emulsion droplets was related to a
larger decrease of the fracture strain as compared to the samples with non-aggregated oil
droplets.
In Table 4.2 the distribution on the oil droplets within the gel matrix and the
qualitative effects of the emulsion droplets on the rheological and breakdown properties of
the different gels are summarized.
90

Matrix effect on sensory perception
91
Table 4.2 – Distribution of the oil droplets within the matrix, droplet-matrix interactions and
effects of oil droplets on rheological and breakdown properties of the gels.
Effect on fracture
properties
Gel matrix Droplet status Droplet-
matrix
interactions
Effect on
modulus
Stress Strain
WPI Non-aggregated Bound Increase Increase Decrease
-carrageenan Aggregated Unbound Decrease Decrease No effect
/ -carrageenan Aggregated Unbound No effect Decrease Decrease
Gelatine Aggregated/
non-aggregated
Bound Increase No effect Decrease
4.3.4 Sensory properties
During the training sessions the QDA panel generated a set of 44 attributes describing
odour (7), taste (9), mouthfeel (15), and after taste/feel (13) sensations (Table 4.3; odour
attributes not reported). This set of attributes was used to rate 8 emulsion-filled gel
samples and 4 reference samples without emulsion. For the present study only mouthfeel
and the after feel attributes were taken in to consideration.
Almost all mouthfeel and after feel attributes, except crumbly, melting, oily
mouthfeel and astringent after feel varied with oil concentration (Table 4.4). All attributes,
except filling mouthfeel and tacky after feel, varied with gel type (Table 4.4).
Interestingly, while the mouthfeel attribute creamy varied with fat content as well as with
gel type, the attribute oily varied only with gel type. In custard and custard-like semi-solid
foods a correlation was found between the attributes creamy and oily (de Wijk, R.A.,
Terpstra, M.E.J , Janssen, A.M. & Prinz, J. F., 2006). Apparently, the inclusion of emulsion
droplets in a gel matrix prevents the increase in oiliness at increasing fat content to be
perceived. This masking effect did not occur for creaminess perception.
None of the sensory attributes generated by the QDA panel varied for gelatine gels
with aggregated and non-aggregated emulsion droplets (Table 4.5). The interactions
responsible for droplet aggregation in these gels were weak and induced only limited
changes in the rheological and fracture properties of the samples. However, we cannot
exclude that such an effect exists if the bonds among droplets within aggregates would be
stronger. When compared to the analysis comprising all gels, fewer parameters (4
mouthfeel attributes and 3 afterfeel attributes) could discriminate between gelatine gels

Chapter 4
with emulsion concentrations of 5 and 20 wt%. This is partly due to the fact that the
samples without emulsion were not taken into consideration in the analysis of gelatine
gels.
The principal components analysis of the samples illustrates the relationships between
gel samples and sensory attributes (Figure 4.6). Principal component 1 (PC1) is clearly
related to the fat content, running from watery to creamy, while principal component 2
(PC2) relates to gel types and runs from crumbly to melting and slippery. In the sensory
space the studied gel samples are separated in two groups along PC2, with gelatine and
carrageenan gels at the positive scale and WPI gels at the negative scale. The gels of the
former group are gels that either contain unbound oil droplets (carrageenan gels) or melt at
body temperature (gelatine). This results in the perception of soft, smooth and creamy
mouthfeel. WPI gels, on the other hand, contain unbound droplets, do not melt and their
oral processing results in the formation of gel crumbs. For both the gelatine and
carrageenan gels, it can be anticipated that the disappearance of the gelled matrix in the
mouth or the breakdown of the gel will lead to a relatively fast release of the emulsion
droplets. This may explain why fat-related attributes are perceived more strongly and
more rapidly for gelatine and carrageenan gels than for WPI gels. As mentioned above, for
gelatine gels 4 mouthfeel attributes and 3 afterfeel attributes were affected by an increase
in oil concentration from 5 wt% to 20 wt% (Table 4.5). This resulted in a remarkable shift
in the PCA plot along the watery-creamy axis, indicating a noticeable difference in
sensory perception (Figure 4.6).
92

Matrix effect on sensory perception
93
Table 4.3 – Attributes generated by the QDA panel.
Group Attribute Description
Taste Tintensity intensity of the taste; taste-explosion
Tsweet sugar like, sweet
Tsour citrus-like
Tsalty little salt; liquorice like, seawater
Tvanilla taste of vanilla
Tpotatostarch tastes like wall paper glue
Talgae taste of algae, like in spirulina
Tartificialcream taste of artificial cream
Tcaramel caramel
Mouthfeel Mfirm stiff, effort to compress, compact
Melastic elastic, degree of spring back
Mslippery slippery feeling of the product, easily gliding
Mcreamy velvety; warm; full; soft
Moily oily; fatty layer
Mspreadable how the sample spreads between tongue and palate
Mmelting sample melts in the mouth, structure disappears
Mcrumbly (small) pieces in the mouth
Mcrumbling effort effort needed to break the sample into pieces
Mrough crumbles crumbles feel rough, fibrous and stiffly
Mcooling gives a cold feeling in the mouth
Mmouthfilling feeling that whole the mouth is filled up, feel the product everywhere
Msticky sticky like peanut butter and gingerbread
Mwatery product itself feels damp, humid
Mdry dry feeling in the mouth; saliva is absorbed
After Taste ATsweet sugar like, sweet
ATsweetener artificial sweetener; aspartame; saccharine
ATbitter bitter
ATcardboard cardboard
ATcreamy velvety; warm; full; soft
AToxidised metal; iron like; synthetic fat; rubber (gum)
After feel AFclean no remaining lumps
AFastringent astringent; contracting afterfeel
AFdry saliva absorbing; dry tongue
AFrough rough feeling on the teeth
AFraw tongue raw feeling; sandpaper or pussycat-tongue
AFcoating fatty coating on tongue, lips or cheek
AFtacky sticky like "post-it"

Chapter 4
Table 4.4 – ANOVA analysis on the effect of emulsion concentration and gel type (p-values lower
than 0.05, i.e. highly significant, are underlined).
p-values
Attribute Emulsion concentration Gel type
Mfirm 0.00 0.00
Melastic 0.00 0.00
Mslippery 0.01 0.00
Mcreamy 0.00 0.00
Moily 0.25 0.00
Mspreadable 0.01 0.00
Mmelting 0.91 0.03
Mcrumbly 0.13 0.00
Mrough 0.00 0.00
Mcooling 0.01 0.03
Mmouthfilling 0.00 0.06
Msticky 0.00 0.00
Mwatery 0.00 0.00
Mdry 0.00 0.00
AFclean 0.00 0.00
AFastringent 0.13 0.01
AFdry 0.00 0.00
AFrough 0.03 0.00
AFraw tongue 0.00 0.00
AFcoating 0.01 0.00
AFtacky 0.01 0.06
94
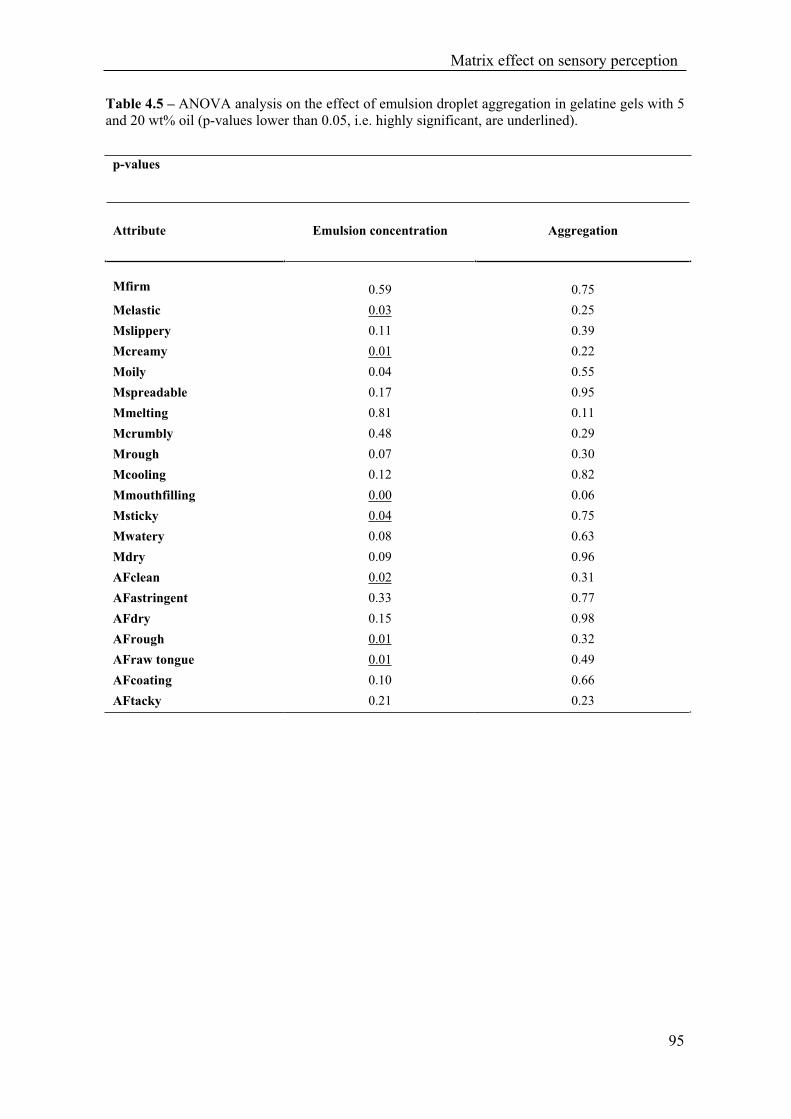
Matrix effect on sensory perception
95
Table 4.5 – ANOVA analysis on the effect of emulsion droplet aggregation in gelatine gels with 5
and 20 wt% oil (p-values lower than 0.05, i.e. highly significant, are underlined).
p-values
Attribute Emulsion concentration Aggregation
Mfirm 0.59 0.75
Melastic 0.03 0.25
Mslippery 0.11 0.39
Mcreamy 0.01 0.22
Moily 0.04 0.55
Mspreadable 0.17 0.95
Mmelting 0.81 0.11
Mcrumbly 0.48 0.29
Mrough 0.07 0.30
Mcooling 0.12 0.82
Mmouthfilling 0.00 0.06
Msticky 0.04 0.75
Mwatery 0.08 0.63
Mdry 0.09 0.96
AFclean 0.02 0.31
AFastringent 0.33 0.77
AFdry 0.15 0.98
AFrough 0.01 0.32
AFraw tongue 0.01 0.49
AFcoating 0.10 0.66
AFtacky 0.21 0.23

Chapter 4
-1.0
-0.5
0
0.5
1.0
-0.8 -0.6 -0.4 -0.2 0 0.2 0.4 0.6 0.8 1.0
X-expl: 43%,33%
-carrageenan 0%
Gelatine 0% / -carrageenan 0%
WPI 0%
-carrageenan 20%
Gelatine 20%
/ -carrageenan 20%
WPI 20%
-carrageenan 5%
Gelatine 5%
/ -carrageenan 5%
WPI 5%
Mfirm
Melastic
Mslippery
Mcreamy
Moily
MspreadableMmelting
Mcrumbly
Mrough crumbs
Mcooling
Mmouthfilling
Msticky
Mwatery
Mdry
AFclean
AFpuckering
AFdry
AFrough
AFrawtongue
AFcoatingAFtacky
PC1
PC2 Bi-plot
Figure 4.6 – Principal component plot of the sensory data.
For a number of sensory attributes, that were considered to be of particular interest,
the relation between emulsion concentration and score of the individual samples was
investigated. Figure 4.7A shows the effect of emulsion concentration on creaminess.
Although the creaminess increases at increasing oil concentration for all gels, the increase
is relatively small for WPI gels. Probably, the higher scores consistently observed for
mixed / -carrageenan could be related to the low elastic modulus and fracture strain of
this gel.
The mouthfeel attributes rough and melting varied strongly between gels melting at
human body temperatures and non-melting gels (Figures 4.7B and 4.7C). Gelatine, -
carrageenan and mixed / -carrageenan gels gave similar scores for the attribute melting,
while WPI gels scored substantially lower. For the attribute rough, a clear effect of
emulsion concentration on perception was found only for WPI and gelatine gels, the effect
for the first gel type being much larger. Moreover, the roughness scores of gelatine and
carrageenan gels were consistently lower than for WPI gels.
The gels with the higher modulus were evaluated by the QDA panel as less firm
(Figure 4.7D) than the gels with lower modulus (Figure 4.4). Furthermore, a negative
correlation was found between the attribute firm and the gel modulus (Table 4.6).
96

Matrix effect on sensory perception
97
0
10
20
30
40
50
60
70
80
90
100
0 5 10 15 20 25
Oil concentration (wt%)
Cream
y M
ou
thfe
el
0
10
20
30
40
50
60
70
80
90
0 5 10 15 20 25
Oil concentration (wt%)
Ro
ug
h M
ou
thfe
el
A B
0
10
20
30
40
50
60
70
0 5 10 15 20 25
Oil concentration (wt%)
Melt
ing
Mo
uth
feel
0
10
20
30
40
50
60
70
80
90
100
0 5 10 15 20 25
Oil concentration (wt%)
Fir
m M
ou
thfe
el
C D
Figure 4.7 – Effect of oil content on mouthfeel attributes creamy (A), rough (B), melting (C) and
firm (D) ( : WPI; -carrageenan; : / -carrageenan; : gelatine).

Chapter 4
Table 4.6 – Correlation between rheological/breakdown parameters and mouthfeel attributes (R2
values higher than 0.75 are underlined).
R2values
Modulus
(kPa)
Fracture stress
(kPa)
Fracture strain (True)
(mm/mm)
Energy to
fracture (mJ)
Mfirm -0.34 0.30 0.87 0.85
Melastic -0.62 0.27 0.89 0.71
Mslippery -0.51 0.17 -0.13 -0.33
Mcreamy -0.41 -0.31 -0.26 -0.42
Moily -0.70 -0.02 0.08 -0.11
Mspreadable -0.37 -0.26 -0.48 -0.62
Mmelting -0.65 0.32 -0.07 -0.20
Mcrumbly 0.84 0.17 -0.19 0.17
Mcrumbling effort -0.38 0.25 0.93 0.87
Mrough crumbs 0.77 -0.21 -0.06 0.20
Mcooling 0.10 0.27 -0.19 -0.15
Mmouth- filling 0.12 -0.41 -0.61 -0.59
Msticky -0.56 -0.23 0.04 -0.12
Mwatery 0.29 0.33 -0.03 0.09
Mdry 0.35 -0.33 0.10 0.21
This is in line with the absence of correlations between firmness at first bite and modulus
found for WPI emulsion gels with different gel matrix structure, as determined by torsion
breakdown experiments (Gwartney et al., 2004). The order of the samples with regard to
firmness was almost the opposite of what was expected based on the data collected for the
modulus (Figure 4.4). Furthermore, for all samples a decrease of the firmness was
perceived at increasing emulsion concentration. This could perhaps be expected for -
carrageenan and mixed / -carrageenan gels, for which a decrease of modulus and fracture
stress was observed, but not for WPI and gelatine gels. For the latter gels, the modulus
was larger at higher emulsion concentration (Figure 4.4). For WPI gels also the fracture
stress at the highest emulsion concentration was higher than that of the reference samples
(Figure 4.5A). The sequence of curves observed for firmness at increasing emulsion
concentration is similar to that found for the fracture strain (Figure 4.5B). In fact, gelatine
showed the highest fracture strain among the samples and was judged as the firmest, while
the gel with the lowest fracture strain, -carrageenan, received the lowest scores.
98

Matrix effect on sensory perception
99
Furthermore, a high correlation was found between fracture strain and firmness (Table
4.6). In spite of the low correlation between fracture stress and firmness, the energy to
fracture (that is the product between fracture stress and fracture strain or the area below
the stress vs. strain curve delimited by the perpendicular from the fracture stress)
correlated well with this sensory attribute (Table 4.6). This indicates that the panel
members evaluated the gel firmness as the effort to obtain structure breakdown.
4.4 Conclusions
This study explores the effects of both oil concentration and the gel type on the sensory
perception of emulsion-filled gels. Creaminess increases with the oil concentration for all
tested systems, but the extent varies with the kind of gel matrix. The effect of melting
behaviour of the gel and droplet-matrix interactions on sensory properties is more
important than the fracture properties. Gels containing unbound droplets and melting at
temperatures typical of oral processing conditions are creamier and show a larger effect of
the emulsion content on creaminess perception. Furthermore, for these gels the scores for
creaminess and roughness do not remarkably differ between gels, in spite of the large
differences in fracture behaviour and droplet-matrix interactions. WPI gels, which do not
melt at the oral processing temperature and in which the oil droplets are bound to the gel
matrix by covalent interactions, are perceived as rougher and more crumbly. For gelatine
gels, no effect of oil droplet aggregation on sensory attributes is found. However, the
interactions responsible for droplet aggregation in these gels are weak and induce only
limited changes in the rheological and fracture properties of the samples.
Chapter 7 describes the behaviour of different gels under processing conditions
comparable with mastication, focussing on the effect of melting properties and droplet-
matrix interactions on droplets release.
4.5 Acknowledgements
Jerry van Maanen (WCFS, TNO) is acknowledged for assistance during samples
preparation, Jan Klok (WCFS, NIZO food research) for the CLSM observations and
Mariska Nijenhuis and Jos Mojet (CICS) for the execution of the QDA tests.

Chapter 4
4.6 References
Alting, A. C. (2003). Cold gelation of globular proteins. PhD Thesis, Wageningen University, The
Netherlands.
de Wijk, R. A., Terpstra, M.E.J , Janssen, A.M. & Prinz, J. F. (2006) Perceived creaminess of
semi-solid foods. Trends in Food Science & Technology, 17 (8), 412-422
Gu, Y. S., Decker, E. A. & McClements, D. J. (2005). Influence of pH and carrageenan type on
properties of -lactoglobulin stabilised oil-in-water emulsions. Food Hydrocolloids, 19,
83-91.
Gwartney, E.A., Larick, D.K. & Foegeding, E.A. (2004). Sensory texture and mechanical
properties of stranded and particulate protein emulsion gels. Journal of Food Science,
69(9), s333-s339.
Kim, K.-H., Gohtani, S. & Yamano, Y. (1996). Effects of oil droplets in physical and sensory
properties of o/w emulsion agar gels. Journal of Texture Studies, 27, 655-670.
Langley, K. R. & Green, M. L. (1989). Compression strength and fracture properties of model
particulate food composites in relation to their microstructure and particle-matrix
interaction. Journal of Texture Studies, 20, 191-207.
Malone, M. E., Appelqvist, I. A. M. & Norton, I. T. (2003). Oral behaviour of food hydrocolloids
and emulsions. Part 1. Lubrication and deposition considerations. Food Hydrocolloids, 17,
763-773.
McClements, D. J., Monahan, F. J. & Kinsella, J. E. (1993). Effect of emulsion droplets on
rheology of whey protein isolate gels. Journal of Texture Studies, 24, 411-422.
Munoz, A. M., Pangborn, R. M. & Noble, A. C. (1986a). Sensory and mechanical attributes of gel
texture. I Effect of gelatin concentration. Journal of Texture Studies, 17, 1-16.
Munoz, A. M., Pangborn, R. M. & Noble, A. C. (1986b). Sensory and mechanical attributes of gel
texture. II Gelatin, sodium alginate and kappa-carrageenan gels. Journal of Texture
Studies, 17, 17-36.
Pereira, R. B., Singh, H., Munro, P. A. & Luckman, M. S. (2003). Sensory and instrumental
textural characteristics of acid milk gels. International Dairy Journal, 13, 655-667.
Rosa, P., Sala, G., van Vliet, T. & van de Velde, F. (2006). Cold gelation of whey protein
emulsions, Journal of Texture Studies, 37, 516-537.
Stone, H. & Sidel, J. L. (1985). Sensory evaluation practices. Orlando: Academic Press.
van de Velde, F., Pereira, L. & Rollema, H. S. (2004). The revised chemical NMR shift data of
carrageenans. Carbohydrate Research, 339(13), 2309-2313.
van Vliet, T. (1988). Rheological properties of filled gels. Influence of filler matrix interaction.
Colloid & Polymer Science, 266, 518-524.
100

G. Sala, T. van Vliet, M. A. Cohen Stuart, G.A. van Aken, F. van de Velde, Deformation and
fracture of emulsion-filled gels. 1 Effect of oil content and deformation speed, submitted for
publication.
Chapter 5
Deformation and fracture of emulsion-filled gels.
Effect of oil content and deformation speed.

Chapter 5
Abstract
The large deformation properties of gelatine, -carrageenan and whey protein isolate
(WPI) gels filled with bound and unbound oil droplets were studied at different
compression speeds. The rheological properties of the gel matrices controlled the
compression speed dependency of the gels containing oil droplets. Polymer gels (gelatine
and -carrageenan gels) showed a predominantly elastic behaviour. Their Young’s
modulus was not affected by the compression speed. The increase of fracture stress and
strain observed with increasing compression speed was related to friction between the
structural elements of the gels and, for gelatine, to the unzipping of physical bonds.
Particle gels (WPI gels) showed a more viscoelastic behavior. Their Young’s modulus and
fracture stress increased with compression speed. This was attributed to the viscous flow
of the matrix and friction phenomena between structural elements of the gel. The effect of
an increase in the oil volume fraction ( ) on the Young’s modulus was for all gels
according to the van der Poel theory. Oil droplets embedded in the gel matrix acted as
stress concentration nuclei and increased friction. The relative impact of these two effects
was related to the viscoelastic properties of the gels and to droplet-matrix interaction. For
polymer gels and gels with bound droplets stress concentration phenomena played a
relatively larger role. For particle gels and gels with unbound droplets friction
phenomena were relatively more important, increasing the viscoelastic character of the
gels. As a result, an increase in resulted in a decrease of both fracture stress and
fracture strain for polymer gels and in an increase of the fracture stress for particle gels.
102

Effect of compression speed and on large deformation properties
5.1 Introduction
In Chapter 3 we showed that the droplet-matrix interactions have mainly an effect on the
Young’s modulus of the filled gels determined at constant deformation speed. The van der
Poel theory developed for small amplitude oscillatory measurements in shear also holds
for the Young’s modulus determined by large deformation measurements. Under the
experimental conditions chosen, the fracture strain decreased with increasing oil volume
fraction ( ) for droplets bound to the matrix and remained constant for unbound droplets.
The fracture stress was unaffected by for bound droplets and decreased with increasing
for unbound droplets.
The way food products behave when they are eaten is better described by their
large deformation and fracture properties than by their small deformation properties (van
Vliet & Walstra, 1995; van Vliet, 2002). The sensorial firmness of gels, for instance,
depends on the apparent modulus at large deformation and on the fracture or yield stress
(van Vliet et al., 1995). In order to establish the relation between mechanical properties
and sensory characteristics, the measurement of the mechanical properties should be
carried out under experimental conditions mimicking oral processing as much as possible.
The fracture properties of many food materials strongly depend on deformation speed (van
Vliet, Luyten & Walstra, 1993). Therefore, when measuring the large deformation
properties of gels in compression experiments, a compression speed comparable to that
encountered under oral conditions (10-40 mm/s) should be applied (Peyron, Mioche,
Renon & Abouelkaram, 1996). However, most data reported in literature on the large
deformation and fracture properties of emulsion-filled gels have been obtained at much
lower compression speeds (Table 5.1).
103

Chapter 5
Table 5.1 – Compression speeds reported in literature for breakdown experiments with filled gels.
Gel systems Extension/compression
speed (mm/s)
Reference
Gelatine gels with glass beads. Extension; 0.016- 16.666. Ross-Murphy, 1983.
Heat-induced whey protein gels with glass
beads and emulsions. Compression; 0.833. Langley, 1989.
Skimmed milk gels with different
emulsions. Compression; 0.166. Xiong, 1991b.
Different types of milk proteins gels with
recombined cream. Compression; 0.166. Xiong, 1991a.
Heat-induced WPI gels with emulsions
stabilised with WPI or non-ionic
surfactants.
Compression; 0.166. McClements, 1993.
Heat-induced WPI gels with emulsions
stabilised with WPI. Compression; unknown. Yost, 1993.
Agar gels with emulsions stabilised with
fatty acids polyglycerolesters. Compression; 0.5. Kim, 1996.
Gelatine gels with whey protein particles. Compression; 0.0016-
0.833
Bot, 1996a.
Gelatine-maltodextrin composite gels.
Extension and
compression; 0.83. Normand, 2001.
Soybean protein isolate gels with soybean
protein stabilised emulsions. Compression; 20. Kim, 2001.
Heat-induced gels of fractionated whey
proteins with fractionated milk fat
emulsions.
Compression; 0.833. Mor-Rosenberg, 2004.
Acid-induced, cold set WPI gels with WPI
aggregates stabilised emulsions Compression; 1. Rosa, 2006.
Gelatine, -carrageenan and acid-induced,
cold set WPI gels with different emulsions.
Compression; 1. Sala, 2007.
104

Effect of compression speed and on large deformation properties
At present, relatively few data are available in literature on the effects of
deformation speed and droplet-matrix interaction on the large deformation properties of
emulsion-filled gels. Also the strain-hardening and viscoelastic behaviour of these systems
at large deformation are not well described in literature. We believe that understanding
these aspects is the key to link rheological and fracture properties of emulsion-filled gels
to their sensory characteristics, which motivated us to undertake the present study.
Gelatine, -carrageenan and whey protein isolate (WPI) were chosen as gel matrices.
Emulsions made of medium-chain triglyceride oil, and stabilised with different
emulsifying agents (WPI, Tween 20, Lactoferrin and WPI aggregates) were added to these
matrices to control droplet-matrix interaction.
5.2 Large deformation and fracture behaviour of gels
In this section an overview is given of the mechanisms responsible for the large
deformation and fracture behaviour of different types of gels, including emulsion-filled
gels. Particular attention is given to the effect of deformation speed and oil volume
fraction ( ). The strain-dependency of the modulus is also described.
5.2.1 Energy balance and role of defects in the large deformation behaviour of
viscoelastic materials
To better understand the deformation speed dependency of the fracture properties of food
materials, both the energy balance related to fracture and the role of defects present in the
structure should be taken into consideration. The energy applied to deform a material (W)
can be elastically stored (W’), dissipated either by viscous flow of the material (W”v) or
by friction between components of the system (W”c) or used for fracture (Wf) (van Vliet et
al., 1993):
fcv WWWWW ""' (5.1)
When a piece of material is deformed, the stress at the tip of cracks and around
weak spots will be higher than in the rest of the structure (van Vliet et al., 1993). This
phenomenon is called stress concentration. For fast fracture to occur, two requirements
should be fulfilled. Firstly, the stress at the tip of the cracks should be higher than the
105

Chapter 5
adhesive or cohesive stresses between the structural elements. This will sooner be the case
as the size of the cracks and inherent defects in the material is larger. Once this
requirement is fulfilled, the cracks start to grow. Secondly, the amount of strain energy
released per unit time during crack growth should be higher than the amount of energy
required for crack growth. If this requirement is also fulfilled, fast crack propagation will
occur and the material will fracture.
5.2.2 Large deformation properties of different types of gels
Polymer and particle gels respond differently to changes in deformation rate (van Vliet et
al., 1995). Moreover, polymer gels with covalent cross-links and gels with physical cross-
links also respond differently. For both types of gels, the way in which they fracture
depends on the gel structure and the strength of the bonds. Homogeneous polymer gels
with stochastically distributed covalent cross-links have no inherent defects larger than the
distance between the cross-links, and therefore behave purely elastically during
deformation. Furthermore, due to the low permeability of these gels, the energy
dissipation rate due to flow of liquid through the matrix will be low. Therefore, the
fracture properties of these gels are almost independent of the deformation rate. For
polymer gels with physical cross-links, such as gelatine gels, large deformation may lead
to unzipping of the cross-links. Unzipping takes a certain time, and this may result in time-
dependency of the fracture parameters. For gelatine gels, fracture stress and strain both
depend on deformation rate. Both parameters initially decrease with increasing
deformation speed at speeds lower than 2 mm/s and at higher speed increase (McEvoy,
Rossmurphy & Clark, 1985). In a study on the effect of several experimental parameters
on the large deformation properties of gelatine gels Bot et al. (1996a, 1996b) found an
increase in fracture stress and strain with increasing compression speed (0.0016-0.83
mm/s) and no effect of the compression speed on the modulus.
In particle gels, such as casein and whey protein gels, the storage modulus and the
loss modulus depend on the type of bonds connecting the particles within one cluster, as
well as those connecting the different clusters (Mellema, Walstra, van Opheusden & van
Vliet, 2002). Clusters can be connected by (i) flexible strands, (ii) hinged connections or
(iii) straight strands. Straight strands will result in stiffer gels. Large deformations of
particle gels will induce straightening of the strands. Therefore, the flexibility and
tortuosity of the strands will have a larger effect on the Young’s modulus than on the
106

Effect of compression speed and on large deformation properties
fracture stress. Moreover, the flexibility and tortuosity of the strands, as well as the
deformability of the particles during deformation, will affect the fracture strain. Flexible
strands and deformable particles will result in higher fracture strains.
5.2.3 Rheological properties of the gels studied
The ratio between the energy dissipated as viscous flow and the energy elastically stored
can be expressed by the ratio between loss modulus (G’’) and the storage modulus (G’) as
determined in dynamic sinusoidal oscillation test in the linear region (van Vliet et al.,
1993). This ratio is known as the loss or damping factor or tan . Even though the validity
of tan is limited to the linear region, this parameter can help in the interpretation of
phenomena observed at large deformation.
Gelatine gels are typically elastic polymer gels of flexible, random coil protein
chains. For gelatine gels the linear region is up to strains of about 0.5 and the gels break at
true fracture strains of 1-1.5. For gelatine tan of 0.01 and lower were reported
(Takahashi, Myojo, Yoshida, Yoshimura & Hattori, 2004). Kappa-carrageenan gels are
also elastic polymer gels of stiff, rather straight chains with a linear region below a strain
of 0.1. These gels break at true fracture strains of 0.4-0.5. For -carrageenan gels prepared
in demineralised water tan increased from 0.07 to 0.09 when the gelling agent
concentration was increased from 0.3 to 1.2 wt% (Bayarri, Duran & Costell, 2004). Acid-
induced, cold set WPI gels are typically viscoelastic particle gels, with a relatively small
viscous component (tan 0.14). The linear region is up to a true strain of 0.1 (Rosa,
Sala, van Vliet & van de Velde, 2006).
5.2.4 Effect of compression speed on Young’s modulus and fracture properties
The effects of the compression speed on Young’s modulus and fracture properties of gels
can be explained on the basis of a set of basic physical phenomena related to their
viscoelastic character and taking into account the energy balance discussed above.
For gels behaving elastically, the energy supplied during deformation is stored in
the gel network and provides the stresses required to regain the original shape after
removing the deformation. In this case no energy dissipation occurs as a result of
relaxation of cross-links/ bonds due to thermal movement. Therefore, the Young’s
107
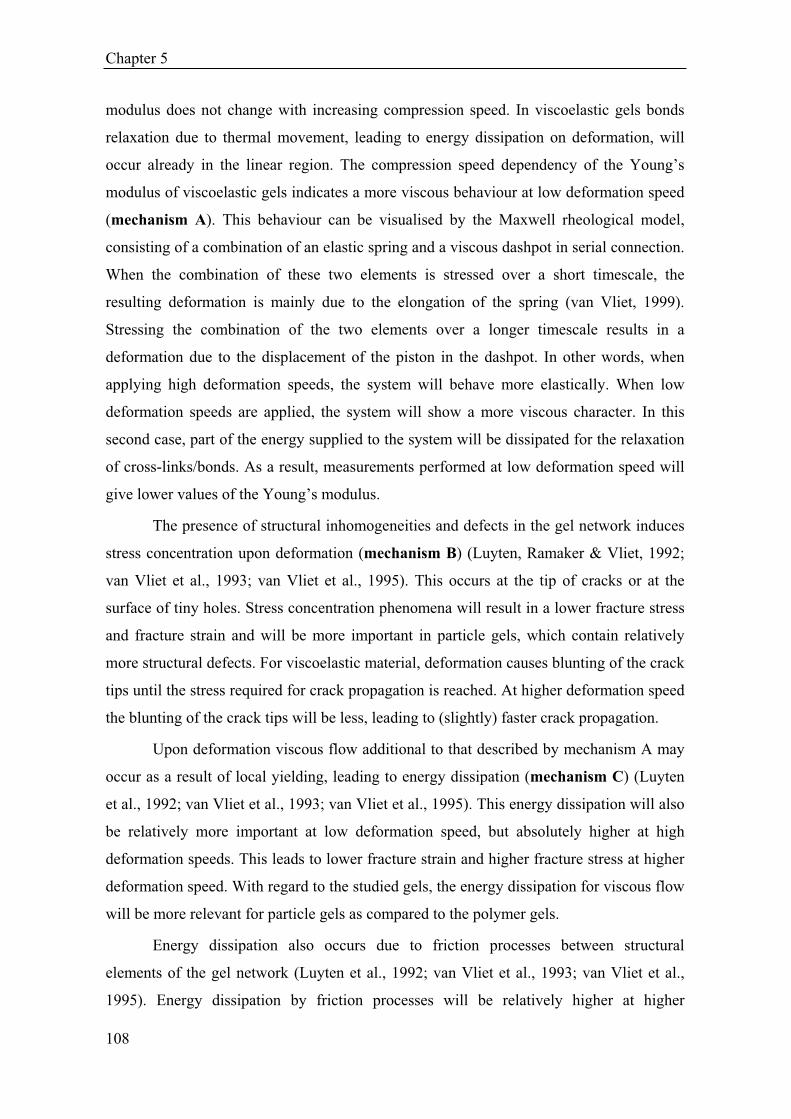
Chapter 5
modulus does not change with increasing compression speed. In viscoelastic gels bonds
relaxation due to thermal movement, leading to energy dissipation on deformation, will
occur already in the linear region. The compression speed dependency of the Young’s
modulus of viscoelastic gels indicates a more viscous behaviour at low deformation speed
(mechanism A). This behaviour can be visualised by the Maxwell rheological model,
consisting of a combination of an elastic spring and a viscous dashpot in serial connection.
When the combination of these two elements is stressed over a short timescale, the
resulting deformation is mainly due to the elongation of the spring (van Vliet, 1999).
Stressing the combination of the two elements over a longer timescale results in a
deformation due to the displacement of the piston in the dashpot. In other words, when
applying high deformation speeds, the system will behave more elastically. When low
deformation speeds are applied, the system will show a more viscous character. In this
second case, part of the energy supplied to the system will be dissipated for the relaxation
of cross-links/bonds. As a result, measurements performed at low deformation speed will
give lower values of the Young’s modulus.
The presence of structural inhomogeneities and defects in the gel network induces
stress concentration upon deformation (mechanism B) (Luyten, Ramaker & Vliet, 1992;
van Vliet et al., 1993; van Vliet et al., 1995). This occurs at the tip of cracks or at the
surface of tiny holes. Stress concentration phenomena will result in a lower fracture stress
and fracture strain and will be more important in particle gels, which contain relatively
more structural defects. For viscoelastic material, deformation causes blunting of the crack
tips until the stress required for crack propagation is reached. At higher deformation speed
the blunting of the crack tips will be less, leading to (slightly) faster crack propagation.
Upon deformation viscous flow additional to that described by mechanism A may
occur as a result of local yielding, leading to energy dissipation (mechanism C) (Luyten
et al., 1992; van Vliet et al., 1993; van Vliet et al., 1995). This energy dissipation will also
be relatively more important at low deformation speed, but absolutely higher at high
deformation speeds. This leads to lower fracture strain and higher fracture stress at higher
deformation speed. With regard to the studied gels, the energy dissipation for viscous flow
will be more relevant for particle gels as compared to the polymer gels.
Energy dissipation also occurs due to friction processes between structural
elements of the gel network (Luyten et al., 1992; van Vliet et al., 1993; van Vliet et al.,
1995). Energy dissipation by friction processes will be relatively higher at higher
108

Effect of compression speed and on large deformation properties
deformation speeds, compared with the other terms in equation 5.1. This gives higher
fracture strain and higher fracture stress at higher deformation speed (crack growth takes
time) (mechanism D).
For polymer gels with physical cross-links (e.g. gelatine gels), unzipping of
physical cross-links and formation of new bonds can be regarded as a kind of viscous flow
as a result of (local) yielding under stress and gives somewhat higher fracture strain and
fracture stress at higher deformation speed (mechanism E) (McEvoy et al., 1985).
Table 5.2 shows a summary of the mechanisms explaining the effect of
compression speed on Young’s modulus and fracture properties.
Table 5.2 – Mechanisms related to the compression speed and affecting the large deformation
behaviour in the gels studied.
Affected parameter
f f Ey
A: viscoelastic behaviour ++
: stress concentration - - B
C: induced viscous flow of the matrix + -
D: friction between structural elements ++ ++
unzipping of physical bonds* + + E:
f: fracture stress; f: fracture strain; Ey: Young’s modulus. + denotes an increase of the parameter with
speed. - indicates a decrease of the parameter. More + or – correspond to a stronger effect. *: relevant for
gelatin at low compression speed.
5.2.5 Effect of the volume fraction of the droplets on Young’s modulus and fracture
properties
The presence of the oil droplets in the gel matrix affects all the phenomena described in
the previous section. Moreover, the oil droplets will affect the gel modulus, in a way
which will depend on the interaction between the oil droplets and the gel matrix. The
effect of the oil droplets on the Young’s modulus can be explained by van der Poel theory
plus extensions (mechanism F) (van der Poel, 1958; Smith, 1974, 1975; van Vliet, 1988;
Sala et al., 2007).
109

Chapter 5
Oil droplets embedded in a gel network represent structural defects which induce
stress concentration upon deformation (mechanism B) (Luyten et al., 1992; van Vliet et
al., 1993; van Vliet et al., 1995). An increase in represent an increase of the number of
structural defects. At small deformation and for spherical holes the effective stress will
increase by a factor 3. For large deformations the situation becomes more complex. For
droplets less deformable than the gel matrix and bound to the matrix, the region between
the droplets will be extended more than the gel matrix at the sides of the droplets. This
gives stress concentration between the droplets and there the gel will start to fracture as a
result of de-bonding of the gel matrix from the droplets or due to fracture of the gel matrix
itself. This will result in lower fracture strain and lower fracture stress with increasing
for bound droplets (mechanism B1). For unbound droplets fracture is likely to occur at
the droplet gel matrix interface. Besides, for unbound droplets and especially at low
deformation speeds, the extent of stress concentration between the droplets will be smaller
since the gel matrix can move more freely with respect to the hard droplets (nevertheless
the droplets are not completely free due to friction effects). For unbound droplets this will
result in lower fracture strain and lower fracture stress with increasing , but the effect
will be smaller than for bound droplets (mechanism B2). The deformation speed effect
will give lower fracture strain and fracture stress at higher speeds.
If droplets are present in a gel matrix, viscous flow (mechanism C) is likely to
locally be more intense (Luyten et al., 1992; van Vliet et al., 1993; van Vliet et al., 1995).
Therefore, the energy dissipation due to viscous flow and the related dependency on
compression speed will increase. Boundary layers between droplets and matrix can be
relatively more viscous (van Vliet, 1988). The volume involved is small but may still have
an effect on stress.
The presence of oil droplets embedded in the gel matrix also affects the friction
phenomena occurring upon deformation (mechanism D) (Luyten et al., 1992; van Vliet et
al., 1993; van Vliet et al., 1995). As a result of inhomogeneous deformation of the gel,
causing displacement of the gel matrix with respect to the droplet surfaces, the energy
dissipated by friction will increase in filled gels as compared to gels without oil droplets.
Table 5.3 shows a summary of the mechanisms explaining the effect of on
Young’s modulus and fracture properties.
110

Effect of compression speed and on large deformation properties
Table 5.3 – Mechanisms affecting the large deformation properties of emulsion-filled gels related
to the presence of oil droplets in the gel matrix.
Affected parameter
Bound droplets (1) Unbound droplets (2)
5.2.6 Strain dependency of the modulus
For several polymeric materials, the stress upon deformation increases more than linearly
with strain, a phenomenon known as strain-hardening. Various molecular theories were
discussed to explain the strain dependency of the modulus of polymer gels and were
compared to experimental results obtained for gelatine gels (Groot, Bot & Agterof, 1996).
The molecular structure of a gel was described in terms of cross-links connected by
entropic springs. The strain-hardening of gelatine gels could be explained by several
mechanisms: a finite polymer length, a fractal nature of the polymer strands, the presence
in the gel network of both stiff rods and swollen coils or strain-induced crystallisation.
Strain-hardening was also observed for heat-set -lactoglobulin gels, i.e. particle gels
(Pouzot, Nicolai, Benyahia & Durand, 2006). In this case the experimental data were well
described by a model of interconnected fractal clusters with randomly oriented elastic
backbones. Deformation would induce the elongation of the backbones. As a
consequence, each structural unit would redistribute into more structural units of smaller
size. The strain-hardening was found to decrease with increasing gel modulus, until for
gels with G’ higher than 2 kPa no strain-hardening was observed.
f f
Eyf f
Ey
+++* --- F: van der Poel
B: stress concentration --- --- -- --
C: induced viscous flow of the matrix + - + -
D: friction filler/ matrix ++ ++
f: fracture stress; f: fracture strain; Ey: Young’s modulus. + denotes an increase of the parameter with
. - indicates a decrease of the parameter. More + or – correspond to a stronger effect. *: assuming
Efiller>> Ematrix.
111

Chapter 5
5.3 Materials and methods
5.3.1 Materials
Porcine skin gelatine PBG 07 (bloom 280, isoelectric point 8-9) was kindly provided by
PB gelatines (Vilvoorde, Belgium). Kappa-carrageenan was kindly donated by CP Kelco
(Lille Skensved, Denmark). The -carrageenan sample consisted of 93% mol -units and
7% mol -units, as determined by NMR spectrometry (van de Velde, Pereira & Rollema,
2004). Powdered whey protein isolate (WPI, BiproTM
) was obtained from Davisco
International Inc. (La Sueur, MN, USA). Tween 20 (Polyoxyethylene sorbitan
monolaurate, in the text referred to as Tween) was obtained from Sigma (Sigma-Aldrich
Chemie BV, Zwijndrecht, The Netherlands). Lactoferrin were kindly donated by DMV
International, (Veghel, The Netherlands). Medium Chain Triglycerides (MCT, MIGLYOL
812N) oil was purchased from Internatio BN (Mechelen, Belgium). Potassium chloride
(p.a.) was obtained from Merck (Darmstadt, Germany). Glucono- -lactone (GDL) was
kindly donated by Purac (Gorinchem, The Netherlands). All materials were used without
further purification. All solutions were prepared with demineralised water.
5.3.2 Sample preparation
5.3.2.1 Emulsions
WPI solutions were prepared by adding the protein to the required amount of water.
Subsequently, the solutions were gently stirred for 2 hours. Stock emulsions, consisting of
40 wt% MCT oil and 60 wt% aqueous phase containing 1 wt% WPI, were prepared by
pre-homogenising the ingredients using an Ultra Turrax (Polytron, Kinematica AG,
Lucerne, Switzerland). Pre-emulsions were further processed using a laboratory
homogeniser (Ariete, Model NS1001L 2K – Panda 2K, Niro Soavi S.p.A, Parma, Italy).
The same procedure was used for the preparation of the emulsions stabilised with Tween
and lactoferrin, only the emulsifying agent concentration in the aqueous phase was 2 wt%.
WPI-stabilised emulsions were used for the preparation of filled gelatine and -
carrageenan gels. Tween-stabilised emulsions were used for the preparation of filled
gelatine gels and lactoferrin-stabilised emulsions for the preparation of filled -
carrageenan gels. KCl was added to the emulsions used for the preparation of -
carrageenan gels, up to a concentration of 30 mM in the aqueous phase.
112

Effect of compression speed and on large deformation properties
Emulsions stabilised with WPI aggregates were prepared as described above, but
using a 3 wt% WPI aggregates dispersion as continuous phase. This dispersion was
prepared by heating a 9 wt% WPI solution at 68.5°C for 2 hours and subsequent cooling to
room temperature with tap water and diluting to 3 wt%. WPI aggregates-stabilised
emulsions were used for the preparation of filled WPI gels.
The droplet size distribution of the obtained emulsions was measured using a
Malvern Mastersizer 2000 (Malvern Instruments Ltd., Malvern, UK). The droplet volume-
surface average or Sauter diameter (d3,2) and other characteristics of the emulsions used
for the preparation of the filled gels are reported in Table 5.4.
Table 5.4 – Volume-surface average diameter (Sauter diameter) and pH of the emulsions used for
the preparation of the filled gels.
Emulsifier in the water phase d3,2
( m)
G’ droplet
(kPa)
Ey droplet
(kPa) pH
1 wt% WPI 1.15 69 207 7.06
2 wt% Tween 1.00 20 60 4.30
2 wt% Lactoferrin 1.85 43 129 5.10
3 wt% WPI aggr. 1.45 55 165 6.64
The G’of the droplet was calculated by G’=4 /d whereby the surface tension was taken to be 20 mN/m for
protein stabilised droplets and 5 mN/m for Tween stabilised droplets. Ey= 3G’.
5.3.2.2 Gels
Gelatine (4 wt%) and WPI (3 wt%) gels were prepared in demineralised water. Kappa-
carrageenan (0.6 wt%) gels were prepared in a 30 mM KCl solution. Samples were
prepared without emulsion and with different (0.05, 0.11, 0.21 corresponding to oil
concentrations of 5, 10 and 20 wt%). In all samples the concentration of the gelling agent
in the aqueous phase was kept constant.
For -carrageenan and gelatine gels, the gelling agent was allowed to hydrate for 2
hours under gentle stirring at room temperature. The samples were subsequently dissolved
by heating at 80°C for 30 minutes and cooled to 45°C. In the case of -carrageenan gels,
the emulsion was heated to 45°C prior to addition to the gelling agent solution. For
113

Chapter 5
gelatine gels, the gelling agent solution was allowed to cool to 20°C prior to mixing with
the emulsion. This procedure was followed to prevent depletion flocculation of the
emulsion droplets before gel formation (Sala et al., 2007). After mixing, the samples were
allowed to gel at room temperatures in 60 ml plastic syringes (internal diameter 26.4 mm)
coated with a thin film of paraffin oil. Gelatine gels containing Tween-stabilised
emulsions were allowed to gel in a refrigerator (7°C) for 6 hours before analysis.
Gelation of the WPI gels was induced by addition of GDL (0.22 wt% in the case of
WPI aggregates dispersion with a concentration of 3 wt%) to the WPI dispersion and to
the WPI dispersion/emulsion mix and incubation at 25°C for 17 hours. The WPI
dispersion was prepared as described above. The final pH of the gels was about 4.8.
5.3.3 Large deformation experiments
Uni-axial compression tests were performed on gel pieces of 25 mm height using an
Instron universal testing machine (Model 5543, Instron International Ldt., Edegem,
Belgium) equipped with a plate-plate geometry. In order to prevent friction between the
plates and the samples, the plates were lubricated with a thin layer of paraffin oil. The
compression was up to a strain of 80% at different constant deformation speeds: 0.05, 0.1,
0.5, 1, 2 and 4 mm/s. The true strain ( H), i.e. the absolute deformation of the specimen,
and the true stress ( t), i.e. the overall stress acting on the sample during deformation,
were calculated as follows:
H
H H
HdH
HH
00
ln1
(5.2)
A
Ft (5.3)
where H0 is the initial height of the specimen, H the actual height after deformation, F the
force measured during compression and A the corresponding cross-sectional area of the
specimen.
The determination of the recoverable energy (RE) was done by compressing the
samples up to a strain of 25% at deformation speeds of 1 and 4 mm/s. The work necessary
to compress the samples to the mentioned strain was recorded (Wc), whereby the work
was calculated from the area below the stress vs. strain curve directly after reaching a
strain of 25%. Hereafter, the compression was removed at the same speed applied during
114

Effect of compression speed and on large deformation properties
deformation and the work released by the gel specimen was immediately recorded (Ws).
The results were expressed as
c
s
W
WRE (5.4)
5.3.4 Confocal Laser Scanning Microscopy (CLSM)
Samples for microstructural analyses were stained with Rhodamine B (0.2 wt% solution;
10 µL per mL sample) to visualise the protein phase. Nile Blue was chosen as staining
agent of the oil droplets. CLSM-images were recorded on a LEICA TCS SP Confocal
Laser Scanning Microscope (Leica Microsystems CMS GmbH., Manheim, Germany),
equipped with an inverted microscope (model Leica DM IRBE), used in the single photon
mode with an Ar/Kr visible light laser. A Leica objective lens (63x/UV/1.25NA/water
immersion/PL APO) was used. The excitation wavelength was set at 568 nm for
Rhodamine B and at 488 nm for Nile Blue. Digital image files were acquired in tagged
image file format and at 1024x1024 pixel resolution.
5.4 Results
5.4.1 Effect of compression speed on Young’s modulus and fracture parameters
For all gels, variations in the compression speed affected at least one of the measured
parameters. For the polymer gels (gelatine and -carrageenan), no effect of compression
speed was observed on the Young’s modulus (Figures 5.1A, 5.2A, 5.3A, 5.4A, diamond
symbol). However, a clear effect of compression speed was found on fracture stress
(Figures 5.1B, 5.2B, 5.3B, 5.4B diamond symbol) and fracture strain (Figures 5.1C, 5.2C,
5.3C, 5.4C, diamond symbol). The effect of speed on fracture stress and fracture strain
slightly differed between gelatine and -carrageenan gels. For gelatine gels, a gradual and
continuous increase of both fracture parameters was observed with compression speeds.
For -carrageenan gels, an increase was observed up to a speed of 1 mm/s. At higher
speed the fracture parameters did not increase further. The effect of compression speed on
the large deformation properties of gelatine gels is in agreement with the results published
115

Chapter 5
in literature (van Vliet et al., 1995; Bot, van Amerongen, Groot, Hoekstra & Agterof,
1996b, 1996a).
For particle gels (WPI gels), the effect of compression speed was different from
that described for the polymer gels. For WPI gels, the Young’s modulus increased with
increasing compression speed up to a speed of 1 mm/s, above which the value of the
modulus did not increase any further (Figure 5.5A). With increasing compression speed
also the fracture stress increased (Figure 5.5B). On the other hand, no effect of
compression speed on fracture strain was observed (Figure 5.5C).
0
5
10
15
20
25
30
0.0 1.0 2.0 3.0 4.0 5.0
Compression speed (mm/ s)
Fractu
re s
tress (
kP
a)
2
3
4
5
6
7
8
0.0 1.0 2.0 3.0 4.0 5.0
Compression speed (mm/ s)
Mo
du
lus (
kP
a)
BA
0
0.2
0.4
0.6
0.8
1
1.2
1.4
1.6
0.0 1.0 2.0 3.0 4.0 5.0
Compression speed (mm/ s)
Tru
e s
train
0
5
10
15
20
25
0.0 0.5 1.0 1.5 2.0
Fracture strain
Fractu
re s
tress (
kP
a)
C D
Speed
0
5
10
15
20
25
30
0.0 1.0 2.0 3.0 4.0 5.0
Compression speed (mm/ s)
Fractu
re s
tress (
kP
a)
2
3
4
5
6
7
8
0.0 1.0 2.0 3.0 4.0 5.0
Compression speed (mm/ s)
Mo
du
lus (
kP
a)
BA
0
0.2
0.4
0.6
0.8
1
1.2
1.4
1.6
0.0 1.0 2.0 3.0 4.0 5.0
Compression speed (mm/ s)
Tru
e s
train
0
5
10
15
20
25
0.0 0.5 1.0 1.5 2.0
Fracture strain
Fractu
re s
tress (
kP
a)
C D
Speed
Figure 5.1 – Gelatine bound: effect of compression speed and on Young’s modulus (A), fracture
stress (B), fracture strain (C) and fracture points (D) ( : 0.0 oil; 0.05 oil : 0.11 oil; : 0.21
oil). The arrow close to the symbol indicates the increase of in the samples.
116

Effect of compression speed and on large deformation properties
2
3
4
5
6
7
8
0.0 1.0 2.0 3.0 4.0 5.0
Compression speed (mm/ s)
Mo
du
lus (
kP
a)
0
5
10
15
20
25
30
0.0 1.0 2.0 3.0 4.0 5.0
Compression speed (mm/ s)F
ractu
re s
tress (
kP
a)
0
5
10
15
20
25
0.0 0.5 1.0 1.5 2.0
Fracture strain
Fractu
re s
tress (
kP
a)
0
0.2
0.4
0.6
0.8
1
1.2
1.4
1.6
0.0 1.0 2.0 3.0 4.0 5.0
Compression speed (mm/ s)
Speed
A
C
B
D
2
3
4
5
6
7
8
0.0 1.0 2.0 3.0 4.0 5.0
Compression speed (mm/ s)
Mo
du
lus (
kP
a)
0
5
10
15
20
25
30
0.0 1.0 2.0 3.0 4.0 5.0
Compression speed (mm/ s)F
ractu
re s
tress (
kP
a)
Figure 5.2 – Gelatine unbound: effect of compression speed and on Young’s modulus (A),
fracture stress (B), fracture strain (C) and fracture points (D) ( : 0.0 oil; 0.05 oil : 0.11 oil; :
0.21 oil). The arrow close to the symbol indicates the increase of in the samples.
Tru
e s
train
0
0.2
0.4
0.6
0.8
1
1.2
1.4
1.6
0.0 1.0 2.0 3.0 4.0 5.0
Compression speed (mm/ s)
0
5
10
15
20
25
0.0 0.5 1.0 1.5 2.0
Fracture strain
Fractu
re s
tress (
kP
a)
Speed
A
C
B
D
Tru
e s
train
117
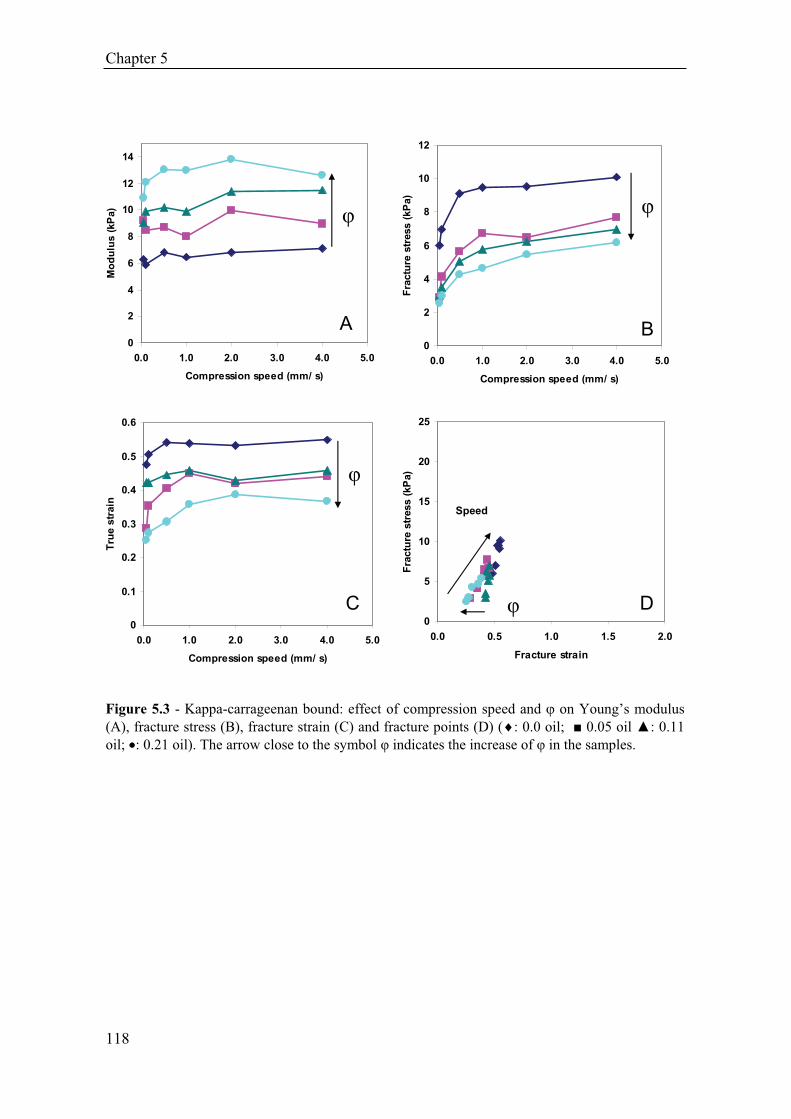
Chapter 5
0
2
4
6
8
10
12
14
0.0 1.0 2.0 3.0 4.0 5.0
Compression speed (mm/ s)
Mo
du
lus (
kP
a
0
2
4
6
8
10
12
0.0 1.0 2.0 3.0 4.0 5.0
Compression speed (mm/ s)
Fractu
re s
tress (
kP
a)
Figure 5.3 - Kappa-carrageenan bound: effect of compression speed and on Young’s modulus
(A), fracture stress (B), fracture strain (C) and fracture points (D) ( : 0.0 oil; 0.05 oil : 0.11
oil; : 0.21 oil). The arrow close to the symbol indicates the increase of in the samples.
)
0
0.1
0.2
0.3
0.4
0.5
0.6
0.0 1.0 2.0 3.0 4.0 5.0
Compression speed (mm/ s)
Tru
e s
train
0
5
10
15
20
25
0.0 0.5 1.0 1.5 2.0
Fracture strain
Fractu
re s
tress (
kP
a)
Speed
DC
BA0
2
4
6
8
10
12
0.0 1.0 2.0 3.0 4.0 5.0
Compression speed (mm/ s)
Fractu
re s
tress (
kP
a)
0
2
4
6
8
10
12
14
0.0 1.0 2.0 3.0 4.0 5.0
Compression speed (mm/ s)
Mo
du
lus (
kP
a)
0
5
10
15
20
25
0.0 0.5 1.0 1.5 2.0
Fracture strain
Fractu
re s
tress (
kP
a)
0
0.1
0.2
0.3
0.4
0.5
0.6
0.0 1.0 2.0 3.0 4.0 5.0
Compression speed (mm/ s)
Tru
e s
train
Speed
DC
BA
118

Effect of compression speed and on large deformation properties
0
1
2
3
4
5
6
7
8
9
10
0.0 1.0 2.0 3.0 4.0 5.0
Compression speed (mm/ s)
Mo
du
lus (
kP
a)
0
1
2
3
4
5
6
7
8
9
10
0.0 1.0 2.0 3.0 4.0 5.0
Compression speed (mm/ s)
Fractu
re s
tress (
kP
a)
0
0.1
0.2
0.3
0.4
0.5
0.6
0.0 1.0 2.0 3.0 4.0 5.0
Compression speed (mm/ s)
Tru
e s
train
0
5
10
15
20
25
0.0 0.5 1.0 1.5 2.0
Fracture strain
Fractu
re s
tress (
kP
a)
Speed
DC
BA0
1
2
3
4
5
6
7
8
9
10
0.0 1.0 2.0 3.0 4.0 5.0
Compression speed (mm/ s)
Mo
du
lus (
kP
a)
0
1
2
3
4
5
6
7
8
9
10
0.0 1.0 2.0 3.0 4.0 5.0
Compression speed (mm/ s)
Fractu
re s
tress (
kP
a)
0
0.1
0.2
0.3
0.4
0.5
0.6
0.0 1.0 2.0 3.0 4.0 5.0
Compression speed (mm/ s)
Tru
e s
train
0
5
10
15
20
25
0.0 0.5 1.0 1.5 2.0
Fracture strain
Fractu
re s
tress (
kP
a)
Speed
DC
BA
Figure 5.4 - Kappa-carrageenan unbound: effect of compression speed and on Young’s modulus
(A), fracture stress (B), fracture strain (C) ( : 0.0 oil; 0.05 oil : 0.11 oil; : 0.21 oil). The
arrow close to the symbol indicates the increase of in the samples.
119

Chapter 5
0
1
2
3
4
5
6
7
8
9
10
0.0 1.0 2.0 3.0 4.0 5.0
Compression speed (mm/ s)
Mo
du
lus (
kP
a)
0
1
2
3
4
5
6
7
8
9
10
0.0 1.0 2.0 3.0 4.0 5.0
Compression speed (mm/ s)
Fractu
re s
tress (
kP
a)
0
0.2
0.4
0.6
0.8
1
1.2
0.0 1.0 2.0 3.0 4.0 5.0
Compression speed (mm/ s)
Tru
e s
train
0
5
10
15
20
25
0.0 0.5 1.0 1.5 2.0
Fracture strain
Fractu
re s
tress (
kP
a)
Speed
A
DC
B0
1
2
3
4
5
6
7
8
9
10
0.0 1.0 2.0 3.0 4.0 5.0
Compression speed (mm/ s)
Mo
du
lus (
kP
a)
0
1
2
3
4
5
6
7
8
9
10
0.0 1.0 2.0 3.0 4.0 5.0
Compression speed (mm/ s)
Fractu
re s
tress (
kP
a)
0
0.2
0.4
0.6
0.8
1
1.2
0.0 1.0 2.0 3.0 4.0 5.0
Compression speed (mm/ s)
Tru
e s
train
0
5
10
15
20
25
0.0 0.5 1.0 1.5 2.0
Fracture strain
Fractu
re s
tress (
kP
a)
Speed
A
DC
B
Figure 5.5 – WPI bound: effect of compression speed and on Young’s modulus (A), fracture
stress (B), fracture strain (C) and fracture point (D) ( : 0.0 oil; 0.05 oil : 0.11 oil; : 0.21 oil).
The arrow close to the symbol indicates the increase of in the samples.
5.4.2 Droplet-matrix interactions and oil droplet aggregation in emulsion-filled gels
By varying the emulsifying agent used for emulsion preparation, the interactions between
oil droplets and gel matrix could be modulated. For the polymer gels studied, samples
with bound as well as unbound droplets could be prepared. For the studied particle gels,
only samples with bound droplets could be prepared. As previously reported (Sala et al.,
2007), the addition of a WPI-stabilised emulsion to gelatine gels resulted in filled gels
containing bound droplets, whereas with the same gel matrix a Tween-stabilised emulsion
120

Effect of compression speed and on large deformation properties
gave filled gels containing unbound droplets. WPI-stabilised emulsion droplets in -
carrageenan gels also behaved as unbound droplets (Sala et al., 2007). For the present
work, lactoferrin-stabilised emulsions were added to -carrageenan in order to obtain
filled gels with bound droplets. At the pH of the filled -carrageenan gels (7-8), lactoferrin
displays a positive net charge, while -carrageenan is negatively charged. As a
consequence, the interactions between the oil droplets and the gel matrix are expected to
be attractive. These interactions indeed manifested themselves by an increase of the
Young’s modulus with increasing in compression measurements (Figure 5.3A). For -
carrageenan samples without oil droplets but containing the same amount of lactoferrin as
filled gels with = 0.21, an increase in the Young’s modulus by 20% was observed. This
increase was comparable to that observed for gels with = 0.05. Furthermore, no effect of
lactoferrin was observed on the fracture stress and fracture strain (results not shown).
Therefore, the effect of lactoferrin present in the water phase of the added lactoferrin-
stabilised emulsion on the studied parameters could be neglected. For WPI gels, filled gels
with bound droplets were prepared by using a WPI aggregates-stabilised emulsion for
sample preparation (Rosa et al., 2006).
The microstructure of the gels studied, with the exception of gelatine gels with
unbound droplets and -carrageenan gels with bound droplets, has been described
previously (Sala et al., 2007; Sala, De Wijk, van de Velde & van Aken, 2008). The
procedure chosen for the preparation of gelatine gels with bound droplets resulted in gels
with non-aggregated oil droplets. For -carrageenan gels containing WPI-stabilised
emulsions, extensive aggregation of the oil droplets was observed, whilst the oil droplets
embedded in WPI gels were homogeneously distributed. Also for gelatine gels with
unbound droplets, the oil droplets were non-aggregated or only slightly aggregated (Figure
5.6A), while the lactoferrin-stabilised oil droplets present in -carrageenan gels were
extensively aggregated (Figure 5.6B).
121

Chapter 5
A B
Figure 5.6 - CLSM images of a gelatin gel containing a Tween 20-stabilised emulsion (A; staining
agent: Nile blue; bright: fat) and a -carrageenan gel containing a lactoferrin-stabilised emulsion
(B; staining agent: Rhodamine B; bright: protein) ( : 0.21; image size 159 X 159 m).
In -carrageenan gels with lactoferrin-stabilised emulsions, the aggregation of the oil
droplets is likely to be driven by electrostatic bridging between the protein adsorbed at the
oil-water interface and the polymer present in solution. For the chosen emulsions, the
aggregation of the oil droplets in the -carrageenan gels could not be prevented. In chapter
3 (Sala et al., 2007) we showed that the aggregation of the oil droplets has mainly an
effect on the Young’s modulus of the filled gels and does not affect their fracture
properties. The aggregation of the oil droplets represents an increase of the effective due
to the matrix entrapped within the aggregate. In case the stiffness of the aggregates is
higher than the Young’s modulus of the gel matrix, this results in an increase of the
Young’s modulus of the filled gels. At the contrary, if the stiffness of the aggregates is
lower than the Young’s modulus of the gel matrix, the increase in effective caused by oil
droplet aggregation induces a decrease in the Young’s modulus of the filled gel. The effect
of aggregation on the Young’s modulus can be assumed to be constant with increasing .
Moreover, droplet aggregation occurred in both gels with bound and unbound dropelts.
Therefore, in this work the variations in the large deformation properties of -carrageenan
gels caused by oil droplet aggregation were not investigated in detail. In chapter 6 more
attention will be paid to the effects of aggregation phenomena.
122

Effect of compression speed and on large deformation properties
5.4.3 Effect of the oil volume fraction on Young’s modulus and fracture parameters
For all gels, the effect of on the Young’s modulus depended on the interaction between
the oil droplets and gel matrix. In accordance with the van der Poel theory, the Young’s
modulus increased with increasing for gels with bound droplets (Figures 5.1A, 5.3A and
5.5A) and decreased for unbound droplets, (Figures 5.2A and 5.4A). The presence of oil
droplets did not affect the speed dependency of the Young’s modulus of the gels.
Focussing on the effect of oil droplets on fracture parameters, differences were
observed between the way gelatine and -carrageenan gels react to a variation in
compression speed. For gelatine gels with bound droplets, the effect of on fracture stress
was small for compression speeds up to 1 mm/s. Above this speed, an increase of
resulted in a decrease of the fracture stress (Figure 5.1B); this effect of on fracture stress
at higher compression speed was just the reverse of that on the Young’s modulus. For
gelatine gels with unbound droplets (Figure 5.2B), a clear decrease of fracture stress with
increasing was also observed, but it started already at compression speed of 0.1 mm/s.
Also for -carrageenan gels the effect of oil content was already visible at compression
speeds above 0.05 mm/s both for bound and unbound droplets (Figure 5.3B and 4B). For
these gels, a decrease of the fracture stress with increasing was observed for both bound
and unbound droplets. For both gelatine and -carrageenan gels a decrease of the fracture
strain with increasing concentration of bound droplets was found (Figure 5.1C, 5.3C). The
effect of was larger at higher compression speeds, but was already clear at lower speed.
A decrease of the fracture strain with increasing was also observed for -carrageenan
gels with unbound droplets (Figure 5.4C). For gelatine gels with unbound droplets (Figure
5.2C), the decrease of fracture strain caused by the presence of the oil droplets was only
minor and not systematically related to . For WPI gels with increasing , the fracture
stress slightly increased (Figure 5.5B) and the fracture strain somewhat decreased (Figure
5.5C).
Graphs of the fracture point (defined as the maximum in the stress-strain curve) at
different compression speeds and for samples with different present the above given
information in an efficient way (Figures 5.1-5.5, panels D). These graphs clearly show
how the effect of on fracture properties depends on the interactions between oil droplets
and gel matrix. Furthermore, they demonstrate that the effect of compression speed and
on fracture parameters is gel-dependent. For gelatine gels with bound droplets (Figure
5.1D), the fracture points of emulsion-filled gels fall above those of the gels without oil.
123

Chapter 5
For gelatine gels with unbound droplets (Figure 5.2D), the fracture points of emulsion-
filled gels fall below those of the gels without oil. For gels with unbound droplets, the
slope of curves connecting the fracture points of samples with the same decreased. This
corresponds to a decreasing effect of compression speed on fracture stress with increasing
. Also for -carrageenan gels, the fracture points of emulsion-filled gels with bound
droplets fall above those of the gels without oil (Figure 5.3D), whereas the fracture point
of gels with unbound droplets fall below those of the gels without oil (Figure 5.4D).
However, for these gels the effect of both compression speed and on fracture parameters
was smaller than for the gelatine gels. The graph obtained for WPI gels was different from
those for the polymer gels. For WPI gels, only a limited effect of compression speed was
observed (Figure 5.5D).
For gelatine gels, the overall effect of emulsion droplets on fracture stress and
strain was similar to that reported for gelatine gels containing whey protein particles (Bot
et al., 1996a) although we studied a much larger filler concentration range and performed
compression measurements over a larger speed range. The similarity of our results and
those of Bot et al. means that the effect of oil droplets on the fracture properties of these
gels can be mimicked by whey protein particles.
The strengthening of WPI gels with increasing concentration of oil droplets
stabilised by WPI aggregates is in accordance with the results obtained by other authors
for heat-induced whey protein gels containing whey protein stabilised emulsions (Langley
& Green, 1989; (Xiong, Aguilera & Kinsella, 1991a; Xiong & Kinsella, 1991b);
McClements et al., 1993).
5.4.4 Strain-dependency of the Young’s modulus
In order to better understand the effect of oil droplets on the structural and functional
properties of emulsion-filled gels, an analysis of the effect of both and compression
speed on the strain-dependency of the modulus of the gels was carried out. The strain-
hardening behaviour of the studied gels can be seen from the increase in the slope of the
stress vs. strain curves with increasing compressive strain (Figure 5.7). The behaviour of
the three gels was remarkably different. Both the polymer gels studied showed strain-
hardening, with differences between the two gels related to the different structure of their
gel network. For gelatine, two main parts could be recognised in the stress vs. strain curve
124

Effect of compression speed and on large deformation properties
(Figure 5.7). At low strain (up to about 0.6), the effect of the strain on the modulus (the
slope of the stress vs. strain curve) was relatively limited. At higher strains, the slope of
the curve increased and flattened on approaching the fracture point. For -carrageenan
gels, a sudden increase of the slope of the stress vs. strain curve was observed at strains
between 0.1 and 0.2 (Figure 5.7). At higher strain the slope of the curve did not change. In
-carrageenan gels the polymer chains are less flexible, less random coil-like, more
straight and stiff than in gelatine gels, resulting in a fast increase of the modulus with
increasing strain. This can explain the difference observed between the two gels. On the
other hand, the modulus of WPI gels did not change with increasing strain (Figure 5.7).
These gels were not strain-hardening.
0
2
4
6
8
10
12
14
16
18
20
0 0.5 1 1.5 2
True strain
Tru
e s
tress (
kP
a)
Figure 5.7 – Stress vs. strain curves of gelatine ( ), WPI ( ) and -carrageenan gels ( )
(compression speed: 4 mm/s).
The effect of on strain-hardening behaviour was studied by superimposing the
fracture vs. strain curves of gels with different and observing possible deviations in the
slope of the curves as compared to the curves of gels without oil (Figure 5.8). The curves
were superimposed by dividing the stress along the stress vs. strain curve by the Young’s
modulus. The obtained stress is dimensionless and was called normalised stress. Figure
5.8 shows the results for -carrageenan gels (the results for gelatine gels are not shown).
For both polymer gels studied, the slope of the normalised stress vs. strain curve was not
affected by and decreased with increasing only as the fracture point was approached
(Figure 5.8A). This effect was not affected by the compression speed (compare Figures
125

Chapter 5
5.8A and 5.8B) and was more evident for gels with bound droplets (compare Figures 5.8A
and 5.8C). Actually, the observed decrease of the slope of the normalised stress vs. strain
curve does not show an effect of the oil droplets on strain-hardening. As the fracture point
is approached, small cracks originated at the surface of the oil droplets will propagate and
join within the gel structure, resulting in a overall decrease of the measured stress. This
effect will increase with increasing and is in agreement with the observed effect of on
fracture stress and fracture strain. For WPI gels, which did not show strain-hardening, no
effect of and compression speed was observed (results not shown). In conclusion, under
the chosen experimental conditions and compression speed did not affect the strain-
hardening behaviour of the studied gels.
0
0.5
1
1.5
2
0 0.2 0.4 0.6 0.8 1
True strain
No
rm
ali
sed
str
ess
0
0.5
1
1.5
2
0 0.2 0.4 0.6 0.8 1
True strain
No
rm
ali
sed
str
ess
0
0.5
1
1.5
2
0 0.2 0.4 0.6 0.8 1
True strain
No
rm
ali
sed
str
ess
C
BA0
0.5
1
1.5
2
0 0.2 0.4 0.6 0.8 1
True strain
No
rm
ali
sed
str
ess
0
0.5
1
1.5
2
0 0.2 0.4 0.6 0.8 1
True strain
No
rm
ali
sed
str
ess
0
0.5
1
1.5
2
0 0.2 0.4 0.6 0.8 1
True strain
No
rm
ali
sed
str
ess
C
BA
Figure 5.8 - Effect of on stress vs. strain curve for different types of -carrageenan gels at
different deformation speeds. A: bound droplets, 1 mm/s. B: bound droplets, 4 mm/s. C: unbound
droplets, 1 mm/s. ( : 0.0 oil; 0.05 oil : 0.11oil; : 0.21oil).
5.4.5 Recoverable energy
126

Effect of compression speed and on large deformation properties
The energy released by a gel specimen after removing a previously applied deformation
gives an indication of the viscoelastic behaviour of the gel. The lower the energy
recovered, the more viscous the gels. The effect of on recoverable energy differed not
only between particle and polymer gels, but also between the different polymer gels. For
WPI gels, a gradual decrease of the recoverable energy was observed with increasing
(Figure 5.9). An increase in resulted in less elastic and more viscous gels. For gelatine
gels with bound droplets, no effect of on recoverable energy was found, independently
of the compression speed. However, for gelatine gels with unbound droplets, a clear
decrease of the recoverable energy was observed with increasing . At higher compression
speed this decrease was even larger. Since in gelatine gels with unbound droplets did not
affect the fracture strain (Figure 5.4C), it can be concluded that an increase of in these
gels made them less elastic at large deformation. For -carrageenan gels, the effect of on
recoverable energy was limited (Figure 5.9). Also the effect of the speed was relatively
small.
40
50
60
70
80
90
100
0 0.05 0.1 0.15 0.2 0.25
Oil volume fraction
Reco
verab
le e
nerg
y (
%)
40
50
60
70
80
90
100
0 0.05 0.1 0.15 0.2 0.25
Oil volume fraction
Reco
verab
le e
nerg
y (
%)
BA40
50
60
70
80
90
100
0 0.05 0.1 0.15 0.2 0.25
Oil volume fraction
Reco
verab
le e
nerg
y (
%)
40
50
60
70
80
90
100
0 0.05 0.1 0.15 0.2 0.25
Oil volume fraction
Reco
verab
le e
nerg
y (
%)
BA
Figure 5.9 - Effect of on recoverable energy for different gels. : gelatine gels with bound
droplets; : gelatine gels with unbound droplets; : -carrageenan gels with bound droplets; :
-carrageenan gels with unbound droplets; WPI gels with bound droplets. (A): compression
speed 1 mm/s. (B): compression speed 4 mm/s.
127

Chapter 5
5.5 Discussion
The data currently available in literature on the large deformation and fracture properties
of emulsion-filled gels are often inconclusive and are sometimes contradictory. The reason
of this lack of coherency is that previous studies have usually focussed on one particular
gel system. Moreover, large deformation and fracture measurements have normally been
performed only at one deformation speed, whereby the applied deformation speed has
almost in all cases been lower than 1 mm/s. In the present study we included different gel
systems, covering a representative set of cases with regard to type of gel matrices and
interaction between oil droplets and gel matrix. By measuring the effect of at different
compression speeds, an overview could be obtained of the effect of oil droplets on the
large deformation and fracture properties of the gels (Tables 5.5 and 5.6).
Table 5.5 – Summary of the results with respect to the effect of speed.
Compression speed
Type of gel f f Ey RE
Gelatine bound +++ +++ 0 0
Gelatine unbound + + 0 -
-carrageenan bound +++ +++ 0 0
-carrageenan unbound + + 0 0
WPI bound ++ 0 +++ 0
f: fracture stress; f: fracture strain; Ey: Young’s modulus. + denotes an increase of the parameter with
peed. - indicates a decrease of the parameter. More + or – correspond to a stronger effect. 0: no effect. s
Table 5.6 – Summary of the results with respect to the effect of .
Type of gel f f Ey RE
Gelatine bound -- --- +++ 0
Gelatine unbound --- -- --- ---
-carrageenan bound --- --- ++ -
-carrageenan unbound -- -- -- -
WPI bound ++ -- +++ --
f: fracture stress; f: fracture strain; Ey: Young’s modulus. + denotes an increase of the parameter with
. - indicates a decrease of the parameter. More + or – correspond to a stronger effect. 0: no effect.
128

Effect of compression speed and on large deformation properties
Compression measurements over a wide range of deformation speeds provided basic
information on the mechanical behaviour of the gel, which was useful for the
interpretation of the effect of oil droplets on the mechanical properties of the gels.
Measurements at high compression speeds showed large differences between gels with
regard to the effect of oil droplets, while these differences were not visible at the low
speeds usually applied in literature.
In the following we propose an explanation of the results presented in this work
based on the rheological properties of the systems studied and considering the different
mechanisms regarding compression speed dependency, stress concentration and energy
dissipation upon deformation (Table 5.2 and 5.3).
In Table 5.7 a summary is given of the mechanisms that may explain the observed
effects of compression speed on the Young’s modulus and fracture properties of the gel
matrices studied. For gelatine and -carrageenan gels, the Young’s modulus was almost
independent of the compression speed. These two gels behave almost purely elastically.
The compression speed dependency of the Young’s modulus of the viscoelastic WPI gels
indicates a more viscous behaviour (mechanism A). These findings are in agreement with
both the recoverable energy values obtained for gels without oil droplets and the tan
values reported in literature for these gels. Gelatine gels were the most elastic, WPI gels
were the most viscous and -carrageenan gels were intermediate. For the polymer gels, the
increase of fracture stress and fracture strain with increasing compression speed can be
ascribed to increased friction between the structural elements of the gel and, for gelatine,
to the unzipping of the physical bond connecting flexible random-coil chains. For WPI
gels, which showed a more viscoelastic behavior, the effect of compression speed on
fracture properties can be explained on the basis of the viscous flow of the matrix and the
presence of inherent defects within the gel network, which induce stress concentration
upon deformation.
129

Chapter 5
Table 5.7 – Summary of the mechanisms explaining the effect of the compression speed on
fracture properties and Young’s modulus of the gels.
Type of gel f f Ey
E, D E, D Elastic behaviour
D D
Gelatine bound
-carrageenan bound
WPI bound B, C, D B, C, D
Elastic behaviour
A
f: fracture stress; f: fracture strain; Ey: Young’s modulus.
In Table 5.8 a summary is given of the mechanisms that may explain the effects of
the presence of oil droplets in the gel matrix and of their on the Young’s modulus and
fracture properties. In all gels the oil droplets act mainly as stress concentration nuclei,
with differences which can be ascribed to the droplet-matrix interactions. The overall
effect on fracture properties is a combination of these effects and of the effect of the
droplets on the Young’s modulus.
Table 5.8 – Summary of the mechanisms explaining the effect of on fracture properties and
Young’s modulus of emulsion-filled gels.
Type of gel f f Ey
Gelatine bound B1, F1 B1 F1
Gelatine unbound B2, F2 B2 F2
-carrageenan bound B1, F1 B1 F1
-carrageenan unbound B2, D, F2 B2, D F2
WPI bound F1, C, (B1) C, B1 F1
f: fracture stress; f: fracture strain; Ey: Young’s modulus. F1: van der Poel theory for bound droplets;
F2: van der Poel theory for unbound droplets.
The presence of oil droplets in the gel matrix modifies also the effect on large
deformation properties of changes in compression speed. For all gels, the amount of
energy dissipated by friction increases with increasing deformation speed (Table 5.9).
130

Effect of compression speed and on large deformation properties
Table 5.9 – Summary of the mechanisms explaining the interactions of compression speed and
on fracture properties and Young’s modulus of emulsion-filled gels.
Type of gel f f Ey
Gelatine bound E, D E, D Elastic behaviour
Gelatine unbound B2, D, E(*) B2, D, E(*)
-carrageenan bound D D
-carrageenan unbound D, B D, B
Elastic behaviour
Elastic behaviour
Elastic behaviour
WPI bound C, (D) C, (D) A
f: fracture stress; f: fracture strain; Ey: Young’s modulus. *: balance between D and E shifted to D
Nevertheless, the effect of compression speed on the Young’s modulus and the
fracture parameters as described for the matrices does not qualitatively change as a result
of this increase in energy dissipation. Also when oil droplets are present in the gel matrix,
the Young’s modulus is independent of compression speed for the polymer gels and
increases with increasing compression speed for the WPI gels. Furthermore, for both
polymer and WPI gels the fracture parameters remain dependent of compression speed.
Up to the highest studied, the compression speed-dependency of the matrix determines
the effect of compression speed on the large deformation and fracture properties of the
filled gels. These findings are generally in line with the recoverable energy values
obtained for the filled gels. For the polymer gels, the presence of bound droplets did not
affect their elastic behaviour. On the other hand, the presence of unbound droplets
increased the viscous character of gelatine gels. This implies a higher amount of energy
dissipated by friction. With increasing compression speed the amount of energy dissipated
by friction increases even more. The effect of on the recoverable energy values obtained
for gelatine gels with unbound droplets is not enough to show repercussions on the effect
of compression speed on the Young’s modulus. Also for gelatine gels containing unbound
droplets and with = 0.21 no effect of compression speed on the Young’s modulus was
observed. The measurements of the recoverable energy were performed up to a strain of
0.25. For gelatine gels, this strain is still within the linear region. For both -carrageenan
and WPI gels a strain of 0.25 falls outside the linear region. For these gels the lower
recoverable energy as compared to gelatine is related to the formation of cracks within the
gel structure. The formation of cracks will increase with increasing . In Table 5.10 the
131

Chapter 5
mechanisms explaining the effects of and compression speed on recoverable energy are
summarised.
Table 5.10 – Summary of the mechanisms explaining the effect of the compression speed on
recoverable energy of emulsion-filled gels.
RE Type of gel
Oil droplets Compression speed
Gelatine bound
Gelatine unbound
-carrageenan bound
-carrageenan unbound
WPI bound
Linear region, small effect
Energy dissipation for friction (D)
Outside linear reg., crack formation (*)
Outside linear reg., crack formation (*)
Outside linear reg., crack formation (*)
Linear region, small effect
Energy dissipation for friction (D)
No effect
No effect
No effect
*: Implies energy dissipation.
The strain-hardening behaviour of the polymer gels studied is likely to be related to
the straightening of the polymer chains upon deformation (Groot et al., 1996). The strain-
independency of the modulus of WPI gels is in agreement with the results of Pouzot et al.
(2006) for heat-set -lactoglobulin gels with a modulus higher than 2 kPa.
The presence of oil droplets within the gel matrix and the compression speed
probably do not affect the strain-hardening behaviour of the studied gels. To our opinion,
the observed decrease of the slope of the fracture vs. strain curve with increasing a
higher strains does not represent a change of the strain-hardening behaviour of the gels,
but is related to stress concentration phenomena induced by the droplets. This is supported
by the effect of on fracture stress and strain observed for polymer (strain-hardening)
gels. The calculation of strain-hardening parameters (e.g. by dividing the modulus at
fracture by the Young’s modulus or the modulus in an initial part of the curve (Gwartney,
D.K. & Foegeding, 2004) without analysing the stress vs. strain curves would lead to
incorrect conclusions. In this particular case it would lead to the conclusions that strain-
hardening decreases with increasing .
132

Effect of compression speed and on large deformation properties
5.6 Conclusions
For emulsion-filled gels the compression speed dependency of Young’s modulus and
fracture behaviour is determined by the gel matrix. The presence of oil droplets embedded
in the gel matrix has primarily an affect on the Young’s modulus. The effect of the oil
droplets on the fracture behaviour of emulsion-filled gels is related to two main
mechanisms. Oil droplets act as stress concentration nuclei and increase the energy
dissipation by friction. Stress concentration results in a decrease of both fracture stress and
fracture strain. Energy dissipation by friction causes an increase of both fracture stress and
fracture strain. The first mechanism is more important for bound droplets, the second for
unbound droplets. The overall effect of stress concentration and energy dissipation by
friction induced by the presence of oil droplets is related to the rheological properties of
the gel matrix and to the droplet-matrix interactions. For elastic polymer gels, like gelatine
and -carrageenan gels, stress concentration is more important than energy dissipation for
friction. This also holds for gels with bound droplets as compared to gels with unbound
droplets, independently of the type of gel. For particle gels, like WPI gels, friction
phenomena will be more relevant. This holds also for gels with unbound droplets as
compared to gels with bound droplets, independently of the type of gel. With increasing ,
particle gels and gels containing unbound droplets become less elastic and more viscous.
In particle gels, however, energy dissipation by viscous flow also plays an important role.
5.7 References
Bayarri, S., Duran, L. & Costell, E. (2004). Influence of sweeteners on the viscoelasticity of
hydrocolloids gelled systems. Food Hydrocolloids, 18(4), 611-619.
Bot, A., van Amerongen, I. A., Groot, R. D., Hoekstra, N. L. & Agterof, W. G. M. (1996a). Effect
of deformation rate on the stress-strain curves of gelatin gels. Journal De Chimie Physique
Et De Physico-Chimie Biologique, 93(5), 837-849.
Bot, A., van Amerongen, I. A., Groot, R. D., Hoekstra, N. L. & Agterof, W. G. M. (1996b). Large
deformation rheology of gelatin gels. Polymer Gels And Networks, 4(3), 189-227.
Chen, J. & Dickinson, E. (1998). Viscoelastic properties of heat-set whey protein emulsion gels.
Journal of Texture Studies, 29, 285-304.
Chen, J. & Dickinson, E. (1999). Effect of surface character of filler particles on rheology of heat-
set whey protein emulsion gels. Colloids and Surfaces B: Biointerfaces, 12, 373-381.
133

Chapter 5
Chen, J., Dickinson, E., Langton, M. & Hermansson, A.-M. (2000). Mechanical properties and
microstructure of heat-set whey protein gels: effect of emulsifiers. Lebensmittel
Wissenschaft Und Technologie, 33, 299-307.
Dickinson, E., Hong, S.-T. & Yamamoto, Y. (1996). Rheology of heat-set emulsion gels
containing -lactoglobulin and small-molecule surfactants. Netherlands Milk & Dairy
Journal, 50, 199-207.
Dickinson, E. & Chen, J. (1999). Heat-set whey protein emulsion gels: role of active and inactive
filler particles. Journal of Dispersion Science and Technology, 20(1&2), 197-213.
Groot, R. D., Bot, A. & Agterof, W. G. M. (1996). Molecular theory of strain hardening of a
polymer gel: Application to gelatin. Journal Of Chemical Physics, 104(22), 9202-9219.
Gwartney, E. A., Larick, D.K., L. & Foegeding, E. A. (2004). Sensory texture and mechanical
properties of stranded and particulate protein emulsion gels. Journal of Food Science,
69(9), s333-s339.
Kim, K.-H., Gohtani, S. & Yamano, Y. (1996). Effects of oil droplets in physical and sensory
properties of o/w emulsion agar gels. Journal of Texture Studies, 27, 655-670.
Kim, K.-H., Renkema, J.M.S. & van Vliet, T. (2001). Rheological properties of soybean protein
isolate gels containing emulsion droplets. Food Hydrocolloids, 15, 295-302.
Langley, K. R. & Green, M. L. (1989). Compression strength and fracture properties of model
particulate food composites in relation to their microstructure and particle-matrix
interaction. Journal of Texture Studies, 20, 191-207.
Luyten, H., Ramaker, M. G. & van Vliet, T. (1992). Fracture properties of starch gels. In Phillips,
G. O., Wedlock, D. J. & Williams, P. A., Gums and stabilizers for the food industry. (Vol.
6) (pp. 101-107). Oxford: IRL Press.
McClements, D. J., Monahan, F. J. & Kinsella, J. E. (1993). Effect of emulsion droplets on
rheology of whey protein isolate gels. Journal of Texture Studies, 24, 411-422.
McEvoy, H., Rossmurphy, S. B. & Clark, A. H. (1985). Large Deformation and Ultimate
Properties of Bio-Polymer Gels .1. Single Bio-Polymer Component Systems. Polymer,
26(10), 1483-1492.
Mellema, M., Walstra, P., van Opheusden, J. H. J. & van Vliet, T. (2002). Effects of structural
rearrangements on the rheology of rennet-induced casein particle gels. Advances In
Colloid And Interface Science, 98(1), 25-50.
Mor-Rosenberg, Y., Schoemaker, C.F., Rosenberg, M. (2004). Mechanical properties of composite
gels consisting of fractionated whey proteins and fractionated milk fat. Food
Hydrocolloids, 18, 153-166.
Normand, V., Plucknett, K. P., Pomfret, S. J., Ferdinando, D. & Norton, I. T. (2001). Large
deformation mechanical behavior of gelatin-maltodextrin composite gels. Journal of
Applied Polymer Science, 82(1), 124-135.
Peyron, M. A., Mioche, L., Renon, P. & Abouelkaram, S. (1996). Masticatory jaw movement
recordings: A new method to investigate food texture. Food Quality and Preference, 7(3-
4), 229-237.
134

Effect of compression speed and on large deformation properties
Pouzot, M., Nicolai, T., Benyahia, L. & Durand, D. (2006). Strain hardening and fracture of heat-
set fractal globular protein gels. Journal Of Colloid And Interface Science, 293(2), 376-
383.
Rosa, P., Sala, G., van Vliet, T. & van de Velde, F. (2006). Cold gelation of whey protein
emulsions. Journal of Texture Studies, 35, 516-537.
Ross-Murphy, S. B. & Todd, S. (1983). Ultimate tensile measurement of filled gelatin gels.
Polymer, 24, 481-486.
Sala, G., van Aken, G. A., Cohen Stuart, M. A. & van de Velde, F. (2007). Effect of droplet-
matrix interactions on large deformation properties of emulsion-filled gels. Journal of
Texture Studies, 38(4), 511-535.
Sala, G., De Wijk, R. A., van de Velde, F. & van Aken, G. A. (2008). Matrix properties affect the
sensory perception of emulsion-filled gels. Food Hydrocolloids, 22, 353-363.
Smith, J. C. (1974). Correction and extension of the van der Poel method for calculating the shear
modulus of particulate composite. Journal of Research of the National Bureau of
Standard, 78A(3), 355-361.
Smith, J. C. (1975). Simplification of the van der Poel's formula for the shear modulus of
particulate composite. Journal of Research of the National Bureau of Standard, 419-423.
Takahashi, K., Myojo, Y., Yoshida, T., Yoshimura, K. & Hattori, M. (2004). Soft and Ca-retaining
gelatin prepared by conjugating with acidic saccharides. Journal of Food Science, 69(6),
C443-C449.
van de Velde, F., Pereira, L. & Rollema, H. S. (2004). The revised chemical NMR shift data of
carrageenans. Carbohydrate Research, 339(13), 2309-2313.
van der Poel, C. (1958). On the rheology of concentrated dispersion. Rheologica Acta, 1, 198-205.
van Vliet, T. (1988). Rheological properties of filled gels. Influence of filler matrix interaction.
Colloid & Polymer Science, 266, 518-524.
van Vliet, T., Luyten, H. & Walstra, P. (1993). Time dependent fracture behaviour of food. In
Dickinson, E. & Walstra, P., Food Colloids and Polymer, Stability and Mechanical
Properties. (Vol. 113) (pp. 175-190). Cambridge: Royal Society of Chemistry.
van Vliet, T. & Walstra, P. (1995). Large deformation and fracture behaviour of gels. Faraday
Discussions, 101, 359-370.
van Vliet, T. (1999). Factors determining small-deformation behaviour of gels. In Dickinson, E. &
Rodriguez Patino, J. M., Food emulsions and foams: interfaces, interactions and stability.
(pp. 307-317). Cambridge: Royal Society of Chemistry.
van Vliet, T. (2002). On the relation between texture perception and fundamental mechanical
parameters for liquid and time dependent solids. Food Quality and Preference, 13, 227-
236.
Xiong, Y. L., Aguilera, J. M. & Kinsella, J. E. (1991a). Emulsified milkfat effects on rheology of
acid-induced milk gels. Journal of Food Science, 56(4), 920-925.
135

Chapter 5
Xiong, Y. L. & Kinsella, J. E. (1991b). Influence of fat globule-membrane composition and fat
type on the rheological properties of milk based composite gels .2. Results.
Milchwissenschaft-Milk Science International, 46(4), 207-212.
Yost, R. A. & Kinsella, J. E. (1993). Properties of acidic whey-protein gels containing emulsified
butterfat. Journal of Food Science, 58(1), 158-163.
136

G. Sala, T. van Vliet, M. A. Cohen Stuart, F. van de Velde, G.A. van Aken, Deformation and
fracture of emulsion-filled gels. 2 Effect of gelling agent concentration and oil droplet size,
submitted for publication.
Chapter 6
Deformation and fracture of emulsion-filled gels.
Effect of gelling agent concentration and oil droplet size.

Chapter 6
Abstract
The large deformation properties of gelatine, -carrageenan and whey protein isolate
(WPI) gels with varying ratio’s between the modulus of the oil droplets and that of the gel
matrix (i.e. with varying gelling agent concentration and oil droplet size) were studied as
a function of the compression speed. The effect of the gelling agent concentration and the
oil droplet size on strain-dependency of the modulus and viscoelastic properties was also
studied. An increase in the concentration of gelling agent resulted in denser gels with
more bonds between structural elements. This induced an increase of both Young’s
modulus and fracture stress for all gels. With increasing gelling agent concentration,
polymer gels (gelatine and -carrageenan) became less strain-hardening and the particle
gels (WPI) even became strain-weakening. The effect of a decrease in the oil droplet size
on the Young’s modulus was generally according to the van der Poel theory, unless when
the oil droplets were aggregated. Moreover, a decrease in oil droplet size induced a
decrease of the fracture strain in gels with non-aggregated bound droplets. The extent of
these changes was shown to depend on the gelling agent concentration. The effect of a
decrease of the oil droplet size on other fracture parameters and in other gel systems was
minor. With decreasing oil droplet size gelatine gels with unbound droplets and WPI gels
became more viscous and less elastic.
138

Effect of G’droplet/ G’matrix on large deformation properties
6.1 Introduction
In the previous chapter, we studied the effect of compression speed and oil concentration
on the large deformation properties of gelatine, -carrageenan (polymer gels) and whey
protein isolate (WPI, particle gels) emulsion-filled gels (Sala, van Vliet, Cohen Stuart, van
Aken & van de Velde, Submitted). The experimental data reported in chapter 5 in question
were obtained for systems with constant gelling agent concentration and oil droplet size,
i.e. with constant ratio between de modulus of the oil droplets and that of the gel matrix.
For emulsion-filled gels, changes in gelling agent concentration and oil droplet size
both result in variations in the ratio M (= G’f/G’m) between the modulus of the filler (G’f)
and that of the gel matrix (G’m). The effect of M on the small deformation properties of
emulsion-filled gels was discussed by van Vliet (1988) on the basis of the van der Poel
theory (van der Poel, 1958; Smith, 1974, 1975). For bound droplets, the effect of oil
volume fraction ( ) on G’ (modulus of the filled gel) is directly related to M. For droplets
stiffer than the matrix (M >1), the larger the ratio, the larger the increase of G’ with
increasing . For droplets less stiff than the matrix (M <1), the lower the ratio, the larger
the decrease of G’ with increasing . In Figure 6.1 the effect of M on
0
)'/'('
d
GGd m (6.1)
is shown as derived from the van der Poel theory. For gels with M <1, the minimum value
of is -1.67. This is also the value of G’/ G’m for gels with unbound droplets as proposed
by van Vliet (1988). Alpha increases with increasing M and for M it reaches the
asymptotic value of 2.5.
Calculations on the stress conditions under uniaxial compression in an
incompressible isotropic gel containing a dilute dispersion of spherical fillers have been
based on the theory of elasticity and on the assumption that the interactions between fillers
are negligible (Gao, Lelievre & Tang, 1995). The results indicated that the stress
concentration around the filler particles depends upon the filler-matrix interactions and on
the ratio of the shear moduli of the two system components. For rigid fillers in a soft gel,
the stress concentration factor at the interface between a filler and matrix came out at 3 for
unbound fillers and at 2.5 for bound fillers. For fillers softer than the matrix, the stress
139

Chapter 6
concentration factor equalled 1.67, independently of the interaction between filler and
matrix. The stress concentration decreased with increasing distance from the surface of the
filler and became zero at a distance corresponding to three times the radius. The results of
Gao et al. (1995) are partially in contrast with the experimental data discussed in chapter
5, where we concluded that the stress concentration effect due to the oil droplets is larger
for bound droplets than for unbound droplets.
-3
-2
-1
0
1
2
3
0 10 20 30 40 50
G'f/G'm
2.5
-1.67
Figure 6.1 – Effect of the ratio between modulus of the filler and that of the matrix on the
modulus of the filled gels at according to the van der Poel theory. G’m: storage modulus of
the gel matrix; G’f: storage modulus of the filler. The dotted line represent the maximum value for
(2.5), the dashed line the minimum (-1.67). -1.67 is also the value of for unbound droplets.
In heat-set WPI gels, a decrease of the oil droplet size at constant whey protein
concentration (i.e. an increase of the ratio between the modulus of the oil droplet and that
of the matrix) resulted in a higher compressive stress for gels containing emulsions
stabilised by WPI (i.e. bound droplets) (McClements, Monahan & Kinsella, 1993). For
gels containing emulsions stabilised by SDS, Tween 20 and Triton X-100 (i.e. unbound
droplets) no effect of the oil droplet size on compressive stress was observed.
In chapter 2 we confirmed the indications of van Vliet regarding the effect of a
variation of M on small deformation properties (Rosa, Sala, van Vliet & van de Velde,
2006). In this study the fracture stress and the fracture strain were found to be independent
of the droplet size. Compared to the study by the group of McClements (1993), the range
of oil droplet size taken into consideration in this study was smaller.
140

Effect of G’droplet/ G’matrix on large deformation properties
In heat-set soybean protein isolate gels containing oil droplets stabilised by the
same protein a decrease in oil droplet size resulted in an increase of the Young’s modulus
and the fracture stress (Kim et al., 2001). The fracture strain was not affected by either the
oil droplet size or the oil content. The oil droplets present in the gels were extensively
aggregated.
The effect of oil droplet size and gelling agent concentration on the large
deformation properties of agar gels filled with oil droplets stabilised by polyglycerolesters
of fatty acids were investigated by compression measurements (Kim, Gohtani, Matsuno &
Yamano, 1999). At all agar concentrations the presence of the oil droplets induced a
decrease of the fracture stress, which was larger for larger droplets. The presence of the oil
droplets and their size did not affect the fracture strain. The oil droplets were extensively
aggregated and microscopy observations revealed empty spaces between the gel network
and the oil droplets.
Based on the findings reported in literature, the ratio between the modulus of the oil
droplet and that of the matrix appears to have a clear effect on the large deformation and
fracture properties of emulsion-filled gels. In this chapter the effect was studied of gelling
agent concentration, oil droplet size and compression speed on the large deformation
properties and visco-elastic behaviour of emulsion-filled gels with varying droplet-matrix
interactions. The chosen systems were gelatine, -carrageenan and whey protein isolate
(WPI) gels containing emulsions made of medium-chain triglycerides oil and stabilised
with different emulsifying agents (WPI, Tween 20, lactoferrin and WPI aggregates) to
control droplet-matrix interaction.
6.2 Materials and methods
6.2.1 Materials
Porcine skin gelatine PBG 07 (bloom 280, isoelectric point 8-9) was kindly provided by
PB gelatines (Vilvoorde, Belgium). Kappa-carrageenan was kindly donated by CP Kelco
(Lille Skensved, Denmark). The -carrageenan sample consisted of 93% mol -units and
7% mol -units, as determined by NMR spectrometry (van de Velde, Pereira & Rollema,
2004). Powdered whey protein isolate (WPI, BiproTM
) was obtained from Davisco
International Inc. (La Sueur, MN, USA). Tween 20 (Polyoxyethylene sorbitan
141

Chapter 6
monolaurate, in the text referred to as Tween) was obtained from Sigma (Sigma-Aldrich
Chemie BV, Zwijndrecht, The Netherlands). Lactoferrin were kindly donated by DMV
International (Veghel, The Netherlands). Medium Chain Triglycerides (MCT) MIGLYOL
812N oil was purchased from Internatio BN (Mechelen, Belgium). Potassium chloride
(p.a.) was obtained from Merck (Darmstadt, Germany). Glucono- -lactone (GDL) was
kindly donated by Purac (Gorinchem, The Netherlands). All materials were used without
further purification. All solutions were prepared with demineralised water.
6.2.2 Sample preparation
6.2.2.1 Emulsions
Emulsions stabilised with different emulsifying agents were used for gel preparation in
order to vary the interactions between oil droplet and gel matrix. The procedures for the
preparation of the emulsions have been described before (Sala et al., Submitted). In the
present study the oil droplet size of the emulsions was varied. The emulsions prepared
with each emulsifying agent were homogenised at different pressures in order to obtain the
desired droplet size. The droplet size distribution of the emulsions was measured using a
Malvern Mastersizer 2000 (Malvern Instruments Ltd., Malvern, UK). The droplet volume-
surface average or Sauter diameter (d3,2) and other characteristics of the emulsions used
for the preparation of the filled gels are reported in Table 6.1.
142

Effect of G’droplet/ G’matrix on large deformation properties
Table 6.1 – Volume-surface average diameter (Sauter diameter) and pH of the emulsions used for
the preparation of the filled gels.
Emulsifying agent d3,2
( m)
G’ droplet
(kPa)
Ey droplet
(kPa) pH
1 wt% WPI 4.25 19 56 7.70
1.10 73 218 7.44
0.45 178 533 7.80
3 wt% WPI aggregates 4.90 16 49 7.50
2.55 31 94 7.58
0.40 200 600 7.70
2 wt% Lactoferrin 3.75 21 64 5.36
1.35 59 178 5.32
2 wt% Tween 5.15 4 12 4.24
0.90 22 67 4.24
0.45 44 133 4.18
The G’of the droplet was calculated by G’=4 /d (van Vliet, 1988) whereby the surface tension was taken to
be 20 mN/m for protein stabilised droplets and 5 mN/m for Tween stabilised droplets. The Young’s modulus
(E ) was E = 3G’. y y
6.2.2.2 Gels
Gelatine (4, 6, 8, 10 wt%) and WPI (3, 5, 7, 9 wt%) gels were prepared in demineralised
water. Kappa-carrageenan (0.6, 1.0 1.4, 1.8 wt%) gels were prepared in a 30 mM KCl
solution. Samples of filled gels were prepared at two different gelling agent concentrations
per gel type (4 and 10 wt% for gelatine, 3 and 6.75 wt% for WPI, 0.6 and 1.8 wt% for -
carrageenan) with of 0.21, corresponding to an oil concentration of 20 wt%. The
procedures for the preparation of the gels have been described before in detail (Sala et al.,
Submitted). In Table 6.2 the ratio’s between the Young’s modulus of the oil droplets and
that of the gel matrix are reported for all combinations studied.
143

Chapter 6
Table 6.2 – Ratio Ef/Em for the different combinations between emulsions and matrices.
Emulsifying agent
1 wt% WPI 3 wt% WPI
aggregates
2 wt%
Lactoferrin
2 wt% Tween
d3,2 ( m)
Gel matrix 4.25 1.10 0.45 4.90 2.55 0.40 3.75 1.35 5.15 0.90 0.45
Gelatine
4 wt% (5 kPa) 11 44 107 - - - - - 2.3 13 27
10 wt% (25 kPa) 2.3 8.7 21 - - - - - 0.5 2.7 5.3
-carrageenan
0.6 wt% (6.5 kPa) 8.7 34 82 - - - 10 27 - - -
1.8 wt% (88 kPa) 0.6 2.5 6.1 - - - 0.7 2.0 - - -
WPI
3 wt% (6 kPa) - - - 8.2 16 100 - - - - -
6.7 wt% (40 kPa) - - - 1.2 2.4 15 - - - - -
-: combination not studied
The large deformation properties of the gels were determined by uniaxial
compression between two flat lubricated plates using different constant deformation
speeds. True stress and true strain were calculated as follows:
H
H H
HdH
HH
00
ln1
(6.2)
A
Ft (6.3)
For an extensive description of the method we refer to Sala et al. (Submitted). The effect
of gelling agent concentration and oil droplet size on strain-hardening behaviour was
studied by superimposing the fracture vs. strain curves of gels for which these parameters
were varied and observing possible changes in the slope of the curves. The curves were
superimposed by dividing the stress along the stress vs. strain curve by the Young’s
modulus. The obtained stress is dimensionless and was called normalised stress. The
microstructure of the samples was studied by Confocal Laser Scanning Microscopy
(CLSM) as described in chapter 5. Coalescence phenomena occurring after mixing the
emulsions with the gelling agents solutions were studied by analysing the CLSM images
144

Effect of G’droplet/ G’matrix on large deformation properties
of the gels (image size of 39.7 x 39.7 m). The diameter of the droplets present in one
image was visually estimated. The obtained estimate of the size distribution of the oil
droplets present in the gel was compared to the droplet size distribution of the emulsion.
Furthermore, CLSM images of different gels containing the same emulsion were
compared and increases of the diameter related to coalescence were visually estimated.
6.3 Results
6.3.1 Effect of gelling agent concentration in gels without oil droplet
For all gels, an increase in the gelling agent concentration induced an increase in both the
Young’s modulus and the fracture stress (Figure 6.2). For WPI gels, also the fracture
strain increased with increasing gelling agent concentration, while for polymer gels the
effect of the gelling agent concentration on this parameter was minor. The effect of
compression speed on the Young’s modulus and fracture properties has been discussed
before (Sala et al., Submitted). The compression speed remarkably affected the fracture
properties of both gelatine and -carrageenan gels. This effect of speed increased with
increasing gelling agent concentration (Figures 6.2.1B and 2.2B). For WPI gels the
dependency of the fracture stress on compression speed increased also with increasing
gelling agent concentration, while the effect of the compression speed on the fracture
strain was not affected by the concentration (Figure 6.2.3B).
With increasing gelling agent concentration, polymer gels became less strain-
hardening (Figures 6.3.1 and 6.3.2). For -carrageenan gels, at the highest concentration
tested (1.8 wt%) the stress increased almost linearly with strain, i.e. at the mentioned
concentration the gels were not strain-hardening. With increasing gelling agent
concentration WPI gels became strain-weakening at intermediate strains (Figure 6.3.3).
For all gels, the effect of gelling agent concentration on strain-hardening was not affected
by the compression speed (results not shown).
145

Chapter 6
0
Figure 6.2 - Effect of compression speed on Young’s modulus (A) and fracture points (B) of
gelatine (1), -carrageenan (2) and WPI (3) gels at different concentrations. The concentrations of
the different gels are reported in the ‘Methods’ section.
10
20
30
0.0 1.0 2.0 3.0 4.0 5.0
Compression speed (mm/ s)
Mo
du
lus (
kP
a)
1A
Conc.
0
20
40
60
80
100
120
0.0 0.5 1.0 1.5 2.0
Fracture strain
Fractu
re s
tress (
kP
a)
Conc.
Speed
1B
0
100
0.0 1.0 2.0 3.0 4.0 5.0
Compression speed (mm/ s)
Mo
du
lus (
kP
a) Conc.
10
20
30
40
50
60
70
80
90
2A0
20
40
60
80
100
120
0.0 0.5 1.0 1.5 2.0
Fracture strain
Fractu
re s
tress (
kP
a)
Speed
Conc.
2B
0
100
0.0 1.0 2.0 3.0 4.0 5.0
Compression speed (mm/ s)
Mo
du
lus (
kP
a)
10
20
30
40
50
60
70
80
90
Conc.
3A0
20
40
60
80
100
120
0.0 0.5 1.0 1.5 2.0
Fracture strain
Fractu
re s
tress (
kP
a)
Speed
Conc.
2B
0
0.0 1.0 2.0 3.0 4.0 5.0
Compression speed (mm/ s)
Mo
du
lus (
kP
a)
1A
Conc.
30
0
20
40
60
80
100
120
0.0 0.5 1.0 1.5 2.0
Fracture strain
Fractu
re s
tress (
kP
a)
20
Conc.
Speed
1B
10
0
100
0.0 1.0 2.0 3.0 4.0 5.0
Compression speed (mm/ s)
Mo
du
lus (
kP
a) Conc.
0
20
40
60
80
100
120
0.0 0.5 1.0 1.5 2.0
Fracture strain
Fractu
re s
tress (
kP
a)
90
80
70
60Speed
Conc.
2B
50
40
30
20
102A
0
100
0.0 1.0 2.0 3.0 4.0 5.0
Compression speed (mm/ s)
Mo
du
lus (
kP
a)
0
20
40
60
80
100
120
0.0 0.5 1.0 1.5 2.0
Fracture strain
Fractu
re s
tress (
kP
a)
90
80
70
60
Conc.
3A
50
40
30
Speed
Conc.
2B
20
10
146

Effect of G’droplet/ G’matrix on large deformation properties
0
1
2
3
4
5
6
0 0.5 1 1.5 2
True strain
No
rm
ali
sed
str
ess
0
0.4
0.8
1.2
1.6
2
0 0.5 1 1.5 2
True strain
No
rm
ali
se
d s
tre
ss
0
0.4
0.8
1.2
1.6
2
0 0.5 1 1.5 2
True strain
No
rm
ali
sed
str
ess
Conc.
Conc.Conc.
1
3
20
1
2
3
4
5
6
0 0.5 1 1.5 2
True strain
No
rm
ali
sed
str
ess
0
0.4
0.8
1.2
1.6
2
0 0.5 1 1.5 2
True strain
No
rm
ali
se
d s
tre
ss
0
0.4
0.8
1.2
1.6
2
0 0.5 1 1.5 2
True strain
No
rm
ali
sed
str
ess
Conc.
Conc.Conc.
1
3
2
Figure 6.3- Effect of gelling agent concentration on the slope of the stress vs. strain curve for
different gels. (1: gelatine; 2: -carrageenan; 3: WPI) at a compression speed of 1 mm/s.
The recoverable energy slightly increased with increasing gelling agent concentration for
WPI gels, and decreased for -carrageenan gels (Figure 6.4). For these gels, the
recoverable energy was not affected by the compression speed. For gelatine gels, the
recoverable energy was not affected by the gelling agent concentration at low compression
speed, and slightly increased at high compression speed (Figure 6.4). In Table 6.3 the
effects of the gelling agent concentration on large deformation and fracture properties are
summarised. Table 6.4 shows the effects of compression speed on the large deformation
and fracture properties of gels with different gelling agent concentrations.
147

Chapter 6
B
0
20
40
60
80
100
120
0 2 4 6 8 10 12
Gelling agent concentration (wt%)
RE
(%
0
20
40
60
80
100
120
0 2 4 6 8 10 12
Gelling agent concentration (wt%)
RE
(%
)
Figure 6.4 - Effect of gelling agent concentration on recoverable energy for different gels: :
gelatine; : -carrageenan; : WPI. (A): compression speed 1 mm/s. (B): compression speed 4
mm/s.
Table 6.3 – Summary of the results obtained for gels without emulsion droplets with respect to the
gelling agent concentration.
Type of gel Gelling agent concentration
f f Ey Ef( f) RE
Gelatine +++ ++ +++ --- +
-carrageenan +++ + +++ --- ---
+++ +++ +++ --- + WPI
f: fracture stress; f: fracture strain; Ey: Young’s modulus. Ef( f): modulus as a function of strain. +
denotes an increase of the parameter with gelling agent concentration. - indicates a decrease of the
parameter. More + or – correspond to a stronger effect. 0: no effect.
)
A B
B
0
20
40
60
80
100
120
0 2 4 6 8 10 12
Gelling agent concentration (wt%)
RE
(%
0
20
40
60
80
100
120
0 2 4 6 8 10 12
Gelling agent concentration (wt%)
RE
(%
))
A B
148

Effect of G’droplet/ G’matrix on large deformation properties
Table 6.4 – Summary of the results obtained for gels without emulsion droplets with respect to the
compression speed.
Type of gel Compression speed
f f Ey Ef( f) RE
latine +++ +++ 0 0 0Ge
-carrageenan +++ ++ 0 0 0
I +++ 0 +++ 0 0WP
f: fracture stress; f: fracture strain; Ey: Young’s modulus. Ef( f): modulus as a function of strain. +
denotes an increase of the parameter with speed. More + correspond to a stronger effect. 0: no effect.
6.3.2 Effect of oil droplet size in gels with different gelling agent concentrations
Variations in the oil droplet size did not remarkably affect the aggregation of the oil
droplets embedded in the gel matrix as described in chapters 3 and 5 (Sala, van Aken,
Cohen Stuart & van de Velde, 2007; Sala et al., Submitted). In gelatine and WPI gels, the
oil droplets were not aggregated, irrespective of the emulsifying agent used for emulsion
preparation. In contrast, in -carrageenan gels both the emulsions stabilised by WPI and
those stabilised by lactoferrin were strongly aggregated. A comparison between the CLSM
micrographs of gelatine and -carrageenan gels containing the same emulsions stabilised
by WPI (Figures 6.5A and 6.5B) and with a Sauter diameter of 0.45 m revealed
extensive coalescence in the -carrageenan gels in addition to aggregation. This
phenomenon was not as evident at larger droplet size and for emulsions stabilised by
lactoferrin (results not shown). Furthermore, it was not observed when studying the effect
of on the large deformation properties of the same gels at constant oil droplet size (d3,2
about 1 m) (Sala et al., Submitted). Nevertheless, some coalescence of the oil droplets
embedded in -carrageenan probably occurred also at larger droplet size and for emulsions
stabilised by lactoferrin. Coalescence in -carrageenan gels was related to the aggregation
occurring in the emulsions used for the preparation of the -carrageenan upon addition of
KCl. KCl addition was needed to adjust the salt concentration to that of the -carrageenan
solutions. As a result of coalescence, the diameter of oil droplets embedded in -
carrageenan gels was about a factor 2-4 larger than the Sauter diameter measured after
preparation of the emulsions. The ratio’s between the modulus of the droplet and that of
149

Chapter 6
the gel matrix were consequently smaller than those calculated with the original Sauter
diameter of the emulsions. Rough estimates of these ratios taking into account the
coalescence of the oil droplets are reported in Table 6.5.
A B
Figure 6.5 - CLSM images of a gelatin gel (A) and a -carrageenan gel (B) containing a WPI-
stabilised emulsion with an oil droplets size of 0.45 m ( : 0.21; image size 159 X 159 m).
Table 6.5 – Ratio Ef/Em for the different combinations of emulsions and -carrageenan gels after
correction for oil droplet coalescence.
Emulsifying agent
1 wt% WPI 2 wt% Lactoferrin
d3,2 ( m)
8.5-17 2.2-4.4 0.9-1.8 7.5-15 2.7-5.4
0.6 wt% (6.5 kPa) 4.3-2.2 16.8-8.4 41-20.5 4.9-2.5
1.8 wt% (88 kPa) 0.3-0.2 1.2-0.6 3-1.5 0.4-0.2
21.7-10.9
1.6-0.8
The effect of oil droplet size variations depended on droplet-matrix interactions,
the microstructure of the gels and M. For non-aggregated bound droplets, like in gelatine
gels with WPI-stabilised emulsions (Figure 6.6) and in WPI gels (Figure 6.10), a decrease
of the droplet size induced an increase of the Young’s modulus and a decrease of the
150

Effect of G’droplet/ G’matrix on large deformation properties
fracture strain. In agreement with the van der Poel theory, this increase was larger for
larger M. For both types of gels, the fracture stress was not affected by a decrease of the
oil droplet size. For gelatine gels, the effect on fracture strain was larger at low gelling
agent concentration. For WPI gels, this effect was larger at the higher gelling agent
concentration.
For gels with bound and aggregated oil droplets ( -carrageenan gels with
lactoferrin-stabilised emulsions), an effect of a decrease in the oil droplet size was
observed at low gelling agent concentration (Figure 6.8.1A). At low gelling agent
concentration the Young’s modulus of the gels increased with decreasing droplet size,
while fracture stress and fracture strain slightly increased. At high gelling agent
concentration M was about 1 or smaller (Table 6.5). Due to aggregation, the presence of
oil droplets in -carrageenan gels with high gelling agent concentration caused a decrease
in the gel modulus. Probably, the highly deformable droplet aggregates rather than the
individual droplets act as the filler particles here, effectively lowering the value of M
(Figure 6.8.2A). For gels with unbound droplets (gelatine gels with Tween-stabilised
emulsions and -carrageenan gels with WPI-stabilised emulsions) variations in the droplet
size had no effect on either the Young’s modulus or the fracture behaviour (Figures 6.7
and 6.9). For these gels, M is always much smaller than 1, independently of the oil droplet
size. For -carrageenan gels this can also be ascribed to the aggregation and coalescence
of the oil droplets.
For gels with non-aggregated bound droplets, the effect of a reduction of the oil
droplets on fracture properties resembled that observed with increasing (Sala et al.,
Submitted). In order to confirm whether in these gels a reduction in oil droplet size could
mimic an increase in , these parameters were varied at the same time in gelatine gels with
a gelling agent concentration of 4 wt% (Figure 6.11). Samples with = 0.21 and
containing an emulsion with d3,2= 3.1 µm showed comparable Young’s modulus and
fracture properties as samples with = 0.11 and containing an emulsion with d3,2= 0.45
µm.
151

Chapter 6
0
2
4
6
8
10
0.0 1.0 2.0 3.0 4.0 5.0
Compression speed (mm/ s)
Mo
du
lus (
kP
a)
0
5
10
15
20
25
0.0 0.5 1.0 1.5 2.0
Fracture strain
Fractu
re s
tress (
kP
a)
0
5
10
15
20
25
30
35
40
45
50
55
60
0.0 1.0 2.0 3.0 4.0 5.0
Compression speed (mm/ s)
Mo
du
lus (
kP
a)
0
20
40
60
80
100
120
0.0 0.5 1.0 1.5 2.0
Fracture strain
Fractu
re s
tress (
kP
a)
Speed
Speed
Lower diam.
Lower diam.
Lower diam.
2B2A
1B1A0
2
4
6
8
10
0.0 1.0 2.0 3.0 4.0 5.0
Compression speed (mm/ s)
Mo
du
lus (
kP
a)
0
5
10
15
20
25
0.0 0.5 1.0 1.5 2.0
Fracture strain
Fractu
re s
tress (
kP
a)
0
5
10
15
20
25
30
35
40
45
50
55
60
0.0 1.0 2.0 3.0 4.0 5.0
Compression speed (mm/ s)
Mo
du
lus (
kP
a)
0
20
40
60
80
100
120
0.0 0.5 1.0 1.5 2.0
Fracture strain
Fractu
re s
tress (
kP
a)
Speed
Speed
Lower diam.
Lower diam.
Lower diam.
2B2A
1B1A
Figure 6.6 – Gelatine bound: effect of compression speed and oil droplet size on Young’s
modulus (A) and fracture points (B) of gelatine gels with 4 wt% (1) and 10 wt% (2) gelatine ( :
no oil; 4.22 µm : 1.09 µm; : 0.47 µm).
152

Effect of G’droplet/ G’matrix on large deformation properties
0
5
10
15
20
25
0.0 0.5 1.0 1.5 2.0
Fracture strain
Fractu
re s
tress (
kP
a)
Figure 6.7 – Gelatine unbound: effect of compression speed and oil droplet size on Young’s
modulus (A) and fracture points (B) of gelatine gels with 4 wt% (1) and 10 wt% (2) gelatine ( :
no oil; 5.12 µm : 0.90 µm; : 0.45 µm).
0
2
4
6
8
10
0.0 1.0 2.0 3.0 4.0 5.0
Compression speed (mm/ s)
Mo
du
lus (
kP
a)
0
5
10
15
20
25
30
35
40
45
50
55
60
0.0 1.0 2.0 3.0 4.0 5.0
Compression speed (mm/ s)
Mo
du
lus (
kP
a)
0
20
40
60
80
100
120
0.0 0.5 1.0 1.5 2.0
Fracture strain
Fractu
re s
tress (
kP
a)
2A 2B
1B1A
Speed
Speed
0
5
10
15
20
25
0.0 0.5 1.0 1.5 2.0
Fracture strain
Fractu
re s
tress (
kP
a)
0
2
4
6
8
10
0.0 1.0 2.0 3.0 4.0 5.0
Compression speed (mm/ s)
Mo
du
lus (
kP
a)
0
5
10
15
20
25
30
35
40
45
50
55
60
0.0 1.0 2.0 3.0 4.0 5.0
Compression speed (mm/ s)
Mo
du
lus (
kP
a)
0
20
40
60
80
100
120
0.0 0.5 1.0 1.5 2.0
Fracture strain
Fractu
re s
tress (
kP
a)
2A 2B
1B1A
Speed
Speed
153

Chapter 6
0
2
4
6
8
10
12
14
16
18
20
0.0 1.0 2.0 3.0 4.0 5.0
Compression speed (mm/ s)
Mo
du
lus (
kP
a)
0
5
10
15
20
25
0.0 0.5 1.0 1.5 2.0
Fracture strain
Fractu
re s
tress (
kP
a)
0
10
20
30
40
50
60
70
80
90
Figure 6.8 – Kappa-carrageenan bound: effect of compression speed and oil droplet size on
Young’s modulus (A) and fracture points (B) of -carrageenan gels with 0.6 wt% (1) and 1.8 wt%
(2) -carrageenan ( : no oil; 3.17 µm : 1.32 µm).
100
0.0 1.0 2.0 3.0 4.0 5.0
Compression speed (mm/ s)
Mo
du
lus (
kP
a)
0
10
20
30
40
50
60
70
80
90
100
110
120
0.0 0.5 1.0 1.5 2.0
Fracture strain
Fractu
re s
tress (
kP
a)
Lower diam.
2B2A
1B1A
Speed
Speed
0
5
10
15
20
25
0.0 0.5 1.0 1.5 2.0
Fracture strain
Fractu
re s
tress (
kP
a)
0
2
4
6
8
10
12
14
16
18
20
0.0 1.0 2.0 3.0 4.0 5.0
Compression speed (mm/ s)
Mo
du
lus (
kP
a)
0
10
20
30
40
50
60
70
80
90
0
0.0 1.0 2.0 3.0 4.0 5.0
Compression speed (mm/ s)
Mo
du
lus (
kP
a)
10
0
10
20
30
40
50
60
70
80
90
100
110
120
0.0 0.5 1.0 1.5 2.0
Fracture strain
Fractu
re s
tress (
kP
a)
Lower diam.
2B2A
1B1A
Speed
Speed
154

Effect of G’droplet/ G’matrix on large deformation properties
0
2
4
6
8
10
0.0 1.0 2.0 3.0 4.0 5.0
Compression speed (mm/ s)
Mo
du
lus (
kP
a)
0
5
10
15
20
25
0.0 0.5 1.0 1.5 2.0
Fracture strain
Fractu
re s
tress (
kP
a)
0
10
20
30
40
50
60
70
80
90
100
0.0 1.0 2.0 3.0 4.0 5.0
Compression speed (mm/ s)
Mo
du
lus (
kP
a)
2A
1A
0
10
20
30
40
50
60
70
80
90
100
110
120
0.0 0.5 1.0 1.5 2.0
Fracture strain
Fractu
re s
tress (
kP
a)
Speed
Speed
2B
1B0
2
4
6
8
10
0.0 1.0 2.0 3.0 4.0 5.0
Compression speed (mm/ s)
Mo
du
lus (
kP
a)
0
5
10
15
20
25
0.0 0.5 1.0 1.5 2.0
Fracture strain
Fractu
re s
tress (
kP
a)
0
10
20
30
40
50
60
70
80
90
100
0.0 1.0 2.0 3.0 4.0 5.0
Compression speed (mm/ s)
Mo
du
lus (
kP
a)
2A
1A
0
10
20
30
40
50
60
70
80
90
100
110
120
0.0 0.5 1.0 1.5 2.0
Fracture strain
Fractu
re s
tress (
kP
a)
Speed
Speed
2B
1B
Figure 6.9 - Kappa-carrageenan unbound: effect of compression speed and oil droplet size on
Young’s modulus (A) and fracture points (B) of -carrageenan gels with 0.6 wt% (1) and 1.8 wt%
(2) -carrageenan ( : no oil; 4.22 µm : 1.09 µm; : 0.47 µm).
155

Chapter 6
0
2
4
6
8
10
12
0.0 1.0 2.0 3.0 4.0 5.0
Compression speed (mm/ s)
Mo
du
lus (
kP
a)
0
5
10
15
20
25
0.0 0.5 1.0 1.5 2.0
Fracture strain
Fractu
re s
tress (
kP
a)
0
10
20
30
40
50
60
0.0 1.0 2.0 3.0 4.0 5.0
Compression speed (mm/ s)
Mo
du
lus (
kP
a)
1A
2A
Speed
Lower diam.
Lower diam.
0
5
10
15
20
25
30
35
40
45
50
0.0 0.5 1.0 1.5 2.0
Fracture strain
Fractu
re s
tress (
kP
a)
2B
1B
Lower diam.
Speed
0
2
4
6
8
10
12
0.0 1.0 2.0 3.0 4.0 5.0
Compression speed (mm/ s)
Mo
du
lus (
kP
a)
0
5
10
15
20
25
0.0 0.5 1.0 1.5 2.0
Fracture strain
Fractu
re s
tress (
kP
a)
0
10
20
30
40
50
60
0.0 1.0 2.0 3.0 4.0 5.0
Compression speed (mm/ s)
Mo
du
lus (
kP
a)
1A
2A
Speed
Lower diam.
Lower diam.
0
5
10
15
20
25
30
35
40
45
50
0.0 0.5 1.0 1.5 2.0
Fracture strain
Fractu
re s
tress (
kP
a)
2B
1B
Lower diam.
Speed
Figure 6.10 – WPI bound: effect of compression speed and oil droplet size on Young’s modulus
(A) and fracture points (B) of WPI gels with 3.0 wt% (1) and 6.75 wt% WPI ( : no oil; 4.88
µm : 2.52 µm; : 0.39 µm).
156

Effect of G’droplet/ G’matrix on large deformation properties
0
2
4
6
8
0
5
10
15
20
25
0.0 0.5 1.0 1.5 2.0
Fracture strain (mm/mm)
Fractu
re s
tress (
kP
a)
12
10
0.0 1.0 2.0 3.0 4.0 5.0
Compression speed (mm/ s)
Mo
du
lus (
kP
a)
Speed
Figure 6.11 – Gelatine bound: Young’s modulus vs. compression speed (A) and fracture points
(B) of gelatine gels with 4 wt% gelatine and different amounts of WPI-stabilised emulsions with
different droplet size ( : no oil; : : 0.21; d3,2: 3.1 µm; : : 0.11; d3,2: 0.41 µm; : : 0.21;
d3,2: 0.41 µm).
At the compression speeds tested, the oil droplet size did not significantly affect the strain-
hardening behaviour of the gels (results not shown). As expected on the basis of the
results presented for the effect of the gelling agent concentration (Figure 6.3), the
emulsion-filled gels with higher gelling agent concentration were less strain-hardening.
The effect of the oil droplet size on the recoverable energy varied in the different
gel systems (Table 6.6). For gelatine gels with bound droplets the recoverable energy
slightly increased with decreasing oil droplet size, whereas it strongly decreased in gels
with unbound droplets. For -carrageenan gels the recoverable energy increased with a
decrease of the oil droplet size for both bound and unbound droplets. For WPI gels this
parameter decreased with decreasing oil droplet size. In Table 6.7 an overview is given of the
effects of the oil droplet size on the large deformation behaviour of the emulsion-filled gels.
157

Chapter 6
Table 6.6 – Effect of droplet size on recoverable energy for the different combinations between
emulsions and matrices (compression speed: 4 mm/s).
Emulsifying agent
1 wt% WPI 3 wt% WPI
aggregates
2 wt%
Lactoferrin
2 wt% Tween
RE (%)
Gel matrix
4.25 1.10 0.45 4.90 2.55 0.40 3.75 1.35 5.15 0.90 0.45
Gelatine
4 wt% (5 kPa) 89 90 92 - - - - - 82 66 56
10 wt% (25 kPa) 92 93 93 - - - - - 96 90 89
-carrageenan
0.6 wt% (6.5 kPa) 55 54 59 - - - 56 58 - - -
1.8 wt% (88 kPa) 49 49 55 - - - 48 51 - - -
WPI
3 wt% (6 kPa) - - - 48 43 38 - - - - -
6.7 wt% (40 kPa) - - - 56 52 45 - - - - -
-: combination not studied; in brackets the Young’s modulus of the gels is reported.
Table 6.7 – Summary of the results obtained for filled gels with respect to the oil droplet size.
Type of gel Decreasing droplet size
f f Ey Ef( f) RE
tine bound
Gela
4 wt% 0 --- +++ 0 ++
10 wt% + - +++ 0 ++
Gelatine unbound
4 wt% 0 0 0 0 --
10 wt% 0 0 + 0 --
-carrageenan bound
0.6 wt% ++ 0 +++ 0 ++
1.8 wt% + 0 0 0 ++
-carrageenan unbound
0.6 wt% + 0 -- 0 ++
1.8 wt% 0 0 0 0 ++
WPI bound
3 wt% 0 0 + 0 --
6.7 wt% ++ -- ++ 0 --
f: fracture stress; f: fracture strain; Ey: Young’s modulus. Ef( f): modulus as a function of strain. +
denotes an increase of the parameter with decreasing oil droplet size. - indicates a decrease of the
parameter. More + or – correspond to a stronger effect. 0: no effect.
158

Effect of G’droplet/ G’matrix on large deformation properties
6.4 Discussion
The effect of compression speed and presence of oil droplets in the gel matrix on large
deformation properties was extensively discussed in chapter 5 (Sala et al., Submitted). In
the current chapter we focus our discussion on the effects of gelling agent concentration
and oil droplet size, i.e. on the effect of the ratio between the modulus of the filler and that
of the matrix.
An increase in gelling agent concentration results in denser gels, with more
structural elements and more bonds between them. This can explain the increase in
Young’s modulus and fracture stress observed for all gels (Table 6.3). In chapter 5 (Sala et
al., Submitted), we ascribed part of the effect of the compression speed on the fracture
parameters of the gels to friction between structural elements of the gel network. The
effect of compression speed on fracture parameters with increasing gelling agent
concentration observed in the present work (Table 6.4) can be primarily related to
increased friction phenomena. For gelatine gels, an increase in gelling agent concentration
will also correspond to a higher density of physical bonds. Upon compression it will then
take longer to unzip these bonds in order to fracture the gel. This will result in a higher
fracture stress and strain for higher compression speed. A higher density of bonds in gels
with a higher gelling agent concentration will also decrease the extensibility of the
polymer chains in polymer gels and of the randomly oriented backbones in particle gels.
Furthermore, a higher density of bonds in the gel network will reduce strain-induced
crystallisation. This can explain the decrease of the strain-hardening behaviour observed
for all gels with increasing gelling agent concentration. For WPI gels the strain-weakening
behaviour observed with increasing WPI concentration (i.e. with increasing gel modulus)
is in accordance with the findings reported by other authors (Pouzot, Nicolai, Benyahia &
Durand, 2006). From the results obtained for the recoverable energy (Figure 6.4), we infer
that an increase in the gelling agent concentration appears to result for gelatine and WPI
gels in a relatively more elastic behaviour and for -carrageenan gels in a relatively more
viscous behaviour at the applied strains (0.25). The effect observed for gelatine and WPI
gels can be readily explained by the shorter length regions over which bonds between
different polymer chains interact. A more viscous character of -carrageenan gels with
increasing gelling agent concentration was observed by other authors in the linear region
as an increase of the tan (Bayarri, Duran & Costell, 2004).
159

Chapter 6
For gels with non-aggregated bound oil droplets, the effect of a decrease in the oil
droplet size on the Young’s modulus of the filled gels can be explained on the basis of the
van der Poel theory (Table 6.8). In these systems, a decrease of the oil droplet size
corresponds to a stiffening of the droplets and, therefore, results in larger increases of the
Young’s modulus as compared to gels with larger droplets and the same . The absence of
a clear effect of oil droplet size variations on the Young’s modulus of gels with unbound
droplets supports the approximation by van Vliet (1988) of setting the effective modulus
of unbound oil droplets to zero, independently of the size of the droplets. For gels with
aggregated bound droplets and at nominal M>1 the effect of oil droplet aggregation can be
twofold. The aggregation of the oil droplets can cause an increase of the effective volume
of the fillers, resulting in an increase of the Young’s modulus of the filled gels. When the
modulus of the aggregates is lower than the Young’s modulus of the gel matrix, the
effective M is <1 and the effect of oil droplet aggregation can be a decrease of the
Young’s modulus of the filled gels (Sala et al., 2007). These two effects will undoubtedly
depend on the extent of aggregation, but the combined effect is hard to predict.
Table 6.8 – Summary of the mechanisms explaining the effect of the oil droplet size on fracture
properties and Young’s modulus.
Type of gel f fEy
Gelatine bound B1, F1(*) B1 F1
Gelatine unbound B2, F2(**) B2 F2
-carrageenan bound B1, F1 B1 F1
-carrageenan unbound B2, D, F2(**) B2, D F2
WPI bound F1, C, (B1) C, B1 F1
f: fracture stress; f: fracture strain; Ey: Young’s modulus. B: stress concentration; C: induced viscous
flow of the matrix; D: friction between structural elements; F: van der Poel theory; 1 refers to the
phenomena occurring in gels with bound droplets; 2 refers to phenomena occurring in gels with unbound
droplets.*: gives higher f at higher compression speed. **: gives lower f at higher compression speed.
According to the theory developed by Gao et al. (1995), unbound stiff fillers in a
soft gel are expected to induce a larger stress concentration as compared to bound or less
stiff fillers. Stress concentration would cause the gels to break at lower fracture strain.
Gels containing unbound particles stiffer than the matrix (M >> 1) are therefore expected
to break at lower strain. This was not observed in our study. No significant difference was
observed in the fracture strain between bound and unbound droplets. In the first part of
160

Effect of G’droplet/ G’matrix on large deformation properties
this study (Sala et al., Submitted) we even showed that bound droplets are more effective
than unbound droplets in decreasing the fracture strains of filled gels. Furthermore, the
experimental results obtained for gelatine and WPI gels (i.e. gels in which the oil droplets
were not aggregated) show that only for gelatine gels with bound droplets the oil droplets
are more effective in decreasing the fracture strain in gels at a higher M (compare Figures
6.7.1B with 6.7.2B, 6.8.1B with 6.8.2B and 6.11.1B with 6.11.2B). For WPI gels, the oil
droplets were more effective in decreasing the fracture strain in gels with higher gelling
agent concentration, i.e. at lower M (Table 6.2; compare Figures 6.11.1B with 6.11.2B).
To study the effect of the stiffness of the oil droplets on stress concentration phenomena, a
comparison between gels containing emulsions with different droplet size presents a
substantial problem. A decrease of the oil droplet size corresponds in all gels to a
remarkable increase in the number of filler particles and to a decreasing distance between
droplets. As a consequence, more interference occurs between stress concentration
regions. The applicability of the theory Gao et al. (1995) to real gels systems is impaired
by several limitations. The assumption made in this theory that there is no filler-filler
interaction is valid only at very low filler concentrations. According to Gao et al., the
stress concentration decreases with increasing distance from the surface of the filler and
becomes zero at a distance corresponding to three times the radius. Already in gels with a
of 0.05 the distance between neighbouring droplets is smaller than three times the
radius. This would result in an overlap of the regions where there is stress concentration
coming from different droplets. Furthermore, Gao et al. assumed the absence of frictional
stress on the interface between unbound droplets and gel matrix. As shown in chapter 5,
for gels containing unbound droplets friction phenomena are extremely relevant at large
deformations. Friction (and therefore frictional stress) between the different structural
components of filled gels (i.e. also between unbound fillers and gel matrix) increases with
increasing deformation speed. The assumption of the absence of frictional stress on the
interface between unbound droplets and gel matrix would limit the validity of the theory
of Gao et al. to (extremely) low compression speeds.
The decrease of the oil droplet size in gels with a certain gelling concentration
corresponds to the stiffening of the droplets and to an increase of their amount. Decreasing
the oil droplet diameter by a factor 10 roughly corresponds to an increase of the droplet
modulus by the same factor (Table 6.1). At the same time, the number of droplets
increases by a factor 1000. The van der Poel theory considers only the stiffness and of
161

Chapter 6
the fillers for the prediction of their effect on the modulus of the filled gel (van der Poel,
1958; Smith, 1974, 1975). However, this theory holds in principle only for small
deformations. For large deformations, the filler particles should also be considered as
defects in the gel matrix which lead to local stress concentration. The stresses near the
filler interface may become larger than the strength of the bonds in the gel matrix at
smaller deformation. Therefore, the filler particles may act as crack initiators. In this case,
the number and the size of filler particles are likely to be important parameters. The size
will be primarily important in the sense that this must be larger than the inherent defect
length of the gel matrix. For gels with bound non aggregated droplets, a decrease of the
droplet size and the related increase in number of droplets has the same effect on Young’s
modulus and fracture strain as observed for an increase in (Figure 6.12; Sala et al.,
Submitted). For unbound and for aggregated droplets, the increase in the stiffness and the
number of droplets as a result of a decrease in oil droplet size does not appear to affect the
fracture behaviour of the gels. This supports the observation that unbound droplets are less
effective stress concentrating nuclei than bound droplets (Sala et al., Submitted). For
gelatine gels with unbound droplets a decrease in oil droplet size and the related increase
in the number of droplets results in a remarkable increase of the energy dissipated by
friction, as shown by the observed decrease in recoverable energy (Table 6.6). In other
words, gelatine gels with small unbound droplets show at large deformation a relatively
more viscous character. The same observation holds for WPI gels. Similar effects
regarding the recoverable energy were observed for both gels as a result of an increase in
. The absence of an effect of the stiffness and the number of droplets on the fracture
properties of gels with aggregated droplets might be related to their aggregated state.
In chapter 5 we proposed an interpretation of the obtained experimental results on
the basis of the different mechanisms regarding compression speed dependency, stress
concentration and energy dissipation upon deformation (Sala et al., Submitted). The same
mechanisms can also explain the effects of a decrease in oil droplet size on Young’s
modulus and fracture behaviour (Table 6.8). The overview given in Table 6.8 is the same
as that previously proposed for the effect of an increase in on the large deformation
properties (Sala et al., Submitted), and suggests that, from a phenomenological point of
view, a decrease in oil droplet size has the same effects as an increase in . For gels with
bound, non aggregated droplets, the similarity does not only concern the phenomena
occurring, but also the observed effects on large deformation properties. As a
162

Effect of G’droplet/ G’matrix on large deformation properties
consequence, for these gels variations in the oil droplet size represent a tool to engineer
gels with different but the same fracture behaviour.
6.5 Conclusions
An increase in the gelling agent concentration results in a denser gel structure with a
higher number of bonds between the structural elements forming the gel network. This
causes an increase of both the Young’s modulus and the fracture stress. In particle gels
(WPI gels) also the fracture strain increases with increasing gelling agent concentration.
This can probably be ascribed to a decrease of the size of the inherent defects present in
the gel structure.
By varying the gelling agent concentration and the oil droplet size the ratio
between the modulus of the droplets and that of the matrix can be modulated. Variations
of this ratio only affect the Young’s modulus and fracture properties of gels containing
bound, non-aggregated properties. For these gels a decrease in the oil droplet size allows
to decrease maintaining the same Young’s modulus and fracture properties.
6.6 References
Bayarri, S., Duran, L. & Costell, E. (2004). Influence of sweeteners on the viscoelasticity of
hydrocolloids gelled systems. Food Hydrocolloids, 18(4), 611-619.
Gao, Y. C., Lelievre, J. & Tang, J. (1995). A theoretical analysis of stress concentrations in gels
containing spherical fillers. Transactions of the Asae, 38(6), 1813-1820.
Kim, K.-H., Renkema, J.M.S. & van Vliet, T. (2001). Rheological properties of soybean protein
isolate gels containing emulsion droplets. Food Hydrocolloids, 15, 295-302.
Kim, K. H., Gohtani, S., Matsuno, R. & Yamano, Y. (1999). Effects of oil droplet and agar
concentration on gel strength and microstructure of o/w emulsion gel. Journal of Texture
Studies, 30(3), 319-335.
McClements, D. J., Monahan, F. J. & Kinsella, J. E. (1993). Effect of emulsion droplets on
rheology of whey protein isolate gels. Journal of Texture Studies, 24, 411-422.
Pouzot, M., Nicolai, T., Benyahia, L. & Durand, D. (2006). Strain hardening and fracture of heat-
set fractal globular protein gels. Journal Of Colloid And Interface Science, 293(2), 376-
383.
Rosa, P., Sala, G., van Vliet, T. & van de Velde, F. (2006). Cold gelation of whey protein
emulsions. Journal of Texture Studies, 35, 516-537.
163

Chapter 6
Sala, G., van Aken, G. A., Cohen Stuart, M. A. & van de Velde, F. (2007). Effect of droplet-
matrix interactions on large deformation properties of emulsion-filled gels. Journal of
Texture Studies, 38(4), 511-535.
Sala, G., van Vliet, T., Cohen Stuart, M. A., van Aken, G. A. & van de Velde, F. (Submitted).
Deformation and fracture of emulsion-filled gels. 1 Effect of oil content and deformation
speed.
Smith, J. C. (1974). Correction and extension of the van der Poel method for calculating the shear
modulus of particulate composite. Journal of Research of the National Bureau of
Standard, 78A(3), 355-361.
Smith, J. C. (1975). Simplification of the van der Poel's formula for the shear modulus of
particulate composite. Journal of Research of the National Bureau of Standard, 419-423.
van de Velde, F., Pereira, L. & Rollema, H. S. (2004). The revised chemical NMR shift data of
carrageenans. Carbohydrate Research, 339(13), 2309-2313.
van der Poel, C. (1958). On the rheology of concentrated dispersion. Rheologica Acta, 1, 198-205.
van Vliet, T. (1988). Rheological properties of filled gels. Influence of filler matrix interaction.
Colloid & Polymer Science, 266, 518-524.
164

G. Sala, F. van de Velde, M. Cohen Stuart, G.A. van Aken (2007). Oil droplet release from
emulsion-filled gels in relation to sensory perception, Food Hydrocolloids, 21, 977-985.
Chapter 7
Oil droplet release from emulsion-filled gels in relation to sensory
perception

Chapter 7
Abstract
Oil droplet release upon shearing was studied in emulsion-filled gels containing oil
droplets either bound or unbound to the gel matrix. At 20°C no release was observed for
gels containing bound droplets. The release measured for gels with unbound droplets
related to the fat content and the size of the gel particles obtained after shearing. For gels
with bound droplets and melting at the oral processing temperature, increasing the
temperature of the determination to 37°C resulted in an almost complete release of the oil
droplets. An increase of the oil content induced an increase of the creaminess scores for
all gels. These scores were somewhat higher for gels containing unbound droplets and
gels melting at oral processing temperature. For these gels, the oil droplet release
appears to correlate with creaminess. However, a similar increase in creaminess at
increasing oil concentration was also found for gels with oil droplets bound to the matrix.
Therefore, it is concluded that the release of oil droplets during oral processing is not the
main mechanism causing creaminess perception in emulsion-filled gels.
166

Oil droplet release
7.1 Introduction
Knowledge on the relation between sensory perception and rheological, physicochemical
and structural properties can facilitate the development of new food products. Rheological
properties can often be explained on the basis of the microstructure. Establishing a link
between sensory properties and both microstructure and rheological characteristics
requires information about the mechanisms relating oral processing and perception of the
broken food and its components. However, a correlation between texture perception and
instrumental data requires an univocal judgement of texture perception by humans and
measurements of the mechanical properties under relevant conditions (van Vliet, 2002).
Since this is difficult to achieve and because objective methods to reproduce the eating
process are not available (Malone, Appelqvist & Norton, 2003), the link between sensory
properties, microstructure and rheological characteristics has remained unclear.
For semi solid foods containing emulsified fats and oils, like custard, mayonnaise and
various kinds of sauces, a thorough study on the link between sensory perception and
instrumental measurements of rheological and friction properties was carried out
(Weenen, Van Gemert, Van Doorn, Dijksterhuis & De Wijk, 2003). For custards, the
attribute creamy was not satisfactorily correlated to small deformation measurements,
such as dynamic stress and frequency sweep, or large deformation measurements, like
flow curves and steady shear rate measurements (Jellema, Janssen, Terpstra, de Wijk &
Smilde, 2005). With increasing fat content, a decrease in friction was observed for these
products, together with an increase in creaminess. Therefore, lubrication was put forward
as important factor affecting texture perception in low fat foods (de Wijk & Prinz, 2005).
Since amylase-induced starch breakdown also resulted in a decrease of friction, the
authors suggested a mechanism for the sensory perception of starch-thickened foods (de
Wijk et al., 2005). Starch breakdown would release fat from the starch matrix. The
released fat would subsequently migrate to the surface of the bolus, where it would
become available for lubrication.
With regard to gelled products, in a study on the sensory properties of stranded and
particulate WPI emulsion-filled gels (Gwartney, Larick & Foegeding, 2004) only the
firmness sensed at the first bite, the number of chews and the time to swallow were found
to correlate to the concentration of emulsified fat. Other sensory attributes correlated only
167

Chapter 7
to the gel structure type. In the systems studied, an increase in oil content induced an
increase in gel firmness.
In the study described in chapter 4 (Sala, de Wijk, van de Velde & van Aken, 2008),
gels containing emulsion droplets unbound to the gel matrix or with a matrix melting at
oral processing temperature resulted in higher scores for the attribute creamy, as compared
to gels containing droplets bound to the matrix. Therefore, the hypothesis was formulated
that the perception of creaminess could be related to the release of oil droplets during
mastication.
The aim of this chapter was to study the effect of compositional and experimental
parameters on oil droplet release in gels containing emulsion droplets. To do this, a
method to quantify the oil droplet release in these systems after shear or breakdown was
developed. Gelatine, acid-induced cold-set whey protein isolate (WPI) and -carrageenan
gels, i.e. gel matrices with a wide variety of parameters concerning elasticity, brittleness
and yielding properties, were tested. To these matrices, emulsions stabilized by WPI (or
WPI aggregates in the case of acid-induced, cold-set WPI gels) were added. For gelatine,
also samples containing emulsions stabilized with Tween 20 were prepared. In order to
correlate oil droplet release to sensory perception, gel samples were evaluated by a
sensory panel trained according to the principles of Quantitative Descriptive Analysis
(QDA) (Stone & Sidel, 1985).
7.2 Materials and methods
7.2.1 Materials
Powdered whey protein isolate (WPI; BiproTM
) was obtained from Davisco International
Inc. (La Sueur, MN, USA). Kappa-carrageenan was kindly donated by CP Kelco (Lille
Skensved, Denmark). The -carrageenan sample consisted of 93% mol -units and 7%
mol -units, as determined by NMR spectrometry (van de Velde, Pereira & Rollema,
2004). Gelatine PBG 07 (obtained by acid treatment, isoelectric point 8-9, bloom 270-290)
was kindly provided by PB gelatines (Vilvoorde, Belgium). Sunflower oil was purchased
from a local retailer. KCl (p.a.) was obtained from Merck (Darmstadt, Germany). Tween
20 (Polyoxyethylene sorbitan monolaurate) was obtained from Sigma (Sigma-Aldrich
Chemie BV, Zwijndrecht, The Netherlands). Glucono- -lactone (GDL; GluconalTM
) was
168

Oil droplet release
kindly donated by Purac (Gorinchem, The Netherlands). Saccharin was from Acatris
Netherlands B.V. (Bunschoten, The Netherlands). Vanilla flavour was donated by Danisco
(Grinsted, Denmark). All materials, except Tween 20, were food grade and were used
without further purification. All solutions were prepared with demineralised water.
7.2.2 Sample preparation
7.2.2.1 Emulsions
WPI solutions were prepared by adding the protein to the required amount of water.
Subsequently, the solutions were gently stirred for 2 hours. Stock emulsions, containing
40 wt% sunflower oil and 1 wt% WPI in the water phase, were prepared by pre-
homogenising the ingredients using an Ultra Turrax (Polytron, Switzerland) homogeniser.
Pre-emulsions were further processed using a laboratory homogenizer (Ariete, Model
NS1001L – Panda, Niro Soavi S.p.A, Italy). The volume-surface average or Sauter
diameter (d3,2) of the droplets of this emulsion was 1.1 0.05 m. KCl was added to the
emulsion used for the preparation of -carrageenan to reach a concentration of 30 mM in
the water phase.
Emulsions stabilised with WPI aggregates were prepared as described above, but
using a 3 wt% WPI aggregates dispersion as continuous phase. This dispersion was
prepared by heating a 9 wt% WPI solution at 68.5°C for 2 hours and subsequent cooling to
room temperature with tap water and diluting to 3 wt%. This preparation procedure
induces a denaturation of the whey protein >95% (Alting, 2003). The Sauter diameter of
the droplets of this emulsion was 1.2 0.05 m.
Tween 20 stabilised emulsions were prepared as described for the WPI-stabilised
emulsions. The concentration of the emulsifier in this case was 2 wt%. The Sauter
diameter of the droplets of this emulsion was 1.0 0.05 m. The droplet size distribution
of the stock emulsions was measured using a Malvern MasterSizer X (Malvern
Instruments, USA). The pH of the emulsions was slightly subneutral (6.6-6.8).
169

Chapter 7
7.2.2.2 Gels
For the study of the oil droplet release, the concentrations of the gelling agents were 4
wt% for gelatine, 3 wt% for WPI and 0.6 wt% for -carrageenan. These concentrations
lead to approximately the same gel strength. Gelatine and WPI gels were prepared in
demineralised water, -carrageenan gels in a 30 mM KCl solution.
Samples for sensory analysis were prepared with varying gelling agent concentration
in the water phase, in order to obtain comparable moduli ( 7kPa) at increasing oil
concentration for all samples.
To mask possible off-flavours, 0.012 wt% saccharin and 0.033 wt% vanilla were
added to both the emulsions and the gels solutions.
Cold gelation of the WPI gels was induced by addition of a suitable amount of GDL
(0.22 wt% for a dispersion with a concentration of 3 wt%) to the WPI dispersion and to
the WPI dispersion/emulsion mix and incubation at 25°C for 17 hours, until a pH of 4.5
was reached (Rosa et al., 2006). The WPI dispersion was prepared as described above.
For gelatine and -carrageenan gels, the material was allowed to hydrate for 2 hours
under gentle stirring at room temperature. The samples were subsequently dissolved by
heating at 80°C for 30 minutes and cooled to 25°C for gelatine and to 45°C for -
carrageenan prior to emulsion addition. For -carrageenan samples, the emulsions were
heated to 45°C. After emulsion addition, the samples were allowed to gel at room
temperature. The pH of gelatine gels was in the range 5.3-5.6 (the lower values were
observed for gels without emulsion; the higher values for the higher emulsion
concentrations). The pH of -carrageenan gels was in the range 7.3-8.2 (the higher values
were observed for gels without emulsion; the lower values for the higher emulsion
concentrations).
The samples for breakdown measurements were allowed to gel in 50 ml plastic
syringes (internal diameter 26.4 mm) coated with a thin film of paraffin oil. The samples
for oil droplet release were prepared in the same syringes, but without paraffin oil. The
samples for the QDA evaluation, prepared under food-grade and sterile conditions, were
allowed to gel in lidded plastic cups with a capacity of 50 ml.
170

Oil droplet release
7.2.3 Large deformation experiments
Uni-axial compression tests were performed approximately 24 hours after preparation,
simultaneously to the QDA evaluation. Gel pieces of about 25 mm height were used for
the measurements with an Instron 5543 machine (Instron Corporation, USA) equipped
with a plate-plate geometry. The plates were lubricated with a thin layer of paraffin oil.
The measurements were performed at room temperature, at a constant deformation speed
of 1 mm/s and up to a compression strain of 80%. For gelatine gels, 4 pieces per specimen
of 2 specimens were analysed. For the other gels at least 4 pieces per specimen of 1
specimen were used for the measurements.
7.2.4 Quantification of oil droplet release
To quantify the oil droplet release occurring after gel shearing, a highly reproducible
method was developed. The shearing treatment consisted of squeezing the gel out of the
syringe in which it was prepared by applying on the plunger a constant velocity
deformation by means of a Texture Analyser instrument. To this end, the syringe was put
on a rack especially build to keep it vertical. The orifice of the used syringes had a
diameter of 0.9 mm. For -carrageenan gels, tests were also carried out after connecting a
hypodermic needle to the syringe and after cutting off a part of the original orifice. In the
first case the diameter of the orifice was 0.5 mm, in the second case 9 mm. The force
needed to squeeze the sample out of the syringe was measured. A known amount of
sheared gel (typically 50 g) was collected in a beaker. To this material, an amount of
distilled water corresponding to two times that of the gel was added (typically 100 g). The
mix gel-water was gently stirred with a magnetic stirrer for 1 minute. The mix was then
filtered on a paper filter with large pores (2411 1/2, Schleicher & Schuell, Dassel,
Germany). These filters allowed the oil droplets that were released into the liquid phase to
pass through the pore. This was confirmed by a complete recovery of the oil from a WPI-
stabilised emulsion after filtration. The ratio between water and gel was chosen to allow
the filtration of the water-gel mix. At lower ratio’s the filtration was entirely blocked or
became remarkably slow. The oil content of the filtrate was determined by the Röse-
Gottlieb method (ISO 1211). This gravimetric method consists in recovering the fat
present in an emulsion by extraction with petrol ether and diethylether.
171

Chapter 7
7.2.5 Quantitative Descriptive Analysis
7.2.5.1 Assessors/ sensory attributes
The sensory characteristics of the gels were investigated with the use of a sensory panel
trained according to the principles of Quantitative Descriptive Analysis (QDA) (Stone et
al., 1985). The panel consisted of nine females aged between 22 and 49 and with above-
average scores on all selection tests. These tests included tests of odour identification,
odour memory, and verbal creativity, and a series of texture tests in which the ability of
the panelist to assess fattiness, roughness, and particle size was measured. All panelists
had previously been trained for the assessment of the sensory properties of oil-in-water
emulsions. Panelists were seated in sensory booths with appropriate ventilation and
lighting. The products were assessed semi-monadically in duplicate on visual analogue
scales. The presentation order was randomly assigned per panellist. Acquisition of the
panelist's responses was done by computer using FIZZ software (Biosystemes, 1998). In 4
2-hr sessions the panel members were presented and trained with a set of 8 samples of
emulsion-filled gels. During these training sessions descriptive attributes were generated
that were used to profile 10 emulsion-filled gel samples with 4 reference samples without
emulsion. Each gel was served in portions of 40 ml in plastic beakers (volume 50 ml) at an
average rate of one sample per 5 minutes. The attributes were generated in Dutch and
subsequently translated into English. During profiling, the attributes appeared per category
on a monitor placed in front of the panelist with the attributes on the left and a 100-point
response scale anchored at the extremes on the right. The panelist used a mouse to indicate
the perceived strength of each attribute. Each product was first smelled, after which the
odour attributes were rated. Next, the product was taken into the mouth, after which the
taste/flavour and mouth feel attributes were rated in the order in which they were
perceived. Finally, the product was spat out. The after feel attributes were rated and the
panelists rinsed their mouths with acidified water before the next sample.
7.2.5.2 Data analysis
The relationships between sensory attributes and gel samples characteristics were
summarized using Principal Component Analysis (PCA) (Unscrambler, Camo Inc.,
Corvallis, U.S.A). PCA facilitates the identification of attribute synonyms and covariate
attributes. Relationships between specific attributes were statistically modeled using
172

Oil droplet release
Partial Least Squares Regression or PLSR (Unscrambler Vs. 7.5, Camo Inc., Corvallis,
U.S.A). The effects of changes in sample properties on individual sensory attributes were
analyzed using a factorial ANOVA (SPSS, SPSS Inc, Chicago, U.S.A.), carried out on the
raw sensory data. In addition to the three gelling agents, main effects and second order
interactions, the ANOVA included a random panelist effect and session effect. Because
the ANOVA was carried out on the raw sensory data, it was possible to carry out tests of
significance for all effects.
7.3 Results and discussion
7.3.1 Oil droplet release
Emulsion-filled gels with droplets bound to the matrix were obtained for gelatine gels with
native WPI-stabilised emulsions and for WPI gels containing WPI aggregates-stabilised
emulsions (Sala et al., 2007). In gelatine gels containing a Tween 20-stabilised emulsion,
and in -carrageenan gels, the oil droplets were not connected to the gel matrix. At 20°C,
no oil droplet release could be observed for gels with oil droplets bound to the matrix
(Figure 7.1A). For gels containing oil droplets unbound to the matrix, significant amounts
of emulsion were released from the matrix after shear treatment (Figure 7.1A). In general,
the droplet release was proportional to the oil concentration. For gelatine samples
containing a Tween 20-stabilised emulsion, a larger release was observed than for -
carrageenan gels. Moreover, for these gels an increase of the oil droplet release with
increasing oil concentration was observed. This can probably be related to a decrease of
modulus and fracture stress at increasing oil concentration observed for these gels in
chapter 3 and chapter 5 and to the low value of these parameters as compared to -
carrageenan. Lower gel strength will result in a more extensive structure breakdown
during gel shearing.
173

Chapter 7
0
5
10
15
20
25
0 5 10 15 20 25
Oil content (g/ 100 g)
Oil
dro
ple
t rele
ase (
g/
100 g
gel)
0
5
10
15
20
25
0 5 10 15 20 25
Oil content (g/ 100 g)
Oil
dro
ple
t rele
ase (
g/
100 g
gel)
A B
Figure 7.1 - Effect of gel oil content on oil droplet release. A: 20°C; B: 37°C ( : gelatine with
WPI-stabilised emulsion; gelatine with Tween 20-stabilised emulsion; WPI; : -
carrageenan). The dotted line represents total oil droplet release.
The extraction of the emulsion from the gel was also performed at 37°C, in order to
mimic the oral processing temperature. Performing the extraction of the oil droplets at this
temperature resulted in a substantial release of emulsion droplets also for gelatine gels
containing a WPI-stabilised emulsion (Figure 7.1B). As expected, changing the extraction
temperature did not affect the oil droplet release for WPI and -carrageenan gels. Under
the experimental conditions chosen for this determination and at the mentioned
temperature gelatine gels melted. Therefore, the differences observed among gel types can
be directly related to their melting behaviour. For gelatine samples containing a Tween
20-stabilised emulsion, a slight further increase of the oil droplet release was observed,
resulting in a complete release of the emulsion droplets originally entrapped within the gel
matrix. The amount of emulsion released after gel shearing appeared to be related to the
interactions between oil droplet and gel matrix and to the melting behaviour of the matrix.
For -carrageenan gels, i.e. gels containing oil droplets unbound to the gel matrix
and not melting at 37°C, an attempt was made to relate the oil droplet release to the extent
of structural breakdown of the gel. A variation in structure breakdown was achieved by
varying the intensity of the shear treatment. To this end, the gel samples were pressed out
of syringes with orifices with different diameter. With decreasing orifice diameter, larger
forces had to be applied (data not shown). As a result, at increasing shear intensity, gel
174

Oil droplet release
particles with decreasing size (i.e. presenting a larger specific surface area) were obtained.
The amount of released emulsion increased with decreasing the orifice diameter of the
syringe (Figure 7.2). During the set-up of the method, different compression speeds,
resulting in different fracture stress values, were applied for sample breakdown (results
not shown). This did not significantly affect the oil droplet release. Therefore, the oil
droplet release seems to be related only to the specific area of the pieces of the sample
obtained after breakdown treatment and not to the applied stress. At increasing oil content,
the fraction of extracted emulsion decreased somewhat (Figure 7.2). This decrease
appeared most prominent for the most intense shear treatment applied (i.e. for gels pressed
out of a hypodermic needle) (Figure 7.2). This is probably due to a lesser separability of
the water from the tiny gel particles by filtering, caused by an increased spreadability or
softening of the gel particles at the higher oil contents, clogging the filter paper. In reality,
the fraction of emulsion droplets released from the gel by shear treatment is probably
almost independent of the oil content.
0
0.1
0.2
0.3
0.4
0.5
0.6
0.7
0 5 10 15 20 25
Oil content (g/ 100 g)
Fracti
on
of
rele
ased
oil
Figure 7.2 - Effect of oil content on fraction of released oil for -carrageenan gels pressed out of
syringes with orifices with different diameter ( : 0.5 mm; 0.9 mm; : 9 mm).
²² 7
For the samples prepared for sensory evaluation, the determination of the oil droplet
release was performed at 37°C on four different days. The standard deviation in the
resulting data set was smaller than 1% for the samples containing 5 wt% oil. With regard
to the samples with 20 wt% oil, the standard deviation was 1.8% for gelatine and 3.4% for
-carrageenan, respectively. For WPI gels, no oil droplet release was found.
175

Chapter 7
In order to detect possible coalescence phenomena occurring during the shear
treatment of the gel, variations of the size distributions of the emulsions droplets extracted
from the matrix were studied. This was carried out by light scattering measurements and
microscopy observations. A slight increase of the droplet size distribution was observed
for the emulsions extracted from gelatine (Figure 7.3A). For -carrageenan no variations
were observed (Figure 7.3B). The increase observed for gelatine was not due to
coalescence, but to the presence in the extract of few, tiny pieces of non-melted gel
material in which several droplets were clustered. This was ascertained by microscopic
observations (images not shown). The shear treatment applied for the determination of the
oil droplet release did not induce coalescence of the oil droplets extracted from the gel
matrix.
A B
0
1
2
3
4
5
6
7
8
9
10
0.1 1 10 100 1000
Droplet size ( m)
Vo
lum
e (
%)
Figure 7.3 – Droplet size density distribution of the bulk emulsion used for sample preparation
( ) and of the aqueous extract of the gels with 20% oil ( ). A: gelatine; B: -carrageenan.
7.3.2 Sensory properties
The effects of gel type and oil content on sensory attributes confirmed those reported
in chapter 4 (Sala et al., 2008). Also in the present study two main sensory dimensions
could be recognised, namely one running from watery to creamy, and one from tough and
crumbly to spreadable and melting (Figure 7.4). The first dimension was related to the oil
content of the gel, the second to the gel type. In studies on the link between sensory
perception and rheological properties of semi-solid foods, such as custard, mayonnaise
0
1
2
3
8
9
10
0.1 1 10 100 1000
Droplet size ( m)
Vo
lum
e (
%)
7
6
5
4
176

Oil droplet release
and sauces, two main sensory dimensions were recognised, one going from rough to
creamy and related to the fat content, and one going from melting to thick and related to
the thickener content (de Wijk, van Gemert, Terpstra & Wilkinson, 2003; Weenen,
Jellema & de Wijk, 2005; de Wijk, Prinz & Janssen, 2006). Interestingly, in these studies
the attribute melting showed a negative contribution to creamy, whereas in our work this
was not found. In starch-containing semi-solid foods, the attribute melting was related to
the decrease of thickness induced by starch granules breakdown, resulting in a liquid
bolus. In this context, the negative correlation between creamy and melting appears
straightforward. In the present study, the food material was introduced in the oral cavity as
a gel and the attribute melting was related to the process of gel breakdown, leading to the
formation of a semi-solid and spreadable bolus. This bolus was perceived as creamy
compared to the original gel.
-1.0
-0.5
0
0.5
1.0
-0.8 -0.6 -0.4 -0.2 0 0.2 0.4 0.6 0.8 1.0
X-expl: 60%,20%
Gelatine 20%
Gelatine 5%/20Gelatine 5%/5
Gelatine 0%
K-carrageenan 0%
K-carrageenan 20%
K-carrageenan 5%WPI 20%
WPI 5%/20
WPI 5%/5
WPI 0%
MTough
MCooling
MSlippery
MFatty
Mspongy
MCrumblyEffort
MCrumbly
MFibrous
MCreamy
MSpreadable
MMelting
MRough
Mdry
MGrainy
MSticky
MMouthfilling
MWatery
PC1
PC2
Bi-
plot
MFirm
MElastic
Figure 7.4 – Principal component analysis of sensory data (PC1 explains 60% and PC2 20% of
the variance).
Upon increasing oil content, the creaminess of all gels increased (Figure 7.5A). The
scores for creamy were consistently higher for gelatine and -carrageenan gels, although
the difference between gelatine and WPI gels was not statistically significant. The scores
for the attribute spreadable increased at increasing oil concentration for all gels, but the
gelatine gels were considerably less spreadable than -carrageenan and WPI gels (Figure
177

Chapter 7
7.5B). This can be linked to the high fracture stress of the gelatine samples tested in the
present study (results not shown). Even though gelatine gels will eventually melt at
temperatures around body temperature, the heat transport to the gels particles in the mouth
takes some time. Melting is accelerated by the reduction in particle size and the flow in the
mouth during mastication. During this oral processing phase the sensory attributes of the
gels related to their fracture properties can be appreciated. A high fracture stress was
related to high scores for the attributes tough, firm, crumbly and crumbly effort (crumbly
being defined as the presence of small pieces in the mouth and crumbly effort as the effort
needed to break the sample into pieces) (Table 7.1), which are negatively correlated to
creamy and spreadable.
Table 7.1 – Correlations among physicochemical parameters and mouthfeel attributes. Significant
correlations (P 0.15) are underlined.
Oil Release Modulus Fracture
stress
Fracture
strain
Fracture
energy
Oil Release - 0,10 0,40 0,43 0,32
Modulus 0,10 - 0,00 -0,36 -0,14
Fracture stress 0,40 0,00 - 0,87 0,96
Fracture strain 0,43 -0,36 0,87 - 0,90
Fracture energy 0,32 -0,14 0,96 0,90 -
Firm 0,39 -0,29 0,90 0,98 0,94
Elastic 0,42 -0,34 0,87 0,98 0,92
Tough 0,47 -0,27 0,88 0,96 0,94
Cooling -0,40 -0,24 0,27 0,11 0,25
Slippery 0,44 -0,12 0,69 0,55 0,55
Fatty 0,27 -0,08 -0,43 -0,17 -0,41
Spongy -0,61 0,04 -0,62 -0,57 -0,43
Crumbly effort 0,42 -0,29 0,91 0,98 0,95
Crumbly 0,36 0,02 0,72 0,53 0,63
Fibrous -0,67 0,11 -0,51 -0,55 -0,34
Creamy 0,71 -0,12 -0,30 0,02 -0,26
Spreadable -0,16 0,23 -0,86 -0,83 -0,89
Melting 0,50 0,08 -0,49 -0,35 -0,56
Rough -0,50 0,18 -0,54 -0,51 -0,37
Dry -0,09 0,11 -0,18 -0,09 0,03
Grainy -0,53 0,49 -0,78 -0,92 -0,83
Sticky -0,07 0,19 -0,10 -0,03 -0,05
Mouth filling 0,30 0,38 -0,44 -0,38 -0,51
Watery -0,47 0,10 -0,36 -0,58 -0,46
For gelatine gels, the low scores for the attribute spreadable negatively affected the
scores for creamy. In chapter 4 (Sala et al., 2008), the scores for the attribute creamy were
178

Oil droplet release
significantly higher for gelatine and -carrageenan gels as compared to WPI gels. For the
samples described in chapter 4, as a result of a lower gelling agent concentration in the
water phase, the fracture stress and the scores for the attribute spreadable for gelatine gels
were much lower than in the present work.
A B
0
10
C
Figure 7.5 - Effect of oil concentration on three different mouthfeel attributes. A: creamy; B:
spreadable; C: fatty ( : gelatine; WPI; : -carrageenan).
20
30
40
50
60
70
0 5 10 15 20 2
Oil content (g/ 100 g)
Mo
uth
feel
Cream
y
5
0
10
20
30
40
50
60
70
0 5 10 15 20 25
Oil content (g/ 100 g )
Mo
uth
feel
Sp
read
ab
le
0
5
10
15
20
25
30
35
40
45
50
0 5 10 15 20 25
Oil content (g/ 100 g)
Mo
uth
feel
Fatt
y
179

Chapter 7
Whereas in chapter 4 the mouthfeel attribute fatty was found to be only affected by the
gel type, in the present study this attribute correlated also to the oil content (Figure 7.5C).
Increasing the oil concentration from 0 to 20 wt % induced an increase of the scores for
fatty only by a factor slightly higher than 2. Also in view of the large statistical variation
observed for the attribute fatty in both studies, we can conclude that in emulsion-filled gels
differences in fattiness at increasing oil concentration are not clearly perceived.
Figure 7.6 shows the effect of oil droplets release on both mouthfeel attributes creamy
and fatty. For gels containing unbound oil droplets ( -carrageenan gels with WPI-
stabilised emulsion) and gels melting at the oral processing temperature (gelatine gels) the
oil droplet release is highly correlated with both sensory attributes. However, since a
similar increase in creaminess and fattiness is also observed upon increasing oil
concentration for gels with oil droplets bound to the matrix and non-melting (WPI gels),
we can conclude that the perception of creaminess in emulsion-filled gels is not primarily
related to the release of oil droplets during structure breakdown. Therefore, the correlation
between oil droplet release and the attributes creamy and fatty for gels containing unbound
oil droplets and gels melting at the oral processing temperature appears to be due to the
linear relationship between gel oil content and oil droplet release, in combination with a
direct relation between the fat content and the mentioned sensory attributes. Clearly, the
sensory perception of creamy and fatty for emulsion-filled gels must have a different
cause.
180
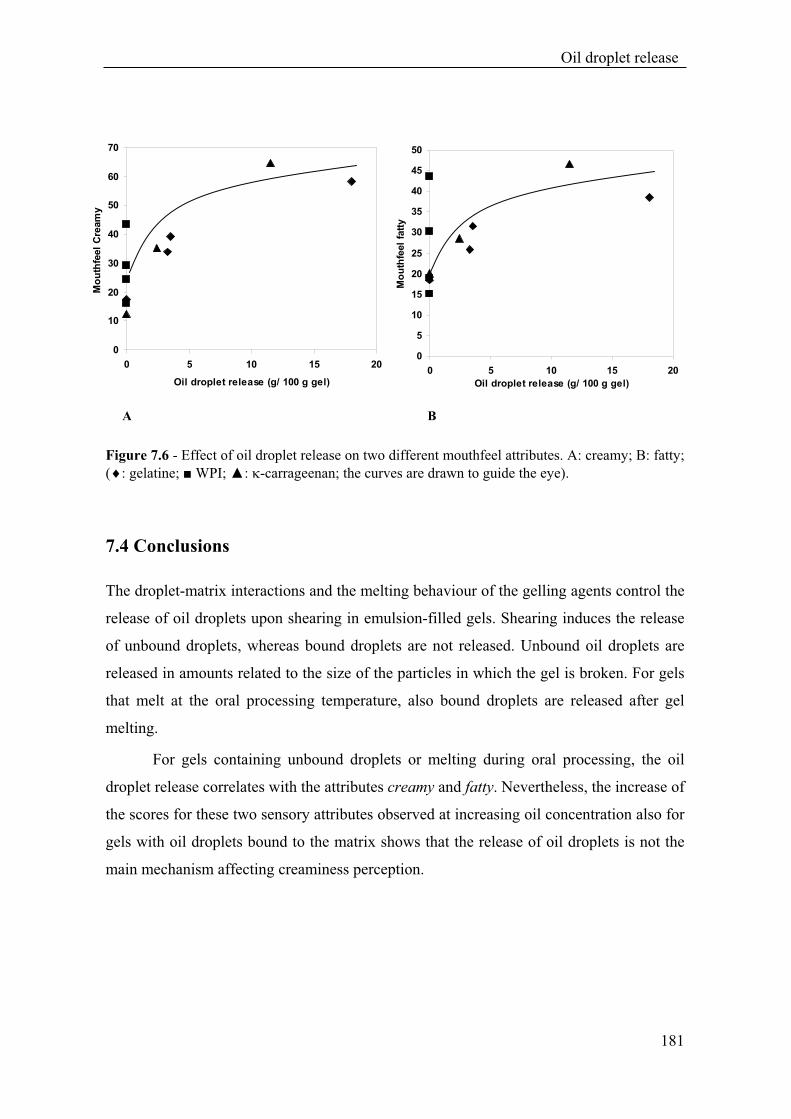
Oil droplet release
00
5
10
15
20
25
30
35
40
45
50
0 5 10 15 20
Oil droplet release (g/ 100 g gel)
Mo
uth
feel
fatt
y
70
A B
Figure 7.6 - Effect of oil droplet release on two different mouthfeel attributes. A: creamy; B: fatty;
( : gelatine; WPI; : -carrageenan; the curves are drawn to guide the eye).
7.4 Conclusions
The droplet-matrix interactions and the melting behaviour of the gelling agents control the
release of oil droplets upon shearing in emulsion-filled gels. Shearing induces the release
of unbound droplets, whereas bound droplets are not released. Unbound oil droplets are
released in amounts related to the size of the particles in which the gel is broken. For gels
that melt at the oral processing temperature, also bound droplets are released after gel
melting.
For gels containing unbound droplets or melting during oral processing, the oil
droplet release correlates with the attributes creamy and fatty. Nevertheless, the increase of
the scores for these two sensory attributes observed at increasing oil concentration also for
gels with oil droplets bound to the matrix shows that the release of oil droplets is not the
main mechanism affecting creaminess perception.
10
20
30
40
50
60
0 5 10 15
Oil droplet release (g/ 100 g gel)
Mo
uth
feel
Cream
y
20
181

Chapter 7
7.5 Acknowledgements
Eefjan Timmerman and Jerry van Maanen (WCFS, TNO) are acknowledged for assistance
during samples preparation and Roelie Holleman (NIZO food research) for carrying out
the Röse-Gottlieb determinations. Hetty Kroese and Jos Mojet (Centre for Innovative
Consumer Studies) are acknowledged for the execution of the QDA tests and René de
Wijk (WCFS, CICS) for the evaluation of the results.
7.6 References
Alting, A. C. (2003). Cold gelation of globular proteins. Wageningen, The Netherlands.
de Wijk, R. A., van Gemert, L. J., Terpstra, M. E. J. & Wilkinson, C. L. (2003). Texture of semi-
solids; sensory and instrumental measurements on vanilla custard desserts. Food Quality
and Preference, 14(4), 305-317.
de Wijk, R. A. & Prinz, J. F. (2005). The role of friction in perceived oral texture. Food Quality
and Preference, 16(2), 121-129.
de Wijk, R. A., Prinz, J. & Janssen, A. M. (2006). Explaining perceived oral texture of starch-
based custard desserts from standard and novel instrumental tests. Food Hydrocolloids,
20(1), 24-34.
Gwartney, E. A., Larick, D. K. & Foegeding, E. A. (2004). Sensory texture and mechanical
properties of stranded and particulate whey protein emulsion gels. Journal of Food
Science, 69(9), S333-S339.
Jellema, R. H., Janssen, A. M., Terpstra, M. E. J., de Wijk, R. A. & Smilde, A. K. (2005). Relating
the sensory sensation 'creamy mouthfeel' in custards to rheological measurements. Journal
of Chemometrics, 19(3), 191-200.
Malone, M. E., Appelqvist, I. A. M. & Norton, I. T. (2003). Oral behaviour of food hydrocolloids
and emulsions. Part 1. Lubrication and deposition considerations. Food Hydrocolloids, 17,
763-773.
Ring, S. & Stainsby, G. (1982). Filler reinforcement of gels. Progress in Food and Nutrition
Science, 6, 232-239.
Rosa, P., Sala, G., van Vliet, T. & van de Velde, F. (2006). Cold gelation of whey protein
emulsions. Journal of Texture Studies, 35, 516-537.
Sala, G., De Wijk, R. A., van de Velde, F. & van Aken, G. A. (2008). Matrix properties affect the
sensory perception of emulsion-filled gels. Food Hydrocolloids, 22, 353-363.
Sala, G., van Aken, G. A., Cohen Stuart, M. A. & van de Velde, F. (2007). Effect of droplet-
matrix interactions on large deformation properties of emulsion-filled gels. Journal of
Texture Studies, 38(4), 511-535.
182

Oil droplet release
Stone, H. & Sidel, J. L. (1985). Sensory evaluation practices. Orlando: Academic Press.
van de Velde, F., Pereira, L. & Rollema, H. S. (2004). The revised chemical NMR shift data of
carrageenans. Carbohydrate Research, 339(13), 2309-2313.
van Vliet, T. (2002). On the relation between texture perception and fundamental mechanical
parameters for liquid and time dependent solids. Food Quality and Preference, 13, 227-
236.
Weenen, H., Van Gemert, L. J., Van Doorn, J. M., Dijksterhuis, G. B. & De Wijk, R. A. (2003).
Texture and mouthfeel of semisolid foods: Commercial mayonnaises, dressings, custard
desserts and warm sauces. Journal of Texture Studies, 34(2), 159-179.
Weenen, H., Jellema, R. H. & de Wijk, R. A. (2005). Sensory sub-attributes of creamy mouthfeel
in commercial mayonnaises, custard desserts and sauces. Food Quality and Preference,
16(2), 163-170.
183


A. Chojnicka & G. Sala, K. de Kruif, F. van de Velde, The interactions between oil droplets and
gel matrix affect the lubrication properties of sheared emulsion-filled gels, to be submitted.
Chapter 8
Effect of droplet-matrix interactions on the lubrication properties of
sheared emulsion-filled gels

Chapter 8
Abstract
In this chapter the lubrication behaviour of different emulsions-filled gels is related to
their composition and structure. When considering the emulsions used for gel preparation,
increasing the oil concentration resulted in a decrease of the friction coefficient.
Emulsions with 40 wt% oil showed the same friction coefficient as the pure oil. The
lubrication properties of the gels strongly depended on the molecular properties of the
gelling agent and on the breakdown behaviour of the gel matrix. For each individual type
of emulsion-filled gel, the lubrication behaviour was affected by the droplet-matrix
interactions. For gels containing oil droplets bound to the matrix, the friction coefficient
gradually decreased with increasing oil concentration. For gels containing oil droplets
not bound to the matrix, the friction coefficient of the filled gels was lower than that of the
same gel matrix without oil. However, no effect of the oil concentration on friction was
observed. The different effects of the oil concentration on the lubrication behaviour of the
different gels were explained by the relation between droplet-matrix interactions and
‘apparent viscosity’ of the broken gels. For gels with bound droplets increasing the oil
concentration resulted in an increase of the ‘apparent viscosity’ of the broken gel. For
gels with unbound droplets, the oil concentration did not affect the ‘apparent viscosity’.
Confocal Laser Scanning Microscopy (CLSM) observations of both emulsions and filled
gels did not reveal coalescence of the oil droplets as a result of the shear treatment
related to friction measurements.
186

Lubrication properties
8.1 Introduction
During oral processing, food products are confined to very thin films between the oral
tissues. Tribology studies the mechanics of friction, lubrication and wear of interacting
surfaces that are in relative motion. Tribology and thin-film rheology allow to mimic in-
mouth conditions (forces and surfaces) and are used to study the lubrication properties of
food. Oral friction is influenced by: (i) the type of food consumed and its lubrication
properties, (ii) the interactions between the lubricants and the surfaces, (iii) the properties
of the oral tissues and (iv) physical parameters like the sliding to rolling motion between
the tongue and palate as well as the force applied during food consumption. Thin-film
rheological properties of foods have been related to the sensory perceptions of mouthfeel,
texture and taste (de Vicente, Spikes & Stokes, 2006).
The behaviour of a lubricant between two rubbing surfaces is represented in the
form of a Stribeck curve. In this curve the friction coefficient, defined as:
Ffric/W (8.1)
(where Ffric and W are the friction force and the normal load, respectively), is given as a
function of the entrainment speed. The friction behaviour can be classified into three
separate regimes, that are distinguishable within the Stribeck curve. The boundary
lubrication regime is present at very low speeds, where the friction is affected by both the
surface-surface interaction dominated by the asperities and ability of the lubricant to form
a boundary interfacial film. In the hydrodynamic regime present at very high speeds, the
surfaces are fully separated and the lubrication is governed by bulk rheological properties
of the lubricant. Between those two regimes a mixed regime can be recognised, where the
pressure of the fluid carries only a part of the load, while the other part is sustained by the
surface asperities. In this case, the two surfaces are not fully separated (Cassin, Heinrich &
Spikes, 2001; de Vicente et al., 2006). The pattern of the Stribeck curves strongly depends
on the properties of lubricant and rotating materials, as well as on the experimental
conditions applied during measurement.
For semi-solid foods containing emulsified fats and oils, an attempt was made to
correlate the sensory attributes generated by a panel with rheological and friction
properties ( Weenen, H., Terpstra, M., Janssen, A., Jellema, R. H., De Wijk, R., Prinz, J., De
Jongh, H. & Van der Linden, 2003a; Weenen, Van Gemert, Van Doorn, Dijksterhuis & De
Wijk, 2003b; Jellema, Janssen, Terpstra, de Wijk & Smilde, 2005). For custards, the
187

Chapter 8
mouthfeel attribute creamy was not correlated to small deformation measurements
(dynamic stress and frequency sweep) or large deformation properties (flow curves and
steady shear rate behaviour). The oral perception of these foods was reported to be related
to their lubrication properties (de Wijk & Prinz, 2005) measured with a friction tester with
a metal-rubber configuration. Increasing the fat content resulted in a decrease of the
friction coefficient as well as in an increase of the product’s creaminess. The decrease of
friction observed as a result of the structure breakdown by amylase in starch containing
products was explained with a surfacing mechanism of the oil droplets released from the
starch matrix. The presence of particles causes on the other hand astringent sensations and
higher friction. Similar results were found by Malone et al. for polymer solutions,
emulsions and different types of milk (Malone, Appelqvist & Norton, 2003).
The lubrication properties of gels have not been studied extensively and those of
sheared gels have not been reported. Chen et al. (Chen, Moschakis & Nelson, 2004)
measured the surface friction of WPI gels and studied the relation between speed and
friction, as well as the influence of the surface roughness of the gel on the surface friction.
The rheological properties and the breakdown behaviour of gels filled with
emulsions droplets can be varied by changing the interactions between oil droplets and gel
matrix, the oil content and the oil droplet size (Aguilera & Kinsella, 1991; Kim, Gohtani
& Yamano, 1996; Kim, 2001; Sala, van Aken, Cohen Stuart & van de Velde, 2007; Sala,
van Vliet, Cohen Stuart, van Aken & van de Velde, Submitted-a; Sala, van Vliet, Cohen
Stuart, van de Velde & van Aken, Submitted-b). In previous studies we showed that the
interactions between the oil droplets and the gel matrix in gelatine, -carrageenan and
cold-set acid-induced whey protein isolates (WPI) gels could be varied by changing the
emulsifying agent used for emulsion preparation. The oil droplets were bound to the
matrix in gelatine gels containing emulsions stabilised by WPI, in -carrageenan
containing emulsions stabilised by lactoferrin and in WPI gels containing emulsions
stabilised by WPI aggregates. This resulted for all gels in an increase of the gel modulus
and a decrease of the fracture strain. In gelatine and -carrageenan gels with bound
droplets the fracture stress decreased, whereas in WPI gels it increased. The oil droplets
were not bound to the matrix in gelatine gels containing Tween 20-stabilised emulsions
and in -carrageenan containing emulsions stabilised by WPI. This gave a decrease in gel
modulus and fracture stress. The fracture strain also decreased, but less than in gel with
bound droplets.
188

Lubrication properties
In the study described in chapter 4, gels with unbound droplets or melting in the
mouth were evaluated as more creamy (Sala, De Wijk, van de Velde & van Aken, 2008).
It was hypothesised that for emulsion-filled gels the perception of mouthfeel attributes
related to the presence of oil droplets could be mediated by the release of the droplets
from the gel matrix upon oral processing. The study described in chapter 7 revealed that
the release of the oil droplets is not the only mechanism explaining the perception of
creaminess and fattiness in emulsion-filled gels (Sala, van de Velde, Cohen Stuart & van
Aken, 2007). Therefore, we hypothesised that the lubrication behaviour of emulsion-filled
gels might be another possible factor involved in their sensory perception mechanism. In
this chapter we investigate the effect of the individual components of emulsion-filled gels
on their lubrication properties by using a tribometer modified to obtain a low contact
pressure. Our simulated environment mimics in that respect oral conditions. The effect of
saliva on friction is also studied. The chosen systems are gelatine, -carrageenan and cold-
set, acid-induced WPI gels, containing both bound and unbound oil droplets.
8.2 Materials and methods
8.2.1 Materials
Porcine skin gelatine PBG 07 (bloom 280, isoelectric point 8-9) was kindly provided by
PB gelatines (Vilvoorde, Belgium). Kappa-carrageenan was kindly donated by CP Kelco
(Lille Skensved, Denmark). The -carrageenan sample consisted of 93% mol -units and
7% mol -units, as determined by NMR spectrometry (van de Velde, Pereira & Rollema,
2004). Powdered whey protein isolate (WPI, BiproTM
) was obtained from Davisco
International Inc. (La Sueur, MN, USA). Tween 20 (Polyoxyethylene sorbitan
monolaurate, in the text referred to as Tween) was obtained from Sigma (Sigma-Aldrich
Chemie BV, Zwijndrecht, The Netherlands). Lactoferrin were kindly donated by DMV
International, (Veghel, The Netherlands). Medium Chain Triglycerides (MCT) MIGLYOL
812N oil was purchased from Internatio BN (Mechelen, Belgium). Potassium chloride
(p.a.) was obtained from Merck (Darmstadt, Germany). Glucono- -lactone (GDL) was
kindly donated by Purac (Gorinchem, The Netherlands). All materials were used without
further purification. All solutions were prepared with demineralised water.
189

Chapter 8
8.2.2 Sample preparation
8.2.2.1 Emulsions
WPI solutions were prepared by adding the protein to the required amount of
demineralised water. Subsequently, the solutions were gently stirred for 2 hours. Stock
emulsions, consisting of 40 wt% MCT oil and 60 wt% aqueous phase containing 1 wt%
WPI, were prepared by pre-homogenising the ingredients using an Ultra Turrax (Polytron,
Kinematica AG, Lucerne, Switzerland) homogeniser. Pre-emulsions were further
processed using a laboratory homogeniser (Ariete, Model NS1001L 2K – Panda 2K, Niro
Soavi S.p.A, Parma, Italy). The same procedure was used for the preparation of the
emulsions stabilised with Tween and lactoferrin, except that the emulsifying agent
concentration in the aqueous phase was 2 wt%. WPI-stabilised emulsions were used for
the preparation of filled gelatine and -carrageenan gels. Tween-stabilised emulsions were
used for the preparation of filled gelatine gels and lactoferrin-stabilised emulsions for the
preparation of filled -carrageenan gels. KCl was added to the emulsions used for the
preparation of -carrageenan gels, up to a concentration of 30 mM in the aqueous phase.
Emulsions stabilised with WPI aggregates were prepared as described above, but
using a 3 wt% WPI aggregates dispersion as continuous phase. This dispersion was
prepared by heating a 9 wt% WPI solution at 68.5°C for 2 hours and subsequent cooling to
room temperature with tap water and subsequent dilution to 3 wt% with demineralised
water. WPI aggregates-stabilised emulsions were used for the preparation of filled WPI
gels.
The droplet size distribution of the obtained emulsions was measured using a
Malvern Mastersizer 2000 (Malvern Instruments Ltd., Malvern, UK). The droplet volume-
surface average or Sauter diameter (d3,2) and other characteristics of the emulsions used
for the preparation of the filled gels are reported in Table 8.1.
190
Lubrication properties
Table 8.1 - Volume-surface average diameter (Sauter diameter) and pH of the emulsions used for
the preparation of the filled gels.
mulsifier in the water phase d3,2
( m)
pH E
wt% WPI 1.15 7.06 1
2 wt% Tween 0.10 4.30
2 wt% Lactoferrin 1.85 5.10
3 wt% WPI aggregates 1.45 6.64
8.2.2.2 Gels
Gelatine (4 wt%) and WPI (3 wt%) gels were prepared in demineralised water. Kappa-
carrageenan (0.6 wt%) gels were prepared in a 30 mM KCl solution. Samples were
prepared without emulsion and with different oil concentrations (5, 10 and 20 wt%). In all
samples the concentration of the gelling agent in the aqueous phase was kept constant.
To obtain efficient dissolution of -carrageenan and gelatine, the gelling agent was
first allowed to hydrate for 2 hours under gentle stirring at room temperature. The samples
were subsequently dissolved by heating at 80°C for 30 minutes and cooled to 45°C. For -
carrageenan gels, prior to emulsion addition the emulsion was heated to 45°C before
mixing. For gelatine gels, the gelling agent solution was allowed to cool to 20°C prior to
mixing with the emulsion. This procedure was applied to prevent depletion flocculation of
the emulsion droplets before gel formation (Sala et al., 2007). After mixing, the samples
were allowed to gel at room temperatures in 60 ml plastic syringes (internal diameter 26.4
mm).
Gelation of the WPI gels was induced by addition of GDL (0.22 wt% in the case of
WPI aggregates dispersion with a concentration of 3 wt%) to the WPI dispersion and to
the WPI dispersion/emulsion mix and incubation at 25°C for 17 hours. The final pH of the
gels was about 4.8. The WPI dispersion was prepared as described above.
8.2.3 Friction measurements
The lubrication properties of emulsifier solutions, emulsions and sheared gels were
measured between two rotating surfaces in a Mini Traction Machine (MTM, PCS
191

Chapter 8
Instruments, London). A low contact pressure was assured by the selection of deformable
materials: a neoprene ring and a silicone disk (Chojnicka, Visschers & de Kruif,
Submitted). Figure 8.1 shows a schematic representation of the MTM tribometer.
Sample
Silicone or
neoprene
steel
Figure 8.1 - Experimental setup for the friction measurements consisting of two essential parts: a
neoprene ring and steel disk with a silicone sheet on the top. The dotted area represents the rubber
surfaces in contact with each other. These surfaces are the source of friction.
Relevant physical parameters for friction measurements are the normal load (the
force pressing the rubber ring against the disk), the temperature of the system, the
tangential (entrainment) speed of the two rotating surfaces at the contact point and the
slide to roll ratio, defined as
U
UUSRR
ringdisk (8.2)
where the Udisk is the mean tangential speed of the disk, Uring that of the ring and U the
mean tangential speed at the contact between the surfaces. These physical parameters can
be varied in the MTM tribometer.
The friction force was then measured as a function of the applied entrainment speed.
In order to mimic oral relevant conditions, the mean speed of the ring and the disc was
kept in a range between 10 and 100mm/s. As commonly used in literature, the SRR of 50
% was applied, which corresponds to a mixed rolling-sliding contact. This type of contact
was chosen to minimize possible wear damage to the soft surfaces. The temperature was
set to 37°C ( 1 C) degrees, as present in the human mouth, while the normal load was
chosen to be 3 and 5N. Since only a part of the Stribeck curve was recorded, the results
will be referred to as friction curves. For gelatine gels friction measurements were also
192

Lubrication properties
carried out at 20°C. Before each experiment all the rubbers were cleaned with an ethanol,
demineralised water and dried with compressed air.
For all systems studied the tribometer reservoir was filled to assure that the lubricant
was present between the rotating surfaces. Measurements were carried out in triplicate.
8.2.4 Rheological measurements
The ‘apparent viscosity’ of the gels broken by forcing them out of the syringe in which
they were prepared was measured at 37°C using a standard rheometer (AR 2000, TA
Instruments, Leatherhead, UK) with a vane geometry. For gelatine gels also measurements
at 20°C were carried out. The vane had four blades, a diameter of 28 mm, a height of 42
mm and was used in combination with a cylindrical shaped cup with a diameter of 70 mm.
After lowering the vane into the broken gel, rotating movements were applied. The
‘apparent viscosity’ was measured at steady shear rate as a function of time. The
experiments were done with two steps. First, a step at a shear rate of 10 s-1
was applied
during 2 minutes. Then a step at a of shear rate 100 s-1
followed during 5 minutes. The
data collected at a shear rate of 100 s-1
were used for analysis.
8.2.5 Confocal Laser Scanning Microscopy (CLSM)
The microstructure of the emulsion-filled gels was visualised with Confocal Laser
Scanning Microscopy. Observations were made on the gels before and after friction
measurements as well as on the silicone rubber used. To visualise the protein phase the
unbroken gels were stained with Rhodamine B (0.2 wt% solution; 10 µL per mL sample).
With this staining agent the oil droplets are visualised as holes within the protein matrix.
After the friction measurements a combination of Fluorescein isothiocyanate with Nile
Red (FITC/NR) was used to stain the protein and oil phases, respectively. Nile Blue was
chosen as a staining agent of the oil droplets in order to specifically reveal possible
coalescence or aggregation. CLSM-images were recorded on a LEICA TCS SP Confocal
Laser Scanning Microscope (Leica Microsystems CMS GmbH., Manheim, Germany),
equipped with an inverted microscope (model Leica DM IRBE), used in the single photon
mode with an Ar/Kr visible light laser. A Leica objective lens (63x/UV/1.25NA/water
immersion/PL APO) was used. The excitation wavelength was set at 568 nm for
Rhodamine B and Nile Red, and at 488 nm for FITC and Nile Blue. Digital image files
were acquired in tagged image file format and at 1024x1024 pixel resolution.
193

Chapter 8
8.3 Results
The aim of the work was to establish the link between the lubrication properties of
emulsion-filled gels and their composition and structure. To achieve this goal, the
contribution of all components of the gel systems to the lubrication properties of the filled
gels had to be studied. Therefore, lubrication measurements were carried out on the
individual components of the gel. For both the emulsions and the gels the effect of the oil
concentration on lubrication properties was studied. Furthermore, in order to simulate oral
conditions the role of saliva in the lubrication behavior of all systems was studied.
8.3.1 Lubrication properties of the emulsions
Figure 8.2 shows the friction coefficient as a function of the entrainment speed for the
WPI stabilized emulsion and its components. Clear differences between friction
coefficients of the different systems were observed. A mixed lubrication regime was
observed for water, the WPI solution and the 10 wt% emulsions for the whole range of the
speeds measured. The friction coefficient of the solution of the emulsifying agent was
about 0.2 lower than that of water. Ten wt% oil in the emulsion remarkably improved the
lubrication properties compared to the emulsifying agent. At oil concentrations above 10
wt% friction weakly depended on oil concentration and an increase of the oil
concentration up to 40 wt% led to only a slight decrease of the friction coefficient. At this
oil concentration the hydrodynamic regime appeared to dominate over the whole range of
speeds. In the hydrodynamic regime the lubrication properties are determined by the oil
droplets entering the contact zone. When MCT oil was used as a lubricant the lubrication
behaviour was about the same as that measured for the emulsion with 40 wt% oil. This
suggests that this oil concentration is sufficient to achieve the same lubrication properties
of MCT oil. For the other emulsifying agents the friction curves of their solutions and of
the emulsions were comparable to those shown in Figure 8.2 (results not shown).
194

Lubrication properties
0
0.2
0.4
0.6
0.8
1
1.2
1.4
1.6
1 10 100
Mean speed (mm/s)
Fric
tio
n c
oeff
icie
nt
Figure 8.2 – Friction curves of the components of WPI stabilised emulsions (X: water; : solution
1 wt% WPI; emulsion with 10 wt% oil : emulsion with 40 wt% oil; : MCT oil; Load: 3 N).
In Figures 8.3.A and 8.3.B the friction coefficients for the different emulsions are
plotted as a function of the oil concentration at the entrainment speeds of 10 and 100
mm/s, respectively. For all emulsions the emulsifying agent solutions had higher friction
coefficients compared with the emulsions in which they were used. For the protein
solutions (WPI, WPI aggregates and lactoferrin), the friction coefficient at an entrainment
speed of 10 mm/ s was 1.2, while that of the solution of 2 wt% Tween 20, which is a
synthetic surfactant, was 0.4. For almost all the emulsions with an oil content of 10 wt%, a
large decrease of the friction coefficient (to ~ 0.4) compared to the emulsifying agent
solutions was observed. The emulsion stabilised by 3 wt% WPI aggregates showed higher
friction (~ 0.8) than the emulsions stabilised by the other emulsifying agents. For all types
of emulsion, an increase of the oil concentrations up to 40 wt% yielded lower values of the
friction coefficient, comparable to that obtained for MCT oil. The lubrication properties of
the emulsion at low oil concentration appear to be determined by both the emulsifying
agent and the oil droplets concentration. On the other hand, at high oil concentration these
properties appear to be only affected by the oil droplets. For both speeds a similar
behaviour was observed. However, friction was lower at higher velocity as is expected for
a mixed lubrication regime.
195

Chapter 8
0
0.2
0.4
0.6
0.8
1
1.2
1.4
0 10 20 30 40 50
Oil concentration (g/ 100 g)
Fric
tio
n c
oeff
icie
nt
0
0.2
0.4
0.6
0.8
1
1.2
1.4
0 10 20 30 40 50
Oil concentration (g/ 100 g)
Fric
tio
n c
oeff
icie
nt
A B
Figure 8.3 – Friction coefficient vs. oil concentration for emulsions stabilised by different
emulsifying agents and for MCT oil ( : 1 wt% WPI; 3 wt% WPI aggregates; : 1 wt%
lactoferrin; : 2 wt% Tween 20. The dashed line represents the friction coefficient of pure MCT
oil. Load: 3 N. A: Entrainment speed= 10 mm/s; B: Entrainment speed= 100 mm/s).
Table 8.2 shows the effect of the saliva on the friction coefficient of the four different
emulsions with 40 wt% oil, stabilized by different emulsifying agents at 10 and 100mm/s.
Differences in friction coefficient between the emulsions could be only observed at low
speed. No significant differences were observed between the systems with 7 wt% water
and those with the same amount of saliva. It seems evident that saliva does not affect
friction. An exception was the lactoferrin-stabilised emulsion, for which the friction
coefficient with saliva was 30% lower compared to that for the emulsions with added
water. In this case complexation between lactoferrin, which is positively charged at the pH
of the emulsion, and the negatively charged mucins present in saliva might occur. This can
lead to aggregation of emulsion droplets caused by saliva addition, as reported by Silletti
et al. (2007). Aggregation of oil droplets could decrease friction by two different
mechanisms. It could either result in an increase of the effective viscosity of the emulsion
or facilitate the entrance of the oil droplets into the contact zone between disk and ring.
196

Lubrication properties
Table 8.2 – Effect of water and saliva on friction coefficient in emulsions with 40 wt% oil and
stabilised by different emulsifying agents (entrainment speeds: 10 and 100 mm/s).
Entrainment speed
Emulsifying agent10 mm/s 100 mm/s
7 wt% water 7 wt% saliva 7 wt% water 7 wt% saliva
1% WPI 0.23 0.25 0.14 0.15
3% WPI 0.20 0.21 0.11 0.12
1%lactoferrin 0.29 0.19 0.16 0.10
2% Tween 0.15 0.19 0.12 0.16
8.3.2 Lubrication properties of the gels without oil
In a preliminary phase of the study, the gels were allowed to gel on top of the silicon disc
used in the MTM tribometer for friction measurements. Following this procedure only 5
ml of the sample could be used for measurement. In this case the gelled samples were
destroyed by the rotating surfaces within a few seconds from the beginning of the
measurements. The destruction of the gels was uncontrolled and part of the samples fell
off the disc. As a consequence, the rotating surfaces were not constantly in contact with
the lubricant. Therefore, a technique to break the gel in a controlled way was optimised.
The gels were prepared in syringes with a capacity of 60 ml. Prior to friction
measurement, the emulsion-filled gels systems were destroyed by pushing them out of the
syringe in which they were prepared. The destroyed gels consisted of thick, viscous,
pourable fluids. The homogeneity of these fluids was only visually evaluated and varied
with the type of gel matrix. Before starting the friction measurements a quantified amount
of destroyed gel was spread on the top of the silicone disc placed in the tribometer.
The friction curves of the three gel matrices without oil droplets are shown in Figure
8.4. The friction curve of gelatine was lower than those of -carrageenan and WPI. The
temperature of 37°C was applied during these measurements to mimic oral conditions.
Since at this temperature gelatine gels were melted, for these gels friction measurements
were carried out also at 20°C, at which they were not melted. For gelatine gels the friction
coefficient measured at 20°C was only slightly lower that that measured at 37°C. At 20°C
gelatine gels broke down into a highly homogeneous material. Consequently, the
197

Chapter 8
lubrication behaviour of gelatine gels without oil droplets is only partially related to their
physical state (melted/ gelled).
0
0.2
0.4
0.6
0.8
1
1.2
1.4
1 10Mean speed [mm/s]
Fric
tio
n c
oeff
icie
nt
100
Figure 8.4 – Friction curves of the three gel matrices studied ( :WPI; : gelatine 37°C; :
gelatine 20°C; -carrageenan; Load: 3 N).
Broken -carrageenan and WPI gels were visually less homogenous, resulting in a large
variation in the distribution of the gel particles. The latter sample (WPI) broke down into
relatively large pieces and serum was released. In this sample, the lubrication properties
were probably dominated by the exuded water phase with small pieces of broken down
gel, whereas large gel particles were not entering the contact zone between the two
rotating parts. As a result, WPI gels had the highest friction coefficient compared to the
two other systems. Compared to WPI, the -carrageenan gels broke down into more
defined and homogenous structures, which may explain the lower friction coefficient.
8.3.3 Lubrication properties of the filled gels
The presence of oil droplets in the gel matrix remarkably affected the lubrication
behaviour of the gels. For gelatine gels, the effect of the oil droplets on lubrication
properties was temperature-dependent. For gels containing oil droplets, the friction
coefficient as measured at 100 mm/s and at 37°C was lower than that of gels without oil
only in systems containing the emulsion stabilised by Tween 20, i.e. gels with unbound
droplets (Figure 8.5). For these gels the friction coefficient decreased to 0.15 at 5 wt% oil
198

Lubrication properties
and remained approximately constant with a further increase of the oil content. No effect
of the presence of oil droplets was observed for the gelatine gels containing the 1 wt%
WPI-stabilised emulsion (gels with bound droplets); a friction coefficient of 0.4 was found
for all gels. During the measurement, gelatine gels both with bound and unbound droplets
were melted, resulting in a homogenous, emulsions-like fluids. The observed results
suggest that under these conditions the gelatine matrix determines the lubrication. The
melted gelatine, due to its very sticky properties, may form a film between the surface of
the disk and that of the ring, masking the effect of the emulsion droplets. No effect on the
friction of the water or saliva was observed for the gelatine gels. Friction measurements
performed at 20°C showed a gradual decrease of the friction coefficient of gelatine gels
containing the WPI-stabilised emulsion (bound droplets, Figure 8.6). For gelatine gels
containing the Tween-stabilised emulsion (unbound droplets) no effect of temperature on
friction was observed (Figure 8.6).
0
0.2
0.4
0.6
0.8
1
1.2
1.4
0 5 10 15 20 25
Oil concentration (g/ 100 g)
Fric
tio
n c
oeff
icie
nt
0
0.2
0.4
0.6
0.8
1
1.2
1.4
0 5 10 15 20 25
Oil concentration (g/ 100 g)
Fric
tio
n c
oeff
icie
nt
A B
Figure 8.5 – Friction coefficient vs. oil concentration for gelatine gels ( ) with either bound (A) or
unbound (B) droplets and for the same gels after addition of either 7 wt% water ( ) or 7 wt%
saliva ( ). Measurements temperature: 37°C. (Entrainment speed: 100 mm/s; Load: 3 N).
199

Chapter 8
0
0.2
0.4
0.6
0.8
1
0 5 10 15 20 25
Oil concentration (g/ 100 g)
Fric
tio
n c
oe
ffic
ien
t
Figure 8.6 – Friction coefficient vs. oil concentration for gelatine gels with either bound ( ) or
unbound ( ) droplets and at two different temperatures. (Open symbol: 37°C; filled symbol: 20°C)
(Entrainment speed: 100 mm/s; Load: 3 N).
For -carrageenan gels, a significant decrease of the friction coefficient to 0.2 was
observed already at 5 wt% oil (Figure 8.7). Further increase of the oil concentration did
not affect the friction coefficient. For both gels with bound and unbound droplets no effect
on friction was observed of dilution with 7 wt% water or saliva. Both the emulsions
stabilised by lactoferrin and 1 wt% WPI showed a friction coefficient of about 0.2 already
at 10 wt% oil (Figure 8.3). This value of the friction coefficient is comparable to that of
the -carrageenan filled gels. Figure 8.7 shows that for -carrageenan the interactions
between droplets and matrix do not have an effect on lubrication.
200

Lubrication properties
0
0.2
0.4
0.6
0.8
0
0.2
0.4
0.6
0.8
1
1.2
1.4
0 5 10 15 20 25
Oil concentration (g/ 100 g)
Fric
tio
n c
oeff
icie
nt
1
1.2
1.4
0 5 10 15 20 25
Oil concentration (g/ 100 g)
Fric
tio
n c
oeff
icie
nt
A B
Figure 8.7 – Friction coefficient vs. oil concentration for -carrageenan gels ( ) with either bound
(A) or unbound (B) droplets and for the same gels after addition of either 7 wt% water ( ) or 7
wt% saliva ( ). (Entrainment speed: 100 mm/s; Load: 3 N).
Figure 8.8 shows the effect of the oil concentration on the friction coefficient of WPI
gels. These gels contain emulsions stabilized by 3 wt% WPI aggregates, which lead to oil
droplets bound to the matrix. A small amount of oil (5 wt%) present in the gel did not
improve the lubrication properties significantly with respect to the gel matrix without the
oil (~ 1.1). However, at oil concentrations above 5 wt% a gradual decrease of the friction
coefficient was observed. At 20 wt% oil a friction coefficient of 0.2 was reached. For the
emulsion stabilised by 3 wt% WPI aggregates this value of the friction coefficient was
obtained at 40 wt% of oil concentration (Figure 8.3). This suggests that a synergy between
gel matrix and emulsion droplets may exist, lowering the lubrication properties of these
gels with increasing oil concentration. As compared to gelatine and -carrageenan gels,
the friction coefficient observed for WPI gels at any oil concentration below 20 wt% is
higher.
201

Chapter 8
0
0.2
0.4
0.6
0.8
1
1.2
1.4
0 5 10 15 20 25Oil concentration (g/ 100g)
Fric
tio
n c
oeff
icie
nt
Figure 8.8 – Friction coefficient vs. oil concentration for WPI gels with bound droplets ( ) and for
the same gels after addition of either 7 wt% water ( ) or 7 wt% saliva ( ) (Entrainment speed:
100 mm/s; Load: 3 N).
8.3.4 Rheological properties of the broken gels
The behaviour of lubricants in the mixed and hydrodynamic regime are known to be
related to their viscosity. Higher viscosity values usually correspond to lower friction
coefficients. In order to ascertain whether this holds also for broken emulsion-filled gels,
the ‘apparent viscosity’ of the broken gels was measured with a rheometer using a vane
geometry. Figure 8.9 shows the ‘apparent viscosity’ of -carrageenan gels with different
oil concentrations at fixed shear rate. A slight decrease of the ‘apparent viscosity’ in time
was observed in this case as well as for all the other gels. This was attributed to the
breakdown of the gel structure during measurement. To standardise the results, the
‘apparent viscosity’ values at a shear rate of 100/s and at 100 seconds were therefore taken
as measure. The measurements at a shear rate of 100/s were more reproducible than at
lower shear rate. The relative differences in ‘apparent viscosity’ observed at 100 seconds
between samples with different oil content remained constant in time.
202

Lubrication properties
0
0.1
0.2
0.3
0.4
0.5
0.6
0.7
0.8
0 100 200 300 400
Time (s)
Vis
co
sit
y (
Pa s
) 20 wt%
10 wt%
5 wt%
0 wt%
0
0.1
0.2
0.3
0.4
0.5
0.6
0.7
0.8
0 100 200 300 400
Time (s)
Vis
co
sit
y (
Pa s
) 20 wt%
10 wt%
5 wt%
0 wt%
Figure 8.9 – ‘Apparent viscosity’ of broken -carrageenan gels with bound droplets at different oil
concentrations ( : 0 wt% oil; : 5 wt% oil; : 10 wt% oil x: 20 wt% oil) (Shear rate 100/s).
The effect of the oil concentration on the ‘apparent viscosity’ of the broken gel
depended on the interactions between oil droplets and gel matrix. For -carrageenan and
WPI gels with bound droplets, an increase of the ‘apparent viscosity’ was observed with
increasing oil concentration (Figure 8.10A). For gelatine gels, the effect of the oil
concentration was temperature dependent. When the ‘apparent viscosity’ was measured at
37°C gelatine gels were melted. Under these experimental conditions very low viscosities
and no effect of the oil concentration were observed (Figure 8.10 B). When the
measurements were performed at 20°C, the ‘apparent viscosity’ of broken gelatine gels
with bound droplets increased with increasing oil concentration (Figure 8.10B). For gels
with unbound droplets increasing the oil concentration above 5 wt% did not affect
‘apparent viscosity’ (Figure 8.10). For -carrageenan gels with unbound droplets, the
‘apparent viscosity’ of the filled gels was higher than that of the gel without oil droplets
(Figure 8.10A). For gelatine gels with unbound droplets, the ‘apparent viscosity’ of the
filled gels was lower than that of the gel without oil droplets (Figure 8.10B). For these
gels, only a slight decrease was observed with increasing the oil concentration from 10 to
20 wt%. This is possibly related to an increasing concentration of Tween in the gel. This
emulsifier is likely to perform a lubricating action between the gel particles present in the
mass of the broken gel, decreasing the adhesion and cohesion forces.
203

Chapter 8
0
0.1
0.2
0.3
0.4
0.5
0.6
0 5 10 15 20 25
Oil concentration (g/ 100 g)
Vis
co
sit
y (
Pa s
)
0
0.4
0.8
1.2
1.6
2
2.4
0 5 10 15 20 25
Oil concentration (g/ 100 g)
Vis
co
sit
y (
Pa s
)
A B
Figure 8.10 – ‘Apparent viscosity’ of the broken gels vs. oil concentration. A: WPI gels with
bound droplets ( ) and -carrageenan gels with bound ( ) and unbound ( ) droplets. B: gelatine
gels with bound ( ) and unbound (X) droplets; measurements performed at 37°C (dotted line) and
20°C (solid line) (Shear rate 100/s).
8.3.5 Effect of shearing on microstructure of filled gels
The microstructure of the gels studied in this work has already been described in the
previous chapters (Sala et al., 2007; Sala et al., Submitted-a). In gelatine and WPI gels the
oil droplets were non-aggregated, whereas in -carrageenan gels, independently on the
droplet-matrix interaction, the oil droplets were aggregated.
Possible changes in the microstructure of the gels as a result of the friction
measurements, with particular attention to the coalescence of the oil droplets, were studied
by CLSM microscopy. CLSM images were taken for each gel before and after friction
measurements. Furthermore, the silicon discs used in the friction measurements were
searched for traces of free oil, which could results from coalescence of the oil droplets
during measurements. Migration of the oil droplets within the broken down gels was
observed for gels with unbound droplets (Figure 8.11). Nevertheless, by CLSM
microscopy no coalescence could be observed (Figure 8.11).
204

Lubrication properties
Before After
A
Before After
B
Figure 8.11 - CLSM images of k-carrageenan gels with either bound (A) or unbound (B) droplets,
before and after friction measurement (5 wt% oil; image size 39.7 X 39.7 m).
8.4 Discussion
The lubrication properties of the oil in water emulsions used in this study are in agreement
with the results of Vicente et al. (2006) for oil in water (O/W) emulsions. Vicente et al.
(2006) studied the lubrication properties of oil-in-water emulsions in a steel-soft elastomer
contact. They found that lubrication is determined by the ratio of the viscosities of the two
phases. If the viscosity of the oil is at least 4 times larger than the viscosity of the
dispersion medium, the oil droplets enter the contact zone and dominate the lubrication
properties. Otherwise the friction is controlled by the aqueous phase. The viscosity of
MCT oil is about 5 mPa s, i.e. about 5 times the viscosity of the water phase of the
emulsions. The large decrease of the friction coefficient observed in this study already at
205

Chapter 8
an oil concentration of 10 wt% shows that also in the systems studied here the oil droplets
enter the contact zone between the silicone disc and the neoprene ring, affecting the
lubrication behaviour of the emulsions. The agreement between our results and those of
Vicente et al. (2006) holds, in spite of the difference in experimental conditions. In our
study a silicone-neoprene contact was chosen, while Vicente et al. worked with a steel-soft
elastomer contact.
The limited decrease of friction coefficient with increasing oil concentration above
10 wt% is in agreement with the results reported also by de Hoog et al. (de Hoog, Prinz,
Huntjens, Dresselhuis & van Aken, 2006). In this study a custom-made friction apparatus
was used with materials with different surface properties like glass, rubber, pig’s tongue
surfaces. The authors showed that when mucosal surfaces were used and in the range of
oil concentration between 10 and 40 wt% the friction coefficient of emulsions stabilised
by WPI did not depend on the oil concentration. Furthermore, the surface characteristics
were shown to have a large effect on friction.
The different emulsifying agents showed different lubrication behaviours. As
compared to proteins, the friction coefficient of the 2 wt% Tween solution and of
emulsions stabilised by this surfactant were in general lower (Figure 8.3). Tween 20 is
more active in decreasing the surface tensions of systems in which it is contained and
might interact with the rubber surfaces and modify them through adsorption. Furthermore,
Tween 20 forms micelles already at concentrations above 0.007 wt% (Malik & Jhamb,
1970). Therefore, at the concentration used in our work this surfactant is present as
micelles. This could effectively lower friction for all Tween-stabilised emulsions within
the whole range of speeds.
The lubrication properties of different gel matrices without oil droplets are likely to
be governed by several factors, like the molecular properties of the gelling agent and the
homogeneity of the broken gel. For WPI gels (Figure 8.4), which show relevant water
phase exudation, the friction is high and is described by two different lubrication regimes.
Up to a speed of 25 mm/s no effect of the speed on the friction coefficient is visible. This
by definition implies that friction is in the boundary regime. At higher speed the friction
coefficient starts to decrease with increasing speed, indicating the beginning of the mixed
regime. For -carrageenan gels, which break down to a more homogeneous material, a
continuous decrease of the friction coefficient with increasing speed is observed,
indicating a mixed regime over the whole range of speeds. The shape of the friction curve
206

Lubrication properties
of gelatine gels, as measured at 20°C, indicates two lubrication regimes in the speed range
studied, as described for WPI gels. The lower friction coefficient observed for gelatine
gels as compared to WPI gels is probably due to the higher homogeneity, the fluid-like
behaviour and the adhesiveness of broken gelatine gels.
For all gel matrices, the mixed regime of lubrication was observed. Therefore, the
bulk rheological properties of the lubricant will partly affect friction. For this reason, the
relation between friction coefficient and ‘apparent viscosity’ of the broken gels was
studied. When comparing the results for the different matrices, it is clear that the ‘apparent
viscosity’ of the broken gel is not the only factor determining the lubrication properties
(Figure 8.11). The ‘apparent viscosity’ of broken gelatine gels is several times higher than
that of WPI gels. Nevertheless, for gels with 20 wt% oil similar friction coefficients are
observed.
When considering the effect of the oil concentration for each individual types of
gels, the effect of ‘apparent viscosity’ on friction and the dependence of this effect on the
interaction between oil droplet and gel matrix can be clearly observed (Figure 8.12). For
gels with bound droplets, the ‘apparent viscosity’ increases with increasing oil
concentration and the friction coefficient decreases with increasing ‘apparent viscosity’.
For these gels, the observed increase in ‘apparent viscosity’ with increasing oil
concentration is related to the increase in gel modulus (i.e. lower deformability of the
particles) (Sala et al, 2007; Sala et al., Submitted-a) and to a different breakdown pattern.
With increasing oil concentration, the increase in modulus results in particles of the
broken gels with higher stiffness. Furthermore, with increasing oil concentration gels with
bound droplets become more brittle and break down in smaller pieces, resulting in a more
homogenous mass. For gels with unbound droplets, no effect of the oil concentration
above 5 wt% on ‘apparent viscosity’ was observed (Figure 8.10). Furthermore, for these
gels no relationship was observed between friction coefficient and ‘apparent viscosity’
(Figure 8.12). This is likely related to the effect of oil concentration on gel modulus and
breakdown properties. For these gels, increasing the oil concentration results in a decrease
of the gel modulus and has only a minor effect on gel brittleness. Therefore, increasing oil
concentration is likely to only slightly affect the homogeneity of the broken mass.
207

Chapter 8
0
0.2
0.4
0.6
0.8
1
1.2
1.4
0 0.5 1 1.5 2
Viscosity (Pa s)
Fric
tio
n c
oeff
icein
t
Figure 8.12 – Friction coefficient vs. ‘apparent viscosity’ of the broken gels ( : gelatine gels with
bound droplets; X: gelatine gels with unbound droplets; : -carrageenan gels with bound
droplets; : -carrageenan gels with unbound droplets; : WPI gels with bound droplets. For
gelatine gels both ‘apparent viscosity’ and friction coefficient were measured at 20°C, whereas for
-carrageenan and WPI gels these measurements were carried out at 37°C. (Entrainment speed
100 mm/s; Load: 3 N; Shear rate 100/s).
The effect of the oil concentration on ‘apparent viscosity’ is not the only factor
explaining the large decrease in friction coefficient observed for gels containing oil
droplets, as compared to the gels without oil. For gels with bound droplets, oil droplets
present in the smallest gel pieces will affect friction like it happens for emulsions. For gels
with unbound droplets, also free droplets will be present in the mass of broken gel (Sala et
al., 2007). These droplets can affect friction directly. The lubrication properties of gels
with unbound droplets are likely to be determined by the individual contribution of gel
matrix and released oil droplets. The overall effect of the oil droplets on friction does not
appear different between gels with bound droplets and gels with unbound droplets. The
lower friction coefficient of gelatine gels with unbound droplets as compared to gelatine
gels with bound droplets is likely to be related to the effect of Tween 20.
In chapters 4 and chapter 7 we showed that the scores for mouthfeel attributes
related to the presence of oil droplets in the gel matrix (e.g. creamy and fatty) increase
with increasing oil concentration for gels with both bound and unbound droplets. The
similarity of the lubrication properties of gels with bound and unbound droplets is in
agreement with these findings. A relationship between the lubrication properties of broken
gels and the perception of sensory attributes related to the presence of oil droplets in the
gel matrix can be hypothesised.
208

Lubrication properties
8.5 Conclusions
The lubrication behaviour of gels is largely determined by the molecular and functional
properties of the gelling agent. The inclusion of oil droplets in the gel matrix remarkably
changes the lubrication properties of the gels. These changes depend on the droplet-matrix
interactions. The changes observed for gels with bound droplets are related to the increase
in ‘apparent viscosity’ of the broken gel mass. For gels with unbound droplets the
decrease of the friction coefficient is likely to be the result of the individual contribution
of gel matrix and released oil droplets. In spite of the two different mechanisms, the
overall effect of the oil droplets on friction does not remarkably differ between gels with
bound droplets and gels with unbound droplets, which is in agreement with findings of
sensory studies on this type of systems described in chapter 7.
8.6 References
Aguilera, J. M. & Kinsella, J. E. (1991). Compression strength of dairy gels and microstructural
interpretation. Journal of Food Science, 56(5), 1224-1228.
Cassin, G., Heinrich, E. & Spikes, H. A. (2001). The influence of surface roughness on the
lubrication properties of adsorbing and non-adsorbing biopolymers. Tribology Letters,
11(2), 95-102.
Chen, H. S., Moschakis, T. & Nelson, P. (2004). Application of surface friction measurements for
surface characterization of heat-set whey protein gels. Journal of Texture Studies, 35(5),
493-510.
Chojnicka, A., Visschers, R. W. & de Kruif, C. G. Lubrication properties of protein aggregates
dispersion in a soft contact, submitted for publication.
de Hoog, E. H. A., Prinz, J. F., Huntjens, L., Dresselhuis, D. M. & van Aken, G. A. (2006).
Lubrication of oral surfaces by food emulsions: the importance of surface characteristics.
Journal of Food Science, 71(7), E337-E341.
de Vicente, J., Spikes, H. A. & Stokes, J. R. (2006). Viscosity ratio effect in the emulsion
lubrication of soft EHL contact. Journal of Tribology-Transactions of the Asme, 128(4),
795-800.
de Wijk, R. A. & Prinz, J. F. (2005). The role of friction in perceived oral texture. Food Quality
and Preference, 16(2), 121-129.
Jellema, R. H., Janssen, A. M., Terpstra, M. E. J., de Wijk, R. A. & Smilde, A. K. (2005). Relating
the sensory sensation 'creamy mouthfeel' in custards to rheological measurements. Journal
of Chemometrics, 19(3), 191-200.
209

Chapter 8
Kim, K.-H., Gohtani, S. & Yamano, Y. (1996). Effects of oil droplets in physical and sensory
properties of o/w emulsion agar gels. Journal of Texture Studies, 27, 655-670.
Kim, K.-H., Renkema, J.M.S. & Vliet, T. van (2001). Rheological properties of soybean protein
isolate gels containing emulsion droplets. Food Hydrocolloids, 15, 295-302.
Malik, W. U. & Jhamb, O. P. (1970). Critical Micelle Concentration of Some Polyoxyethylated
Non-Ionic Surfactants and Effect of Additives. Kolloid-Zeitschrift and Zeitschrift Fur
Polymere, 242(1-2), 1209-&.
Malone, M. E., Appelqvist, I. A. M. & Norton, I. T. (2003). Oral behaviour of food hydrocolloids
and emulsions. Part 1. Lubrication and deposition considerations. Food Hydrocolloids, 17,
763-773.
Sala, G., van de Velde, F., Cohen Stuart, M. A. & van Aken, G. A. (2007). Oil droplet release
from emulsion-filled gels in relation to sensory perception. Food Hydrocolloids, 21, 977-
985.
Sala, G., De Wijk, R. A., van de Velde, F. & van Aken, G. A. (2008). Matrix properties affect the
sensory perception of emulsion-filled gels. Food Hydrocolloids, 22, 353-363.
Sala, G., van Aken, G. A., Cohen Stuart, M. A. & van de Velde, F. (2007). Effect of droplet-
matrix interactions on large deformation properties of emulsion-filled gels. Journal of
Texture Studies, 38(4), 511-535.
Sala, G., van Vliet, T., Cohen Stuart, M. A., van Aken, G. A. & van de Velde, F. (Submitted-a).
Deformation and fracture of emulsion-filled gels. 1 Effect of oil content and deformation
speed.
Sala, G., van Vliet, T., Cohen Stuart, M. A., van Aken, G. A. & van de Velde, F. (Submitted-b).
Deformation and fracture of emulsion-filled gels. 2 Effect of gelling agent concentration
and oil droplet size.
Silletti, E., Vingerhoeds, M. H., Norde, W. & Van Aken, G. A. (2007). The role of electrostatics in
saliva-induced emulsion flocculation. Food Hydrocolloids, 21(4), 596-606.
van de Velde, F., Pereira, L. & Rollema, H. S. (2004). The revised chemical NMR shift data of
carrageenans. Carbohydrate Research, 339(13), 2309-2313.
Weenen, H., Terpstra, M., Janssen, A., Jellema, R. H., De Wijk, R., Prinz, J., De Jongh, H. & Van
der Linden, E. (2003a). Creaminess in mayonnaises: Rheology and oral coating. Abstracts
of Papers of the American Chemical Society, 226, U77-U77.
Weenen, H., Van Gemert, L. J., Van Doorn, J. M., Dijksterhuis, G. B. & De Wijk, R. A. (2003b).
Texture and mouthfeel of semisolid foods: Commercial mayonnaises, dressings, custard
desserts and warm sauces. Journal of Texture Studies, 34(2), 159-179.
210

Summary and conclusive remarks

Summary and conclusive remarks
This thesis reports studies on the large deformation and lubrication properties of emulsion-
filled gels, and the way these properties are related to the sensory perception of the gels.
Understanding sensory perception mechanisms related to the presence of emulsion droplets in
the gel matrix is of basic importance to produce foods with reduced fat but unchanged sensory
properties.
Many dispersions or solutions of gelling agents containing oil droplets show phase
separation phenomena caused by different physicochemical mechanisms and the preparation
of stable, homogenous systems is often difficult. Chapter 2 reports the optimisation of the
preparation of WPI emulsion-filled gels. For emulsions stabilised by native WPI, creaming
was observed upon mixing of the emulsion with a suspension of WPI aggregates, likely as a
result of depletion flocculation induced by the differences in size between the droplets and
aggregates. These systems resulted in non-homogeneous gels. Stable and homogeneous
emulsion-filled gels were prepared by cold gelation of emulsions stabilised by a suspension of
heat denatured WPI. This chapter describes also the rheological properties of these gels at
small and large deformation obtained in a first explorative investigation.
After developing a set of suitable model gels, the chosen approach was to firstly
investigate the effect of the oil droplets on the large deformation properties of the gels at
constant and relatively low deformation speed, as usually reported in literature. The selected
gels were gelatine, -carrageenan and WPI gels containing emulsion droplets stabilised by
various emulsifying agents, i.e. with varying interactions with the gel matrix. Chapter 3 deals
with the large deformation properties of these gels. For gelatine gels, depending on the
emulsifying agent used for emulsion stabilisation, the Young’s modulus either increased or
decreased. It was concluded that in the first case the oil droplets were bound to the gel matrix
and that in the latter case the oil droplets were unbound. For WPI gels, only filled gels with
bound droplets could be obtained. The variations of the Young’s modulus observed for -
carrageenan gels were mainly related to interactions between -carrageenan and the
emulsifying agent present in the aqueous phase. Theories based on the effect of the oil content
on modulus satisfactorily fitted the trend of the experimental results, both for bound and
unbound droplets. The fracture strain decreased with increasing oil content for bound droplets
and remained constant for unbound droplets, while the fracture stress was unaffected by
bound droplets and decreased in the case of unbound droplets. Theories describing the effect
of filler content on fracture strain and stress failed to predict the experimental results.
The role of gel matrix and oil content in the sensory perception of the model gels was
also studied. Chapter 4 reports the results of an explorative sensory study in which the
212

Summary and conclusive remarks
___________________________________________________________________________
selected model gels and / -carrageenan gels were characterised. The emulsion droplets were
homogeneously distributed in WPI gels, slightly aggregated in mixed / -carrageenan and
extensively aggregated in -carrageenan gels. For gelatine, gels with either non-aggregated or
aggregated emulsion droplets could be prepared by modifying the processing conditions. The
sensory properties of the gels were mainly controlled by the matrix. At increasing oil content
the perceived creaminess and spreadability of the samples increased. For gelatine, -
carrageenan and mixed / -carrageenan gels, i.e. for gels melting at the oral processing
temperature or containing unbound oil droplets, the creaminess scores were consistently
higher than for WPI gels, which were perceived as more rough. For gelatine gels, the
aggregation of the oil droplets had no effect on sensory perception. No relevant correlations
were found between the large deformation properties of the gels determined at constant
deformation speed and the sensory attributes.
In a successive phase of the work the effect of the deformation speed on the large
deformation properties of the gels was studied. The motivation of this choice was twofold: to
acquire a better knowledge on the effect of the oil droplets on the rheological properties of the
gels and to determine the large deformation properties of the gels at deformation speeds
similar to those observed during oral processing. Chapter 5 deals with the effect of
deformation speed on the large deformation and viscoelastic properties of the selected model
gels. The gelling agent concentration and the oil droplet size were kept constant. The
rheological properties of the gel matrices controlled the compression speed dependency of the
gels containing oil droplets. Polymer gels (gelatine and -carrageenan gels) showed a
predominantly elastic behaviour. Their Young’s modulus was not affected by the compression
speed. The increase of fracture stress and strain observed with increasing compression speed
was related to friction between the structural elements of the gels and, for gelatine, to the
unzipping of physical bonds. Particle gels (WPI gels) showed a more viscoelastic behavior.
Their Young’s modulus and fracture stress increased with compression speed. This was
attributed to the viscous flow of the matrix and friction phenomena between structural
elements of the gel. The effect of an increase in the oil volume fraction on the Young’s
modulus was for all gels according to the van der Poel theory. Oil droplets embedded in the
gel matrix acted as stress concentration nuclei and increased friction. The relative impact of
these two effects was related to the viscoelastic properties of the gels and to droplet-matrix
interaction. For polymer gels and gels with bound droplets stress concentration phenomena
played a relatively larger role. For viscoelastic gels and gels with unbound droplets friction
213

Summary and conclusive remarks
phenomena were relatively more important, increasing the viscoelastic character of the gels.
As a result, an increase in oil volume fraction resulted in a decrease of both fracture stress and
fracture strain for polymer gels and in an increase of the fracture stress for WPI gels.
Chapter 6 deals with the large deformation and viscoelastic properties of model gels
with constant oil content, but varying gelling agent concentration and oil droplet size. An
increase in the concentration of gelling agent resulted in denser gels with more bonds between
structural elements. This induced an increase of both Young’s modulus and fracture stress for
all gels. With increasing gelling agent concentration, polymer gels (gelatine and -
carrageenan) became less strain-hardening and the particle gels (WPI) even became strain-
weakening. The effect of a decrease in the oil droplet size on the Young’s modulus was
generally according to the van der Poel theory, unless when the oil droplets were aggregated.
Moreover, a decrease in oil droplet size induced a decrease of the fracture strain in gels with
non-aggregated bound droplets. The extent of these changes depended on the gelling agent
concentration. The effect of a decrease of the oil droplet size on other fracture parameters and
in other gel systems was minor. For gels with non-aggregated bound droplets, the effect of a
reduction of the oil droplets size on fracture properties resembled that observed with
increasing oil volume fraction. For these gels, a reduction in oil droplet size could mimic an
increase in oil volume fraction.
The droplet-matrix interactions were assumed to have an effect on the release of the
oil droplets from the gel matrix during oral processing. Therefore, a method to determine the
oil droplets release upon gel shearing was optimised and the behaviour of the oil droplets in
the different model gels was characterised. The role of oil droplet release on sensory
perception was investigated. These aspects are described in chapter 7 for the selected model
gels. At 20°C no release was observed for gels containing droplets bound to the matrix,
whereas the release measured for gels with unbound droplets related to the fat content and the
size of the gel particles obtained after shearing. For gels with bound droplets and melting at
the oral processing temperature, increasing the temperature of the determination to 37°C
resulted in an almost complete release of the oil droplets. An increase of the oil content
induced an increase of the creaminess scores for all gels. These scores were somewhat higher
for gels containing unbound droplets and gels melting at oral processing temperature. For
these gels, the oil droplet release appeared to correlate with creaminess. However, because a
similar increase in creaminess at increasing oil content was also found for gels with oil
droplets bound to the matrix, it was concluded that the release of oil droplets during oral
processing is not the main mechanism causing creaminess perception in emulsion-filled gels.
214

Summary and conclusive remarks
___________________________________________________________________________
After ascertaining the limited role of the release of oil droplets in sensory perception,
it was decided to study the lubrication properties of filled gels and the role played in these
properties by individual gel components and saliva. The results of this part of the work are
discussed in chapter 8. In this study the gels were sheared so as to resemble a broken gel
resulting from oral processing. When considering the emulsions used for gel preparation,
increasing the oil content resulted in a decrease of the friction coefficient. Emulsions with 40
wt% oil showed the same friction coefficient as the pure oil. The lubrication properties of the
gels strongly depended on the molecular properties of the gelling agent and on the breakdown
behaviour of the gel matrix. For each individual type of emulsion-filled gel, the lubrication
behaviour was affected by the droplet-matrix interactions between oil droplet and matrix. For
gels containing oil bound droplets, the friction coefficient gradually decreased with increasing
oil content. For gels containing unbound droplets, the friction coefficient of the filled gels was
lower than that of the same gel matrix without oil. However, no effect of the oil content on
friction was observed. The different effects of the oil content on the lubrication behaviour of
the different gels were explained with the relation between droplet-matrix interactions and
‘apparent viscosity’ of the broken gels. For gels with bound droplets increasing the oil content
resulted in an increase of the ‘apparent viscosity’ of the broken gel. For gels with unbound
droplets, the oil content did not affect viscosity. Confocal Laser Scanning Microscopy
(CLSM) observations of both emulsions and filled gels did not reveal coalescence of the oil
droplets as a result of the shear treatment during friction measurements.
The study of the large deformation properties of emulsion-filled gels described in this
thesis focused on the first fracture event occurring upon compression. The effect of the
droplet-matrix interactions on the ‘apparent viscosity’ of broken gels, observed when studying
the lubrication properties of these systems, indicates the relevance of the successive fracture
events for the properties of gels processed in the mouth. Gels with the same matrix and oil
content, but with different droplet-matrix interactions are broken down in the mouth into
systems with different rheological properties. The findings obtained in this thesis allow to
propose a mechanism relating the effect of the oil droplets on the first fracture event and the
properties of an extensively broken gel. With increasing oil content, gels with bound droplets
become more brittle and are likely broken down in smaller pieces, resulting in a more
homogenous mass, without visible large particles. Furthermore, with increasing oil content,
the increase in Young’s modulus gives particles of the broken gels with higher stiffness. As a
result, gels with bound droplets are fragmented into systems with a higher ‘apparent
215

Summary and conclusive remarks
viscosity’. For gels with unbound droplets, increasing the oil content causes a decrease of the
gel modulus and has only a minor effect on gel brittleness. Therefore, these gels are broken
down into less homogenous systems, containing larger, less stiff particles and with a lower
‘apparent viscosity’. Compared to gels without oil, gels containing both bound and unbound
droplets are fragmented in more homogeneous systems.
The sensory perception of emulsion-filled gels appears to be dominated by the
properties of the gel matrix and by the oil content. Polymer gels are perceived as more
melting, particle gels as more rough. With increasing oil content both types of gels become
more creamy and spreadable. These sensory attributes are positively correlated with each
other. The release of oil droplets during oral processing does not completely explain the
perception of oil-related sensory attributes. As a matter of fact, the sensory score for the
attribute creamy (and in certain cases fatty) also increases with increasing oil content when no
release of the oil droplets occurs. Since the friction coefficient of broken gels decreases with
increasing oil content for gels with both bound and unbound droplets, it can be concluded that
a part of the perception of these attributes is mediated by the lubrication properties of the
broken gel. The increase in spreadability, and therefore also a part of the increase in
creaminess, observed with increasing oil concentration can be explained by the mechanism
described above to relate the first fracture event of filled gels to the properties of extensively
fragmented gels. The increase in brittleness resulting from the presence of oil droplets in the
gel matrix yields upon oral processing more homogeneous fragmented gels compared to gels
without oil. Thus, the most important effect of the oil droplets embedded in the gel matrix is
the breakdown of the gel network, which in turn determines the sensory perception.
Concluding, the droplet-matrix interaction affects the fracture behaviour of the filled
gels, which determines their spreadability, and the ‘apparent viscosity’ of the broken gels. The
‘apparent viscosity’ partially controls the lubrication properties of these systems and thereby
the perception of creaminess and fattiness. In Figure 9.1 a summarising scheme is shown of
the links between the physicochemical mechanisms affecting the sensory perception of
emulsion-filled gels and the respective sensory attributes. To completely unveil the sensory
perception mechanism of emulsion-filled gels, future research should focus on the phenomena
relating the large deformation properties to the rheological properties of the broken gel, with
particular regard to fracture events following the first event, and to the effect of the size and
stiffness of the particles of the broken gel on ‘apparent viscosity’. The precise mechanism
relating the lubrication properties of the broken gels to sensory perception is not known yet.
Therefore, future research should also focus on this item.
216

Summary and conclusive remarks
___________________________________________________________________________
Effect on gel
properties
Physicochemical
mechanism
Effect on oral
processing
Sensory
attribute
More
spreadable
More creamy/
fatty
Decrease
fracture strain
Decrease
fracture stress(polymer gels)
Stress
concentration
Smaller gel
fragments
Weaker
fragments
Matrix
properties
Droplet/ matrix
interaction
‘Viscosity’
broken gel
Lubrication
properties
Oil droplet
release
Lower
friction
Material
properties
Droplet
properties
Figure 9.1 – Links between gels properties affecting the sensory perception of emulsion-filled gels
and the respective sensory attributes.
217


Samenvatting en slotopmerkingen
Samenvatting en slotopmerkingen
Dit proefschrift beschrijft een serie studies naar de mechanische eigenschappen onder grote
vervorming en de lubricatie-eigenschappen van emulsiegevulde gelen. Verder beschrijft dit
proefschrift de manier waarop deze eigenschappen gerelateerd zijn aan de sensorische
perceptie van de gelen. Kennis over het mechanisme van de sensorische perceptie van
emulsiegevulde gelen is van groot belang voor de productie van levensmiddelen met een
gereduceerd vetgehalte maar met onverminderde sensorische kwaliteiten.
In dispersies en oplossingen van geleringsmiddelen die oliedruppels bevatten treedt
vaak fasescheiding op, veroorzaakt door verschillende fysisch-chemische mechanismen. De
bereiding van stabiele, homogeen gevulde gelen is daarom niet eenvoudig. Hoofdstuk 2
beschrijft de optimalisatie van de bereiding van emulsiegevulde wei-eiwitgelen. Oliedruppels
gestabiliseerd door natief wei-eiwit gaven fasescheiding in suspensies van wei-
eiwitaggregaten, waarschijnlijk als gevolg van depletie-vlokking. Dit resulteerde in
heterogene gelen. Stabiele en homogene emulsiegevulde gelen werden bereid door verzuring
van emulsies gestabiliseerd door een suspensie van wei-eiwitaggregaten. In dit hoofdstuk
worden ook de rheologische eigenschappen van deze gelen beschreven bij zowel kleine als
grote vervorming.
Na de ontwikkeling van een set geschikte modelgelen werd deze onderworpen aan
grote vervorming teneinde het effect van de oliedruppels op de mechanische eigenschappen te
bestuderen. In navolging van gepubliceerde studies werd dit bij constante en relatief lage
vervormingsnelheid gedaan. De geselecteerde gelen waren gelatine, -carrageen and wei-
eiwitgelen met oliedruppels waarvan de interacties met de matrix gevarieerd werden door de
keuze van de emulgator. In Hoofdstuk 3 worden de mechanische eigenschappen onder grote
vervorming van deze gelen beschreven. Voor gelatinegelen nam de Young’s modulus soms
toe en soms af, al naar gelang de gebruikte emulgator. Een toename van de Young’s modulus
duidt op oliedruppels die gebonden zijn aan de gelmatrix. Uiteraard duidt een afname van de
Young’s modulus dan op oliedruppels niet gebonden aan de gelmatrix. Voor wei-eiwitgelen
konden alleen monsters met gebonden druppels worden bereid. De veranderingen in Young’s
modulus voor -carrageengelen waren voornamelijk gerelateerd aan interacties tussen -
carrageen en de emulgatoren in de waterfase. Verschillende theorieën gaven een correcte
voorspelling van het effect van de volumefractie olie op de Young’s modulus, voor zowel
gebonden als ongebonden druppels. Met een toename van het oliegehalte nam de vervorming
bij breuk af voor gebonden oliedruppels, maar bleef ongewijzigd voor ongebonden
oliedruppels. De spanning bij breuk werd niet beïnvloed door gebonden druppels en nam af
220

Samenvatting en slotopmerkingen
voor ongebonden druppels. Theorieën over het effect van deeltjes op vervorming en spanning
bij breuk bleken niet geschikt om deze experimentele resultaten te voorspellen.
De rol van gelmatrix en oliegehalte op de sensorische perceptie van de modelgelen
werd ook onderzocht. Hoofdstuk 4 beschrijft de resultaten van een studie naar de sensorische
eigenschappen van de bovengenoemde geselecteerde gelen en van kappa/iota ( / )-
carrageengelen. De oliedruppels waren gelijkmatig verdeeld in wei-eiwitgelen, licht
geaggregeerd in / -carrageengelen, en sterk geaggregeerd in -carrageengelen. Door
aanpassingen van de bereidingswijze werden gelatinegelen bereid waarin de oliedruppels niet-
geaggregeerd dan wel geaggregeerd waren. De gelmatrix bepaalde grotendeels de sensorische
eigenschappen van de gelen. Met een toename van het oliegehalte namen de romigheid en
smeerbaarheid toe. Voor gelatine-, -carrageen- en / -carrageengelen (met andere woorden,
voor gelen die bij lichaamstemperatuur smelten en/ of met ongebonden oliedruppels) waren
de scores voor romigheid consequent hoger dan voor wei-eiwitgelen, die als ruwer werden
waargenomen. Voor gelatinegelen had de aggregatie van oliedruppels geen effect op de
sensorische eigenschappen. Er werden geen relevante correlaties gevonden tussen sensorische
attributen enerzijds en mechanische eigenschappen onder grote vervorming bepaald bij
constante vervormingsnelheid anderzijds.
In het vervolg van het onderzoek werd het effect van de vervormingsnelheid op de
mechanische eigenschappen bestudeerd. Twee motieven bepaalden deze keuze. Ten eerste,
wilden we betere kennis te verwerven over het effect van oliedruppels op de rheologische
eigenschappen van de gelen. Ten tweede, wilden we de mechanische eigenschappen onder
grote vervorming bepalen, bij een vervormingsnelheid vergelijkbaar met die in de mond.
Hoofdstuk 5 bespreekt het effect van de vervormingsnelheid op de mechanische en visco-
elastische eigenschappen van de geselecteerde modelgelen. De concentratie van de
geleringsmiddelen en de grootte van de oliedruppel van de bestudeerde monsters werden
constant gehouden. De rheologische eigenschappen van de gelmatrix bepaalden hier het
effect van de vervormingsnelheid op de mechanische eigenschappen onder grote vervorming.
Polymeer gelen (gelatine- and -carrageengelen) vertoonden een elastisch gedrag. De
Young’s modulus werd niet beïnvloed door de vervormingsnelheid. De toename van de
spanning en de vervorming bij breuk bij een toename van de vervormingsnelheid konden
worden toegeschreven aan frictie tussen structurele elementen van de gelen. Voor
gelatinegelen kwam dit door de locale breuk van fysische bindingen. Deeltjesgelen (wei-
eiwitgelen) vertoonden een visco-elastisch gedrag. De Young’s modulus en de vervorming bij
breuk namen toe met de vervormingsnelheid. Dit werd toegekend aan de viskeuze stroming in
221

Samenvatting en slotopmerkingen
de matrix en aan frictie tussen structurele elementen van de gel. Het effect van een toename
van de volumefractie olie op de Young’s modulus kwam voor alle gelen overeen met de Van
der Poel-theorie. Oliedruppels in een gelmatrix (i) werken als stress-concentratiekernen en (ii)
verhogen frictie. Het relatieve belang van deze twee effecten was afhankelijk van de visco-
elastische eigenschapen van de matrix, en van de druppel-matrixinteractie. Voor
polymeergelen en gelen met gebonden druppels speelden stress-concentratieverschijnselen
een grotere rol. Voor visco-elastische gelen en gelen met ongebonden druppels was frictie
meer van belang, met als gevolg een toename van het visco-elastische karakter van de gelen.
Een toename van de volumefractie olie veroorzaakte vervolgens een afname van zowel
spanning als vervorming bij breuk voor polymeergelen en een toename van de spanning bij
breuk voor deeltjesgelen.
Hoofdstuk 6 bespreekt de mechanische en visco-elastische eigenschappen van
modelgelen met een constant oliegehalte, maar verschillende concentraties geleringsmiddelen
en groottes van de oliedruppels. Een toename van de concentratie geleringsmiddel resulteerde
in dichtere gelen met meer bindingen tussen structurele elementen. Dit veroorzaakte een
toename van zowel de Young’s modulus als de spanning bij breuk voor alle gelen. Met een
toename van de concentratie van geleringsmiddel werden polymeergelen minder ‘strain-
hardening’ en deeltjesgelen zelfs ‘strain-weakening’. Het effect van een afname van de
grootte van de oliedruppels was in het algemeen in overeenstemming met de Van der Poel-
theorie, tenzij de oliedruppels geaggregeerd waren. Een afname van de grootte van de
oliedruppel (bij gelijk oliegehalte) veroorzaakte verder een afname van de vervorming bij
breuk in gelen met niet-geaggregeerde gebonden druppels. De mate waarin dit effect optrad
was afhankelijk van de concentratie van het geleringsmiddel. Het effect van een afname van
de grootte van de oliedruppels op andere breukparameters en in andere systemen was gering.
Voor gelen met niet-geaggregeerde gebonden druppels leek het effect van een afname van de
grootte van de oliedruppels (bij gelijk oliegehalte) op dat van een toename van het oliegehalte
(bij contante druppelgrootte). Voor deze gelen kan een afname van de grootte van de
oliedruppels een toename van het oliegehalte nabootsen. Deze vinding is van groot belang
voor de ontwikkeling van nieuwe producten met verlaagd vetgehalte.
Eerste hypothesen over het mechanisme van de perceptie van emulsiegevulde gelen
gingen uit van een effect van de druppel-matrixinteracties op het vrijkomen van de
oliedruppels uit de gelen tijdens consumptie. Om dit te onderzoeken werd een methode
ontwikkeld om het vrijkomen van oliedruppels als gevolg van het vermalen van de gel te
kwantificeren. De rol van het vrijkomen van oliedruppels op de perceptie van de gelen werd
222

Samenvatting en slotopmerkingen
ook bestudeerd. Deze aspecten zijn in hoofdstuk 7 beschreven voor de geselecteerde
modelgelen. Bij 20°C werd er geen vrijkomen van oliedruppels waargenomen voor gelen met
gebonden oliedruppels. Het vrijkomen van oliedruppels uit gelen met ongebonden druppels
was gerelateerd aan het oliegehalte en de grootte van de geldeeltjes na vermaling.
Gelatinegelen smelten bij lichaamstemperatuur. Als de analyse bij deze temperatuur werd
uitgevoerd, kwamen de oliedruppels ook vrij uit gelen met gebonden druppels. Een toename
van het oliegehalte gaf een toename van de romigheid voor alle gelen. De romigheid was
hoger voor gelen met ongebonden druppels, en voor gelen die smelten bij
lichaamstemperatuur. Voor deze gelen correleerde de hoeveelheid vrijgekomen olie met de
romigheid. Echter, ook voor niet smeltende gelen met gebonden druppels werd een
vergelijkbaar effect van het oliegehalte op de romigheid gevonden. De bovengenoemde
hypothese over de relatie tussen druppel-matrixinteracties en het vrijkomen van de
oliedruppels uit de gelen tijdens consumptie werd dus bevestigd. Toch bleek het vrijkomen
van oliedruppels niet het voornaamste mechanisme waarmee de perceptie van de romigheid
van emulsie-gevulde gelen kan worden verklaard.
In het vervolg van het onderzoek werden de lubricatie-eigenschappen bestudeerd van
emulsiegevulde gelen, van de afzonderlijke componenten ervan en van speeksel. De resultaten
van dit onderzoek worden in hoofdstuk 8 besproken. In deze studie werden de gelen
vermalen, zodat ze op gelen leken na orale verwerking. De emulsies die gebruikt werden voor
de bereiding van de emulsiegevulde gelen vertoonden een afname van de frictiecoëfficiënt bij
een toename van het oliegehalte. Emulsies met 40% olie (op gewichtsbasis) hadden dezelfde
frictiecoëfficiënt als de olie. De lubricatie-eigenschappen van de emulsiegevulde gelen hingen
voornamelijk af van de moleculaire eigenschappen en het breukgedrag van de matrix en van
de druppel-matrixinteracties. Voor gelen met gebonden druppels nam de frictiecoëfficiënt
geleidelijk af bij een toename van het oliegehalte. Voor gelen met ongebonden druppels was
de frictiecoëfficiënt lager dan die van de matrix zonder oliedruppels. Toch werd er voor deze
gelen geen effect van het oliegehalte op de frictiecoëfficiënt waargenomen. De verschillende
effecten van het oliegehalte op het lubricatiegedrag van de verschillende gelen werden
verklaard door de relatie tussen druppel-matrixinteracties en de ‘schijnbare viscositeit’ van de
vermalen gelen. Voor gelen met gebonden druppels resulteerde een toename van het
oliegehalte in een toename van de ‘schijnbare viscositeit’ van de gemalen gelen. Voor gelen
met ongebonden druppels had het oliegehalte geen effect op de ‘schijnbare viscositeit’.
Confocale Scanning Laser Microscopie (CSLM) opnamen van zowel de emulsies als de
223

Samenvatting en slotopmerkingen
emulsiegevulde gelen lieten geen coalescentie zien van de oliedruppels als gevolg van de
frictiemetingen.
De studie van de mechanische eigenschappen van emulsiegevulde gelen zoals
beschreven in dit proefschrift was aanvankelijk gericht op het optreden van de eerste breuk
onder compressie. Het effect van de druppel-matrixinteracties op de ‘schijnbare viscositeit’
van de gemalen gelen wijst echter op de relevantie van de opvolgende afbraak. Gelen met
dezelfde matrix en hetzelfde oliegehalte, maar met verschillende interacties tussen
oliedruppels en gelmatrix, worden in de mond verbroken tot systemen met verschillende
rheologische eigenschappen. De vindingen beschreven in dit proefschrift maken het mogelijk
om een mechanisme voor te stellen voor de relaties tussen de eerste breuk en de
eigenschappen van een gemalen gel. Met een toename van het oliegehalte worden gelen met
gebonden druppels brosser. Daardoor worden ze gebroken in kleinere deeltjes, resulterend in
een homogene massa zonder grote, met het blote oog zichtbare deeltjes. Bovendien leidt de
toename van de Young’s modulus bij de toename van het oliegehalte tot stijvere gelbrokjes.
Als resultaat worden gelen met gebonden druppels gebroken tot systemen met een hogere
‘schijnbare viscositeit’. Voor gelen met ongebonden druppels daarentegen veroorzaakt een
toename van het oliegehalte een afname van de gel modulus, met geringe effecten op de
gelbrosheid. Deze gelen worden gebroken tot minder homogene systemen, met grotere,
mindere stijve deeltjes en met een lagere ‘schijnbare viscositeit’. Vergeleken met gelen
zonder olie worden emulsiegevulde gelen met zowel gebonden als ongebonden druppels
gefragmenteerd tot homogenere systemen.
De sensorische perceptie van emulsiegevulde gelen wordt gedomineerd door de
eigenschappen van de gel matrix en het oliegehalte. Polymeergelen worden waargenomen als
meer smeltend, deeltjesgelen als meer ruw. Met een toename van het oliegehalte worden
beide gelsoorten meer romig en smeerbaar. Deze sensorische attributen zijn met elkaar
gecorreleerd. Het vrijkomen van oliedruppels tijdens consumptie kan de perceptie van
vetgerelateerde attributen niet volledig verklaren: de score voor het sensorische attribuut
‘romig’ (en in sommige gevallen ‘vettig’) neemt met een toename van het oliegehalte ook toe
voor gelen waarbij geen oliedruppels vrijkomen. Aangezien de frictiecoëfficiënt van alle
gebroken emulsiegevulde gelen afneemt met een toename van het oliegehalte, kan er
geconcludeerd worden dat de perceptie van deze attributen wordt beïnvloed door de
lubricatie-eigenschappen van de gebroken gelen. Het effect van het oliegehalte op de
smeerbaarheid (en vervolgens ook op een deel van de toename in romigheid) kan worden
224

Samenvatting en slotopmerkingen
verklaard aan de hand van de relatie tussen de eerste breuk van gevulde gelen en de
eigenschappen van gebroken gelen. De toename in brosheid als gevolg van de aanwezigheid
van oliedruppels in de gelmatrix resulteert tijdens consumptie in meer homogene gebroken
gelen vergeleken met gelen zonder oliedruppels. Het belangrijkste effect van de oliedruppels
in de gelmatrix is dan ook hun rol bij het afbreken van het gelnetwerk. Het is dit gebroken
netwerk dat op zijn beurt de sensorische perceptie bepaalt.
Concluderend, de druppel-matrixinteractie beïnvloedt het breukgedrag van de
emulsiegevulde gelen, dat vervolgens gerelateerd is aan de sensorische smeerbaarheid, en de
‘schijnbare viscositeit’ van de gebroken gelen. De ‘schijnbare viscositeit’ controleert
gedeeltelijk de lubricatie-eigenschappen van deze systemen en vervolgens de perceptie van
romigheid en vettigheid. Figuur 9.1 geeft een samenvattend schema van de verbanden tussen
fysisch-chemische mechanismen van emulsiegevulde gelen en de bijhorende sensorische
attributen. Het mechanisme van de sensorische perceptie van emulsiegevulde gelen is nog niet
volledig onthuld. Om dit te kunnen bereiken zou toekomstig onderzoek gericht moeten zijn op
het vinden van verbanden tussen mechanische eigenschappen onder grote vervorming
enerzijds, en rheologische eigenschappen van de gebroken gelen anderzijds. Bijzondere
aandacht zou besteed moeten worden aan de afbraak na de eerste breuk, en aan het effect van
de grootte en de stijfheid van gelbrokjes op ‘schijnbare viscositeit’. Ook het mechanisme dat
de lubricatie-eigenschappen van de gebroken gelen verbindt met de sensorische perceptie van
de gelen is nog niet bekend. Toekomstig onderzoek zou hierop gericht moeten worden.
225

Samenvatting en slotopmerkingen
Effect op gel
eigenschappen
Fysisch-chemische
mechanismen
Effect op orale
verwerking
Sensorische
attributen
Meer
smeerbaar
Meer romig/
vettig
Afname
vervorming
bij breuk
Afname
spanning
bij breukpolymeer gelen
Stress
concentratie
Kleinere
geldeeltjes
Zwakkere
geldeeltjes
Matrix
eigenschappen
Druppel/ matrix
interactie
‘Viscositeit’
gebroken gel
Lubricatie
eigenschappen
Vrijkomen
oliedruppels
Lagere
frictie
Materiaal
eigenschappen
Druppel
eigenschappen
Figuur 9.1 – Verbanden tussen geleigenschappen met een effect op de sensorische waarneming van
emulsiegevulde gelen en de bijhorende sensorische attributen.
226

Dankwoord
Dankwoord
De afgelopen drie jaren zijn een van de mooiste perioden van mijn professionele leven geweest.
Ik heb erg veel geleerd, heb in een motiverende omgeving en binnen goed afgestemde teams
mogen werken en ben veel boeiende mensen tegenkomen die hopelijk een rol zullen blijven
spelen in het vervolg van mijn leven. Ik vind het erg jammer dat het afgelopen is. Hierbij wil ik
iedereen bedanken die een bijdrage heeft geleverd aan het plezierige doorbrengen van mijn
promotietraject.
Ten eerste wil ik de leidinggevenden van A&F bedanken die mijn detachering binnen de
Wageningen Centre for Food Science (WCFS) mogelijk hebben gemaakt. Fred, Charon, Koos,
zonder jullie vertrouwen en inzet was het niet mogelijk geweest. Rene, bedankt voor de tijd die
ik na mijn terugkeer bij de Centre for Innovative Consumer Studies kon besteden aan het
afronden van mijn proefschrift.
Mijn promotor en copromotoren hadden de taak om mijn koppigheid en zelfstandigheid te
beheersen. Het is hen aardig gelukt. Zelf heb ik geleerd om die eigenschappen enigszins in toom
te houden. Martien, bedankt voor de inspirerende gesprekken en voor je hulp in het zoeken van
precieze, rigoureuze formuleringen bij het schrijfproces. Ik heb enorme bewondering voor jouw
stijl als leerstoelhouder. Je geeft leiding aan een van de grootste vakgroepen van de universiteit
en aan erg veel promovendi. Toch wist je bij onze gesprekken altijd exact waar we de keer
daarvoor waren gebleven en je had altijd een heldere kijk op de ontwikkelingen van mijn
onderzoek. George, ik vond het bijzonder prettig om met jou samen te werken. Je bent erg
creatief en jouw inzichten ontstaan altijd vanuit een stevig onderbouwd wetenschappelijk
standpunt. Ik verliet onze gesprekken altijd met veel ideeën voor nieuwe experimenten. Verder
paste jouw manier van communiceren heel goed bij mij. Fred, je was ongetwijfeld het meest
veeleisend van mijn begeleiders, maar ook degene die er altijd voor mij was. Jouw werkwijze is
strak gestructureerd, zowel bij het opzetten van een experiment als bij het schrijven van een
artikel. De afgelopen drie jaren heb je mij kunnen overtuigen van de voordelen van jouw aanpak.
Hopelijk kun je zelf ook constateren dat ik door jouw begeleiding behoorlijk veranderd ben.
Ton, formeel was je niet bij mijn promotietraject betrokken. Toch heb ik jou altijd als de
‘geestelijk vader’ van mijn onderzoek gezien. Je hebt twintig jaar geleden een paper over
emulsiegevulde gelen geschreven dat vandaag de dag nog steeds het meest geciteerde artikel
over dit onderwerp is. Ik hoop dat de stukken die we samen hebben geschreven even overtuigend
en succesvol zullen zijn. Het was voor mij een genoegen en een eer om met jou te mogen
samenwerken.
227

Dankwoord
Voor mijn onderzoek was ik bij twee verschillende projecten van WCFS, ‘B014’ en ‘B015’,
gedetacheerd. Het was niet altijd gemakkelijk om een evenwicht te vinden met betrekking tot
mijn aanwezigheid en rol binnen de twee projectteams. Ik heb mijn best gedaan om te jongleren
met de verplichtingen van een dubbele detachering. Aangezien ik mijn agenda niet voorbeeldig
bijhoud is dat niet altijd gelukt (het is bijvoorbeeld een paar keer voorgekomen dat ik niet kwam
opdagen bij vergaderingen waar ik een presentatie moest geven). Ondanks dat ik mijn dubbele
verplichtingen niet altijd nakwam, heb ik wel twee keer zoveel inputs en hulp gekregen van mijn
teamgenoten. Hierbij wil ik dus beide teams bedanken voor de vele suggesties, voor de
constructieve gesprekken en voor de feitelijke hulp bij het uitvoeren van mijn onderzoek.
Tegelijkertijd wil ik me dus verontschuldigen voor mijn beperkte aanwezigheid als collega. Ik
wil liever geen namen noemen, maar maak toch drie kleine uitzonderingen. Harmen, jouw
onconventionele stijl van leidinggeven sprak mij erg aan. Je deed je best om een goede sfeer te
creëren en in je gesprekken met je medewerkers/ teamgenoten toonde je altijd belangstelling
voor de persoon achter de medewerker. Bedankt ook voor het organiseren van onze reisjes naar
Milaan en Thessaloniki (hiervoor wil ik alle B015 teamgenoten bedanken voor de gezelligheid).
Monique, je hebt veel tijd besteed aan het verbeteren van mijn teksten. Ik had snel door dat je erg
nauwkeurig een manuscript doorneemt. Geen van mijn artikelen is dus zonder een ‘Monique-
check’ de deur uitgegaan. Hier heb ik ook voor mijn proefschrift gebruik van gemaakt. Hartelijk
dank voor je tijd en energie. Agnieszka, without your hard work the eighth chapter of my thesis
would not be there. Thank you very much for everything, above all for coping with my
sometimes bossy and hasty behaviour of the last period.
Als gevolg van mijn dubbele aanstelling heb ik mijn werkzaamheden op twee verschillende
locaties verricht, bij NIZO food research in Ede en bij het Laboratorium voor Fysische Chemie
en Kolloïdkunde, beter bekend als Fysko. Ik heb op beide locaties met plezier gewerkt en ik wil
alle medewerkers van de twee organisaties bedanken voor hun hulp en voor de prettige
werksfeer. Onder de medewerkers van NIZO food research wil ik in het bijzonder Jan, Roelie en
Marijke bedanken. Jan, ik bewonder jouw diepe kennis over verschillende wetenschappelijke
onderwerpen en jouw evenwicht als mens. Bedankt voor je hulp met de CLSM opnamen en voor
de diepgaande gesprekken. Roelie, het was leuk om na twaalf jaar weer samen met jou te
werken. Bedankt voor de Röse-Gottlieb (Elly, ook bedankt) en voor je beschikbaarheid.
Marijke, ondanks de vele stoeipartijen met ondergetekende heeft de homogenisator het
overleefd. Bedankt voor je vriendelijke assistentie bij de vele ongelukjes. Wat Fysko betreft,
vind ik het nog steeds wonderlijk dat men daar iets voor elkaar kan krijgen gezien het gigantisch
hoge gezelligheidsniveau. Misschien is dat juist het geheim dat Fysko een van de meeste
228

Dankwoord
productieve vakgroepen van de universiteit maakt. Bij Fysko was ik eigenlijk een buitenbeetje.
Alle promovendi zijn daar met onderzoeken van fundamenteel karakter bezig, terwijl ik met mijn
geprakte gelen erg praktisch bezig was. Toch heb ik nooit het gevoel gehad dat ik anders
behandeld werd.
Mijn kamergenoten bij Fysko, Wilfred, Jerry en Jan, wil ik bedanken voor de gezelligheid
en de leuke gesprekken, vaak niet gerelateerd aan het werk. Met een aantal collega’s van de
WCFS teams, NIZO food research en Fysko heb een zeer open, vriendschappelijke relatie gehad.
Anne, Roelie, Jerry, Josie, Ladka, Erika, Diane, Franklin, Mara, Bas, Bart, Saskia, Marijn,
Renate, met jullie heb ik de details van mijn soms onstuimige leven gedeeld. Bedankt dat jullie
altijd voor mij klaar stonden.
Ivano, grazie per le lunghe chiaccherate durante il periodo che hai trascorso in Olanda.
Durante le gare di triathlon a cui ho partecipato dopo il tuo ritorno in Italia mi sono mancati
molto il tuo sostegno e la tua presenza.
Onder mijn vrienden wil ik in het bijzonder degene bedanken die mij in de laatste periode
hebben geholpen met taken gerelateerd aan mijn promotie. Lucy (mijn taalkundige adviseur) en
Sylvia, mijn paranimfen, bedankt voor jullie energie en inzet in het overnemen van de
organisatieactiviteiten. Erik, bedankt voor het mooie kaftje!
Mijn clubgenoten van de Triathlon Vereniging Arnhem worden bedankt voor de interesse die
ze voortdurend hebben getoond in mijn onderzoek en voor de vele gezellige, ontspannende
trainingen die een belangrijke bijdrage hebben geleverd aan het behouden van een goed
geestelijk evenwicht tijdens stressvolle periodes.
Ma, pa, Sara, grazie per il vostro sostegno e il vostro affetto.
229

Dankwoord
230

List of publications
List of publications
- G. Sala, I. De Noni, L. Pellegrino (1993). Caratteristiche chimico-analitiche di latte a lenta
coagulazione presamica, Scienza e Tecnica Lattiero-Casearia, 44 (5), 292-308;
- G. Sala, I. De Noni, M.A. Pagani, P. Mariani, A. Rando (1995). Alcune caratteristiche delle
micelle caseiniche in latti individuali con bassa proporzione di s1-caseina, Scienza e Tecnica
Lattiero-Casearia, 46 (5), 290-300;
- M.A.M. Hoffmann, G. Sala, K. Olieman, K.G. De Kruif (1997). Molecular mass distributions
of heat induced ß-lactoglobulin aggregates, Journal of Agriculture and Food Chemistry, 45 (8),
2949-2957;
- G.J. Grobben, W.H.M. van Casteren, H.A. Schols, A. Oosterveld, G. Sala, M. Smith, J.
Sikkema, J.A.M. de Bont (1997). Analysis of the Exopolysaccharides Produced by Lactobacillus
delbrueckii subsp. bulgaricus NCFB 2771 Grown in a Continuos Culture on Glucose and
Fructose, Applied Microbiology and Biotechnology, 48 (4), 516-521.
- P. Rosa, G. Sala, T. van Vliet, F. van de Velde (2006). Cold gelation of whey protein
emulsions, Journal of Texture Studies, 37, 516-537.
- G. Sala, F. van de Velde, M.A. Cohen Stuart, G. A. van Aken (2007). Oil droplet release
form emulsion-filled gels with relation to sensory perception, Food Hydrocolloids, 21 977-
985.
- G. Sala, R.A. de Wijk, F. van de Velde, G. A. van Aken (2008). Matrix properties affect
the sensory perception of emulsion-filled gels, Food Hydrocolloids, 22, 353-363.
- G. Sala, G. A. van Aken, M.A. Cohen Stuart, F. van de Velde (2007). Effect of droplet-
matrix interactions on large deformation properties of emulsion-filled gels, Journal of Texture
Studies, 38(4), 511-535.
- G. Sala, T. van Vliet, M. A. Cohen Stuart, G.A. van Aken, F. van de Velde, Deformation
and fracture of emulsion-filled gels. 1 Effect of oil content and deformation speed, submitted
for publication.
- G. Sala, T. van Vliet, M. A. Cohen Stuart, F. van de Velde, G.A. van Aken, Deformation
and fracture of emulsion-filled gels. 2 Effect of gelling agent concentration and oil droplet
size, submitted for publication.
- A. Chojnicka & G. Sala, K. de Kruif, F. van de Velde, The interactions between oil droplets
and gel matrix affect the lubrication properties of sheared emulsion-filled gels, to be
submitted.
231

232

Curriculum vitae
Curriculum vitae
Guido Sala werd geboren op 28 augustus 1967 te Vimercate, een klein stadje 15 km ten noorden
van Milaan. In 1986 behaalde hij zijn gymnasium diploma aan de Liceo Classico B. Zucchi, te
Monza. In datzelfde jaar begon hij zijn studie Landbouw Wetenschappen aan de Universiteit van
Milaan. In 1992 studeerde hij af bij de leerstoelgroep Levensmiddelentechnologie en –
microbiologie. Per november 1992 werd hij aangesteld als tijdelijk wetenschappelijk
onderzoeker bij bovengenoemde leerstoelgroep, waar hij zich met studies naar de strembaarheid
van melk bezig hield. In oktober 1995 begon zijn Nederlands avontuur als gastmedewerker bij de
afdeling Analytische Chemie van het toenmalige Nederlands Instituut voor Zuivelonderzoek te
Ede. Hier werkte hij aan de toepasbaarheid van "Multi-Angle Laser Light Scattering" (MALLS)
detectie in de HPLC-analyse van polysacchariden en melkeiwitten. Per september 1996 werd hij
aangesteld als productontwikkelaar bij de afdeling Research & Development van de
zuivelconcern Baars Dairy te Schoonrewoerd. Een jaar later kreeg hij een functie als
wetenschappelijke onderzoeker bij het toenmalige Instituut voor Agrotechnologisch Onderzoek
(ATO-DLO, later Agrotechnology and Food Innovations, tegenwoordig Agrotechnology & Food
Sciences Group, AFSG) te Wageningen. Zijn onderzoeksveld was de toepassing van
membraantechnologie in de zuivelindustrie. Tussen januari 2000 en augustus 2001 werkte hij als
procestechnoloog bij de afdeling Research & Development van de Kaasdivisie van Campina, te
Tilburg. In september 2001 keerde hij terug naar ATO-DLO om te werken aan een project over
de bereiding van eiwitgestabiliseerde emulsies met behulp van membraanemulgering.
Gedetacheerd bij Wageningen Centre for Food Science begon hij in juli 2004 een
promotieonderzoek bij het Laboratorium van Fysische Chemie en Kolloïdkunde van de
Wageningen Universiteit. De resultaten van dit onderzoek worden in dit proefschrift beschreven.
Sinds juli 2007 is hij wederom werkzaam als onderzoeker bij AFSG, binnen de Centre for
Innovative Consumer Studies.
233

234

Educational activities
Educational activities
Discipline specific activities
VLAG courses
- Food rheology, 1999, Wageningen, The Netherlands
- Sport & nutrition, 2004, Arnhem and Zeist, The Netherlands
- Industrial proteins, 2006, Wageningen, The Netherlands
- Reaction kinetics, 2006, Wageningen, The Netherlands
Courses and conferences
- Lecture series on coacervates, 2005, Utrecht University, Utrecht, The Netherlands
- Basics of rheology, 2005, Anton Paar, Waalwijk, The Netherlands
- Seminar on rheo-optics, 2005, Leuven University, Leuven, Belgium
- Dutch Polymer Days, 2006, National Dutch Graduate School of Polymer Science and
Technology, Lunteren, The Netherlands
Meetings
- PhD students work group, 2004-2007, Laboratory of Physical Chemistry and Colloids
Science, Wageningen University, Wageningen, The Netherlands
- Colloquia, 2004-2007, Wageningen University, Wageningen, The Netherlands
- Work meetings project ‘Engineered texture of emulsions and foams’, Wageningen
Centre for Food Science (WCFS), 2004-2007, Wageningen, The Netherlands
- Work meetings project ‘Dynamics of biopolymer networks and textures’, WCFS,
2004-2007, Wageningen, The Netherlands
- Program meetings ‘Structure and Functionality’, WCFS, 2004-2007, Wageningen,
The Netherlands
- Discussion group ‘Fracture mechanics’, WCFS, 2004-2007, Wageningen, The
Netherlands
General courses
- Scientific English, 2005, Language Centre, Wageningen University, Wageningen, The
Netherlands
235