Influence of emulsion composition on lubrication capacity and texture perception
11
Original article Influence of emulsion composition on lubrication capacity and texture perception Me ´lanie Bellamy, 1 Nicolas Godinot, 1 Stefano Mischler, 2 Nathalie Martin 1 & Christoph Hartmann 1 * 1 Nestle´ Research Center, PO Box 44, CH-1000 Lausanne26, Switzerland 2 Ecole Polytechnique Fe´de´rale de Lausanne (EPFL), Materials Institute, CH-1015 Lausanne, Switzerland (Received 24 December 2008; Accepted in revised form 1 June 2009) Summary The role of fat content and type of surfactant for oral friction processes and texture perception of oil-in- water emulsions was assessed. Emulsions at 22% and 33% fat content containing either sodium caseinate or a sucrose ester as emulsifier were compared with viscosity-adapted aqueous solutions of dextran using both sensory evaluation and friction coefficient measurements on a tongue-palate contact model. The impact of saliva on the emulsion droplet size distribution was studied using tribology, differential interference contrast microscopy and light diffraction measurements. Emulsions at 33% and the corresponding iso-viscous aqueous solutions were discriminated in the sensory experiment whereas emulsions at 22% were not. Friction was significantly different for emulsions at 33% and the corresponding iso-viscous aqueous solutions. The difference was not significant for emulsions with 22% fat level when compared with the iso-viscous aqueous solutions. Saliva significantly decreased the friction coefficient of emulsions depending on the surfactant and amount of fat used. Keywords Fat, saliva, sensory, surfactants, texture, tribology. Introduction As consumers are faced with an increasingly wide range of products, sensory appreciation of foods becomes very important in determining consumer food choice. Con- sumer demand for low-fat and low-calorie foods has given rise to new trends in product development. However, low-fat foods are still not as appealing as full-fat versions as fats are responsible for the sensory properties of many foods and greatly contribute to eating pleasure (Drewnowski, 1997). One challenge for food companies is to master low-fat products that match consumer expectations in terms of energy density without compromise on sensory properties. Thus, a better understanding of the key drivers for fat percep- tion is necessary for food manufacturers to develop reduced-fat products acceptable to consumers (Mattes, 2001). The presence of fat in a product can be detected by the five senses (vision, hearing, smell, taste and touch). Although some authors have discussed the role of taste (Chale´ -Rush et al., 2007), olfactory (Elmore et al., 1999; Richardson-Harman et al., 2000) or visual cues (Frost et al., 2001), the prevailing belief holds that fat is perceived mainly by its textural cue (Mela, 1988; Drewnowski et al., 1989; Raats & Shepherd, 1992). Restriction of visual and olfactory cues also fails to affect the perceived fat content in fluid dairy products (Mela, 1988). In addition, fat reduction and ⁄ or fat substitution leads to changes in food structure that are often perceived by consumers as giving less attractive textures (Strugnell, 1993). Fat replacers are designed to help maintain the original texture of a regular-fat food in a reduced-fat product version (Jones, 1996). Efforts have been under- taken in matching the oral viscosity of low-fat products to those of full-fat products through addition of fat replacers. However, even if rheological property data appear to correlate with some attributes of perceived texture in the mouth, it is evident for many foods that adapted bulk properties alone do not provide the in-mouth sensory properties of full-fat products (Malone et al., 2003; Verhagen et al., 2003). In the recent literature, oral heat transfer between food and oral surfaces was identified as possible cue for fat perception. Comparison between high- and low- fat products and their influence on oral surface temperature during consumption showed a significant *Correspondent: E-mail: [email protected] International Journal of Food Science and Technology 2009, 44, 1939–1949 1939 doi:10.1111/j.1365-2621.2009.02007.x Ó 2009 The Authors. Journal compilation Ó 2009 Institute of Food Science and Technology
-
Upload
independent -
Category
Documents
-
view
0 -
download
0
Transcript of Influence of emulsion composition on lubrication capacity and texture perception

Original article
Influence of emulsion composition on lubrication capacity and
texture perception
Melanie Bellamy,1 Nicolas Godinot,1 Stefano Mischler,2 Nathalie Martin1 & Christoph Hartmann1*
1 Nestle Research Center, PO Box 44, CH-1000 Lausanne26, Switzerland
2 Ecole Polytechnique Federale de Lausanne (EPFL), Materials Institute, CH-1015 Lausanne, Switzerland
(Received 24 December 2008; Accepted in revised form 1 June 2009)
Summary The role of fat content and type of surfactant for oral friction processes and texture perception of oil-in-
water emulsions was assessed. Emulsions at 22% and 33% fat content containing either sodium caseinate or
a sucrose ester as emulsifier were compared with viscosity-adapted aqueous solutions of dextran using both
sensory evaluation and friction coefficient measurements on a tongue-palate contact model. The impact of
saliva on the emulsion droplet size distribution was studied using tribology, differential interference contrast
microscopy and light diffraction measurements. Emulsions at 33% and the corresponding iso-viscous
aqueous solutions were discriminated in the sensory experiment whereas emulsions at 22% were not. Friction
was significantly different for emulsions at 33% and the corresponding iso-viscous aqueous solutions. The
difference was not significant for emulsions with 22% fat level when compared with the iso-viscous aqueous
solutions. Saliva significantly decreased the friction coefficient of emulsions depending on the surfactant and
amount of fat used.
Keywords Fat, saliva, sensory, surfactants, texture, tribology.
Introduction
As consumers are faced with an increasingly wide rangeof products, sensory appreciation of foods becomes veryimportant in determining consumer food choice. Con-sumer demand for low-fat and low-calorie foods hasgiven rise to new trends in product development.However, low-fat foods are still not as appealing asfull-fat versions as fats are responsible for the sensoryproperties of many foods and greatly contribute toeating pleasure (Drewnowski, 1997). One challenge forfood companies is to master low-fat products that matchconsumer expectations in terms of energy densitywithout compromise on sensory properties. Thus, abetter understanding of the key drivers for fat percep-tion is necessary for food manufacturers to developreduced-fat products acceptable to consumers (Mattes,2001).The presence of fat in a product can be detected by the
five senses (vision, hearing, smell, taste and touch).Although some authors have discussed the role of taste(Chale-Rush et al., 2007), olfactory (Elmore et al., 1999;Richardson-Harman et al., 2000) or visual cues (Frost
et al., 2001), the prevailing belief holds that fat isperceived mainly by its textural cue (Mela, 1988;Drewnowski et al., 1989; Raats & Shepherd, 1992).Restriction of visual and olfactory cues also fails toaffect the perceived fat content in fluid dairy products(Mela, 1988). In addition, fat reduction and ⁄or fatsubstitution leads to changes in food structure that areoften perceived by consumers as giving less attractivetextures (Strugnell, 1993).Fat replacers are designed to help maintain the
original texture of a regular-fat food in a reduced-fatproduct version (Jones, 1996). Efforts have been under-taken in matching the oral viscosity of low-fat productsto those of full-fat products through addition of fatreplacers. However, even if rheological property dataappear to correlate with some attributes of perceivedtexture in the mouth, it is evident for many foods thatadapted bulk properties alone do not provide thein-mouth sensory properties of full-fat products(Malone et al., 2003; Verhagen et al., 2003).In the recent literature, oral heat transfer between
food and oral surfaces was identified as possible cuefor fat perception. Comparison between high- and low-fat products and their influence on oral surfacetemperature during consumption showed a significant*Correspondent: E-mail: [email protected]
International Journal of Food Science and Technology 2009, 44, 1939–1949 1939
doi:10.1111/j.1365-2621.2009.02007.x
� 2009 The Authors. Journal compilation � 2009 Institute of Food Science and Technology

difference, which is related to the differences inthermophysical properties of the food products (Prinzet al., 2007).It is already postulated in the literature that besides
bulk transport (influenced by rheological properties),physical interactions on the oral surfaces such as frictionplay an important role in the texture perception of fat inthe mouth (De Wijk & Prinz, 2005, 2006; Prinz & DeWijk, 2006; Prinz et al., 2006; Janhøj et al., 2009). It wasargued that possible mechanisms by which fat affects theoral texture perception of low-fat custards includelubrication (De Wijk et al., 2003, 2006). Therefore,tribological properties (tribology being the science offriction, lubrication and wear) may contribute to theoral texture perception of fatty foods, in particular themouth-coating perception, for example, when a thin filmof food remains on the surfaces of the oral mucosa afterswallowing.One important class of food systems, oil-in-water
emulsions, are of increasing interest in the scientificliterature concerning the physical mechanisms underly-ing fat perception, because they represent a largepotential for fat content reduction (De Vicente et al.,2006).Recent studies of Dresselhuis et al. (2007, 2008a, b)
investigate the lubrication properties of oil-in-wateremulsions as well as related surface physical andtribological effects. The major outcome of these studiesis that an increased sensitivity of the emulsions towardscoalescence results in a lower friction coefficient. Sur-face-induced coalescence appears to generate a lubri-cating film on a model surface. The results reveal thatprotein-poor (unstable) emulsions are retained more atthe tongue model surface than protein-rich (stable)emulsions. Furthermore, the layer formed by theadherence of protein-poor droplets is more stableagainst rinsing. It is presumed that coalescence mightbe the origin of the formation of big droplet and theformation of a lubricating film on the contact surfaces.The aim of the current contribution is to better
understand the oral texture perception of oil-in-wateremulsions with a particular focus on the fat content andtype of emulsifiers used. In contrast to prior studies, acombined sensory–tribological approach is chosenwhere oil-in-water emulsions are compared with aque-ous model systems with partially adapted rheologicalproperties. The tribometer employed for the study hasbeen adapted for a range of parameters to achieve a highlevel of similarity to human texture perception (Ranc,2006; Ranc et al., 2006a,b). As the employed modelsystems are simple compared with the real food systems,appearance, taste and olfactory properties can becontrolled. Consequently, sensory interaction betweenflavour, appearance and texture can be excluded.Further, rheological properties of the model systemsare controlled, which allows separating surface physical
effects from the effects related to the flow behaviour ofthe liquids.
Materials and methods
Sample preparation
Emulsions at 22% and 33% fat level using medium-chain triglycerides oil (MCT; Delios�V; Cognis,Dusseldorf, Germany) as fat source and sodium case-inate (Emmy, Dagmersellen, Switzerland) or sugar esterP1670 (RYOTO� sugar ester P1670 ⁄ sucrose palmitate;Mitsubishi Chemical Europe GMBH, Dusseldorf,Germany) as emulsifier were homogenised using ahigh-speed rotative mechanical mixer (Kinematica,Luzern, Switzerland) of 22 mm in diameter, with arotating speed of 11 000 r.p.m. at room temperature.The current study focuses on texture perception. There-fore, it is crucial to limit bias as a result of the flavour ofthe used compounds.The range of fat content is representative for diverse
culinary products such as sauces, salad dressings andmayonnaises. The fat contents of 22% and 33% havebeen chosen from a larger range investigated in anearlier study (unpublished) as being most relevant.The vegetable, edible MCT oil was selected for its
neutral flavour, stability and its Newtonian flow behav-iour. P1670 is selected because of its nonionic charge andits low molecular weight being a counterpart to sodiumcaseinate (Nacas), which has a high molecular weight(protein) and a negative charge at physiological pH.Iso-viscous aqueous solutions were prepared by dis-
solving dextran in appropriate amounts of Vittel� waterusing a magnetic stirrer for 1 h. Dextran powder(Dextran 2000; Amersham Pharmacia Biotech, Uppsala,Sweden) was chosen as its solution exhibits Newtonianflow behaviour at higher shear rates (above 100 s)1) andowing to its neutral taste. The dextran solutions werenamed according to the concentration of dextranpowder used [e.g. D7.15 denominates an aqueoussolution of 7.15% (w ⁄w) dextran, whereas D0.35denominates an aqueous solution of 0.35% (w ⁄w)dextran]. Moreover, to further limit texture differencesrelated to the presence of emulsifiers in emulsions, thesame amount of surfactant used in the emulsions wasalso added to the aqueous solutions.The samples (emulsions and aqueous solutions) were
placed in a bain-marie at 37 �C before each sensory andinstrumental experiment to minimise temperature dif-ferences between the sample and oral surfaces andresulting differences in oral heat transfer.
Measurement and adjustment of the viscosity
The viscosity of the emulsions at 22% and 33% and theiso-viscous aqueous solutions of dextran was measured
Lubrication capacity and texture of emulsions M. Bellamy et al.1940
International Journal of Food Science and Technology 2009 � 2009 The Authors. Journal compilation � 2009 Institute of Food Science and Technology

with the rheometer RS150 (Haake, Karlsruhe,Germany) in controlled shear stress mode, using aconcentric cylinder geometry (DG41, double gap). Themeasurement was done in triplicate at 37 �C. The shearstress was increased linearly from 0.01 Pa to 10 Pa in10 min.As both systems exhibit a slightly shear-thinning
behaviour, viscosities were matched at a shear stress of1 Pa through iterative adaptation of the concentrationof dextran. The viscosity at this point of reference islisted in Table 1 for dextran aqueous solutions andemulsions.We refer to the study of Mathmann et al. (2007), who
identify shear rates of the order of magnitude of 100 s)1
in the human mouth based on the use of a numericalfluid dynamical model. This range is largely covered thein present study, as illustrated exemplarily in Fig. 1 forsamples as used in Tests C and D (emulsion andcorresponding aqueous solution). The viscosities of bothsystems decrease over shear rate and remain similar toeach other in the range from 100 s)1 onwards.
Sensory discrimination tests
Five different triangle tests (Tests A to E) were carriedout with twenty untrained internal panellists (twelvefemales and nine males from 23 to 40 years). Thetriangle test has been chosen because of its sensitivityespecially as the samples are very close (in terms ofsensory differences) and all but textural cues areminimised (see next). According to the normas of theAssociation Francaise de Normalisation (AFNOR)(NFV09-001, 1983) and International Standard Organi-sation (ISO 6658, 1985), a specific training is notrequired for triangle tests. This procedure is also widelyused for measuring sensory thresholds in the population,without providing prior training, as documented in theAmerican Society for Testing and Materials (ASTM)norm E679-91.Each triangle contained three samples, in which two
are the same and one is different. Every panellistperformed the triangle tests in duplicate. The order ofpresentation of the samples was randomised across
panellists. Panellists could ask the experimenter tore-evaluate samples if needed.During all the sensory sessions, the participants were
seated comfortably opposite to the experimenter andperformed the test one by one. Moreover, to avoid anyvisual or nonoral tactile cues (e.g. contact with thefingers or with the lips), the panellists were blind-foldedand the samples were delivered directly into the mouthof the panellists onto the tongue surface using amicropipette. To eliminate any olfactive cues, thepanellists wore a nose clip during the etire test. Toprevent detection through thermal effects, the solutionswere kept warm in a bain-marie at 37 �C. Each sensorysession was conducted at a room temperature. Beforeeach sensory test and between each sample, the panel-lists rinsed their mouth thrice with warm water (37 �C).The participants were free to manipulate the liquids intheir mouth before spitting and rinsing. The samplescompared are summarised in Table 1.Tests C and D differed from Tests A and B principally
in the surfactant used. Moreover, solutions in Tests Cand D contained less dextran because of the lowermolecular weight of P1670 compared with Nacas. InTest E, the two emulsions at 33% with either Nacas orP1670 were used to assess the influence of the surfactanton differentiability.The number of correct answers was recorded for each
triangle test. The samples were considered to be signif-icantly different when the percentage of correct answersis higher than 50% for the forty trials (twenty sub-jects · two replicated), which corresponds to a P-valuesmaller than 5%. Moreover, the samples were consid-ered to be significantly similar with b = 10% andPd = 20% significance level, when the percentage ofcorrect answers was below 35%.
Tribology: measurement of the friction coefficient
The tribometer and conditions of the measurementThe tribometer (EPFL, Lausanne, Switzerland) enforcesa reciprocating sliding motion between a polychlorotri-fluoroethylene (PCTFE) hemisphere of 0.5 cm radiusand a flat silicone rubber surface (Silflo Kit, Flexico; J&S
Table 1 Composition, viscosity and sensory trial arrangements of emulsions and aqueous solutions
Emulsions Aqueous solutions Sensory trials
Medium-chain triglycerides Emulsifier l (10)3 Pa s) Dextran Emulsifier l (10)3 Pa s) Test Measures
22% Nacas 1.0% 1.16 ± 0.02 0.50% Nacas 1.0% 1.16 ± 0.02 A 18 · 2 replicated
33% Nacas 1.7% 2.95 ± 0.03 2.00% Nacas 1.5% 2.94 ± 0.01 B 18 · 2 replicated
22% P1670 1.0% 1.72 ± 0.03 0.35% P1670 1.0% 1.69 ± 0.02 C 19 · 2 replicated
33% P1670 1.5% 2.51 ± 0.02 0.34% P1670 1.5% 2.64 ± 0.05 D 20 · 2 replicated
33% P1670 1.5% 2.51 ± 0.02 – E 20 · 2 replicated
33% Nacas 1.7% 2.95 ± 0.03
Lubrication capacity and texture of emulsions M. Bellamy et al. 1941
� 2009 The Authors. Journal compilation � 2009 Institute of Food Science and Technology International Journal of Food Science and Technology 2009

Davis, Stevenage, UK) with a surface structure similarto that of the human tongue (Ranc, 2006) in contact. Thecontact is ensured through application of a normalforce. The tangential force is measured. The frictioncoefficient was determined from the ratio of the tangen-tial force to the normal force. The model food systemswere added as a lubricant onto the flat surface repre-senting the tongue. Figure 2 illustrates the tribometer.During the test, the temperature of the contact pair
and the lubricating liquid was maintained at 37 �C witha thermally controlled vessel to which the siliconesurface was fixed. The PCTFE pin was screwed to theend of the loading. Then, a load of 0.5 N was appliedwith dead weights suspended to the tribometer arm, toobtain a Hertzian pressure of 310 kPa between thecontacting surfaces that approximately corresponds tothe pressure recorded in vivo with pressure transducers(Winders, 1958; Takahashi & Nakazawa, 1991). TheHertzian pressure results from application of a normal
force to an elastic body and the deformation of the bodyat the point of contact such that the contact pointextends to a contact surface. Within this contact surfacea pressure builds up and acts against the normal forceleading to mechanical equilibrium along the line ofaction of the normal force (e.g. Holzapfel, Massy, 2000).To reproduce the velocity of tongue movements found
in the literature (Peng et al., 2000; Cheng et al., 2002), atriangular waveform with a frequency of 1 Hz (thatcorresponds to a velocity magnitude of 10 mms)1) wasapplied. The displacement of the pin in PCTFE wastracked optically with a laser placed on the arm andrecorded by a photodetector (Hamamatsu, Massy,France).The tangential force magnitude (Ft) corresponding to
the friction force as well as the normal force and thetemperature were measured. The friction coefficient (l)was obtained by dividing the friction force by themagnitude of the applied normal force (Fn):
0
0.001
0.002
0.003
0.004
0.005
0.006
0.007
0.008
1000100101Shear rate (1 s–1)
Vis
cosi
ty (
Pa
s)
Emulsion at 22% fat contentCorresponding aqueous solution
0
0.001
0.002
0.003
0.004
0.005
0.006
0.007
0.008
1000100101Shear rate (1 s–1)
Vis
cosi
ty (
Pa
s)
Emulsion at 33% fat content
Corresponding aqueous solution
Figure 1 Viscosity over shear rate for emul-
sion at 22% fat content and the correspond-
ing aqueous solution (above) and for
emulsion at 33% fat content and the corre-
sponding aqueous solution (below).
Lubrication capacity and texture of emulsions M. Bellamy et al.1942
International Journal of Food Science and Technology 2009 � 2009 The Authors. Journal compilation � 2009 Institute of Food Science and Technology

lðtÞ ¼ FtðtÞFn
:
To calculate the average friction coefficient during dryand lubricated contacts, at least 100 data points of theplateau region of the friction coefficient vs. time curvewere taken into account. All tests were done in triplicateand new silicone surfaces and PCTFE pins were used foreach test.
Manufacturing of silicone surfaces and PCTFE pinsFlat silicone samples with a particular surface structuresimulating the roughness of the tongue (Ranc, 2006)were fabricated by a moulding technique. The siliconesurface is structured with hemispherical pillars with asurface area density of 2.5 mm2, a diameter of 250 lmand a height of 125 lm. The silicone rubber impressionmaterial (Silflo Kit, Flexico; J&S Davis) was selected asits elastic modulus ranging from 260 to 350 kPa (Jamaniet al., 1989) is of the same order of magnitude as theelastic modulus of the tongue (Payan & Perrier, 1997).To prepare the silicone surfaces, nine drops of the
catalyst were added and mixed to 14 g of Silfloelastomer precursor. The polymer mixture obtainedwas poured on the mould placed at the centre of ascrewing press (30 mm long and 25 mm wide) to controlthe thickness of the samples and to remove the airbubbles. After 3 h, the silicone replica was taken fromthe press and separated from the mould. HemisphericalPCTFE pins of 3 mm curvature radius were used as theYoung’s modulus was close to that of the hard palatebone elastic modulus (Jans et al., 1998).
Friction coefficient measurementsThe friction coefficient was first measured under dryconditions until the plateau region was reached. Then,the motion was stopped and the loading arm was lifted
with a wedge, to add 0.5 mL of the lubricant (emulsionsor aqueous solutions containing surfactants) with amicropipette. The PCTFE pin was put into contactagain with the silicone surface and the motion wasrestarted after stabilising the temperature.To investigate the influence of whole saliva on the
tribology, friction tests were conducted in the followingways. As before, after friction in dry condition, themotion was stopped and the load arm was lifted to add0.5 mL of human whole saliva taken from a sample spatout into a beaker by a subject after stimulation throughchewing of parafilm for 20 s. A volume of 0.5 mL issufficient to cover the contact surfaces. The friction wasstarted again after stabilisation of the temperature andthe coefficient of friction was recorded until the plateauregion was reached. The motion was stopped once againto remove 0.3 mL of saliva from the silicone surface andto replace it by 0.3 mL of the other liquids (emulsions oraqueous solutions). The friction was restarted after thestabilisation of the temperature (Fig. 3).
Droplet size assessmentvTo assess structural changes in both sensory andtribological samples, we observed emulsions preparedwith either Nacas or P1670 with differential interferencecontrast (DIC) microscopy. The droplet sizes of theemulsion were measured with a standard droplet size-analysing technique (Mastersizer Micro; MalvernInstruments, Malvern, UK) after exposure to thefollowing conditions:
• at 37 �C, in the native state
• at 37 �C, under friction and mixed with human whole
saliva: 300 lL of saliva is put on a silicone surface and
mixed gently with 200 lL of emulsions. Then, the
friction coefficient measurement protocol was applied
• at 37 �C, after vigorous manipulation in the mouth for
10 s (to approximate the sensory tests conditions):
for this, emulsions are put in mouth and manipulated
for 10 s and then taken from the mouth with a pipette
• at 37 �C, after vigorous manipulation in the mouth for
45 s (to approximate the tribological tests conditions).
For this, the emulsions are put in mouth and manipu-
lated for 45 s and then taken from the mouth with a
pipette.
Results
Sensory study: impact of fat level and surfactants
Figure 4 illustrates the percentage of correct answers asa function of the fat level, for the different triangle testscarried out on emulsions (Tests A, B, C, D and E).Emulsions at the 22% fat level were not significantly
different from their corresponding iso-viscous aqueous
0.5 N0.5 N1. Silicone surface2. PCTFE ball3. Normal force strain
gauge4. Tangential force
sensor5. 2D photodetector6. Laser diode7. Temperature sensor8. Heating resistance9. Vessel
Figure 2 Schematic representation of the tribometer configuration.
Lubrication capacity and texture of emulsions M. Bellamy et al. 1943
� 2009 The Authors. Journal compilation � 2009 Institute of Food Science and Technology International Journal of Food Science and Technology 2009

solutions (Test A and C). Moreover, the emulsion at22% fat level with P1670 was perceived as significantlysimilar to the iso-viscous aqueous solution (11 ⁄38correct answers, i.e. 28.95%).In Tests B and D, emulsions at the 33% fat level with
P1670 or with Nacas were significantly discriminatedfrom iso-viscous aqueous solutions of dextran (19 ⁄36correct answers, i.e. 52.8% and 27 ⁄40 correct answers,i.e. 67.5%).Further, the appropriate choice of the surfactant
could enhance (Test D compared with Test B) or inhibit(Test C compared with Test A) the texture perception offat. For emulsions at the 33% fat level the perceiveddifference to iso-viscous aqueous solutions was largerwhen P1670 (Test D) was chosen as the emulsifier thanin the case when Nacas (Test B) was chosen. This was
confirmed by Test E, where emulsions at the 33% fatlevel with P1670 were significantly discriminated fromemulsions at 33% with Nacas (65% of the correctanswers).Moreover, the results suggest the existence of a fat
level limit between 22% and 33%, below which fat inemulsions was not perceived by textural cues other thanviscosity.
Friction coefficient measurements
Influence of fat level and surfactants on the lubricatingproperties of emulsionsThe friction coefficient results obtained for the samesamples as tested in sensory analysis (emulsions vs. iso-viscous aqueous solutions) are illustrated in Fig. 5.In the emulsions with the 22% fat level, there was no
significant difference observed between the emulsionsand their corresponding aqueous solutions. For emul-sions with 33% fat we observed a small but (confirmed)significant difference compared with the aqueous solu-tion when stabilised with Nacas. When stabilised withP1670, the 33% fat containing the emulsion exhibited asignificantly lower friction coefficient compared with thecase when stabilised with Nacas (lP1670 = 0.34 ± 0.05and lNacas = 0.46 ± 0.01). Moreover, the differencebetween the friction coefficients of the emulsions at the33% fat level and the dextran solution was larger whenthe surfactant P1670 was used than when Nacas wasused. Finally, we observed that emulsions with the sameamount of fat (emulsion at 33% + Nacas and emulsionat 33% + P1670) had different friction coefficients.
Influence of salivaThe influence of human whole saliva on the frictioncoefficients of the emulsions and the iso-viscous aqueoussolutions of dextran is illustrated in Fig. 6.
Dry friction
Addition oflubricant
Lubricatedfriction
0.0
0.1
0.2
0.3
0.4
0.5
0.6
0 200 400 600 800 1000 1200 1400 1600 1800 2000Time (s)
Co
effi
cien
t o
f fr
icti
on
Friction coefficient 1Friction coefficient 2
Figure 3 Typical friction measurement record
with three distinguished phases: dry friction,
rest during addition of lubrication and
lubricated friction.
0
10
20
30
40
50
60
70
Test A Test B Test C Test D Test E
Cor
rect
ans
wer
s (%
) Lower limit for significantdifference, α = 5%
Upper limit of significantsimilarity, β = 10%, Pd = 20%
22%
MC
T, N
acas
33%
MC
T, N
acas
22%
MC
T, P
1670
33%
MC
T, P
1670
33%
MC
T, P
1670
vs.
Nac
as
Figure 4 Percentage of correct answers for comparison of emulsions of
different fat levels with iso-viscous aqueous solutions through triangle
tests.
Lubrication capacity and texture of emulsions M. Bellamy et al.1944
International Journal of Food Science and Technology 2009 � 2009 The Authors. Journal compilation � 2009 Institute of Food Science and Technology
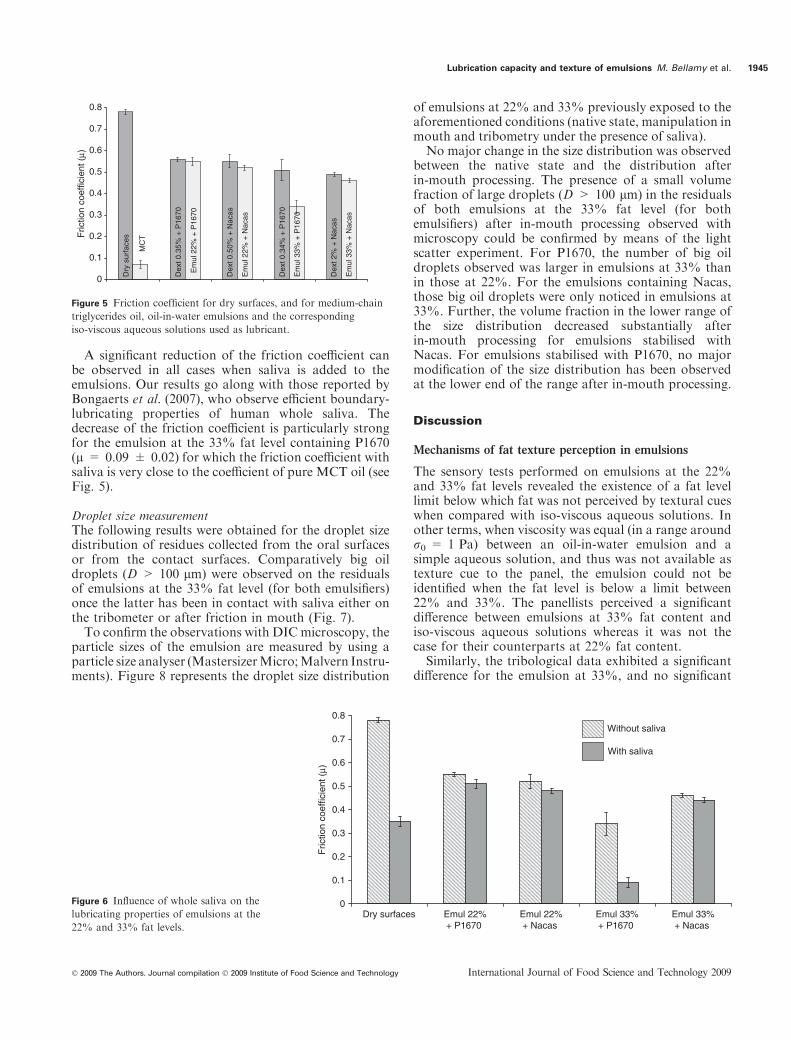
A significant reduction of the friction coefficient canbe observed in all cases when saliva is added to theemulsions. Our results go along with those reported byBongaerts et al. (2007), who observe efficient boundary-lubricating properties of human whole saliva. Thedecrease of the friction coefficient is particularly strongfor the emulsion at the 33% fat level containing P1670(l = 0.09 ± 0.02) for which the friction coefficient withsaliva is very close to the coefficient of pure MCT oil (seeFig. 5).
Droplet size measurementThe following results were obtained for the droplet sizedistribution of residues collected from the oral surfacesor from the contact surfaces. Comparatively big oildroplets (D > 100 lm) were observed on the residualsof emulsions at the 33% fat level (for both emulsifiers)once the latter has been in contact with saliva either onthe tribometer or after friction in mouth (Fig. 7).To confirm the observations with DICmicroscopy, the
particle sizes of the emulsion are measured by using aparticle size analyser (MastersizerMicro;Malvern Instru-ments). Figure 8 represents the droplet size distribution
of emulsions at 22% and 33% previously exposed to theaforementioned conditions (native state, manipulation inmouth and tribometry under the presence of saliva).No major change in the size distribution was observed
between the native state and the distribution afterin-mouth processing. The presence of a small volumefraction of large droplets (D > 100 lm) in the residualsof both emulsions at the 33% fat level (for bothemulsifiers) after in-mouth processing observed withmicroscopy could be confirmed by means of the lightscatter experiment. For P1670, the number of big oildroplets observed was larger in emulsions at 33% thanin those at 22%. For the emulsions containing Nacas,those big oil droplets were only noticed in emulsions at33%. Further, the volume fraction in the lower range ofthe size distribution decreased substantially afterin-mouth processing for emulsions stabilised withNacas. For emulsions stabilised with P1670, no majormodification of the size distribution has been observedat the lower end of the range after in-mouth processing.
Discussion
Mechanisms of fat texture perception in emulsions
The sensory tests performed on emulsions at the 22%and 33% fat levels revealed the existence of a fat levellimit below which fat was not perceived by textural cueswhen compared with iso-viscous aqueous solutions. Inother terms, when viscosity was equal (in a range aroundr0 = 1 Pa) between an oil-in-water emulsion and asimple aqueous solution, and thus was not available astexture cue to the panel, the emulsion could not beidentified when the fat level is below a limit between22% and 33%. The panellists perceived a significantdifference between emulsions at 33% fat content andiso-viscous aqueous solutions whereas it was not thecase for their counterparts at 22% fat content.Similarly, the tribological data exhibited a significant
difference for the emulsion at 33%, and no significant
0
0.1
0.2
0.3
0.4
0.5
0.6
0.7
0.8
Fric
tion
coef
ficie
nt (
μ)
Dry
sur
face
s
Em
ul 2
2% +
P16
70
MC
T
Dex
t 0.3
5% +
P16
70
Em
ul 2
2% +
Nac
as
Dex
t 0.5
0% +
Nac
as
Em
ul 3
3% +
P16
70
Dex
t 0.3
4% +
P16
70
Em
ul 3
3% +
Nac
as
Dex
t 2%
+ N
acas
Figure 5 Friction coefficient for dry surfaces, and for medium-chain
triglycerides oil, oil-in-water emulsions and the corresponding
iso-viscous aqueous solutions used as lubricant.
0
0.1
0.2
0.3
0.4
0.5
0.6
0.7
0.8
Dry surfaces Emul 22%+ P1670
Emul 22%+ Nacas
Emul 33%+ P1670
Emul 33%+ Nacas
Fric
tion
coef
ficie
nt (
μ)
Without saliva
With saliva
Figure 6 Influence of whole saliva on the
lubricating properties of emulsions at the
22% and 33% fat levels.
Lubrication capacity and texture of emulsions M. Bellamy et al. 1945
� 2009 The Authors. Journal compilation � 2009 Institute of Food Science and Technology International Journal of Food Science and Technology 2009

difference for the emulsion at 22%. Moreover, depend-ing on the emulsifier used, the differences in thelubrication capacity between the emulsions at 22%and at 33% (l22% = 0.52 ± 0.03 vs. l33% =0.46 ± 0.01 for Nacas and l22% = 0.55 ± 0.01 vs.l33% = 0.34 ± 0.05 for P1670) could be one of thepossible explanations for the sensory differenceobserved, as the percentage of correct answers in thetriangle tests followed the same trend (see also thesection on ‘Analogy between the sensory results andthe tribological data’).The influence of fat content on the lubricating
properties of technical emulsions is reported in mechan-ical engineering literature. For instance, Wilson et al.(1994), Schmid & Wilson (1996), Reich & Urbanski(2004) and also Tieu & Kosasih (2007) describe hydro-dynamic effects in the gap between two contact partnerslubricated with technical emulsions with the dynamicconcentration theory. According to this theory, the oildroplet concentration increases dynamically in theconfined space between the two contact partners suchthat an emulsion inversion might occur depending onthe tribological regime (speed, gap width and lubricantviscosity). Consequently, an oil-in-water emulsion mightinvert into a water-in-oil emulsion forming an oilreservoir in the space between the contact partners. Oildroplets larger than the thickness of the lubricant film inthe deformation zone become trapped when they comeinto contact with the solid surfaces. As the dropletsmove towards the deformation zone, water is left behindor squeezed out by the flattening of the oil droplets. Atsome point, the surfaces of the trapped oil droplets comeinto contact with each other, resulting in an inversionwhere oil becomes the continuous phase, providing
enhanced lubrication properties between the contactsurfaces.This effect could explain the superior lubricating
capacity of emulsions with 33% fat content comparedwith those at the 22% fat level. For the latter case, ourresults suggest that the critical local concentration foremulsion inversion was probably not reached. DeVicente et al. (2006) give a similar interpretation. Theyassess water-oil-emulsions at 20% fat level for differentviscosity ratios between disperse and continuous phases.According to their observations, the oil phase dominatesthe lubrication if the viscosity ratio exceeds a value of5.8, a condition that was fulfilled in our case. In thissituation, the oil droplets would undergo coalescenceand form a continuous lubricating film in the gapbetween both contact partners.Dresselhuis et al. (2007, 2008a) show that an
increased sensitivity of the emulsions towards coales-cence results in a lower friction. Surface-inducedcoalescence appears to generate a lubricating film on amodel surface. Results reveal that protein-poor (unsta-ble) emulsions are retained more at the tongue than theprotein-rich (stable) emulsions. Furthermore, the layerformed by the adherence of protein-poor droplets ismore stable against rinsing.As also shown by Dresselhuis et al. (2008b), coales-
cence might be the originator of the big droplets that weobserved in our droplet size measurements. The dropletscould have been formed notably through dynamicconcentration increase in the gap and the relatedemulsion inversion. This apparition of big oil dropletsin emulsions at 33% after both tribological measure-ment and after friction in the mouth may explain thesignificant difference perceived by the panellists between
Figure 7 Differential interference contrast
microscopy observations of emulsions at the
22% and 33% fat levels with P1670 exposed
to different conditions.
Lubrication capacity and texture of emulsions M. Bellamy et al.1946
International Journal of Food Science and Technology 2009 � 2009 The Authors. Journal compilation � 2009 Institute of Food Science and Technology

the emulsion at 33% and the iso-viscous aqueoussolution. A further mechanism could be related to anadhesion of emulsifier molecules to the tribological (andoral) surfaces. Because of the coalescence of smalldroplets to larger droplets with a smaller surface-to-volume ratio the excess surfactant molecules mightmigrate and adhere to the contact surface modifyingtheir tribological characteristics. The surface-activesaliva proteins might interfere in this process as well,as outlined in the following section.
Impact of saliva on the texture perception of fat inemulsions
It should be noticed that in our study big oil dropletswere observed in both DIC microscopy and particle sizeanalysis when saliva was added solely without mechan-ical manipulation either in mouth or on the tribometer.Thus, saliva alone appeared to be able to induce theformation of large droplets.The influence of saliva on texture perception of
emulsion was also demonstrated in this work with helpof tribological measurements. Saliva demonstrated goodlubricating properties as it induced a significant decrease
of the friction coefficient of the emulsions with Nacasand P1670 (compare Fig. 6), which goes along with thestatements in literature that one of the major functionsof saliva is lubrication between hard (teeth enamel) andsoft (mucosal) tissues (Berg et al., 2003).Furthermore, the impact of saliva on the friction
coefficient of emulsions was found to be of differentmagnitudes depending on the surfactant used and theamount of fat. The effect was relatively small(Dl = )0.03 ± 0.01) for all emulsions except for theemulsion at the 33% fat level with P1670 (Dl = )0.25).In this case, the level of the friction coefficient that wasreached was close to that of MCT oil (l = 0.05 ±0.02), a fact that supports our idea of emulsion inversionin the gap. Light diffraction measurements showed thatthis emulsion is quite stable, though. However, thedifference of lubrication observed for the differentemulsions could stem from the fact that the mostimportant determinant of film formation by oil-in-wateremulsions is the extent to which the oil dropletswet the surface and to which the emulsifiers modu-late wettabilitiy of the contact surfaces (Ranc et al.,2006b).The capacity of a liquid to wet a surface along with its
viscosity contributes to its lubrication capacity.Although there is a relative contribution of both anda dependency on the tribological regime, it can bestated that an enhanced wetting of a surface throughthe lubricant reduces friction. This depends on theemulsifier type and the concentration used (Ratoi &Spikes, 1999).
Analogy between the sensory results and the tribologicaldata
The difficulty in developing a model for oral frictionduring consumption of food is related to the fact thatphysical, chemical and physiological mechanismsbetween tongue and palate are particularly complicatedmostly because of a large variability from one person tothe other (roughness of the tongue, density, form andrepartition of the papillae on the tongue and also theway by which the tongue and palate are made to havecontact and moved). Furthermore, there are inter- andintra-individual differences concerning the lubricatingproperties of saliva depending on the food diet,hormonal rate and so on.Several authors have noted the importance of oral
friction processes in determining the sensory propertiesof foods (e.g. Malone et al., 2003; De Wijk & Prinz,2006). Even if the experimental conditions (tribometerand surfaces used) are not completely representative ofthe diversity and complexity in mouth situations, in thecurrent study, analogous trends between the sensoryresults and the tribological data for several liquidsystems from simple to complex composition were in
0
2
4
6
8
10
12
14
Droplet diameter (μm)
Vol
ume
frac
tion
(%
) Emul22P1670
Emul33P1670
Emul22P1670 mouth
Emul33P1670 mouth
0.1 1 10 100 1000
0
2
4
6
8
10
12
14
0.1 1 10 100 1000Droplet diameter (μm)
Vol
ume
frac
tion
(%)
Emul22 Nacas
Emul33 Nacas
Emul22 Nacas mouth
Emul33 Nacas mouth
Figure 8 Droplet size distribution of the emulsions at the 22% and
33% fat levels with P1670 and with Nacas, in normal conditions and
after friction in mouth.
Lubrication capacity and texture of emulsions M. Bellamy et al. 1947
� 2009 The Authors. Journal compilation � 2009 Institute of Food Science and Technology International Journal of Food Science and Technology 2009

agreement with the findings of the contributions men-tioned before.While emulsions at 33% and the iso-viscous aqueous
solutions exhibited significantly different friction coeffi-cients, they were also significantly discriminated by thepanellists. In contrast, no significant difference existedfor the emulsion at 22% both in sensory analysis andtribology. Moreover, the difference between the emul-sions at the 33% fat level and the iso-viscous aqueoussolutions was more significant with the surfactant P1670than with the Nacas both in sensory analysis and in thetribological measurements. Additionally, the results onemulsions indicated that the larger is the differencebetween the friction coefficients, the higher is thepercentage of correct answers (through triangle tests).This relation is illustrated in Fig. 9.The regression coefficient for linear correlation
between the two data sets was close to one(R2 = 0.95), which suggested the existence of a corre-lation between the sensory results of the triangle tests onemulsions and tribological data.
Conclusion
The current study demonstrates that in-mouth friction isa cue for texture perception of fat-containing food andhighlights the role of saliva in such a process.The aim of this work was to better understand the
mechanisms by which fats and surfactants affect oraltexture perception of emulsions to potentially improvethe texture of low-fat products. For this, emulsions at22% and 33% fat contents with either P1670 or Nacaswere compared with iso-viscous aqueous solutions usingsensory evaluation and tribological data.This comparison suggests the existence of a fat level
limit between 22% and 33% fat contents, below whichfat is not perceived by textural cues other than viscosity
in emulsions. This sensitivity threshold may be attrib-uted to structural changes in terms of droplet sizedistribution and of physico-chemical interaction withthe saliva being stronger in emulsions at 33%.This work also demonstrates the different abilities of
the surfactants for lubrication. For instance, emulsionsat the 33% level with P1670 lubricate better than itscounterpart with Nacas. The different capacities of thesurfactants to improve the lubrication of emulsions maystem from the different types of interactions at the oralmucosa with the saliva, which are related to the differentcharacteristics of these surfactants (molecular weight,electrical charge and chemical structure).Finally, we observe that saliva significantly influences
the lubrication of emulsions and should therefore beconsidered for instrumental measurements. Moreover,the effect of saliva on the lubricating properties ofemulsions is of different magnitude depending on the fatcontent and the surfactant used. Saliva has a particu-larly strong effect on the lubrication of the emulsion atthe 33% level with P1670. Thus, this study shows thatthe interaction between saliva, food components and thetribo-pair system (adhesion, physico-chemistry of thesurfaces, etc.) should be investigated deeply for furtherunderstanding of the mechanisms related to fat textureperception.The current study is dedicated to the identification of
physical mechanisms of fat perception and the lubrica-tion capacity has been proven to be one. A generalisa-tion will require the use of more complex foods.However, the particular challenge will lie in the factthat the presence or absence of fat considerably changesthe taste and aroma properties of a food and gives riseto sensory interactions.
References
Berg, I.C., Rutland, M.W. & Arnebrant, T. (2003). Lubricatingproperties of the initial salivary pellicle – an AFM study. Biofouling,19, 365–369.
Bongaerts, J.H.H., Rossetti, D. & Stokes, J.R. (2007). The lubricatingproperties of human whole saliva. Tribological Letters, 27, 277–287.
Chale-Rush, A., Burgess, J.R. & Mattes, R.D. (2007). Evidence forhuman orosensory (taste?) sensitivity to free fatty acids. ChemicalSenses, 32, 423–431.
Cheng, C.F., Peng, C.L., Chiou, H.Y. & Tsai, C.Y. (2002). Dentofacialmorphology and tongue function during swallowing. AmericanJournal of Orthodontics and Dentofacial Orthopedics, 122, 491–499.
De Vicente, J., Spikes, H.A. & Stokes, J.R. (2006). Viscosity ratioeffect in the emulsion lubrication of soft EHL contact. Journal ofTribology, 128, 795–800.
De Wijk, R.A. & Prinz, J.F. (2005). The role of friction in perceivedoral texture. Food Quality and Preference, 16, 121–129.
De Wijk, R.A. & Prinz, J.F. (2006). Mechanisms underlying therole of friction in oral texture. Journal of Texture Studies, 37,413–427.
De Wijk, R.A., van Gemert, L.J., Terpstra, M.E.J. & Wilkinson, C.I.(2003). Texture of semi-solids; sensory and instrumental measure-ments on vanilla custard desserts. Food Quality and Preference, 14,305–317.
R 2 = 0.95
0
0.02
0.04
0.06
0.08
0.1
0.12
0.14
0.16
0.18
2 35 45 55 65 75
Correct answers (%)
Δμ (–
)
Figure 9 Difference in friction coefficients (between fatty and nonfatty
fluids) as a function of the percentage of correct answers in the sensory
differentiation test (R2 = 0.95).
Lubrication capacity and texture of emulsions M. Bellamy et al.1948
International Journal of Food Science and Technology 2009 � 2009 The Authors. Journal compilation � 2009 Institute of Food Science and Technology

De Wijk, R.A., Prinz, J.F. & Janssen, A.M. (2006). Explainingperceived oral texture of starch-based custard desserts from standardand novel instrumental tests. Food Hydrocolloids, 20, 24–34.
Dresselhuis, D.M., Klok, H.J., Cohen Stuart, M.A., De Vries, R.J.,Van Aken, G.A. & De Hoog, E.H.A. (2007). Tribology of o ⁄wemulsions under mouth-like conditions: determinants of friction.Food Biophysics, 2, 158–171.
Dresselhuis, D.M., Cohen Stuart, M.A., van Aken, G.A., Schipper,R.G. & De Hoog, E.H.A. (2008a). Fat retention at the tongue andthe role of saliva: adhesion and spreading of ‘protein-poor’ versus‘protein-rich’ emulsions. Journal of Colloids and Interface Science,321, 21–29.
Dresselhuis, D.M., de Hoog, E.H.A., Cohen Stuart, M.A., Vingerho-eds, M.H. & van Aken, G.A. (2008b). The occurrence of in-mouthcoalescence of emulsion droplets in relation to perception of fat.Food Hydrocolloids, 22, 1170–1183.
Drewnowski, A. (1997). Why do we like fat? Journal of the AmericanDietetic Association, 97, 58–62.
Drewnowski, A., Shrager, E.E., Lipsky, C. & Stellar, E. (1989). Sugarand fat: sensory and hedonic evaluation of liquids and solid foods.Physiology and Behavior, 45, 177–183.
Elmore, J.R., Heymann, H., Johnson, J. & Hewett, J.E. (1999).Preference mapping: relating acceptance of ‘‘creaminess’’ to adescriptive sensory map of a semi-solid. Food Quality and Prefer-ence, 10, 465–473.
Frost, M.B., Dijksterhuis, G. & Martens, M. (2001). Sensory percep-tion of fat in milk. Food Quality and Preference, 12, 327–336.
Holzapfel, G.A. (2000). Nonlinear Solid Mechanics: A ContinuumApproach for Engineering. West Sussex, UK: Wiley.
Jamani, K.D., Harrington, E. & Wilson, H.J. (1989). Rigidity ofelastomeric impression materials. Journal of Oral Rehabilitation, 16,241–248.
Janhøj, T., Bom Frøst, M., Prinz, J.F., Edrud, S. & Ipsen, R. (2009).Sensory and instrumental characterization of low-fat and non-fatcream cheese. International Journal of Food Properties, 12, 211–227.
Jans, G., van Audekercke, R., Sloten, J.V., Gobin, R., van der Perre,G. & Mommaerts, M.Y. (1998). Bending properties of cranial bonesegments of new-born children. Journal of Biomechanics, 31, 65.
Jones, S.A. (1996). Physical, Chemical and Sensory Aspects of FatReplacement. Handbook of Fat Replacers. London: CRC Press.
Malone, M., Appelqvist, I. & Norton, I. (2003). Oral behaviour offood hydrocolloids and emulsions. Part 1. Lubrication and depo-sition considerations. Food Hydrocolloids, 17, 763–773.
Mathmann, K., Kowalczyk, W., Petermeier, H., Baars, A., Eberhard,M. & Delgado, A. (2007). A numerical approach revealing theimpact of rheological properties on mouthfeel caused by food.International Journal of Food Science and Technology, 42, 739–745.
Mattes, R.D. (2001). The taste of fat elevates postprandial triacyl-glycerol. Physiology and Behavior, 74, 343–348.
Mela, D.J. (1988). Sensory assessment of fat content in food dairyproducts. Appetite, 10, 37–44.
Payan, Y. & Perrier, P. (1997). Synthesis of V–V sequences with 2Dbiomechanical tongue shape in vowel production. Speech Commu-nication, 22, 185–206.
Peng, C.L., Jost-Brinkmann, P.G., Miethke, R.R. & Lin, C.T. (2000).Ultrasonographic measurement of tongue movement during swal-lowing. Journal of Ultrasound in Medicine, 19, 15–20.
Prinz, J.F. & De Wijk, R.A. (2006). The role of fats in friction andlubrication. In: Flavour and Texture of Lipid Containing Foods(edited by H. Weenen & F. Shahidi). Pp. 95–103. Washington, DC:American Chemical Society; ACS Symposium Series 920.
Prinz, J.F., de Wijk, R.A. & Weenen, H. (2006). The role of fats infriction and lubrication. Food Lipids: Chemistry, Flavor and Texture,920, 95–103.
Prinz, J.F., de Wijk, R.A., Huntjens, L.A., Engelen, L. & Polet, I.A.(2007). Is fat perception a thermal effect? Perceptual & Motor Skills,104, 381–386.
Raats, M.M. & Shepherd, R. (1992). Free-choice profiling of milks andother products prepared with milks of different fat contents. Journalof Sensory Studies, 7, 179–203.
Ranc, H. (2006). Tribological aspects of in-mouth texture perceptionof fatty and non-fatty fluids, PhD thesis. France: E.N.S.I.A.
Ranc, H., Servais, C., Chauvy, P.F., Debaud, S. & Mischler, S.(2006a). Effect of surface structure on frictional behaviour ofa tongue ⁄ palate tribological system. Tribology International, 39,1518–1526.
Ranc, H., Elkhyat, A., Servais, C., Mac-Mary, S., Launay, B. &Humbert, Ph. (2006b). Friction coefficient and wettability of oralmucosal tissue: changes induced by a salivary layer. Colloids andSurfaces A, 276, 155–161.
Ratoi, M. & Spikes, H. (1999). Lubricating properties of aqueoussurfactant solutions. Tribology Transactions, 42, 479–486.
Reich, R. & Urbanski, J. (2004). Experimental support for thedynamic concentration theory of forming an oil reservoir at the inletof the roll bite by measuring the onset speed of starvation as afunction of oil concentration and droplet size. Tribology Transac-tions, 47, 489–499.
Richardson-Harman, N.J., Stevens, R., Walker, S. et al. (2000).Mapping consumer perceptions of creaminess and liking for liquiddairy products. Food Quality and Preference, 11, 239–246.
Schmid, S. & Wilson, W. (1996). Lubrication mechanisms for oil-in-water emulsions, lubrication engineering. Lubrication Engineering,52, 168–175.
Strugnell, C. (1993). Fat substitution: implications for the consumer.Nutrition and Food Science, 5, 24–28.
Takahashi, J. & Nakazawa, F. (1991). Effects of viscosity of liquidfoods on palatal pressure. Journal of Texture Studies, 22, 13–24.
Tieu, A.K. & Kosasih, P.B. (2007). Experimental and numerical studyof O ⁄W emulsion lubricated strip rolling in mixed film regime.Tribology Letters, 25, 23–32.
Verhagen, J.V., Rolls, E.T. & Kadohisa, M. (2003). Neurons in theprimate orbitofrontal cortex respond to fat texture independently ofviscosity. Journal of Neurophysiology, 90, 1514–1525.
Wilson, W., Sakaguchi, Y. & Schmid, S. (1994). A mixed flow model oflubrication with emulsions. Tribological Transactions, 37, 543–551.
Winders, R.V. (1958). Forces exerted on the dentition by the perioraland lingual musculature during swallowing. Angle Orthodontist, 28,226–235.
Lubrication capacity and texture of emulsions M. Bellamy et al. 1949
� 2009 The Authors. Journal compilation � 2009 Institute of Food Science and Technology International Journal of Food Science and Technology 2009