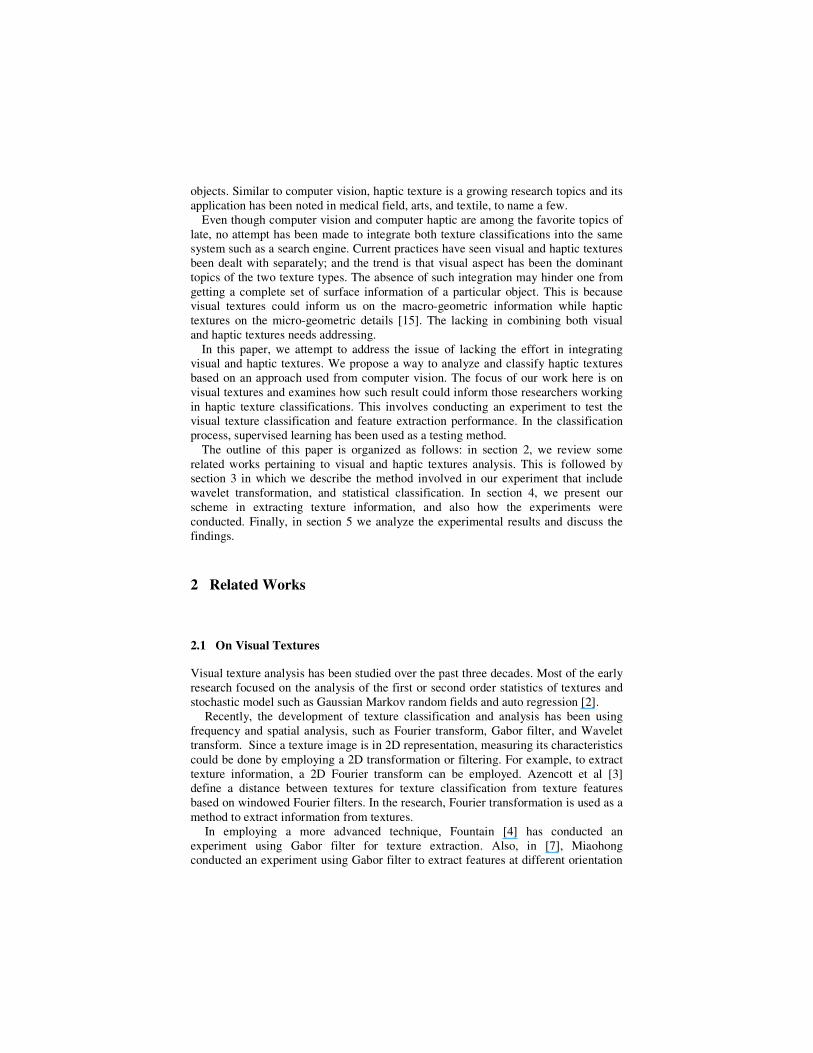
Texture classification using wavelet extraction: An approach to haptic texture searching
12
Using Wavelet Extraction for Haptic Texture Classification Waskito Adi 1 , Suziah Sulaiman 1 1 Computer and Information Sciences Department, Universiti Teknologi PETRONAS Bandar Seri Iskandar, 31750 Tronoh, Perak, Malaysia {[email protected], [email protected]} Abstract. While visual texture classification is a widely-researched topic in image analysis, little is known on its counterpart i.e. the haptic (touch) texture. This paper examines the visual texture classification in order to investigate how well it could be used for haptic texture search engine. In classifying the visual textures, feature extraction for a given image involving wavelet decomposition is used to obtain the transformation coefficients. Feature vectors are formed using energy signature from each wavelet sub-band coefficient. We conducted an experiment to investigate the extent in which wavelet decomposition could be used in haptic texture search engine. The experimental result, based on different testing data, shows that feature extraction using wavelet decomposition achieve accuracy rate more than 96%. This demonstrates that wavelet decomposition and energy signature is effective in extracting information from a visual texture. Based on this finding, we discuss on the suitability of wavelet decomposition for haptic texture searching, in terms of extracting information from image and haptic information. Keywords: Texture recognition, supervised learning, machine learning, haptic texture search engine, wavelet decomposition. 1 Introduction Lately, computer vision has become one of the most popular research subjects. Computer vision contributes in various fields that include medical, engineering, and robotics. One of the most interesting topics in computer vision is texture recognition. Being the smallest entity, textures could be used as a parameter to recognize a particular object. There are many different types of applications involving texture analysis, including medical imaging, industrial inspection, remote sensing, document segmentation, and computer based image retrieval [1]. Feature extraction plays an important role in a classification process. The effectiveness of such classification relies greatly on the choice of this feature. In this case, a suitable extraction algorithm influences the process end result. Parallel to computer vision, computer haptic is also another area which is gaining its popularity among researchers. Computer haptic enable user to touch and interact with the virtual
-
Upload
independent -
Category
Documents
-
view
2 -
download
0
Transcript of Texture classification using wavelet extraction: An approach to haptic texture searching

Using Wavelet Extraction for Haptic Texture
Classification
Waskito Adi1, Suziah Sulaiman1
1 Computer and Information Sciences Department, Universiti Teknologi PETRONAS
Bandar Seri Iskandar, 31750 Tronoh, Perak, Malaysia
{[email protected], [email protected]}
Abstract. While visual texture classification is a widely-researched topic in
image analysis, little is known on its counterpart i.e. the haptic (touch) texture.
This paper examines the visual texture classification in order to investigate how
well it could be used for haptic texture search engine. In classifying the visual
textures, feature extraction for a given image involving wavelet decomposition
is used to obtain the transformation coefficients. Feature vectors are formed
using energy signature from each wavelet sub-band coefficient. We conducted
an experiment to investigate the extent in which wavelet decomposition could
be used in haptic texture search engine. The experimental result, based on
different testing data, shows that feature extraction using wavelet
decomposition achieve accuracy rate more than 96%. This demonstrates that
wavelet decomposition and energy signature is effective in extracting
information from a visual texture. Based on this finding, we discuss on the
suitability of wavelet decomposition for haptic texture searching, in terms of
extracting information from image and haptic information.
Keywords: Texture recognition, supervised learning, machine learning, haptic
texture search engine, wavelet decomposition.
1 Introduction
Lately, computer vision has become one of the most popular research subjects.
Computer vision contributes in various fields that include medical, engineering, and
robotics. One of the most interesting topics in computer vision is texture recognition.
Being the smallest entity, textures could be used as a parameter to recognize a
particular object. There are many different types of applications involving texture
analysis, including medical imaging, industrial inspection, remote sensing, document
segmentation, and computer based image retrieval [1].
Feature extraction plays an important role in a classification process. The
effectiveness of such classification relies greatly on the choice of this feature. In this
case, a suitable extraction algorithm influences the process end result. Parallel to
computer vision, computer haptic is also another area which is gaining its popularity
among researchers. Computer haptic enable user to touch and interact with the virtual
objects. Similar to computer vision, haptic texture is a growing research topics and its
application has been noted in medical field, arts, and textile, to name a few.
Even though computer vision and computer haptic are among the favorite topics of
late, no attempt has been made to integrate both texture classifications into the same
system such as a search engine. Current practices have seen visual and haptic textures
been dealt with separately; and the trend is that visual aspect has been the dominant
topics of the two texture types. The absence of such integration may hinder one from
getting a complete set of surface information of a particular object. This is because
visual textures could inform us on the macro-geometric information while haptic
textures on the micro-geometric details [15]. The lacking in combining both visual
and haptic textures needs addressing.
In this paper, we attempt to address the issue of lacking the effort in integrating
visual and haptic textures. We propose a way to analyze and classify haptic textures
based on an approach used from computer vision. The focus of our work here is on
visual textures and examines how such result could inform those researchers working
in haptic texture classifications. This involves conducting an experiment to test the
visual texture classification and feature extraction performance. In the classification
process, supervised learning has been used as a testing method.
The outline of this paper is organized as follows: in section 2, we review some
related works pertaining to visual and haptic textures analysis. This is followed by
section 3 in which we describe the method involved in our experiment that include
wavelet transformation, and statistical classification. In section 4, we present our
scheme in extracting texture information, and also how the experiments were
conducted. Finally, in section 5 we analyze the experimental results and discuss the
findings.
2 Related Works
2.1 On Visual Textures
Visual texture analysis has been studied over the past three decades. Most of the early
research focused on the analysis of the first or second order statistics of textures and
stochastic model such as Gaussian Markov random fields and auto regression [2].
Recently, the development of texture classification and analysis has been using
frequency and spatial analysis, such as Fourier transform, Gabor filter, and Wavelet
transform. Since a texture image is in 2D representation, measuring its characteristics
could be done by employing a 2D transformation or filtering. For example, to extract
texture information, a 2D Fourier transform can be employed. Azencott et al [3]
define a distance between textures for texture classification from texture features
based on windowed Fourier filters. In the research, Fourier transformation is used as a
method to extract information from textures.
In employing a more advanced technique, Fountain [4] has conducted an
experiment using Gabor filter for texture extraction. Also, in [7], Miaohong
conducted an experiment using Gabor filter to extract features at different orientation

from hyperspectral images. In that particular research, it is said that accuracy of the
classification is over 90%. Using a different technique, Shankar conducted an
experiment [5] by using wavelet transform to extract information from finger print.
Similarly, Chi-Man Pun [6] has also conducted an experiment using wavelet to extract
information from textures. It is reported in his research that wavelet gives a better
result than Gabor filter. In this particular case, although Gabor filter is a multi-
resolution filter, wavelet transform still outperforms.
2.2 On Haptic Textures
Texture is the smallest independent quantity in an object. Research works that involve
texture are mostly conducted in image and signal processing. When including texture
in haptics field, image and signal processing algorithm will be involved. To create a
realistic object the simplest way is by employing sine wave to generate the texture
surfaces. In [16] Seungmoon Choi and Hong Z. Tan employed sine wave to render the
texture surface in order to analyze the stability during haptic texture rendering.
In order to simulate the surface of haptic texture, there are some algorithms that
can be used [16][17]. The simplest one is by using sine wave. By adjusting amplitude
and frequency of the sine wave the texture of surfaces could be obtained. In [14] Wall
developed a haptic texture rendering technique using Fourier series. The basic idea of
this rendering technique is similar with rendering using sine wave because Fourier
series using sine wave as basis to create new wave. In order to create realistic texture
for haptic rendering, Juan Wu introduced a new rendering method based on image
processing [17].
3 Methodology
3.1 Equating Haptic Texture to Visual Texture
To obtain a texture sensation, a simple technique such as sinusoidal waves could be
used to render the force feedback. Different texture pattern or profile is obtained by
adjusting frequency, and amplitude of the sine waves which could result in different
haptic sensation. For example, Wall [14] conducted an experiment that simulates
texture surface by employing Fourier series to achieve different types of haptic
texture surface.
The texture profile used in haptic rendering and its 2D image counterpart share a
similar characteristic. When rendering a property of an object, such as its haptic
texture using sinusoidal waves, the (haptic) surface will have surface properties
similar to (visual) sine waves, but in 3D plane. However, when these haptic properties
are plotted onto a 2D plane they will appear similar to 2D images. Fig. 1 shows a 2D
representation of sine and square haptic waves (Fig 1.1 & 1.2) and the actual visual
images (Fig 1.3 & 1.4).

Fig 1.1. sine wave (haptic)
texture
Fig 1.2. square wave (haptic)
texture
Fig 1.3 cloth texture (visual)
Fig 1.4 cloth texture (visual)
Fig. 1. Image visualization from haptic texture
Comparing the four images in Fig. 1, it could be assumed that haptic texture
images generated using both sine square waves have similar patterns with those non
artificial visual textures (Fig. 1.3 & 1.4). Based on the similarity of their appearances
on a 2D plane, we could claim that computer vision (CV) algorithm could also be
employed to extract information from haptic rendering data.
3.2 Determining a Method to Represent Haptic Texture
Transformation is one of the most powerful tools to analyze signal information. With
transformation, signal can be analyze and manipulated. The most common method to
analyze signal is by using Fourier transform. Fourier transforms use sine wave as
basis of the transformation, by using Fourier transform assumption, it can be inferred
that every signal is constructed by sine waves superposition. Fourier transform is
denoted as:
∫∞
∞−
− ∂= xexfwFxiωπ2)()(
(1)
The inverse of Fourier transform, which allows going from spectrum to the signal is:
∫∞
∞−
∂= ωωπ xiexFxf
2)()(
(2)

Consider a square wave, (Fig. 2), )(xf of length L2 .The range ]2,0[ L , could be written:
112)( −
−−
=
L
xH
L
xHxf
(3)
By using Fourier transform, information of square signal can be retrieved. In this
case, square signal can be decomposed into different sine wave frequency and
amplitude. Referring to the Fourier transform, if a square wave equation is
transformed, it will produce a Fourier series as follows:
∫∞
=
=
,...5,3,1
sin14
)(n
L
xn
nxf
π
π
(4)
Unlike Fourier series that uses sine wave, wavelet is a transformation that uses
transient signal as its basis. In other word wavelet transform is better than Fourier for
analyzing transient signal. Wavelet transform of )(xf is denoted as:
∫ ∂=R
ba xxfxbafW )()(),( ,ψψ (5)
Consider a signal shown in (Fig. 2), in wavelet analysis.
Fig. 2. Decomposition of square wave using Fourier Transform
The signal can be decomposed into different small basis transient signal. Otherwise if
Fourier transform is employed, the signal will be decomposed into different amplitude
and frequency of sine wave.
Fig 3. Illustration of 1-D wavelet transforms. Unlike Fourier transform that used sine wave as
basis, wavelet transform use small transient signal to transform or decompose the source signal.
Wavelet multiresolution analysis has been used as texture characterization. It provides
spatial or frequency information of an image. There are two method extractions in
wavelet multiresolution: (i) wavelet decomposition (ii) wavelet packet decomposition.

In our experiment we use 2D wavelet decomposition to extract texture images. The
decomposition offer results for image analysis. Although it is not as rich as 2D
wavelet packet (2D-WPT), it is adequate to do analysis to an image with 2D wavelet
decomposition. In 2D wavelet decomposition transform (2D-WDT), an image x is
split into an approximation and three detail image (Fig. 3). 2D-WDT can be described
as a pair of filter L and H [9], H is low pass filter, and L is high pass filter. The 2D-
WDT of a discrete N x M image can be recursively defined as:
∑∑ +++ ==
m n
p
jnimk
p
jik CnhmhCA )2,2(,
1
),(,41 )()( (6)
∑∑ ++++ ==
m n
p
jnimk
p
jik CnhmhCH )2,2(,
1
),(,141 )()( (7)
∑∑ ++++ ==
m n
p
jnimk
p
jik CnhmhCV )2,2(,
1
),(,241 )()( (8)
∑∑ ++++ ==
m n
p
jnimk
p
jik CnhmhCD )2,2(,
1
),(,341 )()( (9)
A1 is approximation coefficient, H1 is horizontal detail, V1 is vertical detail, and
D1 is diagonal detail, illustrated in (Fig. 4). In practice, the image X only has finite
number of pixels, for boundary handling different technique such as symmetric,
periodic could be used. The difference between 2D-WDT and 2D-WPT is in the
extraction process. In 2D-WDT only approximation coefficient will be transformed
whereas in 2D-WPT all of the coefficient will be recursively transformed. In the
proposed method, an image is decomposed into 4-levels. 4-level decomposition
results in 3n+1 sub-band, it means that decomposition results in 13 sub-bands.
The general transformation processes compress information from data. In wavelet
transform, if the basis signal for transformation has correlation with transformed
signal it will produce homogenous transformed coefficient. Referring to those
characteristics, characteristics of each sub-band can be used as information to form
feature vector. In order to form a feature vector, f=(x1, x2, x3,. . ., xn), the energy or
characteristic each sub-band of images have been calculated using formula (Table 1).
Table 1. Energy Calculation Formula
Energy Type Formula
Norm 2
∑∑= =
=M
m
N
n
NMCNM
e1 1
2
,1
1
Norm 1
∑∑= =
=M
m
N
n
NMCNM
e1 1
,2
1
Standard Deviation
∑∑= =
−=M
m
N
n
NMCNM
e1 1
2
,3 )(1
µ
Average Residual ∑∑ −=M N
NMCe µ,4
Entropy
∑∑−=M
NM
N
NM CCNM
e2
,
2
,5 log1

It is a common issue that data stored in feature vector have redundancy. To reduce
redundancy form the feature vector, PCA (Principle Component analysis) algorithm
should be employed [7][12][1]. With PCA algorithm, classification process could be
more effective and efficient
3.3 Testing the Classification Performance
In our research, we will employ the supervised learning to classify the texture. In
our study, in order to test the classification performance, we employ linear, quadratic
and mahalanobis classifiers. Bayesian rule has been used as a fundamental concept for
the entire classifiers. Bayesian rule is denoted as:
)(
)()|()|(
xp
PxpxP
jj
j
ωωω = (10)
Let say there are two classes of data ω1 and ω2, P(ωj) is prior probability and p(x)
is probability density function (PDF). Referring to the maximum likelihood theorem,
by maximizing the conditional probabilities P(ωj|x) decision of the class could be
obtained. In this case if P(ω1|x)>P(ω2|x) the data will belong to class ω1, otherwise if
ω2 data belong to ω2. Referring to Bayesian rule, if it assumes PDF is a normal
distribution or Gaussian, linear, quadratic and mahalamobis classifier could be
obtained. Quadratic, linear and mahalanobis could be denoted as:
Quadratic classifier:
||ln)(ln)()(2
1|max 1
jjjj
T
jPxx ∑−+−∑−− − ϖµµ (11)
Linear Classifier:
)(ln)()(2
1|max 1
jjj
T
j Pxx ϖµµ +−∑−− − (12)
Mahalanobis Classifier:
)()(|max1
jj
T
j xx µµ −∑−− − (13)
To obtain the data classes (refer to equation 11, 12, 13), there is a need to
maximize the conditional probability. In equations 11 and 12, all data are calculated
based on the relative distance between the data and data distribution, and also using
prior probability of the class as weight parameter. In mahalanobis classifier algorithm,
(equation 13), it calculates relative distance between the data and the data distribution.
4 Proposed Framework and Experiment
To this end, we have claimed that computer haptic texture classification could
replicate similar technique from computer vision. In the previous section, we have

described how wavelet and its feature extraction could be a potential candidate to
address this situation. Fig. 4 presents a proposed framework for a system that can
adopt both visual and haptic search. The framework combines both visual and haptic
texture extractions and classifications.
=
nx
x
x
x
f
...
3
2
1
Fig. 4. Proposed Framework involving the extraction and classification processes
The visual information as shown in Fig. 4 consists of the texture image data; this
information is passed to the extraction process. The process involves the wavelet
decomposition (using db-8) to get the characteristics from each image. At this stage
the energy calculation formula will be used. The feature vector f(x) is formed as a
result of this process.
In the classification stage, we employ the linear, quadratic and mahalanobis
classifiers to examine the most suitable classifier in terms of its performance. Using
the chosen classifier, the system will suggest some possible matching results.
4.1 Experiment
The effectiveness of wavelet decomposition for texture analysis and classification
has been tested in an experiment, using 76 samples of texture images. The texture set
consists of natural, artificial, and semi natural textures. The objectives of the
experiments are:
• To determine the texture classification performance for each classifier
• To identify the most effective and efficient variable to be used in a
classification process.
During the performance test, we use three different types of classifiers. We employ
linear, quadratic, and mahalanobis classifiers. Daubechies wavelet family has been
employed as an algorithm to extract the textures. Table 2 shows 16 tap of daubechies
wavelet transform filter coefficient.

Table 2. 16 Tap of Daubechies-8 Wavelet Transform Filter Coefficient
h(0) 0.0385 h(8) -0.0123
h(1) 0.2212 h(9) -0.0312
h(2) 0.4777 h(10) 0.0099
h(3) 0.4139 h(11) 0.0062
h(4) -0.0112 h(12) -0.0034
h(5) -0.2008 h(13) -0.0003
h(6) 0.0003 h(14) 0.0005
h(7) 0.0910 h(15) -0.0001
The textures have been decomposed into 4-level. It means that decomposition
processes results in 13 coefficient sub-band. To conduct the experiment we prepare a
learning sample and testing data sets. We create a random 512x512 pixel image from
the texture image. For each 512x512 pixel image we partition this image into 4
265x265 without overlapping each other. We generate 100 random images 128x128
from each 256x256 images. In other words, for each sample we have 400 samples.
We use 200 samples for learning process and the other 200 samples for testing.
To test the performance of the classification, we conduct three experiments with
different feature vectors and different classification methods. We employed the linear,
quadratic, and mahalanobis classifiers in the experiments, consecutively. For the first
experiment, we use the entire feature of vector element, meaning that all the extracted
information was used. The second experiment was to test the effect of the element
number with classification process. We start by using 1 feature vector element up to
the entire elements. In the third experiment, we use only one type of energy
calculation algorithm.
5 Findings and Analysis
As described earlier, in the experiment we have used the three classifiers to measure
the accuracy of classification performance. In each classification process we measure
the error rate of each method. The classification testing involves:
1) Measuring the number of feature vector element versus error rate
2) Measuring the effect using different type of feature vector
3) Comparing the classification method
4) Finding the optimum number of feature vector element
The first experiment was conducted by measuring the error rate for each feature
vector that have different element. Since we have Level-4 wavelet decomposition, it
means that we have 13 different sub-bands. For each sub-band we calculate the
energy using the formula in (Table 1), which means we have 65 different values to
form a feature vector. In this experiment we form a feature vector started using 1
element to 65 elements, f(x1) to f(x1, x1, x1,. . ., x65). In this test, quadratic classifier
gives the most accurate results when compared with linear and mahalanobis
classifiers. The classification results are summarized in Figure 5 and Table 3.

Table 3. 16 Tap of Daubechies-8 Wavelet Transform Filter Coefficient
Energy Norm1 Norm2 Std dev Ave. residual Entropy
1 0.8661 0.8656 0.8584 0.9212 0.8666
2 0.6899 0.8379 0.7063 0.5719 0.6389
3 0.4606 0.8200 0.5540 0.3503 0.5241
4 0.3198 0.7755 0.5337 0.2409 0.4041 5 0.3068 0.7460 0.3248 0.2226 0.3936
6 0.1672 0.7065 0.1607 0.1461 0.2459
7 0.1072 0.6691 0.1057 0.1022 0.1727 8 0.0917 0.6361 0.0744 0.0605 0.1594
9 0.0527 0.6205 0.0610 0.0311 0.1113
10 0.0348 0.6057 0.0562 0.0228 0.0840 11 0.0210 0.5903 0.0327 0.0179 0.0683
12 0.0126 0.5580 0.0199 0.0140 0.0524
13 0.0068 0.5432 0.1066 0.0119 0.0411
We carried out a second experiment similar to the first but for this time we only
use one type of energy to form the feature vector. This means that the feature vector
only formed from norm1, norm2, standard deviation, average residual and entropy
(Table 3). The experimental results show that the best performance was achieved with
average residual energy calculation. In this experiment quadratic classifier has been
employed and overall error rate is 1.19%. This suggests that average residual is more
effective than other energy calculation method.
From the experimental result, it shows that the number of element of feature
vector, and the number of energy used are affecting the accuracy of classification
process. Using the data of the experiment, optimization of the classification system
could be done by reducing the element of the feature vector. In Figure 5.1, it is
indicated that the optimum number element is 20. The visual representation shows
that the error rate starts to convergence when the number of feature vector element is
20. This means that if we add more elements in, more energy will be used. This does
not show any significant improvement to Figure 5.1.
The experiment has resulted in the quadratic classifier being the most accurate
method. Error rate for quadratic classifier is 0.18%. This result shows that feature
extraction using wavelet is suitable for texture classification. Based on the second
experiment it shows that the most effective and efficient energy calculation algorithm
is using the average residual, (Figure 5.2). Overall error rate for 13 number of energy,
i.e. element of the feature vector, is 1.19%. Overall accuracy is about 98%. From this
result we can suggest that wavelet feature extraction should be suitable for haptic
texture searching that deals not only with visual representation, but also the touch
sensation.

Fig 5.1 Fig 5.2
Fig 5. Classification Accuracy experiment by using different type of energy. In this particular
experiment, quadratic classifier has been employed. In this experiment, average residual gives
most effective feature vector element for classification. 1). error propagation for quadratic,
linear and mahalanobis classifier. 2). Propagation error for quadratic classifier for each type of
energy.
6 Conclusion and Future Work
In this paper, we have addressed the problem in haptic searching method and
proposed a framework that integrates both visual and haptic in a texture search
engine. We claimed that techniques in computer vision could be replicated for
computer haptic. We predicted that wavelet decomposition could be the best
candidate. In justifying our claim, we reviewed the standard 2D wavelet
decomposition. Then we defined an algorithm to extract the texture. The feature
extraction involves wavelet transform and five different energy measurements. The
construction of feature vector is done using different techniques. Firstly, we used the
entire energy from entire sub-band; secondly, we used only one type of energy for
entire sub-band.
The several series of experiments to find out the suitable method for extraction
and searching process show that quadratic classifier outperforms two other
classification methods. Also, based on the experiment, average residual is the most
effective and efficient energy measurements method, beside norm 2. The overall error
rate for average residual energy calculation in quadratic classification was 1.19%.
Since haptic rendering data and 2D images have similarity, based on this
experiment, we can conclude that 2D wavelet decomposition and wavelet energy
signature could be employed in haptic data extraction. With this experiment results
we could suggest that this method could be suitable for our proposed haptic texture
searching. Future work will include implementation of this method in our haptic
texture search engine.
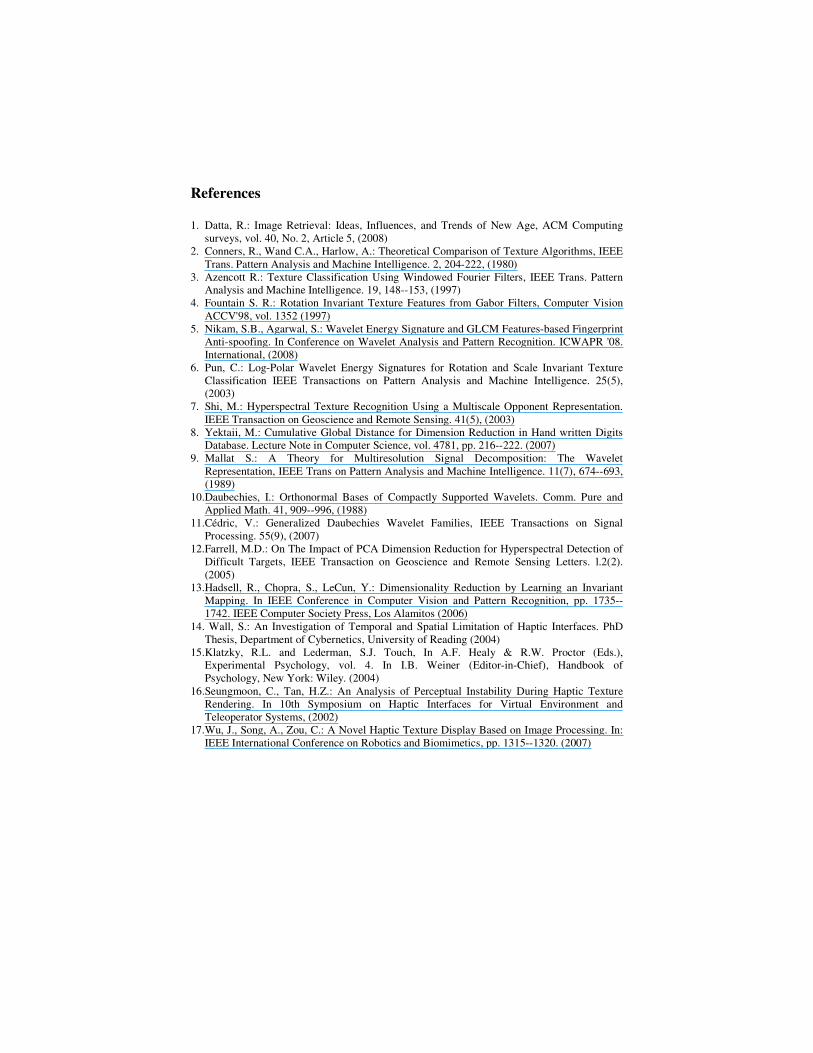
References
1. Datta, R.: Image Retrieval: Ideas, Influences, and Trends of New Age, ACM Computing
surveys, vol. 40, No. 2, Article 5, (2008)
2. Conners, R., Wand C.A., Harlow, A.: Theoretical Comparison of Texture Algorithms, IEEE
Trans. Pattern Analysis and Machine Intelligence. 2, 204-222, (1980)
3. Azencott R.: Texture Classification Using Windowed Fourier Filters, IEEE Trans. Pattern
Analysis and Machine Intelligence. 19, 148--153, (1997)
4. Fountain S. R.: Rotation Invariant Texture Features from Gabor Filters, Computer Vision
ACCV'98, vol. 1352 (1997)
5. Nikam, S.B., Agarwal, S.: Wavelet Energy Signature and GLCM Features-based Fingerprint
Anti-spoofing. In Conference on Wavelet Analysis and Pattern Recognition. ICWAPR '08.
International, (2008)
6. Pun, C.: Log-Polar Wavelet Energy Signatures for Rotation and Scale Invariant Texture
Classification IEEE Transactions on Pattern Analysis and Machine Intelligence. 25(5),
(2003)
7. Shi, M.: Hyperspectral Texture Recognition Using a Multiscale Opponent Representation.
IEEE Transaction on Geoscience and Remote Sensing. 41(5), (2003)
8. Yektaii, M.: Cumulative Global Distance for Dimension Reduction in Hand written Digits
Database. Lecture Note in Computer Science, vol. 4781, pp. 216--222. (2007)
9. Mallat S.: A Theory for Multiresolution Signal Decomposition: The Wavelet
Representation, IEEE Trans on Pattern Analysis and Machine Intelligence. 11(7), 674--693,
(1989)
10.Daubechies, I.: Orthonormal Bases of Compactly Supported Wavelets. Comm. Pure and
Applied Math. 41, 909--996, (1988)
11.Cédric, V.: Generalized Daubechies Wavelet Families, IEEE Transactions on Signal
Processing. 55(9), (2007)
12. Farrell, M.D.: On The Impact of PCA Dimension Reduction for Hyperspectral Detection of
Difficult Targets, IEEE Transaction on Geoscience and Remote Sensing Letters. l.2(2).
(2005)
13.Hadsell, R., Chopra, S., LeCun, Y.: Dimensionality Reduction by Learning an Invariant
Mapping. In IEEE Conference in Computer Vision and Pattern Recognition, pp. 1735--
1742. IEEE Computer Society Press, Los Alamitos (2006)
14. Wall, S.: An Investigation of Temporal and Spatial Limitation of Haptic Interfaces. PhD
Thesis, Department of Cybernetics, University of Reading (2004)
15. Klatzky, R.L. and Lederman, S.J. Touch, In A.F. Healy & R.W. Proctor (Eds.),
Experimental Psychology, vol. 4. In I.B. Weiner (Editor-in-Chief), Handbook of
Psychology, New York: Wiley. (2004)
16. Seungmoon, C., Tan, H.Z.: An Analysis of Perceptual Instability During Haptic Texture
Rendering. In 10th Symposium on Haptic Interfaces for Virtual Environment and
Teleoperator Systems, (2002)
17. Wu, J., Song, A., Zou, C.: A Novel Haptic Texture Display Based on Image Processing. In:
IEEE International Conference on Robotics and Biomimetics, pp. 1315--1320. (2007)