Texture signals in whisker vibrations
9
95:1792-1799, 2006. First published Dec 7, 2005; doi:10.1152/jn.01104.2005 J Neurophysiol Mathew E. Diamond and Peter König Joerg Hipp, Ehsan Arabzadeh, Erik Zorzin, Jorg Conradt, Christoph Kayser, Texture Signals in Whisker Vibrations You might find this additional information useful... 27 articles, 12 of which you can access free at: This article cites http://jn.physiology.org/cgi/content/full/95/3/1792#BIBL including high-resolution figures, can be found at: Updated information and services http://jn.physiology.org/cgi/content/full/95/3/1792 can be found at: Journal of Neurophysiology about Additional material and information http://www.the-aps.org/publications/jn This information is current as of June 14, 2006 . http://www.the-aps.org/. American Physiological Society. ISSN: 0022-3077, ESSN: 1522-1598. Visit our website at (monthly) by the American Physiological Society, 9650 Rockville Pike, Bethesda MD 20814-3991. Copyright © 2005 by the publishes original articles on the function of the nervous system. It is published 12 times a year Journal of Neurophysiology on June 14, 2006 jn.physiology.org Downloaded from
-
Upload
independent -
Category
Documents
-
view
2 -
download
0
Transcript of Texture signals in whisker vibrations
95:1792-1799, 2006. First published Dec 7, 2005; doi:10.1152/jn.01104.2005 J NeurophysiolMathew E. Diamond and Peter König Joerg Hipp, Ehsan Arabzadeh, Erik Zorzin, Jorg Conradt, Christoph Kayser,Texture Signals in Whisker Vibrations
You might find this additional information useful...
27 articles, 12 of which you can access free at: This article cites http://jn.physiology.org/cgi/content/full/95/3/1792#BIBL
including high-resolution figures, can be found at: Updated information and services http://jn.physiology.org/cgi/content/full/95/3/1792
can be found at: Journal of Neurophysiologyabout Additional material and information http://www.the-aps.org/publications/jn
This information is current as of June 14, 2006 .
http://www.the-aps.org/.American Physiological Society. ISSN: 0022-3077, ESSN: 1522-1598. Visit our website at (monthly) by the American Physiological Society, 9650 Rockville Pike, Bethesda MD 20814-3991. Copyright © 2005 by the
publishes original articles on the function of the nervous system. It is published 12 times a yearJournal of Neurophysiology
on June 14, 2006 jn.physiology.org
Dow
nloaded from
Texture Signals in Whisker Vibrations
Joerg Hipp,1 Ehsan Arabzadeh,2 Erik Zorzin,2 Jorg Conradt,1 Christoph Kayser,3 Mathew E. Diamond,2
and Peter Konig1,4
1University/ETH Zurich, Institute of Neuroinformatics, Zurich, Switzerland.; 2International School for Advanced Studies,Cognitive Neuroscience Sector, Trieste, Italy; 3Max Planck Institute for Biological Cybernetics, Physiology of Cognitive Processes,Tubingen, Germany; and 4University of Osnabruck, Institute of Cognitive Science, Department of Neurobiopsychology,Osnabruck, Germany
Submitted 19 October 2005; accepted in final form 29 November 2005
Hipp, Joerg, Ehsan Arabzadeh, Erik Zorzin, Jorg Conradt, Chris-toph Kayser, Mathew E. Diamond, and Peter Konig. Texture signalsin whisker vibrations. J Neurophysiol 95: 1792–1799, 2006. First pub-lished December 7, 2005; doi:10.1152/jn.01104.2005. Rodents excel inmaking texture judgments by sweeping their whiskers across a surface.Here we aimed to identify the signals present in whisker vibrations thatgive rise to such fine sensory discriminations. First, we used sensors tocapture vibration signals in metal whiskers during active whisking of anartificial system and in natural whiskers during whisking of rats in vivo.Then we developed a classification algorithm that successfully matchedthe vibration frequency spectra of single trials to the texture that inducedit. For artificial whiskers, the algorithm correctly identified one texture ofeight alternatives on 40% of trials; for in vivo natural whiskers, thealgorithm correctly identified one texture of five alternatives on 80% oftrials. Finally, we asked which were the key discriminative features of thevibration spectra. Under both artificial and natural conditions, the com-bination of two features accounted for most of the information: Themodulation power—the power of the part of the whisker movementrepresenting the modulation due to the texture surface—increased withthe coarseness of the texture; the modulation centroid—a measure relatedto the center of gravity within the power spectrum—decreased with thecoarseness of the texture. Indeed, restricting the signal to these twoparameters led to performance three-fourths as high as the full spectra.Because earlier work showed that modulation power and centroid aredirectly related to neuronal responses in the whisker pathway, we con-clude that the biological system optimally extracts vibration features topermit texture classification.
I N T R O D U C T I O N
The whiskers are one of the principal sources of sensoryinformation for rodents; a conspicuous and specialized sensorypathway has evolved to process vibrissal signals. Since thediscovery of rodent barrel cortex (Woolsey and Van der Loos1970), great strides have been made in understanding therelationship between the circuitry and the physiological prop-erties of neurons (Armstrong-James and Fox 1987; Brecht etal. 2003; Staiger et al. 2004). In the last few years, research hasbegun to turn to another aspect of sensory processing: howdoes neuronal activity represent the real physical objects withwhich the animal interacts? Through active movement of theirwhiskers, rats are able to discriminate the shape of smallobjects, the aperture size of openings, and the distance andlocation of objects (Brecht et al. 1997; Hutson and Masterton1986; Krupa et al. 2001). An additional sensory capacity, thefocus of the present work, is the discrimination of the surface
features of objects; rats can judge the depth and distancebetween ridges as well as the coarseness of textures (Carvelland Simons 1990, 1995; Guic-Robles et al. 1989). Indeed,when making a texture discrimination by sweeping their whis-kers across a surface, rats demonstrate discriminative capaci-ties that rival or exceed those of humans using their fingertips.Here we aim to identify the signals present in whisker move-ment that give rise to such fine sensory discriminations.
The nature of the signals present in the whiskers is of interestfor several reasons. First, whiskers carry out a signal transforma-tion, acting as the interface between external objects and sensoryreceptor neurons. Whereas in visual system it is readily apparentthat sensory receptors transduce the energy of photons, such astraightforward statement cannot be made for the whisker sensorysystem. To probe a texture, rodents actively move their whiskersat a frequency of �5–12 Hz (Carvell and Simons 1990, 1995;Harvey et al. 2001). Signals arising from contact with the objectsurface are conducted toward the follicle, where the primarysensory neurons are situated. In this process, the mechanicalproperties of whiskers modify the signals in ways that are onlyrecently beginning to be understood (Fend et al. 2003; Hartmannet al. 2003; Neimark et al. 2003). Second, the features of thesignals that reach the whisker follicle can give us indications ofwhat to expect in neuronal processing. If sensory processingmechanisms have evolved to take advantage of the most infor-mative features of the physical signal, then identifying thoseinformative features will lead us to more precise hypotheses aboutneuronal processing mechanisms.
In this study, we investigate which features of the whiskermovements are best suited for the discrimination of textures.We use a hardware model of a whisker system as well as invivo measurements of rat whiskers. Applying a classificationalgorithm to the power spectra of whisker movements, weidentify vibration features which could be extracted to supportoptimal performance. This leads to a model of texture discrim-ination that is, we argue, corroborated by recent electrophysi-ological experiments (Arabzadeh et al. 2005).
M E T H O D S
Hardware model
RECORDING SETUP. To probe textures, rodents actively move theirwhiskers across them. We simulated this process using metal whiskers
Address for reprint requests and other correspondence: J. Hipp, Institute ofNeuroinformatics, University/ETH Zurich, Winterthurerstrasse 190, 8057 Zu-rich, Switzerland (E-mail: [email protected]).
The costs of publication of this article were defrayed in part by the paymentof page charges. The article must therefore be hereby marked “advertisement”in accordance with 18 U.S.C. Section 1734 solely to indicate this fact.
J Neurophysiol 95: 1792–1799, 2006.First published December 7, 2005; doi:10.1152/jn.01104.2005.
1792 0022-3077/06 $8.00 Copyright © 2006 The American Physiological Society www.jn.org
on June 14, 2006 jn.physiology.org
Dow
nloaded from
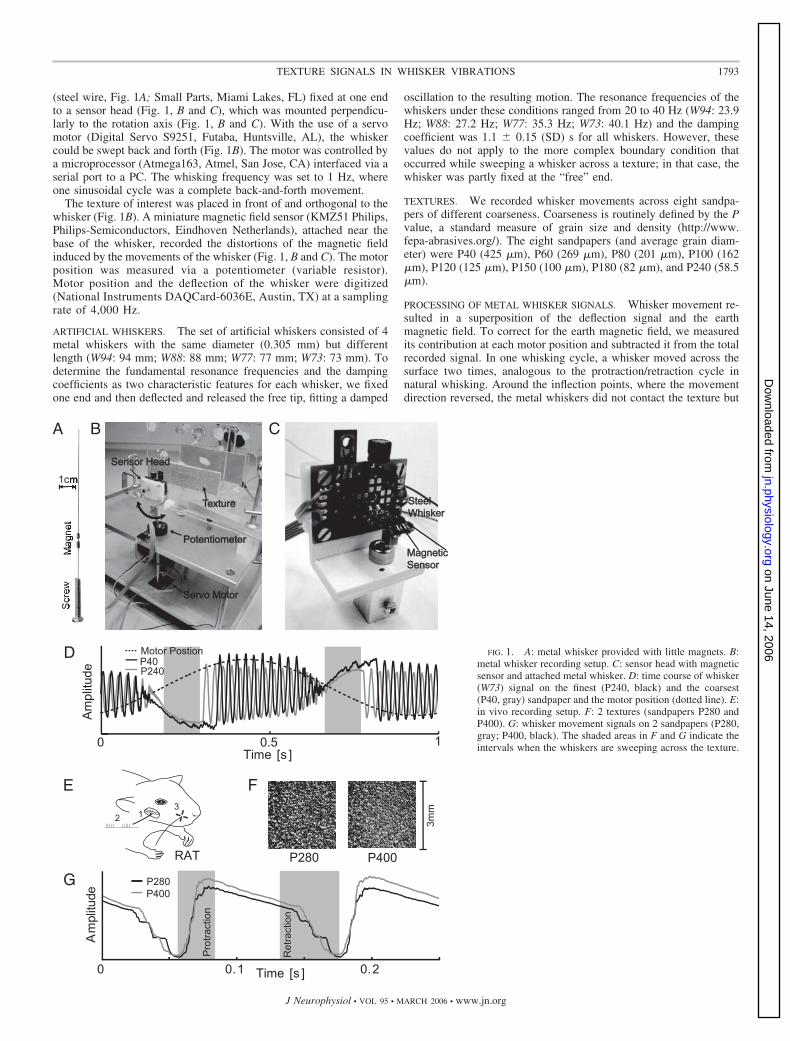
(steel wire, Fig. 1A; Small Parts, Miami Lakes, FL) fixed at one endto a sensor head (Fig. 1, B and C), which was mounted perpendicu-larly to the rotation axis (Fig. 1, B and C). With the use of a servomotor (Digital Servo S9251, Futaba, Huntsville, AL), the whiskercould be swept back and forth (Fig. 1B). The motor was controlled bya microprocessor (Atmega163, Atmel, San Jose, CA) interfaced via aserial port to a PC. The whisking frequency was set to 1 Hz, whereone sinusoidal cycle was a complete back-and-forth movement.
The texture of interest was placed in front of and orthogonal to thewhisker (Fig. 1B). A miniature magnetic field sensor (KMZ51 Philips,Philips-Semiconductors, Eindhoven Netherlands), attached near thebase of the whisker, recorded the distortions of the magnetic fieldinduced by the movements of the whisker (Fig. 1, B and C). The motorposition was measured via a potentiometer (variable resistor).Motor position and the deflection of the whisker were digitized(National Instruments DAQCard-6036E, Austin, TX) at a samplingrate of 4,000 Hz.
ARTIFICIAL WHISKERS. The set of artificial whiskers consisted of 4metal whiskers with the same diameter (0.305 mm) but differentlength (W94: 94 mm; W88: 88 mm; W77: 77 mm; W73: 73 mm). Todetermine the fundamental resonance frequencies and the dampingcoefficients as two characteristic features for each whisker, we fixedone end and then deflected and released the free tip, fitting a damped
oscillation to the resulting motion. The resonance frequencies of thewhiskers under these conditions ranged from 20 to 40 Hz (W94: 23.9Hz; W88: 27.2 Hz; W77: 35.3 Hz; W73: 40.1 Hz) and the dampingcoefficient was 1.1 � 0.15 (SD) s for all whiskers. However, thesevalues do not apply to the more complex boundary condition thatoccurred while sweeping a whisker across a texture; in that case, thewhisker was partly fixed at the “free” end.
TEXTURES. We recorded whisker movements across eight sandpa-pers of different coarseness. Coarseness is routinely defined by the Pvalue, a standard measure of grain size and density (http://www.fepa-abrasives.org/). The eight sandpapers (and average grain diam-eter) were P40 (425 �m), P60 (269 �m), P80 (201 �m), P100 (162�m), P120 (125 �m), P150 (100 �m), P180 (82 �m), and P240 (58.5�m).
PROCESSING OF METAL WHISKER SIGNALS. Whisker movement re-sulted in a superposition of the deflection signal and the earthmagnetic field. To correct for the earth magnetic field, we measuredits contribution at each motor position and subtracted it from the totalrecorded signal. In one whisking cycle, a whisker moved across thesurface two times, analogous to the protraction/retraction cycle innatural whisking. Around the inflection points, where the movementdirection reversed, the metal whiskers did not contact the texture but
FIG. 1. A: metal whisker provided with little magnets. B:metal whisker recording setup. C: sensor head with magneticsensor and attached metal whisker. D: time course of whisker(W73) signal on the finest (P240, black) and the coarsest(P40, gray) sandpaper and the motor position (dotted line). E:in vivo recording setup. F: 2 textures (sandpapers P280 andP400). G: whisker movement signals on 2 sandpapers (P280,gray; P400, black). The shaded areas in F and G indicate theintervals when the whiskers are sweeping across the texture.
1793TEXTURE SIGNALS IN WHISKER VIBRATIONS
J Neurophysiol • VOL 95 • MARCH 2006 • www.jn.org
on June 14, 2006 jn.physiology.org
Dow
nloaded from
oscillated at their resonance frequency (Fig. 1D). Using motor posi-tion as a reference, we discarded these segments and selected thosewhen the whisker touched the texture (gray shading, Fig. 1D). Werefer to these as sweeps. The two directions were treated separatelyand gave equivalent results; analyses are based on sweeps in onedirection only. After low-pass filtering (150 Hz; chebyshev type IIfilter of 5th order) and subtracting a polynomial of third order, weapplied a Hanning window (raised cosine window) and zero padding(adding zeros in the temporal domain to increase the frequencyresolution), and then calculated the power spectra.
In vivo recording
RECORDING SETUP. The data were originally collected as describedin Arabzadeh et al. (2005). Experiments were conducted in accor-dance with National Institutes of Health and institutional standards forthe care and use of animals in research. Subjects were 10 adult male250 to 350 g Wistar rats anesthetized with urethan (1.5 g/kg), and dataare presented from one case with the most complete stimulus set; thewhisker in this dataset was C3. “Electrical whisking ” (Brown andWaite 1974; Szwed et al. 2003) was generated by stimulating the rightfacial nerve (Fig. 1E) with 1 to 2 V pulses of 100 �s at 200 Hz for 60ms to produce whisker protraction, followed by a passive 65 mswhisker retraction (also see Fig. 1 in Arabzadeh et al. 2005). Theangle traversed at the whisker base, averaged across all trials and alltextures, was 25 � 6.1° (mean � SD). Horizontal and verticalmovements at the base were registered by a two-channel opticalsensor, each channel consisting of a light-emitting diode (LED) lightsource and phototransistor. The two voltage signals were digitized(7,634 samples/s). Whisker movement was recorded in contact withfive surfaces of different coarseness for 10 min each [compact diskand 4 sandpapers: P1200 (15.3 �m), P400 (35.0 �m), P280 (52.2�m), P100 (162 �m); Fig. 1F illustrates P280 and P400].
PROCESSING OF IN VIVO WHISKER SIGNALS. We examined the prin-cipal direction of whisker movement, corresponding to the horizontalforward- backward axis. Movement in this axis contained all thetexture-specific signals (Arabzadeh et al. 2005) and allowed an anal-ysis in one dimension, similar to that of the metal whiskers (Fig. 1G).We extracted 300 protraction and retraction segments for each texture(illustrated by gray backgrounds in Fig. 1G). After band-pass filtering(cut off frequency 30 Hz, 150 Hz; chebyshev type II filter of 5thorder), we applied a Hanning window, zero padding, and then calcu-lated the power spectra.
Classification
The whisker movements in each sweep across a texture werecharacterized by their power spectrum, a good representation ofwhisker kinetics (see Fig. 1, Arabzadeh et al. 2005). However, thefrequency resolution and the wide frequency band investigatedyielded vectors of several hundred dimensions, unsuitable for classi-fication. To estimate the classification performance supported bywhisker movements’ power spectrum, we reduced the dimensionalityof the data using the generalization of Fisher’s linear discriminant tomulti dimensions (Fisher transform), applied density estimation, max-imum likelihood classification and then documented the results ashit-matrices, fraction correct classified and mutual information. Thesteps are next described in detail.
GENERALIZATION OF FISHER’S LINEAR DISCRIMINANT (FISHER
TRANSFORM). The Fisher transform finds a linear projection suchthat the classes are best separated (Bishop 1995). This is achieved bymaximizing the product of the between-class scatter matrix (SB) andthe inverse of the within-class scatter matrix (SW)
SB � �t
nt(�t � �) � ��t � ��T (1)
SW � �t
�s�t
�xst � �t� � �xs
t � �t�T (2)
where t is the texture class index (8 classes for metal whiskers and 5for the rat whisker); nt is the number of samples in class t; xs
t is the sthsweep from texture class t; �t is the mean of class t and � is the meanover all sweeps. In this notation, we use column vectors and T
indicates the transpose. We refer to this transform as Fishertransform.
PARAMETRIC DENSITY ESTIMATION. We approximated the proba-bility distribution of feature vectors pertaining to each texture class bya multi-dimensional Gaussian (n dimensions). Given a set of featurevectors xs
t , e.g., the vector components after the Fisher transform,relating to texture t and sweep s, we computed the class specific means�t and covariance matrices �t. This yields an estimation of theprobability distribution of the feature vectors for each class
pt�x� �1
� �2��n � det��t�� e�
12 �x��t�
�t�1
�x��t�T(3)
CLASS ASSIGNMENT. For classification, we randomly select twodisjoint subsets: 100 sweeps for the metal whisker data, 150 sweepsfor in vivo data. One subset was used to compute the Fisher transformand to estimate the class probability densities (training). The secondsubset was used to measure performance. Each sample feature vectorof the validation set was then assigned to the texture class with themaximum likelihood
c��ts� �
arg maxt
�pt��ts�� (4)
Classification results were visualized as a hit-matrix (H), whichcontained for each sweep from texture class t � i the probability ofbeing assigned to a class c � j
Hi,j � w�c � j�t � i� (5)
To quantify the classification performance as a single value, wecomputed the fraction of correctly classified sweeps
C�H� �
�i
Hi,i
�i
�j
Hi,j
(6)
To compare classification performance of samples from m differenttextures (chance level: 1/m) under two different conditions C1, C2, weevaluated the relative performance (R) and the relative performancegain (G � R � 1)
R �C2 � 1/m
C1 � 1/m(7)
Additionally, we measured the mutual information
I�H� � �i�1
m �j�1
m
w�t � j� � Hi,j � log2� Hi,j
w�c � j�� (8)
The value of I(H) is in bits.All data processing was in MATLAB (http://www.mathworks.
com).
R E S U L T S
We first illustrate texture-induced vibrations in the hardwaremodel of the whisker system and introduce a spectral analysisalgorithm that yields good classification performance. We thenuncover two features of whisker vibration that, by themselves,
1794 HIPP ET AL.
J Neurophysiol • VOL 95 • MARCH 2006 • www.jn.org
on June 14, 2006 jn.physiology.org
Dow
nloaded from
can support a high level of discrimination performance. Fi-nally, we apply this same simple signal processing algorithm tothe data obtained in vivo.
Texture-induced vibrations in the hardware model
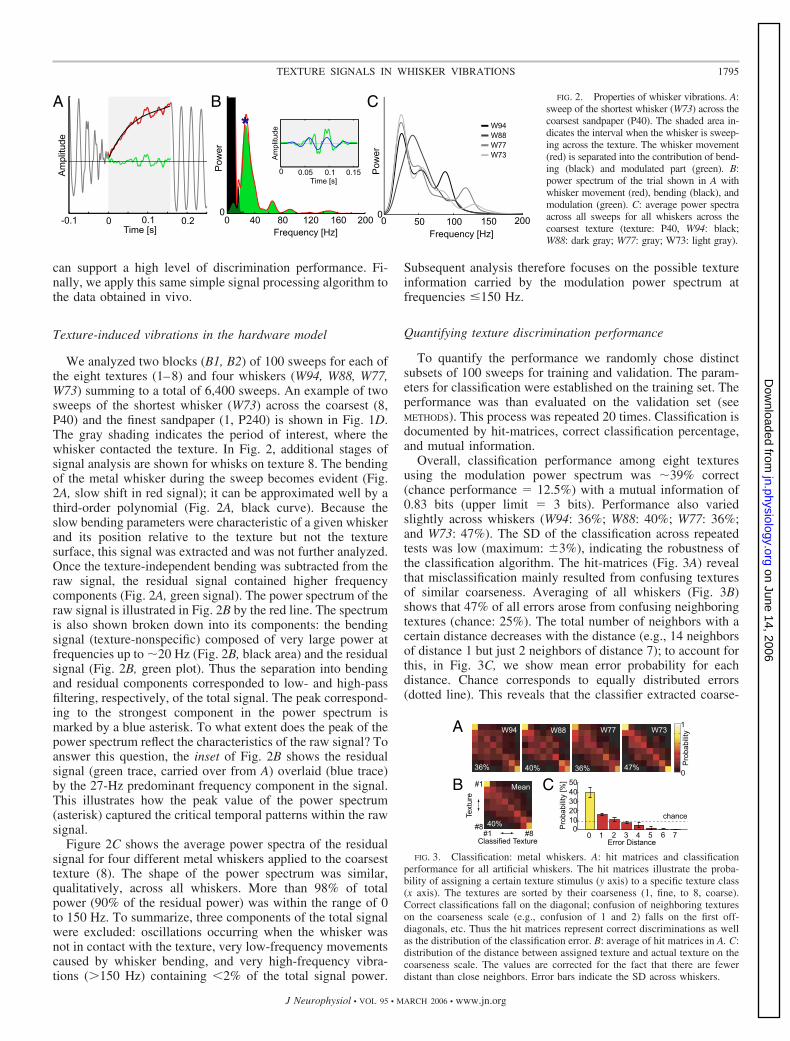
We analyzed two blocks (B1, B2) of 100 sweeps for each ofthe eight textures (1–8) and four whiskers (W94, W88, W77,W73) summing to a total of 6,400 sweeps. An example of twosweeps of the shortest whisker (W73) across the coarsest (8,P40) and the finest sandpaper (1, P240) is shown in Fig. 1D.The gray shading indicates the period of interest, where thewhisker contacted the texture. In Fig. 2, additional stages ofsignal analysis are shown for whisks on texture 8. The bendingof the metal whisker during the sweep becomes evident (Fig.2A, slow shift in red signal); it can be approximated well by athird-order polynomial (Fig. 2A, black curve). Because theslow bending parameters were characteristic of a given whiskerand its position relative to the texture but not the texturesurface, this signal was extracted and was not further analyzed.Once the texture-independent bending was subtracted from theraw signal, the residual signal contained higher frequencycomponents (Fig. 2A, green signal). The power spectrum of theraw signal is illustrated in Fig. 2B by the red line. The spectrumis also shown broken down into its components: the bendingsignal (texture-nonspecific) composed of very large power atfrequencies up to �20 Hz (Fig. 2B, black area) and the residualsignal (Fig. 2B, green plot). Thus the separation into bendingand residual components corresponded to low- and high-passfiltering, respectively, of the total signal. The peak correspond-ing to the strongest component in the power spectrum ismarked by a blue asterisk. To what extent does the peak of thepower spectrum reflect the characteristics of the raw signal? Toanswer this question, the inset of Fig. 2B shows the residualsignal (green trace, carried over from A) overlaid (blue trace)by the 27-Hz predominant frequency component in the signal.This illustrates how the peak value of the power spectrum(asterisk) captured the critical temporal patterns within the rawsignal.
Figure 2C shows the average power spectra of the residualsignal for four different metal whiskers applied to the coarsesttexture (8). The shape of the power spectrum was similar,qualitatively, across all whiskers. More than 98% of totalpower (90% of the residual power) was within the range of 0to 150 Hz. To summarize, three components of the total signalwere excluded: oscillations occurring when the whisker wasnot in contact with the texture, very low-frequency movementscaused by whisker bending, and very high-frequency vibra-tions (�150 Hz) containing 2% of the total signal power.
Subsequent analysis therefore focuses on the possible textureinformation carried by the modulation power spectrum atfrequencies �150 Hz.
Quantifying texture discrimination performance
To quantify the performance we randomly chose distinctsubsets of 100 sweeps for training and validation. The param-eters for classification were established on the training set. Theperformance was than evaluated on the validation set (seeMETHODS). This process was repeated 20 times. Classification isdocumented by hit-matrices, correct classification percentage,and mutual information.
Overall, classification performance among eight texturesusing the modulation power spectrum was �39% correct(chance performance � 12.5%) with a mutual information of0.83 bits (upper limit � 3 bits). Performance also variedslightly across whiskers (W94: 36%; W88: 40%; W77: 36%;and W73: 47%). The SD of the classification across repeatedtests was low (maximum: �3%), indicating the robustness ofthe classification algorithm. The hit-matrices (Fig. 3A) revealthat misclassification mainly resulted from confusing texturesof similar coarseness. Averaging of all whiskers (Fig. 3B)shows that 47% of all errors arose from confusing neighboringtextures (chance: 25%). The total number of neighbors with acertain distance decreases with the distance (e.g., 14 neighborsof distance 1 but just 2 neighbors of distance 7); to account forthis, in Fig. 3C, we show mean error probability for eachdistance. Chance corresponds to equally distributed errors(dotted line). This reveals that the classifier extracted coarse-
A B C FIG. 2. Properties of whisker vibrations. A:sweep of the shortest whisker (W73) across thecoarsest sandpaper (P40). The shaded area in-dicates the interval when the whisker is sweep-ing across the texture. The whisker movement(red) is separated into the contribution of bend-ing (black) and modulated part (green). B:power spectrum of the trial shown in A withwhisker movement (red), bending (black), andmodulation (green). C: average power spectraacross all sweeps for all whiskers across thecoarsest texture (texture: P40, W94: black;W88: dark gray; W77: gray; W73: light gray).
B
A
C
FIG. 3. Classification: metal whiskers. A: hit matrices and classificationperformance for all artificial whiskers. The hit matrices illustrate the proba-bility of assigning a certain texture stimulus (y axis) to a specific texture class(x axis). The textures are sorted by their coarseness (1, fine, to 8, coarse).Correct classifications fall on the diagonal; confusion of neighboring textureson the coarseness scale (e.g., confusion of 1 and 2) falls on the first off-diagonals, etc. Thus the hit matrices represent correct discriminations as wellas the distribution of the classification error. B: average of hit matrices in A. C:distribution of the distance between assigned texture and actual texture on thecoarseness scale. The values are corrected for the fact that there are fewerdistant than close neighbors. Error bars indicate the SD across whiskers.
1795TEXTURE SIGNALS IN WHISKER VIBRATIONS
J Neurophysiol • VOL 95 • MARCH 2006 • www.jn.org
on June 14, 2006 jn.physiology.org
Dow
nloaded from
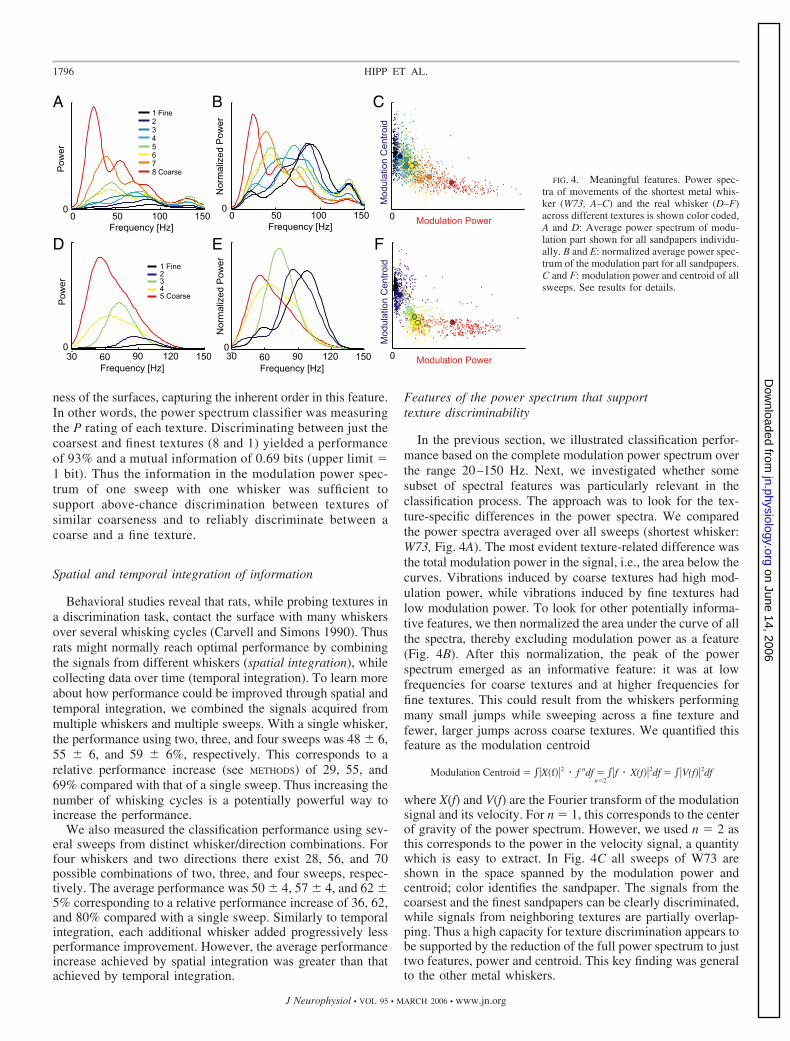
ness of the surfaces, capturing the inherent order in this feature.In other words, the power spectrum classifier was measuringthe P rating of each texture. Discriminating between just thecoarsest and finest textures (8 and 1) yielded a performanceof 93% and a mutual information of 0.69 bits (upper limit �1 bit). Thus the information in the modulation power spec-trum of one sweep with one whisker was sufficient tosupport above-chance discrimination between textures ofsimilar coarseness and to reliably discriminate between acoarse and a fine texture.
Spatial and temporal integration of information
Behavioral studies reveal that rats, while probing textures ina discrimination task, contact the surface with many whiskersover several whisking cycles (Carvell and Simons 1990). Thusrats might normally reach optimal performance by combiningthe signals from different whiskers (spatial integration), whilecollecting data over time (temporal integration). To learn moreabout how performance could be improved through spatial andtemporal integration, we combined the signals acquired frommultiple whiskers and multiple sweeps. With a single whisker,the performance using two, three, and four sweeps was 48 � 6,55 � 6, and 59 � 6%, respectively. This corresponds to arelative performance increase (see METHODS) of 29, 55, and69% compared with that of a single sweep. Thus increasing thenumber of whisking cycles is a potentially powerful way toincrease the performance.
We also measured the classification performance using sev-eral sweeps from distinct whisker/direction combinations. Forfour whiskers and two directions there exist 28, 56, and 70possible combinations of two, three, and four sweeps, respec-tively. The average performance was 50 � 4, 57 � 4, and 62 �5% corresponding to a relative performance increase of 36, 62,and 80% compared with a single sweep. Similarly to temporalintegration, each additional whisker added progressively lessperformance improvement. However, the average performanceincrease achieved by spatial integration was greater than thatachieved by temporal integration.
Features of the power spectrum that supporttexture discriminability
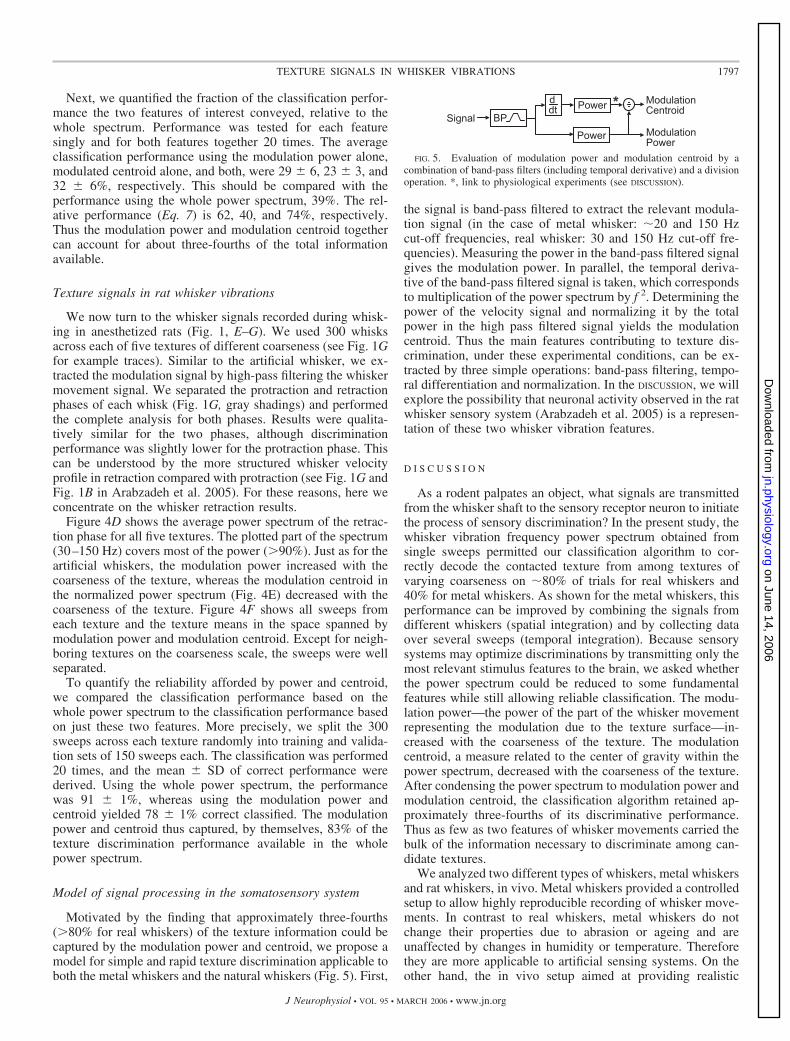
In the previous section, we illustrated classification perfor-mance based on the complete modulation power spectrum overthe range 20–150 Hz. Next, we investigated whether somesubset of spectral features was particularly relevant in theclassification process. The approach was to look for the tex-ture-specific differences in the power spectra. We comparedthe power spectra averaged over all sweeps (shortest whisker:W73, Fig. 4A). The most evident texture-related difference wasthe total modulation power in the signal, i.e., the area below thecurves. Vibrations induced by coarse textures had high mod-ulation power, while vibrations induced by fine textures hadlow modulation power. To look for other potentially informa-tive features, we then normalized the area under the curve of allthe spectra, thereby excluding modulation power as a feature(Fig. 4B). After this normalization, the peak of the powerspectrum emerged as an informative feature: it was at lowfrequencies for coarse textures and at higher frequencies forfine textures. This could result from the whiskers performingmany small jumps while sweeping across a fine texture andfewer, larger jumps across coarse textures. We quantified thisfeature as the modulation centroid
Modulation Centroid � �X�f��2 � f ndf �n�2
�f � X(f)�2df � �V(f)�2df
where X(f) and V(f) are the Fourier transform of the modulationsignal and its velocity. For n � 1, this corresponds to the centerof gravity of the power spectrum. However, we used n � 2 asthis corresponds to the power in the velocity signal, a quantitywhich is easy to extract. In Fig. 4C all sweeps of W73 areshown in the space spanned by the modulation power andcentroid; color identifies the sandpaper. The signals from thecoarsest and the finest sandpapers can be clearly discriminated,while signals from neighboring textures are partially overlap-ping. Thus a high capacity for texture discrimination appears tobe supported by the reduction of the full power spectrum to justtwo features, power and centroid. This key finding was generalto the other metal whiskers.
A B C
D E F
FIG. 4. Meaningful features. Power spec-tra of movements of the shortest metal whis-ker (W73, A–C) and the real whisker (D–F)across different textures is shown color coded,A and D: Average power spectrum of modu-lation part shown for all sandpapers individu-ally. B and E: normalized average power spec-trum of the modulation part for all sandpapers.C and F: modulation power and centroid of allsweeps. See results for details.
1796 HIPP ET AL.
J Neurophysiol • VOL 95 • MARCH 2006 • www.jn.org
on June 14, 2006 jn.physiology.org
Dow
nloaded from
Next, we quantified the fraction of the classification perfor-mance the two features of interest conveyed, relative to thewhole spectrum. Performance was tested for each featuresingly and for both features together 20 times. The averageclassification performance using the modulation power alone,modulated centroid alone, and both, were 29 � 6, 23 � 3, and32 � 6%, respectively. This should be compared with theperformance using the whole power spectrum, 39%. The rel-ative performance (Eq. 7) is 62, 40, and 74%, respectively.Thus the modulation power and modulation centroid togethercan account for about three-fourths of the total informationavailable.
Texture signals in rat whisker vibrations
We now turn to the whisker signals recorded during whisk-ing in anesthetized rats (Fig. 1, E–G). We used 300 whisksacross each of five textures of different coarseness (see Fig. 1Gfor example traces). Similar to the artificial whisker, we ex-tracted the modulation signal by high-pass filtering the whiskermovement signal. We separated the protraction and retractionphases of each whisk (Fig. 1G, gray shadings) and performedthe complete analysis for both phases. Results were qualita-tively similar for the two phases, although discriminationperformance was slightly lower for the protraction phase. Thiscan be understood by the more structured whisker velocityprofile in retraction compared with protraction (see Fig. 1G andFig. 1B in Arabzadeh et al. 2005). For these reasons, here weconcentrate on the whisker retraction results.
Figure 4D shows the average power spectrum of the retrac-tion phase for all five textures. The plotted part of the spectrum(30–150 Hz) covers most of the power (�90%). Just as for theartificial whiskers, the modulation power increased with thecoarseness of the texture, whereas the modulation centroid inthe normalized power spectrum (Fig. 4E) decreased with thecoarseness of the texture. Figure 4F shows all sweeps fromeach texture and the texture means in the space spanned bymodulation power and modulation centroid. Except for neigh-boring textures on the coarseness scale, the sweeps were wellseparated.
To quantify the reliability afforded by power and centroid,we compared the classification performance based on thewhole power spectrum to the classification performance basedon just these two features. More precisely, we split the 300sweeps across each texture randomly into training and valida-tion sets of 150 sweeps each. The classification was performed20 times, and the mean � SD of correct performance werederived. Using the whole power spectrum, the performancewas 91 � 1%, whereas using the modulation power andcentroid yielded 78 � 1% correct classified. The modulationpower and centroid thus captured, by themselves, 83% of thetexture discrimination performance available in the wholepower spectrum.
Model of signal processing in the somatosensory system
Motivated by the finding that approximately three-fourths(�80% for real whiskers) of the texture information could becaptured by the modulation power and centroid, we propose amodel for simple and rapid texture discrimination applicable toboth the metal whiskers and the natural whiskers (Fig. 5). First,
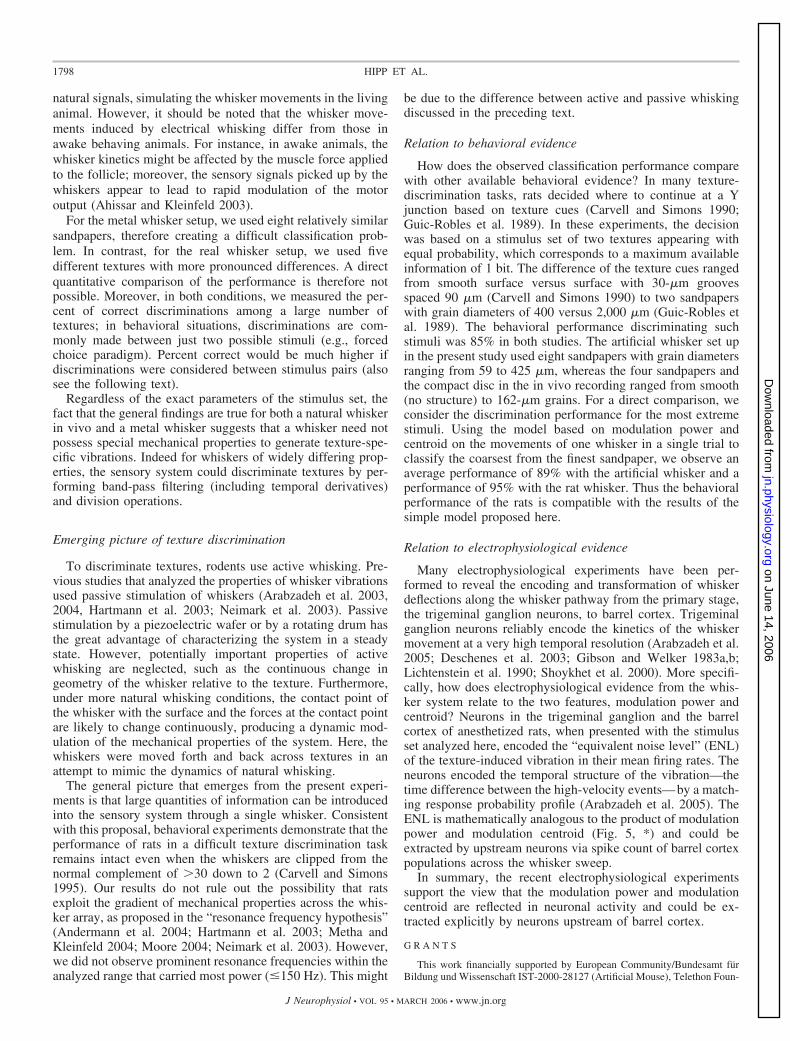
the signal is band-pass filtered to extract the relevant modula-tion signal (in the case of metal whisker: �20 and 150 Hzcut-off frequencies, real whisker: 30 and 150 Hz cut-off fre-quencies). Measuring the power in the band-pass filtered signalgives the modulation power. In parallel, the temporal deriva-tive of the band-pass filtered signal is taken, which correspondsto multiplication of the power spectrum by f 2. Determining thepower of the velocity signal and normalizing it by the totalpower in the high pass filtered signal yields the modulationcentroid. Thus the main features contributing to texture dis-crimination, under these experimental conditions, can be ex-tracted by three simple operations: band-pass filtering, tempo-ral differentiation and normalization. In the DISCUSSION, we willexplore the possibility that neuronal activity observed in the ratwhisker sensory system (Arabzadeh et al. 2005) is a represen-tation of these two whisker vibration features.
D I S C U S S I O N
As a rodent palpates an object, what signals are transmittedfrom the whisker shaft to the sensory receptor neuron to initiatethe process of sensory discrimination? In the present study, thewhisker vibration frequency power spectrum obtained fromsingle sweeps permitted our classification algorithm to cor-rectly decode the contacted texture from among textures ofvarying coarseness on �80% of trials for real whiskers and40% for metal whiskers. As shown for the metal whiskers, thisperformance can be improved by combining the signals fromdifferent whiskers (spatial integration) and by collecting dataover several sweeps (temporal integration). Because sensorysystems may optimize discriminations by transmitting only themost relevant stimulus features to the brain, we asked whetherthe power spectrum could be reduced to some fundamentalfeatures while still allowing reliable classification. The modu-lation power—the power of the part of the whisker movementrepresenting the modulation due to the texture surface—in-creased with the coarseness of the texture. The modulationcentroid, a measure related to the center of gravity within thepower spectrum, decreased with the coarseness of the texture.After condensing the power spectrum to modulation power andmodulation centroid, the classification algorithm retained ap-proximately three-fourths of its discriminative performance.Thus as few as two features of whisker movements carried thebulk of the information necessary to discriminate among can-didate textures.
We analyzed two different types of whiskers, metal whiskersand rat whiskers, in vivo. Metal whiskers provided a controlledsetup to allow highly reproducible recording of whisker move-ments. In contrast to real whiskers, metal whiskers do notchange their properties due to abrasion or ageing and areunaffected by changes in humidity or temperature. Thereforethey are more applicable to artificial sensing systems. On theother hand, the in vivo setup aimed at providing realistic
FIG. 5. Evaluation of modulation power and modulation centroid by acombination of band-pass filters (including temporal derivative) and a divisionoperation. *, link to physiological experiments (see DISCUSSION).
1797TEXTURE SIGNALS IN WHISKER VIBRATIONS
J Neurophysiol • VOL 95 • MARCH 2006 • www.jn.org
on June 14, 2006 jn.physiology.org
Dow
nloaded from
natural signals, simulating the whisker movements in the livinganimal. However, it should be noted that the whisker move-ments induced by electrical whisking differ from those inawake behaving animals. For instance, in awake animals, thewhisker kinetics might be affected by the muscle force appliedto the follicle; moreover, the sensory signals picked up by thewhiskers appear to lead to rapid modulation of the motoroutput (Ahissar and Kleinfeld 2003).
For the metal whisker setup, we used eight relatively similarsandpapers, therefore creating a difficult classification prob-lem. In contrast, for the real whisker setup, we used fivedifferent textures with more pronounced differences. A directquantitative comparison of the performance is therefore notpossible. Moreover, in both conditions, we measured the per-cent of correct discriminations among a large number oftextures; in behavioral situations, discriminations are com-monly made between just two possible stimuli (e.g., forcedchoice paradigm). Percent correct would be much higher ifdiscriminations were considered between stimulus pairs (alsosee the following text).
Regardless of the exact parameters of the stimulus set, thefact that the general findings are true for both a natural whiskerin vivo and a metal whisker suggests that a whisker need notpossess special mechanical properties to generate texture-spe-cific vibrations. Indeed for whiskers of widely differing prop-erties, the sensory system could discriminate textures by per-forming band-pass filtering (including temporal derivatives)and division operations.
Emerging picture of texture discrimination
To discriminate textures, rodents use active whisking. Pre-vious studies that analyzed the properties of whisker vibrationsused passive stimulation of whiskers (Arabzadeh et al. 2003,2004, Hartmann et al. 2003; Neimark et al. 2003). Passivestimulation by a piezoelectric wafer or by a rotating drum hasthe great advantage of characterizing the system in a steadystate. However, potentially important properties of activewhisking are neglected, such as the continuous change ingeometry of the whisker relative to the texture. Furthermore,under more natural whisking conditions, the contact point ofthe whisker with the surface and the forces at the contact pointare likely to change continuously, producing a dynamic mod-ulation of the mechanical properties of the system. Here, thewhiskers were moved forth and back across textures in anattempt to mimic the dynamics of natural whisking.
The general picture that emerges from the present experi-ments is that large quantities of information can be introducedinto the sensory system through a single whisker. Consistentwith this proposal, behavioral experiments demonstrate that theperformance of rats in a difficult texture discrimination taskremains intact even when the whiskers are clipped from thenormal complement of �30 down to 2 (Carvell and Simons1995). Our results do not rule out the possibility that ratsexploit the gradient of mechanical properties across the whis-ker array, as proposed in the “resonance frequency hypothesis”(Andermann et al. 2004; Hartmann et al. 2003; Metha andKleinfeld 2004; Moore 2004; Neimark et al. 2003). However,we did not observe prominent resonance frequencies within theanalyzed range that carried most power (�150 Hz). This might
be due to the difference between active and passive whiskingdiscussed in the preceding text.
Relation to behavioral evidence
How does the observed classification performance comparewith other available behavioral evidence? In many texture-discrimination tasks, rats decided where to continue at a Yjunction based on texture cues (Carvell and Simons 1990;Guic-Robles et al. 1989). In these experiments, the decisionwas based on a stimulus set of two textures appearing withequal probability, which corresponds to a maximum availableinformation of 1 bit. The difference of the texture cues rangedfrom smooth surface versus surface with 30-�m groovesspaced 90 �m (Carvell and Simons 1990) to two sandpaperswith grain diameters of 400 versus 2,000 �m (Guic-Robles etal. 1989). The behavioral performance discriminating suchstimuli was 85% in both studies. The artificial whisker set upin the present study used eight sandpapers with grain diametersranging from 59 to 425 �m, whereas the four sandpapers andthe compact disc in the in vivo recording ranged from smooth(no structure) to 162-�m grains. For a direct comparison, weconsider the discrimination performance for the most extremestimuli. Using the model based on modulation power andcentroid on the movements of one whisker in a single trial toclassify the coarsest from the finest sandpaper, we observe anaverage performance of 89% with the artificial whisker and aperformance of 95% with the rat whisker. Thus the behavioralperformance of the rats is compatible with the results of thesimple model proposed here.
Relation to electrophysiological evidence
Many electrophysiological experiments have been per-formed to reveal the encoding and transformation of whiskerdeflections along the whisker pathway from the primary stage,the trigeminal ganglion neurons, to barrel cortex. Trigeminalganglion neurons reliably encode the kinetics of the whiskermovement at a very high temporal resolution (Arabzadeh et al.2005; Deschenes et al. 2003; Gibson and Welker 1983a,b;Lichtenstein et al. 1990; Shoykhet et al. 2000). More specifi-cally, how does electrophysiological evidence from the whis-ker system relate to the two features, modulation power andcentroid? Neurons in the trigeminal ganglion and the barrelcortex of anesthetized rats, when presented with the stimulusset analyzed here, encoded the “equivalent noise level” (ENL)of the texture-induced vibration in their mean firing rates. Theneurons encoded the temporal structure of the vibration—thetime difference between the high-velocity events—by a match-ing response probability profile (Arabzadeh et al. 2005). TheENL is mathematically analogous to the product of modulationpower and modulation centroid (Fig. 5, *) and could beextracted by upstream neurons via spike count of barrel cortexpopulations across the whisker sweep.
In summary, the recent electrophysiological experimentssupport the view that the modulation power and modulationcentroid are reflected in neuronal activity and could be ex-tracted explicitly by neurons upstream of barrel cortex.
G R A N T S
This work financially supported by European Community/Bundesamt furBildung und Wissenschaft IST-2000-28127 (Artificial Mouse), Telethon Foun-
1798 HIPP ET AL.
J Neurophysiol • VOL 95 • MARCH 2006 • www.jn.org
on June 14, 2006 jn.physiology.org
Dow
nloaded from
dation Grant GGP02459, Italian Ministry of Universities and Research Grant20002035, and Human Frontiers Science Programme Grant RGP0043.
R E F E R E N C E S
Ahissar E and Kleinfeld D. Closed-loop neuronal computations: focus onvibrissa somatosensation in rat. Cereb Cortex 13: 53–62, 2003.
Andermann ML, Ritt J, Neimark MA, and Moore CI. Neural correlates ofvibrissa resonance; band-pass and somatotopic representation of high-frequency stimuli. Neuron 42: 451–463, 2004.
Arabzadeh E, Panzeri S, and Diamond ME. Whisker vibration informationcarried by rat barrel cortex neurons. J Neurosci 24: 6011–6020, 2004.
Arabzadeh E, Petersen RS, and Diamond ME. Encoding of whisker vibra-tion by rat barrel cortex neurons: implications for texture discrimination.J Neurosci 23: 9146–9154, 2003.
Arabzadeh E, Zorzin E, and Diamond ME. Neuronal encoding of texture inthe whisker sensory pathway. PLoS Biol 3: e17, 2005.
Armstrong-James M and Fox K. Spatiotemporal convergence and diver-gence in the rat S1 “barrel” cortex. J Comp Neurol 263: 265–281, 1987.
Bishop M. Neural Networks for Pattern Recognition. Oxford, UK: OxfordUniv. Press, 1995.
Brecht M, Roth A, and Sakmann B. Dynamic receptive fields of recon-structed pyramidal cells in layers 3 and 2 of rat somatosensory barrel cortex.J Physiol 553: 243–265, 2003.
Brecht M, Preilowski B, and Merzenich MM. Functional architecture of themystacial vibrissae. Behav Brain Res 84: 81–97, 1997.
Brown AWS and Waite PME. Responses in the rat thalamus to whisker movementsproduced by motor nerve stimulation. J Physiol 238: 387–401, 1974.
Carvell GE and Simons DJ. Biometric analyses of vibrissal tactile discrim-ination in the rat. J Neurosci 10: 2638–2648, 1990.
Carvell GE and Simons DJ. Task- and subject-related differences in senso-rimotor behavior during active touch. Somatosens Mot Res 12: 1–9, 1995.
Deschenes M, Timofeeva E, and Lavallee P. The relay of high-frequencysensory signals in the whisker-to-barreloid pathway. J Neurosci 23: 6778–6787, 2003.
Fend M, Bovet S, Yokoi H, and Pfeifer R. An active artificial whisker arrayfor texture discrimination. Proc IEEE/RSJ Intl Conf Intell Robots Syst II:1044–1049, 2003.
Gibson JM and Welker WI. Quantitative studies of stimulus coding infirst-order vibrissa afferents of rats. II. Adaptation and coding of stimulusparameters. Somatosens Res 1: 95–117, 1983a.
Gibson JM and Welker WI. Quantitative studies of stimulus coding infirst-order vibrissa afferents of rats. I. Receptive field properties and thresh-old distributions. Somatosens Res 1: 51–67, 1983b.
Guic-Robles E, Valdivieso C, and Guajardo G. Rats can learn a roughnessdiscrimination using only their vibrissal system. Behav Brain Res 31:285–289, 1989.
Hartmann MJ, Johnson NJ, Towal RB, and Assad C. Mechanical charac-teristics of rat vibrissae: resonant frequencies and damping in isolatedwhiskers and in the awake behaving animal. J Neurosci 23: 6510–6519,2003.
Harvey MA, Bermejo R, and Zeigler HP. Discriminative whisking in thehead-fixed rat: optoelectronic monitoring during tactile detection and dis-crimination tasks. Somatosens Mot Res 18: 211–222, 2001.
Hutson KA and Masterton RB. The sensory contribution of a single vibris-sa’s cortical barrel. J Neurophysiol 56: 1196–1223, 1986.
Krupa DJ, Matell MS, Brisben AJ, Oliveira LM, and Nicolelis MA.Behavioral properties of the trigeminal somatosensory system in rats per-forming whisker-dependent tactile discriminations. J Neurosci 21: 5752–5763, 2001.
Lichtenstein SH, Carvell GE, and Simons DJ. Responses of rat trigeminalganglion neurons to movements of vibrissae in different directions. Somato-sens Mot Res 7: 47–65, 1990.
Metha SB and Kleinfeld D. Frisking the whiskers: patterned sensory input inthe rat vibrissa system. Neuron 41: 181–184, 2004.
Moore CI. Frequency-dependent processing in the vibrissa sensory system.J Neurophysiol 91: 2390–2399, 2004.
Neimark MA, Andermann ML, Hopfield JJ, and Moore Christopher I.Vibrissa resonance as a transduction mechanism for tactile encoding. J Neu-rosci 23: 6499–6509, 2003.
Shoykhet M, Doherty D, and Simons DJ. Coding of deflection velocity andamplitude by whisker primary afferent neurons: implications for higher levelprocessing. Somatosens Mot Res 17: 171–180, 2000.
Staiger JF, Flagmeyer I, Schubert D, Zilles K, Kotter R, and LuhmannHJ. Functional diversity of layer IV spiny neurons in rat somatosensorycortex: quantitative morphology of electrophysiologically characterized andbiocytin labeled cells. Cereb Cortex 14: 690–701, 2004.
Szwed M, Bagdasarian K, and Ahissar E. Encoding of vibrissal active touch.Neuron 40: 621–630, 2003.
Woolsey TA and Van der Loos H. The structural organization of layer IV inthe somatosensory region (SI) of mouse cerebral cortex. The description ofa cortical field composed of discrete cytoarchitectonic units. Brain Res 17:205–242, 1970.
1799TEXTURE SIGNALS IN WHISKER VIBRATIONS
J Neurophysiol • VOL 95 • MARCH 2006 • www.jn.org
on June 14, 2006 jn.physiology.org
Dow
nloaded from