Texture mapping parametric molecular surfaces
7
I-/lUTTERWORT. II1E'N MANN Texture mapping parametric molecular surfaces Bruce S. Duncan and Arthur J. Olson The Scripps Research Institute, La Jolla, California 92037 Texture mapping is an increasingly popular technique in molecular modeling. It is particularly effective in represent- ing high-resolution surface detail using a low-resolution polygonal model. We describe how texture mapping can be used with parametric molecular surfaces represented as ex- pansions of spherical harmonic functions. We define ana- lytically the texture image and its transformation to a para- metric surface. Unlike most methods of texture mapping, this transformation defines a one-to-one correspondence between the surface and the texture; texture coordinates are derived from the location of the surface point and not from physical properties at the surface point. This has advan- tages for the interactive visualization of surface data. We control the interactive response time by lowering the reso- lution of the polygon mesh while retaining the high- resolution detail of the texture, or we can lower the reso- lution of the texture image with the same polygonal model. By using a well-defined convention for texture coordinates, we can use the same image for the original surface or its parametric representation, and we can rapidly switch be- tween images that represent different surface properties without recomputing the texture coordinates. Parametric surfaces allow new flexibility for the visualization of mo- lecular surface data. Keywords: Texture mapping, molecular surface, spherical harmonics INTRODUCTION Texture mapping is a procedure to represent high-resolu- tion surface detail using a low-resolution geometric model. 1,2 It is available in many advanced renderers and is increasingly popular in molecular graphics to show proper- ties on molecular surfaces. These surfaces are frequently isodensity contours of a three-dimensional scalar function Color plates for this article are on p. 237. Address reprint requests to Dr. Olson at The Scripps Research Institute, 10666 North Torrey Pines Road, La Jolla, California 92037. Received 3 February 1995; revised 15 May 1995; accepted 18 May 1995. or surfaces derived from Richards's definition of the mo- lecular surface. 3 The article by Teschner et al. presents an overview of texture mapping in molecular modeling as well as many striking images. 4 Some molecular surfaces have an analytic representation, but this analytic description is usually defined implicitly or covers only a limited region of the surface. For example, algorithms that compute analytic molecular surfaces s-8 rep- resent the spherical and toroidal patches of the surface, but the complete surface is the union of these small patches. Consequently, molecular surfaces are usually represented as a collection of polygons for computation or rendering. For some applications, however, a single parametric de- scription that represents the entire molecular surface is de- sirable. One such method is to approximate the surface as an expansion of spherical harmonic functions. With this method there is a single parameterization that describes the entire surface; it is not composed of the union of discrete segments. This technique has several advantages for com- putation and interactive graphics. For example, we control the resolution of the surface by changing the number of terms in the expansion, and control the resolution of the triangle mesh independently of the surface resolution. We have applied this technique in a program to predict protein- protein interactions and for the real-time display of spheri- cal harmonic surfaces during normal mode vibrations. 9-1j An important step in texture mapping is to define the correspondence between the polygonal model and the tex- ture image. One method is to use texture coordinates de- rived from the physical properties (electrostatic potential, hydrophobicity, etc.) at the surface points. This procedure has the advantage that it is easy to do texture mapping using these property-based texture coordinates. This method, however, has limitations. Texture mapping a different set of surface data requires changing the texture coordinates in the geometric model; an expensive procedure in some render- ers. Also, it is not possible to use a high-resolution texture with a coarsely triangulated geometric model because the texture image defines the color coding of the surface data only at individual points and is not a planar representation of the surface topography. In contrast, the methods described here rely on the com- putation of a one-to-one correspondence between the tex- Journal of Molecular Graphics 13:258-264, 1995 © 1995 by Elsevier Science Inc. 655 Avenue of the Americas, New York, NY 10010 0263-7855/95/$10.00 SSDI 0263-7855(95)00038-8
-
Upload
independent -
Category
Documents
-
view
4 -
download
0
Transcript of Texture mapping parametric molecular surfaces

I-/lUTTERWORT. II1E'N MANN
Texture mapping parametric molecular surfaces Bruce S. Duncan and Arthur J. Olson
The Scripps Research Institute, La Jolla, California 92037
Texture mapping is an increasingly popular technique in molecular modeling. It is particularly effective in represent- ing high-resolution surface detail using a low-resolution polygonal model. We describe how texture mapping can be used with parametric molecular surfaces represented as ex- pansions of spherical harmonic functions. We define ana- lytically the texture image and its transformation to a para- metric surface. Unlike most methods of texture mapping, this transformation defines a one-to-one correspondence between the surface and the texture; texture coordinates are derived from the location of the surface point and not from physical properties at the surface point. This has advan- tages for the interactive visualization of surface data. We control the interactive response time by lowering the reso- lution of the polygon mesh while retaining the high- resolution detail of the texture, or we can lower the reso- lution of the texture image with the same polygonal model. By using a well-defined convention for texture coordinates, we can use the same image for the original surface or its parametric representation, and we can rapidly switch be- tween images that represent different surface properties without recomputing the texture coordinates. Parametric surfaces allow new flexibility for the visualization of mo- lecular surface data.
Keywords: Texture mapping, molecular surface, spherical harmonics
I N T R O D U C T I O N
Texture mapping is a procedure to represent high-resolu- tion surface detail using a low-resolution geometric model. 1,2 It is available in many advanced renderers and is increasingly popular in molecular graphics to show proper- ties on molecular surfaces. These surfaces are frequently isodensity contours of a three-dimensional scalar function
Color plates for this article are on p. 237.
Address reprint requests to Dr. Olson at The Scripps Research Institute, 10666 North Torrey Pines Road, La Jolla, California 92037. Received 3 February 1995; revised 15 May 1995; accepted 18 May 1995.
or surfaces derived from Richards's definition of the mo- lecular surface. 3 The article by Teschner et al. presents an overview of texture mapping in molecular modeling as well as many striking images. 4
Some molecular surfaces have an analytic representation, but this analytic description is usually defined implicitly or covers only a limited region of the surface. For example, algorithms that compute analytic molecular surfaces s-8 rep- resent the spherical and toroidal patches of the surface, but the complete surface is the union of these small patches. Consequently, molecular surfaces are usually represented as a collection of polygons for computation or rendering.
For some applications, however, a single parametric de- scription that represents the entire molecular surface is de- sirable. One such method is to approximate the surface as an expansion of spherical harmonic functions. With this method there is a single parameterization that describes the entire surface; it is not composed of the union of discrete segments. This technique has several advantages for com- putation and interactive graphics. For example, we control the resolution of the surface by changing the number of terms in the expansion, and control the resolution of the triangle mesh independently of the surface resolution. We have applied this technique in a program to predict protein- protein interactions and for the real-time display of spheri- cal harmonic surfaces during normal mode vibrations. 9-1j
An important step in texture mapping is to define the correspondence between the polygonal model and the tex- ture image. One method is to use texture coordinates de- rived from the physical properties (electrostatic potential, hydrophobicity, etc.) at the surface points. This procedure has the advantage that it is easy to do texture mapping using these property-based texture coordinates. This method, however, has limitations. Texture mapping a different set of surface data requires changing the texture coordinates in the geometric model; an expensive procedure in some render- ers. Also, it is not possible to use a high-resolution texture with a coarsely triangulated geometric model because the texture image defines the color coding of the surface data only at individual points and is not a planar representation of the surface topography.
In contrast, the methods described here rely on the com- putation of a one-to-one correspondence between the tex-
Journal of Molecular Graphics 13:258-264, 1995 © 1995 by Elsevier Science Inc. 655 Avenue of the Americas, New York, NY 10010
0263-7855/95/$10.00 SSDI 0263-7855(95)00038-8
ture image and the molecular surface. Thus, the texture image is analogous to a cartographic representation (world map) of the surface. These texture coordinates define the spatial location of the surface points and not physical prop- erties of the surface points. We call this type of represen- tation location-based texture coordinates. An important feature is that this representation is independent of the spa- tial resolution (number of terms in the expansion) and the triangulation (number of surface triangles) of a spherical harmonic surface. To display a new set of surface data, only the texture image must be changed; the geometric model is constant. In this article we describe the advantages of lo- cation-based texture coordinates and spherical harmonic surfaces for texture mapping and show applications of these techniques to our modeling tasks.
SPHERICAL HARMONIC REPRESENTATIONS
Spherical harmonic representations a[~proximate the large- 9 1 2 , ~ scale features of protein surfaces. • ' The most important
feature is the surface geometry, that is, the Cartesian coor- dinates of the surface points. Any surface function, how- ever, can be represented by this method. Important surface functions include shape measures, electrostatic potential, and hydrophobicity. Spherical harmonic functions are ap- propriateofOr representing surface data down to a scale of about 1 A. This is suitable for many applications because the scale of most surface properties is greater than the size of individual atoms. It is more difficult to represent detailed surface geometry than most surface properties. A funda- mental limitation of spherical harmonic basis functions is that they can represent only surfaces that are topologically equivalent to a sphere, but we believe that parametric sur- faces using other basis functions will have similar rendering and computation advantages.
In the following descriptions we refer to geometric ob- jects of various dimensions. It is important to distinguish between the dimension of the parameterization of an object and the dimension in which the object is embedded. For example, a plane is a two-dimensional object that can be embedded in three-dimensional space. The molecular sur- faces that we use are two-dimensional and are topologically equivalent to the two-dimensional surface of a sphere. An important concern is the parameterization of the surface. The parameterization gives the dependent variables that de- fine the three-dimensional surface position as functions of independent variables called parameters. For example, the spherical harmonic technique uses the 0 and + spherical angles as independent variables (two-dimensional surface coordinates). This two-dimensional coordinate represents a specific point on the surface at which the dependent vari- ables (three-dimensional Cartesian coordinates) are deter- mined.
We generate spherical harmonic representations with the following procedure. 9 The input data represent a triangu- lated molecular surface computed by available pro- grams. -s'7"~ An important step is the topological mapping of the original molecular surface into a sphere. This is neces- sary because the spherical harmonic functions are defined on a unit sphere, and the mapping procedure defines a one-
to-one relation between the molecular surface and a unit sphere. After this mapping, expansion coefficients are com- puted by integrating the product of each Cartesian coordi- nate of the molecular surface (X, Y, Z), with the spherical harmonic functions. This produces three sets of expansion coefficients, one for each Cartesian coordinate. Surface in- tegrals are evaluated using a uniform grid in spherical co- ordinates. A grid element is computed by extending a ray from the origin of the unit sphere and finding the triangle that the ray intersects. This triangle has a corresponding triangle on the molecular surface. We obtain the value in the integration grid by interpolating the Cartesian coordinates of the vertices of the molecular surface triangle. To com- plete the grid, we repeat this procedure for each (0, ~b) spherical coordinate, using constant angle increments. After integration, spherical harmonic surfaces are generated by summing the product of the expansion coefficients and the spherical harmonic functions. Evaluation is also done using constant angle increments in spherical coordinates, and the Cartesian coordinate at an arbitrary spherical point is com- puted from the four nearest grid points using bilinear inter- polation.
An important feature of this method is that we can define arbitrarily the spherical coordinates used to generate the Cartesian surface coordinates. We choose these spherical coordinates so that the polygon mesh of the surface has a well-defined hierarchical structure. We subdivide the faces of a regular solid to create a set of spherical coordinates used to generate Cartesian surface points. We frequently use the spherical coordinates obtained by subdividing the faces of a regular icosahedron to produce a triangular mesh. Our visualization techniques use this hierarchy to give the user interactive control of the resolution of the mesh. De- tails of this mesh structure are in Ref. 10.
Our spherical harmonic programs perform a wide variety of computation and modeling tasks, including representa- tion of surface geometry and surface properties, interactive computation of the interfacial surface between two interact- ing proteins, and real-time visualization of spherical har- monic surfaces during normal mode vibrations. Each of these applications can benefit from increased surface detail and efficient rendering using texture mapping.
T E X T U R E M A P P I N G
A typical application of texture mapping is to apply a two- dimensional image to a surface. For molecular modeling applications, the two-dimensional image usually represents a physical property such as electrostatic potential, hydro- phobicity, or atom type. Polygonal regions within a texture image are specified using the texture coordinates (u, v), which are floating point numbers between 0 and 1. Each vertex of a polygon in the geometric model also has a (u, v) texture coordinate, and a corresponding polygon can be located in the texture image. During rendering, the subim- age contained within this region in the texture image is applied to the polygon of the geometric model.
Texture mapping can also be done in one or three dimen- sions. In one-dimensional texture mapping, the u and v texture coordinates are set to the same value; this produces a surface indexed by a single scalar quantity. Three-
J, Mol. Graphics, 1995, Vol. 13, August 259
dimensional texture mapping uses the three texture coordi- nates, (u, v, w), which are usually derived from the Carte- sian coordinates of the surface point.
We distinguish between two methods of defining texture coordinates. Most procedures to texture map molecular sur- faces use what we call property-based texture coordinates. In this method, the texture coordinate of each vertex is defined using a physical property at the surface point. For example, it is straightforward to use texture mapping to display simultaneously the electrostatic potential and the hydrophobicity of a surface if the u texture coordinate is set proportional to the potential and the v coordinate propor- tional to the hydrophobicity. These surfaces can be rendered using a texture image with the u coordinate color coded by potential and the v coordinate color coded by hydrophobic- ity. An advantage of this method is that it is easy to apply and does not have distortion artifacts. This method has the limitation that we cannot lower the triangulation of the po- lygonal model while retaining the high-resolution informa- tion in the texture image.
Texture coordinates can also be defined so that they spec- ify a location on the surface (location-based texture coor- dinates) instead of a physical property. A limitation of this type of texture coordinate is that the texture image may be stretched or compressed when applied to a polygon. For example, an image can be applied to a plane or cylinder without distortion but not to a sphere or irregularly shaped surface. This distortion can limit the applicability of two- dimensional texture mapping. Location-based texture coor- dinates are frequently used in other computer graphics ap- plications because the geometric models are usually simpler than molecular surfaces. In spite of these limitations, loca- tion-based texture coordinates have advantages for interac- tive graphics. One advantage is that there is a one-to-one correspondence between the surface and the texture image. This allows the same texture image to be used on surfaces with different triangulations or spatial resolutions. The main difficulty in using location-based texture coordinates is to overcome the problem of the distortion of the texture when applied to an irregular surface. Because our molecular sur- faces have a well-defined parametric representation, we can use this information to define a series of coordinate trans- formations that eliminate this problem.
COORDINATE TRANSFORMATIONS
The explicit mapping of the entire molecular surface to the texture image is an important concern in applying two- dimensional texture mapping with location-based texture coordinates. A fundamental problem is that a molecular surface cannot be mapped into a plane without distortion. To quantify this distortion, we define a series of transfor- mations from the molecular surface to the texture image. An advantage of parametric surfaces is that the transformation from a plane to a surface can be defined precisely. By creating texture images using these transformations, we can apply the resulting image to the surface without distortion. This is analogous to creating a planar map of the Earth using the knowledge of how the map will be stretched and com- pressed when applied to a sphere to form a globe.
The coordinate transformations used by our procedures
are summarized below. The function arguments denote the independent variables of the parameterization.
Tmap s ~ s(0 ,+) (1)
S is the original molecular surface in Cartesian coordinates; it has no parameterization and is represented as a set of discrete points. S(O, ~b) is the mapping of this surface to a unit sphere. Tma p is the topological mapping procedure by which each surface point is assigned a unique (0, ~b) spher- ical coordinate. Conversely, a Cartesian surface point can be defined for each point on the unit sphere by interpolating the values in the discrete set S.
After mapping the surface to a sphere, the spherical rep- resentation is projected to a planar one as follows:
Projection S(O,~b) > S(u,v) (2)
S(u,v) is the projection of the unit sphere to a unit square. Coordinates inside the square are referenced by the texture coordinates (u, v) which are derived from the spherical co- ordinates (0, ~) as follows: u = 0/'tr and v = ~b/2w. The Projection procedure is a simple spherical mapping, al- though more complex cartographic projections could be used. Note that this projection is not strictly one to one because the poles (0 -= 0 and 0 = ~r) are singular points. These relations describe transformations of the original mo- lecular surface to a plane. With these transformations, each point of the molecular surface (excluding the poles) is as- signed a unique texture coordinate. Also, a Cartesian sur- face point can be defined for each point in the unit square using interpolation.
There are also relations between the Cartesian molecular surface and its spherical harmonic approximation. These relations are summarized as follows:
Integration S(0,+) > Coefsl/,m] (3)
Evaluation Coefs[l,m] > H(0,+) (4)
Coefs[l,m] are the expansion coefficients indexed by the parameters l and m, which denote specific spherical har- monic functions. H(0, ~b) denotes the spherical harmonic representation of the surface. Recall that the Integration procedure evaluates the inner product of the Cartesian co- ordinates with the spherical harmonic functions to obtain the expansion coefficients, and the Evaluation procedure sums the product of the expansion coefficients and the spherical harmonic functions to obtain the spherical har- monic surface. Evaluation occurs at selected points on the unit sphere defined by their (0, +) coordinates. These spher- ical harmonic surfaces are defined on a unit sphere and can be projected to a unit square as described above.
Projection H(O,d~) ~ H(u,v) (5)
Note that the projection transformation alters only the pa- rameterization; the coordinates of the vertices and the to- pological relations between them (the polygon definitions) do not change. The triangle mesh of the molecular surface and its unit sphere representation are identical. For spherical harmonic surfaces, the triangle mesh on the unit sphere is
260 J. Mol. Graphics, 1995, Vol. 13, August

topologically equivalent to the triangle mesh of the spheri- cal harmonic surface in Cartesian coordinates. By compos- ing these transformations we form a link between the orig- inal molecular surface points and the points of the unit square.
One limitation of this projection is that the poles (0 = 0 and 0 = "rr) are singular points and there is a possibility of an inconsistency where the + = 0 line wraps around to meet the + = 2v line. If a triangle crosses this boundary, the texture image can be applied incorrectly. Some hard- ware renderers remove this inconsistency by using a peri- odic texture, that is, truncating the integer part of the texture coordinate when it is greater than I. One limitation, how- ever, is that not all hardware renderers allow arbitrary di- mensions for periodic textures and restrict the dimensions to be an integral power of 2. We find this limitation unaccept- able. Consequently, we developed a procedure that adds vertices and polygons to the surface to ensure that no poly- gons cross this boundary. With this method, we can use texture images of arbitrary dimensions without an inconsis- tency at the boundary of the texture. Property-based texture coordinates do not have this wrapping problem because the texture image does not have a one-to-one correspondence with the surface points. As described previously, property- based texture coordinates have limitations because it is dif- ficult to render a high-resolution texture on a low-resolution polygonal model, and the texture coordinates must be changed when displaying a new set of surface data. Because our texturing procedures use an explicit relation between the texture image and the molecular surface, they do not have these limitations. Our procedures are, however, more com- plex than those used for property-based texturing.
V I S U A L I Z I N G S U R F A C E DATA
Many of our rendering procedures are implemented using the Application Visualization System (AVS), a data-flow system tbr scientific visualization. ~4,15 Visualization meth- ods are carried out by connecting supplied or custom AVS modules to form a network. Within an AVS network, poly- gons, vertices, and texture images are passed between mod- ules and the AVS renderer. Rendering is done on a DEC 3000 AXP model 500 workstation with a Denali graphics accelerator from Kubota Pacific. The Denali has hardware- assisted texture mapping, and on platforms that do not have this feature, AVS does texture mapping in software, al- though this is considerably slower. AVS imposes data-type constraints between modules, but the user defines the data semantics. Our AVS data structures for molecular applica- tions are described in Ref. 16, The modular structure of AVS, however, results in additional overhead when creat- ing geometries. Texture mapping reduces this overhead as discussed below.
We now describe how to visualize surface information on molecular or parametric surfaces. We use two procedures to create the texture image. If the surface property does not have a parametric description, the texture image is created by sampling and interpolating the original data. If the sur- face property has a spherical harmonic or other parametric representation, the texture image is created analytically. The analytic representation has the advantage that calcula-
tions often have higher precision, especially in cases in which first or second derivatives are required.
An advantage of this procedure is that texture coordinates have a one-to-one correspondence with the molecular sur- face; no texture coordinates are duplicated. Because of this convention, the same texture image can be used on the original molecular surface or its spherical harmonic repre- sentation. Each of these surfaces is transformed to a unit square through its unit sphere representation. Examples of these procedures are given below.
Rendering numeric surface data
We use our spherical mapping procedure to create a texture image for the original molecular surface or its spherical harmonic representation. The following procedure creates a texture image for an atomic property that does not have a parametric representation but is defined at each surface ver- tex. Recall that each point on the molecular surface has a unique (0, +) spherical coordinate. These coordinates are normalized to form the texture coordinates (u. v). A texture image that covers this texture space is created using a mod- ified version of the ray intersection procedure described above. For each spherical coordinate, we determine the tri- angle (in the unit sphere representation of the molecular surface) that the ray intersects. Each vertex of this surface is assigned to a specific atom of the original structure. Recall that we create an integration map for the spherical harmon- ics by interpolating the vertex data from this intersection triangle. To create texture data, we simply use the datum value of the closest vertex. This creates sharp boundary between data elements instead of a smooth transition that would be obtained by interpolation. By repeating this pro- cedure over the entire unit sphere using a constant angle increment, we create a two-dimensional array of the atomic property to be used as the texture data. This array is color coded to create the texture image. One advantage of AVS is that it has interactive tools to specify the color coding of the data array.
One limitation of this method is the computational cost of sampling the unit sphere representation to create data on a unit square. This procedure creates a high-resolution repre- sentation of the surface data but the number of pixels in the texture image is much greater than the number of vertices in the polygonal model. A limitation is that each surface prop- erty (Cartesian coordinate, shape measures, hydrophobic- ity, etc.) would require resampling the sphere. To improve the efficiency we precompute the intersection triangle and the triangle interpolation constants for each spherical coor- dinate so that interpolation of new surface data can be done more rapidly. We do not need to recompute the intersection triangles for each new surface property. This table, how- ever, must be sampled or recomputed for different angle increments.
Rendering parametric surface data
Because spherical harmonic expansions can represent sur- face properties in addition to surface geometry, we can analytically define the surface data used in the texture image instead of numerically interpolating the data values on the
J. Mol. Graphics, 1995, Vol. 13, August 261
unit sphere. With spherical harmonics we can define texture images of surface data at different spatial resolutions. For example, to represent the surface hydrophobicity we first create its spherical harmonic representation from the nu- merical surface data. After computing the expansion coef- ficients, we reconstruct the hydrophobicity at the desired level of detail. To use texture mapping we compute a two- dimensional data array of the hydrophobicity in spherical coordinates using a constant angle increment. This creates a two-dimensional array of hydrophobicity values indexed by the 0 and ~b coordinates. By color coding these data we produce the texture image.
Color Plate 1 shows the molecular surface of bovine pan- creatic trypsin inhibitor (BPTI; from ltpa.pdb [Ref. 17]) and an order 30 spherical harmonic representation. The sur- faces are color coded by the order 20 residue-based hydro- phobicity, and the same texture image is used for both sur- faces. Because there is a single mapping from a surface to the unit sphere, the (0, +) spherical coordinates for the original molecular surface, the spherical harmonic surface, and the hydrophobicity are the same.
With this method we can create different combinations of surfaces and properties: molecular surfaces with a sampled texture, molecular surfaces with a parametric texture, para- metric surfaces with a sampled texture, and parametric sur- faces with a parametric texture.
Texture mapping intermolecular interfaces
Our parametric surface representations were developed for a program to analyze and predict protein-protein interactions. Parametric methods are well suited to this problem because most intermolecular interfaces have significant complemen- tarity of geometric and physical properties even at low spa- tial resolution.
One method to analyze these interactions is to create an interfacial surface between two interacting molecular sur- faces. This highlights the geometry of the interface and creates a surface where the physical properties of each sub- unit can be displayed to assess the complementarity of shape, hydrophobicity, charge, and so on. Similar methods
18 have been used by others. An advantage of parametric representations is that the interfacial surface can be com- puted and displayed with the same interactive control tech- niques as the surfaces themselves.
The interface is defined as the locus of points "halfway" between two molecular surfaces. For each point of the first surface, we find the point of the second surface that is closest to it. The interface point is the midpoint between these two points. We use a binary spatial subdivision tree to
19 generate the pairs of close points. This procedure is re- peated for each point of the first surface. The surface de- fined by the interface points is created using the polygon definitions (vertex connectivity) of the first surface; the con- nectivity of the interface points does not have to be recom- puted. The interface denotes a potentially significant inter- action if the distance between the points is less than about 2.0 ,~. A polytriangle clipping procedure culls triangles if the pairwise distance is greater than a user-specified thresh- old. An interesting feature is that this procedure works for molecular surfaces, spherical harmonic surfaces, or even combinations of the two.
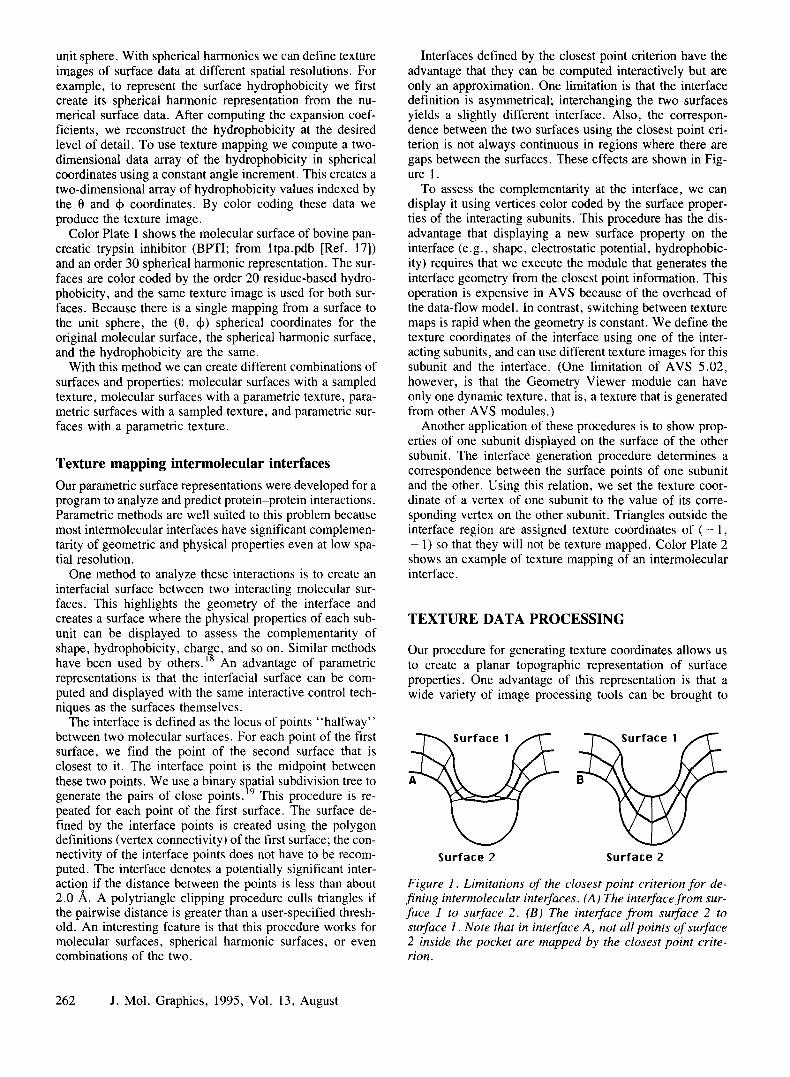
Interfaces defined by the closest point criterion have the advantage that they can be computed interactively but are only an approximation. One limitation is that the interface definition is asymmetrical; interchanging the two surfaces yields a slightly different interface. Also, the correspon- dence between the two surfaces using the closest point cri- terion is not always continuous in regions where there are gaps between the surfaces. These effects are shown in Fig- ure 1.
To assess the complementarity at the interface, we can display it using vertices color coded by the surface proper- ties of the interacting subunits. This procedure has the dis- advantage that displaying a new surface property on the interface (e.g., shape, electrostatic potential, hydrophobic- ity) requires that we execute the module that generates the interface geometry from the closest point information. This operation is expensive in AVS because of the overhead of the data-flow model. In contrast, switching between texture maps is rapid when the geometry is constant. We define the texture coordinates of the interface using one of the inter- acting subunits, and can use different texture images for this subunit and the interface. (One limitation of AVS 5.02, however, is that the Geometry Viewer module can have only one dynamic texture, that is, a texture that is generated from other AVS modules.)
Another application of these procedures is to show prop- erties of one subunit displayed on the surface of the other subunit. The interface generation procedure determines a correspondence between the surface points of one subunit and the other. Using this relation, we set the texture coor- dinate of a vertex of one subunit to the value of its corre- sponding vertex on the other subunit. Triangles outside the interface region are assigned texture coordinates of ( - 1, - 1) so that they will not be texture mapped. Color Plate 2 shows an example of texture mapping of an intermolecular interface.
T E X T U R E D A T A P R O C E S S I N G
Our procedure for generating texture coordinates allows us to create a planar topographic representation of surface properties. One advantage of this representation is that a wide variety of image processing tools can be brought to
Surface 2 Surface 2
Figure 1. Limitations of the closest point criterion for de- fining intermolecular interfaces. (A ) The interface from sur- face 1 to surface 2. (B) The interface from surface 2 to surface 1. Note that in interface A, not all points of surface 2 inside the pocket are mapped by the closest point crite- rion.
262 J. Mol. Graphics, 1995, Vol. 13, August

bear for analyzing and processing surface data. These in- clude contouring, interpolation, compositing, and filtering.
AVS has interactive tools for computing isovalue con- tours of two-dimensional image data. One limitation of con- touring is that contour lines show aliasing (pixelation) with small (500 by 250 pixel) texture images. For some appli- cations this aliasing is unacceptable. One method to reduce aliasing is to interpolate the data to create a larger texture image before contouring. Color Plate 3 shows a BPTI mo- lecular surface and its order 10 spherical harmonic surface texture mapped with hydrophobicity data. The spherical harmonic texture image was reconstructed to order 20 and interpolated to a size of 1 000 by 500 pixels so that the contour lines appear smooth.
Many image-processing operations such as convolution or Fourier transforms can be used with the texture data. Care must be exercised, however, to ensure the proper sym- metry of the image operations. Recall that in our represen- tation, data at the left edge of the texture image are contin- uous with the right edge. Operations that do not observe this symmetry will introduce an artifact at the edge of the tex- ture. Also, we must be aware that an area element in the texture image is not the same when applied to the molecular surface.
Although these methods must be applied carefully when analyzing surface data, many applications in animation do not have such stringent requirements. We believe that these tools can be used effectively in animation of molecular in- teractions to produce more illustrative and computationally efficient renderings of proteins and other cellular compo- nents.
In most of our applications, we display surface properties by color coding the data, and use hardware-assisted texture mapping to do this efficiently. Another method is to code the data using different texture elements (dots, crosshatch, etc.) instead of color. In addition, we can select regions within different texture elements and composite them into a single image for application onto a surface. Selection can be done interactively or based on surface data. By this method, we can represent several surface regions or surface proper- ties using different texture elements. For example, Figure 2 shows an order 10 surface of BPTI texture mapped using three texture elements. The regions for each element were selected interactively. Because these texture elements are not created by the spherical mapping procedure, there is distortion at the poles. This method can be improved by modulating the texture elements using the surface area in- formation so that they tile the surface more uniformly.
I N T E R A C T I V E V I S U A L I Z A T I O N
The need for photorealistic rendering in numerous graphics applications will increase the development of hardware- assisted texture mapping, and the computational cost of texture mapping relative to triangle rendering is likely to decrease in the future. With AVS, it is more expensive to recreate a geometry with new texture coordinates than it is to apply a new texture map. We believe that many of the new graphics environments will have this characteristic. Instead of doing expensive polygon manipulation, we try to do operations using the texture data. For example, by pre-
Figure 2. An order 10 spherical harmonic surface of BPTI texture mapped using three texture elements whose posi- tions were selected interactively.
computing several texture images we can rapidly switch between them or do animations by altering the colormap.
One advantage of AVS is that the texture image can be sampled interactively to reduce its size and improve inter- active response time. With the Denali renderer, texturing a 90 by 180 pixel image (2 ° increments) is about twice as fast as texturing a 360 by 720 pixel image (0.5 ° increments). For some surface properties there is little degradation of the surface detail after sampling the texture image to 2 ° incre- ments.
One feature of the Denali renderer is that surfaces can be rendered in a mode called ~'Outline Gouraud," in which a wireframe mesh showing the polygon outline is rendered with the Gouraud shaded polygon. During texture mapping, the wireframe mesh is colored using vertex colors. With this rendering option, we can simultaneously display high- resolution surface detail as a texture map and lower reso- lution information using the vertex colors. The AVS ren- derers on other platforms may blend the texture image with the Gouraud shaded triangles using the vertex colors.
One advantage of the parametric surface representation is the hierarchical structure of the subdivision mesh. As de- scribed in Refs. 10 and 16, we interactively control the resolution of the triangle mesh independent of the resolution of the spherical harmonic surface. An important observation is that the low-resolution triangle mesh indexes the correct texture coordinates. Thus we can change the surface trian- gulation using the same texture image. This is an important feature for interactive applications: by altering the complex- ity of the scene we can change the interactive response time. We can rapidly switch between different triangulation meshes, surface coordinates, or texture images. These con-
J. Mol. Graphics, 1995. Vol. 13, August 263
trois are interactive and independent. Color Plate 4 shows four images of BPTI rendered with the same texture image but different surface triangulations.
We have used these methods to represent and display spherical harmonic surfaces during normal mode vibra- tions, m and texture mapping can also be applied to these surfaces.
One application that we are investigating is the use of these procedures in molecular animation. For some appli- cations, the low-resolution description of molecular struc- ture is more instructive than a detailed atomic model; car- toon diagrams of molecular information are common. The tools described here are ideal for this application. Even in cases in which atomic detail is required, the spherical har- monic methods can be applied to define quickly the motion of the surfaces using low-resolution representations before rendering the detailed model.
C O N C L U S I O N
Texture mapping is a powerful tool for adding surface detail to geometric models and improvements in graphics hard- ware will increase its applicability to molecular graphics. Texture mapping molecular surfaces and isodensity con- tours is well established, but parametric surfaces allow many rendering and geometry attributes (resolution, trian- gulation, texture coordinates) to be controlled interactively and independently. A key element in implementing our pro- cedures is the use of location-based instead of property- based texture coordinates. The spherical harmonic repre- sentation is flexible; many computations can be done using the original molecular surface or its spherical harmonic ap- proximation. We can also apply image processing tools to the texture data.
We believe that it is important to give the user control of the rendering parameters that affect the interactive response time. With our framework, we can develop techniques that run on a wide variety of hardware platforms without sacri- ficing functionality. These methods increase the flexibility and applicability of texture mapping for molecular applica- tions,
Additional images rendered with these techniques are available on the World Wide Web at: http:// www. scripps, edu/pub/o lson-web/doc/harmony/har - mony.html.
ACKNOWLEDGMENT
This work was funded by NIH Grant GM38794 (to A.J.O.).
REFERENCES
1 Catmull, E.E. A Subdivision Algorithm for Computer Display of Curved Surfaces. Ph.D. Dissertation, Uni- versity of Utah, Salt Lake City, 1974
2 Blinn, J.F. and Newell, M.E. Texture and reflection in computer generated images. CACM 1976, 19(10), 542- 547
3 Richards, F.M. Areas, volumes, packing and protein structure. Annu. Rev. Biophys. Bioeng. 1977, 6, 151- 176
4 Teschner, M., Henn, C., Vollhardt, H., Reiling, S., and Brinkmann, J. Texture mapping: A new tool for molecular graphics. J. Mol. Graphics 1994, 12, 98-105
5 Connolly, M.L. The molecular surface package. J. Mol. Graphics 1993, 11(2), 139-143
6 Connolly, M.L. Analytical molecular surface calcula- tion. J. Appl. Crystallogr. 1983, 16, 548-558
7 Sanner, M.F. Modeling and Applications of Molecular Surfaces. Ph.D. Dissertation, Universit6 de Haute- Alsace, France, 1992
8. Sanner, M.F., Olson, A.J., and Sphener, J.-C. Re- duced surface: An efficient way to compute molecular surfaces. Biopolymers (in press)
9 Duncan, B.S. and Olson, A.J. Approximation and char- acterization of molecular surfaces. Biopolymers 1993, 33, 21%229
10 Duncan, B.S. and Olson, A.J. Approximation and vi- sualization of large-scale motion of protein surfaces. J. Mol. Graphics 1995, this issue
11. Duncan, B.S. and Olson, A.J. Predicting protein- protein interactions using parametric surfaces. In: Pro- ceedings of the 13th Molecular Graphics Society Meet- ing, 1994
12 Max, N.L. and Getzoff, E.D. Spherical harmonic mo- lecular surfaces. IEEE Comput. Graphics Appl. 1988, 8(4), 42-50
13. Leicester, S.E., Finney, J.L., and Bywater, R.P. De- scription of molecular surface shape using Fourier de- scriptors. J. Mol. Graphics 1988, 6(2), 104-108
14. Upson, C., Faulhaber, T.J., Kamins, D., Laidlaw, D., Schlegel, D., Vroom, J., Gurwitz, R., and van Dam, A. The Application Visualization System: A computa- tional environment for scientific visualization. IEEE Comput. Graphics Appl. 1989, 9(4), 30--42
15 Bowie, J.E., Olson, A.J. (eds.). Data Visualization in Molecular Science. Addison-Wesley, New York, 1995
16 Duncan, B.S., Pique, M., and Olson, A.J. AVS for molecular modeling. In: Proc. AVS '93 Conf., Int. AVS Center, Research Triangle Park, North Carolina, 1993
17 Bernstein, F.C., Koetzle, T.F., Williams, G.J.B., Meyer, E.F.J., Brice, M.D., Rodgers, J.R., Kennard, O., Shimanouchi, T., and Tasumi, M. The Protein Data Bank: A computer-based archival file for macromolec- ular structures. J. Mol. Biol. 1977, 112, 535-542
18 Goodsell, D. Personal communication. 19 Barnes, J. and Hut, P. A hierarchical O(N log N) force-
calculation algorithm. Nature (London) 1986, 324(4), 446--449
264 J. Mol. Graphics, 1995, Vol. 13, August