Kinetics of precipitation hardening in SiC whisker-reinforced 6061 aluminium alloy
9
JOURNAL OF MATERIALS SCIENCE 26 (1991) 6279-6287 Kinetics of precipitation hardening in SiC whisker-reinforced 6061 aluminium alloy C. BADINI Dipartimento di Scienza dei Materiali e Ingegneria Chimica, Politecnico di Torino, Cso. Duca Degli, Abruzzi 24, 10129 Torino, Italy F. MARINO Dipartimento di Ingegneria dei Materiali, Universit# di Trento, Mesiano, 38050 Trento, Italy A. TOMASI I.R.S.T., Povo, 38050 Trento, Italy Ageing behaviour at 180~ of 6061 aluminium alloy-SiCw composites, drawn from bars obtained in various extruded ratios, and 6061 aluminium alloy used as matrix, have been compared. These materials were dissolved in a salt bath at 529 and 557 ~ for 2 h, quenched in ice-water, and aged at 180~ in an oil bath for increasing periods. Ageing kinetics were studied with Brinell hardness measurements and differential scanning calorimetry (DSC). Various samples of the composite, deriving from bars with (I)20, ~35 and (I)50 mm in diameter, and 6061 aluminium alloy, show the same ageing mechanism; however, the ageing rates results increased for composites. While 6061 aluminium alloy shows its maximum hardness value after about 4-5 h at 180~ the 6061-SiCw composites reach theirs in 2-3 h. Moreover, for composites hardness abruptly decreases after 3 h, while aluminium alloy keeps its maximum value for an ageing time as long as 6 h. Thermal analysis allows us to put together a definite DSC trace for every microstructural state. The highest hardness values are obtained as a result of the formation of a Guinier Preston (GP) needle-shaped zones, which progressively become more thermally stable with protracted isothermal treatment at 180 ~ The different ageing process rates observed for composites and for the 6061 alloy are correlated with the sizes of the reinforcements. Dimensional analysis of whiskers has been performed by light scattering and scanning electron microscopy. Ordinarily the longer the average length of the whiskers in the samples, the faster the ageing process. Higher temperatures are required for composite solutions than for 6061 alloy. On the other hand, 6061-SiCw samples solutionized at higher temperature and then quenched sometimes show microcrack formation in the materials. 1. Introduction The presence of ceramic reinforcements in an alumi- nium alloy matrix generally produces an acceleration in the precipitation processes during artificial ageing [1 5]. Such behaviour has been attributed to the presence of a high density of dislocations near the interface between matrix and reinforcement, intro- duced during quench treatment [1, 3, 4]. These zones form due to the notably different values of the thermal expansion coefficient between matrix and ceramic reinforcement [6]. Moreover, electron microscopy studies indicate that they constitute preferential sites for the heterogeneous nucleation of new phases [6]. The kinetics of the precipitation hardening process in SiC-reinforced aluminium alloys is not completely known, even though it has been suggested that the geometrical shape of the reinforcement plays an im- portant role in the ageing kinetics [4]. In this paper, this influence has been systematically studied for the 6061 SiCw composite. 0022-2461/9l $03.00 + .12 1991 Chapman & Hall Brinell 'macrohardness' measurements were carried out to evaluate the hardness increase of the metal matrix during ageing. SiC reinforcement systemat- ically enhances the Brinell hardness of the composite compared with that of the aluminium alloy used as a matrix. However, as the reinforcement is untouched by the ageing process, this enhancement remains con- stant during the ageing period; for this reason the Brinell technique is suitable to show the hardness increase. Furthermore, differential scanning calorimetry (DSC) measurements gave a 'finger-print' of the ma- trix microstructure of samples aged for different times. Other authors too have demonstrated [7, 8] that the thermograms of some aluminium alloys (e.g. 2219 and 7012) after heat treatment are strongly dependent on the treatment conditions, since the latter determine the microstructure of the materials. The interpretation of the DSC results requires knowledge of the ageing sequence. 6279
-
Upload
independent -
Category
Documents
-
view
0 -
download
0
Transcript of Kinetics of precipitation hardening in SiC whisker-reinforced 6061 aluminium alloy

JOURNAL OF MATERIALS SCIENCE 26 (1991) 6279-6287
Kinetics of precipitation hardening in SiC whisker-reinforced 6061 aluminium alloy
C. BADIN I Dipartimento di Scienza dei Materiali e Ingegneria Chimica, Politecnico di Torino, Cso. Duca Degli, Abruzzi 24, 10129 Torino, Italy
F. M A R I N O Dipartimento di Ingegneria dei Materiali, Universit# di Trento, Mesiano, 38050 Trento, Italy
A. T O M A S I I.R.S.T., Povo, 38050 Trento, Italy
Ageing behaviour at 180~ of 6061 aluminium alloy-SiCw composites, drawn from bars obtained in various extruded ratios, and 6061 aluminium alloy used as matrix, have been compared. These materials were dissolved in a salt bath at 529 and 557 ~ for 2 h, quenched in ice-water, and aged at 180~ in an oil bath for increasing periods. Ageing kinetics were studied with Brinell hardness measurements and differential scanning calorimetry (DSC). Various samples of the composite, deriving from bars with (I)20, ~35 and (I)50 mm in diameter, and 6061 aluminium alloy, show the same ageing mechanism; however, the ageing rates results increased for composites. While 6061 aluminium alloy shows its maximum hardness value after about 4-5 h at 180~ the 6061-SiCw composites reach theirs in 2-3 h. Moreover, for composites hardness abruptly decreases after 3 h, while aluminium alloy keeps its maximum value for an ageing time as long as 6 h.
Thermal analysis allows us to put together a definite DSC trace for every microstructural state. The highest hardness values are obtained as a result of the formation of a Guinier Preston (GP) needle-shaped zones, which progressively become more thermally stable with protracted isothermal treatment at 1 80 ~ The different ageing process rates observed for composites and for the 6061 alloy are correlated with the sizes of the reinforcements. Dimensional analysis of whiskers has been performed by light scattering and scanning electron microscopy. Ordinarily the longer the average length of the whiskers in the samples, the faster the ageing process. Higher temperatures are required for composite solutions than for 6061 alloy. On the other hand, 6061-SiCw samples solutionized at higher temperature and then quenched sometimes show microcrack formation in the materials.
1. I n t r o d u c t i o n The presence of ceramic reinforcements in an alumi- nium alloy matrix generally produces an acceleration in the precipitation processes during artificial ageing [1 5]. Such behaviour has been attributed to the presence of a high density of dislocations near the interface between matrix and reinforcement, intro- duced during quench treatment [1, 3, 4]. These zones form due to the notably different values of the thermal expansion coefficient between matrix and ceramic reinforcement [6]. Moreover, electron microscopy studies indicate that they constitute preferential sites for the heterogeneous nucleation of new phases [6].
The kinetics of the precipitation hardening process in SiC-reinforced aluminium alloys is not completely known, even though it has been suggested that the geometrical shape of the reinforcement plays an im- portant role in the ageing kinetics [4]. In this paper, this influence has been systematically studied for the 6061 SiCw composite.
0022-2461/9l $03.00 + .12 �9 1991 Chapman & Hall
Brinell 'macrohardness' measurements were carried out to evaluate the hardness increase of the metal matrix during ageing. SiC reinforcement systemat- ically enhances the Brinell hardness of the composite compared with that of the aluminium alloy used as a matrix. However, as the reinforcement is untouched by the ageing process, this enhancement remains con- stant during the ageing period; for this reason the Brinell technique is suitable to show the hardness increase.
Furthermore, differential scanning calorimetry (DSC) measurements gave a 'finger-print' of the ma- trix microstructure of samples aged for different times. Other authors too have demonstrated [7, 8] that the thermograms of some aluminium alloys (e.g. 2219 and 7012) after heat treatment are strongly dependent on the treatment conditions, since the latter determine the microstructure of the materials. The interpretation of the DSC results requires knowledge of the ageing sequence.
6279

The 6061 alloy precipitation sequence from the solutionized state is described in the literature [9-21]. It consists of these subsequent transformations:
Supersaturated metastable solid solution ~ GP zones rod-shaped metastable phase 13'-* stable phase 13
with composition Mg2Si.
In previous works [22, 23] it has been demonstrated that differential scanning calorimetry (DSC) allows the study of all these transformations in a linear temperature rise. Moreover, with this technique, peak temperatures, enthalpies and (in some cases) activa- tion energies have been measured for each one of the phases of the ageing sequence described above.
DSC studies of the composite and of the 6061 alloy show how, in these materials, the same precipitation sequence occurs with different kinetics [22, 23]. The comparison by DSC of the ageing rate of a composite with that of the aluminium alloy used as a matrix requires a knowledge of the ageing kinetics of the alloy. The kinetics of transformations undergone by 6061 alloy during ageing, carried out in isothermal conditions at various temperatures, is described in the literature [9, 10, 13, 16]. Disagreements among vari- ous authors are attributable to the different ways in which solution treatment and quenching were per- formed (e.g. different solution temperatures and quen- ching baths used) as well as to different contents of Mg and Si in the alloy [13].
After solution at 560 ~ and quenching, Jacobs [16] observed by means of transmission electron micro- scopy (TEM) the formation of GP zones (5 nm in length) after one hour at 160~ Thomas [10] ob- served with the same technique, after quenching in water from 550~ the formation of zones at 149 ~ after only 24min, and found the GP zones to be needle-shaped, with length progressively increasing with the advancement of the ageing treatment between 20 and 100 nm. Lutts [9] led a detailed study on this topic, carried out by an X-ray scattering technique on single crystals of high-purity aluminium-base alloys (A1-0.7% Mg2Si), quenched from 590 600~ and aged at various temperatures. According to this author GP zone formation occurs after 5 h at 150 ~ and/or 30 rain at 200 ~ Firstly, they are formed by clusters of solute atoms containing a relatively import- ant vacancy concentration; at this stage they do not possess a perfect internal order or periodicity. During subsequent ageing, an identical periodicity to that of the matrix is progressively established: this phenom- enon is related to an abrupt decrease of concentration of vacancies, which are replaced by solute atoms, and to an increase in length of this needle-shaped phase. In addition Jacobs [16] observed that this needle-shaped phase during its growth subsequently loses coherence with the matrix in the direction perpendicular to the needle axes. This process is complete after 80h at 150~ or 7h at 200~ Hence the GP zones with a continuous process transform into a metastable pre- cipitate [3', partially coherent with the matrix, with rod-shaped crystals up to 100 nm in length and about 6 nm in diameter. Thomas [10] described this phase as having f c c structure, whereas more recently Jacobs
6280
[ 16] assigned it as a hexagonal lattice. The rod-shaped metastable precipitate 13' forms easily, keeping the solutionized alloy at temperatures higher than 200 ~
Thomas [10] described the formation of this rod-shaped phase after 5h at 220~ according to Lutts [9] who ascribed it an incubation time of 10h at 200 ~ and 0.5 h at 250 ~
The presence of [3' in samples aged at room temper- ature (T4) appears, on the contrary, controversial: while Lutts does not observe this precipitate even in samples aged for 1 year, Jacobs finds it in samples aged for only 1 week.
The strengthening of the 6061 alloy, achieved by heat treatment, is chiefly attributed to the presence of GP zones, and the subsequent softening to the forma- tion of 13' and [3 [9, 10, 24]. As natural ageing does not lead to a hardness peak, even after a few years during which the alloy shows a slow but continuous increase in mechanical properties [25], it is likely that the formation of the rod-shaped phase and GP zone formation at room temperature is extremely slow. The next transformation, from the metastable to stable. 13 phase (Mg2Si), was never observed for ageing at room temperature. On the contrary this transformation has been observed after 3 h at 260~ by Thomas, after only 0.5h at this temperature by Lutts, and after progressively shorter ageing times with the increasing of the temperature [9]. Moreover, these authors ob- served, in samples aged in the temperature range 200 300~ the contemporary presence of different precipitates (e.g. GP zones and [3', or 13' and 13) due to the non-quantitative character of these phase trans- formations.
2. Experimental procedure 2.1. Materials Bars of composite, with matrix of 6061 aluminium alloy reinforced by 17 vol % of silicon carbide whis- kers, fabricated by Pechiney Aluminium, and un- reinforced 6061 alloy as a reference, were examined. Fabrication of these materials consists of production of billets (120 mm in length and 110 mm in diameter) via squeeze casting and subsequent hot extrusion to obtain bars 20, 35 and 50 mm in diameter, respectively.
The chemical composition of the composite matrix and of 6061 alloy used as a reference is reported in Table I. The SiC whiskers utilized as a reference for the dimensional analysis of reinforcement in the com- posites were supplied by Tokai Carbon.
TABLE l Aluminium alloy 6061 and composite metal matrix chemical analyses (wt %)
Material Element (wt %)
Si Mg Fe Cr Cu Zn
AA 6061 0.65 0.84 0.51 0.15 0.18 0.21 Composite 0.77 1.23 0.29 0.18 0.37 metal matrix

2.2. Sample preparation and analysis 2.2. 1. Heat treatment of the samples and
hardness measurements Disc-shaped samples of composite and of 6061 alloy with a polished surface, 5 mm thick and having a diameter equal to the bar from which they were machined, were submitted to solution treatment, quenching and ageing.
The solution treatment was carried out in a salt bath for 2 h at 529 4- 1 and 557 _+ 1 ~ respectively. The samples were successively quenched in a brine bath and stored in liquid nitrogen until the beginning of the ageing process. The ageing process was carried out in an oil bath at 180 4- 2 ~ In correspondence with pre-determinated ageing times, samples were submitted to Brinell hardness measurements. These measurements were performed with Brinell equipment using an indenter 2.5 mm in diameter and a load of 625 MPa applied for 20s. Each hardness value was obtained as the average of at least twelve measure- ments. Hardness values were correlated with ageing time up to 50h.
2.2.2. Differential scanning calorimetry DSC analysis was carried out on discs (4 mm dia- meter, 2 mm thick), machined from specimens used to determine a plot of hardness achieved as a function of ageing time. Samples corresponding to the solution- ized state and to different ageing periods were ana- lysed. To explain the transformations taking place during artificial ageing (T6 treatment), the thermo- grams of these samples were compared with those obtained from other 6061/SiCw samples solutionized, quenched and submitted to appropriate thermal cycles in the calorimetric equipment.
DSC tests were carried out in DSC 7 Perkin Elmer apparatus with an argon atmosphere. The measure- ment technique and an elaboration of the results are described in a previous work [22]. An improvement of the baseline adopted in the analysis of the composite was achieved by using as reference a composite of pure aluminium reinforced with 20 vol % SiC. Despite this, the uncertainty of the baseline and the partial peak overlapping introduce a certain degree of error in enthalpic measurements; nevertheless these measure- ments allow a meaningful comparison between sam- ples of 6061 alloy and composites. Furthermore, in most cases the shape of the peaks permitted a sharp determination of the peak temperature for the trans- formations.
The complete dimensional characterization of the re- inforcement in the composite therefore necessitates the determination of its size distribution curve.
The most common methods used in particle size studies are not suitable for whisker analysis, due both to the asymmetrical shape and the high brittleness of this material. For example, results for the size analysis carried out with an image analyser on composite sections are hardly affected by whisker orientation with respect to the plane of the section (Figs 1 and 2). Therefore the extraction of the reinforcement from the composite and suitable analytical techniques must be found. The analysis by means of 'light scattering' (Malvern [30]) provides only semiquantitative results, due to the needle shape of the whisker fragments which involves a l ight scattering effect strongly de- pendent on their orientation with respect to the incid- ent beam. On the other hand, the elaboration of the experimental results carried out, taking into account of the particle shape, requires specific software and extremely lengthy computer times [31 ]. Moreover, the Malvern technique shows some merits: speed, good reproducibility of measurements, and the statistical character of the results. For these reasons, size ana- lyses were carried out with this apparatus after ex- traction of whiskers; the results obtained by this method were checked with SEM analyses.
Figure 1 Longitudinal section of bar of composite material (6061 alloy-SiC whiskers).
2.2.3. Whisker size analyses Whiskers used in the manufacturing of these com- posites were produced by heating rice hull at 1800 ~ without the contact of air [26], with a size varying 1-27, 283 from 0.1 to 1 ~tm in diameter and longer than 50 ~tm. During the composite manufacturing and the next mechanical working (e.g. extrusion) the reinforce- ment, characterized by high brittleness, is prone to breakage, with production of fragments showing de- creasing sizes as the extrusion ratio increases [2, 29].
Figure 2 Transverse section of bar of composite material (6061 alloy SiC whiskers).
6281

These techniques demonstrated meaningful size dif- ferences for the reinforcement contained in composite bars with different diameters. The analyses were car- ried out as follows. After dissolution of the aluminium matrix in a 5% HC1 aqueous solution, the whiskers were collected by filtration and washed, then sus- pended in a 1% triethanolamine solution and exam- ined by Malvern. Some drops of this solution were dried at 40 ~ on a sample holder and then observed by SEM. Cut-down parts of composite bars were submitted to various subsequent attacks with HC1 solution in order to obtain samples of whiskers pro- gressively closer to the bar axis. The extremities of these cylindrical samples were protected from chem- ical etching with polyester paint. For each kind of composite, the sequence of chemical attacks was re- peated three times and the distribution data are given as averaged values.
3. Results and discussion 3.1. Solution temperature and microstructure DSC thermograms of composites solutionized at 529 ~ for 2 h show significant differences in the high- temperature part with respect to the analogous ther- mogram of the 6061 alloy. Only in the first case could sharp endothermic effects in the range 500 ~ temperature be observed. For instance, a composite bar 50mm in diameter displays two endothermic peaks at 536 and 558 ~ probably related to local melting occurring where inhomogeneity in composi- tion causes eutectic formation (e.g. ternary eutectiC Mg2Si-(A1)-(Mg) melts at 558 ~ [32]. When com- posite solution is carried out at 557 ~ for 2 h, these endothermic peaks disappear almost completely and stronger exothermal effects related to 13' and [3 forma- tion are observed. Hence the solutionized state is more difficult to reach in the case of a composite than with aluminium alloy.
In Table II, results obtained for samples drawn from the external part of a 50 mm diameter bar solu- tionized at 529 and 557 ~ are compared. Thus in the case of the composite it should be appropriate to carry out the solution treatment at 557 ~ to increase the degree of supersaturation of the solid solution. But drastic quenching treatments may result in damage to the incompletely homogeneous materials. This is the case for some composite samples showing reinforce- ment-free zones (Fig. 3). Close to these areas, owing to the different thermal contraction during cooling of whisker-free and whisker-rich regions, formation ot
cracks after quenching from 557 ~ has been observed (Fig. 4). As already mentioned, in practice this pheno- menon prevents the achievement of greater hardness. The correct solution treatment would therefore re- quire an improvement in the manufacturing process with the aim of achieving a higher degree of homogen- eity in the composite or the use of a properly studied quenching mean.
3.2 Ageing at 180~ Fig. 5 (curve a) depicts the Brinell hardness values as a function of ageing time (at 180~ for 6061 alloy solutionized at 529 ~ and quenched. The analogous curve after solution at 557 ~ and quenching is quite similar to the former. During the first 4 h of ageing, the hardness increases from 500 up to about 1100 MPa; in the next 6 h it remains constant; afterwards it slowly decreases. The behaviour of the composites (submitted to the same heat treatment) is appreciably different (Fig. 5, curves b-d). These materials achieve their maximum hardness value (within 2 3 h) more quickly than 6061 alloy, hence they reach the overaged condi- tion faster. Composite bars 50mm and 35 mm in diameter reached the hardness peak after 2 h (Fig. 5, curves c and d), 20 mm diameter composite bars after
Figure 3 Composite material as-received: zone without reinforcing whiskers.
T A B L E I I Effect of solution temperature on DSC thermograms of samples of composite 6061 SiCw (bar �9 - 50 mm)
Solution temperature (c)
Formation of [3' Formation of [3
T. H T. H (~ (j g-') (~ (j g-')
529 243 6.0 288 0.5 557 243 7.0 289 1.0
6282
Figure 4 Microcrack in composite material after solution at 557 C and water quenching next to an unreinforced area.
1 4 0 0 - _
1200- ~ / -~/
o
m 34 i
1400
lZ: -
IO(O-
~ O -
6OO-
i I I 1 I I I I I
0.5 } 4 8 20' gO Time(hi
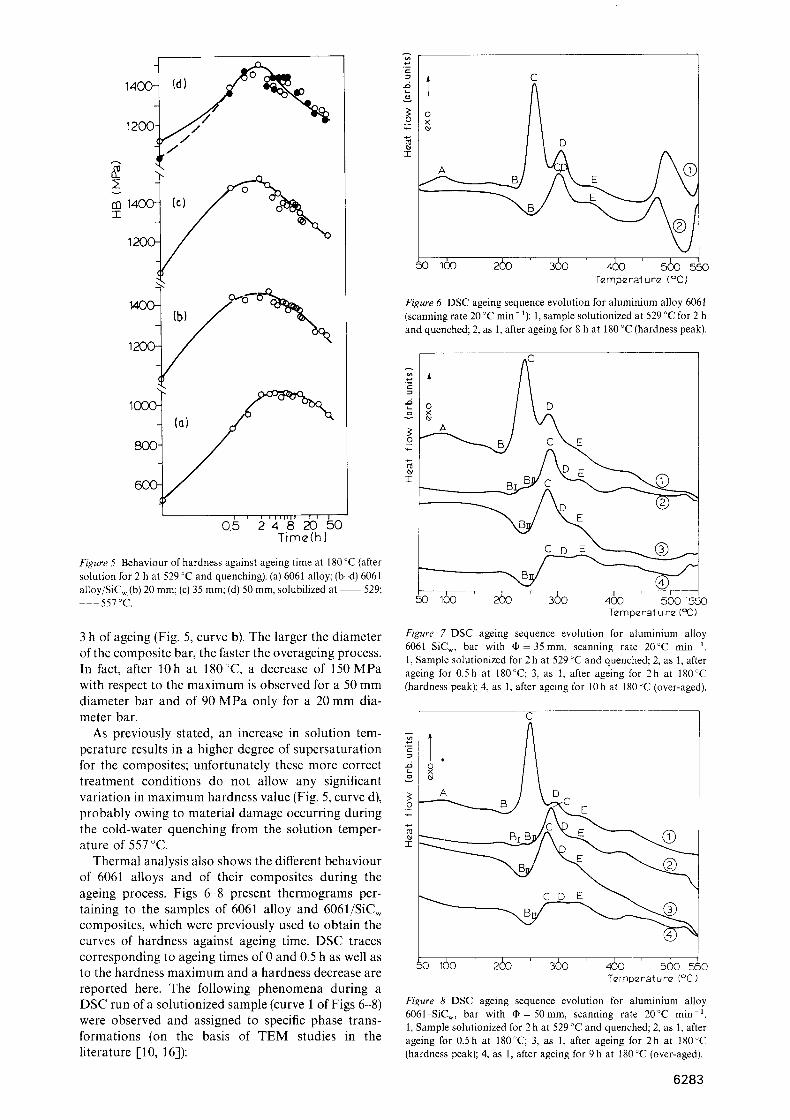
Figure 5 Behaviour of hardness against ageing time at 180 ~ (after solution for 2 h at 529 ~ and quenching). (a) 6061 alloy; (b~l) 6061 alloy/SiC~ (b) 20 mm; (c) 35 mm; (d) 50 mm, solubilized at 529; - - - 5 5 7 ~
3 h of ageing (Fig. 5, curve b). The larger the diameter of the composite bar, the faster the overageing process�9 In fact, after 10h at 180~ a decrease of 150 MPa with respect to the maximum is observed for a 50 mm diameter bar and of 90 MPa only for a 20 mm dia- meter bar.
As previously stated, an increase in solution tem- perature results in a higher degree of supersaturation for the composites; unfortunately these more correct treatment conditions do not allow any significant variation in maximum hardness value (Fig. 5, curve d), probably owing to material damage occurring during the cold-water quenching from the solution temper- ature of 557 ~
Thermal analysis also shows the different behaviour of 6061 alloys and of their composites during the ageing process. Figs 6-8 present thermograms per- taining to the samples of 6061 alloy and 6061/SiCw composites, which were previously used to obtain the curves of hardness against ageing time. DSC traces corresponding to ageing times of 0 and 0.5 h as well as to the hardness maximum and a hardness decrease are reported here. The following phenomena during a DSC run of a solutionized sample (curve 1 of Figs 6-8) were observed and assigned to specific phase trans- formations (on the basis of TEM studies in the literature [10, 16]):
. , 0 I-.
T
l C
o
160 260 360 460 ' ~ 550 Tempcral ure (~
Figure 6 DSC ageing sequence evolution for aluminium alloy 6061 (scanning rate 20 ~ min- 1): 1, sample solutionized at 529 ~ for 2 h and quenched; 2, as 1, after ageing for 8 h at 180 ~ (hardness peak).
T A o
o
T
C
50 I(~D 260 360 4(~) 560 550 Tcmpcrat u r@ (~
Figure 7 DSC ageing sequence evolution for aluminium alloy 6061 SiCw, bar with (1)= 35 ram, scanning rate 20~ min '. 1, Sample solutionized for 2 h at 529 "C and quenched; 2, as 1, after ageing for 0�9 at 180~ 3, as 1, after ageing for 2h at 180~ (hardness peak); 4, as 1, after ageing for 10h at 180~ (over-aged).
'E
o
*& I
C
Tempera ture (~
Figure 8 DSC ageing sequence evolution for aluminium alloy 6061 SiCw, bar with q~ = 50mm, scanning rate 20~ m i n - ' . 1, Sample solutionized for 2 h at 529 ~ and quenched; 2, as 1, after ageing for 0.5h at 180~ 3, as 1, after ageing for 2h at 180~ (hardness peak); 4, as 1, after ageing for 9 h at 180 ~ (over-aged).
6283

TAB L E I I I DSC thermograms of samples aged at 180 ~ C: peak temperatures and values of enthalpy for phases formation and reversion
Sample Ageing Peak time (h) A BI BII C D
T H T H T H T H T H (~ (j g - ' ) (~ (j g - l ) (~ (j g-~) (~ (j g 1) (~ (j g 1)
6061 alloy 0 60-100 not det. 228 0.5 8 absent absent
6061/SiCw �9 20mm 0 60-100 not det. 200 < 0.5 0.5 absent 217 < 0.5 3 absent absent
10 absent absent
6061/SiCw ~ 35mm 0 60-100 not det. 200 0.5 0.5 absent 217 < 0.5 2 absent absent
10 absent absent 6061/SiCw~50mm 0 60-100 not det. 202 1.0
0.5 absent 217 < 0.5 2 absent absent 9 absent absent
absent 256 7.0 305 1.5 242 1.0 301 2.0 peaks C + D
absent 245 7.0 291 0.5 251 <0.5 288 2.0 peaks C + D 242 1.5 287 1.5 peaks C + D 244 1.5 282 1.0 peaks C + D
absent 241 7.0 287 0.5 245 < 0.5 284 2.5 peaks C + D 236 1.5 281 2.0 peaks C + D 244 1.5 282 1.0 peaks C + D
absent 244 6.5 289 0.5 243 < 0.5 286 2.5 peaks C + D 237 1.0 279 2.0 peaks C + D 242 1.0 281 0.5 peaks C + D
a large exothermic effect at above 60-100~ which refers to GP zone formation (peak A);
a subsequent endothermic peak with Tp about 200-230 ~ (peak B), which is related to GP zone reversion; and
two sharp exothermic effects corresponding to metastable rod-shaped ([Y) and stable [3 formation (peaks C and D).
Furthermore, the last part of the thermograms at higher temperatures consists of a broad and complex area chiefly due to the endothermic dissolution of the precipitates; other overlapped exothermal phenomena (for example shoulder E at about 340~ are also present. As reported in a previous work [22], the whole precipitation-dissolution sequence is realized at lower temperatures for composites with respect to the alloy used as a matrix.
The thermograms of composites and 6061 alloy aged for different times up to 10h are different with respect to those of samples in the solutionized state: in fact the GP zone formation peak (A) is absent, and the peaks B, C and D are partially overlapped. Moreover at 0.5 h two endothermic phenomena, attributable to GP zone reversion, appear. With the progress of the ageing process, this endothermic peak moves towards higher temperatures and is emphasized, whereas the precipitation exothermic phenomena (C + D) pro- gressively appear to turn down. Thus the enthalpy of the exothermic transformations is more difficult to determine. Finally, the shoulder (E), which is present in all thermograms, becomes more important in the specimens submitted to long periods of ageing.
In Table III, peak temperatures and enthalpy values for samples at different ageing conditions are reported. This table shows the progressive shift of the zone dissolution peak towards higher temperatures with increasing ageing times. As a consequence, the ex0- thermic precipitation peak also falls at higher temper- atures with respect to peak C observed for samples in the solutionized state. Furthermore, it falls at a lower
6 2 8 4
t _
3 ~ o
n -
�9
|
I
100 200
D
J
/ t
./
I _ _
300 400 500 Temperoture (o C)
Figure 9 DSC thermograms of aluminium alloy 6061 after thermal cycles: 1, sample solutionized at 529 ~ for 2 h and quenched; 2, as 1, after ageing at 70~ for 3h; 3, as 1, after ageing at 180~ for 1 h; 4, as 1, after ageing at 180 ~ for 3 b; 5, as 1, after ageing at 227 ~ for 15 min.
temperature with respect to peak D (of solutionized samples) due to the overlapping of different exo- thermic phenomena.
To better understand the transformations in the DSC traces (Table III), 6061 alloy samples solution- ized at 529~ were submitted to tailored thermal cycles. These samples were heated in the cell of the calorimeter (with a scanning rate of 20 ~ min- 1) up to 227, 180 or 70 ~ respectively, kept at these temper- atures in isothermal conditions for different periods of time (15 min, 1 h, 3 h), then cooled to room temper- ature and analysed by DSC apparatus. In Fig. 9, the DSC traces of samples cycled as above are reported and compared with the thermogram of the 6061 alloy in the solutionized state (curve 1). Curve 2 of Fig. 9 refers to a sample aged in the calorimeter at 70 ~ for

3 h. This isothermal treatment causes the shift of the zone dissolution peak (B) towards a higher temper- ature. Moreover, the enthalpy value for this pheno- menon increases appreciably while the enthalpies of exothermic peaks slightly decrease. Curves 3 and 4 are obtained after isothermal treatments at 180 ~ for 1 and 3 h, respectively. Also, these isothermal treatments cause the shift of peak B towards a higher temperature and a marked decrease of intensity of exothermic peak C. In addition peaks B, C and D tend to overlap. For these reasons, in the resulting thermogram 4, only one exothermic effect is distinguishable. This peak (C + D) falls at a temperature between those characteristic of peaks C and D present in the DSC curve of a solution- ized and quenched sample (Fig. 9, curve 1). Moreover the intensity of this exothermic effect is greatly low- ered. Thermogram 4 is similar to the DSC traces of composite samples aged for short periods of time. Curve 5 of Fig. 9 refers to a sample which was heated up to the onset of peak C and kept at this temperature for 15 min. This last DSC curve is similar to thermo- grams of samples artificially aged for several hours.
The shift of peak B towards higher temperatures, due to ageing (Table III, Fig. 9), can be explained on the basis of data in the literature. Such a behaviour seems to be general, in fact it has been observed by other authors [7] for 2219 alloy. In addition, accord- ing to Antonione et al. [8], the peak temperature for GP zone dissolution depends on the heat treatment parameters. In particular, such a peak progressively moves to higher temperatures with the increase in ageing time and temperature. These authors [7, 8] agree that prolongation of the treatment time, or a higher temperature, determines an increase of GP zone size (also observed by microscopy) and con- sequently a greater thermal stability. Moreover, cor- responding to the size increase of the zones, they have also observed (in the DSC traces) a decreasing forma- tion enthalpy for the subsequent phases. As the GP zones transform into the rod-shaped phase with a continuous process, a modification of their size and internal structure can partially explain the decrease of exothermal effects. On the other hand, in curves 4 and 5 of Fig. 9 the exothermal effects are greatly reduced with respect to the solutionized state, and it should be inferred (contrary to the TEM studies [9, 10]), that a co-precipitation of the 13' rod-shaped phase has occurred.
The comparison between the thermograms ob- tained for alloy 6061 and its composites at T6 temper and for samples submitted to different thermal cycles leads to the conclusion that the ageing mechanism described above is common to all these materials.
of the aluminium matrix/SiC interfacial stresses [1, 3, 23]. Furthermore the dislocations generated at the whisker ends may travel far enough during cooling substantially to enhance the dislocation density of a large part of the matrix [33]. Generally, strained zones enhance the nucleation and the early growth stages of semi-coherent intermediate phase precipitation [3, 21]. Hence an increase in artificial ageing rate was ascribed to the high dislocation density and resid- ual stress in the aluminium matrix. According to the theoretical study of Dutta et al. [4], the plastic strain (and consequently the ageing rate) increases as the reinforcing particulate aspect ratio increases, the spheres generating the lowest plastic strain and the long cylinders generating the highest. The size dis- tribution analysis of whiskers showed a correlation between their length and the ageing rate of our com- posite materials.
Whiskers utilized in composite manufacturing show a wide size distribution. Figs 10 and 11 depict the results of the dimensional analysis performed with Malvern apparatus, and the whisker morphology observed by SEM respectively. The more consistent volume fraction of the whiskers (about 45%) shows lengths ranging from 113 to 160 l.tm, while only 20% of the reinforcement has a length shorter than 6 p.m.
Figs 12 and 13 show, respectively, the volume frac- tion of whiskers with lengths ranging from 6 to 20 pm or from 4 to 20 pm against the distance from the surface of the composite bars with 20, 35 and 50 mm diameters. In all the composites examined, at least 40 vol % of the whiskers show lengths shorter than 4 ~m. Close to the bar centre, a larger integrity of the reinforcement has been found with the presence of a meaningful fraction of 15-20 pm length whiskers.
50-
40-
30-
~> 20- 3~
~ 1 0 -
0 6 7 9 11 15 18 24 30 39 50 65 84113160 Size (lain)
Figure lO Dimensional distribution of whiskers (Tokai Carbon).
3.3. Influence of reinforcement dimensions on the ageing process
When an aluminium alloy/SiC composite is subjected to a quench, local plastic deformation can occur. The plastic deformation is due to stress created by the difference between the coefficients of thermal expan- sion of the two components of the material. A high density of dislocations results from plastic relaxation Figure 11 Morphology of whiskers by SEM.
6285

�9 o
L
o
0.4
0
1 2 3 4 (0) g R -~ 'R gR gR (b, 1R 5 R ~ R 4 R (c, gR -~R -~R -~R
Distance from bar surface (as radius f ract ion)
Figure 12 Volume fraction of whiskers with length between 6 and 20 gm in function of the distance from the surface of composite bars with different diameter: (a) 20; (b) 35; (c) 50 ram.
~ - Q 8 tn r -
. o
o.4
~ 0.2
2 3 4 P') {R "~'R "~R ~'R (b) -gR ~.R -g'R --gR (c) ~R ~R gR ~R
Distance from barsurface (as radius fraction)
Figure 13 Volume fraction of whiskers with length between 4, and 20 gm in function of the distance from the surface of composite bars with different diameter: (a) 20; (b) 35; (c) 50 mm.
Therefore the composite manufacturing process via squeeze casting and extrusion causes whisker break- age. A less severe extrusion allows us to avoid damage to the reinforcement, which is more marked close to the outer surface than close to the bar axis.
These results explain the different behaviours with respect to heat treatment observed for composite bars with different diameters. Specimens submitted to less rough extrusion (50 and 35 mm diameter bars) show whiskers with a larger average length inducing a faster age hardening.
4. Conclus ions Silicon carbide whiskers reinforcing the 6061 alumi- nium alloy considerably accelerate the precipitation hardening processes during 180 ~ ageing. The longer the average length of the whiskers, the more marked is the effect, the former depending on mechanical work- ing undergone during the production process.
DSC analysis allows the study of microstructural variations undergone by the material during ageing, and hence their relation to mechanical properties. In the 6061 alloy and its composites, the maximum hardness is obtained when GP zones (needle-shaped) are formed. Thermal analysis indicates that the GP zones are progressively more stable with the protrac-
6286
tion of ageing treatment after their growth. Com- posites require higher solution temperatures than 6061 alloy to reach a complete solutionized state but, on the other hand, composites can be damaged more easily during the subsequent quenching process.
A c k n o w l e d g e m e n t s The authors wish to thank Professor P. Appendino of Politecnico di Torino, under whose general super- vision this work was performed, Mr. F. Nicolodi for the help given with the DSC measurements and Dr L. Montanaro for Malvern tests.
R e f e r e n c e s 1. T . G . NIEH and R. F. KARLAK, Scripta Met. 18 (1984) 25. 2. S.V. NAIR, J. K. TIEN and R. C. BATES, Int. Met. Rev. 30
(1985) 275. 3. H.J . RACK, in Proceedings oft-he Sixth International Confer-
ence on Composite Materials, London, July 1987, Vol. II (Elsevier Applied Science, London, i Tew York, 1987) p. 382.
4. I. DUTTA, D. L. BOURELL and O. LATIMER, 3. Compos. Mater. 22 (1988) 829.
5. J .L . PETTY-GALIS and R. D. GOOLSBY, J. Mater. Sci. 24 (1989) 1439.
6. R . J . ARSENAULT and R. M. FISHER, Seripta Met. 17 (1983) 67.
7. J .M. PAPAZIAN, Met. Trans. I2A (1981) 269.

8. C. ANTONIONE, F. MARINO, G. RIONTINO, S. ABIS and E. DI RUSSO, Mater. Chem. Phys. 20 (1988) 13.
9. A. LUTTS, Acta Metall. 9 (1961) 577. 10. G. THOMAS, J. Inst. Met. 90 (1961-2) 57. 11. G.C, W E A T H E R L Y a n d R . R N I C H O L S O N , PhiI. Mag. 17
(1968) 801.
12. E. OZAWA and H. KIMURA, Acta Metall. 18 (1970) 995. 13. C. BRICHET, G. W Y O N a n d P . LACOMBE, MOm. Sci. Rev.
MOt. 67 (1970) 691. 14. E. O Z A W A a n d H . K I M U R A , M a t e r . Sci. Engn98(1971) 327. 15. 1. KOVACS, J. LENDVAI and E. NAGY, Acta Metall. 20
(1972) 975. 16. M.H. JACOBS, Phil. Mag. 26 (1972) 1. 17. J. LENDVAI, T. UNGAR and 1. KOVACS, Mater. Sci.
Engn9 16 (1974) 85. 18. H. EL SAYEDand I. K O V A C S , Phys. Stat. Sol.(a) 24(1974)
123. 19. E. KORNGIEBEL, H. LOFFLER and W. OETTEL, ibid. 30
(1975) K125. 20. H . J . RACK and R. W. KRENZER, Met. Trans. 8A (1977)
335. 21. H.J . RACK, Mater. Sci. Engng 29 (1977) 179. 22. C. BADINI, F. MAR1NO and A. TOMASI, Mater. Chem.
Phys. 25 (1990) 57. 23. J .M. PAPAZIAN, Met. Trans. 19A (1988)2495.
24. M. CONSERVA, E. DI RUSSO and P. FIORINI, Alluminio e Nuova Metallurgia 19 (1970) 515.
25. ASM "Metals Handbook" Vol. 2, 9th edn (American Society for Metals, Metals Park, Ohio, 1979) p. 31.
26. J . G . LEE and I. B. CUTLER, Amer. Ceram. Soc. Bull. 54 (1975) 195.
27. K.R. KARASEK, S. A. BRADLEY, J. T. DONNER, M. R. MARTIN, K. L. HAYNES and H. C. YEH, J. Mater. Sci. 24 (1989) 1617.
28. A. P. DIVECHA, S. G. FISHMAN and S. D. KARMARKAR, J. Metals 33 (1981) 12.
29. R.J. ARSENAULT, Mater. Sei. Engn 9 64 (1984) 171. 30. U. TUZUN and F. A. FARHADPOUR, Particle Character-
ization 2 (1985) 104. 31. P. CHYLEK, G. W. GRAMS and R. G~ P1NNICK, Science
193 (1976) 480. 32. ASM "Metals Handbook" Vol. 8, 8th edn (American Society
for Metals, Metals Park, Ohio, 1973) p. 396. 33. T. CHRISTMAN and S. SURESH, Acta Metall. 36 (1988)
1691.
Received 10 September 1990 and accepted 28 February 1991
6287