Determination of maize hardness by biospeckle and fuzzy granularity
Upload
khangminh22Category
view
1download
0
coatings
Article
Effects of Laser Hardening Process Parameters onHardness Profile of 4340 Steel Spline—AnExperimental Approach
Noureddine Barka 1,* , Sasan Sattarpanah Karganroudi 2 , Rachid Fakir 1 , Patrick Thibeault 1
and Vincent Blériot Feujofack Kemda 1
1 Mathematics, Computer Science and Engineering Department, Université du Québec à Rimouski,Rimouski, QC G5L 3A1, Canada; [email protected] (R.F.); [email protected] (P.T.);[email protected] (V.B.F.K.)
2 Institut Technologique de Maintenance Industrielle, Cégep de Sept-Iles, Sept-Iles, QC G4R 5B7, Canada;[email protected]
* Correspondence: [email protected]
Received: 14 January 2020; Accepted: 27 March 2020; Published: 2 April 2020�����������������
Abstract: This study displays the effect of laser surface hardening parameters on the hardnessprofile (case depth) of a splined shaft made of AISI 4340 steel. The approach is mainly basedon experimental tests wherein the hardness profile of laser hardened splines is acquired usingmicro-hardness measurements. These results are then evaluated with statistical analysis (ANOVA)to determine the principal effect and the contributions of each parameter in the laser hardeningprocess. Using empirical correlations, the case depth of splined shaft at tip and root of spline’s teethis also estimated and verified with measured data. The obtained results were then used to study thesensitivity of the measured case depths according to the evolution of laser process parameters andgeometrical factors. The feasibility and efficiency of the proposed approach lead to a reliable statisticalmodel in which the hardness profile of the spline is estimated with respect to its specific geometry.
Keywords: AISI 4340 steel; analysis of variances; case depth; laser hardening; splined shaft;experimental analyses
1. Introduction
Laser surface hardening is a heat treatment process that uses a high energy density laser in alocalized heating zone [1,2]. Applying this process on steel parts and coupling it with a fast quenchingtechnique, called martensitic quenching, allow improving fatigue life and limit the distortion of steelparts [3–5]. The laser beam is capable of rapidly increasing the surface temperature to above theaustenitizing temperature (Ac3). This intense heating process makes it possible to transform the existingmicrostructure of the surface to austenite, and then to generate a very fine martensitic microstructurewith high hardness [6]. In order to obtain a uniform hardness profile on parts with complex geometries,specific tuning on the parameters of laser hardening processes, such as laser power and scanningspeed, is required [7–9]. This uniform hardness profile is recommended to uniformly distribute themechanical loads. This layer is obtained by a uniform martensitic layer at the surface of hardenedparts. This uniform hardened layer avoids stress concentration on the hard surface layer of parts andlimits crack propagation under periodic loads, which improves the fatigue resistance of parts [10–12].In the case of splines, a uniform hardness profile on teeth geometry can effectively reduce the wearingcaused by abrasion [13].
To achieve this uniform hardness profile, it is important to calibrate parameters such as laserpower, scanning speed, and rotational speed. Sun et al. [14] proposed an experimental approach
Coatings 2020, 10, 342; doi:10.3390/coatings10040342 www.mdpi.com/journal/coatings

Coatings 2020, 10, 342 2 of 12
supported with an analysis of variance (ANOVA) to develop a model for optimizing laser claddingparameters. This approach allows demonstrating an optimal combination of process parametersto obtain a high-quality microstructure with laser coating applied to Ti6Al4V. Lambiase et al. [15]proposed a prediction method that can determine the temperature distribution profile based on laserhardening process parameters using an artificial neural network technique. The artificial neuralnetwork model allows for a better understanding of laser heating process behavior and the validationof simulated data. Bailey et al. [16] carried out tests to optimize the laser hardening processes ofindustrial parts with complex geometries by developing a predictive model. Their approach canestimate the amount of heat generated during the process and transferred to the surface of a splinedshaft. Thus, it can predict the hardness profile based on the heated area on the surface layer of parts.Babu et al. [17] carried out experimental studies on the microstructure of low alloy steels wherein thedurability after laser hardening is studied. Their approach allows optimizing the hardness profile ofEN25 steel and obtaining a surface hardness twice as high as the core hardness by varying the laserpower and sweeping speed. Lusquinos et al. [18] carried out theoretical and experimental studiesof laser heat treatment applied to 1045 steel using a high-power diode laser source. The results oftheir study demonstrate that obtaining a greater degree of hardness can be archived by maintaining arelatively constant surface temperature during the process.
Most of the previous research works were carried out on simple geometries. However, in thispaper, we present a comprehensive set of experimental tests on a complex geometry of a splined shaftand present a statistical approach to evaluate the effect of the laser hardening process and geometricalparameters on the case depth of splines. To this end, the first step is to plan experimental tests byvarying different parameters of laser hardening procedures and geometrical parameters of splines.The second step involves defining the variation range of each independent parameter. The third stepconsists of acquiring the experimental results and analyzing these data using ANOVA analysis [19,20].The final step is dedicated to developing a reliable statistical model to estimate the case depth hardnessof splines, according to their geometry.
This article is organized as follows. Section 2 presents the experimental planning, the methodology,and a description of the proposed approach toward using statistical analysis to determine the effect oflaser hardening parameters on splined shafts. Results of experimental tests as well as statistical andsensitivity analyses are presented in Section 3. The paper ends with a conclusion and ideas for futureworks on this domain in Section 4.
2. Methodology and Experimentations
The experimental tests presented in this article are carried out on AISI 4340 steel splines. Thechemical composition of AISI 4340 Steel and its mechanical characteristics are given in Tables 1 and 2,respectively. The geometrical parameters of these splines, as shown in Figure 1, consist of a diameterof 29 mm, flank tilt angles of 15◦ and 20◦, and the tooth depth of splines, which varies in three differentdepths: 2.5, 3, and 3.5 mm.
Table 1. AISI 4340 steel chemical composition as a percentage.
C Cr Fe Mn Mo Ni P S Si
0.37–0.43 0.7–0.9 96 0.7 0.2–0.3 1.83 <0.035 <0.04 0.23
Table 2. Mechanical properties of AISI 4340 steel.
Yield Strength [MPa] Ultimate Tensile Strength[MPa]
Elongation at Break[%]
Hardness Rockwell C[HRC]
710 1110 13.2 35

Coatings 2020, 10, 342 3 of 12
Coatings 2020, 10, x FOR PEER REVIEW 3 of 12
Figure 1. Geometric variation of experimented spline shafts, dimensions are in [mm], and angle is in
degrees [°].
Before applying the laser hardening heat treatment, the spline shafts are quenched and tempered
to achieve a uniform core hardness of approximately 45 HRC. The experimental laser hardening set-
up, as illustrated in Figure 2, is composed of a 3 kW fiber laser source and six degrees of freedom
(DF) articulated FANUC robot, which supports the laser head. A rotating rig is also integrated into
the experimental set-up, which provides a maximal rotation speed of 10,000 rpm. This experimental
set-up is also equipped with a mixed mounting system, comprising central support with three jaws
and a counter-head that moves along the z-axis. This mounting system allows centering the spline
shafts during rotation. The laser spot is located in the median plane of splines, which are laser heat-
treated. Following laser heat treatment, the samples are carefully prepared, polished, and etched
using a Nital chemical solution (95% ethanol and 5% nitric acid). The hardness profiles are then
characterized by micro-hardness measurements using a Clemex machine.
Figure 2. Experimental set-up equipped with a robotic laser cell [21].
Figure 1. Geometric variation of experimented spline shafts, dimensions are in [mm], and angle is indegrees [◦].
Before applying the laser hardening heat treatment, the spline shafts are quenched and temperedto achieve a uniform core hardness of approximately 45 HRC. The experimental laser hardening set-up,as illustrated in Figure 2, is composed of a 3 kW fiber laser source and six degrees of freedom (DF)articulated FANUC robot, which supports the laser head. A rotating rig is also integrated into theexperimental set-up, which provides a maximal rotation speed of 10,000 rpm. This experimental set-upis also equipped with a mixed mounting system, comprising central support with three jaws and acounter-head that moves along the z-axis. This mounting system allows centering the spline shaftsduring rotation. The laser spot is located in the median plane of splines, which are laser heat-treated.Following laser heat treatment, the samples are carefully prepared, polished, and etched using a Nitalchemical solution (95% ethanol and 5% nitric acid). The hardness profiles are then characterized bymicro-hardness measurements using a Clemex machine.
Coatings 2020, 10, x FOR PEER REVIEW 3 of 12
Figure 1. Geometric variation of experimented spline shafts, dimensions are in [mm], and angle is in
degrees [°].
Before applying the laser hardening heat treatment, the spline shafts are quenched and tempered
to achieve a uniform core hardness of approximately 45 HRC. The experimental laser hardening set-
up, as illustrated in Figure 2, is composed of a 3 kW fiber laser source and six degrees of freedom
(DF) articulated FANUC robot, which supports the laser head. A rotating rig is also integrated into
the experimental set-up, which provides a maximal rotation speed of 10,000 rpm. This experimental
set-up is also equipped with a mixed mounting system, comprising central support with three jaws
and a counter-head that moves along the z-axis. This mounting system allows centering the spline
shafts during rotation. The laser spot is located in the median plane of splines, which are laser heat-
treated. Following laser heat treatment, the samples are carefully prepared, polished, and etched
using a Nital chemical solution (95% ethanol and 5% nitric acid). The hardness profiles are then
characterized by micro-hardness measurements using a Clemex machine.
Figure 2. Experimental set-up equipped with a robotic laser cell [21]. Figure 2. Experimental set-up equipped with a robotic laser cell [21].

Coatings 2020, 10, 342 4 of 12
To evaluate the case depth at the tip and root of spline teeth, a series of experimental testsare carried out wherein the laser hardening process and splines’ geometrical parameters are varied.Adopting an experimental plan in which different parameters vary within their variation range, allowstudying the effect of parameters on the case of depth. The efficiency and simplicity of factorialexperiments make it the most commonly used model for choosing factor levels and the simultaneousmode of factor variation in order to study the effect of each factor on the process [22]. In the case of laserhardening processes, it is important to define the experimental margins by allowing for minimal casedepth transformation and excessive transformation. Maximal and minimal tuning is necessary beforeparameter levels can be established. The experimental strategy consists of investigating independentand controllable operational factors [23]. The five factors that are used in these experiments are laserpower (P), scanning speed (S), rotation speed (R), flank tilt angle (A), and tooth depth (D). Table 3shows the factors and their variation ranges in our experiments. Four factors with three variation levelswere considered for laser power, scanning speed, rotation speed, and tooth depth. The remainingfactor, flank tilt angle (A), had only two variation levels due to the non-availability of manufacturingtools. All the factors used in these experiments are continuous and interrelated. The average variationrange of laser hardening parameters, which allows us to achieve an acceptable case depth in a laserheat treatment process that is determined as 2200 W, 4 mm/s, and 2000 rpm.
Table 3. Factors used in the experimental tests and range of variables.
Factors Abbreviation Variation Ranges Unit
Laser power P 1900, 2200, and 2500 WScanning speed S 2, 4, and 6 mm/sRotation speed R 1500, 2000, and 2500 rpm
The flank tilt angle of spline tooth A 15 and 20 Degree [◦]Tooth depth of spline shaft D 2.5, 3, and 3.5 mm
Each test consists of linear displacement of the spot in the spline’s medium plane. Using amicro-hardness measuring machine, the hardness of heat-treated splines is measured by examiningtheir cross-section to determine the hardness profile (case depth). These results are then exploitedusing the contributions and average effects of each studied factor on the final response. To this end,the analysis of variance (ANOVA), a statistical model which analyzes the differences among groupmeans in a sample, is used to determine the effect of each factor on the case hardening of splines.The percentage contribution of a single factor reflects the total variation observed in the experimentsattributed to this factor and the interactions between factors [24]. These analyses are then followedby performing a linear regression to obtain a mathematical model of case hardening as a function ofindependent variables and their interactions. This mathematical model can predict the case depth ofspline shafts at the tip and root of splines’ teeth. Lastly, sensitivity analyses of case depths based onthe response surfaces [25] as a function of laser hardening process parameters is performed to obtaina more clear understanding of the estimated model responses. The sensitivity study is establishedto explore the effects of the laser hardening process parameters on the hardness profile. In fact, theresponse surfaces present contour plots of case depths at the tip and root of a splines’ tooth with respectto the variation of the process parameters.
In Section 3, the results of case depth measurements are presented and supported with ANOVAanalysis. These analyses allow evaluating the effect of laser treatment parameters on case depth. Thepredictive model of case depth at tip and root of spline shafts is then developed based on a linearregression method.

Coatings 2020, 10, 342 5 of 12
3. Results and Discussions
3.1. Hardness Measurement
As explained in Section 2, the hardness of heat-treated splines is measured at their cross-section todetermine the hardening profile (case depth). The grid of tests in Table 4 presents the measurement ofcase depth at tip (HT) and root (HR) of splines. The experimental tests consist of varying factors of thelaser hardening process, which can affect HT and HR. Based on the literature presented in Section 1,we selected five parameters in which the modeling factors are: laser power (P), laser beam scanningspeed (S), rotation speed of splines during laser heating process (R), flank tilt angle of splines (A),and tooth depth of splines (D). The results obtained show that the case depths are minimal in Test 2(1900 W, 4 mm/s, 2000 rpm, and 15◦) and maximal in Test 9 (2500 W, 2 mm/s, 2500 rpm, and 20◦). Thecase depth is 0.05 mm at the tip and 0.05 mm at the spline’s tooth in Test 2, while the case depth is 0.95mm at the tip and 0.45 mm at the root of the spline’s tooth in Test 9.
Table 4. Experimental test results with respect to factors variation in each test.
TestFactors Responses
P [W] S [mm/s] R [rpm] A [◦] D [mm] HT [mm] HR [mm]
1 1900 2 1500 15 2.5 0.20 0.152 1900 4 2000 15 3.0 0.05 0.053 2200 6 2500 15 3.0 0.05 0.104 2500 4 1500 15 3.5 0.20 0.205 2200 2 2000 15 3.5 0.60 0.306 2500 4 1500 15 3.0 0.25 0.207 1900 6 1500 15 3.0 0.05 0.058 1900 4 2500 15 2.5 0.05 0.059 2500 2 2500 20 3.0 0.95 0.45
10 2200 4 1500 20 2.5 0.15 0.1511 1900 6 1500 20 3.5 0.05 0.1012 1900 4 2000 20 3.0 0.05 0.1013 1900 2 1500 20 3.0 0.20 0.1514 1900 4 2500 20 3.5 0.05 0.1015 2500 6 2000 20 2.5 0.10 0.1516 2200 4 1500 20 3.0 0.15 0.15
The result of hardness curves at the tip and root of the spline’s tooth for test 5 is shown in Figure 3a.This hardness carves can be characterized by three regions. The first region demonstrates high surfacelayer hardness compared to the core hardness of the spline. This is due to a complete austenitization,as a result of high temperature (above Ac3) in the surface layer, and then a martensite transformationresulted by rapid cooling. The second region presents a hardness drop to approximately the corehardness. The temperature in this region is between Ac1 and Ac3, which results in a mixture of hardand over-tempered martensite. The third region keeps the initial hardness of the part since it is notaffected by the thermal flow. Therefore, the case depth is defined by the first region, which representsthe hardness profile of the surface layer. It is worth mentioning that the case depth of heat-treatedspline at the tip and root of the tooth is presented with red and yellow lines, respectively. The coolingmedium after austenitization of surfaces is the air at an ambient temperature (T∞ = 20 ◦C). On the onehand, the high heat flux generated by laser beam energy, applied in a localized region, transforms thesurface layer to austenite. On the other hand, AISI 4340 steel is a very good heat conductor. Thus,cooling it in the air results in self-quenching of the heated surface. The cooling rate of heated AISI 4340in the air is rapid enough to eliminate the need for external quenching for martensite transformation.

Coatings 2020, 10, 342 6 of 12
Coatings 2020, 10, x FOR PEER REVIEW 6 of 12
enough heat flux to be transformed into austenite. Yet, it is affected by the heat of a hardened surface
to which its hardness drops to the original value.
The metallographic analysis of the hardened region reveals a martensitic microstructure, which
is illustrated as a shadow layer, in Figure 3b, on the surface of the spline for test 5. The hardened layer
follows the shape of the spline’s tooth with a circular form, recalling the initial shape of the rotating
shaft. The results confirm that it is technically possible to control the case depth during the laser heat
treatment process, according to the specific requirements of the manufacturing process for
mechanical parts, such as pump motor shaft splines. The case depth at the tooth flank is not affected
by the variations of the heat treatment process parameters.
(a) (b)
Figure 3. Hardness results for laser heat treatment for test 5: (a) micro-hardness measurement [HRC]
in different depths [µm] at tip and root of spline’s tooth and (b) visualized hardness profile of a cross-
section of the spline shaft.
3.2. Statistical Analysis
In order to assess the significance of each factor in laser hardening of splines based on our
experimental tests, an ANOVA analysis is performed. These analyses are ensured using MINITAB18
statistical analysis software in which their general systematic methodology is detailed in Tables 5 and
6. For each parameter, the value of variance ratio F is compared to values of the standard F tables for
given statistical significance levels. It is concluded that the case depth is influenced to a large degree
by laser power (P), scanning speed (S), and the interactions between these factors, which were
significant for the response value of the model at a 98% confidence. The coefficient of determination
(R2), which can be interpreted as the rate of factors contributed in the estimated statistical model, is
approximately 99% for case depth at the tip of splines (HT) and 98% for case depth at the root of
splines (HR). It can also be observed that the hardness value increases with increasing laser power
and decreasing the scanning speed. This parameter combination results in higher absorption of
energy in the surface layer of splines, which increases the depth of heat-treated material and,
eventually, the case depth. It is also observed that the variation of the flank tilt angle and tooth depth
of the spline does not noticeably affect the case depth of splines.
Figure 3. Hardness results for laser heat treatment for test 5: (a) micro-hardness measurement [HRC]in different depths [µm] at tip and root of spline’s tooth and (b) visualized hardness profile of across-section of the spline shaft.
It appears that the case depth is more present at the tip than at the root of splines. This differenceis important in the case of high laser power and low scanning speed. It is interesting to note that thetransition region between the hardened layer and the layer below it had minimum hardness withrespect to the initial hardness at the surface and the depth. This transition region did not receiveenough heat flux to be transformed into austenite. Yet, it is affected by the heat of a hardened surfaceto which its hardness drops to the original value.
The metallographic analysis of the hardened region reveals a martensitic microstructure, whichis illustrated as a shadow layer, in Figure 3b, on the surface of the spline for test 5. The hardenedlayer follows the shape of the spline’s tooth with a circular form, recalling the initial shape of therotating shaft. The results confirm that it is technically possible to control the case depth during thelaser heat treatment process, according to the specific requirements of the manufacturing process formechanical parts, such as pump motor shaft splines. The case depth at the tooth flank is not affectedby the variations of the heat treatment process parameters.
3.2. Statistical Analysis
In order to assess the significance of each factor in laser hardening of splines based on ourexperimental tests, an ANOVA analysis is performed. These analyses are ensured using MINITAB18statistical analysis software in which their general systematic methodology is detailed in Tables 5 and 6.For each parameter, the value of variance ratio F is compared to values of the standard F tables forgiven statistical significance levels. It is concluded that the case depth is influenced to a large degree bylaser power (P), scanning speed (S), and the interactions between these factors, which were significantfor the response value of the model at a 98% confidence. The coefficient of determination (R2), whichcan be interpreted as the rate of factors contributed in the estimated statistical model, is approximately99% for case depth at the tip of splines (HT) and 98% for case depth at the root of splines (HR). It canalso be observed that the hardness value increases with increasing laser power and decreasing thescanning speed. This parameter combination results in higher absorption of energy in the surface layerof splines, which increases the depth of heat-treated material and, eventually, the case depth. It is alsoobserved that the variation of the flank tilt angle and tooth depth of the spline does not noticeablyaffect the case depth of splines.

Coatings 2020, 10, 342 7 of 12
Table 5. ANOVA table for case depth at the tip of the splines (HT).
Factors DoF Sum of Squares Mean Square F-Value P-Value
P 1 0.229105 0.251229 290.93 0.001S 1 0.361250 0.015161 17.56 0.004R 1 0.036946 0.009494 10.99 0.013A 1 0.003906 0.003906 4.52 0.071D 1 0.020000 0.002943 3.41 0.107S2 1 0.097656 0.097656 113.09 0.001
P × S 1 0.137336 0.138967 160.93 0.001D × S 1 0.005100 0.005100 5.91 0.045Error 7 0.006045 0.006045 – –Total 8 0.897344 – – –
Table 6. ANOVA table for case depth at the root of splines (HR).
Factors DoF Sum of Squares Mean Square F-Value P-Value
P 1 0.056378 0.045650 209.35 0.001S 1 0.045000 0.001380 6.33 0.033R 1 0.003196 0.001418 6.50 0.031A 1 0.001406 0.001406 6.45 0.032S2 1 0.012656 0.012656 58.04 0.001
P × S 1 0.020495 0.020495 93.99 0.001Error 9 0.001962 0.020495 – –Total 15 0.141094 0.001962 – –
3.3. Contribution and Effect of Process Parameters
The statistical approach allows determining the main effects of each factor separately as well as thedifferent interactions between these factors and the response variable with the same precision. It alsofacilitates analysis of the experimental data and the development of correlations between studiedfactors and the case depths. The factors’ contribution in the estimated model’s performance at the tipand root of splines’ tooth is analyzed by the ANOVA variance study. This study allows determiningthe different effects and the contribution of each factor in the final response. The contribution of eachprocess parameter (P, S, R, A, and D) with a significant interaction between some parameters on themodel’s final response are presented in Table 7. The results of ANOVA analysis confirm that laserpower (P) and scanning speed (S) contribute significantly to the final response of the case depth. It isalso observed that rotation speed (R), flank tilt angle of the spline tooth (A), and tooth depth (D)have a small influence on the results in which their contributions are, respectively, of the order ofapproximately 4%, 1%, and 2%. This is due to their small variation in the process parameters. Theoverall error of the statistical model is less than 2%.
Table 7. Parameters contributions as a percentage [%] in the case depth of splines.
Parameters HT [%] HR [%]
P 25.53 39.96S 40.26 31.89R 4.12 2.27A 0.44 1.00D 2.23 0.00S2 10.88 8.97
P × S 15.30 14.53D × S 0.57 0.00Error 0.67 1.39

Coatings 2020, 10, 342 8 of 12
The graphical representation of the main effects of all parameters on the case depth (in µm) attip (HT) and root (HR) of splines are shown, respectively, in Figures 4 and 5. The results illustratethe qualitative contribution of different factors to the variation of HT and HR and offer informationon the nature of their relationship. The steep variation of case depth with respect to laser power (P)and scanning speed (S) confirms that these factors contribute the most in the final response, which isconsistent with the results provided by ANOVA analysis. These results illustrate that the case depthsat the tip and root of splines increase as laser power (P), rotation speed (R), flank tilt angle (A), andtooth depth (D) increase. Furthermore, the case depths at the tip and root of splines decrease as thescanning speed (S) decreases.
Coatings 2020, 10, x FOR PEER REVIEW 8 of 12
The graphical representation of the main effects of all parameters on the case depth (in µm) at
tip (HT) and root (HR) of splines are shown, respectively, in Figures 4 and 5. The results illustrate the
qualitative contribution of different factors to the variation of HT and HR and offer information on the
nature of their relationship. The steep variation of case depth with respect to laser power (P) and
scanning speed (S) confirms that these factors contribute the most in the final response, which is
consistent with the results provided by ANOVA analysis. These results illustrate that the case depths
at the tip and root of splines increase as laser power (P), rotation speed (R), flank tilt angle (A), and
tooth depth (D) increase. Furthermore, the case depths at the tip and root of splines decrease as the
scanning speed (S) decreases.
Figure 4. Effects of process parameters on the case depth at the tip of the spline’s tooth (HT). The unit
of parameters are laser power (P) in [W] scanning speed (S) in [mm/s], rotational speed (R) in [rpm],
flank tilt angle (A) in degrees, and tooth depth (D) in [mm].
Figure 5. Effects of process parameters on the case depth at the root of spline’s tooth (HR), the unit of
parameters are laser power (P) in [W] scanning speed (S) in [mm/s], rotational speed (R) in [rpm],
flank tilt angle (A) in degrees, and tooth depth (D) in [mm].
To estimate the case depths at tip (HT) and root (HR) as a function of laser power (P), scanning
speed (S), rotation speed (R), flank tilt angle (A), and tooth depth (D), a linear regression technique is
used to determine the adequate coefficients in a polynomial function. After eliminating non-
significant terms, the empirical estimated relationships of case depth at tip (HT) and root (HR) of a
tooth can be expressed according to the following equations.
HT = -3.122 + 0.001717P + 0.3953S + 0.000065R + 0.00625A + 0.1373D + 0.03906S2 - 0.000319(P × S) - 0.0452(S × D) (1)
HR = -0.981 + 0.000649P + 0.0680S + 0.000023R + 0.00375A + 0.01406S2 - 0.000103(P × S) (2)
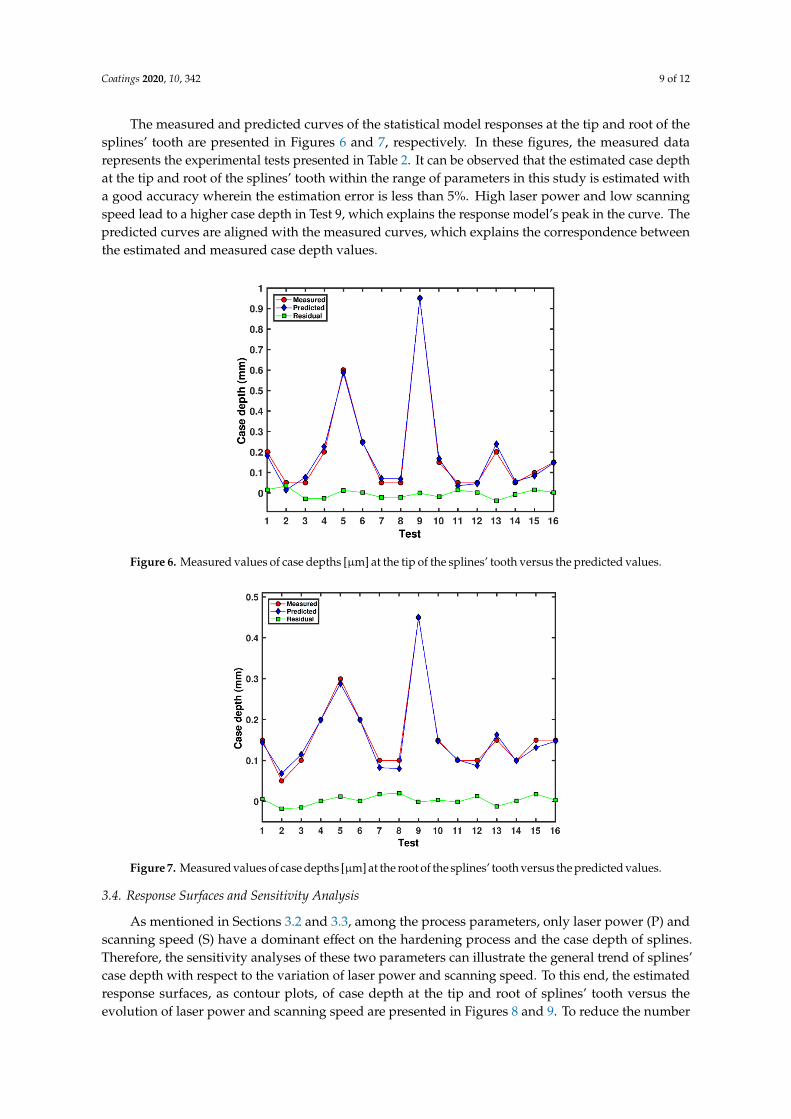
The measured and predicted curves of the statistical model responses at the tip and root of the
splines’ tooth are presented in Figures 6 and 7, respectively. In these figures, the measured data
represents the experimental tests presented in Table 2. It can be observed that the estimated case
Figure 4. Effects of process parameters on the case depth at the tip of the spline’s tooth (HT). The unitof parameters are laser power (P) in [W] scanning speed (S) in [mm/s], rotational speed (R) in [rpm],flank tilt angle (A) in degrees, and tooth depth (D) in [mm].
Coatings 2020, 10, x FOR PEER REVIEW 8 of 12
The graphical representation of the main effects of all parameters on the case depth (in µm) at
tip (HT) and root (HR) of splines are shown, respectively, in Figures 4 and 5. The results illustrate the
qualitative contribution of different factors to the variation of HT and HR and offer information on the
nature of their relationship. The steep variation of case depth with respect to laser power (P) and
scanning speed (S) confirms that these factors contribute the most in the final response, which is
consistent with the results provided by ANOVA analysis. These results illustrate that the case depths
at the tip and root of splines increase as laser power (P), rotation speed (R), flank tilt angle (A), and
tooth depth (D) increase. Furthermore, the case depths at the tip and root of splines decrease as the
scanning speed (S) decreases.
Figure 4. Effects of process parameters on the case depth at the tip of the spline’s tooth (HT). The unit
of parameters are laser power (P) in [W] scanning speed (S) in [mm/s], rotational speed (R) in [rpm],
flank tilt angle (A) in degrees, and tooth depth (D) in [mm].
Figure 5. Effects of process parameters on the case depth at the root of spline’s tooth (HR), the unit of
parameters are laser power (P) in [W] scanning speed (S) in [mm/s], rotational speed (R) in [rpm],
flank tilt angle (A) in degrees, and tooth depth (D) in [mm].
To estimate the case depths at tip (HT) and root (HR) as a function of laser power (P), scanning
speed (S), rotation speed (R), flank tilt angle (A), and tooth depth (D), a linear regression technique is
used to determine the adequate coefficients in a polynomial function. After eliminating non-
significant terms, the empirical estimated relationships of case depth at tip (HT) and root (HR) of a
tooth can be expressed according to the following equations.
HT = -3.122 + 0.001717P + 0.3953S + 0.000065R + 0.00625A + 0.1373D + 0.03906S2 - 0.000319(P × S) - 0.0452(S × D) (1)
HR = -0.981 + 0.000649P + 0.0680S + 0.000023R + 0.00375A + 0.01406S2 - 0.000103(P × S) (2)
The measured and predicted curves of the statistical model responses at the tip and root of the
splines’ tooth are presented in Figures 6 and 7, respectively. In these figures, the measured data
represents the experimental tests presented in Table 2. It can be observed that the estimated case
Figure 5. Effects of process parameters on the case depth at the root of spline’s tooth (HR), the unit ofparameters are laser power (P) in [W] scanning speed (S) in [mm/s], rotational speed (R) in [rpm], flanktilt angle (A) in degrees, and tooth depth (D) in [mm].
To estimate the case depths at tip (HT) and root (HR) as a function of laser power (P), scanningspeed (S), rotation speed (R), flank tilt angle (A), and tooth depth (D), a linear regression technique isused to determine the adequate coefficients in a polynomial function. After eliminating non-significantterms, the empirical estimated relationships of case depth at tip (HT) and root (HR) of a tooth can beexpressed according to the following equations.
HT= −3.122 + 0.001717P + 0.3953S + 0.000065R + 0.00625A + 0.1373D+0.03906S2− 0.000319(P × S) − 0.0452(S × D) (1)
HR= −0.981 + 0.000649P + 0.0680S + 0.000023R + 0.00375A+0.01406S2− 0.000103(P × S) (2)
Coatings 2020, 10, 342 9 of 12
The measured and predicted curves of the statistical model responses at the tip and root of thesplines’ tooth are presented in Figures 6 and 7, respectively. In these figures, the measured datarepresents the experimental tests presented in Table 2. It can be observed that the estimated case depthat the tip and root of the splines’ tooth within the range of parameters in this study is estimated witha good accuracy wherein the estimation error is less than 5%. High laser power and low scanningspeed lead to a higher case depth in Test 9, which explains the response model’s peak in the curve. Thepredicted curves are aligned with the measured curves, which explains the correspondence betweenthe estimated and measured case depth values.
Coatings 2020, 10, x FOR PEER REVIEW 9 of 12
depth at the tip and root of the splines’ tooth within the range of parameters in this study is estimated
with a good accuracy wherein the estimation error is less than 5%. High laser power and low scanning
speed lead to a higher case depth in Test 9, which explains the response model’s peak in the curve.
The predicted curves are aligned with the measured curves, which explains the correspondence
between the estimated and measured case depth values.
Figure 6. Measured values of case depths [µm] at the tip of the splines’ tooth versus the predicted
values.
Figure 7. Measured values of case depths [µm] at the root of the splines’ tooth versus the predicted
values.
3.4. Response Surfaces and Sensitivity Analysis
As mentioned in Section 3.2 and 3.3, among the process parameters, only laser power (P) and
scanning speed (S) have a dominant effect on the hardening process and the case depth of splines.
Therefore, the sensitivity analyses of these two parameters can illustrate the general trend of splines’
case depth with respect to the variation of laser power and scanning speed. To this end, the estimated
response surfaces, as contour plots, of case depth at the tip and root of splines’ tooth versus the
evolution of laser power and scanning speed are presented in Figures 8 and 9. To reduce the number
of statistical response surfaces, only the mean value of rotation speed (R = 1875 rpm) and tooth depth
of spline (D = 3 mm) is taken into consideration as a constant parameter in the contour plots. The
effect of tooth depth variation on the case depth at the root of a spline’s tooth is negligible. Therefore,
this parameter is not taken into consideration in the contour plot of case depth at the root (HT). In the
Figure 6. Measured values of case depths [µm] at the tip of the splines’ tooth versus the predicted values.
Coatings 2020, 10, x FOR PEER REVIEW 9 of 12
depth at the tip and root of the splines’ tooth within the range of parameters in this study is estimated
with a good accuracy wherein the estimation error is less than 5%. High laser power and low scanning
speed lead to a higher case depth in Test 9, which explains the response model’s peak in the curve.
The predicted curves are aligned with the measured curves, which explains the correspondence
between the estimated and measured case depth values.
Figure 6. Measured values of case depths [µm] at the tip of the splines’ tooth versus the predicted
values.
Figure 7. Measured values of case depths [µm] at the root of the splines’ tooth versus the predicted
values.
3.4. Response Surfaces and Sensitivity Analysis
As mentioned in Section 3.2 and 3.3, among the process parameters, only laser power (P) and
scanning speed (S) have a dominant effect on the hardening process and the case depth of splines.
Therefore, the sensitivity analyses of these two parameters can illustrate the general trend of splines’
case depth with respect to the variation of laser power and scanning speed. To this end, the estimated
response surfaces, as contour plots, of case depth at the tip and root of splines’ tooth versus the
evolution of laser power and scanning speed are presented in Figures 8 and 9. To reduce the number
of statistical response surfaces, only the mean value of rotation speed (R = 1875 rpm) and tooth depth
of spline (D = 3 mm) is taken into consideration as a constant parameter in the contour plots. The
effect of tooth depth variation on the case depth at the root of a spline’s tooth is negligible. Therefore,
this parameter is not taken into consideration in the contour plot of case depth at the root (HT). In the
Figure 7. Measured values of case depths [µm] at the root of the splines’ tooth versus the predicted values.
3.4. Response Surfaces and Sensitivity Analysis
As mentioned in Sections 3.2 and 3.3, among the process parameters, only laser power (P) andscanning speed (S) have a dominant effect on the hardening process and the case depth of splines.Therefore, the sensitivity analyses of these two parameters can illustrate the general trend of splines’case depth with respect to the variation of laser power and scanning speed. To this end, the estimatedresponse surfaces, as contour plots, of case depth at the tip and root of splines’ tooth versus theevolution of laser power and scanning speed are presented in Figures 8 and 9. To reduce the number

Coatings 2020, 10, 342 10 of 12
of statistical response surfaces, only the mean value of rotation speed (R = 1875 rpm) and tooth depthof spline (D = 3 mm) is taken into consideration as a constant parameter in the contour plots. Theeffect of tooth depth variation on the case depth at the root of a spline’s tooth is negligible. Therefore,this parameter is not taken into consideration in the contour plot of case depth at the root (HT). In thecase of the flank tilt angle of splines (A), which is the last parameter of the process, both angles (15◦
and 20◦) are separately taken into consideration in the contour plots of case depth at the tip and root ofthe splines. The contour plots of case depth at the tip and root with a flank tilt of 15◦ are presented inFigure 8, and those with a flank tilt of 20◦ are presented in Figure 9. These figures show the effects ofthe laser process parameters (P, S, and R) and geometrical factors (A and D) on the case depth of splines.In these figures, the unity of the independent variables and parameters are presented as follows: thecase depth in [mm], laser power in [W], scanning speed in [mm/s], and rotational speed in [rpm].
Coatings 2020, 10, x FOR PEER REVIEW 10 of 12
case of the flank tilt angle of splines (A), which is the last parameter of the process, both angles (15°
and 20°) are separately taken into consideration in the contour plots of case depth at the tip and root
of the splines. The contour plots of case depth at the tip and root with a flank tilt of 15° are presented
in Figure 8, and those with a flank tilt of 20° are presented in Figure 9. These figures show the effects
of the laser process parameters (P, S, and R) and geometrical factors (A and D) on the case depth of
splines. In these figures, the unity of the independent variables and parameters are presented as
follows: the case depth in [mm], laser power in [W], scanning speed in [mm/s], and rotational speed
in [rpm].
It can be observed in Figures 8 and 9 that the case depth at the tip and root of splines reacts
directly with laser power (P) and inversely with scanning speed (S). In other words, increasing the
laser power and decreasing the scanning speed results in increasing the case depth regardless of the
tilt angle of the splines’ tooth (15° or 20°). The higher case depth is generally obtained at the tip and
root of the splines’ tooth corresponding to the flank tilt angle of 20°, which is a very representative
fact since the surface of the splines’ tooth can be exposed better to a laser beam where the flank tilt
angle is 20° when compared to 15°.
(a) (b)
Figure 8. Contour plot of case depth [mm] versus power, scanning speed and rotation speed (1875 rpm)
for the flank tilt angle of 15°: (a) at the tip of splines’ tooth (HT), (b) at the root of splines’ tooth (HR).
(a) (b)
Figure 9. Contour plot of case depth [mm] versus power, scanning speed, and rotation speed (1875 rpm)
for the flank tilt angle of 20°: (a) at the tip of splines’ tooth (HT), (b) at the root of splines’ tooth (HR).
4. Conclusions
Figure 8. Contour plot of case depth [mm] versus power, scanning speed and rotation speed (1875 rpm)for the flank tilt angle of 15◦: (a) at the tip of splines’ tooth (HT), (b) at the root of splines’ tooth (HR).
Coatings 2020, 10, x FOR PEER REVIEW 10 of 12
case of the flank tilt angle of splines (A), which is the last parameter of the process, both angles (15°
and 20°) are separately taken into consideration in the contour plots of case depth at the tip and root
of the splines. The contour plots of case depth at the tip and root with a flank tilt of 15° are presented
in Figure 8, and those with a flank tilt of 20° are presented in Figure 9. These figures show the effects
of the laser process parameters (P, S, and R) and geometrical factors (A and D) on the case depth of
splines. In these figures, the unity of the independent variables and parameters are presented as
follows: the case depth in [mm], laser power in [W], scanning speed in [mm/s], and rotational speed
in [rpm].
It can be observed in Figures 8 and 9 that the case depth at the tip and root of splines reacts
directly with laser power (P) and inversely with scanning speed (S). In other words, increasing the
laser power and decreasing the scanning speed results in increasing the case depth regardless of the
tilt angle of the splines’ tooth (15° or 20°). The higher case depth is generally obtained at the tip and
root of the splines’ tooth corresponding to the flank tilt angle of 20°, which is a very representative
fact since the surface of the splines’ tooth can be exposed better to a laser beam where the flank tilt
angle is 20° when compared to 15°.
(a) (b)
Figure 8. Contour plot of case depth [mm] versus power, scanning speed and rotation speed (1875 rpm)
for the flank tilt angle of 15°: (a) at the tip of splines’ tooth (HT), (b) at the root of splines’ tooth (HR).
(a) (b)
Figure 9. Contour plot of case depth [mm] versus power, scanning speed, and rotation speed (1875 rpm)
for the flank tilt angle of 20°: (a) at the tip of splines’ tooth (HT), (b) at the root of splines’ tooth (HR).
4. Conclusions
Figure 9. Contour plot of case depth [mm] versus power, scanning speed, and rotation speed (1875 rpm)for the flank tilt angle of 20◦: (a) at the tip of splines’ tooth (HT), (b) at the root of splines’ tooth (HR).
It can be observed in Figures 8 and 9 that the case depth at the tip and root of splines reacts directlywith laser power (P) and inversely with scanning speed (S). In other words, increasing the laser powerand decreasing the scanning speed results in increasing the case depth regardless of the tilt angle of thesplines’ tooth (15◦ or 20◦). The higher case depth is generally obtained at the tip and root of the splines’

Coatings 2020, 10, 342 11 of 12
tooth corresponding to the flank tilt angle of 20◦, which is a very representative fact since the surface ofthe splines’ tooth can be exposed better to a laser beam where the flank tilt angle is 20◦ when comparedto 15◦.
4. Conclusions
The effect of different parameters in a laser hardening process on the case depth of AISI 4340steel splined shafts is studied in this article. Laser hardening is a heat treatment process that allowsmicrostructural transformation on the surface layer of steel. This microstructural transformationgenerates martensite on the surface layer of AISI 4340 splines, which increases their surface hardness.This process, which is also known as case hardening, results in a hard and wear-resistant surface whilemaintaining a soft and ductile core. The study is based on developing experimental tests by varyingthe hardening process parameters as well as the geometry of splines. These tests are then analyzedusing statistical approaches to define the effectiveness of each parameter on the case depth at the tipand root of splines’ tooth.
The influence of laser power, scanning speed, tooth depth, and flank tilt angle on the laserhardening process of spline shafts with different dimensions are studied and analyzed in this study.Performing experimental tests wherein test parameters are systematically varied and then usingANOVA analysis demonstrate that the case depth is mainly affected by the factors of laser power andscanning speed. These factors contribute to approximately 70% of case depth variability at the tip androot of splines’ tooth. In addition, a statistically estimated model of case depth at the tip and rootof splines is proposed based on correlations between case depths and laser power, scanning speed,rotation speed, flank tilt angle, and tooth depth. These correlations estimate the case depth of splineswith an accuracy in which the mean square error is less than 5%. The obtained results can be used toplan the modeling process and be served as a development guideline based on case depth predictionsfor AISI 4340 steel splines with studied geometries.
Even if the validation results of these predicted models are promising, they can be improved byperforming additional tests outside the variation range of parameters presented in this study. Thisensures the validation of our predictive models on a larger range of parameter variation. Applying anartificial neural network based on the results of these tests can also improve the estimation of predictivemodels. Lastly, a statistical approach based on validation and verification methods can be applied toevaluate quantitatively the precision of predictive models.
Author Contributions: Conceptualization, N.B.; methodology, N.B., S.S.K. and R.F.; software, R.F, P.T. and V.B.F.K.;validation, S.S.K. and N.B.; formal analysis, N.B., S.S.K. and R.F.; investigation, S.S.K.; resources, R.F., P.T. andV.B.F.K.; data curation, R.F., P.T. and V.B.F.K.; writing—original draft preparation, R.F. and S.S.K.; writing—reviewand editing, S.S.K. and N.B.; visualization, R.F., S.S.K. and N.B.; supervision, N.B.; project administration, N.B.;funding acquisition, N.B. All authors have read and agreed to the published version of the manuscript.
Funding: This research received no external funding.
Conflicts of Interest: The authors declare no conflict of interest.
References
1. Zhang, T.; Li, L.; Liang, F.; Yang, B. Parameter optimization of laser die-surface hardening using the particleswarm optimization technique. Int. J. Adv. Manuf. Technol. 2008, 36, 1104–1112. [CrossRef]
2. Sun, P.; Li, S.; Yu, G.; He, X.; Zheng, C.; Ning, W. Laser surface hardening of 42CrMo cast steel for obtaining awide and uniform hardened layer by shaped beams. Int. J. Adv. Manuf. Technol. 2014, 70, 787–796. [CrossRef]
3. Yilbas, B.S.; Akhtar, S.S.; Keles, O. Laser cutting of small diameter hole in aluminum foam. Int. J. Adv. Manuf.Technol. 2015, 79, 101–111. [CrossRef]
4. Alvarenga, H.D.; van de Putte, T.; van Steenberge, N.; Sietsma, J.; Terryn, H. Influence of carbide morphologyand microstructure on the kinetics of superficial decarburization of C-Mn steels. Metall. Mater. Trans. A 2015,46, 123–133. [CrossRef]

Coatings 2020, 10, 342 12 of 12
5. Fakir, R.; Barka, N.; Brousseau, J. Case study of laser hardening process applied to 4340 steel cylindricalspecimens using simulation and experimental validation. Case Stud. Therm. Eng. 2018, 11, 15–25. [CrossRef]
6. Erdem, M.; Altug, M.; Karabulut, M. Investigation of mechanical, microstructural, and machining propertiesof AISI 420 martensitic stainless steel welded by laser welding. Int. J. Adv. Manuf. Technol. 2016, 85, 481–492.[CrossRef]
7. Barka, N.; Bocher, P.; Brousseau, J. Sensitivity study of hardness profile of 4340 specimen heated by inductionprocess using axisymmetric modeling. Int. J. Adv. Manuf. Technol. 2013, 69, 2747–2756. [CrossRef]
8. Safeen, W.; Hussain, S.; Wasim, A.; Jahanzaib, M.; Aziz, H.; Abdalla, H. Predicting the tensile strength,impact toughness, and hardness of friction stir-welded AA6061-T6 using response surface methodology. Int.J. Adv. Manuf. Technol. 2016, 87, 1765–1781. [CrossRef]
9. Fakir, R.; Barka, N.; Brousseau, J. Servo-control applied to the parameters of the laser hardening process for aregular case depth of 4340 steel cylindrical specimen. J. Comput. Inf. Sci. Eng. 2019, 19, 031007. [CrossRef]
10. Nassef, G.A.; Elkhatib, A.; Yakout, M. Analysis of a failed rocker arm shaft of a passenger car engine. CaseStud. Eng. Fail. Anal. 2016, 5, 10–14. [CrossRef]
11. Rafi, H.K.; Starr, T.L.; Stucker, B.E. A comparison of the tensile, fatigue, and fracture behavior of Ti–6Al–4Vand 15-5 PH stainless steel parts made by selective laser melting. Int. J. Adv. Manuf. Technol. 2013, 69,1299–1309. [CrossRef]
12. Fakir, R.; Barka, N.; Brousseau, J.; Caron-Guillemette, G. Analysis of the mechanical behavior of AISI 4340steel cylindrical specimens heat treated with fiber laser. J. Manuf. Process. 2020, in press.
13. Prime, M.B.; Sebring, R.J.; Edwards, J.M.; Hughes, D.J.; Webster, P.J. Laser surface-contouring and splinedata-smoothing for residual stress measurement. Exp. Mech. 2004, 44, 176–184. [CrossRef]
14. Sun, Y.; Hao, M. Statistical analysis and optimization of process parameters in Ti6Al4V laser cladding usingNd: YAG laser. Opt. Lasers Eng. 2012, 50, 985–995. [CrossRef]
15. Lambiase, F.; di Ilio, A.M.; Paoletti, A. Prediction of laser hardening by means of neural network. ProcediaCIRP 2013, 12, 181–186. [CrossRef]
16. Bailey, N.S.; Shin, Y.C. Optimization of laser hardening processes for industrial parts with complex geometryvia predictive modeling. In Proceedings of the ASME 2009 International Manufacturing Science andEngineering Conference, West Lafayette, IN, USA, 4–7 October 2009; pp. 647–656.
17. Babu, P.D.; Buvanashekaran, G.; Balasubramanian, K.R. Experimental studies on the microstructure andhardness of laser transformation hardening of low alloy steel. Trans. Can. Soc. Mech. Eng. 2012, 36, 241–258.[CrossRef]
18. Lusquinos, F.; Conde, J.C.; Bonss, S.; Riveiro, A.; Quintero, F.; Comesaña, R.; Pou, J. Theoretical andexperimental analysis of high power diode laser (HPDL) hardening of AISI 1045 steel. Appl. Surf. Sci. 2007,254, 948–954. [CrossRef]
19. Crawley, M.J. Statistical Computing: An Introduction to Data Analysis Using S-Plus; Wiley: Chichester, UK, 2002.20. Babu, P.D.; Buvanashekaran, G.; Balasubramanian, K.R. Experimental investigation of laser transformation
hardening of low alloy steel using response surface methodology. Int. J. Adv. Manuf. Technol. 2013, 67,1883–1897. [CrossRef]
21. Barka, N.; El Ouafi, A. Effects of Laser Hardening Process Parameters on Case Depth of 4340 Steel CylindricalSpecimen—A Statistical Analysis. J. Surf. Eng. Mater. Adv. Technol. 2015, 5, 124. [CrossRef]
22. Giorleo, L.; Previtali, B.; Semeraro, Q. Modelling of back tempering in laser hardening. Int. J. Adv. Manuf.Technol. 2011, 54, 969–977. [CrossRef]
23. Basilevsky, A.T. Statistical Factor Analysis and Related Methods: Theory and Applications; John Wiley & Sons:Hoboken, NJ, USA, 2009; Volume 418.
24. Loh, N.H.; Tam, S.C.; Miyazawa, S. Statistical analyses of the effects of ball burnishing parameters on surfacehardness. Wear 1989, 129, 235–243. [CrossRef]
25. Myers, R.H.; Montgomery, D.C.; Anderson-Cook, C.M. Response Surface Methodology: Process and ProductOptimization Using Designed Experiments; John Wiley & Sons: Hoboken, NJ, USA, 2016.
© 2020 by the authors. Licensee MDPI, Basel, Switzerland. This article is an open accessarticle distributed under the terms and conditions of the Creative Commons Attribution(CC BY) license (http://creativecommons.org/licenses/by/4.0/).
Copyright © 2022 FDOKUMEN