SEARCHING FOR THE OPTIMAL
11
SEARCHING FOR THE OPTIMAL HEAP LEACH APPLICATION RATE Orlando Bernal Crush Leach Superintendent Sociedad Minera Cerro Verde S.A.A. [email protected] Guillermo Velarde Senior Metallurgist Sociedad Minera Cerro Verde S.A.A. [email protected] ABSTRACT Sociedad Minera Cerro Verde S.A.A, a subsidiary of Phelps Dodge Mining Company, operates a copper mining facility located in southern Peru. The mine for leach operation produces 90,000 mtpy of copper cathode from secondary sulfide ore utilizing crushing, leaching, solvent extraction and electrowinning processes. Over the years, the leach solution handling and application rates have undergone constant development. This paper discusses the achievements in leach application design to (1) satisfy the needs of the “lixiviant request rate”, which requires the use of application rates as low as 3.5 l/h-m2 and as high as 15 l/h-m2 with variable rest periods according to the leach kinetics, and (2) alleviate poor solution distribution on the surface of the leach heaps inherent to drip emitters. On one hand, too low, early application rates result in poor surface solution distribution and the formation of upside down cones of dry, non-leached material in the top meter of stacked ore, with heavy jarosite and iron salt precipitation; moreover, ferric iron is lost as insoluble precipitates. On the other hand, high unit flows associated with poor agglomerate quality can lead to uneven solution flow patterns within the heap leading to solution short-circuits, fines migration, and ponding with adverse effects on acid consumption and recovery.
Transcript of SEARCHING FOR THE OPTIMAL

SEARCHING FOR THE OPTIMAL
HEAP LEACH APPLICATION RATE
Orlando Bernal
Crush Leach Superintendent
Sociedad Minera Cerro Verde S.A.A.
Guillermo Velarde
Senior Metallurgist
Sociedad Minera Cerro Verde S.A.A.
ABSTRACT
Sociedad Minera Cerro Verde S.A.A, a subsidiary of Phelps Dodge Mining
Company, operates a copper mining facility located in southern Peru. The mine for leach
operation produces 90,000 mtpy of copper cathode from secondary sulfide ore utilizing
crushing, leaching, solvent extraction and electrowinning processes.
Over the years, the leach solution handling and application rates have undergone
constant development. This paper discusses the achievements in leach application design
to (1) satisfy the needs of the “lixiviant request rate”, which requires the use of
application rates as low as 3.5 l/h-m2 and as high as 15 l/h-m2 with variable rest periods
according to the leach kinetics, and (2) alleviate poor solution distribution on the surface
of the leach heaps inherent to drip emitters.
On one hand, too low, early application rates result in poor surface solution
distribution and the formation of upside down cones of dry, non-leached material in the
top meter of stacked ore, with heavy jarosite and iron salt precipitation; moreover, ferric
iron is lost as insoluble precipitates.
On the other hand, high unit flows associated with poor agglomerate quality can
lead to uneven solution flow patterns within the heap leading to solution short-circuits,
fines migration, and ponding with adverse effects on acid consumption and recovery.

INTRODUCTION
Cerro Verde, located in southwestern Peru, began its leach, solvent extraction and
electro-winning (LX/SX/EW) operation under Minero Peru in April 1977 producing at a
rate of 33 000 metric tonnes per year of high purity copper cathodes. The copper was
extracted using leach pads to leach copper oxide ore, principally chrysocolla and
bronchantite. The material was crushed to a size of two-inches then truck dumped onto
asphalt-lined pads where solution was applied with wigglers.
In the early 1980’s the oxide ore reserve was exhausted and the mining operation
began to exploit secondary sulfide ore. Cyprus Amax acquired majority of shares (82%)
the mine in 1994 during a national privatization process and undertook a leach process
improvement project with the aim of producing 48,000 mtpy of cathodes. The initial
project goals were quickly surpassed and continued improvements over the past seven
years enabled production to reach the current level of 90,000 mtpy. In 1999 Phelps
Dodge acquired Cyprus along with its participation in Cerro Verde.
Early on, in the 1970’s, copper heap leaching utilized wigglers and wobblers for
solution application. In the 1980´s some of the leach operations began to use drippers as
the irrigation systems improved, Cerro Verde adopted dripper technology in the 1990’s.
Improvements to these systems were made with hydraulic changes in the irrigation
designs (main pipes & grid irrigation) to obtain as uniform and constant flows as possible
and which were not sensitive to pressure variations. These changes were the result of a
team effort which investigated:
The Main Irrigation Pipes Redesign & Development.
Implementations of pressure regulating valves, gauges.
Use of different types and sizes of drippers
Use of new irrigation grids that reduce or eliminate the formation of cones within
whose limits (between borders) precipitation / lost of ferric iron takes place as a result
of the droplet incipient irrigation that characterizes dripper flow.
Size and drip emitter types varied from 8,0 to 2,2 liters per hour. The current
design is 1,0 liters per hour including a mini wobblers grid that operate between 0,08 to
0,14 l/s, with the purpose of eliminating the formation of cones from to the droplet flow.
The diameters of drip lines varied from 12 mm to 20 mm and finally settling on a
diameter of 16 mm.
HEAP LEACHING TECHNOLOGY
It is well-known that an initial guideline for leaching solution application is the
solution flow applied to a given area of the leaching module (L/h/m2) commonly
denominated "Flow Rate." In 1995, Cerro Verde, the flow rate design parameter for the
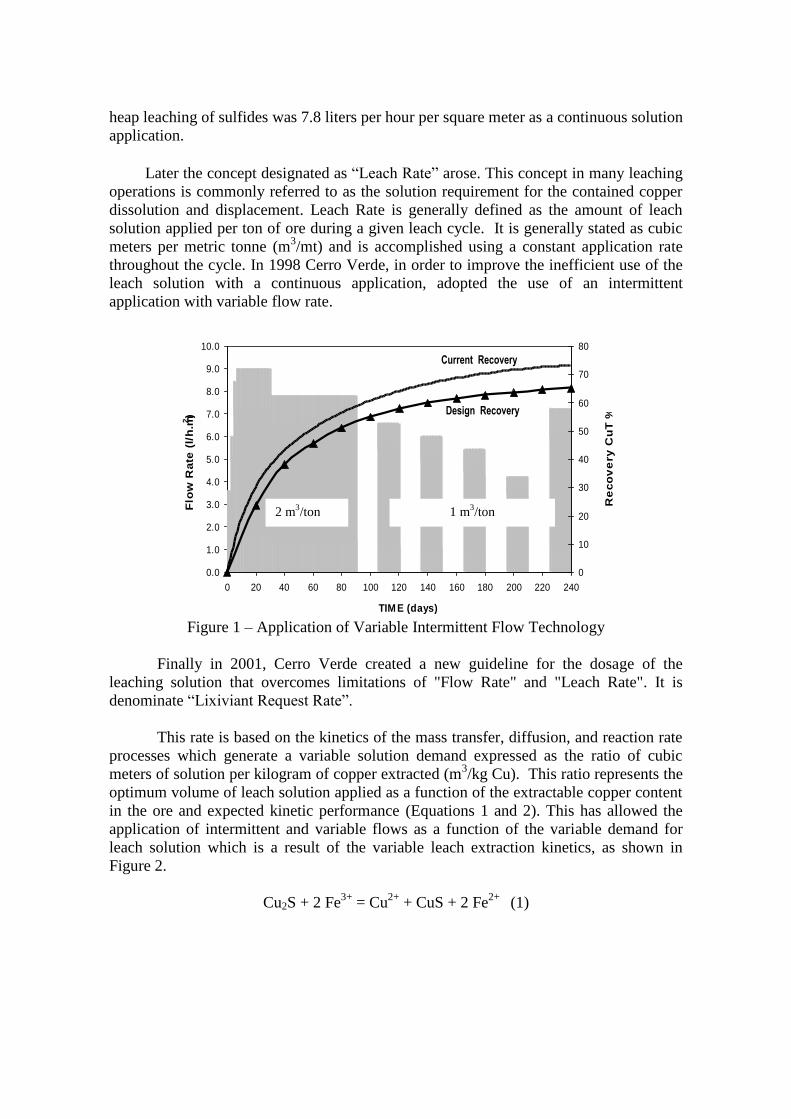
heap leaching of sulfides was 7.8 liters per hour per square meter as a continuous solution
application.
Later the concept designated as “Leach Rate” arose. This concept in many leaching
operations is commonly referred to as the solution requirement for the contained copper
dissolution and displacement. Leach Rate is generally defined as the amount of leach
solution applied per ton of ore during a given leach cycle. It is generally stated as cubic
meters per metric tonne (m3/mt) and is accomplished using a constant application rate
throughout the cycle. In 1998 Cerro Verde, in order to improve the inefficient use of the
leach solution with a continuous application, adopted the use of an intermittent
application with variable flow rate.
Figure 1 – Application of Variable Intermittent Flow Technology
Finally in 2001, Cerro Verde created a new guideline for the dosage of the
leaching solution that overcomes limitations of "Flow Rate" and "Leach Rate". It is
denominate “Lixiviant Request Rate”.
This rate is based on the kinetics of the mass transfer, diffusion, and reaction rate
processes which generate a variable solution demand expressed as the ratio of cubic
meters of solution per kilogram of copper extracted (m3/kg Cu). This ratio represents the
optimum volume of leach solution applied as a function of the extractable copper content
in the ore and expected kinetic performance (Equations 1 and 2). This has allowed the
application of intermittent and variable flows as a function of the variable demand for
leach solution which is a result of the variable leach extraction kinetics, as shown in
Figure 2.
Cu2S + 2 Fe3+
= Cu2+
+ CuS + 2 Fe2+
(1)
0.0
1.0
2.0
3.0
4.0
5.0
6.0
7.0
8.0
9.0
10.0
0 20 40 60 80 100 120 140 160 180 200 220 240
TIM E (days)
Flo
w R
ate
(l/
h.m
2)
0
10
20
30
40
50
60
70
80
Re
co
ve
ry C
uT
%
Current Recovery
Design Recovery
2 m3/ton 1 m
3/ton

CuS + 2 Fe3+
= Cu2+
+ 2 Fe2+
+ So
(2)
0
5
10
15
20
25
30
35
40
0 20 40 60 80 100 120 140 160 180 200 220 240 260 280
Time (Days)
l/h.m
2
Theoretical Flow Rate Industrial Flow Rate
Figure 2 – Request Leach Rate Model Application
HANDLING SOLUTION DEVELOPMENT
Managing leach solution application to provide uniform wetting is undoubtedly
an important part of leaching. The solution to this problem required a team effort to
design the handling solution main pipes, drip line grid, install pressure regulating valves,
install pressure gauges, pressure compensation manifolds - flashing system, test various
types of drippers and drip lines, and ultimately install mini wobblers into the grid.
Development Irrigation Grid Design
The great lack of uniformity in the irrigation and the highly variable recoveries
obtained in the first lift of the Cerro Verde permanent pad led to the a revision of the
initial hydraulic design of the irrigation pipes as shown in Figure 3. Evidently there was
an inadequate design of the location of the main pipes in the irrigation unit (module) that
left areas without irrigation. This revision also identified that the dripper size of 8 liters
per hour in the grid of 0,80 x 0,80 was not compatible with the application rate of 7,8
L/h/m2, in fact it was closer to a rate of 12 L/h/m2 for which the main pipes were not
adequate.. This was also the reason the flow was low in the last drippers on the drip line
and the flow was higher in the first drippers. In order to correct this, in the last leach
modules of the 3rd
Lift, the dripper size was changed to 4 liters per hour. Both flow
conditions were corrected with a new design (the second) shown on Table 1.
Additionally this revision identified that the initial pipe design, failed to consider
the negative effect of the slope which works against the drip lines. This was corrected
utilizing a third design. (Table I).
CuT: 0, 79 %
Height: 7, 20 m Ratio: 0, 863
Request: 0, 45 m3/ kg Cu

2
m8
2 m
84
m
ZONE 1 ZONE 2 ZONE 3
4" 4" 4"
6" 6"
80 m 80 m 80 m
8"
Distance between lines: 0.80 m
Distance between drippers: 0.80 m
Drippers: 8 LPH
Area without rinse Area without rinse Area without rinse
Figure 3 - Leach Module Main Pipes & Drip lines - Project Design
In the fourth design (Table I) an important change was made in the drip line
diameter from 16 mm to 20 mm while decreasing the size of drippers to 2,2 liters per
hour since the main pipes were relocated to one side of the module requiring less
accessories. The installation of pressure compensation manifolds in the drip lines,
flushing systems and pressure gauges in the main pipes and in the drip lines improved the
handling of the pressures and achieved of application rates with irrigation uniformity
over 90%.
8
4 m
ZONE 1 ZONE 2
80 m 80 m
4" 2" 4" 3"
6"
8"
4" 4" 3" 2"2"3"
Distance between lines: 0.40 m
Distance between drippers: 0.40 m
Nominal Flow Rate: 1 LPH
24 PSI24 PSI
Slope 0.5 - 1.5 %
Slope: 2 - 3 %
6" 4"
2"3"
6"4"
23 PSI
Figure 4 - Leach Module Main Pipes & Drip lines - Sixth Design

While maintaining the same diameter of main pipes header pipes, the area of the
leach module was reduced increasing the irrigation uniformity to 95%. This modification
was carried out in 2004 and is the sixth design that is shown in Figure 4. Additionally it
incorporated double pressure compensation manifolds - flushing system, drip lines of 16
mm of diameter with a dripper size of 1,0 liter per hour.
Actual Pipes Design
The application of Lixiviant Request Rate requires an application of variable
irrigation flows, initially high rates, and then diminishing until becoming alternating
cycles of irrigation-rest which also diminishes as the process advances the periods of
irrigation, everything in accordance with the particular kinetics of copper extraction of
the mineral contained within the leaching unit.
The conventional design of a single header was unable to respond to this wide
rangin demand of flows (from 15 L/h/m2 to 3,5 L/h/m2) that were needed. This demand
led to the development at the end of the year 2004 of a double header system. The two
headers also allowed the reduction of the irrigation grid and this was implemented
industrially in 2005 on the Lift 11 (Figure 5). The installation of mini wobblers in the
irrigation grid was also implemented for application flow rates between 0,08 to 0,14 L/s,
in order to reduce the precipitations of ferric iron on the border of the irrigation cones
whose occurrence will be explained later.
ZONE 1
Wobbler Feed
ZONE 2
102 m
16
0 m
4"3"
4"3"2"
Distance between lines: 0.80-0.40 m
Distance between drippers: 0.20 m
Nominal Flow Rate: 1 LPH
35 PSI35 PSI
Slope 0.5 - 1.5 %
Slope: 2 - 3 %
6" 4"
2"
6"
Feed Pipe
18 PSI 18 PSI
Pipe Flashing
6"
6"
6" 4"6"
4"
4"
6"8"
Pipe Flashing
Figure 5 - Main Pipes Leach Module Two Headers & Drip lines - Actual Design
Grid Design
In Table I, all the modifications in dripper design and drip line size are shown
resulting in dripper size changes from 8 liters per hour (L/h) to 4 then 2,2 and ultimately
1 L/h. The drip line diameters have changed as well from 12 millimeters (mm) to 20 and
finally to 16 mm, all for applied flow rates between 8,0 liters for hour per square meter

(L/h/m2) to 4,0 L/h/m
2 with one header, as shown in Figure 6 and the application rate
Equation 3.
Table I - Historical Irrigation Grid
Time LiftIrrigation Pipes
Design
Grid Spacing
(Line x Dripper)
m
Dripper
Q
LPH
Drip Line
Diameter
mm
Application
Rate (15 psi)
l/h/m2
1996 - 1997 1 Proyect 0.80 X 0.80 8.0 16 8.0 (*)
1998 - 1999 2 & 3 Second 0.80 X 0.80 8.0 16 8.0 (*)
1999 - 2000 4 & 5 Second 0.80 X 0.80 4.0 16 6.25
2000 - 2001 6 Third 0.80 X 0.40 4.0 16 12.5
2001 - 2002 7 Fourth 0.40 X 0.80 2.2 16 6.9
2002 - 2003 8 Fourth 0.80 X 0.40 2.2 20 6.9
2003 - 2004 9 & 10 Fifth 0.40 X 0.40 2.0 16 12.5
2004 10 (Cells 5 a 12) Sixth 0.40 X 0.40 1.0 16 6.3
1.0 16 6.2 - 12.52005 - 2006 11 & 12 Seventh / 2 Headers0.80 X 0.20
0.40 X 0.20 (*) Project Design Rate
Figure 6 – Dripper Selection Criteria in S.M.C.V.
Application Rate = Q . (3)
(L * D)
Where: Q = Dripper Flow Rate
L = Distance between lines
D = Distance between drips
REDUCTION OF THE PRECIPITATIONS OF FERRIC IRON
In 2004, during the heap leaching of Pad 4 a large trench was cut, 6,5 meters deep
by 70,0 meters long. The figure 7 (photographs 1 and 2) sample the trench and the
1,0
2,0
3,0
4,0
5,0
6,0
7,0
8,0
9,0
10,0
0 5 10 15 20 25 30 35 40
Drip Pressure (PSI)
Flo
w R
ate
(L
PH
)
Design Limit Operation Limit

precipitation of the ferric iron that took place vertically inside of the heap along the edges
of the (borders) of the irrigation cones that is characteristic of the irrigation drip emitter.
This precipitation is evidenced on the walls of the trench and almost invariably took
place following a precipitation pattern.
This phenomenon was interpreted as an important and undesirable occurrence
because it implied loss of iron in the leaching solutions and as the ferric iron is the
oxidizing agent of the secondary sulfides of copper was the same as losing sulfuric acid
with economic and metallurgical consequences.
Figure 7 – Ferric Iron Precipitation in the Cones Borders - Dripper Irrigation
The interpretation of the mechanism of the precipitation was the following:
The droplet points of the dripping irrigation solution, form cones with the maximum flow
along the the axis of the cones and the minimum flow tending to zero on the borders of
these cones. The pH of leaching solution in the limits have an extremely little flow and
may increase to the point of producing iron precipitation in the form of jarosites.
Table II – Behavior of the Iron in Pad 4
Cu FeT Fe2+ Fe3+ Cu FeT Fe2+ Fe3+
1996 1.02 3.99 2.13 1.86 3.38 4.93 3.33 1.59
1997 1.10 4.60 2.07 2.54 2.83 4.99 3.32 1.66
1998 1.02 5.35 3.11 2.71 3.05 5.70 4.20 1.52
1999 1.11 5.20 2.32 2.89 3.50 5.50 3.95 1.54
2000 1.24 4.91 2.08 2.84 3.19 5.08 3.54 1.55
2001 1.16 4.96 2.32 2.64 3.03 5.20 3.85 1.37
2002 0.71 5.05 2.37 2.69 3.00 5.27 3.89 1.38
2003 0.51 4.53 1.93 2.60 2.83 4.72 3.67 1.05
2004 0.51 4.07 1.92 2.16 2.77 4.32 3.92 0.40
2005 0.50 4.36 2.09 2.26 2.62 4.64 4.25 0.39
2006 0.61 4.99 2.45 2.52 2.65 5.25 4.76 0.49
ILS + RAFF PLS
Year
It was evident these occurrences needed to be prevented. It was necessary to
avoid the occurrence of elevated pH. The irrigation grid was reduced so that the cone

limits cross closer to the surface of the pile and this action could be supplemented, with
an occasional irrigation with micro-wobblers especially when beginning the irrigation of
the heap. This was made possible with the double header design of 2005.
The figure 8 (photographs 3 and 4) shows the walls of another trench made in the
heap at the end of the leaching cycle, in late of 2006, to evaluate the results of the
prevention measures. It can be appreciated that the precipitation patterns disappeared and
a few, isolated spots of precipitate had taken place in points where the irrigation was not
satisfactory. It is considered that with the measures taken avoided at least 85% of the iron
loss by precipitation of the ferric sulfate.
Figure 8 – Elimination of Ferric Iron Precipitation by combining: Dripper Irrigation &
Non Continuous Aspersion (Only Begin Rinse and After Rest Periods)
0.00
1.00
2.00
3.00
4.00
5.00
6.00
7.00
19
96
19
97
19
98
19
99
20
00
20
01
20
02
20
03
20
04
20
05
20
06
FeT
(g
/l)
&
Hei
gh
t x
10
(m
)
0.00
0.05
0.10
0.15
0.20
0.25
0.30
0.35
0.40F
e3+/F
eT
FeT Pad Height Ratio Fe+3/FeT
Figure 9 – Behavior of Iron in PLS Pad 4
Figure 9, shows the total iron concentration in the leaching solutions, evidently
affected by having strongly reduced jarosite precipitation inside the lift, as explained

earlier. Although the ferric iron concentration does not show the same tendency there are
other effects taking part such as the greater demand by the process.
INCREASE IN COPPER RECOVERY
The improvement in the superficial irrigation when reducing the irrigation grid in
a dripper system combined with a micro, non-continuous, spray (wobbler) and a variable
leaching regime, achieved more effective leaching, managing to leach a greater amount
of the mineral in the heap surface and reducing the losses of ferric iron by precipitations.
The higher concentration of ferric iron, oxidant of copper sulfides, enabled a more
favorable recovery. The quantification of its effect is very difficult to predict,
nevertheless we must accept the benefit qualitatively.
On the other hand, the improvement in uniformity of the leaching solution
distribution inside the heap in both the horizontal and vertical planes is another
consequence of the changes which contributed to the increase in the recovery. Prior to
this, the quality of agglomerate was improved and another complementary aspect that
improved was the reduction of the effects of the high unitary flows which require larger
distribution grids (of greater volume/by area unit) which tend to generate channeling and
larger impermeable zones. Mores irrigation never compensates the deficient exposure of
the mineral to the leaching solutions.
0
5
10
15
20
25
30
35
40
45
50
55
60
65
70
75
80
0 30 60 90 120 150 180 210 240 270TIME (DAYS)
EX
TR
AC
TIO
N C
uT
(%
)
Lift 1 Lift 2 Lift 3 Lift4 Lift 5 Lift 6
Lift 7 Lift 8 Lift 9 Lift 10 Lift 11
Figure 10 – Extraction Curves Based on Pad 4 Ripios Sampling as Function of
Lixiviabilty Quality Ore (Chemistry Rate) and Lixiviant Request Rate
These three considerations have had effect on the recovery of copper and
Figure 10 shows the comparison of recoveries for the different lifts on the permanent pad
The greater recovery obtained on the Lift 12 can be appreciated which is when the
CuT Cpy Cc Cv Ratio m3/Tm m3/Kg Cu % Extrac.
Lift 1 0.90 24.04 60.61 13.95 0.84 4.69 0.75 69.53
Lift 2 0.80 15.47 67.43 15.00 0.88 3.51 0.58 75.72
Lift 3 0.82 9.78 72.44 12.92 0.91 2.76 0.44 77.20
Lift 4 0.80 11.46 72.07 14.69 0.86 2.70 0.48 70.88
Lift 5 0.74 9.60 67.14 18.77 0.90 3.36 0.64 70.82
Lift 6 0.64 9.33 64.53 21.99 0.90 2.76 0.58 73.63
Lift 7 0.67 14.31 60.80 20.22 0.85 2.53 0.55 68.54
Lift 8 0.68 13.65 60.89 20.72 0.85 2.59 0.56 68.70
Lift 9 0.75 13.03 68.04 15.28 0.87 2.60 0.49 70.63
Lift 10 0.80 12.30 49.41 37.32 0.86 2.87 0.51 70.88
Lift 11 0.75 4.88 61.48 33.61 0.86 2.65 0.50 76.26

changes described in this paper began. We must also consider that the comparison begins
with Lift 4, at which time the mineral processed came from the Cerro Verde Pit (the first
three first lifts came from Santa Rosa Pit). Nevertheless the recovery delta of 5,5 units %
obtained should not be considered as the exclusive consequence of these changes, as lift
forced aeration paralleled these improvements.
.CONCLUSIONS
The quality and measured quantity of solutions applied in heap leaching are without
a doubt the most important part of the recovery of metallic values and this has to be
applied in variable and highly uniform rates
The design of irrigation headers for variable rate application is the most critical part
of the irrigation to obtain high uniformities and the use of additional irrigation
headers must be considered.
As the leaching temperature is important for the reaction kinetics in the oxidation of
copper minerals, the sprays (wobblers) must be eliminated. In addition, grid irrigation
(distances between lines and drippers) must tend to ZERO to eliminate the effect of
ferric iron precipitation which occurs between the cone boundaries in dripping due to
the pH change.
The dripper size must be directly proportional to the drop size, according to columns
tests where rates of 4 - 5 cm3/minute were applied to approach the behavior of ideal
irrigation solution flows as described by the D' Alambert Theorem.
The three effects described were obtained by reduction of the irrigation grid
combined with micro wobblers applying the concepts explained in this paper
resulting in favorable effects on the recovery.
REFERENCES
1. Bernal, Orlando, “Solutions Management at Cerro Verde” - SME Annual Meeting,
paper SME/04-179, Denver, Colorado - USA, February 2004.
2. Bernal, Orlando / Velarde, Guillermo, “New Technology for Secondary Sulfide Heap
Leaching” Copper 2003, Chile December 2003.
3. Velarde, Guillermo “Criterios de Manejo de los Regímenes de Riego en la
Lixiviación de Sulfuros de Cobre” - Sociedad Minera Cerro Verde, Internal Report
CV/ MET-27041, Perú 2001.