Agreement on Agriculture Between the Republic of Albania ...

Ŕ periodica polytechnica
Social and Management Sciences14/2 (2006) 53–69
doi: 10.3311/pp.so.2006-2.02web: http://www.pp.bme.hu/so
c© Periodica Polytechnica 2006
RESEARCH ARTICLE
Searching for political business cycle inAlbaniaImami Drini / Lami Endrit
Received 2007-09-14
AbstractIn our search for Political Business Cycles in Albania, we
found clear evidence of the attempts made by the incumbent tomanipulate the economy. There is a statistically significant in-crease of public expenditures before elections aiming at reduc-ing unemployment and increasing output, in order to please thevoters.
Regarding the macroeconomic outputs, we have found, evi-dence of PBC in GDP and unemployment but not in inflation.The fiscal expansionary policy before elections, leads to higherGDP and lower unemployment before/during elections. How-ever, the inflation does not significantly increase as expected.That might be attributed to the mature monetary policy con-ducted by the Central Bank which enjoys a relatively high levelof independence.
Keywordspolitical busibness cycles · Albania
AcknowledgementWe are thankful to Professors Dietmar Meyer, Ann-Margret
Westin, Holger Kächelein and H. Dieter Wenzel, as well as toDAAD for the precious support that enabled our research.
Imami Drini
Department of Agriculture Economics Agriculture University of Tirana Univer-siteti Bujqesor i Tiranes, Koder-Kamez, Tirane, Albaniae-mail: [email protected]
Lami Endrit
Makroeconomics Department, Ministry of Finance of the Republic of Albania,Bul. Deshmoret e Kombit, Tirane, Albaniae-mail: [email protected]
1 IntroductionNo previous research for Political Business Cycle (PBC) has
been done before on Albania, to best of our knowledge. How-ever, it is widely believed in Albania as elsewhere, that the gov-ernments may use all the means they possess, including eco-nomic policy instruments, to enhance the chances of reelections.The government may engage in expansionary economic poli-cies prior elections, increasing output and decreasing unemploy-ment, in order to please the voters, creating this way PoliticalBusiness Cycles.
The objective of our work is to search for the existence ofPBC in Albania. The testing for PBC is done by investigat-ing and analysing the economic policy instruments and macroe-conomic outcomes. We will statistically test for PBC in fiscaland monetary instruments, as well as in the related main eco-nomic outcomes; unemployment, output and inflation. We as-sume that the government may follow expansionary fiscal andmonetary policy, to reduce unemployment and increase outputbefore/during elections, and as a result of this expansionary eco-nomic policy, the inflation may increase during/after elections.
We will analyse data for the variables mentioned above atmonthly or quarterly level, between January, 1998 and March,2007. The period prior 1998 was not taken into considerationbecause of the lack of reliable data and because the economic,political and institutional framework followed a chaotic and ab-normal pattern between early 1990’ and 1997 and including theextreme year of 1997, might affect the nature of time series anal-yses. During the analysed period there took place two parlia-mentary elections and three local elections. The local electionswere considered important also because they were seen as a testfor the political forces and as a referendum for the central gov-ernment.
It is essential to investigate both, policy instruments andmacroeconomic indicators, because it may be possible that theremay be obvious attempts by the incumbent to manipulate econ-omy by (statistically) significantly altering fiscal and monetaryvariables, but without succeeding to significantly affect the (in-tended and unintended) macroeconomic variables (i.e. inflation,output and unemployment) for what ever reasons. On the other
Searching for political business cycle in Albania 532006 14 2
hand, Business Cycles may occur and coincide in election tim-ing, however not caused by instrument policies, but by other fac-tors, such as preferences and expectations [19](Suzuki, 1992).Therefore, there may be other cyclical phenomena that may off-set the effect of the policy instruments on economic outcomes.In this context, it is important in our analyses to investigate andcompare the (possible) PBC cycles in policy instruments withpolicy cycles in macroeconomic outcomes.
2 Social, Economic and Political Background of Alba-niaIn this section, we will give an overview of Albania’s social,
political and economic structure, characteristics and trends (datafrom Albanian Institute of Statistics, INSTAT)1.
Before the Second World War, Albania was an undeveloped,largely rural based society and after the war, it became part ofthe communist block. The country embraced democracy andmarket economy in the early 1990s. Despite of economic re-form, Albania still remains one of the poorest countries in Eu-rope, and that is to a large extent a result of the past communistrule which left the country in a deplorable state. The economicand political communist version applied in Albania was one ofthe toughest in the Eastern Block. All private enterprises wereshut down and nationalized and all private initiative was bannedout of economic life, prices and the investments were decidedby the authorities. The economic situation in the early 1990swas in the state of a collapse. The overall infrastructure and in-dustries, in general, was old and inefficient. Despite efforts bythe communist regime to industrialize the country, Albania hadstill remained in large a rural based society, with about 2/3 ofthe population living and working in villages.
In the early 1990s, Albania underwent the social, economicand political changes, like the rest of the former communistblock. The initial years were characterized by high inflation,reduced output and an increasing budget deficit. Policymak-ers implemented the reforms in a fast and radical way (‘shocktherapy’) aiming at deregulation, decentralization and liberal-ization in order to transfer the power of resource allocation tothe emerging markets. In the following years, the economy andAlbanian Lek stabilized, and led by the agricultural sector, realGDP grew. The speed of private entrepreneurial response to Al-bania’s opening and liberalizing was better than expected butthe collapse of the infamous pyramid schemes in 1997 and theeconomic, political and social instability that followed were atremendous setback, from which Albania’s economy still con-tinues to recover.
However, the cumulative growth since 1990 is among thehighest of all transition economies. That is the reason why Alba-nia’s real income has recovered to pre-transition levels, with anestimated GNI per capita of about US$2,510 in 2005. Real GDPhas grown by more than 7% per year between 1994 and 2001
1 www.instat.gov.al
(except for the 1997) and by about 5,4% per year between 2002and 2005 whereas the inflation has been relatively low, with anaverage of about 2.5% per year between 2004-2006. The pub-lic debt reached 57.5% of GDP in 2006. There is a very largeinformal economy (according to INSTAT and other institutions,the informal sector may count for between 30% and 50% of thetotal economy).
Albania’s trade imbalance is deep. The trade deficit was about25% of the GDP in 2006. This deficit is mainly financed byremittances coming from a large number of emigrants workingabroad.
State-owned entities (SOE) play a significant role in the econ-omy of Albania, especially in the electricity and communica-tions sectors, and the oil refinery industry. SOEs, being someof the largest entities in Albania, are important as public inter-est entities and as possible future privatization candidates. Inaddition, they provide the incumbent government the possiblemeans of affecting the economy, also in time of elections. Thereis a wide believe that the incumbents tends to manipulate theelections, by “rewarding” the supportive regions/municipalities,which may be in the form of larger electricity supply for the“favourite electoral units (municipalities)” in times of electricityshortages (KESH, the Electricity Albanian Corporate, is ownedand supervised by the government). Such assumptions may be asubject to econometrical analyses in another research work.
In Albania, still almost half of the population lives in rural ar-eas. The mountainous areas, especially in northeastern Albania,are deeply undeveloped and poor.
The political life is mainly dominated by two political parties,Democratic and Socialist Party. Although the earlier is called asrightist and the latter as leftist, their differences are more basedon geographical and (economic) clans’ components rather thansocial strata, and are perceived as pragmatic rather than ideo-logical (however, some ideological differences are discerned intheir programs and less in their decisions). Because there isa wide agreement that the main Albanian political parties andgovernments have acted and act to large extent based on oppor-tunistic approach, we found it reasonable to use the NordhausOpportunistic PBC Model as a bases of our research.
3 PBC Theory and Empirical Background“It is pretty generally accepted that the popularity of political
parties at election time is related to business conditions.” [20].It is obvious that the economic performance of a governmentdetermines to a large extent if it will be reelected, and there-fore the economic factors influence political factors. There hasbeen plenty of research and articles aiming at understanding andexplaining the interrelation between economy and politics andthe way the former affects the latter. Tibbitts does not spec-ify weather the “good business years” or the “depression years”affect the opinion and decision of the voters, only when theyare a result of respectively good and bad government perfor-mance. However it is clear that an improved economic situation
Per. Pol. Soc. and Man. Sci.54 Imami Drini / Lami Endrit
(whether it is a result of professional leadership, or just a resultof external factors) is reflected into electoral support for the in-cumbent, and the other way around, economic slow down, orcrises, (whether it is a result of bad governance, or a result ofother causes, such as whether conditions or international fac-tors), will likely result in a change of government in electionsyears. In his research of the correlation of vote given to theparty in power in different federal congressional districts, withselected points of business cycles, concluded that the party inpower will receive more votes in elections following businessexpansion than in elections during business depression [20].
But the relation between economy and politics is wider andmore complicated than just described by Tibbitts. There is awide belief in Albania, and else where, that politicians woulddo almost any things to get into power and/or remain in power,including even starting wars. In this context, many would alsobelieve that the incumbent would try to manipulate the economy(if they could) before elections aiming at staying in power.
The phenomena of (attempted) manipulation of the economyby the incumbent for electoral purpose, is called Political Busi-ness Cycles (PBC), introduced by William Nordhaus in his pa-per The Political Business Cycle, in year 1975.
The PBC model developed by Nordhaus (1975) opened theway for many following empirical and theoretical studies andpublications and remains a point of reference. It suggests thatincumbent attempts to manipulate the economy through the eco-nomic policies and instruments it possesses, in order to be re-elected. According to Nordhaus theory, the incumbent will al-ways attempt to generate PBC, for political reasons, for the goalof wining elections. Therefore, his model is based on rationalassumptions, and supports an opportunistic approach. Nordhausfocuses his empirical research on democratic countries, whereelections are held regularly.
In his work he introduced a theoretical model based on theassumptions that there is a Phillips Curve economy (trade-offbetween inflation and unemployment), voters are backward-looking (retrospective) with adaptive expectations and myopic,politicians are opportunistic and control a policy instrument, andthe timing of elections is exogenously fixed. The implicationsof the early Nordhaus model are higher economic growth be-fore elections as incumbent makes use of the short run PhilipsCurve and increased inflation after elections because of the fis-cal and/or monetary expansion. After elections, the aggregatedemand decreases which, which in turn reduces output and therate of inflation.
Another major contribution in the Political Business Cycletheory, based on empirical studies, was given by Douglas A. Hi-bbs, who gave birth to the Partisan PBC theory. The PartisanPBC theory substantially differs from the Opportunistic PBCtheory of Nordhaus, because it is based upon ideological ap-proach rather than just an opportunistic approach focused onlyon reelections. He assumes that in general, political parties inmost industrialized countries are distinguished to a large ex-
tent by class, income and related socioeconomic characteristics.According to him, left wing, labor oriented governments pur-sue different policies from right wing governments, because ingeneral they represent different “income and occupational sta-tus groups” with different preferences towards macroeconomicvariables, including unemployment and inflation.
3.1 Recent Empirical Research and Evidence for PBCOne of the most interesting PBC research works was done by
Alberto Alesina and Nouriel Roubin which were analysed dataof three recent decades of 18 OECD countries analysing investi-gating the relation between main macroeconomic variables andelections results [2]. According to this study, there was no ev-idence of Opportunistic PBC of the Nordhaus type, either foroutput or for unemployment, except for two countries (Germanyand New Zealand). However, the data showed electoral cycle onthe inflation rate. The empirical findings were in line with therational partisan theory, especially in countries with bi-partisansystem, and less relevant in countries run by broad coalitionsand unstable governments.
Also Krause and Méndez (2004) [13], analysing the data of 24countries, found evidence suggesting higher relative preferencetowards stabilizing inflation from right wing governments, thanthe left wing governments.
There may be two explanations for the limited empirical sup-port for the Nordhaus Opportunistic PBC on growth and unem-ployment. First of all, “rational” voters limit such approach,and therefore the policymakers, being aware of this fact, do nottry to generate Opportunistic PBC policies. Second, it is not aneasy task to generate expansions well calculated and timed forelections [2].
Evidence of PBC was also found in less developed and demo-cratic countries. Daniel Treisman and Vladimir Gimpelsenmade a research on the existence of PBC in Russia (2001), find-ing evidence in support of it. In his study, Asutay (2004) pro-vided clear evidence for the presence of PBC in Turkey. Theincumbent in Turkey has used fiscal and monetary policy instru-ments to create PBC in order to improve the chances of beingreelected.
3.2 Endogenous versus Exogenous Set Election DatesNordhaus (1975) does not make a distinction between en-
dogenous and exogenous election timing. Nevertheless, the waythe election date is set may have a decisive effect on the pre-dictability of the model.
In some countries, the election timing is imposed constitu-tionally (ie. in US, Presidential Elections every 4 years). Butthis is not the case for all (or most) consolidated and new democ-racies. According to Lachler (1982), if the elections timing isnot set for a fixed date by the constitution, the incumbent cancall early elections for political, economic and/or social reasons.In this context, the incumbent has information advantage, byknowing alone when elections could take place. The opportunis-
Searching for political business cycle in Albania 552006 14 2
tic government may decide to call for early elections during higheconomic performance (which should not necessarily be a resultof good governance), and benefit (i.e. win a larger majority).
As claimed by Ito and Park “the incumbent governmentdoes not manipulate the economy, but waits for positive non-government sector supply shocks (high growth, low inflation) tocall an election” (Ito and Park, 1988: 234).
In the case of Albania (parliamentary republic), the consti-tution does not set the fix date of (parliamentary) elections.Although it imposes elections every four years, allows the in-cumbent to call for early elections. During the short history ofits fragile democracy and market economy, starting from 1992,there has been only one case that early parliamentary electionswere called (1997 crises).
The local elections of February 2007, however, are an in-teresting example. These elections were seen as very impor-tant by both incumbent and opposition, as a referendum forthe government, elected in year 2005. Although they shouldbe held in the end of year 2006, the opposition pushed for adelay (within constitutional limits), so that the election timingcould converge with the electricity shortages, caused by bothdry whether and close down of Bulgarian reactors (oppositionpresented other pretext for pushing for this delay). The elec-tricity shortages, caused by external major factors, led to dis-satisfactions of households (that in some areas lacked electric-ity for more than 6 hours a day), higher costs for businesses,and in turn lower economic performance (miniature of supplydriven inflation of the 1970s in the west, that also questionedthe Phillips Curve). The incumbent lost the elections in largercities. It is hard or impossible to show econometrically to whatextent the elections result was affected by these reaction chain,however, there is a wide belief that the electricity crises and its“by-products” did influence the voting decisions.
4 Searching for PBC in Albania4.1 Theoretic modellingWe assume an Opportunistic Political Business Cycle
(OPBC) model for Albania. There is a wide consensus in Al-bania that political parties follow an opportunistic pattern in-stead of ideological one. There have been cases in the Albanianshort democratic history the right-wing governments promoteleftist reforms and vice versa. There is a socialist “tradition”:the very close relationship between political power and wealth.In almost every former socialist country the market-based legalsystem had been introduced, but in reality policy is made on thebasis of “old reflexes”.
As we already saw in the previous chapter, Nordhaus (1975),based on theoretical and empirical findings, claims that the op-portunistic governments attempt to manipulate the economy, byusing the economic instruments they possess in order to achievemacroeconomic outcomes that are attractive for the voters, inorder to enhance chances of being reelected. Hence, they try toengineer growth prior to election by expanding controlled eco-
nomic instruments and contract them after the election, causingartificial business cycles, which very likely seem to be inefficientfor the economy.
Inspired by this model, we seek to statistically find if thereis PBC in Albania caused by opportunistic incumbent govern-ments. We will analyse the instruments we have investigatedfor political manipulation, macroeconomic outcomes, method-ology we have used and the results that we have achieved. Inthis section we briefly present the assumptions and implicationsof Nordhaus (1975) theoretic.
The assumptions underlying Nordhaus “Political BusinessCycle” are as follows:
• The expectations of the voters are adaptive
In Nordhaus’ model (1975) is assumed that the expectations ofthe voters are adaptive. That means that the expectations of thevoters regarding the government performance and the prospectof the economy are formed adaptively, taking the past valuesand the most recent values of economic variables as an index forgovernment performance. That is formally represented as:
υt = πt−1 + λ (υt−1 − πt−1) 0 < λ < 1
where υ is the rate of expected inflation and π is the actual infla-tion rate
• The economy can be represented by a Phillips Curve
There is a general agreement among economists that within aneconomy there is a trade-off between the levels of unemploy-ment and the rate of inflation (although that may not always bethe case). Thus, Nordhaus (1975) assumes the economy canbe modelled by a Phillips Curve. Taking into account the firstassumption, Nordhaus employs an expectations-augmented ver-sion of the Phillips Curve. Hence, the dynamic economic systemupon which Nordhaus (1975) builds his opportunistic politicalcycle model can formally be expressed as:{
πt = f (ut ) + γ υt
υt = πt−1 + λ (υt−1 − πt−1)
where u is the rate of unemployment.
• Voters are myopic
The model assumes that voters judge the incumbent by evaluat-ing positively low unemployment and low inflation, but Nord-haus (1975) introduces the possibility that voters do not takesimple averages of economic variables over the last electoral pe-riod, but have a decaying “memory” of past events. On electionday, the memory of recent events looms larger than that of old(bad) times. In this case, the aggregate vote function can bedescribed as:
Vθ =
∫ θ
0g (utπt ) eµ t dt
where g (utπt ) is the vote function used in the static case or itcan be seen as the preference function of the electorate U =
Per. Pol. Soc. and Man. Sci.56 Imami Drini / Lami Endrit

g (ut , πt ) which depends on the macroeconomic situation in acertain time, µ is the rate of decay of voters’ memories, and θ isthe length of electoral period.
• Politicians control a policy instrument
To be able to manipulate the economy for electoral purposes, thegovernment should have (some) control of policy instruments,such as fiscal and/or monetary policies, which have direct im-pact on macroeconomic outcomes that affect the individuals (i.e.unemployment). This can take place when such policies alteraggregate demand.
• The timing of elections is exogenously fixed
Nordhaus’ model is based on exogenously determined electiontiming, but as we have already seen in the previous chapter, thismay not always be the case.
• Politicians are opportunistic
The assumption is that the main or only purpose of the govern-ment is re-election, and they use the means they have, includingeconomic policy instruments, to be re-elected. Formally the be-haviour of opportunistic politicians trying to maximize the votescan be expressed as:
max{ut , πt }
Vθ (ut , πt ) =
∫ θ
0g (utπt ) eµ t dt
subject to the economic constrains:{πt = f (ut ) + γ υt
υt = πt−1 + λ (υt−1 − πt−1)
where Vθ (ut , πt ) is the aggregate voting of the electorate ex-pressed as a function of the macro-economic situation. The sys-tem of constrains is the augmented Philips curve by which theeconomy is modelled.
Under these assumptions the implications of the Nordhausmodel are the following:
1 All governments follow the same policy. They stimulate eco-nomic growth before the elections to make use of short runPhilips Curve
2 Inflation will increase during and after election time becauseof economic expansion. Later, the inflation is reduced throughcontractionary policies.
Hence, in the next sections we explain the empirical tests wemade to the above mentioned implications of the OPBC Nord-haus theoretic in the case of Albania. We test them both inan “indirect and direct way”. We test these implications “in-directly” by investigating the patterns of fiscal and monetaryinstruments which may be manipulated by incumbents in elec-tions’ time and we test them “directly” by investigating the pat-terns of the macroeconomic indicators, such as inflation, GDP,and unemployment.
4.2 Variables and Data specificationsWithin the OPBC model framework we expect that the gov-
ernment may follow expansionary fiscal and monetary policy toreduce unemployment and increase output before/during elec-tions, and as a result of this expansionary economic policy, theinflation may increase during/after elections. Naturally, we willinvestigate and analyse the economic policy instruments literallyfiscal and monetary instruments. We will statistically test forPBC in fiscal and monetary instruments, as well as in the relatedmain economic outcomes; unemployment, output and inflation.Below we list the set of all these variables (policy instrumentsand economic indicators):
Fiscal instruments:
– Public investment expenditure
– Government expenditures on compensation of employees
– Unemployment insurance benefits
– Subsidies
– Social assistance
– Social insurance outlays
Monetary instruments:
– Monetary aggregate M1
– Monetary aggregate M2
Macroeconomic outcomes:
– Gross Domestic Product
– Unemployment
– Inflation
The data for the variables mentioned above are monthly timeseries beginning from January, 1998 to March, 2007, includ-ing 111 observations. There is exception for the data of GDPand unemployment which are available only quarterly. The datawere collected from the Ministry of Finance, (Central) Bank ofAlbania and Albanian Institute of Statistics (INSTAT).
The period before 1998 was not taken into consideration pri-mary for two reasons. First, there is a lack of data and/orthe quality is not reliable. Second, elections, economic, polit-ical and institutional framework followed a chaotic and abnor-mal pattern during those years. It was possible (easier) to winthe elections by (police) force during those years, and there-fore there was little (if any) incentive for the incumbent to usemacroeconomic polices to win elections.
During the analysed period there took place two parliamen-tary elections, namely June 24, 2001 and July 3, 2005 and threelocal elections, namely 1 October 2000, 12 October 2003 18February 2007. The local elections were considered significantalso because they were seen as a test for the participating politi-cal forces and as a referendum for the central government.
Searching for political business cycle in Albania 572006 14 2
4.3 Specifications of empirical testsSurveying the literature of the empirical works on this field
we decided to use the Intervention Analysis [4] methodologyfor constructing a statistical model in our study. Many otherwell known researchers on the field such as McCallum [14], Hi-bbs [11]Alesina and Sachs (1988), Alesina and Roubini [2] haveused Intervention Analysis in empirical studies of this kind.
Given a known intervention should be investigated if there isevidence of change in the series of the kind expected, and, ifso, what can be said of the nature and magnitude of the change(Box-Tiao, 1975). Statistically speaking: A test of the null hy-pothesis that a postulated event caused a change in the socialprocesses measured as a time-series.
The rationale for using this econometrical tool is that the po-litical manipulation of the economy through fiscal and monetaryinstruments can be considered as an intervention which yieldscyclical shifts in the mean value of the time-series of the par-ticular policy variable or the macroeconomic outcomes. Thusin our research work, the intervention analysis aims to searchif the elections can render additional explanations in the rele-vant fiscal, monetary policy instrument and in macroeconomicindicators time-series.
In this paper we test the hypothesis of the existence of changesin the above mentioned fiscal and monetary instruments andmacroeconomic time series during the elections timing, con-sistent with Nordhaus’ theory. Basically the test proceeds bysubjecting the monthly seasonally adjusted time series of thesevariables to a Box-Tiao (1975) intervention analysis. The Box-Tiao technique basically consists in fitting a time series as a sumof an autoregressive-moving average (ARMA) process and anintervention term; here the intervention term models the timedistance to the election day. Hibbs (1977) offers a good intro-duction to the Box-Tiao technique.
A simple formal representation of the intervention analysis is:
zt = µ + It + Nt
where µ denotes the mean level, the term It denotes the inter-vention effect and Nt denotes the noise of the time series whichis modelled using a suitable ARMA(p,q) time series model,
Nt = φ1 Nt−1 + ... + φp Nt−p + Et − θ1 Et−1 + ... + θp Et−q
where Et denotes an independent error sequence.The simplest, which corresponds to the t-test in a non-time se-
ries setting, is the Intervention term/variable, which in this casetakes the form of a Pulse Intervention which is an abrupt jumpin the series and then a gradual decline at the normal level of theseries. Formally the pulse intervention term can be expressedas:
It = ω0 P(T )t
where P(T )t is a pulse function,
P(T )t =
{0 t , T1 t = T
The parameter ω0 measures the change caused by the interven-tion and is estimated along with the ARMA time series com-ponent. The estimation procedure provides an estimate of ω0
and a confidence interval for the parameter. In our case the de-pendent variable zt is the fiscal or monetary instrument or themacro-economic indicator that is assumed to be affected becauseof elections. The intervention variable It is expressed as a bi-nary variable (dummy variable) indicating a specific time priorto election, as shown below. And the noise component of eachspecific dependent variable Nt is modelled by an appropriateARIMA(p,d,q) found by following Box-Jenkins (BJ) Methodol-ogy (1970) as explained in more detail below.
Hence the application of the Intervention Analysis in thistypes of studies aims to search if the elections can render ad-ditional explanations in the relevant fiscal and monetary policyinstrument and macro-economic time-series.
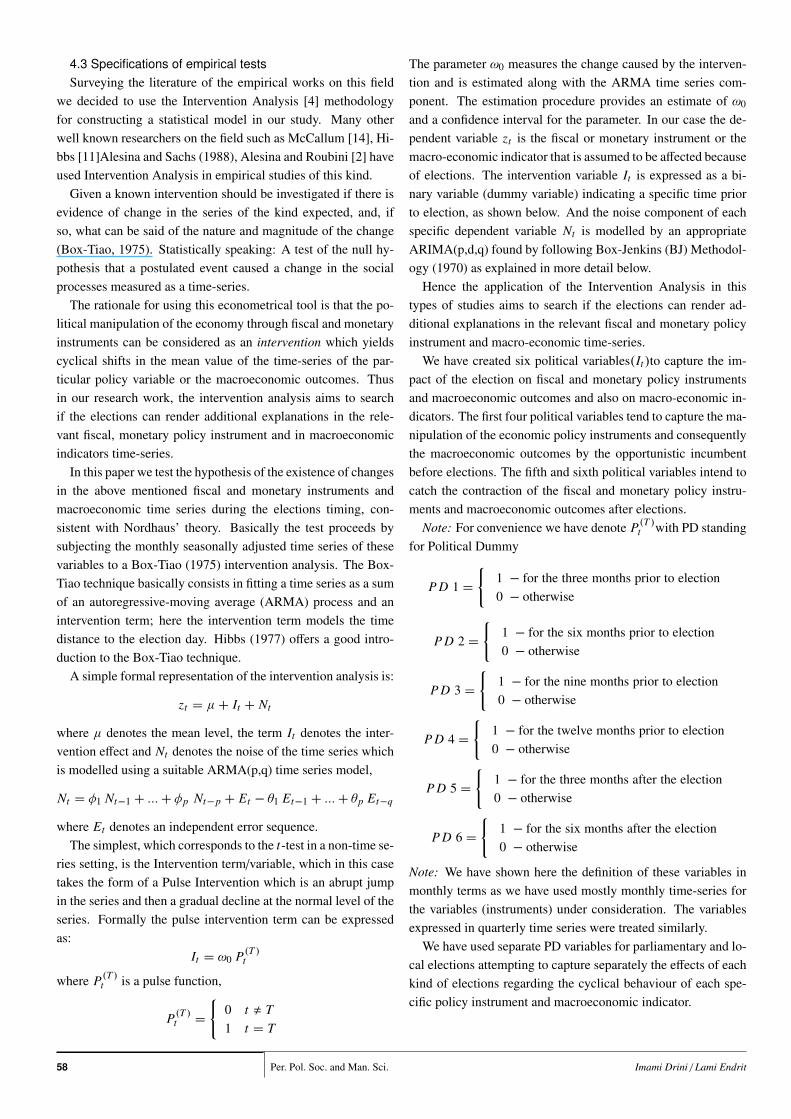
We have created six political variables(It )to capture the im-pact of the election on fiscal and monetary policy instrumentsand macroeconomic outcomes and also on macro-economic in-dicators. The first four political variables tend to capture the ma-nipulation of the economic policy instruments and consequentlythe macroeconomic outcomes by the opportunistic incumbentbefore elections. The fifth and sixth political variables intend tocatch the contraction of the fiscal and monetary policy instru-ments and macroeconomic outcomes after elections.
Note: For convenience we have denote P(T )t with PD standing
for Political Dummy
P D 1 =
{1 − for the three months prior to election0 − otherwise
P D 2 =
{1 − for the six months prior to election0 − otherwise
P D 3 =
{1 − for the nine months prior to election0 − otherwise
P D 4 =
{1 − for the twelve months prior to election0 − otherwise
P D 5 =
{1 − for the three months after the election0 − otherwise
P D 6 =
{1 − for the six months after the election0 − otherwise
Note: We have shown here the definition of these variables inmonthly terms as we have used mostly monthly time-series forthe variables (instruments) under consideration. The variablesexpressed in quarterly time series were treated similarly.
We have used separate PD variables for parliamentary and lo-cal elections attempting to capture separately the effects of eachkind of elections regarding the cyclical behaviour of each spe-cific policy instrument and macroeconomic indicator.
Per. Pol. Soc. and Man. Sci.58 Imami Drini / Lami Endrit
Regarding the expected signs of the policy variables, accord-ing to Nordhaus’ opportunistic model, we expected the coeffi-cients of pre-election variables, PD1, PD2, PD3, and PD4, tohave positive signs, implying pre-election expansion of policyinstruments. On the other hand, post-election variables PD5 andPD6 are expected to have negative sign, implying contraction inthe post-election period.
In the case of inflation, post-election variable should have apositive sign as a result of the pre-election expansionary eco-nomic policies.
4.3.1 Estimation of the empirical modelRecent developments in time-series econometrics have
yielded significant implications for econometrics application. Acrucial point of these developments has been the robustness ofOLS estimators. Due to econometrics time series propertiesof social processes the OLS estimates may yield spurious re-gression (Granger and Newbold, 1974). As shown by Price(1998), most of macroeconomic time series follow a long-runtrend. One explanation for such an occurrence can be the trendand a changing variance inherent in these time series processes.Hence the implication for this would be the invalidity of the sig-nificance test applied on OLS estimates. The existence of a timetrend and a changing variance in a time series process is widelyknown as non-stationary. When a time series is to be modelledby an Autoregressive Moving Average model (ARMA), as weare doing within the Intervention Analysis framework, such atime series must first be transformed to a stationary one [5].
In order to estimate the above mentioned empirical model foreach of the variables under consideration we have undergonea two-stage process. First we estimate an appropriate ARMAmodel for each of the depended variables time series and thenwe implement the political dummy variables individually andre-estimate the model as a whole. For each of the instruments’time series we will end up having six estimated models referringto parliamentary elections and six to local elections. Each of themodels has the same ARMA(p,q) part and one of the PDi vari-ables (i=1,2,. . . ,6) which attempt to capture the election effectson fiscal and monetary instruments and on the macroeconomicindicators.
In the first stage, we have followed precisely the Box-Jenkins(BJ) Methodology (1970). In the beginning of the process, thefirst step for each time series was removing the seasonal patternswhen they were present. All of the seasonal adjustments arecomputed with the help of DEMETRA software2. The next stepwas to carefully investigate on the stationary of each specifictime series as a necessity in further steps. In case a time seriesappeared to be non-stationary, the appropriate transformationswere made. Whenever non-stationarity was evident in a timeseries, we performed first order difference transformation on the
2 DEMETRA is a standard software used by EUROSTAT to seasonally adjustevery kind of EU figures.
original series. In every case the first order difference of theoriginal time series resulted from all the relevant tests to be sta-tionary3. To test for the stationarity of the time series and theirtransformations, the unit root test, specifically the AugmentedDickey Fuller test, was employed.
After ensuring the stationarity of time-series, the study ismodelled as ARMA (AutoRegressive Moving Averages) based onBox-Tiao’s (1975) intervention analysis. By modelling throughARMA it is possible to prove if elections can explain thechanges taking place in each policy instrument, in addition tothe past history of each variable and the random error term. Forthis process the identification of ARMA(p,q) benchmark mod-els is necessary. To find the “best” ARMA model for each timeseries we are straightforwardly based on Box-Jenkins method-ology (1970). Hence, in order to model as an ARMA each ofthe time series, we went throught an iterative process of identi-fication, estimation and diagnostic checking of several ARMAmodels until we found the most plausible one, deemed as the“best” for each series4.
In the second stage we individually incorporated each of thepolitical dummy variables in the ARMA model tentatively foundin the first stage and re-estimated the whole model now with anadditional incorporated PDi. The political dummy variables aimat capturing the impact of elections, to test whether electionshave any impact on the econometric time-series utilized by thisstudy in addition to each variable’s past value and its respectiveerror term. Thus, the impact of elections is considered to bean intervention or shock in the determination of the value of avariable by forcing the value of the variable to shift during theintervention or shock periods. The statistical significance of thepolitical dummy variables is tested using t-test. Consequently,if the coefficient of the political dummy variable is statisticallysignificant and possesses the expected sign it can be inferredthat political manipulation exists and elections affected the fis-cal, monetary policy instrument or macro-economic time-series.
4.4 Empirical Results of PBC Analyses in AlbaniaWe investigate the possible existence of PBC pattern in eco-
nomic instruments variables, including both fiscal and monetaryvariables, and in macroeconomic outcomes variables.
4.4.1 Analyses of Fiscal Economic Instruments VariablesIn the context of specifications explained above, we will
model the monthly public expenditures by category, undertakenby the governments for 1998M1-2007M3 including the effectof the 2001 and 2005 parliamentary elections, and 2000, 2003,2007 local elections. We aim at estimating the significance of
3 The n order difference is a strongly recommended efficient approach inmost of the literature of transforming one time series from non-stationary to astationary one
4 Gujarati (2003) makes a simple and clear explanation of the Box – JenkinsMethodology
Searching for political business cycle in Albania 592006 14 2
the political variables so that we can explain the changes thattake place in public expenditures.
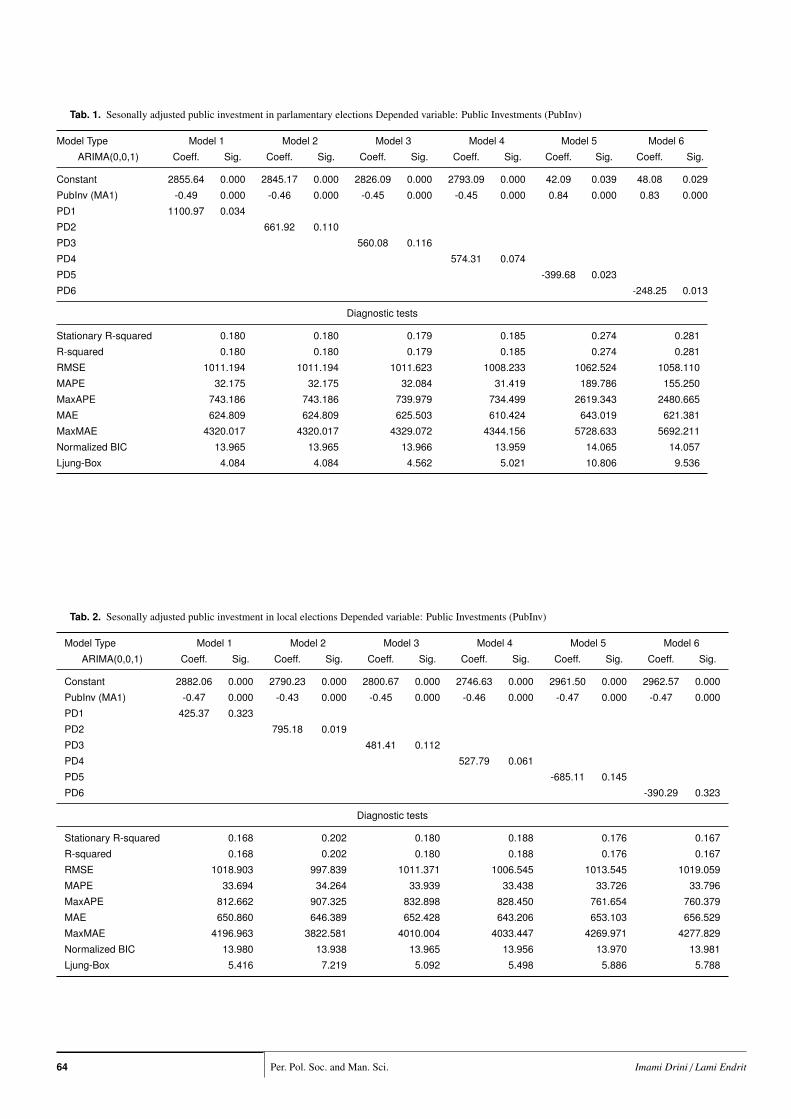
• Public investment expenditure in parliamentary (general)and local election
Since the time series of this instrument obviously showed aseasonal pattern, first we seasonally adjusted this time series.Then we investigated the stationarity of the series employingall the relevant tests (unit root test-Augmented Dickey-Fullertest, ACF, PACF). The seasonally adjusted figures of public in-vestments are not differenced at any order as from all the testsit resulted to be a stationary time-series. Then we tentativelyfound “the best” ARMA model for this time series which is anARMA(0,1) or a pure moving average with a lag one, MA(1)5.The p-values of the political dummy variables indicate the sig-nificance level of these variables.
After we went through all the steps of the methodology as ex-plained above, we had the following results. The estimated coef-ficients before pre-parliamentary election variables, PD1, PD2,PD3 and PD4 have a positive sign as a priori expected. PD1is significant at 5 % level (indicated by p-value) strongly im-plying that the government do increase this instrument nearlyprior the general parliamentary elections. On the other hand, thepost-election variables, PD5 and PD6, are significantly negativeat 5 % level, implying that the government investment expendi-ture in the post-election period decrease to compensate for theincreased spending of the pre-election period, as theory predicts.
The public investments in local elections follow a similar pic-ture as in parliamentary ones. All the PD variables prior to elec-tions have coefficients with a positive sign, as expected, withPD2 significant at 5% and PD4 at 10 %. The post-election vari-ables, PD5 and PD6, have negative signs although not signifi-cant.
Public investment, in addition to the direct benefits to the po-tential voters, can be utilized to make show campaigns from theincumbent (it is common to see ministers and mayors beforeelections inaugurating new roads, schools, etc.).
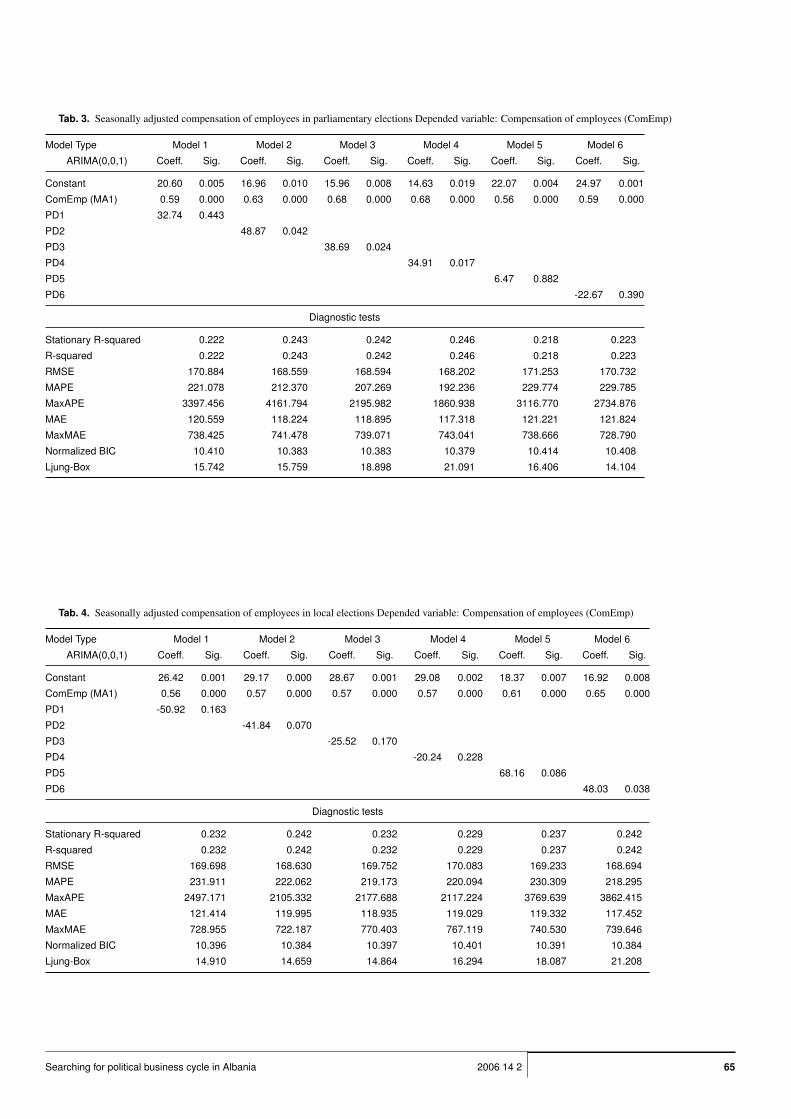
• Expenditure on compensation of employees in parliamentaryand local election (Wages + Social insurance contributions)
The characteristics: Seasonally adjusted, first-order difference,best model ARMA(0,1).
Regarding the parliamentary elections all the pre-electionsvariable coefficients result with the expected (positive) sign andPD2, PD3, PD4 coefficients are statistically significant at 5%level.
The first post-elections variable’s coefficient, PD5 is not neg-ative, contrary to our expectations; however it marks an evi-dent decrease in comparison to PD4. The second post-elections
5 The same general procedure is followed in all the other time series con-sidered in this study. Further on we briefly report the results of this procedurereferring as “the characteristics” of the time series.
variable’s coefficient PD6 is negative, as expected but not sig-nificant. These results imply that governments do manipulatecompensation of employees’ expenditure prior to parliamentaryelections increasing them and they do cut them short after elec-tions although for the second statement we are not statisticallysure.
All the pre-local elections variables’ coefficients result in op-posite signs as expected. Furthermore three of them are sig-nificant. Consequently, we can conclude that the governmentsdo not attempt to manipulate this instrument at local electionsmaybe because the incumbent does not consider the local elec-tions as important as the parliamentary elections, or becausethey may focus more on other instruments, which may be moreefficient for local elections, such as public investment (i.e. con-structing roads) in the targeted municipalities. Hence the be-haviour of incumbents in this case may be such that “they takesome money from the compensation of employee’s pool and putthem to the public investment’s pool”.
• Subsidies in parliamentary and local elections
The characteristics: Seasonally adjusted, first-order difference,best model ARMA(0,1).
Most pre-elections variables’ coefficients in both parliamen-tary and local have a positive sign however they are statisticallyinsignificant implying that subsidies have not been used as a“tool of government” prior to both types of elections.
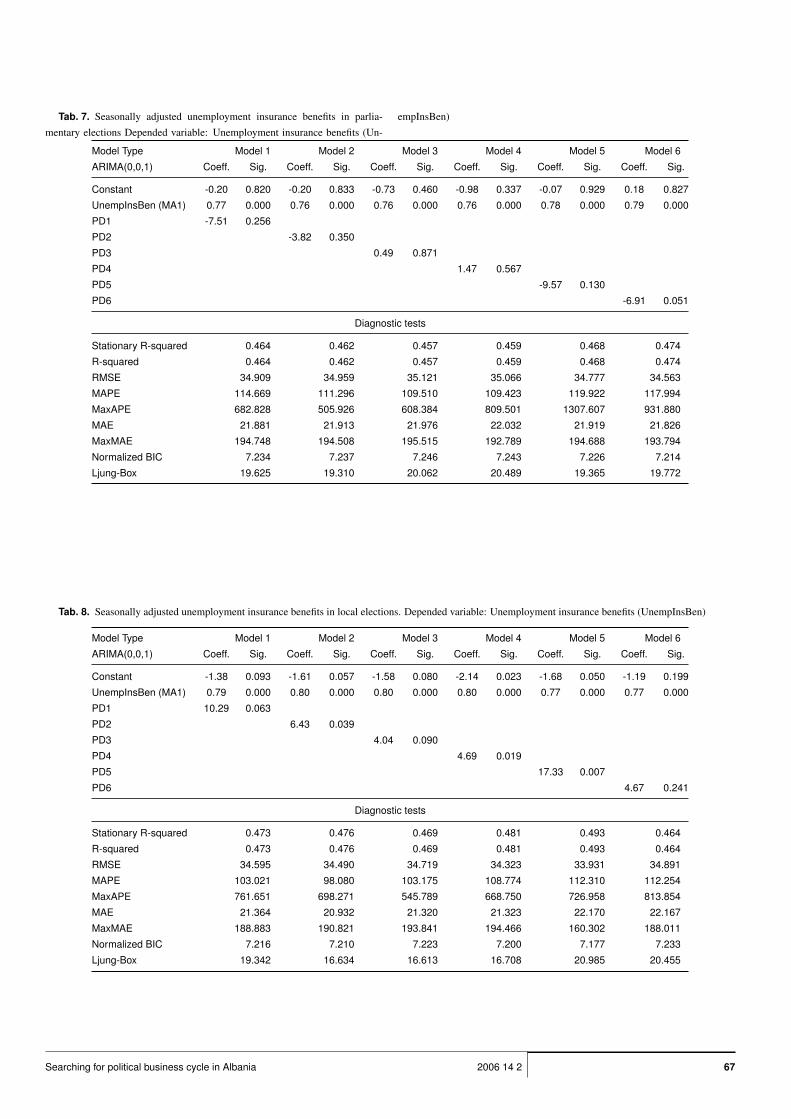
• Unemployment insurance benefits in parliamentary and localelections
The characteristics: Seasonally adjusted, first-order difference,best model ARMA(0,1).
Regarding parliamentary elections almost all the pre and post-elections’ coefficients have the expected sign but only PD6 issignificant at 10%. Consequently, we can not say anything withcertainty regarding the opportunistic manipulation of this instru-ment.
Different from general elections, in local elections appears an-other view regarding the unemployment insurance benefits. Thepre-elections’ coefficients here are with the expected sign andsignificant. Two of them, PD2 and PD4 are significant at 5%level. The post-elections’ variable coefficients, PD5 and PD6,are contrary to theoretic expectations; since they are positive(PD5 is significant at 5%). We can conclude that the govern-ments do increase this kind of expenditures prior to local elec-tions in order to attract the voters, and naturally may find it dif-ficult/impossible to reduce them back to the previous levels.
• Social assistance in parliamentary and local elections
The characteristics: Seasonally adjusted, first-order difference,best model: ARMA(0,1).
The econometric analyses of the social assistance variable inboth types of elections follow a similar pattern with the unem-ployment insurance benefits variable. There is no statistically
Per. Pol. Soc. and Man. Sci.60 Imami Drini / Lami Endrit
significant increase in parliamentary elections while there is sta-tistically significant increase in local ones. The post-elections’variables coefficients, PD5 and PD6, appear with the negativesign as predicted by theory, however significant. So we canconclude the variables of “Social assistance” have been used bygovernments as a tool of electorate manipulation, as in the caseof “Unemployment insurance benefits”.
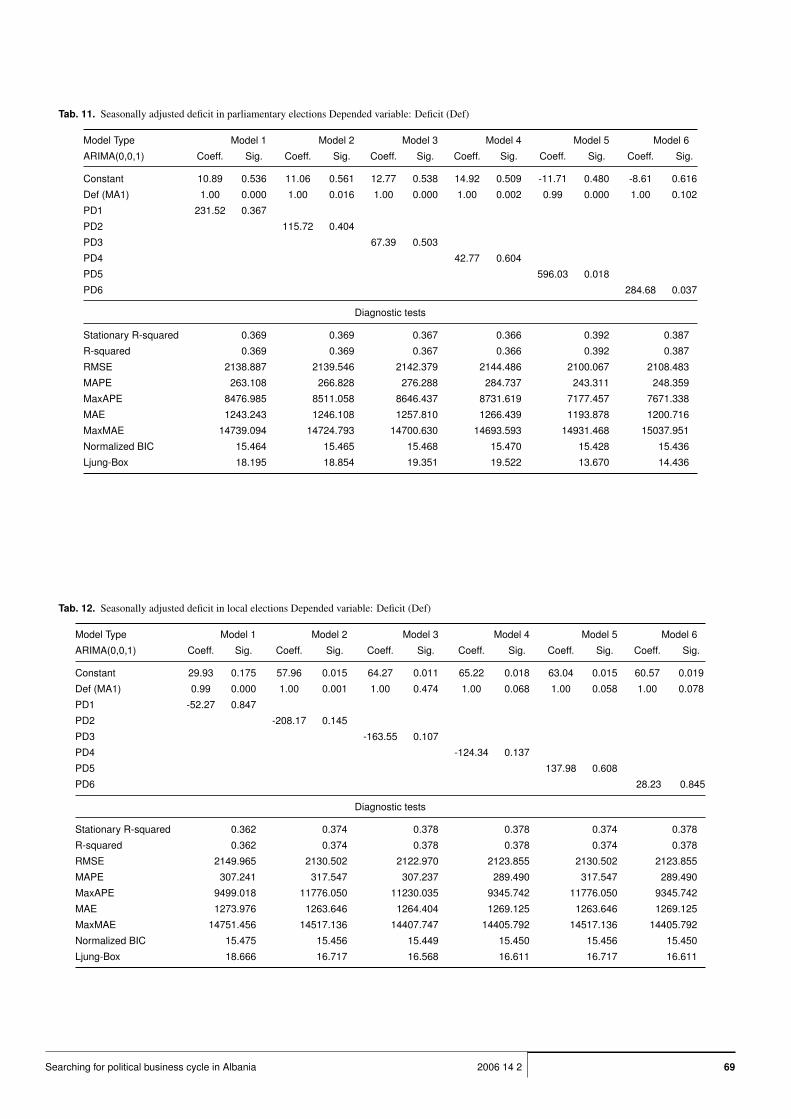
• Deficit in parliamentary and local elections
The characteristics: Seasonally adjusted, first-order difference,best model: ARMA(0,1)
In parliamentary elections’, the pre-elections variable coeffi-cients are with a positive sign, as expected, but statistically in-significant. In local elections, these variable coefficients are witha negative sign, opposite to what was expected. This makes usconclude that governments do not engage significantly in higherdeficits prior to general or local elections. One explanation forthis attitude may be the restrictions posed by the IMF. There-fore we may conclude, that although the governments signifi-cantly increase some of the expenditure items in elections time,they are discrete regarding deficit. Or, the increased expendi-tures may be covered by higher revenues (i.e. tax collections)before elections. An interesting result that needs explanations isthe fact that PD5 and PD6 result to be with a positive sign andsignificant at 5% after the general elections.
4.4.2 Analyses of Monetary Economic Instruments Vari-ablesThe statistical analyses, makes us conclude that the incum-
bent does not manipulate Monetary Policy. It is not a coinci-dence that the incumbent does not engage in Monetary PBC,because the Central Bank of Albania enjoys a relatively highlevel of independence.
• Monetary aggregate M1 in parliamentary and local elections
The characteristics: Seasonally adjusted, first-order difference,best model: ARMA(1,0)
M1 is statistically insignificant in most cases in both parlia-mentary and local elections, except for PD5 in parliamentaryelections. PD5 in parliamentary elections is significant but witha positive sign, opposite to what the theory predicts. These re-sults confirm the fact that the Central Bank of Albania is not en-gaged in PBC. M1 follows the same pattern as the deficit whichis positive and significant in post-parliamentary elections period.
• Monetary aggregate M2 in parliamentary elections
The characteristics: Seasonally adjusted, first-order difference,best model: ARMA(0,0)
Note: Although the time series in this case can not be ap-propriately modelled by any ARMA(p,d) where (p, d , 0) theoutcomes of Intervention Analysis still hold the same.
Similar to M1, also M2 is statistically insignificant in mostcases in both parliamentary and local elections.
4.4.3 Analyses of Macroeconomic Outcomes VariablesWe have analysed the main macroeconomic outcomes; GDP,
inflation (through CPI) and unemployment. As already statedearlier, we expect that the incumbent attempts to manipulatethe economy, to increase the output and unemployment be-fore/during elections, through fiscal and/or monetary expansion(in our case, fiscal expansion). In addition to the (possible)achievement of intended outcomes (lower unemployment andhigher output), normally such policies will result in higher infla-tion after elections.
• Unemployment in parliamentary elections
The characteristics: Seasonally adjusted, first-order difference,best model: ARMA(0,0)
Note: the data for unemployment are quarterly data from1998Q1-2007Q1
The unemployment is reduced before both types of elections,as predicted by the theory. However, the unemployment reduc-tion is statistically significant only in parliamentary elections asreflected by PD2 and PD3 respectively significant at 10 and 5percent level.
• GDP in parliamentary and local elections
The characteristics: Seasonally adjusted, first-order difference,best model: ARMA(0,0)
Note: the data for QGDP are quarterly data from 2001Q1-2006Q4 (Experimental figures-INSTAT).
The signs of the coefficients in all the cases are exactly likethe theory predicts, in both general and local elections, but theyare not significant except for two cases, PD5 in parliamentaryand PD2 in local. Given the limited number of observations, wemay attribute to that fact the insignificance of the coefficientsand judging from the sings of the coefficients we might implythat the manipulations of the government of fiscal instrumentsdo effect the GDP, which also corresponds to the results of un-employment.
• Consumer Price Index (CPI) in parliamentary elections
The characteristics: Seasonally adjusted, first-order difference,best model: ARMA(0,1)
CPI does not significantly change during and after parliamen-tary and local elections. This stability of CPI may be attributedto the “mature” policies followed by the Central Bank.
4.5 Reflections on PBC Theoretic and Empirical FindingsThe incumbent in Albania, as elsewhere tends to use the eco-
nomic instruments it possesses to manipulate the economy forelectoral purposes. The use of expansionary policies by theincumbent may not necessarily lead to statistically increasedunemployment and output. In our case, although there was achange of these macroeconomic variables in the expected di-rections, the changes were not statistically significant, despitethe fact that public expenditures (fiscal policy) were in general
Searching for political business cycle in Albania 612006 14 2
statistically increased before elections. There might be severalexplanations.
First, the economic structure and situation and the transmis-sion mechanism may not reflect the fiscal expansion into signif-icantly higher output and lower unemployment.
Second, there might be other factors that may offset or coun-terbalance the effect of the expansionary economic policies.Consumer and private companies’ preferences may be charac-terized by cycles which may timely converge with the electionscycles. Before parliamentary elections, there are usually “eco-nomic uncertainties” among many/most consumers and privatecompanies, because in the case of Albania, where there is aweak institutional framework, it is common that the govern-mental changes are associated with huge changes in the publicadministration staff, sometimes going down to police and highschool teachers. Moreover the new government official, may tryto favour “supportive client businesses” and “punish” businessesassociated with the other political forces. Consequently, theremay be reduced investments and household consumption levels,and overall aggregate demand, which may counterbalance theincreased aggregate demand, resulting from expansionary fiscalpolicy. Another explanation is that the government may try toincrease taxes (revenues) before elections to finance for the in-creased expenditures, while still maintaining low deficit. In thiscase, the fiscal manipulation takes the form of pure distributivemaneuver, “taking money” from relatively few businesses anddistributing them to the many voters.
Hibbs assumes that political parities have ideological orienta-tion and follow policies in line with the preferences of their mainconstituencies. There is a strong argument against it. Even in thecase of parties following ideological orientation in line with thecore part of the voters, they may do so in case they are con-vinced that if they move apart from their (ideological) line, theymay loose their electorate (there is therefore an opportunistic el-ement). Moreover, there is evidence, that there are cases thatideologically oriented parties, may ignore the interests of their“hard line” supporters (voters), although these interests may bein line (or neutral) with the ideological orientation, because theparty leaders know that their “hard line” supporters would notvote for another party, anyway. Instead they may orient certainpolicies toward “ideologically un-oriented” or “politically un-determined” voters that could in turn give their votes to that (in-cumbent) party. That can particularly be the case of policies, thatcan not (necessarily) be classified as leftist, rightist, or have anyideological characterization at all, such as the decision to makea certain public investment in this or that geographical area, ordecision to increase the wages of this or that (public) sector. Thedecision of increasing overall public investment or wages maybe a matter of ideological orientation, but for a given level ofinvestment and wage budget, choosing the areas or sector, maynot necessarily justified by ideological factors.
Once a high socialist government official in Albania wasasked by an advisor to increase the wages of the military per-
sonal, because their majority is widely believed to be leftist, heanswered that there was no reason for increasing their wages,because either way they would vote for the (same) socialistparty.
Another interesting example is the geographically orientatedelectorates. In Albania, the Socialist Party enjoys consider-ably higher support in the south of Albania, and the other wayaround, the Democratic Party (right-wing), has considerablymore voters in the north of Albania (these are the two largest par-ties in Albania). There are two implications. First, each party,once in power, may make decisions and follow policies, whichalthough in line with their ideological orientation, still containopportunistic elements, in the context of sector and regional fo-cus, in terms of choosing the region and sector to receive thehigher benefits, which should naturally converge with those con-taining the highest electoral support.
Second implication is that the government may not consider itreasonable to “waste” resources for “strong hold” (geographic)electoral areas, which do not normally change their voting pat-tern, but shift their recourses to those electoral areas that canchange their overall support. An evidence for this argument,is provided by the fact that the present government dominatedby the Democratic Party, supplied less electricity6 to Tropoja(northern city) than the previous Socialist government, which isa “strong hold” of the Democratic Party, because it is widelybelieved that the vast majority of that city will always vote forthat (Democratic) party, as in the past. Instead, they suppliedmore electricity to areas that traditionally supported the Social-ist Party, but that on occasions had voted for the DemocraticParty, like the city of Gjirokastra (city of Gjirokastra, with alarge Socialist electorate, elected a MP of the Democratic Partylast elections).
More empirical and formal evidence for these claims areneeded, which can be subject to another research undertaking.
5 ConclusionsThe incumbent is willing to use a lot of means (if not every
means) to remain in power. We have already seen plenty of the-oretical and empirical evidence in support of the view that politi-cians often attempt to manipulate the economy, to “buy voters”,creating PBCs, which although may work in the short term, inthe long term may be a source of economic instability or ineffi-ciency.
In our search for PBC in Albania, we found convincing evi-dence that the incumbent tries to manipulate the economy. Thereis a statistically significant increase of public expenditures be-fore elections, in an attempt to improve the overall economicsituation, through public investments, and directly benefit thevoters through increased transfers to the population, such as un-employment and social insurance benefits.
6 KESH, the Albanian Electricity Corporate, is a public company run by thegovernment
Per. Pol. Soc. and Man. Sci.62 Imami Drini / Lami Endrit

Regarding the macroeconomic outputs, we have found evi-dence of PBC in GDP and unemployment, but not in inflation.The fiscal expansionary policy before elections, leads to higherGDP and lower unemployment before/during elections. How-ever, the inflation does not significantly increase as expected.It is not a coincidence that the incumbent does not engage inMonetary PBC and that inflation does not alter significantly dur-ing elections, because the Central Bank enjoys a relatively highlevel of independence and it may be considered the centre ofeconomic policy in Albania.
The fiscal expansion may not always lead to significantlyhigher output and employment because the transmission mech-anisms may not be predictable and controllable, and becauseother cycles may occur simultaneously but independently ofeconomic instruments.
Another view is that the incumbent may orient its “electoratebuying” policies according to geographical aspects and not only“social strata” aspects, as predicted by Hibbs. This spatial ele-ment of our analysis opens a new window for research.
References1 Alesina A, Jerey S, Political Parties and the Business Cycle in the United
States, Journal of Money, Credit and Banking 20 (1998), 63-82.2 Alesina Alberto and Nouriel Roubini, Political Cycles in OECD
Economies, Review of Economic Studies 59 (1992), 663-88.3 Asutay M, Searching For Opportunistic Political Business Cycles in Turkey,
2004.4 Box GEP, Tiao GC, Intervention analysis with applications to economic
and environmental problems, J. Am. Stat. Assoc. 70 (1975), 70–79.5 Box GEP, Jenkins GM, Time Series Analysis, Forecasting and Control
(1976), 553. Holden-Day Inc.6 Gimpelson V, Political Business Cycles and Russian Elections, or the Ma-
nipulations of “Chudar”, British Journal of Political Science 31 (2001), 225-46.
7 Granger CWJ, Newbold P, Spurious regressions in econometrics, Journalof Econometrics 2 (1974), 111-120.
8 Gujarati DN, Basic Econometrics, McGraw Hill, New York, 2003. FourthEdition.
9 Douglas AH Jr., The American Political Science Review 71 (1977), no. 4,1467-1487.
10 Hallerberg M, de Souza Lúcio Vinhas, The Political Business Cycles of
EU Accession Countries, 2000. Tinbergen Institute Discussion Paper.11 Hibbs Douglas A. Jr., The American Political Economy: Macroeconomics
and Electoral Politics, Cambridge, MA: Harvard University Press, 1987.12 , Voting and the Macroeconomy, 2006.13 Krause S, Méndez F, Policy Makers’ Preferences, Party Ideology and the
Political Business Cycle, Department of Economics, Emory University, andDepartment of Economics, University of Arkansas, 2004.
14 McCallum B, The political Business Cycle: An Empirical Test, SouthernEconomic Journal 44 (1978), 504-515.
15 Phelps ES, The Role of Monetary Policy, American Economic Review 58,no. 1.
16 Phelps Edmund S, Phillips Curves, Expectations of Inflation and Optimal
Employment over Time, Economica NS 34 (1967), no. 3, 254-81.17 Phillips AWH, The relation between unemployment and the rate of change of
money wage rates in the United Kingdom 1861-1957, Economica 25 (1958),283-299.
18 Price S, Cointegration and Modelling the Long Run, 1998.
19 Suzuki M, Political Business Cycles in the Public Mind, The American po-litical science review 86 (1992), no. 04.
20 Tibbitts Clark, Majority Votes and the Business Cycle, The American Jour-nal of Sociology 36 (Jan. 1931), no. 4, 596-606.
21 Albanian Institute of Statistics, available at www.instat.gov.al.22 Nordhaus W, The Political Business Cycle, Review of Economic Studies 42
(1975).23 Treisman D, Gimpelson V, Political Business Cycles and Russian Elec-
tions, or the Manipulation of the "Chudar", British Journal of Political Sci-ence 31 (2001).
24 Lachler V, On political business cycles with endogenous elections dates,Journal of public economics 17 (1982).
25 Ito T, Park JH, Political business cycles in the parliamentary system, Eco-nomics Letters 27 (1988).
Searching for political business cycle in Albania 632006 14 2
Tab. 1. Sesonally adjusted public investment in parlamentary elections Depended variable: Public Investments (PubInv)
Model Type Model 1 Model 2 Model 3 Model 4 Model 5 Model 6
ARIMA(0,0,1) Coeff. Sig. Coeff. Sig. Coeff. Sig. Coeff. Sig. Coeff. Sig. Coeff. Sig.
Constant 2855.64 0.000 2845.17 0.000 2826.09 0.000 2793.09 0.000 42.09 0.039 48.08 0.029
PubInv (MA1) -0.49 0.000 -0.46 0.000 -0.45 0.000 -0.45 0.000 0.84 0.000 0.83 0.000
PD1 1100.97 0.034
PD2 661.92 0.110
PD3 560.08 0.116
PD4 574.31 0.074
PD5 -399.68 0.023
PD6 -248.25 0.013
Diagnostic tests
Stationary R-squared 0.180 0.180 0.179 0.185 0.274 0.281
R-squared 0.180 0.180 0.179 0.185 0.274 0.281
RMSE 1011.194 1011.194 1011.623 1008.233 1062.524 1058.110
MAPE 32.175 32.175 32.084 31.419 189.786 155.250
MaxAPE 743.186 743.186 739.979 734.499 2619.343 2480.665
MAE 624.809 624.809 625.503 610.424 643.019 621.381
MaxMAE 4320.017 4320.017 4329.072 4344.156 5728.633 5692.211
Normalized BIC 13.965 13.965 13.966 13.959 14.065 14.057
Ljung-Box 4.084 4.084 4.562 5.021 10.806 9.536
Tab. 2. Sesonally adjusted public investment in local elections Depended variable: Public Investments (PubInv)
Model Type Model 1 Model 2 Model 3 Model 4 Model 5 Model 6
ARIMA(0,0,1) Coeff. Sig. Coeff. Sig. Coeff. Sig. Coeff. Sig. Coeff. Sig. Coeff. Sig.
Constant 2882.06 0.000 2790.23 0.000 2800.67 0.000 2746.63 0.000 2961.50 0.000 2962.57 0.000
PubInv (MA1) -0.47 0.000 -0.43 0.000 -0.45 0.000 -0.46 0.000 -0.47 0.000 -0.47 0.000
PD1 425.37 0.323
PD2 795.18 0.019
PD3 481.41 0.112
PD4 527.79 0.061
PD5 -685.11 0.145
PD6 -390.29 0.323
Diagnostic tests
Stationary R-squared 0.168 0.202 0.180 0.188 0.176 0.167
R-squared 0.168 0.202 0.180 0.188 0.176 0.167
RMSE 1018.903 997.839 1011.371 1006.545 1013.545 1019.059
MAPE 33.694 34.264 33.939 33.438 33.726 33.796
MaxAPE 812.662 907.325 832.898 828.450 761.654 760.379
MAE 650.860 646.389 652.428 643.206 653.103 656.529
MaxMAE 4196.963 3822.581 4010.004 4033.447 4269.971 4277.829
Normalized BIC 13.980 13.938 13.965 13.956 13.970 13.981
Ljung-Box 5.416 7.219 5.092 5.498 5.886 5.788
Per. Pol. Soc. and Man. Sci.64 Imami Drini / Lami Endrit
Tab. 3. Seasonally adjusted compensation of employees in parliamentary elections Depended variable: Compensation of employees (ComEmp)
Model Type Model 1 Model 2 Model 3 Model 4 Model 5 Model 6
ARIMA(0,0,1) Coeff. Sig. Coeff. Sig. Coeff. Sig. Coeff. Sig. Coeff. Sig. Coeff. Sig.
Constant 20.60 0.005 16.96 0.010 15.96 0.008 14.63 0.019 22.07 0.004 24.97 0.001
ComEmp (MA1) 0.59 0.000 0.63 0.000 0.68 0.000 0.68 0.000 0.56 0.000 0.59 0.000
PD1 32.74 0.443
PD2 48.87 0.042
PD3 38.69 0.024
PD4 34.91 0.017
PD5 6.47 0.882
PD6 -22.67 0.390
Diagnostic tests
Stationary R-squared 0.222 0.243 0.242 0.246 0.218 0.223
R-squared 0.222 0.243 0.242 0.246 0.218 0.223
RMSE 170.884 168.559 168.594 168.202 171.253 170.732
MAPE 221.078 212.370 207.269 192.236 229.774 229.785
MaxAPE 3397.456 4161.794 2195.982 1860.938 3116.770 2734.876
MAE 120.559 118.224 118.895 117.318 121.221 121.824
MaxMAE 738.425 741.478 739.071 743.041 738.666 728.790
Normalized BIC 10.410 10.383 10.383 10.379 10.414 10.408
Ljung-Box 15.742 15.759 18.898 21.091 16.406 14.104
Tab. 4. Seasonally adjusted compensation of employees in local elections Depended variable: Compensation of employees (ComEmp)
Model Type Model 1 Model 2 Model 3 Model 4 Model 5 Model 6
ARIMA(0,0,1) Coeff. Sig. Coeff. Sig. Coeff. Sig. Coeff. Sig. Coeff. Sig. Coeff. Sig.
Constant 26.42 0.001 29.17 0.000 28.67 0.001 29.08 0.002 18.37 0.007 16.92 0.008
ComEmp (MA1) 0.56 0.000 0.57 0.000 0.57 0.000 0.57 0.000 0.61 0.000 0.65 0.000
PD1 -50.92 0.163
PD2 -41.84 0.070
PD3 -25.52 0.170
PD4 -20.24 0.228
PD5 68.16 0.086
PD6 48.03 0.038
Diagnostic tests
Stationary R-squared 0.232 0.242 0.232 0.229 0.237 0.242
R-squared 0.232 0.242 0.232 0.229 0.237 0.242
RMSE 169.698 168.630 169.752 170.083 169.233 168.694
MAPE 231.911 222.062 219.173 220.094 230.309 218.295
MaxAPE 2497.171 2105.332 2177.688 2117.224 3769.639 3862.415
MAE 121.414 119.995 118.935 119.029 119.332 117.452
MaxMAE 728.955 722.187 770.403 767.119 740.530 739.646
Normalized BIC 10.396 10.384 10.397 10.401 10.391 10.384
Ljung-Box 14.910 14.659 14.864 16.294 18.087 21.208
Searching for political business cycle in Albania 652006 14 2

Tab. 5. Seasonally adjusted subsidies in parliamentary elections Depended variable: Subsidies (Sub)
Model Type Model 1 Model 2 Model 3 Model 4 Model 5 Model 6
ARIMA(0,0,1) Coeff. Sig. Coeff. Sig. Coeff. Sig. Coeff. Sig. Coeff. Sig. Coeff. Sig.
Constant 1.64 0.844 0.87 0.921 -2.98 0.738 -6.08 0.506 -0.12 0.988 -2.41 0.784
Sub (MA1) 0.91 0.000 0.91 0.000 0.92 0.000 0.92 0.000 0.91 0.000 0.91 0.000
PD1 -10.57 0.908
PD2 0.89 0.986
PD3 20.79 0.567
PD4 27.56 0.342
PD5 18.32 0.838
PD6 28.59 0.559
Diagnostic tests
Stationary R-squared 0.450 0.450 0.452 0.455 0.450 0.452
R-squared 0.450 0.450 0.452 0.455 0.450 0.452
RMSE 658.448 658.471 657.282 655.415 658.384 657.726
MAPE 410.387 407.741 392.121 381.478 410.295 421.664
MaxAPE 11447.361 11453.283 11257.463 10954.201 11611.427 12183.398
MAE 248.217 248.797 249.689 251.186 250.191 254.619
MaxMAE 5869.259 5860.961 5839.604 5835.520 5838.311 5767.117
Normalized BIC 13.108 13.108 13.104 13.099 13.108 13.106
Ljung-Box 16.729 16.882 17.092 17.015 16.889 16.701
Tab. 6. Seasonally adjusted subsidies in local elections Depended variable: Subsidies (Sub)
Model Type Model 1 Model 2 Model 3 Model 4 Model 5 Model 6
ARIMA(0,0,1) Coeff. Sig. Coeff. Sig. Coeff. Sig. Coeff. Sig. Coeff. Sig. Coeff. Sig.
Constant -7.96 0.329 -7.45 0.403 -6.81 0.489 -5.18 0.639 -7.99 0.330 -5.29 0.545
Sub (MA1) 0.92 0.000 0.92 0.000 0.92 0.000 0.92 0.000 0.92 0.000 0.92 0.000
PD1 121.70 0.141
PD2 55.45 0.225
PD3 33.24 0.331
PD4 19.33 0.508
PD5 134.59 0.130
PD6 47.42 0.337
Diagnostic tests
Stationary R-squared 0.462 0.458 0.456 0.453 0.462 0.455
R-squared 0.462 0.458 0.456 0.453 0.462 0.455
RMSE 651.650 653.707 655.306 656.923 651.251 655.455
MAPE 333.966 341.957 345.060 341.946 359.509 374.385
MaxAPE 10234.480 10200.623 10254.131 10501.744 10728.870 11074.962
MAE 242.527 244.600 246.649 245.475 245.852 246.783
MaxMAE 5891.344 5901.313 5905.863 5900.661 5851.593 5842.030
Normalized BIC 13.087 13.094 13.098 13.103 13.086 13.099
Ljung-Box 17.221 18.549 18.032 16.997 16.392 17.566
Per. Pol. Soc. and Man. Sci.66 Imami Drini / Lami Endrit
Tab. 7. Seasonally adjusted unemployment insurance benefits in parlia-mentary elections Depended variable: Unemployment insurance benefits (Un-
empInsBen)
Model Type Model 1 Model 2 Model 3 Model 4 Model 5 Model 6
ARIMA(0,0,1) Coeff. Sig. Coeff. Sig. Coeff. Sig. Coeff. Sig. Coeff. Sig. Coeff. Sig.
Constant -0.20 0.820 -0.20 0.833 -0.73 0.460 -0.98 0.337 -0.07 0.929 0.18 0.827
UnempInsBen (MA1) 0.77 0.000 0.76 0.000 0.76 0.000 0.76 0.000 0.78 0.000 0.79 0.000
PD1 -7.51 0.256
PD2 -3.82 0.350
PD3 0.49 0.871
PD4 1.47 0.567
PD5 -9.57 0.130
PD6 -6.91 0.051
Diagnostic tests
Stationary R-squared 0.464 0.462 0.457 0.459 0.468 0.474
R-squared 0.464 0.462 0.457 0.459 0.468 0.474
RMSE 34.909 34.959 35.121 35.066 34.777 34.563
MAPE 114.669 111.296 109.510 109.423 119.922 117.994
MaxAPE 682.828 505.926 608.384 809.501 1307.607 931.880
MAE 21.881 21.913 21.976 22.032 21.919 21.826
MaxMAE 194.748 194.508 195.515 192.789 194.688 193.794
Normalized BIC 7.234 7.237 7.246 7.243 7.226 7.214
Ljung-Box 19.625 19.310 20.062 20.489 19.365 19.772
Tab. 8. Seasonally adjusted unemployment insurance benefits in local elections. Depended variable: Unemployment insurance benefits (UnempInsBen)
Model Type Model 1 Model 2 Model 3 Model 4 Model 5 Model 6
ARIMA(0,0,1) Coeff. Sig. Coeff. Sig. Coeff. Sig. Coeff. Sig. Coeff. Sig. Coeff. Sig.
Constant -1.38 0.093 -1.61 0.057 -1.58 0.080 -2.14 0.023 -1.68 0.050 -1.19 0.199
UnempInsBen (MA1) 0.79 0.000 0.80 0.000 0.80 0.000 0.80 0.000 0.77 0.000 0.77 0.000
PD1 10.29 0.063
PD2 6.43 0.039
PD3 4.04 0.090
PD4 4.69 0.019
PD5 17.33 0.007
PD6 4.67 0.241
Diagnostic tests
Stationary R-squared 0.473 0.476 0.469 0.481 0.493 0.464
R-squared 0.473 0.476 0.469 0.481 0.493 0.464
RMSE 34.595 34.490 34.719 34.323 33.931 34.891
MAPE 103.021 98.080 103.175 108.774 112.310 112.254
MaxAPE 761.651 698.271 545.789 668.750 726.958 813.854
MAE 21.364 20.932 21.320 21.323 22.170 22.167
MaxMAE 188.883 190.821 193.841 194.466 160.302 188.011
Normalized BIC 7.216 7.210 7.223 7.200 7.177 7.233
Ljung-Box 19.342 16.634 16.613 16.708 20.985 20.455
Searching for political business cycle in Albania 672006 14 2

Tab. 9. Seasonally adjusted social assistance in parliamentary elections Depended variable: Social assistance (SocAss)
Model Type Model 1 Model 2 Model 3 Model 4 Model 5 Model 6
ARIMA(0,0,1) Coeff. Sig. Coeff. Sig. Coeff. Sig. Coeff. Sig. Coeff. Sig. Coeff. Sig.
Constant 10.02 0.037 11.41 0.028 10.57 0.051 10.03 0.078 9.43 0.059 9.32 0.079
SocAss (MA1) 0.84 0.000 0.84 0.000 0.84 0.000 0.83 0.000 0.83 0.000 0.82 0.000
PD1 -51.76 0.202
PD2 -36.98 0.115
PD3 -19.99 0.255
PD4 -12.59 0.395
PD5 -40.20 0.336
PD6 -18.65 0.437
Diagnostic tests
Stationary R-squared 0.345 0.351 0.344 0.340 0.341 0.339
R-squared 0.345 0.351 0.344 0.340 0.341 0.339
RMSE 252.984 251.850 253.287 254.009 253.812 254.229
MAPE 304.409 278.415 288.993 291.566 336.733 349.947
MaxAPE 7046.533 3275.795 3802.239 5844.412 11845.285 11778.249
MAE 112.620 112.729 112.536 113.361 114.182 115.024
MaxMAE 1597.225 1590.206 1593.125 1595.790 1603.853 1606.788
Normalized BIC 11.195 11.186 11.197 11.203 11.201 11.205
Ljung-Box 5.277 4.939 5.269 5.552 4.646 4.633
Tab. 10. Seasonally adjusted social assistance in local elections Depended variable: Social assistance (SocAss)
Model Type Model 1 Model 2 Model 3 Model 4 Model 5 Model 6
ARIMA(0,0,1) Coeff. Sig. Coeff. Sig. Coeff. Sig. Coeff. Sig. Coeff. Sig. Coeff. Sig.
Constant 3.78 0.450 0.67 0.889 -0.52 0.914 -1.08 0.833 -0.83 0.887 0.22 0.974
SocAss (MA1) 0.84 0.000 0.86 0.000 0.87 0.000 0.87 0.000 0.86 0.000 0.85 0.000
PD1 43.35 0.251
PD2 40.17 0.042
PD3 30.43 0.035
PD4 23.99 0.053
PD5 18.43 0.115
PD6 13.36 0.258
Diagnostic tests
Stationary R-squared 0.344 0.360 0.362 0.358 0.351 0.344
R-squared 0.344 0.360 0.362 0.358 0.351 0.344
RMSE 253.233 250.070 249.762 250.451 251.864 253.297
MAPE 350.936 393.335 389.512 399.201 386.661 368.791
MaxAPE 8683.537 6625.583 5477.843 4899.816 5136.744 6120.628
MAE 118.469 122.844 124.107 123.185 121.461 119.810
MaxMAE 1587.184 1522.038 1516.687 1528.138 1548.870 1571.802
Normalized BIC 11.197 11.172 11.169 11.175 11.186 11.197
Ljung-Box 5.471 5.668 5.812 5.653 5.743 6.069
Per. Pol. Soc. and Man. Sci.68 Imami Drini / Lami Endrit
Tab. 11. Seasonally adjusted deficit in parliamentary elections Depended variable: Deficit (Def)
Model Type Model 1 Model 2 Model 3 Model 4 Model 5 Model 6
ARIMA(0,0,1) Coeff. Sig. Coeff. Sig. Coeff. Sig. Coeff. Sig. Coeff. Sig. Coeff. Sig.
Constant 10.89 0.536 11.06 0.561 12.77 0.538 14.92 0.509 -11.71 0.480 -8.61 0.616
Def (MA1) 1.00 0.000 1.00 0.016 1.00 0.000 1.00 0.002 0.99 0.000 1.00 0.102
PD1 231.52 0.367
PD2 115.72 0.404
PD3 67.39 0.503
PD4 42.77 0.604
PD5 596.03 0.018
PD6 284.68 0.037
Diagnostic tests
Stationary R-squared 0.369 0.369 0.367 0.366 0.392 0.387
R-squared 0.369 0.369 0.367 0.366 0.392 0.387
RMSE 2138.887 2139.546 2142.379 2144.486 2100.067 2108.483
MAPE 263.108 266.828 276.288 284.737 243.311 248.359
MaxAPE 8476.985 8511.058 8646.437 8731.619 7177.457 7671.338
MAE 1243.243 1246.108 1257.810 1266.439 1193.878 1200.716
MaxMAE 14739.094 14724.793 14700.630 14693.593 14931.468 15037.951
Normalized BIC 15.464 15.465 15.468 15.470 15.428 15.436
Ljung-Box 18.195 18.854 19.351 19.522 13.670 14.436
Tab. 12. Seasonally adjusted deficit in local elections Depended variable: Deficit (Def)
Model Type Model 1 Model 2 Model 3 Model 4 Model 5 Model 6
ARIMA(0,0,1) Coeff. Sig. Coeff. Sig. Coeff. Sig. Coeff. Sig. Coeff. Sig. Coeff. Sig.
Constant 29.93 0.175 57.96 0.015 64.27 0.011 65.22 0.018 63.04 0.015 60.57 0.019
Def (MA1) 0.99 0.000 1.00 0.001 1.00 0.474 1.00 0.068 1.00 0.058 1.00 0.078
PD1 -52.27 0.847
PD2 -208.17 0.145
PD3 -163.55 0.107
PD4 -124.34 0.137
PD5 137.98 0.608
PD6 28.23 0.845
Diagnostic tests
Stationary R-squared 0.362 0.374 0.378 0.378 0.374 0.378
R-squared 0.362 0.374 0.378 0.378 0.374 0.378
RMSE 2149.965 2130.502 2122.970 2123.855 2130.502 2123.855
MAPE 307.241 317.547 307.237 289.490 317.547 289.490
MaxAPE 9499.018 11776.050 11230.035 9345.742 11776.050 9345.742
MAE 1273.976 1263.646 1264.404 1269.125 1263.646 1269.125
MaxMAE 14751.456 14517.136 14407.747 14405.792 14517.136 14405.792
Normalized BIC 15.475 15.456 15.449 15.450 15.456 15.450
Ljung-Box 18.666 16.717 16.568 16.611 16.717 16.611
Searching for political business cycle in Albania 692006 14 2
Copyright © 2022 FDOKUMEN