VISCOELASTIC PROPERTIES OF HEAT-SET WHEY PROTEIN EMULSION GELS
Advances in Colloid and Interface Science 108–109(2004) 259–272
0001-8686/04/$ - see front matter� 2003 Elsevier B.V. All rights reserved.doi:10.1016/j.cis.2003.10.008
Using emulsion inversion in industrial processes
Jean-Louis Salager*, Ana Forgiarini, Laura Marquez, Alejandro Pena, Aldo Pizzino,´ ˜Marıa P. Rodriguez, Marianna Rondon-Gonzalez´ ´ ´
Universidad de Los Andes, Laboratorio of FIRP Ingenierıa Quımica, Merida 5101, Venezuela´ ´ ´
Abstract
Emulsion inversion is a complex phenomenon, often perceived as an instability that is essentially uncontrollable, althoughmany industrial processes make use of it. A research effort that started 2 decades ago has provided the two-dimensional andthree-dimensional description, the categorization and the theoretical interpretation of the different kinds of emulsion inversion. Aclear-cut phenomenological approach is currently available for understanding its characteristics, the factors that influence it andcontrol it, the importance of fine-tuning the emulsification protocol, and the crucial occurrence of organized structures such asliquid crystals or multiple emulsions. The current know-how is used to analyze some industrial processes involving emulsioninversion, e.g. the attainment of a fine nutrient or cosmetic emulsion by temperature or formulation-induced transitional inversion,the preparation of a silicone oil emulsion by catastrophic phase inversion, the manufacture of a viscous polymer latex by combinedinversion and the spontaneous but enigmatic inversion of emulsions used in metal working operations such as lathing orlamination.� 2003 Elsevier B.V. All rights reserved.
Keywords: Emulsion inversion; Emulsification protocol; Transitional inversion
1. Introduction: importance of phase behavior
Macroemulsions, which are simply called emulsions,are liquid–liquid dispersions exhibiting certain persist-ence against phase separation because of the presenceof stabilizing agents, usually surfactants, at the interface.In most practical cases they can be categorized assurfactant–oil–water(SOW) systems containing at leastthree components. Even when there are many morecomponents, it is convenient to assume the SOW ternaryfor the sake of simplicity and without committing muchfrom the interpretative point of view.The two main emulsion types, i.e. oil-in-water(Oy
W) and water-in-oil(WyO) morphologies, involve thepresence of two non-miscible phases and are thusassociated to two-phase behavior at equilibrium. This isgenerally the case for double or multiple emulsions aswell, in spite of a higher grade of morphology complex-ity. It is thus of utmost importance to know the physico-chemical conditions that are associated with two-phasebehaviorw1x.
*Corresponding author. Tel.:q58-274-2402954; faxq58-274-2402957.
E-mail address: [email protected](J.-L. Salager).
Single-phase SOW systems such as microemulsionsor liquid crystals would not produce any emulsion uponstirring.As far as three-phase behavior systems are concerned,
they generally contain a surfactant-rich phase, eithermicroemulsion or liquid crystal, in equilibrium withexcess oil and excess water, which are essentially pureoil and pure water for inventory purposes. Wheneverthe formulation is appropriate, the occurrence of amicroemulsion or a liquid crystalline mesophase essen-tially depends upon the degree of disorder. Molecularorder and liquid crystal occurrence are favored bysurfactant purity, straight chain structure, low tempera-ture and high polar interaction as in ionic systemsw2–7x.In such cases disorder can be introduced either by
elevating the temperature or by adding a short chain co-surfactant amphiphile such as an alcohol. Systems con-taining polyethoxylated non-ionic surfactants oftenproduce microemulsions without co-surfactant becauseof the variety of species produced by the ethoxylationreaction, and the resulting difference in molecular sizew6x. In some cases, systems containing ionic surfactants
260 J.-L. Salager et al. / Advances in Colloid and Interface Science 108 –109 (2004) 259–272
can also exhibit three-phase behavior in absence of aco-surfactantw8x.When these three-phase systems are stirred, emulsifi-
cation often takes place very easily because the interfa-cial tension is usually extremely low. Moreover, thethree-phase systems containing a bicontinuous microe-mulsion in equilibrium with excess oil and excess water,are known to produce very unstable emulsions thatcoalesce very quicklyw9–14x, probably because theformulation tends to favor a zero interfacial curvaturewhich is incompatible with the existence of a macroe-mulsion. Although different approaches have beenadvanced to interpret this fact, they all reach this samefinal conclusionw15–18x.The relative position of the surfactant-rich phase in
stirred three-phase system emulsions is essentiallyimpossible to find out by direct observation, and it isextremely difficult to determine from conductivity meas-urementw19x. If the microemulsion phase represents alarge fraction of the system, then it probably becomesthe continuous phase with drops of both oil and waterdispersed in it. The situation is not easy to find outwhen the surfactant-rich phase represents a small frac-tion of the total, as it occurs at low surfactant concen-tration. However, some hints on what could happen aregiven from the observation of low tension SOW systemsflowing in transparent microporous models used tomimic enhanced oil recovery processesw20x. In theseexperiments, and at high wateryoil ratios, the oil dropsbecome extremely elongated and they break and coa-lesce very easily. When the wateryoil ratio is close tounity, streams of oil and water move concomitantly andform some kind of bicontinuous dispersed system when-ever shear is applied.In this complex morphology, the surfactant phase can
be guessed to be located at the interface. This idea issupported by observations on emulsions made near so-called optimum formulation when the surfactant-richphase is a liquid crystal of the lamellar type. Freezeetching pictures have shown the deposition of one orseveral liquid crystal layers around the emulsion dropsw21–25x. Encapsulation with liquid crystals has beenknown for many years as an effective mechanism tostabilize macroemulsionsw26x. It is also the key mech-anism that prevents the quick coalescence tendency andinsures the persistence of small droplets in the three-phase systems referred above, as will be discussed later.
2. Twoythree-dimensional diagram representation ofphase behavior
2.1. Generalized formulation
The phase behavior of a surfactant–oil–water systemdepends on two kinds of variables, generally referred toas formulation and composition variablesw27x. The
typical formula to indicate the variation of the chemicalpotential of a substance in an ideal solution allows thecategorization of these variables,
msm8qRT lnC (1)
wherem8 is the standard chemical potential at a certainreference state, andC is the surfactant concentration.The formulation or field variables are related to the
nature of the substances, as well as temperature andpressure. These intensive variables influence them8 termin Eq. (1). However, the composition variables, whichare the relative amounts of the different substances, suchas surfactant concentrationC, are extensive variables.The influence of both type of variables on emulsion
morphology was recognized a century agow28–30x,when Bancroft associated it with the surfactant hydro-philicity, i.e. a formulation variable, and Oswald withthe wateryoil ratio (WOR), i.e. a composition variable.The main problem in handling the phase behavior
representation was the high number of degrees of free-dom, which are at least three to describe the nature ofthe SOW components, one more for temperature(withpressure often neglected), plus two independent varia-bles to describe the composition, often taken as surfac-tant concentration and WOR. This ternary case, whichis the simplest one, requires six independent variables,far more than what can be represented in the usual two-dimensionalythree-dimensional plotting.The situation became easier to manage when Winsor’s
pioneering workw31x in the early 1950s indicated thatthe formulation could be handled through a singleoverall concept, including temperature as shown in detaila few years later by Shinodaw32x. Thanks to theextensive experimental work carried out in the 1970sduring the enhanced petroleum recovery research drive,the attainment of the so-called optimum formulation forthree-phase behavior has been quantified in terms ofvariables describing the nature of the different compo-nentsw33,34x.This was extended to the definition of a generalized
overall formulation variable, which is written as thedeviation from optimum formulation, and is related tothe change of chemical potential of the surfactant mol-ecule when it passes from water to oil, so-called surfac-tant affinity difference(SAD) w35x or alternately theequivalent dimensionless expression so-called hydro-philic–lipophilic deviation(HLD) w36,37x. For a strictlyminimum system containing an ionic surfactant, an-alkane, and a sodium chloride brine the hydrophilic–lipophilic deviation (HLD) may be written as followsw33,38x:
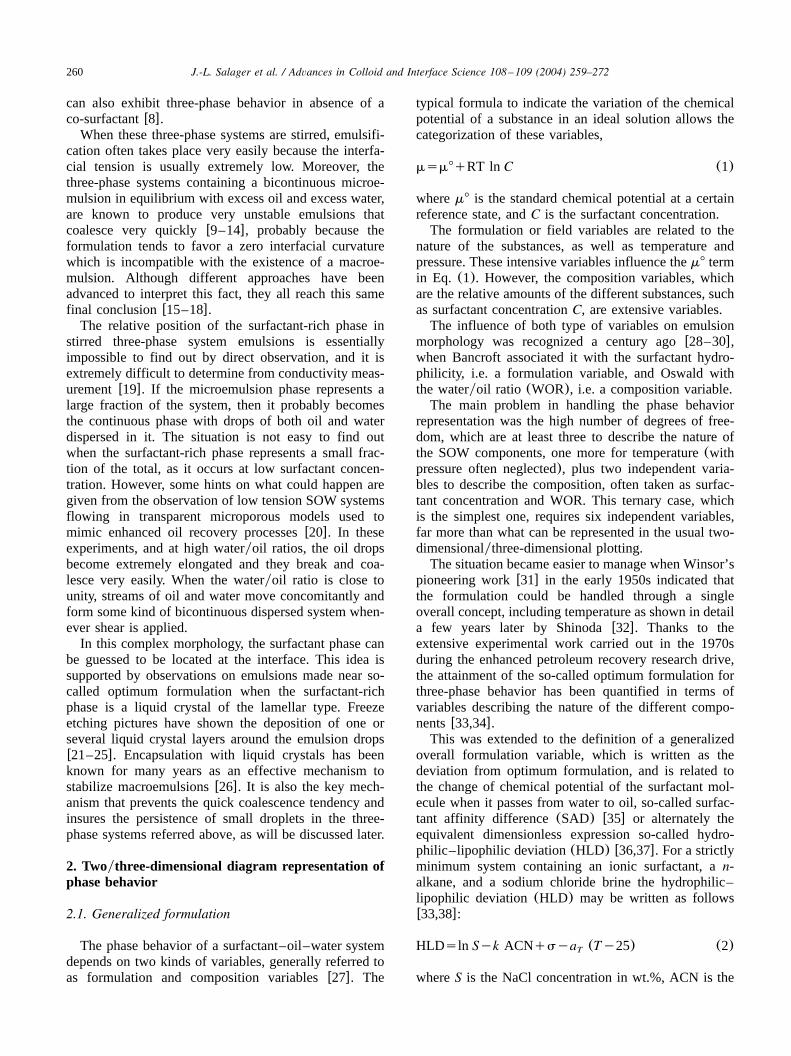
HLDsln Syk ACNqsya (Ty25) (2)T
whereS is the NaCl concentration in wt.%, ACN is the

261J.-L. Salager et al. / Advances in Colloid and Interface Science 108 –109 (2004) 259–272
Fig. 1. Two-dimensional representation of the phase behavior of SOW systems.
alkane carbon number, ‘s’ is a characteristic parameterof the surfactant, andT is the temperature.A similar relationship has been found for ethoxylated
non-ionic surfactants:w34x
HLDsbØSykØACNqayEONqc (Ty25) (3)T
where EON is the average degree of ethoxylation and‘a’ is a parameter that is characteristic of the surfactantlipophilic group. More complete relationships are avail-able for systems containing other surfactants, otherelectrolytes, alcohol co-surfactants, non-alkane oils, andmixturesw6,37–43x.This HLD concept is essentially a generalization of
previously proposed concept such as Griffin’s HLBw44,45x or HLB temperature on which is based Shinoda’sPIT w32,46,47x, with the advantage of including theeffects of all formulation variables in a numerical way.Whenever HLDs0, the formulation is exactly balanced.If HLD)0 (respectively HLD-0) the surfactant exhib-its more affinity for the oil(respectively aqueous) phase.HLD can be made to vary by changing any of theformulation variables, i.e. salinity, oil nature, surfactanttype, temperature, as well as others which are notindicated in the simplified relationships Eqs.(2) and(3), such as alcohol type, alcohol content, and evenpressurew48x, whose effect is often negligible in hydro-carbon–water systems but can become important incompressible ones, e.g. those containing supercriticalcarbon dioxide ‘oil’ phasew49x.Thanks to these relationships, the influence of for-
mulation may be handled through a single variable. Thisresults in a considerable reduction in the number ofdegrees of freedom that allows to describe the phasebehavior of a minimum SOW system with three inde-pendent variables: the generalized formulation HLD,and two composition variables, i.e. the surfactant con-centration(SC) and the wateryoil ratio (WOR), to buildup a three-dimensional representation. Let us review
first the two-dimensional representations that areavailable.
2.2. Two-dimensional phase behavior representations
At constant formulation, the usual two-dimensionalrepresentation is a triangular ternary diagram(Fig. 1a)in which the phase behavior depends on two composi-tion variables, usually surfactant concentration(SC) andwateryoil ratio (WOR). Generally speaking, the diagramexhibits a single-phase region at high surfactant concen-tration and a multiphase region near the OW side. Thenature of this region essentially depends on the gener-alized formulation, i.e. on the HLD valuew6x.The second kind of two-dimensional representation is
obtained at constant WOR, by plotting the phase behav-ior vs. surfactant concentration and formulation. In mostSOW systems containing non-ionic surfactants, temper-ature is the selected variable to change the generalizedformulation according to Eq.(3). This two-dimensionaldiagram is found in the literature with the shapesindicated in Fig. 1b, so-called gammaw50,51x or fishw52–55x, depending of which of the variable is taken asordinate.The third kind of two-dimensional diagram corre-
sponds to a constant surfactant concentration. In thiscase, the phase behavior is plotted against formulationand WOR(Fig. 1c) w56x.The selection of the most suitable type of diagram
depends on the application, i.e. on the two variablesthat are most critical for the particular case.
2.3. Three-dimensional phase behavior representation
The variation of these two-dimensional diagrams dueto changes in a third variable leads to a sequence ofplots that make up a three-dimensional diagram.Although all three-dimensional diagrams would com-prise the same information, in particular the extensionof the three-phase region, their appearance differs,
262 J.-L. Salager et al. / Advances in Colloid and Interface Science 108 –109 (2004) 259–272
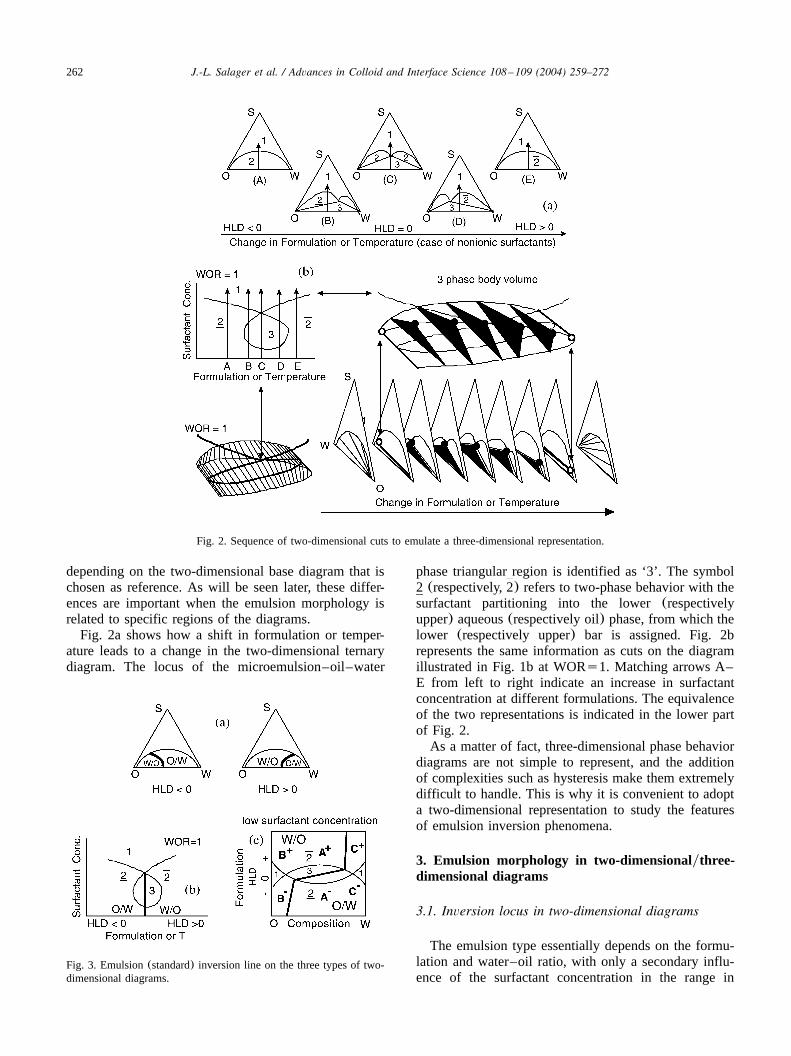
Fig. 2. Sequence of two-dimensional cuts to emulate a three-dimensional representation.
Fig. 3. Emulsion(standard) inversion line on the three types of two-dimensional diagrams.
depending on the two-dimensional base diagram that ischosen as reference. As will be seen later, these differ-ences are important when the emulsion morphology isrelated to specific regions of the diagrams.Fig. 2a shows how a shift in formulation or temper-
ature leads to a change in the two-dimensional ternarydiagram. The locus of the microemulsion–oil–water
phase triangular region is identified as ‘3’. The symbol2 (respectively, ) refers to two-phase behavior with the2surfactant partitioning into the lower(respectivelyupper) aqueous(respectively oil) phase, from which thelower (respectively upper) bar is assigned. Fig. 2brepresents the same information as cuts on the diagramillustrated in Fig. 1b at WORs1. Matching arrows A–E from left to right indicate an increase in surfactantconcentration at different formulations. The equivalenceof the two representations is indicated in the lower partof Fig. 2.As a matter of fact, three-dimensional phase behavior
diagrams are not simple to represent, and the additionof complexities such as hysteresis make them extremelydifficult to handle. This is why it is convenient to adopta two-dimensional representation to study the featuresof emulsion inversion phenomena.
3. Emulsion morphology in two-dimensionalythree-dimensional diagrams
3.1. Inversion locus in two-dimensional diagrams
The emulsion type essentially depends on the formu-lation and water–oil ratio, with only a secondary influ-ence of the surfactant concentration in the range in

263J.-L. Salager et al. / Advances in Colloid and Interface Science 108 –109 (2004) 259–272
which the system exhibits more than one phase. Fig. 3aindicates the two-phase regions where OyW and WyOmorphologies are attained in the two extreme cases(HLD-0 and HLD)0) in the surfactant concentration–WOR ternary diagram representation.The inversion locus is the bold black line that sepa-
rates the two-phase region in two zones. It is locatednear the O(respectively W) vertex at HLD-0 (respec-tively HLD)0). This is surely not the best representa-tion since the formulation effect is not shown in a singlediagram, but has to be handled through a sequence ofdiagrams as indicated in the lower part of Fig. 2. Theonly interest of such a representation is that it canindicate the composition of the phases in equilibriumthrough a tie line representation(not shown here). Italso shows the position of the critical point ‘c’ on thebinodal curve at the end of the inversion line, which isof interest more for thermodynamics discussions thanfor the interpretation of emulsion inversion.The two-dimensional plot that is based on the varia-
tions of surfactant concentration and formulation(Fig.3b, see also Fig. 1b and Fig. 2b) is not very convenienteither because the effect of the WOR on the inversionlocus is missing too.The appropriate representation is thus the one which
gathers the effect of formulation and WOR(Fig. 3c). Itwas introduced for such purpose 25 years agow56x andis now used by most researchersw57–59x. In thisdiagram the line separating the regions where OyW andWyO morphologies are attained, which is called thestandard inversion locus, exhibits a stair case shape.This characteristic makes it very easy to interpret theeffects of formulation and wateryoil composition onemulsion type. In the middle of the diagram, i.e. forsystems containing similar amounts of oil and water(labeled as A regions) the inversion locus is horizontal.In this case, the emulsion morphology only depends onthe formulation, indicated by the sign(y or q) ofHLD. Contrariwise, the emulsion morphology is foundto be OyW on the right(respectively WyO on the left),where the system contains a large amount of water(respectively oil) in the B(respectively C) regions. Thistwo-dimensional representation exhibits some additionalfeatures. In the By and Cq regions, the formulationfavors one type of morphology whereas the WOR tendsto force the other type, which is the reason why theseregions have been so-called ‘abnormal’w56x.Actually, the conflict between the two effects if often
settled during the emulsification process by the forma-tion of a multiple emulsion, in which a small fractionof the continuous phase is inserted as droplets withindrops of the internal phase. As a rule of thumb, it canbe said that the most internal emulsion, i.e. droplets indrops, complies with the morphology required by theformulation (oyW in By and wyO in Cq), whereasthe most external one, i.e. drops in continuous phase,
obeys the compositional demand(WyO in By and OyW in Cq). As a consequence, the abnormal By(respectively Cq) region exhibits multiple oyWyO(respectively, wyOyW) emulsion morphologies. In themultiple emulsion label, the low case letter indicates the(usually small amount of) most internal phase.The importance of this formulation-WOR map is due
to the fact that, whatever the actual variable that isscanned to alter the formulationw60,61x, each region isassociated with an emulsion type,w56x as well as withwell-defined trends in other properties such as stability,drop size and viscosity. This is well documented else-where w62–64x, and it suffices to mention here that, ingeneral, SOW systems in the Ay and Aq regionsrender stable emulsions, while very unstable emulsionsare obtained in abnormal By and Cq regions, as wellas in a strip around HLDs0.The plots in Fig. 3 indicate that at WORs1, a change
in formulation produces the emulsion inversion, what-ever the surfactant concentration is. A HLD changefrom negative to positive results in a change in emulsionmorpholology from OyW to WyO, and conversely.The phenomenology is more complex when WOR is
quite different from unity, because it also depends onthe surfactant concentration. Fig. 4a,e indicate the stan-dard inversion line in the formulation–WOR plot at low(dashed line) and high(bold line) surfactant concentra-tions. It is seen that the location of the horizontal branchof the inversion line is unchanged, whereas the lateralvertical branches are shifted, so that the central regionA widens as the surfactant concentration is increasedw65x.Therefore, a change in surfactant concentration can
result in a change in emulsion type. For instance, theemulsion whose representative point in the formulation-WOR plot is located at the tip of the arrows in Fig. 4a,would be of the OyW type at low surfactant concentra-tion, i.e. on the right of the(dashed) inversion linevertical branch, whereas it would be of the WyO type,i.e. on the left of the(plain) inversion line verticalbranch at high surfactant concentration. Hence, it canbe said that at a high enough surfactant concentrationthe inversion would take place at HLDs0, as it is thecase at WORs1 (see Fig. 3). Fig. 4b indicates thesame phenomenology on the formulation–surfactantconcentration plot at WOR large enough to correspondto the zone in which the surfactant concentration shiftsthe vertical branch of the inversion line. At high surfac-tant concentration(plain inversion line and arrow) anincrease in HLD results in the emulsion inversion,whereas the emulsion remains OyW at low surfactantconcentration(dashed line and arrow). In the latter case,the emulsion actually becomes an abnormal wyOyWtype as HLD turns positive and departs from optimumformulation.

264 J.-L. Salager et al. / Advances in Colloid and Interface Science 108 –109 (2004) 259–272
Fig. 4. Standard inversion line in different two-dimensional plots. The bold arrows indicate a change in formulation in the direction of an increasein HLD at low (dashed arrow) and high(filled arrow) surfactant concentration. The light arrows indicate an increase in surfactant concentration.HSCshigh surfactant concentration; LSCslow surfactant concentration.
Fig. 5. Dynamic inversion patterns.
Fig. 4c and d exhibit the same result, this time on thetriangular diagram. It is seen that an increase in HLDresults in a change in emulsion type from OyW to WyO at high surfactant concentration(black circle) whileit is not the case at low surfactant concentration(whitecircle). In other terms it can be said that, in systemscontaining much more water than oil, an increase insurfactant concentration(light arrows in Fig. 4b,c,d)result in a change in the most external emulsion type atHLD)0 but not at HLD-0.Fig. 4f,g,h indicate a similar phenomenology in the
different types of diagrams, but this time when thesystem contains much more oil than water.As a general rule of thumb, it can be said that normal
emulsions are encountered near WORs1 and at highsurfactant concentration, whereas a low surfactant con-centration and a WOR very different from unity areconditions likely to be associated to the occurrence ofabnormal emulsions.
3.2. Dynamic inversion boundaries
So far we have discussed emulsion inversion patternsfor SOW systems at equilibrium. Transient effects com-plicate the phenomenology because emulsions canexhibit a delayed response, sometimes called memory,when they are altered according to some emulsificationprotocol, for instance by adding oil drop by drop as inmayonnaise home preparation. In such processes thepoint representing the emulsion is moved in the two-dimensionalythree-dimensional corresponding map, andthe emulsion is likely to switch type whenever the pointenters a different morphology region. This does not
happen always, and in some cases the change has to becarried out(far) beyond the crossing of the standardinversion locus, for a so-called dynamic inversion totake place. Hence, the dynamic inversion line positioncould depend on the direction of change, and if so thereare actually two dynamic inversion lines as seen in Fig.5a.Because of the delayed feature, the regions of the
map in between the two dynamic inversion lines exhibitone or the other morphology, depending on the way thechange is carried out. These regions are called hysteresisregions, according to the catastrophe theory model whichwas proposed to interpret the morphology changesw66–68x.The delayed inversion has been found to take place
mostly when the wateryoil ratio is changed far awayfrom optimum formulation, i.e. when HLD is quitedifferent from zero. This phenomenology can be ren-dered in the two representations which include thewateryoil composition variable. The hysteresis regionindicated in the ternary diagram shown in Fig. 5b,c hasa cusp shape and is asymmetrically placed with respectto the diagram. The vertex of the cusp is located at the

265J.-L. Salager et al. / Advances in Colloid and Interface Science 108 –109 (2004) 259–272
Fig. 6. Formulation–WOR map showing the hysteresis zones.
Fig. 7. Paths leading to dynamic emulsion inversion on a formulation–composition map.
critical point on the binodal boundary, and the widerpart of the cusp(at zero surfactant concentration) islocated in the middle of the OW sidew69,70x, providedthat one type of emulsion is not favored by physical ormechanical constraintsw71x. Hence, it can be said thatthe position and asymmetry of the hysteresis regionmostly depends on the formulation. It has been shownw68x that such a formulation effect cannot be renderedconveniently in a ternary diagram. The formulationyWOR plot is in this case the most convenient one sinceit gathers the two variables that most likely wouldtrigger the emulsion inversion upon changing. Fig. 6indicates the most general phenomenology which isdiscussed in details elsewherew68x. In this figure, thebold line stands for the standard inversion locus and theslanted light lines represent the dynamic inversionboundaries. As a general rule, the crossing of the verticalbranches of the inversion locus, so-called catastrophicinversion, exhibits a strong hysteresis(shaded region),which tends to increase when formulation departs fromHLDs0 w72x.Contrariwise, the crossing of the central horizontal
branch, so-called transitional inversion, takes place with-out hysteresisw68,72x, unless very special conditionsoccur, such as the formation of a lamellar mesophasethat encapsulates newly formed dropletsw73x.The effect of other variables can be easily incorpo-
rated in this formulation–WOR diagram. Increasingsurfactant concentration has been found to widen thecentral A region, as well as the extension of thehysteresis zonesw65x, whereas an increase in stirringenergy does just the oppositew74x. The effect of othervariables related to the emulsification protocol has beenrecently reported in detailw75–77x. The increase in theviscosity of one of the phase tends to reduce theextension of the A region in which this increasedviscosity phase is normally the external phasew56,72,78x. This trend is consistent with the usualtendency of the stirring process, which is, in absence offormulation effects, to disperse the most viscous phasewithin the less viscous one.
4. Dynamic inversion as a way to prepare emulsions
4.1. Characteristics of transitional and catastrophicinversion processes
There are several ways to dynamically invert anemulsion, which may be categorized by the positionwhere the inversion locus is crossed or the way theinversion is triggered. Of paramount importance arekinetic considerations related to the lumpwise or contin-uous addition of the internal phase, and the flow rate atwhich such phase is added. These ways are illustratedon the formulation–composition map in Fig. 7. Forsimplicity, only the dynamic inversion lines have beenindicatedw72x.The first type of dynamic inversion is the so-called
transitional inversion in which a change in formulationor temperature is applied to the system(maintainedunder stirring) so that the horizontal branch of theinversion locus is crossed. This path of change, indicatedas arrows�1 in Fig. 7, undergoes through a lowinterfacial tension region near HLDs0, so that fineemulsions are produced. However, the HLDs0 regionis also characterized by rapid coalescence of droplets.The resulting drop sizes are significantly affected bykinetic considerations, particularly the rate of change ofthe formulation or temperaturew79–82x.The second type is the so-called catastrophic inversion
in which a change in WOR to increase the internalphase content triggers the inversion. There are twodifferent cases, i.e. from a normal region to an abnormalone(arrows�2 and 3), or conversely from an abnormalregion to a normal one(arrows�4 and 5).In the normal-to-abnormal inversion(arrows�2 and
3), a stable emulsion belonging to the region A reachesa composition at which drops are close-packed and startbeing highly deformed under shear. If the protocol thatis adopted to add internal phase maintains homogeneityat a small scale, the internal phase content is likely toincrease up to a very high value without inversion, asin mayonnaise home preparation. In layman terms, itcan be said that the formulation opposes the inversion.

266 J.-L. Salager et al. / Advances in Colloid and Interface Science 108 –109 (2004) 259–272
Fig. 8. Three-dimensional mapping showing the effect of surfactantconcentration and stirring energy on the inversion locus.
This is particularly the case when the formulation is faraway from HLDs0, in which instance the hysteresisregion can be broadened very significantly(arrows�3).Moreover, the high viscosity of high-internal-phase-ratioemulsions generally favors a very efficient emulsifica-tion of the added phase with low energy input. It seemsthat inversion from normal to abnormal emulsion islikely to occur only if a local WOR condition favorsthe formation of a certain volume of the added phase asexternal phase, for instance by lumpwise addition insteadof continuous addition.In the inversion from abnormal to normal morphology
(arrows �4 and 5) the situation is opposite and theformulation helps the inversion to take place. Let usdiscuss it in the case of the path from By to Ayregions, when water is added to an oil phase in formu-lation conditions corresponding to HLD-0 (arrow�4).In most cases the initial WyO abnormal emulsion is orrapidly becomes a multiple emulsion oyWyO, as expect-ed in the By region w72,83,84x. This multiple emulsionalready contains an oyW ‘seed’ of the future invertedemulsion as ‘o’ droplets inside W drops. The insertionof ‘o’ droplets inside the W drops depends on differentconditions, particularly the surfactant concentration, thestirring energy and the phase viscosityw85x. As more‘o’ droplets enter the W drops, the latter become swollenand the apparent internal phase ratio of the WyOexternal emulsion can be much higher than the overallone. Since this WyO external emulsion is unstable, theinversion takes place when the apparent internal phasecontent approaches the close packing value, says approx-imately 70% of apparent water, which is the sum of Wand ‘o’ phases. It is worth noting that this can happenas soon as 10 or 20% of added W phase if the conditionsare favorable to incorporate a large amount of ‘o’droplets inside W drops. Contrariwise, the abnormal tonormal inversion can be delayed quite a lot in conditionswhere the oyWyO multiple emulsion occurrence are notfavored, for instance if the aqueous phase is made soviscous that the oyW morphology is inhibitedw72x.
4.2. Other inversion protocols
A third type of inversion is the combination of thetwo previous cases, in which concomitant changes informulation (or temperature) and WOR are mergedalong the path of change(arrows� 6 and 7). In mostinstances these combined paths result in an inversionphenomenology, which falls into one of the previouscases. A particular situation may be attained if the pathcrosses the inversion line just at the point where thecatastrophic and transition branches met(arrow � 7).In such a case a normal emulsion can be inverted intoanother normal emulsion with a change in both formu-lation and WOR. In this case, both transitional andcatastrophic inversions are overlapping when HLDs0
is crossed and some synergistic effects can be attained,particularly the formation of extremely small dropsw86x.The addition of a third degree of freedom to the two-
dimensional formulation–WOR mapping allows torationalize other experimentally known inversion cir-cumstances. The inversion locus surface in the three-dimensional mapping has the aspect shown in Fig. 8w72x in which surfactant concentration increases down-ward and stirring energy upward. Because of the slantingof the ByyAy and AqyCq surface portions, theycan be crossed by a vertical displacement, i.e. a changein surfactant concentration or stirring energy, as dis-cussed in recent papersw87,88x.These cases have been recognized to correspond to
two known phenomena: the inversion of a heavy crudeoil emulsion in water when it is submitted to high speedstirring (upward arrow�1 in Fig. 8) w89,90x and therecovery of failed mayonnaise by adding egg yolk andmustard, e g. increasing surfactant concentration(down-ward arrow�2). The first case is a normal to abnormalinversion, whereas the second case is the opposite.
4.3. Additional effects and occurrences
The previously mentioned phenomenology explainsqualitatively how changes in formulation, WOR, surfac-tant concentration and stirring result in emulsion inver-sion. These trends can be enhanced or inhibited, ormodified quantitatively by other effects that alter themechanisms taking place before, during, or afterinversion.The phase viscosity has a systematic influence on the
emulsion type, because it is easier to disperse a viscousliquid in another, less viscous liquid than the opposite.Changing the viscosity can shift the inversion boundaryin a favorable or unfavorable way. This is importantbecause it can alter the way a process is carried out.For instance, if an OyW emulsion with a viscousaqueous phase is to be prepared, it might be advanta-geous to make it first with a low viscosity aqueousphase and add a viscosity-boosting agent afterward.Drop sizes can change more or less quickly depending
on the position of the emulsion on the formulation–WOR map. If an external change takes place at a

267J.-L. Salager et al. / Advances in Colloid and Interface Science 108 –109 (2004) 259–272
Fig. 9. Formation of nanoemulsions via multiple crossings of the opti-mum formulation region.
timescale that is much shorter than that of disruptionycoalescence of drops, some properties can be frozen orquenched. For instance, a fine drop emulsion preparedin the A region near HLDs0, is known to be ratherunstable w64,91x. A quick change in formulation ortemperature that shifts the representative point deepinside the A region at HLD40 or <0 would easilyincrease the stability thousand times or more.The presence of a lamellar liquid crystal instead of a
microemulsion in the three-phase system occurring nearHLDs0, could result in the encapsulation of the drop-lets and thus in their stabilization by steric hindrancew24,92–96x.The initial location of the stirrer inside the oil or
water phase can produce a local increase or decrease ofthe WOR and thus can result in a morphology differentfrom the one expected for the global WOR of thesystem. This opposite emulsion type can be perpetuated,thanks to the memory feature. In this case, the agreementwith the general phenomenology can be maintained byusing the local WOR conceptw71x.The relative stability of the internal and external
emulsions in a multiple emulsion can be altered byusing two surfactants, which would not be able to mix.The proposed solution has been to use a low molecularweight surfactant to stabilize the internal emulsion, anda high molecular weight polymeric amphiphile to sta-bilize the external onew97x. In such a case, the situationof a multiple emulsion can be represented by twodifferent points in the two-dimensional formulation–WOR diagram, one for the internal emulsion and anotherfor the external onew71x. As in simple emulsions, aliquid crystal can be used to provide a steric protectionagainst coalescence for multiple emulsionsw98x.Before proceeding any further, it is worth noting that
the above-mentioned association between emulsion mor-phology, phase behavior and WOR corresponds to sys-tems which are equilibrated from the physico-chemicalpoint of view, i.e. systems in which there are thermo-dynamic arguments to link the phase behavior and theemulsion phase inversionw99,100x. In many instances,the emulsion inversion is accompanied by the transientmass transfer of the surfactant from one phase to theother. In such instance, some time might be needed forthe surfactant to partition between the phases, or at leastfor a pseudo-equilibration to take place. It was recentlyshown that the mass transfer ratew101x and the timethat the SOW system remains in contact prior to emul-sification could affect the emulsion morphology. Theapparent equilibration time was found to considerablydecrease when the HLD value approaches zerow102x.Far from HLDs0, memory effects are more likely totake place. Even more complex situations arise when aspontaneous emulsification process is involvedw103–108x.
Although it is surely impressive, this listing of effectsis probably not exhaustive, but it indicates that a lot oftrade-offs and tricks can be added to fine tune thegeneral phenomenological trends.
5. Examples of inversion processes in industry
Some of the following examples are very importantfrom the industrial point of view, whereas others mightbe less relevant. In any case, they were selected toillustrate with practical examples the different cases ofinversion that were discussed previously.
5.1. Fine emulsion preparation by thermal phase inver-sion (PIT method)
This is probably the best-known phase inversionprocess, generally called the phase inversion temperature(PIT) method, as named by Shinoda and coworkerswho introduced it w32,47,79,109,110x. The methodworks with a surfactant system which is temperaturesensitive, generally a non-ionic surfactant of the polye-thoxylated type that becomes less hydrophilic as tem-perature increases and conversely.In this emulsification method, which is of the transi-
tional inversion type, a temperature scan is applied to astirred SOW system so that the temperature passesthrough the so-called HLB temperaturew111x which isthe temperature at which HLDs0 according to Eq.(3).It is not strictly always the temperature at which theemulsion inverts, since the latter often depends on theWOR and surfactant concentration, but it is very closeto it in most casesw60x.Near HLDs0 the system exhibits a single phase
microemulsion or liquid crystal phase behavior, providedthat the surfactant concentration is high enough, say 10wt.%. As the temperature departs from HLDs0, thebicontinuous microemulsion becomes a two phase sys-tem according to a spinodal decomposition process inwhich tiny droplets of an excess oil or water phase areexuded. If no special care is taken, these nanodropscoalesce to form a macroemulsion with drops in the 1–10 mm range and beyond. If there is a large amount ofsurfactant andyor if some liquid crystal structure areformed near HLDs0 (Fig. 9), then the nanoemulsion

268 J.-L. Salager et al. / Advances in Colloid and Interface Science 108 –109 (2004) 259–272
does not coalesce immediately and the droplet sizeremains in the 50–100 nm range while the HLD ismoved away from the unstable region. At some distancefrom HLDs0, says 258C either above or below it, theemulsion enters one of the Aq or Ay stable regionsand the nanoemulsion becomes definitively stable. Asindicated in Fig. 9, the method works either by heatingor by cooling, with a final emulsion, which is, respec-tively, WyO or OyW. In some cases the method isperformed with two consecutive crossings of the bal-anced HLD regionw112x, starting in one direction ofchange, and then returning back for the formation of thenanoemulsion.The crossing of a single phase region is critical, which
is why the method is generally used with a high oilcontent and relatively high surfactant concentration, sothat the single phase wedge located in Fig. 9 plots iscrossed. If the WOR is taken near unity, either a muchhigher surfactant concentration has to be used, or athree-phase behavior is attained near HLDs0. In sucha case the phase behavior near HLDs0 exhibits amicroemulsion and two excess phases, and the finalemulsified system contains tiny drops produced by themicroemulsion decomposition as well as large dropsproduced by the stirringw113,114x.The PIT method has been used for years to produce
nanoemulsions for different purposes, such as cosmeticformulas, fermentation nutrient emulsions, intravenousfeeding, etc.w115–118x. One of the difficulties is thatpolyethoxylated surfactants are generally a mixture ofwidely different oligomers, and thus exhibit an optimumformulation shift with concentration, which has beenexplained as the result of a fractionation processw119x.This means that the gamma or fish diagrams are quiteslanted in practice. Nevertheless, the only serious draw-back is the required high surfactant concentration, asidethe fact that the method can be applied neither to ionicsurfactants nor to non-ionics of the glucoside type,which are not very sensitive to temperature.
5.2. Emulsification by formulation-induced inversion
The formulation-induced inversion essentially followsthe same principle as the previous method, but in thiscase the formulation is changed by adding a substancethat is able to modify the HLD of the system, i.e. anelectrolyte, a surfactant, an alcohol, or an oil.This can be done by adding a concentrated solution
miscible with the external phase of the initial emulsion.In such a case the formulation change is often quick,particularly if alcohol is present. However, it is worthnoting that alcohols, particularly the C3–C4 primaryand secondary alcohols, tend to adsorb at the interfaces,and also to displace the surfactant molecules. Theydecrease the surfactant adsorption and inhibit the for-
mation of liquid crystals, and consequently tend toreduce the emulsion stability.In absence of alcohol, the mass transfer is slower and
in some cases the transitional inversion has been foundto exhibit a slight hysteresisw73x. The same wouldhappen if a liquid crystalline phase is produced asdiscussed above.This formulation-induced inversion has some advan-
tages over its thermal counterpart: it is more general, itdoes not require a temperature sensitive surfactant, andit does not imply a temperature change and the associ-ated eventuality of thermal degradation. Its main incon-venience is that some of the changes can be appliedonly in one direction, e.g. salinity can be increased byadding a small amount of concentrated brine, but itcannot be decreased without considerably changing theWOR. This method has been used in the lifting of heavycrude oil by downhole injection of an aqueous solutionof a non-ionic surfactant, which result in an OyW lowviscosity emulsion instead of the usual WyO one. In thecrude oil dehydration process, the same principle isapplied, this time by adding the hydrophilic surfactantto the oil continuous phase and stopping the formulationscan at HLDs0 where the emulsion would breakw120,121x. This method was recently proposed as wellfor the preparation of cosmetic emulsionsw122x.
5.3. Oil emulsification by catastrophic inversion
The catastrophic inversion method is used in manyinstances of industrial processes, particularly when theoil phase is an extremely viscous fluid(such as alkydor epoxy resins, or polydimethylsilicone oils), whichmust be dispersed in water, for instance for paintmanufacturing or hydrophobic treatment in constructionoperationsw93,123–126x. Because of the extreme vis-cosity of the oil phase, a conventional stirring processis likely to be quite inefficient in producing smalldroplets. The inversion technique essentially consists inadding water little by little to the oil phase, while aslow motion mixing is applied. In most cases thesurfactant is hydrophilic and initially dissolved or dis-persed in the oil phase. In some instances, as in theorimulsion manufacturingw127x or in silicon oil emul-�
sification w93x, the surfactant is located in the addedwater.If the chosen surfactant renders a negative HLD, an
inversion from abnormal WyO emulsion to normal OyW emulsion would typically take place. It is worthnoting that in this case several factors contribute toproduce an OyW morphology and thus facilitate inver-sion. Firstly, the formulation favors the OyW morphol-ogy curvature at interface. Secondly, the slow stirringmotion required by the high viscosity oil phase tends toshift the ByyAy inversion locus branch to the left,thus reducing the extension of the By region. Finally,

269J.-L. Salager et al. / Advances in Colloid and Interface Science 108 –109 (2004) 259–272
Fig. 10. Inversion from abnormal to normal morphology with theoccurrence of a high internal phase ratio multiple emulsion.
the high viscosity of the oil tends to favor the dispersionof the oil in water, i.e. the occurrence of the oyWinternal emulsion in the oyWyO multiple emulsion inthe By region. A consequence of these effects is thatthe ‘apparent’ internal phase content of the WyO emul-sion increases very quickly because the small ‘o’ dropletvolume is accounted in the apparent W phase volumew77x. It means that inversion can take place only after avery small amount of water, say 10%, is added accordingto the mechanism illustrated in Fig. 10 for the pathalong the arrows. It also implies that the invertedemulsion, i.e. the normal OyW emulsion, will exhibitvery high internal phase content, e.g. 90%, and will beextremely viscous. Additionally, this suggests that anyresidual big oil drop will be crushed by the so-calledlow shear mechanism discussed elsewherew64,128–130xwhich is the main reason why a drop of oil poured in abowl filled with mayonnaise is very easily emulsifiedby a few turns of a spoon. In practice, the final OyWemulsion drop size seems to be logically linked toseveral factors: the addition protocol, the internal phaseratio after inversion, and the formulation and itsconsequences.If the inversion takes place very early, it is because a
lot of ‘o’ oil droplets are emulsified inside of the Wdrops. Even if the W drops are sheared, the ‘o’ dropletswill not coalesce because the formulation stabilizesthem. Thus, more and more ‘o’ droplets could beincorporated in the W drops. This would be favouredby the combination of a slow addition of water andprolonged low energy stirringw131x. As mixing goes onmore and more ‘o’ droplets are inserted in the W dropsand the oyW emulsion becomes a very high internalphase ratio system and the low energy stirring contributein making smaller ‘o’ droplets. At the same time theapparent W internal phase content increases. Finally, theW drops critical packing condition is attained and theinversion is triggeredw77x. The residual oil coming fromfilms between the W drops just before inversion couldresult in large oil drops, which are quickly reduced insize because of the high viscosity of the mediumw132,133x.If the formulation is relatively close to HLDs0,
additional effects have to be considered. First, theinterfacial tension could become very low, down to the
mNym range, and the shear would be extremely effectivein producing an extreme elongation of the dropletsbefore the Taylor breakage takes place, thus resulting inmini or nanoemulsions. However, the region nearHLDs0 is also associated with rapid coalescence, andthe tiny droplets are thus likely to quickly merge intolarger ones. This would not happen if a liquid crystal,generally a lamellar type to match the zero curvatureinterfacial condition prevailing at HLDs0, is able toencapsulate the formed droplets and to produce a stericprotection against coalescence as mentioned abovew24,134x. The presence of a liquid crystal, instead of abicountinuous microemulsion, is not, however, sufficientto insure the encapsulation of the oil droplet, as recentlyshown w96x. Actually, the process should warrant thatthe liquid crystal would end up surrounding the oildrops. This is why the inversion has to take place aftervery little water is added, so that the water phase collecta large amount of surfactant and becomes a liquidcrystal before or when the inversion takes placew93x.Then, the oil droplets are surrounded by liquid crystallayer(s). When more water is added an excess waterphase appear in equilibrium with the oil phase and theliquid crystal phase, a part of which is still surroundingthe oil droplets. Such a stabilization would not happensif the emulsification is carried out after the system isequilibrated, because the encapsulation of the drop bythe liquid crystal phase would not be warrantedw96x.
5.4. Combined inversion
When the surfactant is a mixture, fractionation phe-nomena can take place, in which the interfacial formu-lation, i.e. the relative amounts of surfactant species atinterface, has been shown to vary with both the WORand total surfactant concentrationw119x. This effect isnot very serious with ionic surfactants, but can becomepredominant with ethoxylated non-ionic ones, particu-larly at high temperature and with polar or aromatic oilsw135,136x. This means that a change in composition, i.e.a move in a ternary diagram, can indirectly produce achange in formulation. This is by the way why thethree-phase behavior region in formulation–compositiondiagram appears to be slanted in many casesw50x.Another way to produce a combined inversion is to
alter both formulation(or temperature) and WOR con-comitantly, so that the protocol path in a formulation–WOR map is neither vertical nor horizontal, but skewedw92,97,137x.A particularly efficient way of emulsifying by phase
inversion was recently found to cross the inversion locusjust at the point were its horizontal and vertical branchesmerge, so that the features exhibited by both inversionmethods are accumulatedw86x.

270 J.-L. Salager et al. / Advances in Colloid and Interface Science 108 –109 (2004) 259–272
Fig. 11. Formulation–WOR path of cutting oil in use.
5.5. Cutting or laminating oil action—a combined inver-sion process
A cutting oil is generally a low internal phase contentOyW emulsionw138,139x. Its role is to both cool downand lubricate the area where a hard steel bit or tool isin contact with a metal part in a lathe or other powertool. A similar situation arises during the lamination ofa metal slab that passes in between two rolling cylinderson which an extremely high pressure is applied. In thiscase, the laminating emulsion should release the oil towet the metal surface for lubrication purpose, whereasthe water phase evaporates or drains away.In both cases the low oil content OyW emulsion must
invert into a WyO emulsion to perform its duty. Suchemulsions are generally made with non-ionic surfactantsand a long chain hydrophobic alcohol co-surfactantw138x. At ambient temperature their representative pointis located in the C- region. When the emulsion is appliedat the friction point the increase in temperature resultsin two effects.First a large amount of water evaporates and the
internal phase content, i.e. the oil proportion, increases,thus moving the representative point toward the left, i.e.towards the A- region in the direction of arrow�1 inFig. 11.Secondly, the HLD increases because of the non-ionic
character of the surfactant, and the formulation movesupward in the map, i.e. towards the Cq region asindicated by arrow�2 in Fig. 11. Finally, the increasein temperature reduces the oil phase viscosity and thusfacilitates the occurrence of a WyO emulsion by shiftingthe AqyCq branch of the inversion locus to the rightas indicated by arrow�3 in Fig. 11. All these effectscombine together to produce the inversion from an OyW emulsion in the Cy region to a WyO one in theAq region. Once the emulsion is of the WyO type, theoil phase easily wet the metallic surfaces to insurelubrication. The role of the lipophilic alcohol is not veryclear, but some effects can be conjectured. First, theevaporation of water would increase the relative concen-tration of alcohol in the system, thus increasing thelipophilic character of the surfactant plus alcohol mix-ture. However, the alcohol increases the polarity of theoil phase and could help improving the wettability of
the metal surface by oil. Finally, the alcohol could playa role in avoiding liquid crystal formation in cutting orlaminating oil concentrates, which are microemulsionsystems containing a small amount of waterw138x.
6. Conclusion
Emulsion inversion is no longer a mysterious anduncontrollable instability process. Current know-howallows building a whole picture that describes most ofthe phenomena taking place during inversion, includingwhen and in what circumstances they would occur. Thehandling of emulsion inversion in two-dimensionalythree-dimensional maps, particularly those proposed bythe catastrophe theory model, allows harnessing emul-sion inversion as a useful industrial tool for emulsionmaking. Emulsion inversion is particularly useful whenthe final emulsion is subject to specifications that arenot attainable with more conventional emulsificationmethods, as for instance in the case of tiny droplets ofvery viscous oils.
Acknowledgments
The authors would like to express their appreciationfor the financial support provided by their UniversityResearch Council(CDCHT-ULA) and by the Venezue-lan National Research Fund(FONACIT-MCT) PCPProgram and Grants AP-97-3719, F-2000-1629 and S1-2001-1156, to Lab. FIRP Emulsion Science ResearchProject at University of The Andes.
References
w1x S. Friberg, L. Mandell, J. Pharm. Sci. 59(1970) 1001.w2x P.G. de Gennes, The Physics of Liquid Crystals, Oxford Press,
UK, 1974.w3x J.C. Lang, R.D. Morgan, J. Chem. Phys. 73(1980) 5849.w4x D.J. Mitchell, G.J.T. Tiddy, L. Waring, T. Bostock, M.P.
Mcdonald, J. Chem. Soc. Faraday Trans. 79(1981) 975.w5x H. Kunieda, J. Colloid Interface Sci. 114(1986) 378.w6x M. Bourrel, R.S. Schechter, Microemulsions and Related Sys-
tems, M. Dekker, New York, 1988.w7x R. Laughlin, The Aqueous Phase Behavior of Surfactants,
Academic Press, London, 1994.w8x M.A. De Tk, Adv. Colloid Interface Sci. 59(1995) 95.w9x M. Bourrel, A. Graciaa, R.S. Schechter, W.H. Wade, J. Colloid
Interface Sci. 72(1979) 161.w10x J.L. Salager, L. Quintero, E. Ramos, J. Anderez, J. Colloid´
Interface Sci. 77(1980) 288.w11x L.M. Baldauf, R.S. Schechter, W.H. Wade, A. Graciaa, J.
Colloid Interface Sci. 85(1982) 187.w12x D.O. Shah, R.S. Schechter(Eds.), Improved Oil Recovery by
Surfactant and Polymer Flooding, Academic Press, New York,1977.
w13x J.L. Salager, I. Loaiza-Maldonado, M. Minana-Perez, F. Silva,˜J. Disper. Sci. Technol. 3(1982) 279.
w14x B.P. Binks, W.G. Cho, P.D.I. Fletcher, D.N. Petsev, Langmuir16 (2000) 1025.

271J.-L. Salager et al. / Advances in Colloid and Interface Science 108 –109 (2004) 259–272
w15x R.E. Anton, J.L. Salager, J. Colloid Interface Sci. 111(1986)´54.
w16x R.D. Hazlett, R.S. Schechter, Colloid Surface A: Physicochem.Eng. Aspects 29(1988) 53.
w17x A. Kabalnov, H.J. Wennerstrom, Langmuir 12(1996) 276.¨w18x E. Ruckenstein, Adv. Colloid Interface Sci. 79(1999) 59.w19x J.M. Lee, H.J. Shin, K.H. Lim, J. Colloid Interface Sci. 257
(2003) 344.w20x W. Arnold, MS Thesis, University of Texas at Austin, 1977.w21x T. Suzuki, H. Takei, S. Yamazaki, J. Colloid Interface Sci. 129
(1989) 491.w22x H. Sagitani, J. Disper. Sci. Technology 9(1988) 115.w23x J. Rouviere, Inform. Chimie 325(1991) 158.`w24x J. Rouviere, J.L. Razakarison, J. Marignan, B. Brun, J. Colloid`
Interface Sci. 133(1989) 293.w25x A. Forgiarini, J. Esquena, C. Gonzalez, C. Solans, Prog. Colloid´
Polym. Sci 118(2001) 184.w26x S.E. Friberg, L. Mandell, M. Larsson, J. Colloid Interface Sci.
29 (1969) 155.w27x W.H. Wade, J. Morgan, J. Jacobson, J.L. Salager, R.S. Schech-
ter, Soc. Petrol. Eng. J. 18(1978) 242.w28x W. Ostwald, Kolloid Z. 6(1910) 103.w29x W.D. Bancroft, J. Phys. Chem. 17(1913) 501.w30x W.D. Bancroft, J. Phys. Chem. 19(1915) 275.w31x P. Winsor, Solvent Properties of Amphiphilic Compounds,
Butterworth London, 1954.w32x K. Shinoda, H. Arai, J. Phys. Chem. 68(1964) 3485.w33x J.L. Salager, J. Morgan, R.S. Schechter, W.H. Wade, E. Vas-
quez, Soc. Petrol. Eng. J. 19(1979) 107.w34x M. Bourrel, J.L. Salager, R.S. Schechter, W.H. Wade, J. Colloid
Interface Sci. 75(1980) 451.w35x J.L. Salager, in: F. Nielloud, G. Marti-Mestres(Eds.), Phar-
maceutical Emulsions and Suspensions, M. Dekker, New York,2000, Chapter 2.
w36x J.L. Salager, N. Marquez, A. Graciaa, J. Lachaise, Langmuir´16 (2000) 5534.
w37x J.L. Salager, R.E. Anton, J.M. Anderez, J.M., Aubry, Tech-´ ´niques de l’Ingenieur, Paris France. Vol. Genie des Procedes´ ´ ´ ´(J2), 2001(Chapter 157).
w38x R.E. Anton, N. Garces, A. Yajure, J. Disper. Sci. Technol. 18´ ´(1997) 539.
w39x M. Hayes, M. Bourrel, M. El-Emary, R.S. Schechter, W.H.Wade, Soc. Petrol. Eng. J. 19(1979) 349.
w40x M. Bourrel, C. Koukounis, R.S. Schechter, W.H. Wade, J.Disper. Sci. Technol. 1(1980) 13.
w41x A. Skauge, P. Fotland, SPE Reservoir Eng, Nov. 1990, 601.w42x J.L. Salager, in: G. Broze(Ed.), Handbook of Detergents-part
A: Properties, Marcel Dekker, New York, 1999, Chapter 8.w43x J.L. Salager, R.E. Anton, in: P. Kumar, K.L. Mittal(Eds.),´
Handbook of Microemulsions Science and Technology, MarcelDekker, New York, 1999, Chapter 8.
w44x W.C. Griffin, J. Soc. Cosmet. Chem. 1(1949) 311.w45x W.C. Griffin, J. Soc. Cosmet. Chem. 5(1954) 249.w46x H. Arai, K. Shinoda, J. Colloid Interface Sci. 25(1967) 396.w47x K. Shinoda, H. Kunieda, in: P. Becher(Ed.), Encyclopedia of
Emulsion Technology, 1, M. Dekker, New York, 1985, Chapter5.
w48x P. Fotland, A. Skauge, J. Disper. Sci. Technol. 7(1986) 563.w49x P.A. Psathas, S.R.P. da Rochas, C.T. Lee, K. Johnston, K.T.
Lim, S. Weber, Ind. Eng. Chem. Res. 39(2000) 2655.w50x M. Bourrel, C. Chambu, R.S. Schechter, W.H. Wade, Soc.
Petrol. Eng. J. 22(1982) 28.w51x M. Bourrel, C. Chambu, Soc. Petrol. Eng. J. 23(1983) 327.w52x M. Kahlweit, J. Colloid Interface Sci. 90(1982) 197.
w53x M. Kahlweit, E. Lessner, R. Strey, J. Phys. Chem. 88(1984)1937.
w54x M. Kahlweit, R. Strey, D. Haase, J. Phys. Chem. 89(1985)163.
w55x E.S. Rudolph, M.A. Cacao Pedroso, Th.W. de Loos, J.¸de Swaan Aruns, J. Phys. Chem. B 101(1997) 3914.
w56x J.L. Salager, M. Minana-Perez, M. Perez-Sanchez, M. Ramirez-˜Gouveia, C.I. Rojas, J. Disper. Sci. Technol. 4(1983) 313.
w57x H.T. Davis, Colloid Surface A: Physicochem. Eng. Aspects 91(1994) 9.
w58x B.W. Brooks, H.N. Richmond, Colloid Surface A: Physico-chem. Eng. Aspects 58(1991) 131.
w59x B.W. Brooks, H.N. Richmond, Chem. Eng. Sci. 49(1994)1053.
w60x R.E. Anton, P. Castillo, J.L. Salager, J. Disper. Sci. Technol. 7´(1986) 319.
w61x Z. Mendez, R.E. Anton, J.L. Salager, J. Disper. Sci. Technol.´ ´20 (1999) 883.
w62x M. Minana, P. Jarry, M. Perez, M. Ramirez, J.L. Salager, J.˜ ´Disper. Sci. Technol. 7(1986) 331.
w63x J.L. Salager, in: F. Nielloud, G. Marti-Mestres(Eds.), Phar-maceutical Emulsions and Suspensions, M. Dekker, New York,2000, Chapter 3.
w64x M. Perez, N. Zambrano, M. Ramirez, E. Tyrode, J.L. Salager,´J. Disper. Sci. Technol. 23(2002) 55.
w65x F. Silva, A. Pena, M. Minana, J.L. Salager, Colloid Surface A:˜ ˜Physicochem. Eng. Aspects 132(1998) 221.
w66x E. Dickinson, J. Colloid Interface Sci. 84(1981) 284.w67x J.L. Salager, in: K.L. Mittal, P. Bothorel(Eds.), Surfactants in
Solution, 4, Plenum Press, New York, 1987, p. 439.w68x J.L. Salager, in: P. Becher(Ed.), Encyclopedia of Emulsion
Technology, 3, M. Dekker, New York, 1988, Chapter 3.w69x D.H. Smith, K.H. Lim, J. Phys. Chem. 94(1990) 3746.w70x D.H. Smith, K.H. Lim, Langmuir 6(1990) 1071.w71x S.E. Salager, E. Tyrode, M.T. Celis, J.L. Salager, Ind. Eng.
Chem. Res. 40(2001) 4808.w72x J.L. Salager, L. Marquez, A. Pena, M.J. Rondon, F. Silva, E.´ ˜ ´
Tyrode, Ind. Eng. Chem. Res. 39(2000) 2665.w73x L. Marquez, A. Graciaa, J. Lachaise, J.L. Salager, N. Zambrano,
Polym. Int. 52(2003) 590.w74x A. Pena, J.L. Salager, Colloid Surface A: Physicochem. Eng.˜
Aspects 181(2001) 319.w75x N. Zambrano, E. Tyrode, I. Mira, L. Marquez, M.P. Rodriguez,´
J.L. Salager, Ind. Eng. Chem. Res. 42(2003) 50.w76x I. Mira, N. Zambrano, E. Tyrode, L. Marquez, A. Pena, A.´ ˜
Pizzino, et al., Ind. Eng. Chem. Res. 42(2003) 57.w77x E. Tyrode, I. Mira, N. Zambrano, L. Marquez, M. Rondon,´ ´
J.L. Salager, Ind. Eng. Chem. Res. 42(2003) 4311.w78x J.L. Salager, G. Lopez-Castellanos, M. Minana-Perez, J. Disper.˜ ´
Sci. Technol. 11(1990) 397.w79x K. Shinoda, H. Saito, J. Colloid Interface Sci. 26(1968) 70.w80x H. Kunieda, H. Fukui, H. Uchiyama, C. Solans, Langmuir 12
(1996) 2136.w81x E. Sing, A. Graciaa, J. Lachaise, P. Brochette, J.L. Salager,
Colloid Surface A: Physicochem. Eng. Aspects 152(1999) 31.w82x Y. Katsumoto, H. Ushik, B. Mendiboure, A. Graciaa, J.
Lachaise, Colloid Polym. Sci. 278(2000) 905.w83x L. Marquez, doctoral dissertation, U. Pau-France and U. of the´
Andes, Merida-Venezuela, 2001.´w84x L. Marquez, R.E. Anton, A. Graciaa, J. Lachaise, M. Rondon-´ ´ ´
Gonzalez, J.L. Salager, 14th Surfactants in Solution Symposi-um, Barcelona, Spain, June 9–14, 2002.
w85x J.M. Lee, K.H. Lim, D. Smith, Langmuir 18(2002) 7334.w86x L. Marquez, A. Graciaa, J. Lachaise and J.L. Salager, 3rd
World Congress on Emulsion, CD Proceedings paper� 1F-180. Lyon France, Sept. 24–27, 2002.

272 J.-L. Salager et al. / Advances in Colloid and Interface Science 108 –109 (2004) 259–272
w87x J.L. Salager, L. Marquez, I. Mira, A. Pena, E. Tyrode, N.´ ˜Zambrano, in: K.L. Mittal, D.O. Shah(Eds.), Adsorption andAggregation of Surfactants in Solution, M. Dekker, New York,2002, Chapter 24.
w88x J.L. Salager, R.E. Anton, M.I. Briceno, L. Choplin, L. Marquez,´ ˜ ´Polym. Int. 52(2003) 471.
w89x J.L. Salager, M.I. Briceno, C.L. Bracho, in: J. Sjoblom(Ed.),˜ ¨Encyclopedic Handbook of Emulsion Technology, Marcel Dek-ker, New York, 2001, Chapter 20.
w90x G.A. Nunez, M.I. Briceno, C. Mata, H. Rivas, J. Rheology 40˜ ˜(1996) 405.
w91x J.L. Salager, M. Perez-Sanchez, Y. Garcia, Colloid Polym. Sci.´ ´274 (1996) 81.
w92x H. Sagitani, J. Am. Oil Chem. Soc. 58(1981) 738.w93x G. Guerin, 2nd World Congress on Emulsion, Bordeaux,´
France, Sept. 1997.w94x A. Forgiarini, J. Esquena, C. Solans, Progr. Colloid Polym.
Sci. 115(2000) 36.w95x C. Solans, R. Pons, S. Zhu, H.T. Davis, D.F. Evans, K.
Nakamura, et al., Langmuir 9(1993) 1479.w96x A. Forgiarini, J. Esquena, C. Gonzalez, C. Solans, Langmuir
17 (2001) 2076.w97x C. Py, J. Rouviere, Th.F. Tadros, M.C. Taelman, P. Loll,`
Colloids Surfaces A: Physicochem. Eng. Aspects 91(1994)215.
w98x D.R. Kavaliunas, S.G. Frank, J. Colloid Interface Sci. 66(1978) 586.
w99x E. Dickinson, J. Colloid Interface Sci. 87(1982) 416.w100x J.L. Salager, J. Colloid Interface Sci. 105(1985) 21.w101x L. Fillous, A. Cardenas, J. Rouviere, J.L. Salager, J. Surfactants
Deterg. 3(1999) 303.w102x J.L. Salager, N. Moreno, R.E. Anton, S. Marfisi, Langmuir 18´
(2002) 607.w103x C. Miller, Colloid Surface A: Physcochem. Eng. Aspects 29
(1988) 89.w104x M. El-Aasser, C. Lack, J. Vanderhoff, F. Fowkes, Colloid
Surface A: Physcochem. Eng. Aspects 29(1988) 103.w105x R.J. Goetz, M.S. El-Aasser, Langmuir 6(1990) 132.w106x T. Nishimi, C.A. Miller, J. Colloid Interface Sci. 237(2001)
259.w107x C.A. Miller, J. Cosmet. Sci. 52(2001) 144.w108x J.C. Lopez-Montilla, P.E. Herrera-Morales, S. Pandey, D.O.´
Shah, J. Disper. Sci. Technol. 23(2002) 219.w109x K. Shinoda, H. Saito, J. Colloid Interface Sci. 30(1969) 258.w110x K. Shinoda, H. Kunieda, J. Colloid Interface Sci. 42(1973)
381.w111x H. Kunieda, S.E. Friberg, Bull. Chem. Soc. Jpn. 55(1981)
1010.
w112x T. Foster, W. Von Rybinsky, H. Tesman, A. Wadle, Int. J.¨Cosmet. Sci. 16(1994) 84.
w113x S. Friberg, C. Solans, J. Colloid Interface Sci. 66(1978) 367.w114x M. Minana-Perez, C. Gutron, C. Zundel, J.M. Anderez, J.L.˜ ´ ´
Salager, J. Disper. Sci. Technol. 20(1999) 893.w115x T. Foster, F. Schambil, W. Von Rybinski, J. Disper. Sci. Technol.¨
13 (1992) 183.w116x H. Nakajima, S. Tomomasa, M. Okabe, Proceedings of First
World Congress on Emulsion, vol. 1, Paris, France, 1993,paper� 1-11y162.
w117x H. Nakajima, in: C. Solans, H. Kunieda(Eds.), IndustrialApplications of Microemulsions, Marcel Dekker, New York,1997, pp. 175–197.
w118x T. Foster, in: M. Rieger, L.D. Rhein(Eds.), Surfactants in¨Cosmetics, Marcel Dekker, New York, 1997, pp. 105–125.
w119x A. Graciaa, J. Lachaise, J.G. Sayous, P. Grenier, S. Yiv, R.S.Schechter, et al., J. Colloid Interface Sci. 93(1983) 474.
w120x J.L. Salager, Intern. Chem. Eng. 30(1990) 103.w121x A. Goldszal, M. Bourrel, Ind. Eng. Chem. Res. 39(2000)
2746.w122x D.J. Miller, T. Henning, W. Grunbein, Colloid Surface A:¨
Physicochem. Eng. Aspects 183–185(2001) 681.w123x Z.Z. Yang, Y. Xu, S. Wang, H. Yu, W. Cai, Chinese J. Polym.
Sci. 15(1997) 92.w124x Z.Z. Yang, D.L. Zhao, Y. Xu, M. Xu, Chinese J. Polym. Sci.
15 (1997) 373.w125x Z.Z. Yang, D. Zhao, Chinese J. Polym. Sci. 18(2000) 33.w126x D.J. Watson, M.R. Mackley, Colloid Surface A: Physicochem.
Eng. Aspects 196(2002) 121.w127x M.I. Briceno, M.L. Chirinos, I. Layrisse, G. Martinez, G.˜
Nunez, A. Padron, Rev. Tecn. INTEVEP 9(1989) 101.˜ ´w128x T.J. Lin, T. Akabori, S. Tanaka, K. Shimura, Cosmet. Toiletries
95 (1980) 33.w129x T.J. Lin, T. Akabori, S. Tanaka, K. Shimura, Cosmet. Toiletries
98 (1983) 67.w130x T.J. Lin, Y.F. Shen, J. Soc. Cosmet. Chem. 35(1984) 357.w131x S. Sajjadi, M. Zerfa, B.W. Brooks, Langmuir 16(2000) 10 015.w132x T.G. Mason, J. Bibette, Phys. Rev. Lett. 77(1996) 3481.w133x T.G. Mason, J. Bibette, Langmuir 13(1997) 4600.w134x S. Friberg, P.O. Jansson, J. Colloid Interface Sci. 55(1976)
614.w135x J.L. Salager, N. Marquez, R.E. Anton, A. Graciaa, J. Lachaise,´ ´
Langmuir 11(1995) 37.w136x F. Ysambertt, R.E. Anton, J.L. Salager, Colloid Surface A:´
Physicochem. Eng. Aspects 125(1997) 131.w137x T. Iwanaga, M. Suzuki, H. Kunieda, Langmuir 14(1998) 6775.w138x H. Bataller, P. Dicharry, J. Lachaise, A. Graciaa, J. Disper. Sci.
Technol. 21(2000) 571.w139x C. Dicharry, H. Bataller, S. Lamaallam, J. Lachaise, A. Graciaa,
J. Disper. Sci. Technol. 24(2003) 237.
Copyright © 2022 FDOKUMEN