BOUNDARY LUBRICATION - DTIC
354
AA BOUNDARY LUBRICATION ~.~miFhjnn rp AUG 29 1! -1972- C t SCIENTIFIC AND TECHNICAL APPLICATIONS FORECAST r0 NATIONAL TECHNICAL INF:OR!.,ATION SERVICE OFFICE OF THE CHIEF OF RESEARCH AND DEVELOPMENT DEPARTMENT OF THE ARMY WASHINGTON. D.C. 20310 j proved for public releaw. jst ibuuo Unlimited
-
Upload
khangminh22 -
Category
Documents
-
view
0 -
download
0
Transcript of BOUNDARY LUBRICATION - DTIC

AA
BOUNDARY LUBRICATION~.~miFhjnn rp
AUG 29 1!-1972-
C
t SCIENTIFIC AND TECHNICAL APPLICATIONS FORECASTr0
NATIONAL TECHNICALINF:OR!.,ATION SERVICE
OFFICE OF THE CHIEF OF RESEARCH AND DEVELOPMENT
DEPARTMENT OF THE ARMY
WASHINGTON. D.C. 20310
j proved for public releaw.
jst ibuuo Unlimited

a #NOTICES
Distribution
This document has been approved for public release and sale; itsdistribution is unlimited.
Availability
Qualified requestors may obtain copies of this document from theDefense Documentation Center, Cameron Station, Alexandria, Virginia.Others may purchase copies from the Clearinghouse for Federal Scientificand Technical Information, U.S. Department of Commerce, Springfield,Virginia 22151.
Disposition
Des'troy this report when no longer needed. Do not return it to theoriginator.
Disclaimer
The findings in this report are not to be construed as an officialDepartment of the Army position unless so designated by otherauthorized documents.
Rights
Reproduction in whole or in part is allowed for purposes of the U.S.Government.
4 .

DOCUMENT CONTROL DATA - R & DJ
1ORIGINATING A1C TI V IT CW~*"14)g.RIOt 9ITY L114FCTO
EgoResearch and Engineering Company UnclassifiedP..Box 8 - Government Research Laboratory 116. GROUP
Linden, New Jersey 07036N/dEPORT TIL9AE
Boundary Lubrication
4'.O61mc~gTevnf52P ec Age, A Jpication Forecast (1972)Final Reor Jl n 19 - Sune 9S.~~~~~~~~I AU.0(1(~S Mmdl ntalls nam) '
Alan fleerbower
0. REPORT CATS 78. TOTAL NO. oil PAGES Yb N. P EP
June 1972 351 7 "'6.CON4TRACT OR GRANT NO. 5.ORIGINAVORWS REPORT NUIDIERIS)
DAHC-19-69-C-0033a. PROJECT No GRU.lGBEN.72
S.OTKER REPORT NO4S1 (Any, at. nuMb 6S 5944 60h 0161ed
01 OSTRIOUTION STATEMEfNT
Approved for public release; distribution unlimited.
II. SUPP6ItHETARV NOTEtS 1.SPONSORING MILITARY AC~TIVITY
Office of the Chief of Research &Dev.DeIpartment of the Army
12. ESTAT rpor revewstheWashington, D.C. 20310
4ki reortrevewsthestate-of-the-art of Boundary Lubrication and ptesentsthe prospects of such improvements in the lubrication of highly-loaded bearings asvirtually to eliminate bearing failures and the need to relubricate machinery inthe field. It includes a survey of instances of anomalously successful boundarylubrication and of mathematical models which might explain the low wear observed.These models are shown to be inadequate and some steps are taken to complete them.
A plan for applying this knowledge to design practices is outlined.
RSPLAC~Do 00PR1478. 1 JAN 54. P1cM isDv ,..V .I1 3 *GS-LSYE OR ARWY we.l
SeiyClas~ sification

Unclassified
lecutit ClalslflcetionRevLINK a LINK a LINK C
ROLE WT ROLE WT VIOLS WT-
Lubrication
Friction
Wear
Adsorption
Surface Free Energy
Zero-Maintenance
L
I
I
I
- {
,I, , A
9 BOUNDARY LUBRICATION
AnAArmy Research Office j
Scientific and Technical Applications .Forecast
[ILI
ByIAlan Beerbower
Esso Research and Engineering CompanyLinden, M. J ,.
Contract No. DAHC1g-69-C-0033
JtNE 1972
• t.

- ii -
FOREWORD
The documents known as Scientific and Technical Applications Forecasts I(STAF) form a series designed to supplement the U. S. Army LongRange Technological. Forecast. A STAF is intended to provide an insightinto one specific field, and is for use by persons inside and outside ofthe Department of the Army who have need for such background information.A STAF is primarily an encyclopedic summary of the current knowledge anda projection of the expected technological environment during the next20 years. It is also a research plan designed to achieve the forecast.It includes an extensive bibliography, and its purpose is to enablescientifically, technically and operationally oriented individuals tocoimmunicate across disciplinary lines in order to achieve prograrmned
Army goals.
U.S. Army RDT&E agencies are encouraged to publish STAF's on specificscientific and technical subjects falling within their area of assignedresponsibilities. Additionally, recommendations concerning desired
Headquarters, Department of the ArmyOffice of the Chief of Research and DevelopmentAttn: Science and Technology DivisionWashington, DC 20310
This particular STAF on boundary lubrication is more than a summary in thatit has developed new insights beyond those in the literature, and itstechnological forecast includes the prospect of Army vehicles andmachinery whose moving parts will require no field re-lubrication and willexperience negligible wear during the expected useful life of the machine.It contains a suggested research plan to aid in achieving that goal.
The conclusions 4n this report are subject to evlution in the light ofnew developments and information. Accordingly, readers are urged tosubmit comments to fill in gaps in current knowledge, report new findingsor applications, and suggest new programs.
HAROLD F. DAVIDSONPhysical Scientist
Office of the Chief of Researchand Development
I
ESSO RESEARCH AND ENGINEERING COMPANY4% O0VURNMENT RESEARC11 LABORATORY P. 0, BOX 8, LINDEN, N. J, u7036
1,ft9 N~rnPREFACE
This Scientific and Technical Applications Forecast (STAF)on Boundary Lubrication constitutes the final report in accordance with
-. Contract No. DAHCI9-69-C-0033, dated 1 June, 1969. Mr. Harold F. Davidsonof the Army Research Directorate, Science and Technology Division origin-ated the project and monitored its progress.
The author wishes to express the deepest appreciation to
those who aided in various ways during the project. In particular, Dr.Henry Gisser, Pitman-Dunn Laboratories, Frankford Arsenal, was consulted manytimes and served as one of the final reviewers. The other reviewers were:
VProf. Ernest Rabinowicz, Massachusetts Institute of Technology,Dr. L. S. Akin, Marine Turbine and Gear Dept, General Electric,Mr. R. L. Johnson, NASA, Lewis Research Center,
0. Mr. Henry Mahncke, SKF Industries,Mr. Harold Ravner, U. S. Naval Research Laboratory, andMr. Harry Ammlung Aberdeen Proving Ground.
Several co-workers also provided vital assistance; Dr. I. L. -
3 Goldblatt in the organic chemistry, Mr. A. R. Garabrant in mathematical
I' programming and correlations, and Dr. J. A. Brown in organization of thematerial. Mr. L. Berkowitz supervised the
project.
Correspondence about any aspect of this STAF would be welcomedby the author, especially where extropolations or interpretations of theoryare involved. A
t" ESSO RESEARCH AND ENGINEERING COMPANY
( 4
U
iliiiJ iI

-iv
TABLE OF CONTENTS
Page l
1. S UMMARY 1
2. THE REGIMES OF LUBRICATION 5
3. THE PROSPECTS FOR ENHANCED LUBRICANT PERFORMANCE 8
3.1 The Limitations of Current Engineering Practice 83.2 Instances of Extraordinary Performance 9 4
3.3 Prospects for an Advanced Design Manual 10
4. ANOMALIES IN LUBRICATED SLIDING 12
4.1 The Anomalous Bace Case - Ordinary Lubrication 124.2 Anomalies Involving Lead 134.3 Anomalies Involving Calcium 144.4 Anomalies Involving Other Elements 15
4.4.1 Zinc and Cadmium 154.4.2 The Chalcogenes 164.4.3 The Halogens 164.4.4 Tungsten 18
4.5 Optima in Blended Lubricants 184.6 Competition of Additives for Surfaces 204.7 Ambiguous Roles of Humidity and Oxygen 214.8 The Sharp Transition to Scuffing Wear 244.9 Effect of Anti-Wear Additives on Fatigue 264.10 Benefits of a Break-In Period 264.11 Miscellaneous Anomalies 27
4.11.1 Anomalously Low Friction 274.11.2 Anomalous Wetting Energy 274.11.3 Metals of Group B in the Periodic Chart 27
4.11.4 Multilayers of Stearic Acid 284.11.5 Freshly Purified Cetane 284.11.6 Complex Organic I' ;--hates 284.11.7 Diesel Engine Scut ing 284.11.8 Wear Due to Suspended Abrasive Particles 284.11.9 Delay of Scuffing Transition 284.11.10 Gold Appears to Oxidize 304.11.11 Water Plus Phenothiazine Shows Low Wear 304.11.12 Two Consistent Sets of Friction Data 30
4.11.13 High Friction on Titanium4.11.14 Austenite Versus Martensite 30
4.12 Summary of Anomalies 30
5. ADVANCED MODELS OF BOUNDARY LUBRICATION 31
5.1 Introduction: Current Design Practices 31
5.1.1 Design of Rubbing Bearings 315.1.2 Design of Gears 32
Ij

TABLE OF CONTENTS (Continued)
Page
5.2 New Concepts 415.3 The Empirical Model for Zero and Finite Wear (Model I) 43
5.3.3 Analysis for Zero Wear (Model IA) 475.3.2 Testing Model IA 515.3.3 Analysis of Finite Wear (Model IB) 525.3.4 Testing Model IB 59
5.4 Adhesive Wear (Model II) 59
5.4.1 Adhesive Wear With Simple Lubricants (Model IlA) 705.4.2 Testing Model IIA 745.4.3 Adhesive Wear With Gas and Vapor Lubricants
(Model IIB) 775.4.4 Adhesive Wear With a Compounded Lubricant
(Model IIC) 785.4.5 Severe Wear (Model lID) 81
5.5 The Irreversible Chemistry Models - Reaction
With the Atmosphere and/or the Lubricant (Model III) 81
5.5.1 Corrosive Wear by the Atmosphere (Model liA) 835.5.2 Testing Model liA 89
5.5.3 Corrosion by Additives (Model IIIB) 935.5.4 Formation of Surface Resin (Model IIIC) 945.5.5 The Charge-Transfer Mechanism (Model IIID) 1075.5.6 Testing Model IIID 1.105.5.7 Formation of Soap Films (Model IIIE) 114
5.6 Metallurgical Compatibility (Model IV) 114
5.6.1 The Bulk Energy Model'(IVA) 1155.6.2 The Surface Free Energy Model (IVB) 1165.6.3 Testing Model IVA (Metallurgical Compatibility) 119
5.7 Mixed Film Lubrication (Model V) 125
5.7.1 Empirical Load-Sharing (Model VA) 1255.7.2 A Two-Dimensional Model (VB) 1275.7.3 The One-Dimensional Model (VC) 1325.7.4 Gear Surface Damage (Mo~el VD) 1385.7.5 A Tentative Break-In Mechanism (Model VE) 1405.7.6 Testing Model V (Mixed Film Lubrication) 140
5.8 Rolling Contact Fatigue (Model VI) 142
5.8.1 The Interfacial Free Energy (y1 2 ) Theory (Model VIA)1425.8.2 Testing the Interfacial Free Energy Model VIA 1435.8.3 The Hydrogen Embrittlement Theory (Model VIB) 143
5.9 Abrasive Wear (Model VII) 148
5.9.1 Two-Body Abrasion (Model VITA) 1495.9.2 Automotive Abrasion (Model VIIB) 1525.9.3 Three-Body Abrasion (Model VIIC) 153
5.10 Fretting Corrosion (Model VIII) 158

- vi -
TABLE OF CONTENTS (Continued)
page
5.11 Auxiliary Models on Surface Free Energy 159
5.11.1 Surface Free Energy of Liquids 1595.11.2 Surface Free Energy of Solids 1605.11.3 Surface Free Energy of Mixtures 161
5.11.4 Interfacial Free Energy 161
5.11.5 Interfacial Entropy 168
5.12 Predicting the Coefficient of Friction (F) 168
6. COMPARISON AND COMBINATION OF THE MODELS WITH EACH OTHER 172
6.1 Reduction to Standard Format 1726.2 Checking Models Against Each Other 176
6.3 Comparison with Literature Data 1786.4 Perspective on the Modes of Wear 184
6.4.1 Increasing Load 184
6.4.2 Decreasing Viscosity 1846.4.3 Decreasing Velocity 1866.4.4 Decreasing Work of Adhesion 1866.4.5 Break-In 1866.4.6 Abrasion 1866.4.7 Fatigue 186
6.4.8 EP Lubrication 186
6.5 Combining the Models for Design Purposes 186
7. REVIEW AND EXPLANATION OF THE ANOMALIES 189
7.1 The Base Case 1897.2 Anomalies Involving Lead 1907.3 Anomalies Involving Calcium 1917.4 Other Elements 1917.5 Optima in Blended Lubricants 192
7.5.1 The DuPont Patents 1927.5.2 The Silicone Anomaly 1957.5.3 Aromatic-Aliphatic Blends 195
7.6 Competition of Additives for Surfaces 1987.7 Roles of Humidity and Oxygen 1987.8 The Sharp Transition to Scuffing Wear 2007.9 Effect of Anti-Wear Additives on Fatigue 2017.10 Break-Tn Anomalies 203
7.11 Miscellaneous Anomalies
7.11.1 Anomalously Low Friction in Transmissions 205
7.11.2 Anomalous Wetting Energy 2057.11.3 Croup B Metals 207
7.11.4 Multilayers of Stenric Acid 207
7.11.5 Fre-hly Purified Cotane 2097.11.6 Complex Organic Phosphates 209

. - vvii -
V1
TABLE OF CONTENTS (Continued)
Page
7.11.7 Diesel Engine Scuffing 2097.11.8 Suspension of Particles 2107.11.9 Delay of Transition 2107.11.10 Formation of Gold-Oxygen bayer 2107.11.11 Water Solutions as Lubricants 2137.11.12 "Bifurcated" Wear Data 2137.11.13 High Friction on Titanium 2137.11.14 Austenite Versus Martensite 215
7.12 Recapitulation of Anomaly Explanations 2157.13 Irmediate Applications of Anomalies 218
7.13.1 Lead 2187.13.2 Calcium 218
7.13.3 Diesel Scuffing 2187.13.4 Particle Suspension 218
8. RECOMMENDED RESEARCH PLAN 219
8.1 The Incentives for Further Work 2198.2 Forecast of Possible Achievements 2218.3 The Plan of Attack 222
APPENDIX I - Nomenclature 224
APPENDIX II - Bibliography 227
APPENDIX III - Surface Free Energy: A New Relationship toBulk Energies (reprint) 253
APPENDIX IV - The Surface Free Energy of Solids 260
APPENDIX V - Interfacial Energies of Pure Liquids on Solids 270
APPENDIX VI - Surface and Interfacial Free Energies of Mixtures 295
APPENDIX VII - Surface aid Interfacial Entropies 303
APPENDIX VIII - Solubility ParameLers (reprint) 310
APPENDIX IX - List of Experts Interviewed 332
APPENDIA X - Publications Resulting from This Contract 335
Distribution list 336

- viii -
List ot Tables
Number Page T.tle
2-1 7 Regimes and Nodes of Lubrication and Wear
4-1 22 Ef feet of Trieresyl Phosphate (TCP) in VariousLubricants and Atmospheres
4-11 2Y Anti-Wear Additives Increase Diesel Scuffing
5.1-1 3637 Material Classes for IME Charts '5.1-2 and 5.1--3
5.1-11 39 Crit ,al Scoring Index Numbers
5.3-1 46 Lubricants Used to Develop Model 1
5.3-11 4 Distribution of Fatigue and Adhesive Modesin Node] I
5.3-Il 53 Predicted Zero-Wear Travel (Inches) for CopperBall on Steel Disk
5.3-IV S Noble Metal Alloy Tests of Zero-Wear Model
5.3-V 55 Critical Relative Humidities of Alloys
5.3-VI 56 Zero-Wear Predictions on Pure Hydrocarbons
5.3-VII 60 Predicted Wear Rates for Model TB
5.4-1 67 Specific Wear Rates for Various Metal Combinations
5.4-11 73 Input Data for Model TIA
5.4-Ill 75 Heats of .\dsotption of Pure Hydrocarbons 'n
Steel Calculated from Wear Rates
5.4-1V 76 Heats of Adsorption of Commercial Liquidson Steel Calculated from Wear Rates
5.4-V 30 Time Scale for Film Renewal
5.5-I 90 Comparison of Activation Energies for theOxidation of Iron
5.5-11 108 The Charge Transfer Mechanism

I
ix-
List of Tables (Continued)
Number Page Title
5.5-lt 112 Absolute Rate for Capture of a Water-Solvated Electron
5.5-IV 113 Heteroatom Molecules Show Prowear or IncreasedFriction in Mixed (50/50) Isoparaffin-Aromatic Basestock I
5.6-1 117 Value of Compatibility Parameter C2 ]5.6-ti 120 Publications on Laboratory Tests of Adhesion,
Friction and Wear of Various Metallic Pairs
5.6-111 121 Predictions of Scoring Resistance on Ircn
5.6-IV 122 Prediction of Scoring Resistance - NonferrousCouples I
5.6-V 124 Success of Compatibility Predictions
5.7-1 130 Gear Surface Distress as a Function ofSpecific Film Thickness
5.7-11 139 Roughness Conversion Factors for VariousGear Manufacturing Methods
5.8-1 145-6 Fatigue of Steel Balls in Various Lubricants
6.1-I 177 Wear Modes Expressed as Exponents in(V/d) = KdmVnUp
6.3-1 179 Variation of Wear Rate with Load in Various
Atmospheres I7-I 194 Friction and Wear of Laves Phase AlloyWith Various Liquid Lubes
7-Il 196 Mass Spectral Analysis of 1000 CoastalDistillate Oil
/-Il1 197 Wear Data for Components of 1000 CoastalDistillate Cil
7-tV 199 Various Roles of Water in Lubrication Models
7-V 202 Estimated Properties of Blok's Oils atStandard Temperatures
7-VI 212 "Zero-Wear" Periods at High Loads on the4-Ball Machine with Cetane as Lubricant
7-VI 216 Summary of Explanations for the Anomalies
in Section 7

List of Tables (Continued)
Number Page Title
V-I 279 Results of Panzer Plots
V-II 282 Typical Works of Adhesion on Chromium byWashburn-Anderson Balance
V-Ill 286 Temperatures of Melting (T ) and Transition (Tt)for Various Compounds (C)m t
V-IV 288 Partial Solubility Parameters of Metal Surfaces
V-v 292 Methods for Heat of Immersion in Pure Liquids
VI-I 299 Heats of Displacement from White Oil by Frewing
(1943) Dynamic Method
VI-II 302 Methods for Heat of Displacement
VIII-I 313-6 Solubility Parameters of Various Liquids at 25C
VIII-2 317 Group Contributions to Partial Solubility Parameters
VIII-3 327 "Liquid" Volumes and Solubility Parameters for
Gaseous Solutes at 250 C
VIII-4 328 Rates of Change for Two Liquids

i - xi -
List of Figures
Number Page_ Title
2-1 5 Regimes of Lubrication
4-1 17 Effect of Iodine on Friction
4-2 19 Optima Obtained in Blending an Isoparaffin(Bayol 35)with a Polynuclear Aromatic(1-methylnaphthalene)
4-3 23 Behavior of l-Methylnaphthalene as Affected byVMoisture and Oxygen
5.1-1 33 ASLE Design Chart for Various Bearing Materials
5.1-2 34 IME Pressure-Velocity Curves for Journal BearingsUsing Machineable Materials
5.1-3 35 IME Pressure-Velocity Curves for JournalBearings Using Unmachineable Materials
5.1-4 40 Scoring Probability of Gears with Different Lubricants
5.3-1 44 Successful Boundary Lubrication
5.3-2 45 Failure of an Asperity by Elastic Deformation
5.3-3 61 Comparison of Measured and Predicted Wear
Rates - Copper Sphere on Steel Disk
5.4-1 63 Asperities before Collision
5.4-2 64 Start of Adhesive Wear
5.4-3 65 Continuation of Adhesive Wear
5.4-4 66 Completion of Adhesive Wear
5.4-5 69 The Interlocked Dislocation Model
5.4-6 72 Heat of Adsorption of Vapor versus Fraction Not Covered
5.5-1 82 The Hydrated Iron Oxide Layer
5.5-2 84 The Pot-Wear Process
5.5-3 87 Alternative Methods of Correlating Wear Versus Time
5.5-4 91 Rate Constant for Static Oxidation of Iron: versus Temperature
5.5-5 92 Correlation of Wear Rate with Hydrocarbon Density
5.5-6 95 Corrosion of Steel Wire by Phosphorus LubeAdditives as a Iunctioij of Reaction Time
4r

- Xii -4
List of Figures (Continued)
Number Pae Title
5.5-7 98 Correlation of Activation Energies of Metals for
Ethane - Deuterium Exchange
5.5-8 99 Polymer Formed from Vapor in Air
5.5-9 100 Dislocations at Surfaces
5.5-10 104 Data Analysis on Hermance and Egan Friction
Polymer105
5.5-11 Solubility Parameter of Resin Formed from
Naphthenic Base Stock
5.5-12 106 Solubility Parameter of Resin Formed from
Aromatic + Isoparaffin Lubricant
5.5-13 109 Chemical Model for Lubrication in the Presence
of Polynuclear Aromatics
5.6-1 118 Compatibilities of Metal Pairs
5.7-1 126 EffeeL of White Oil ViscosiLy on Wear
5.7-2 128 Two Dimensional Physical Model
5.7-3 131 Integrated Values of GH(h o ) and GC(h o)
5.7-4 133 Two-Dimensional Solution for a Journal Bearing
5.7-5 135 One and Two Dimensional Physical Models
5.7-6 136 Stribeck-Type Diagram fhom the one-Dimensional
Model
5.7-7 137 Film Collapse due to Thermal Instability -
Theoretical Prediction
5.7-8 137 Film Collapse Due to Thermal Instability -
Experimental Verification
5.7-9 141 Experimental Dependence of Wear Rate or
Apparent Bearing Pressure
5.8-1 144 The Interfacial Free Energy Theory of Foriue Cracking
5,8-2 147 Fatigue Results with One Crystallized Glass
and Three Steel Balls
5.9-1 150 Two-Body Abrasive Wear

xiii .. I
List of Figures (Continued)
Number f Title
5.9-2 150 Abrasive Wear as a Function of Hardness
5.9-3 151 Effect of Heat-Hardening on Abrasive Wear
5.9-4 151 Effect of Work-Hardening on Abrasive Wear
5.9-5 154 Automotive Bearing Wear Correlation
5.9-6 156 Wear Rate as a Function of Particle Size and
Concentration
55.11-1 162 Hansen Plot of Friction on Polyethylene (Untreated)I
5.11- 163Hansen Plot of Friction on Polyethylene Treated
with H2S207 for Two Minutes I5.11-3 164 Hansen Plot of Friction on Polyethylene Treated
- with H S0 for Five Minutese 2272'7
5.11-4 166 Determination of Interaction Parameters for aFreshly Cut Aluminum
5.11-5 167 Correlation of Cutting Ratio with Interaction
Parameters
5.12-5 170 Correlation of Coefficient of Friction withWear and Velocity
- 6.1-1 174 Transformation of Exponential into a Power Function
6.1-2 175 Torque Balance for Removal of an Oxide Cap(Corrosive Wear)
6.3-1 180 Variation of Wear Rate with Travel in VarioustAtmospheres
6.4-1 185 Regime and Modes of Wear (Excluding Abrasion) onBroken-In Machine Parts
6.5-1 187 Illustrative Design Scheme for Military Power
Gearing
7-1 204 Correlation of Surface Free Energy with Hardness
7-2 206 Zisman-Gans Plot of Wetting Power of Organic~Liquids on Metals
7-3 211 Seizure Delay Travel as a Power Function of Load
7-4 214 Probable Mechanism for High Friction on Titanium

:- xiv -
List of Figures (Continued)
Number Pag Title.,
II1-i 255 Comparison of Calculated and Observed Surface FreeEnergies
111-2 257 Surface Free Energies of the Liquid Metals at TheirMelting Points
111-3 258 Surface Free Energy of the Fused Metal Halides
IV-I 269 Change in Surface Free Energy on Fusion of Solids
V-1 275 Homomorph Chart for Non-Cyclic Compounds
V-2 277 Prediction of London Parameter from Refractive Index
V-3 281 Works of Adhesion of Liquids on Mercury
V-4 282 Changes in Oil Lens/Metal Plate/Water Layer Systemin Measuring Spreading Pressure of Oil on a MetalSurface
V-5 289 The Rehbinder Effect
V-6 290 The Joffe Effect
VI-I 300 Scuffing Tests with Hexadecane plus Additives
VI1I-l 319 Solubility Plot for Poly (methyl methacrylate)
VIII-2 320 Solubility Parameter Plot for Common Solvents
VIII-3 321 imodal 25% Swell Contour of Polysulfide Rubber
VIII-4 322 Correlation of Swell of Natural Rubber with Radiusof Spheroid
VIII-5 327 Fugacity of Hypothetical Liquid at 1 atmosphere

I
1. SUMMARY iI
This STAF reviews the state of the art of Boundary Lubrication andpresents the prospects of such improvements in the lubrication of highly-loaded bearings as virtually to eliminate bearing failures and the need to re-lubricate machinery in the field.
The field of lubrication is one which has grown up empirically and
in which the practical art has far outstripped the basic understanding. Therehas been steady improvement in machine life and performance, but this has beendue in the main to incremental improvements, empirically proved; and it is istill not possible for a scientist to design a new lubricant for a new appli-cation and say with confidence, "This will work." There is, of course, a gen-eral body of experience and some limited Handbooks which guide lubricetion en-gineers; buL exceptions and anomalies are so comnmon as to preclude any greatfeeling of confidence on their part, and it is still necessary to demonstratenew lubricants and new lubrication designs by iterative field trials, oftenlasting for a year or more.
However, a number of examples are known of really spectacular per-formances by lubricants - far beyond anything the state of the art would pre-dict - and there is a growing body of understanding of the basic physics andchemistry of surfaces. These recent advances, taken together, promise import-ant improvements in machine and lubricant design; because if it is once really Iunderstood why spectacular lubricant performance is sometimes obtained, itshould be possible to capitalize on the understanding and make it to order inall cases, not just in happy accidents.
This happy situation has not yet been realized, but this STAF pointsthe way by an in-depth study of the contributory art, including.
* A survey of observed cases of extraordinary lubrica-tion.
* An analysis of the coxmmon factors and practicalapplications.
* An outline of advanced mathematical models of wear in the
boundary regime to account for the extraordinary performance.
A research plan to derive a unified, quantitative uearmodel and a design manual foe the actual engineeringof bearing-lubricant systems which will run withoutattention until obsolete.
The advances reported are such as to make realistic the hope of virtual Ielimination of the re-lubrication of Army machinery in the expected lifetimeof the equipment, and the consequent virtual elimination of lubricant storageat operating bases. The elimination of field re-lubrication should actuallyresult in longer equipment life; because it has been found that field servic-ing is frequently harmful (by such things as the introduction of abrasive con-tamination into a precision bearing) and that most breakdowns occur shortlyafter servicing. 4

-2- .1
This survey uncovered 28 anomalies - phenomena inexplicable in the Istate of the art as available to designers at that time - in the performance
of lubricants, including the surprising fact that two very ancient liquids -
petroleum and fats - are good lubricants while most liquids are rather poor
lubricants. Among the most striking of the anomalies are:I
* Leaded metals and lubricants carry extreme loadswithout scuffing.
a Calcium additives prevent scuffing and wear.
Other elements such as zinc, cadmium, sulfur, iodineand tungsten give unexpectedly lower wear or friction-by as much as 99% over the base lubricant.
* Blending dissimilar liquids can produce superiorlubricants.
* With the right lubricants, oxygen and humiditycan improve performance.
* The transition from mild wear to severe scuffingcan be delayed.
Anti-wear additives can increase or decreasefatigue life.
While not all of these techniques offer equal rewards, an explanationof any of them IN TERMS WHICH THE DESIGNER CAN USE would offer some promise for
pay-off. Plausible explanations have been obtained in 25 cases of the 28 anomalies,two others still require special "ad hoc" theories, and one is still unexplained.
The working approach of this study was to attempt to understand thefundamental phenomena of lubrication in quantitative terms, using the achieve-ments of "ordinary good practice" as the starting point and the much betterachievements of the "anomalous cases" as tests of the new modele and theories.Lubrication is so complex a phenomenon that no one, all-encompassing model wasfound; but seven overlapping models of wear point the way toward acomplete understanding:
* EMPIRICAL - A quantitative but empirical set of de-sign criteria for very lightly loaded bearings, suchas in office machines.
* ADSORFTIVE CHEMISTRY - Which takes into account ad-sorption of gases, additives and base stocks ontobearing surfaces.
* REACTIVE CHEMISTRY - Which provides for metal oxida-tion and the reaction of (some) additives with metalsurfaces to form both harmful structures such as
flakes and also the protective surface resin.

-3-
* METALLURGY - Which clarifies the shifts in thescuffing transition,
9 MIXED FILM - A concept still under development,which connects boundary lubrication with thebetter-understood hydrodynamic lubrication.
* FATIGUE - Which considers the harmful or beneficialeffects of additives on this failure mode.
* ABRASION - Which covers the effect and the fate ofparticulates generated in the above wear modes.
In addition .o this critical review, it was expedient to create fourauxiliary models which help in various ways to implement the seven main ones.These are:
* A new approach to surface and interfacial free energies,useful in the adsorptive and fatigue models.
o Correlations of the coefficient of friction with the wearrate for two clearly identifiable wear modes.
* Means for "fingerprinting" wear modes, which led to a master-model concept for dealing with the mixed modes found to pre-dominate under non-idealized conditions.
* A combination of the models for reactive chemistry and mixedfilm, which explains a great deal about both ordinary andanomalous lubrication.
The last of these came, in the end, to dominate the picture on success-ful boundary lubrication. It proceeds by three steps. First, a bearing or gearbreaks in by chopping off the oxide layer, and often some metal, from the highestasperities. Second, the raw metal interacts with the lubricant to form surfaceresin, which partly fills the micro-valleys to produce a "glazed" surface oflessened roughness. Third, this smoothing increases the hydrodynamic lift andreduces the rate of wear to where resin no longer forms. The system is now inhomeostatic balance; loss of resin causes wear, which produces resin until wearis again reduced. Failure would be the result of sudden heating (due to over-load, etc.) which dissolves the resin, throwing much of the load onto the asperi-ties and causing whole patches to rip off as "scuffing."
These models, now semi-quantitative, sketch out a greatly improvedunderstanding of lubrication and wear. Confirmed and quantified, they would pro-vidu the basis for a design manual for the engineering of lubricant/bearing sys-tems with sealed-at-the-factory lubrication and wear rates low enough to give azero maintenance life expectancy equal to the obsolescence time of the machine.This assumes that svch designs would use only the best quality lubricants, toprevent the failures due to oxidation which presently limit system life. Presentor easily foreseeable industrial, automotive and aircraft lubricants can be con-fidently expected to provide severe service (3000 F) for 5 to 10 years by the timesuch design changes could reach the field. Realization of this goal requires furtherR&D effort in three interwoven phases, involving original study as opposed to thecompilations in this STAF:

I-4-
" Complete and quantify the models where gaps and
inadequacies exist.
" Test the models by comparison with published data
and with new experiments to verify crucial points.
Translate the quantified and verified models into
a practical design manual, useful and intelligible
to industrial factory engineers and to military
planners.
The design manual would be based on the principle of systemanalysis, rather than the present practice of assembling pre-designedcomponents into a machine. Given the basic environmental parameters of
load, speed, temperature and any special atmospheric condition, thedesigner wouid undertake simultaneous optimization of
" Metallurgy of both contacting surfaces
" Geometry of contacting surfaces
" Physical and chemical properties of lubricant
" Chemical properties of additives
" Chemistry and geometry of seals
" Filtration - need, fineness, service life
Preliminary estimates suggest that the program would require approximately athree-man effort over a period of approximately three years.
Several of the anomalies uncovered and explained in this STAF appearto be ready for immediate application to field problems without waiting for
further research. These are:
" Increased use of leaded alloys, platings and lubricants,
" Application of high calcium content lubricants in new areas,
" Reduce diesel scuffing with glaze-forming additives, and
" Use anti-abrasion additives to decrea-e the need for filtration.

-5-
2. THE REGIMES OF LUBRICATION
Lubrication is a complex and technical subject, and it is essential
to establish a common language at the outset. DO NOT SKIP THIS SECTION, nomatter how expert you are.
This STAF follows the usage of the new glossary just released by theInternational Research Group on Wear of Engineering Materials (Rowe, 1969) ex-cept where they did not rrovide a word for a specific situation. In the dis- A
cussions of lubrication and wear, "regime" is used to describe the outwardsymptoms (e.g., "hydrodynamic" or "boundary" lubrication) and "knode" is usedto name the underlying mechanisms (e.g., "mixed film" lubrication or "scuffing"wear - as defined on the next page). Distinctions are sometimes difficult;Table 2-I, on page 7,summarizes the intent.
The following figure diagrams the relationship between bearing wearand bearing load as it is currently known in "normal good practice." Theanomalies discussed in this STAF would by definition fall either below or abovethe wear rate curve at the appropriate relative load, but not on it.
Figure 2-1
REGIMES OF LUBRICATION j
N
UOJ
0 I-
Hydrody nam ic Oj.: *
Lubrication3
S0 A X B Y Z
= RELATIVE LOADUW

-6-
Figure 2-L is highly idealized (see Pig. 6.4-1) , but hel ps set some definitions
Region O-A is the regime of hydrodynamic lubrication in which the entire loadis borne by the liquid film and there is no metal-to-metal contact. There islittle or no wear, and the friction is due solely to the viscous shear of thelubricant. As the load rises to enough to distort the curvature of the sur-faces, the term becomes elastohydrodynamic lubrication.
Region A-X is the regime of quasi-hydrodynamic or mixed-film lubrication, which de-pends upon the roughness of the surfaces for its onset. The main part of the loadis carried by the hydrodynamic film in the micro-grooves or "anti-asperities", whilemost of the friction and all the wear result from asperity contacts. It is oftentransitory, as the running-in process smooths down the higher asperities; andPoint A moves toward Point X.
Rezion X-Y is the.regime of boundary lubrication proper, the territory of thisSTAF. There is some metal-to-metal contact on the asperity tips, and the degreeof metal-to-metal contact increase, as the load increases. Most of the load,however, is still carried by the liquid film. Wear is mild and tends to hedue to corrosion to the left of Point B. Point B represents a change in wearmode, from corrosive and abrasive to adhesive wear in which material is trans-ferred from one surface to the other by cold welding. The location of Point Bis variable; under non-corrosive conditions, metallic wear particles occur asfar left as Point X, while with corrosive additives, they are not found untilZ' is reached, far outside the boundary region.
Region B-Y is characterized by "hemispherical" wear particles, which are muchtoo short and thick to be simply the planed-oit tops ot asperities. Some be-lieve they are compressed or even rolled up during formation, but others be-lieve they are plucked out of the surface. Tn many cases, a particle is trans-ferred back and forth several times before release. The wear rate tends tobe greater than in X-B, but is still called "mild."
Region Y-Z is one of prohibitively severe wear, and bearings cannot operatethere except very briefly. Bearing surfaces to the left of Point Y are apt tobe as smooth as the original one, even though quite worn; but those on theright are scored or scuffed. The transition Point Y is not always as clear-cut as shown in the Figure, and call fail to appear at all with some systems.The use of "extreme pressure" additives, for example, can extend the wear curveup along line B-Z'. However, the scuffing transition is so often found as torepresent the "normal" situation. For the purpose of this STAr, it representsa limit beyond which designers must not go, and the objective is to locate itwithout experiencing it. The line B-Z' is outside the scope of boundary lubrication,and so will not be discussed in any detail.
The subject of fatigue needs mention. It cannot be located in anyparticular regime because it is characterized by a variable wear rate. It isimportant, partly because it can set a limit to the life of a bearing whichshows negligible wear up until failure and partly because it can be aggravatedby some improved boundary lubricants. It can become a limiting factor in roll-ing contact bearings which share a lubricant with some boundary-regime mechanismsuch as gears.
The remainder of this STAF concerns the region from X to Y, withexcursions into the hydrodyrna'ic or scuffing regimes only when it is necessary toilluminate some point pertinent to the boundary regime. Lifetime design is noproblem In the hydrodynamic regime; such bearings (in steam turbines) run foyears without erasing pencil marks made on the surface by the machinist. No onetries to operate machines in the scuffing regime Y-Z, and the extreme pressure',1EP) regime Y-Z' is a special case which is not widely applicable.

-7
TABLE 2-1
REGIMES AND MODES OF LUBRICATION AND WEAR
Regime Modes
Hydrodynamic No Wear
E lastohydrodynamic "Zero-Wear"
i Molecular wear
: Quas i-Hyd rodynamic Break- in
~Mixed Film! Sliding (Contact) Fatigue
iS
M Id Wear Sliding Fatigue
~Adhesive Wear
Corrosive Wear~Mixed Corrosive-Adhesive
Mixed Corrosion Fatigue
Severe Wear ScuffingiS cor ing
Severe Abrasion ("Wire-Wool", "Plowing")
Violent Corrosion
Seizure Weld ing
!IfI

3. THE PROSPECTS FOR ENHANCED LUBRICANT PERFORMANCE
The scope of this STAF has been focused on liquid lubrication inthe boundary regime under treasonable" conditions. Solid and gaseouslubricants are excluded from discussion, as are the effects of unusual lycorrosive atmospheres and extreme temperatures. The hydrodynamic and extremepressure regimes are also not treated in any detail.
In the discussions of lifetime lubrication and zero maintenance designwhich follow, it is assumed that the liquid maintains its integrity; that is,that seals are adequate to prevent abrasive contamination from outside andthat the lubricant is effectively stabilized with anti-oxidants. Thisassumption may appear optimistic in view of the fact that oxidation isresponsible for most current lubrication failures, but cnrent progress inindustrial, automotive and aircraft lubricants indicates that oxidationproblems will be well under control by the time the design practices outlinedherein can reach the field. By 1977, premium quality lubricants can beexpected to give 5 to 10 years service at 300 F before oxidizing. The zero-maintenance design concept carries with it the requirement to use onlypremium quality lubricants and to consider them part of the capital investmentin the machine itself.
3.1 The Limitations of Current Engineering Practice
Designers tend to size their bearings on the well-established hydro-dynamic models. The 1968 ASLE-sponsored Handbook of Lubrication Engineering
(O'Connor 1968) devotes only five pages (99-104 in Chapter 5) to designing"Thin-Film, Mixed-Film and Dry Bearings". This forces the 6esignor to use thedry-sliding models, since boundary models arc not in acceptable form, and soresults in very over-conservative designs.
Despite the efforts of many of the best minds from the universitiesas well as the bearing, lubricant and machine industries, the Handbook failsto provide the designer with a plan for simultaneously optimizing metallurgy,shape factors and lubricant. This probably reflects the true situation on com-mercial designs, in which the bearing (or gear, etc.) manufacturer decides themetallurgy, the machine designer then selects a shape from the beating catalog,the maintenance engineer selects a lubricant of the viscosity specitied inmachine instruction booklet, and the lubricant formulator modifies one of hisregular products to fit if complaints start to build up. Occasionally, thereare conferences, on a spot basis, if the machine designer foresees an unusualproblem, and there may be an attempt to review some possibilities before thedesign is "frozen". However, this is all too rare.
Military designing differs from the above discussion mainly in thateveryone involved knows that the lubricant must, barring exceptional circum-stances, meet one or another of the existing MIL specifications. There mayalso be some intervention by a technical expert from the procuring agency, ifsomething out of the ordinary is being designed. Howeor, the tendency is tolet the contractor use his best judgment.

The tendency in both commercial and military design offices is tooveremphasize the viscosity of the lubricant, as if most bearings were going tooperate with a hydrodynamic film at all times. This is definitely not true,as stop-and-start operation is always in the boundary regime. This is pointedout in the ASLE Handbook, but the treatment is scanty and admittedly over-simplified due to the lack of more sophisticated mathematical models than the Atwo primitive ones cited there. Neither of these includes any factor forlubricant quality; one is based on an allowable temperature rise and the otheron an allowable wear rate. The result of this dependence on full-film anddry-sliding models often is over-design, except in the aircraft and aerospaceindustries where weight is of prime importance. If such optimization is re- -quired, an iterative shop program is usually employed in which a prototype is
built, tested to failure, rebuilt and so on until an acceptable compromise isachieved.
In the United Kingdom, a serious effort has been made in the last fewyears to improve lubrication practices. This stems from a report (Jost 1966)* inwhich potential annual savings of $1,000,000,000 were estimated for that countryAmong the many steps taken has been encouragement by the government of coursesin advanced design. The charts issued by The Institutica of Mechanical En-gineers certainly appear to be simpler, and easier to use than the ASLE Hand-book, but still suffer from the lack of suitable equations for wear in theboundary regime.
3.2 instances of Extraordinary Performance
As part of this program, a number of examples of what improved lubri-cant-netal systems can do were collected. Some of the anomalies which are notpredicted by current understanding are:
* Leaded metals and lubricants carry extreme loadswithout scuffing.
* Calcium additives prevent scuffing and wear.
* Other elements such as zinc, cadmium, sulfur,iodine and tungsten give unexpectedly lower iwear or friction - up to 99%.
* Blending dissimilar liquids can produce superiorlubricants.
* With the right lubricants, oxygen and humidity can
improve performance, even though they usually de-grade it.
All such references are given in Appendix II, by author and year. In case anauthor published more than one report that year, they are flagged (1966A),(1966B), cte.

- 10 -
* Additives can interfere with each other's activities,but can be chosen to avoid interference.
* The transition from mild wear to severe scuffing canbe shifted to higher loads by changes in lubricant-plus-metal chemistry and physics.
* Anti-wear additives often reduce fatigue life, butnot always.
* Break-in practices can be shortened and otherwiseimproved.
While not all of these anomalies offer equal rewards, and few aretotally understood, it can be shown that most of them can be generalized suf-ficiently to permit wider use. A number of partial explanations are given inASME's "Boundary Lubrication - An Appraisal of World Literature" (Ling 1969)but usually in the language of chemists and often with several untested alter-natives. In this STAF, the anomalies are used to test the various mathematical"models" of lubrication and wear which are presented - a model being definedas an equation or a set of equations which can be adapted to the needs of adesigner.
3.3 Prospects for an Advanced Design Manual
In view of the esamples of extraordinary success shown above, it mightseem that it is only necessary to replace all ordinary lubricants with theseanomalous ones, and the problem is solved. However, most of these successes arefor special situations and cannot be widely applied until understanding of thefundamental principles involved is available.
It must be recognized that "understanding" exists on a number oflevels in any process involving growing sophistication about complex phenomena.In the first stage, technologists create a body of empirical knowledge which isusually mysterious and contradictory but which works well enough to attractusers. Design engineers then pick this body over for a few threads of generalapplicability and start using them. In due course, scientists are drawn inand produce a body of verified experimental data, with theories of a phenomeno-logical nature (e.g., chemical mechanisms).
Next, a group of mathematical theorists forms and distills the gen-eralizations into model equations, far different from the empirical expressionsof the first designers, containing some of the same parameters originally usedbut with new ones replacing some originally considered essential. Usuallythese equations are quite clear to the theorists, but only vaguely useful tothe designers. A translation process is needed to convert the scientific equa-tions into design equations, and the resulting forms often shock the theorists.However, the design equations produce results quite rommensurate with thescientific principles.

- 11 -
In this STAF, "model" is used to describe a hypothetical wear processand the equations showing its response to changes in load, speed, chemistry, etc."Design equations" describe a set of computations to be applied to a preliminarymachine design to determine how and when it will fail. Such equations tend to beoriented to computer programming, and include failures due to lack of mechanical
strength as well as lubrication.
Boundary lubrication is now in the latter part of the generalizationphase, and almost ready to start the last step. In fact, one wear model hasalready been converted into a design model, even though it is definitely limited
to conditions of low loads, speeds and humidities and so is riot in wide use.Another model has achieved similar status and is being advocated for gear use,
although it also lacks some formns of input which are very likely to be neededsoon.
This STAF presents a battery of seven models of lubrication and wear
which have been distilled from the literature and in some cases extended in thecourse of this effort. They are mostly in the generalization, or model equa-tion, phase; but they explain most of the instances of extraordinary lubricantperformance. They contain gaps, and they need firming up by some crucial ex-periments. If this were done and the models validated, it would only remain
to reduce them to suitable form for use by designers - a design manual forachieving extraordinary performance routinely.
tI

t
- 12 -
4. ANOMALIES IN LUBRICATED SLIDING
The initial step of this project was to "survey all accessible ex-amples of extraordinary lubrication", in which performance was spectacularlybeyond current understanding. This has also been referred to as "anomalouslubrication", with the emphasis on those anomalies which were better than pre-dictable by conventional theory, but in addition taking into account a fewcases in which performance was limited by unknown factors to a level far belowwhat might reasonably be expected.
It must be recognized that "anomalous" is a transitory state, withoutpermanent meaning, since as soon as an explanation is validated the phenomenonbecomes part of the accepted pattern. Thus, we must define the word on a timescale; for engineering purposes it indicates anyLhing not predictable from thecurrent design manuals sponsored by the American Society of Lubrication Engineers(O'Connor 1968), the Institution of Mechanical Engineers (Neale 1968) and theAmerican Gear Manufacturers Associetiin (Dudley 1965). However, this is so all-inclusive as to be misleading, and in this STAF indicates approximately "unpre-dictable by the formalized engineering models of 1965".
In this section, the ten outstanding cases which were selected forfurther study are reviewed. In a few cases, these are individual anomalies;but others consist of groups which appear to have something in common. It mustbe emphasized that not all of these cases are new; on the contrary, some areso old that they are taken for granted even though they are still as mysteriousas when they wore first observed.
The study of anomalies serves two purposes. First, these more orless isolated successes forecast what could be done if we really understoodtheir causes. Second, they serve as tesP* "-. advanced theories; any theorywhich merely explains routine success "edicting the anomalies canscarcely be considered an advance.
4.1 The Anomalous Base Case - Ordina ation
Before reviewing the other caces, it would be best to consider brieflywhat may be the greatest anomaly of all, that two of the cheapest metals andtwo of the cheapest lubricants known work so well together that it is necessaryto search rather deeply to find anomalies that are really extraordinarily bet-ter than fatty oil and petroleum films on bronze and steel.
Historically, fatty oils were recognized as lubricants about 6,000years ago. This is not their natural function; biological joints are lubri-cated with syncvial fluid, a complex visco-elastic aqueous solution of polymers,and the fats are fuel to the organisms that make them. Stone age technologistssoon recognized that fat's viscosity and adhesion to surfaces solved many prob-lems on moving parts. This knowledge increased in value with the bronze age,and again during the iron age. Petroleum joined this team only about a hundredyears ago. While it may well have been originally derived from fat (an un-settled controversy which need not concern us here), fitting this complexhydrocarbon mixture into the already developed technology reqtiirod a good dealof effort.

131
- 13 - .
It is noteworthy that of all the other viscous liquids discovered inthe meantime, only "synthetic" esters have yet found a high volume market aslubricants. Of the seventy or so metals now available, only lead has been addedto the list of widely used bearing materials. (Babbitt may be regarded as a specialcase of the bronze in which the copper/tin ratio is approximately reversed, fromthe usual 82 Cu/16 Sn/2 Zn to 89 Sn/7 Sb/4 Cu. Rabinowicz (personal communication)notes that aluminum-tin is becoming common, but it has not gone nearly as far).
A4.2 Anomalies Involving Lead
As mentioned in 4.1, lead was added within historic times to the basiclist of copper, tin and steel. This began many years ago, but has grown greatly inimportance during the past few years. The use of lead-base "white metal" as acheap substitute for babbitt is old, but these are both solid-solution alloysof fairly predictable behavior. They contain a second phase of SbSn and
Cu6Sn 5 , which is harder than the solid solution; this was once believed to beIimportant. This view is not supported by the success of the two-phase alloyswhich were later introduced (Morris 1967).
The most important of these is the 70 Cu/30 Pb alloy which has been
used in automotive bearings since about 1920, in which the lead is dispersedas a separate soft phase. The results were sufficiently good to justify agreat deal of work in preventing the corrosion which resulted when the un-sophisticated motor oils of those days became oxidized. More recently, leadedbronzes have attracted favorable attention from NASA (Demorest 1969), and TNOin Holland (de Gee 1969). Both leaded bronze and lead-plated steels weretested for aeorspace use, in air and vacuum (Harris 1966); he found good re-sults were not always obtained but the overall picture was favorable. Someresults seemed to depend on the presence of tungsten in the steel (see 4.4.4).
Leaded steels were studied in depth by the U.S. Army Tank AutomotiveCommand (Warke 1969). Their excellent machinability (low friction during cut- Iting, turning, etc.) was duly noted, but the main purpose of the study was todetermine the extent to which these steels suffered from high temperature em-brittlement. It was concluded that the fatigue life, compared to an unleadedsteel, was unchanged at up to 300'F but suffered a 907 loss at 600*F. Verygood results have been obtained with an iron alloy "Bishiralloy" loaded with 15 Ito 30% lead (Anonymous 1970) as slider-bar material on the electrical powerpantographs of Japanese National Railways. Slider life went from less than2.3 hours to over 10,000 hours.
It appears that the mechanism is that the small drops of lead which areemulsified in the matrix just before pouring extrude during use, and providea surface coating similar to lead plating but self-renewing (Bowden 1950).The physical properties of lead - insolubility in most other metals, plasticityand low surface free energy - cause it to spread rapidly, so the cases citedso far are scarcely anomalous. However, these low free energy surfaces seemto be exceptionally easy to lubricate. Demorest (1969) found that ordinaryautomotive pressure gun grease was adequate, though it contains no additives(except the lithium stearate thickener, which contributes little to lubrica-tion). His earlier work (1966) had shown that very sophisticated additives

14~
- 14 -
were not adequate to support the very heavy loads in his simulated rocket haul-ing vehicle. The anomaly lies in the fact that such a low surface free energymetal should not, according to theories current in 1965, bond any better tolubricants than a harder metal; quite the opposite would be predicted.
The anomaly Is even more pointed when we consider the effect of leadcompounds as additives. There is a long history on this (Klemgard 1937,Boner 1954) and the list continues to grow. Industrial gear oils of the 1920'sfrequently contained lead soaps, thus combining the lead anomaly with fattyoils and acids. The advent of the automotive hypoid gear depended very largelyon this background, though the next step was replacement of the fatty oil withthe relatively non-lubricating petroleum naphthenic acids to improve solubil-ity of the soap. The fact that such a change could be made without sacrific-ing lubricating quality emphasizes that lead was the key component.
Lead alkyls give powerful lubrication enhancement (Antler 1959,1963; Feng 1963) and their removal from gasoline has run into difficulties inthe form of increased exhaust valve wear. Triphenyl thiomethyl lead, devel-oped by the Ethyl Corporation (Beatty 1967) for the International Lead andZinc Research Organization (Carr 1967) shows phenomenally low wear rates atlow cnncentrations. In the solid phase, both white lead (Pb3 (COR)2 (OH)2 )and red lead (Pb304 ) are well known pipe thread lubricants, and t e former isstill standard for lubricating dead centers on lathes.
While none of these additives has been shown to deposit a film oflead metal on the surface, this has been postulated and would combine the alloyand additive phenomena tidily. The electromotive series favors this reactionon iron, and the analogous reaction with gold compounds was recently reported(Dickert 1971). Both Blok nd the writer observed this with silver salts, butneither published it.
4.3 Anomalies Involving Calcium
Calcium has never made much impact as an alloying agent, due partly toits high susceptibility to corrosion (Morris 1967). However, its action as an addi-tive is quite adequate to justify its inclusion as anomalous. It is interest-ing to note that calcium is second only to lead in its insolubility in othermetals (Rabinowicz 1971B).
The oldest case of calcium as a lubricant additive comes from anal-ysis of the "grease" in an ancient Egyptian chariot's wheels. Probably thegelling powers of the calcium soap motivated the addition of lime to the fattyoils, but there is no doubt that the increase in load-bearing capacity helpedto perpetuate the use of lime-based greases to the present and future. Theliterature is replete with examples (Klemgard 1937). All effect of the gellingpower ca be ruled out by comparison with sodium and lithium base greases,which show no more load-bearing capacity than can be accounted for by thethickened base oil. Strontium and especially barium greases have been pre-pared, but no noteworthy effects on load bearing capacity were reported.

- 15 - -
A new generation of calcium base greases and oils appeared about M
1955. These were based on calcium acetate with just enough calcium laurate, etc.to make it compatible with the oil. The high calcium content led to film strenghtsthat would previously have required corrosive sulfur or chlorine additives(Kolfenbach 1959). Simultaneously, the use of calcium alkylbenzene sulfonates con-taining excess lime in motor oils and in oils for diesel engines operated at high sul-fur fuels became conon. Much of the benefits in the latter case can be at- j
tributed to the ability of the excess calcium to neutralize sulfuric acidformed in the combustion chamber, but some anti-wear effects appear to bepresent even with low sulfur fuel. A striidng fact is that replacement of thecalcium with magnesium, equally potent in neutralizing acid, did not give goodanti-wear action (unpublished data, Esso Research and Engineering Co.).
Another instance of the anomalous effect of calcium is the use oflime as an additive to wire-drawing lubricants (Wistreich 1957). The actionseems fairly specific to iron and steel wire, but may be used on some stainlesssteels. Copper, brass and aluminum do not benefit, but this may be because thestresses do not require much film strength with these soft metals. The filmstrength is not due to chemical action as with sulfur or chlorine extreme pres-sure (EP) lubricants (see 4.4.2 and 4.4.3) and the technique remains an art evenafter 120 years of use. Lime is either coated on the wire from a water slurry, orapplied as a dispersion in cup grease, and the wire comes out smooth and bright.Attempts to substitute any other hydroxide or carbonate result in a dull, roughsurface with increased friction in the die as an extra penalty.
4.4 Anomalies Involving Other Elements
Several other elements have shown unexpected effects on lubrication -
mostly favorable. In most cases, plausible (though not necessarily accurate)explanations exist. These may be considered in a few groups.
4.4.1 Zinc and Cadmium
These elements have a good deal in common with calcium, and may endup being grouped with it as a single anomaly. However, Lthe present main useof zinc is very different from chat of calcium, in that it is usually appliedas the dialkyl dithiophosphate. This complicates things greatly as both sulfurand phosphorus have strongly beneficial effects. Attempts to replace the zinc
with other elements have led to cadmium as the only usable substitute, buttoxicity has prevented its use.
Zinc oxide has enjoyed a wide reputation as a solid additive ingreases, under the general brand name of "Lubriplate" (trademark of Fiske Bros.).However, their basic patent ran out a few years ago, and the expected rush tocopy the products has not developed. Perhaps the only "anomaly" was the whitecolor and hiding power of this additive.

-16-
4.4.2 The Chalcogenes
Sulfur, and to a limited extent selenium and tellurium, have beenlong used to increase load bearing capacity. The latter two are usuallyruled out by toxicity, cost or both. The mechanism by which sulfur acts waslong thought to be simply corroding the surface to an FeS film, but there arenew data to indicate that more goes on than had been supposed (Allum 1968).Perhaps it is best to reserve judgment on the anomalous status of this import-ant class of additives.
4.4.3 The Halogens
Fluorine, the lightest member of the family, tends to behave quite pre- -dictably. Its C-F bond strength keeps it from any exchange reactions, and thefluorocarbons are the least reactive of all liquids. This is not true of chlo-rine. It is generally well understood that chlorine will leave an aliphaticmolecule readily (an aromatic less readily) for hot metal, and form an FeCIfilm. There may be more complicated hypotheses, but this fits all the facts.Bromine behaves about the same way; a little more activity per mole, about thesame by weight. These cannot be regarded as anomalous, though chlorine is ex-tremely useful in gear lubricants and cutting oils.
Iodine, on the other hand, has been shown by two different groups (Furey1966, Brown 1968) to exhibit additive qualities that are not predictable from itsgreater atomic weight and the lower strength of the carbon-halogen bond. In addi-
cion to the anti-scuff qualities shown by chlorine, it has a demonstrated capabil-ity to reduce friction to as little as 17. of dry or 10% of base oil value in a steel-to-steel system (Fig. 4-1). This is quite an enormous effect. For both caseswith and without iodine - lubrication was in the ordinary wear regime; the re-duction in friction Is not simply a case of going from a scuffing situation toone of mild wear. Noreover, in many well-known cases where wear is reduced byabout 50% from that of the base oil (e.g., with conventional fatty acids, otherhalogens, organic phosphates), friction is generally reduced by no more than 20-30%. Reductions in friction of 50% are considered unusual. Thus, the 90% re-duction due to iodine in the present example is rare indeed.
It does not matter whether the iodine is present as solvated mole- Icules (brown solutions) or as diatomic molecules (Violet solutions). As little
as 0.0075% 1 in either form does the job; the "charge-transfer complex" form(Roberts 1961A)is not required. Moreover, iodine is much more effective thanchlorine or bromine, other members of the halogen family that are usuallymore reactive than 12. And it is quite interesting that iodine by itself asa solid lubricant is ineffective (Peterson 1955).

-17-
Figure 4-1
EFFECT OF IODINE ON FRICTION
.100
08
U-. Base Oil 0
S.04 -C-)
U-u02 +ase Oi 0
+ .0 B a se....................O..................0...0 - - I LI I I __
0 200 400 600 800 J')OOLOAD (grams)

- 18 -
-.4.4 Tungsten
In a number of instances, it has been observed that the addition ofa moderate amount of tungsten to steel has a strong effect in reducing the wearrate. This might appear to be merely an example of the old rule that hardmetals wear less than softer ones, but in pump vanes the two alloys were heat-treated to exactly the same hardness of 60-62 Rockwell C. Running them in theauthor's laboratory showed a consistent difference of about five-fold. A verydesirable effect was also noted (see 4.2) in lead-plated ball bearings, wherealloys without tungsten (i.e., 440 C stainless steel) failed to show muchbenefit from the plating. The mystery is deepened by the fact that high sur-face energy elements are less abundant at the surface, in accord with theGibbs-Duhem principle discussed further below. Tungsten is also quite vulner-able to oxidation (Kubaschewski 1962) which would lead to its rapid removalfrom the surface.
Some vital information may be found in 7 recent patents to duPont(1971), covering a system for producing lubricants "in situ" by the polymeriza-tion of thin liquids which are passing through the equipment. The vital stepis a reaction at the rubbing surfaces of two alloys, one of which must contain6 to 12 atom percent of tungsten or molybdenum. Most of the data covers molyb-denum, with tungsten only being tested once out of ten examples (and comingoff second-best that time), but they are given equal weight in the claims.Also cited, as third-rate choices, are chromium and manganese. This anomalywill be further discussed in Section 5.5 under the subject of "surface resin",and in Section 7.5.1.
4.5 Optima in Blended Lubricants
There have been observations for some time that blending togethertwo different types of liquid lubricants would sometimes result in a productwhich was far more satisfactory than either. One of the first reported ex-amples was blending low molecular weight dimethyl silicone oil with diesters.Testing on the Ryder Gear Machine, the silicone alone carries very little loadbefore scuffing. The diester, typical of base stocks for jet engine lubri-cants, scuffs at 1800 lb/in. Blending 4% by weight of 4 centistokes at 25*Cdimethyl silicone into this ester raised the scuff load to over 3000 lb/in.Unfortunately, these blends foam excessively, since silicone in solution actssimilarly to soap in water. (Silicone acts as an anti-foam agent only when notin solution.) Hence, this work received only scanty attention and some ratherfanciful explanations (Matuszak 1959). Recently, one of the silicone manu-facturers has come up with what might be called an "internal blend", in whichtetradecyl replaces one of the methyls (Brown 1966, 1970). The resultingliquid is reported to have quite exceptionally good properties, even protect-ing aluminum-on-aluminum is reciprocating motion.
In passing, it may be noted that the poor performance of dimethylsilicone constitutes a negative anomaly. These fluids appear to have idealproperties, but fail rapidly due to wear at light loads and scuffing at moder-atp loads. This is caused by the polymerization of the siltcone to a hard,sandy resin which acts as an abrarive (Currie 1950, Tabor 1965, 1969).

-19-
an A much more important example of an anomaly in blending arose duringainvestigation ohihpump wear in aircraft fulsystems (Appeldoorn 196,6,
1967A, 1968B). In Figure 4-2, the results obtained in air and in argonatmospheres with blends of isoparaffinic and polynuclear aromati~c componentsare shown. The conclusion was that over-re7ining the fuel (i.e., removingnearly all the aromatics) caused the high wear. While this is a perfectly
valid conclusion, it is evident from the Figure that atmosphere affects the
optimum blending ratio. This will be discussed in Section 4.7. 'Some anomalies in re-bleadiflg components extracted from lubricating
oil by silica gel proved to be more complicated (Groszek 1967-8, BeerbowerI1971D). This work is discussed in detail in Section 7.5.3.
- T -
IN AIRQ IN ll R.0 _op 1
%BAOL 5~ OO 0 0 40 2 0
0 20 40 60 s0 100NAPH4THALENE; COMPOSMTON
Figure 4-2
Optima Obtained by Blending an Isoparaffin
(Bayol 35) with a Polynuclear
Aromatic (1-methylnaphthalene)
tI
-20 -
4.6 Competition of Additives for Surfaces
A phenomenon which has been under investigation since the 1920's isthe ability of additives to seek out the surface and, in effect, act as thereal lubricant while the base oil merely serves as a solvent or carrier (plusits functions as a viscous-film former in the mixed-film regime, as a heattransfer medium and a flushing agent to remove wear particles from the actionzone). No doubt this work was sparked by observed differences between thefatty oils and mineral oils, since it took the form of putting small doses ofthe former into the latter. The results must have seemed miraculous, as theyproved that less than 1% of fatty acid converted the hydrocarbon lubricantinto the equivalent of a fatty oil.
This "Germ Process", as it was first called, was mysterious only be-cause the principles laid down by Willard Gibbs had not yet been reduced tousable form. We now know that such behavior is simply the universal tendencyof a system to equilibrate at the configuration which has the lowest freeenergy, and that is when the metal surface is nearly 100% covered with oleicacid,
However, in the 1930's and 1940's, many other types of additives wereintroduced, sometimes with very embarrassing results. A highly complex lubri-cant of the 1950's might well include:
"Oiliness" agent, such as oleic acid,
Antioxidant,
Sludge dispersant, typically calcium sulfonate
Pour depressant, usually alkylated naphthalene
VI improver, either polybutene or polyacrylate
Antifoam, a dimethyl silicone
Rust inhibitor, often a complex acid or amine.
The results were difficult to predict, and led to a set of rules on "anta-gonisms" and "synergisms". Loosely translated, these mean that the experi-menter did not know what happened, but disliked or liked the result.
At the "base-liie" date of 1965, many of these interactions wereroutinely explained on generally accepted grounds, but anomalies still exist.At one time, it was believed that sulfur additives (see 4.4.2) functionedsimply by reacting with the metal surface to form metal sulfide (and presum-ably an olefin), but new data indicate that physical adsorption plays a majorrole. Vere (1969) has shown that thiophene derivatives in jet fuel play arole in lubricating pumps; Forbes (1970) has shown that aliphatic sulfur com-pounds wet the surface in a complicated but predictable fashion, and Grew(1969) has shown that the action of even a very active compound, dibenzyl di-sulfide, can be blocked by the non-lubricating hexadecyl amine. Chlorine ad-ditives have also been regarded as working by simple irreversible chemistry

-4
- 21 -
resulting in metal chloride (see 4.4.3), but Studt (1968) has shown that theycan be blocked by lauric acid. While such effects cnin vaguely be foreseen ]from the Gibbs principle, detailed predictions are not possible. i1
An even more unpredictable effect is shown in Table 4-1 (Appeldoorn1967A, 1968B, 1969). Gibbs' ,.inciple cannot explain how an active anti-wearagent such as tricresyl phosphate can be forced off a surface by such blandmaterials as hydrocarbons, nor especially by a mixture of two kinds. The firstgroup of data show what may be regarded as the normal effect of TCP; in paraf-finic lubricants it acts by coating the surface and so reduces wear. Even thefailure to perform this function in dry argon is predictable, since the tri-ester must be split to become truly a surfactant.
IThe mystery starts when we consider the failure to improve the poor
performance of aromatics, regardless of atmosphere. Aromatics do wet a little
more energetically than paraffins, but scarcely can compare with TCP and itshydrolysis product dicresyl hydrogen phosphate. The real anomaly develops Iwhen we try to improve the already good performance of the paraffin-aromaticblend; not only does the attempt fail, but wear becomes even greater than it Iwas with the aromatic alone in some atmospheres. Discussion of the last lineof Table 4-1 will be reserved for the next section.
So far, it appears that all the effects of competition are bad, inthat effective additives are driven off by inferior materials. This is, ofcourse, what tends to be published in the journals. Cases of synergism tend
to appear in the form of patents, usually so obscured with irrelevant specula-tions as to be very hard to isolate. The fact that this STAF failed to turnup many useful cases should not be taken as an indication that the phenomenoncannot be turned to advantage. For instance, Studt (1968) went on to demon-strate that tetrachloro-lauric acid would displace the simple acid, and havethe virtues of both fatty oil and chlorinated aliphatic. Once quantitativeexplanations of the interaction are available, such models will serve to makeStudt's success routine.
4.7 Ambiguous Roles of Humidity and Oxygen
Until the atomic energy program forced the matter on our attention,it was not generally realized that the atmosphere surrounding a bearing/lubri-cant system had anything to do with its performance. The space program addedto this recognition, and it is now coming to be realized that essentially alllubrication data obtained before 1960 (and a good deal since) is worse thanuseless. Not only did experimenters fail to control the humidity in theirlaboratories; they seldom even bothered to record it. The observed effectsare sketched in Table 4-1, most of which was discussed in the previous sectionfrom a different standpoint, as well as in Figure 4-2. Additional informatiotis provided in Figure 4-3 (Goldman 1970), showing the special nature of theinteraction of arematics with the atmosphere. The region below the line wasoriginally called "scuffing", but Goldman (1969) later re-examined the testpieces and found it to be a special sort of corrosive wear. (These dates arecorrect; the later work happened to be published earlier.)
II

- 22 -
TABLE 4-1
EFFECT OF TRICRESYL PHOSPHATE (TCP)
IN VARIOUS LUBRICANTS AND ATMOSPHERES
(Wear Rate, Steel on Steel)
Lubricant Dry Argon Wet Argon Dry Air Wet Air
Isoparaffin (P) Low Medium Medium Very high
P + TCP Low Low Low Low
Polynuclear High Medium Medium MediumAromatic (A)
A + TCP High Medium Medium Medium
Blend (P + A) Low Medium Low Low
P + A + TCP High High High High
Based on Appeldoorn (1969).

I
- 23 -
10,0001II,
xw 1,000
CL WEAR
• 100
z ACCE LFRATED r
LU 10
.0 1 2 3 4 5 6 7 8
OXYGEN IN ATMOSPHERE,
FIGURE 4-3
BEAImOR OF I1-IYLNummlmLIzw As AFFECTED By MISTUR Aw OXYGENI,
!

- 24 -
The situation is obviously very complicated; it appears that bothwater vapor and oxygen can act to reduce or increase wear, depending on thelubricant. They can replace one another, as shown in Figure 4-3, but wetargon is not quite equivalent to dry air, as shown by the P + A blend it.Table 4-1.
The addition of TCP to the P + A blend in Table 4-1 apparently showsthat this additive is simulating the worst effects of water and oxygen, whileits addition to the P oil has exactly the opposite effect.
There are certainly relations between the additive competition discus-sed in 4.6 and these atmospheric anomalies - at least where TCP is involved.
Oxygen can be regarded as an "additive", at a concentration of about 200 ppmin paraffinic and 50 ppm in aromatic oils. Water is also soluble at about50 ppm in paraffinic and 500 ppm in aromatic oils. These are not too low topermit competition, especially since the effects are apt to be irreversible.On the other hand, both oxides and hydroxides are quite capable of acceptingsome classes of additive, so that competition with the atmosphere may resultin a different outcome of the conflict between two additives.
4.8 The Sharp Transition to Scuffing Wear
One of the most startling phenomena in boundary lubrication is thesudden change from moderate to severe wear and friction, on application of asmall increment in severity, as shown at point Y in Figure 2-1. As long as thistransition was associated merely with a load increment, it could be writtenoff as being parallel to the familiar yielding from elastic to plastic deforma-tion in testing the strength of materials. However, it has been clearly demon-strated that the same transition can be triggered oft by a minor increase inambient temperature; in fact, as will be discussed in Srction 5, there is everyreason to believe that the load increment causes transition primarily becauseit leads to at. increase in contact temperature. Furthermore, this cannot beequated with the known kbtit rarely demonstrated) phenomenon of yielding underconstant load at a certain point while increasing the teniperature, because thefriction/wear transition is at least as dependent on the libricant as on themetallurgy. While this argument is weakened later on, by considerable evidencethat the yield point of solids is indeed affect--d by the nture of the surround-ing liquid or gas, (see Section 5.8 and Appendix V) Lhe currently accepted viewthat the scuffing transition is uniquely related to lubrication will be pursuedhere.
The vertical line at Y in Figure 2-1 is schemrtic, and may very wellrepresent a very steep S-shaped curve (Model II-C) or even a backward-bent one(Model V-C). The physical events are not subject to very precise examinationdue to their violent nature, and the scatter of data is sufficient to fitequally well on a number of models (Section 5). Usually, a small load step isfollowed by a brief period of mild wear, and stopping the Lest during thisperiod shows a typically smooth surface. Pike (1970) describes this period as"1seizure delay" and cites some interesting 4-ball data. Very suddenly, thefriction rises and characteristic noises come from the ma'zhine: squealing,groaning, chattering or grinding, depending on the speed and geometry of the

- 25 -
test machine. (This description applies to machines with test parts of simple Igeometry. When actual gears are used, the change is much less dramatic sinceit takes place at the tooth tips and only propagates under further load incre-
ments.) Stopping for examination now shows a rough surface, sometimes withscuff marks forming a vague pattern reminiscent of overlapping circles. Inother cases, linear marks known as "scoring" appear; the relation of these toscuffing proper is still the subject of debate, but in this report no distinc- *tion will be made.
Often, scuffing wear generates large particles. Unlike those seenin moderate wear, which are near the limit of optical microscope resolution(3 to 5 pm), scuffing particles may be visible to the naked eye.
If the load remains constant a wear rate several times as high asthat recorded at the last pre-scuffed load step is maintained. Increasingthe load causes a regular increase in the wear rate as shown in Figure 2-1,
eventually followed by sudden welding. Decreasing the load will reduce thisrate along a line parallel to the normal wea-.. rate/load relation. Sometimes,at considerably reduced load, healing will take place and a new break-in periodleads to the normal wear rate again. The surface is apt to show wave or ripplemarks, and other evidence of the rough contour period.
Another evidence of scuffing is the generation of a "swarf", orfeather edge of the wear scar. On the Timken machine, which has a cylinderrubbing on a flat block and producing a narrow wear scar 0.50 in. long, it iscottnon to find that one or two small areas have scuffed at the end of thestandard 10-minute test period under loads near transition. The writer believesthis to be a transient situation, and that continued running at the same loadwould cause the scuffing to spread all the way along the scar. This experimenthas not been carried out, partly because the standard procedure allows the tem- Iperature to rise due to frictional heat. Hence, the anticipated effect couldbe attributed (if found) to either time or temperature. Fitting the machinewith a cooling system would provide an interesting opportunity to study the"seizure delay" previously reported only on the 4-ball machine and mertionedabove (Pike 1970).
Unlike those previously considered, the transition anomaly is entirelyto the disadvantage of the machine designer. However, as shown in Table 4-I, itis possible to find cases in which the competition of additives, the atmospheric
effects, and their interaction with one another can aid in shifting the transi-tion point Y (Figure 2-1) to a higher load. In fact, it is this phenomenonthat makes possible operation of gears under modern conditions. Automotivehypoid gears, in particular, could not be operated at all due to their highproportion of sliding to rolling motion until suitable additives were developedin the late 1930's. This is done by a deliberate sacrifice; as shown by theline ending at Z' in Figure 2-1, operation at loads above Y not only involveshigher than normal wear there, but also at loads below Y when the same lubri-cant is used. This is undoubtedly due to the corrosive or chemically reactivenature of the additives. Despite this insight, we may still call operation inthis "extreme pressure" (EP) region anomalous, since recent work has shown thatthe mechanisms long accepted for the prevention of scuffing by controlled cor-rosion are not valid (see 4.4.2 and 4.4.3 above).
16-

i
- 26 -
4.9 Effect of AntiWear Additives on Fatigue
As the lubricant industry has responded to demands for lubricantswith better anti-wear and anti-scuff properties, it has been noticed thattrouble seemed to be arising in an unexpected crop of fatigue failures, oftenafter prolonged service but sometimes earlier than anticipated. This hasbeen particularly the concern of the rolling element bearing users (Rounds,1962, 1967), who have reported some data. It is difficult at this point todiscuss the matter because of contradictions in the data (partly due to lackof humidity control), but it certainly seems likely that some very good anti-wearadditives are responsible. A far less clear-cut case concerned the gear peoplea few years ago, but has been set aside for the present as being of lesspressing importance.
Complicating the situation is the fact that there are severalphenomena grouped together as "fatigue." One of these is rapidly coming undercontrol; it is known as "subsurface fatigue" and arises from slag, etc., in-clucions in the metal. This had nothing to do with the lubricant, as thefatigue crack arose at the impurity and only reached the surface at the time offailure; it is currentiy being brought undur control by vacuum melting.
What may be called "rolling fatigue" arises from micro-cracks in themetal surface that p::opagate downward and then turn parallel to the surface.Eventually, a piece snaps out and bearing failure results at a cat'iotrophicrate. This phenomenon seems t; be definitely related to the lubricant.
"Corrosion fatigue" merges into the rolling sort, and may sometimesresult from high humidity causing the formation of hydrogen by the reactionFe + H20 Fe O + 112 . If so, it must result in more rapid failure as hydrogenhas a very bad effect on hard steels (Berry 1967). The possible roles oflubricants and additives in this mode of wear will be discussed later.
"Sliding fatigue" may be defined as that coming from sliding motion.
It is rather more controversial than the first three, but may well be lubricant-related. It must certainly include a "sliding corrosion fatigue" as a fifthsub-species. The effect is to cause the asperities on the surface to fail byrepeated elastic stressing, and spring loose as much smaller particles thanthose found In rolling fatigue.
So far, this anomaly appears to be largely harmful. However, somedata can be interpreted so as to provide hope for positive results from properly
selected additives - at least in preventing the accelerating effects of corro-sion on rolling fatigue.
4.10 Benefits of a Break-ln Period
It has been long and widely recognized that gear and bearing surfacesshow less wear in service if they have been subjecLd to a moderate period ofoperation under partial load. One factor that was obvious from the beginningof this practice was that the break-in served as a final lapping step duringwhich poorly finished surfaces lost their high spots, which turned up as

- 27 -
visible metal particles in the oil. Various additives were tried; some provedso powerful that they prevented lapping, and when the special break-in oil wasreplaced with ordinary lubricant, rapid wear resulted (Crook 1958/59). Inother cases, there proved to be a chemical factor involved (especially in unitsdesigned for EP service) and clear-cut films of reaction products could beidentified (Grew 1969).
In many cases, however, the process was mysterious - and remains so.With modern finishing and fitting methods available, it should not be neces-sary for the new owner to serve as an amateur machinist by lapping the sur-faces to perfection. Nevertheless, the best finishes from the machine shopstill showed excessive wear until broken in, unless given a pre-treat in achemical bath which formed the equivalent of an EP film. It was evident insome cases that smoothing was taking place; cast iron cylindersin particularshow a "glaze" that has never been analyzed completely. Speculation led tothe concept of a "Bielby layer" of highly cold-worked metal which was bothsmoother and harder than the original surface, biit it could not be detected insome cases and shop processes designed to produce it led to disappointing re-sults.
We now believe that the formation of surface resin is a factor; thiswill be discussed in detail in 5.5.4 and 5.5 below.
4.11 Miscellaneous Anomalies
In the course of this investigation, a large member of workers wereasked to report on any peculiar phenomena that might be added to the list ofanomalies. These are listed below simply in chronological order of acquisition.Some are discussed further in Section 7, but others remain to be investigated.
4.11.1 Anomalously Low Friction was reported by Finkin (1968A)in trans-missions, where moderate friction is required for operation. This was a cop-per-based sintered material sliding on steel. There was a long low-frictionperiod, followed by a metal transfer mode. Friction appeared to be a step-function of temperature. This is discussed further in 7.11.1.
4.11.2 Anomalous Wetting Energy was published by Bernett (1968), and Zis-man was unable to explain (1969) this effect. They had measured the contactangle (9) of various liquids on metals polished with abrasive in water. Allthe metals had the same "critical surface tension" of 44 + 2 ergs./cm
2 atcos 9 = 1, but the slopes (A cos O/AY 2) varied widely. The latter fact may beconsidered anomalous, since it is not widely believed that metallic forces canreach out through the layers of oxide, hydroxide and bound water to affect thebehavior of liquids - especially the non-polar ones used as probes. (Furtherdiscussion in 5.5, 7.11,2 and Appendix V).
4.11.3 Metals of Group B in the Periodic Chart were found (Roach 1956) tohave special properties in preventing the scuffing transition. Other people havefound similar behavior but have connected it with other metal properties, such ashexagonal crystal structure (Buckley 1966). As this goes far beyond the calcium,etc., effects, it is treated below as Model IV in Section 5.6.
. _ ._ -

- 28 -
4.11.4 Multilayers of Stearic Acid have been investigated by severalgroups (Allen 1969A). This may or may not have special meaning in regard tolubrication. Others have found that stearic acid forms only 40% of a monolayer(Anderson 1969). Askwith (1966) found optimum lubrication when oil and additivemolar volumes matched; this leads to 50% coverage (Beerbower 1971C). (Furtherdiscussion in 7.11.4.)
4.11.5 Freshly Purified Cetane is a far poorer lubricant than materialwhich has stood a little while. Tests run on material kept in the dark showhigher friction than on that exposed to light (Johnson 1950). (Further discus-sion in 7.11.5.)
4.11.6 Complex Organic Phosphates have quite extraordinarily low friction(Blok 1970). Castor oil reacted with P205 carried over 1000 kg on the 4-ballmachine at 1500 rpm, with F values as low as 0.006. Despite the low friction,the heat and pressure extruded part of the top ball into a rod projecting amongthe other three. A suspension of bone meal (largely calcium phosphat3) in oleicacid or linseed oil was so slippery the top ball could scarcely be held in itschuck, and the F readings were exceptionally low (limited discussion in 7.11.6).
4.11.7 Diesel Engine Scuffing shows very peculiar effects; the usualanti-wear additives turn out to be prowear (Pike 1970, Davies 1969) as shown inTable 4-11 . The scuffing could be related to conversion of grey cast iron tocementite (Fe3C) (Rogers 1970). "Scuffing" in this case may be something quitedifferent from the sort of transition discussed above (4.8) and related more tosliding fatigue (4.9) but the complexity of the metallurgy, motion, corrosiveatmosphere and anti-corrosion (calcium base) additive interactions render anal-ysis difficult. An attempt is made to relate it to additive-induced fatigue viaModel II in Section 7.11.7.
4.11.8 Wear Due to Suspended Abrasive Particles is dramatically reducedby the addition of minor amounts of additives. Tao (1970) found that smallamounts of oleic acid essentially reduced the wear of an iron or iron oxide par-ticle suspension to that of the clean oil, while stearyl amine did the same forsilica. He was able to explain this only in generalities, not very useful inpredicting how to control abrasive wear. This is discussed in 5.9.3 and 7.11.8.
4.11.9 Delay of Scuffing Transition appears to be more unpredictable(Pike 1970) than transition temperature, which could serve as a check on thenumerous transition theories (further discussion in 7.11.9).

-29-
TABLE 4-11
ANTI-WEAR ADDITIVES INCREASE DIESEL SCUFFING
Relative Wear RateAdditive On Steel Balls In Diesel Eng ines
N one 100 100
Oleic Acid 80 100
Dibenzyl Disulfide 50 145
Isopropyl Oleate 60 195
Zinc Dialkyl Dithiophosphate 40 245
A

- 30 -
4.11.10 Gold Appears to Oxidize, though this is in conflict with all or-dinary chemical thermodynamics. The evidence is that melted gold will not spread1on ceramics in bone-dry argon, but spreads freely in air (Pask 1970). While thisis not a lubrication anomaly, it may be related to some of the effects of atmo-sphere on friction and wear. This matter is given some further attention in 7.11.10.
4.11.11 Water plus Phenothiazine Shows Low Wear, enough so to be used ashydraulic fluid, even though emulsions of 5% of oil in water show high wear.Break-in is very important; if high wear ever starts it tends to continue todestruction (limited discussion in 7.11.11).
4.11.12 Two Consistent Sets of Friction Data can result from repeated testson a single system (Ling 1962). Apparently some chance event starts one or theother of two mutually exclusive processes going, and the result is a pair ofwear or friction curves known as "bifurcation". Johnson (1970B) and various othershave observed similar effects. These frequently are "explained" as instancesof borderline scuffing transition (Y on Figure 2-1), but may have deeper signi-ficance as explaiied in 7.11.12).
4.11,13 High Friction on Titanium is notorious; this is usually accompaniedby scuffing. The problem is so severe that special care must be taken at therolling mills in stacking finished sheets, as they will scuff one another seri-ously enough to be rejected merely by this mild contact. The only lubricantsthat have shown any real promise are those based on iodine (Brown 1968) (Section4.4.3 and Figure 4-1), and these have been used despite serious corrosive ten-
dencies in the earlier versions. Rabinowicz (personal communication) questionsthis conclusion, as discussed further in 7.11.13.
4.11.14 Austenite Versus Martensite. These two structures of steel have
long been recognized to have different mechanical properties. Recently it wasrealized that their response to lubricants was also very different (Grew 1969). IThe discoverers put forth the following explanation: Martensite is the mainconstituent of ordinary, highly reactive steels. Most of the properties ofstainless steels are connected with their austenitic structure. Thus, it isreasoned that austenite is relatively non-reactive. The fine needles of mar-tensite certainly would be easier to attack than the coarse grains of austen- Iite. No literature is cited on reaction rates under static conditions, but anumber of cases of high wear attributable to austeniLe, both preformed and gen-erated by rubbing, were quoted (no further discussion - see 7.11.14).
4.12 Summary of Anomalies. This list shows that, in about ten areas, fric-tion gr wear is markedly less than would be predicted by 1965 models. In anotherten, thck of understanding is leading to incorrect predictions, that may be eithertoo optimistic or too pessimistic. In three cases, machine operation is consider-ably more difficult than was anticipated. It seems reasonable to expect that im-proved understanding would permit more general use of the ten favoiable anomalies,and also avoiding the dangers of working with the ten which are imperfectly predict-able. Understanding the three cases where unexpected difficulties arise might pointthe way to new solutions of these vexing problems.

-31 4
5. ADVANCED MODELS OF BOUNDARY LUBRICATION
This chapter presents a detailed discussion of seven advanced modelsof boundary lubrication which have emerged from this study, Each is applic-
able to a limited range of conditions, and each is to some extent incomplete;but together they provide at least qualitative explanations for nearly all theanomalies and they open the way to a quantitative understanding deep enough tomake what is now anomalously good performance into routine.
A "model" is defined, for the purposes of this STAF, as an equationor set of equations predicting the wear rate (or a transition to another modeof wear) for some specific mechanism of particle generation. Minor exceptionsto this definition are made in a number of cases where multiple mechanismswere found to be at work, but the overall process is described by essentiallythe same equations. At the end of this section, two auxiliary "models" areintroduced which lead only to values required for use in the true wear models.
5,1 Introduction: Current Design Practices
Aside from the specialized model proposed by the American Gear Manu-facturers Association (Dudley 1965) and discussed below, only the "PV" (pres-sure times velocity) or "rubbing-factor" model has received the backing of anyprofessionai society. It is reconnended in the Handbook sponsored by ASLE
(O'Connor 1968), and TIE (Neale 1968) in the UK for unlubricated bearings. Bothsocieties recognize the boundary lubrication will give less wear than predictedby "PV", but in the absence of suitable equations they recommend it as the "worstpossible case." Thp following discussion attempts to combine the best featuresof both pubiications. ASLE uses equations and one chart, while IME givescharts which are far more detailed, but no equations. The latter publicationis far easier to use. Both depend on the designer meeting two criteria: a simpleheat balance, and the "WP" system mentioned above.
5.1.1 Design of Rubbing Bearings
The first of these is a simple balance of work lost = heat dissipated:
"PV" = WU/Ap = JIAT/F (5.1-1)
where:
W = load, U = velocity, Ao = projected area, S = mechanical equivalent
of heat, k1 = thermal conductivity, AT is the allowable temperature rise, F thecoefficient of friction and "PV" has a more or less constant maximum allowablevalue for any given material. This formulation is from ASLE; IME merely dis-cusses the matter in general terms, and gives typical values, for 16 classes,of allowable temperature, coefficient of friction and thermal conductivity.Equation (5.1-1) is not even dimensionally balanced; it would also raquire thelength of the heat leakage path to complete a valid calculation.
In general, nomenclature (Anpendix I) is based on the ASLE standard as faras is possible. However, "iPV" is so widely used that it is used on this and thenext few pages.

-32-
ASLE shows a correlation of published "PV" values for various materialswith k AT/F (Figure 5.1-1), which could be expressed as
log "V" = log (WU/A ) 0.35 log (k1AT/F) + 2.35 (5.1-2)
though ASLE does not take that step.
The second criterion is somewhat more sophisticated. According toASLE,
"fP" - W U/Ap h P /k t (5.1-3)p mw
where h/t - allowable wear rate, P ff= hardness of material, and k is a wearconstant. This is the equation of a hyperbola, in P and V coordinates, butthe IME charts (Figures 5.1-2 and 5.1-3) show it as being more or less flattenedin the middle. Originally the flat portion was used as a measure of load bear-ing capacity but, as IME points out, this "is an oversimplification and can bemisleading." The materials coded in Figures 5.1-2 and 5.1-3 are listed in Table5.1-I.
This model is related to the well-accepted Archard wear equation
V/d = K W/P (5.1-4)m
where V = wear volume and d = distance traveled -Ut, but since V is not ex-actly equivalent to hA k cannot be quite the Archard constant K. The exactrelation of V to h wout require precise knowledge of the shape of the weargroove in the bushing, or else assurance that all wear is on the shaft. Thelatter is very rare, and wear groove shapes depend on many factors, so thatkw = K is a good example of an "unscientific" (because the wear area is not really
) approximation that solves a very vexing engineering problem.
Equation (5.1-4) is of the utmost importance in wear theory and willbe constantly referred to in this STAY. The constant K will sometimes be calledthe "specific wear rate."
ASLE states that "PV" based on allowable wear rate will usually havea smaller value than "P" based on allowable temperature rise, while IME ad-vises calculating both and accepting the more conservative result.
5.1.2 Design of Gears
By far the most sophisticated model officially recognized for designpurposes in the boundary regime is the AGMA "Gear Scoring Design Guide for Aero-space Spur and Helical Power Gears" (Dudley 1965). The title is quite descrip-tive of its scope and limitations, to the reader who is well grounded alreadyin such matters. It is concerned only with scoring (location of point Y inFigure 2-1 and offers no guidance on friction or wear. It contains specificparameters for two oils commonly used in military aircraft, MIL-L-7808 and

-33-
SINTERED GRAPH. BRZ. -
104
2 LAI

-34 -
Figure 5.1-2
IME PRESSURE-VELOCITY CURVES FOR JOURNAL BEARINGS IUSING MACHINEABLE MATERIALS
V (m/s) I10 - 2 lO 1 1
N e: Unidirectional load wear rate = 1 thol (25gm) in 100 hours_ 108Rotating load wear rate = thou (12 rni) hn 100 hours
10 4
ID I
102 7
10 3
m1100 1o -' - 1°0
10 2 103 I
V (ft/min)

i
35-
Figure 5.1-3
IME PRESSURE-VELOCITY CURVES FOR JOURNAL BEARINGSUSING UNMACHINEABLE MATERIALS
V (m/s)2 11
ote: Unidirectional load wetr rate = 1 thou (25gm) in 100 hours- 108104 Rotating load wear rate I thou (12/pm) in 100 hours
Hi H2
GIA
F G. 10 -7I
1003
10 -
IN I
10 2 16
10n
10 i o10
10 102 103
V (ft/n~n)

-36-
TABLE 5.1-T MAZERITLS FOR THE CHARTS5.1-2 AND 5.1-3
M a c e l( s e e K e y p p e a e e ) M n f c u e
I D@alc''1
,<'v Polytettal P ft Polypenco Ltd
2 0lsretsi Th Polyneetal 8 .1v The Glacier Metl 00. Ltd
A Therwplsetit 3 mohoraht Nylon Polyaold (ttyi1n) I.T Polypeaco Ltl
4 Nyllner(3
) Pollyaile (Nylon) SI Kellett Engineeriug Co. Ltd4
5 Nylon *6(2) Iolyuntile fittIon I P. I.$ T Polypenco Lt'i
Thereoplsatic ( I~ 3) nymd Nln t elt nlcrrmO tB Metal Backed I ylner -oymd N ,D U eletEgneigC t
I tNylnlnt 20 G1,lthlte flib', I nylon TO. Polypesco Ltd
2 Nylanlont 60 Graphtte fjill fln TO. Potypenco Ltd
S Nylasiat W4 M~llytns ilsulpltldo
Thermuplatir with (M,';,) ftlled rvl on TO. Polypenco LtdFiller 4 Nylanlnt WSt Mob, filled ntylon TO. Polypenco Ltd
S Nylatron os(-,) klS fl1d nylon r ust BInhitors BP. Pr. R. S. T Polrrsenco Ltd
6 1 Itsron 094 tS filled nylIon A P Rt PolyDnno Ltd
0 Filler - Met al Glacier' 11(5 I 1 ad .itvolwnatd Porous B HCi W S. The Glacier Meal Co. LtdBacke htonzf on) steel
F- Mn z ii T4L 1 PY. +-j'. Polyperco Ltda IP (ans t IleI d 1W it. 7Crane Pecking Ltd
2 Pluoroeint111 Mica filled M'Wf .? oyenoLd.
3 Glacier 1)01 llunne-traphlte till ed P RP T ~ The Glacier Met l .ltd
4 1 Glacier P1Q2 Graophite fill-~l T The Umnver 11,tal Co. Ltd
Im With Fille I Glacier D1 Bronze-leafd'nal1d, tilled PMW 1ft P Th lcer Vetal Co. Ltd
e I ar 5r t f Illed 1 PE WT tonrac Carho Lt d
, Persaf Inn Glas filhd MT.' R jmal Ltd whaeLtat RulerS'
1 lp CereaiL type filled IMT P.ft.Sb I.E Henry Crossley (akns t
9 fulon"4
) I-Liner Ceai IP4igs tTat 51.1~lL- ll Henry Crosslay (aite t
PIPEwit Pilar I I Gllacter DM MT-lad inrecsated()MeaCoLtS poros broaze on steel B HC V ftd 8 SP The GIlacio er a o t
metal Backed 2 ftulon T-Lisvr
Ba&ring Cirolc type filled ME1- CU Henry Crossley Ipachi~ls Ltd
I ~ rTT r trc. ton av reInforced I-with a Ihert., st rinoed Anpep Indu.,trialetton lbackLni * araphiten m Rd XNir P. o~lcta Ltd
H pffl-oe 2 Fiheralidef'lX M'E) pn1:-aa wev trr i,lfrd
with 4 Iflerot reinforced 1a)(9) Aapep Industrial-~________ -luas. backing B ad Sp 11 Proin cts Ltd
fs~oehsncloth -thermot
IIddrgrn Iwanite w rihnlite ft.Sii.? Tufns1
Ltd
lis atwth Ms, ft Sh.T Woitol Ltd
2 AL2 ~Aahesitbv"1,;t lt.h t russePtlamo wIth I . itile Rt Sh T Ballko Ltd
i Asb~~estos cloth 1.rneism nte wIth araihlte Rt Sh.T. Rlk t
1 ]. t l wint sil ranhlta ft S T.. Tufnsl Ltd4 Bear Brand cc IVnn therm' StI
ltirltttto with ''S Rt M T. iufnnl Ltd
Anrirtos cl o th thersoset
5~~~ ~~ eriete Iinat vIsi h a hite ft atT .3 nt t
R elnfocad with 0 Pt ninrwt 11Filr J ased su rc laerB.h. Walkte Ltd (oitud

-37-
TABLE 5.1-I (Continued)
Cram Lteription No Malarial o#" ipIion Fore Aviabe Miea
| Thermoset-
I Retefored with Textile-thermosct Untted Coke andFiller lainate with graphite TO. Chemicals Co. Ltd(Conelksed) I Orkot ILL Tetile thurmnet United Coke mod
laninate with MoB2 TO. Chemicals Co. Ltd
Tetile-thermset United Coke adlaminate with graphite TO. Chemicals Co. Ltd
8 Orkot I 1 TeltIle-thermococt United Coke andlaminete with Mo? TO. Chemicals Co. Ltd
Teatile-thermnset United Cokn ardamninate with graphite TO. Chemicals Co. Ltd
9 Orkot TL TextIje-thermos et United Coke adlaminate with M,)S? TO. Chemicals Co. Ltd
I ERBJiJ Thernohrt bonded carbo n/Ti irmoset graphite . PVE . MoS2 TO. Nobrac Carbon Ltd
J Carbon.Graphite 2 MS Thermoset bonded carbon/with Filler raphite • PFE o MoS2 T. Nobrac Carbon Ltd
Carbon/Graphite I C 2 Carbon/graphite R. Morgajlte Cnrbon Ltd -- Hig Carbon
Carbon/Graphlte I tY10O Electro-grurhite( 12
. Morganite Carbon LtdSL ]1 - Ins Carbon 2 C18(C) Carbon/graphite R. Morganite Carbon Ltd
Cerbon/Graphite I HY3A Calbon/mraphito ' copper f. M ~rgante Carbon Ltd
o ltnCopperandl Lead 2 MY3D Crhon!rnphite . copprr + led ft. Morganite Carbon Ltd
Carbon/Graphite I WY104 Carbon/gralhite - babbit R. Molvgnite Carbon LtdN with Whiteretal 2 MY106 Csr')onigraphlte + antimony R. Morstnite Carbon Ltd
! CY9C Caron/graphite impregnatedCarbon raphite wIthpiteermos t R. Morganite Carbon Ltd
0 Impregnated with aiThervocet 2 Mi2 Carbon'rnphlite impregnated
with a theoroset TO. Nobrac Carbon Ltd
I eys mi'tal Grapblte filled B&CU.P.S. Sp.I. The.Universal Me~tallic ;
Graphite oIrons) metalo.) MOs2 Packi ng Co. LtdImpregeated Metal 2 Deem Mtal graphite filled ?be Universal Metallic
(Bronzes) metalt o )
Mil 2 B. CU.P.S. lp.W. Packing Cc Ltd
NOTES
(1) Trade name of du Pont (U.. ) Ltd.So (2) Can be used m a sleeve which is mounted by the
CU Cit'poite (bit - .,eeve in a metal housing user in a housing.
PC "emiNl6r?.1ai Cup (3) Trade name of Thomson Induetries, Inc.
P Plate (4) Trade nae of The Dixon Corporation.
Pr Profile -various standards or produced to order (5) Plastic layer bonded to a metal beck.
It Sod (8) Not available or suitable on a thrumt wnhaer.
d LA End Bearing il) Varicualy known an Fabrold and Fabrilube.
8 Strip (8) Sphricl Bearing ()
b spherical Bearing IT Tube A Rod Ed Bearing A rphierica. Bearing
TO No Standard Range Stocked -to order only
S Weaher (10) Metals used are bronze, lend bronze, tin bronze.Iron and nickel.
(I) Fibergllde and Piberelip 00 be headed to verousmaterials P.. steel.
(12) Carbon content negligible.

-38 --
and MIL-0-6081, Grade 1005, on which 48 and 24 gear sets were run, respectively.MIL-0-6081, Grade 1010, was run on only 6 gear sets (all of which failed) sono explicit parameters are given for that oil. Additional tests were run onMIL-O-6086 (4 sets), MIL-L-25336 (3 sets), MIL-L-6082 (3 se.s), MIL-L-15016(I set) and MIL-L-2104 (I set). Analysis ol this data is left to the reader. I
The model is one of those used for calculating "flash temperature".This term is perhaps unfortunate as it has been used by chemists in anothersense, but it seems so well accepted in boundary lubrication that OECD (Rowe1969) lists it with no alternative. However, Lhoy do show it with a doublemeaning. Note (1) of their definition #195 says "at areas of real contact",which is in line with AGMA usage. Note (3) says "may also mean the averagetemperature over a reztricted contact .rea", which is appropriate to Equa-tion (1) and the ASLE model. Thus, the two models have a cotmnon principle,but AGMA has implemented it in a far less naive way than did ASLE. Theirmodel equation is:
Tf= r T0 L[ z, (np)' 4
b LrJLL ed)" J (5.1-5)
T'here:
Tf = flash temperature index, degrees F
Tb inial temperature, degrees F (may be oil
inlet)
t't = effective tangential load, pounds
Fe = effective face width, inches
Ds = surface finish, tins (after running in), 4inchesSJZt = scoring geometry factor Inp = pinion rpm .
Pd = diamettal pitch, transverse operating
Zt is a complicated function involving several angles, the tooth count on bothgears, and the distance between gear centers. W. is also somewhat complicated,It is the tooth loading tangential to the pitch ,circle, corrected for thesharing of load by more than one pair of teeth, and for three combinations ofroll angles
By comparison with the goals set forth in detail below, the modellacks almost everything that a chemical engineer would desire. In addition torequiring laborious testing for each oil, it lacks any means for predicting theeffect of changing metallurgy. In fact, the document does not even mention thealloy, heat treatment, hardness or thermal conductivity of the gears used,
____ ___ ____ -.---.---I~-

- 39 -
though this information is accessible through AGMA. An annoying limitation isthat the surface finish D. must be measured or estimated after running-in; ithas no clear-cut relation to the original surface finish D, and the user is ad-vised to pick a number between 10 and 30, and then warned that his choice"will throw irregularity into the results." Since Ds is subtracted from 50,choosing 30 would give twice the temperature rise of that incurred by choosing10. This corresponds to an allowable loading ratio of 21.33 or 2.5 times asmuch load capacity with Ds 1 10 as with Ds = 30. This is an acceptable engineer-ing safety factor, but the logical extrapolation that gears of 50 micro-inchRMS finish will score under the most trivial loading is not.
The "flash temperature index" alone does not contain any lubricantparameter; that must be supplied from experimental data. For MIL-0-7808, thescoring risk is considered "low" up to T 276, medium from 276 to 339, andhigh above that. The final conclusion, however, is based on a very sophisti-cated statistical analysis of the available data. The risks for both oils areshown in Figure 5.1-4, from which the designer can read them at once; "low"proves to be 5.5% probability, and "high" 307 probability. It is ratherobliquely suggested that 10% probability could be used as a maximum designlimit, but the actual choice is left open.
A simpler and older model is also described but not recommended; itis the "Scoring Index." It does not take into account nonstandard tooth pro-portions, nor does it have any parameter for lubricant quality:
(5.1-6)
(W IFe) 3 / 4 (nt e (ne
SI = -I
(pA) 1/4
with symbols as in Equation (5.1-5). This equation is still recommended byASLE, with the critical scoring index numbers shown in Table 5.1-11. PresumablyEquation (5.1-5) would have been included by ASLE if it had been ready at thetime their Handbook (O'Connor 1968) was written, several years before the dateof publication.
TABLE 5.]-I Critical Scoring Index Numbers
Gear blank temp, F 100 150I 200 250 300
Kind of uil Critical scoring indox numbers
AGNMA 1 9,000 6,000 3.000 IAG.MA 3 11.000 .000 5.000 5.000 2.000AGMA 5 13.0)0 1, 000 7,000 41,00AGMA 7 1,5.000 112.00f 9,000 6 OAGNIA SA 17,000 14,00) 11.000 1.00f)Grade 1065. MIL-0.602B1 15.000 12,100 0,000 6.00)Urade 1010, .IUI L.0.601 2, !2,.)W) !,0(0 6.000 2.000Synthetic (Tutho 35) I 17.000 14.0110 1 11.000 R 0ooo 5,00Synthet. MiL-L-7S08!) 15,000 12,000 i9.000 6,oO0 :;,000

-40-
-~~~ .a- .H- . -'.-. . '-.-.'. .-.
HI(
0 0
w CCo tuz'~ -
(D* o'C
p44-c
H '
t1- 14 T-:4-
0 i
-- b-vIN
r-'-40 )Xa 13j.VN dNJ S-.
- 41 -
5.2 New Concepts
Although the designers are not yet exploiting them, there are anumber of published mathematical models for boundary lubrication which showpromise of design value. They are summari.u -hcre for orientation and discus-sed in detail in the following sections.
EMPIRICAL MODEL - Model I was developed for design of office equipment. Itoffers two possible modes: IA predicts the load that can be supported with-out incurring appreciable wear for a pre-selected amount of travel. (speed timestime). Model IB predicts the wear rate under loads somewhat greater than IA,but still light by military standards. Both have completely developed geo-metrical concepts, but are very deficient in lubricant chemistry - includinglimitations on atmospheric humidity. Each includes two modes of wear: lowtransfer, probably due to sliding fatigue, and high transfer due to some formof metal/metal "adhesion" (MacGregor 1964).
REVERSIBLE CHEMISTRY MODEL - Model II is based on reversible chemistry andprovides a means for varying the lubricant and metal properties over a widerange. It is used for moderate loads and can be shown to join Model I with-out any gap despite the very different forms of the equations. Its weaknessis in failure to take into account irreversible chemistry such as oxidationof metals. Model IIA covers base stock only, TIB adsorbed gases only, and IICadditives dissolved in base stocks (Rowe 1966, 1967, 1970).
IRREVERSIBLE CHEMISTRY - ModelilIA provides for metal oxidation, but not forany sort of adsorption of lubricants and additives onto the metal or oxide.It has not been evaluated on metals other than steel, but it appears adaptableto all other easily oxidizable metals. It also contains a secondary potential
for metals of low oxidation rate (Quinn 1967; Tao 1968A).
Model IIIB covers corrosion of the metal by additives of the extreme pressure(EP) class. Since this follows essentially the equations of Model IliA, andis borderline to the scope of this STAF, it is given a fairly short treatment(Sakurai 1965, 1966, 1967, 1970).
Model !IIC represents catalytic decomposition of the base stock by freshly
deformed metal. This results in polymerized base stock (usually hydrocarbon),hydrogen and metal carbides. Free radicals are intermediate products and maydischarge their energy by several alternate pathways (Eisehens'1969, Beerbower
1971A).
Model IIID requires the presence of a charge-transfer agent such as a poly-nuclear aromatic. Again, free radicals are produced, and one of their prth-ways is the formation of a surface resin containing oxygen and even nitrogenfrom the atmosphere. This is the newest, and perhaps most important, of themodels (Goldblatt 1971).
Model IIIE covers the irreversible interaction of additives with metal, andparticularly hydrate.- metal oxide surfaces. This reaction is probably limitedto organic acids, but these may include acids formed by oxidation of the p'"-
ducts of Models IIIC and HID (Kreuz 1969).

-42-
METALLURGY - Model IV covers metallurgical compatibility and serves mainly toclarify conditions in which the meLal pair is responsible for shifting the scuff-
ing transition to higher loads. (Hildebrand 1950, Rabinowicz 1965B, 1971A).
MIXED FILM - Model V is a concept, still under quantitative development, in which
the load is largely supported by the partial liquid film remaining in the valleys(anti-asperities) of the metal surface. Work has progressed far enough to state
that moderately rough surfaces can be 99% supported by this hydrodynamic filmand still be wearing at a significant rate. (Thompson 1972, Christensen 1971).
FATIGUE - Model VI involves fatigue due to rolling, as opposed to sliding fatiguein Model I, and the effect of additives on this failure mode. (Rounds 1962, 1967).
ABRASION - Model VII covers the effect and fate of wear particles geneiated bythe above modes. (Khrushchov 1956-1965).
Several concepts which are extremely promising will require further workbefore they can be seriously considered for actual design use:
* Neither model II nor III contains any means for adaptation to realisticgeometries, but this can readily be transferred from Model I.
" Models IIIC and IIID ace based on metal-organic interactions that havenot been quantified to engineering mathematics. Both research andmathematical formalization will be required.
* Model V is being actively formalized by several groups, but has twogaps which need to be filled. First, it requires entering the rough-
ness of the surfaces into the equations, and this depends on the historyof the surfaces - the "as-received" roughness is largely wiped out dur-ing use, and no model seems available for computing the resulting rough-ness. Second, the interaction with Model III is of utmost importanceas the surface resin reduces the roughness and thus decreases wear bylightening the load on the asperities. If this happens promptly enough,
it will also decrease the amount of change in the metal topography; so
an iterative solution is likely.
* Model VI is borderline to the project, being aimed only at predictingthe effect of additives on anti-friction bearing fatigue. However,there is evidence that the optimum additives for gears may shorten thelife of the bearings lubricated by a common source - but the extent of
the problem is not yet clearly defined.
In the following sections, the models will be presented essentially asthe authors prepared them, reduced to the common nomenclature of Appendix I. Where
applicable, each sub-model will then be criticized on theoretical grounds. Next,such tests as have been feasible through the use of published data on ordinary
lubrication will be presented and discussed. In Section 6, the models willbe compared with one another, and preliminary step, taken towards combining
them into a ' ixed-mode" model. Applicability to explaining the anomalies
will be tested in Section 7.

43 -
5.3 The Empirical Model for Zero and Finite Wear (Model I)
This model has a rather instructive history. It arose at the IBMLaboratories as the result of their accumulating a large amount of data tobe used in the design of office equipment. Due to this end use, the experi-menters studied wear and friction under lighter loads than commonly used,and came to the conclusion that operation on a wear-free basis for a selectedlifetime could be achieved by proper selection of materials, with due attentionto geometry. In order to handle this increasingly bulky set of data (eventuallyover 1500 data points) a scheme was devised to reduce the observations to atable of two parameters for each combination of slider metal, fixed plate mate-rial and lubricant (MacGregor 1964), plus the mechanical properties of the twosolids.
The tabulated parameters were the coefficient of friction, and a muchless obvious one describing the mode of failure at the end of the zero-wearperiod. Two modes were designated as "high transfer" and "low transfer", andonly recently have been assigned the more conventional names of "adhesive wear"and "fatigue wear" (Bayer 1962, 1968A). A third mode is described as "quasi-hydrodynamic", but it was not considered necessary to list any parameters forthis condition in the tables.
The existence of a fatigue mode of wear between sliding surfaces wasnew and has been quite controversial, but it appears now to be both real andprevalent. It is distinct from the more generally accepted fatigue of rollingelement bearings and is more closely related to the original observations offatigue in flexed rods. In this case, continued elastic deformation of an as-perity (Figure 5.3-1) leads to its eventual spalling off after a microcrack atits leading edge has propagated to a point where the friction force equals thetensile strength of the remaining metal. The writer's concept of this processis shown in Figure 5.3-2. While the originators of Model I disclaim anythingother than an empirical approach, followed by recognition that their equationwas consistent with the Palmgren function (Lundberg 1949), they must intuitivelyhave used concepts compatible with Figure 5.3-2. Unfortunately, a peculiar jar-gon of terms, unfamiliar to lubrication engineers in general, accompanied thisevolution.
More controversy has arisen from the fact that the model was presented
without adequate warnings of its limits of applicability. One of these isimplicit. When the equations are solved, it is found that allowable loads arequite small. Others appear in the tables which accompanied the principal pub-lication (MacGregor 1964); only three metals were used as the ball in the Bowden-Leben type machines used for the test work, and no clear-cut means is providedfor estimating the effect of using other metals for this vital part. The othermaterials were all used in the platen. In addition, only four grades of oil,and in many cases only three, plus dry sliding, are listed. No means was pro-vided for estimating the effect of other lubricants. All changes from the balland lubricant materials are to be handled by a worst-case assumption that theywill result in adhesive wear.

-44 -
Figure 5.3-1
SUCCESSFUL BOUNDARY LUBRICATIONWITH ELASTIC DEFORMATION ONLY- THE
"ZERO-WEAR" PERIOD
Vertical Scale Exaggeratedabout 6X:
Relative Motion
Film Prevents Welding
Realistic Vertical Scale:
Note: In this and similar drawings, the roughness is assumed to have a Gaussiandistribution of asperity heights, corresponding to 4pu in rms and an averageslope of 80. Hence, the contact spot has a diameter of about 200ps in(51L m), as discussed by Williamson (1968). I
I1
I
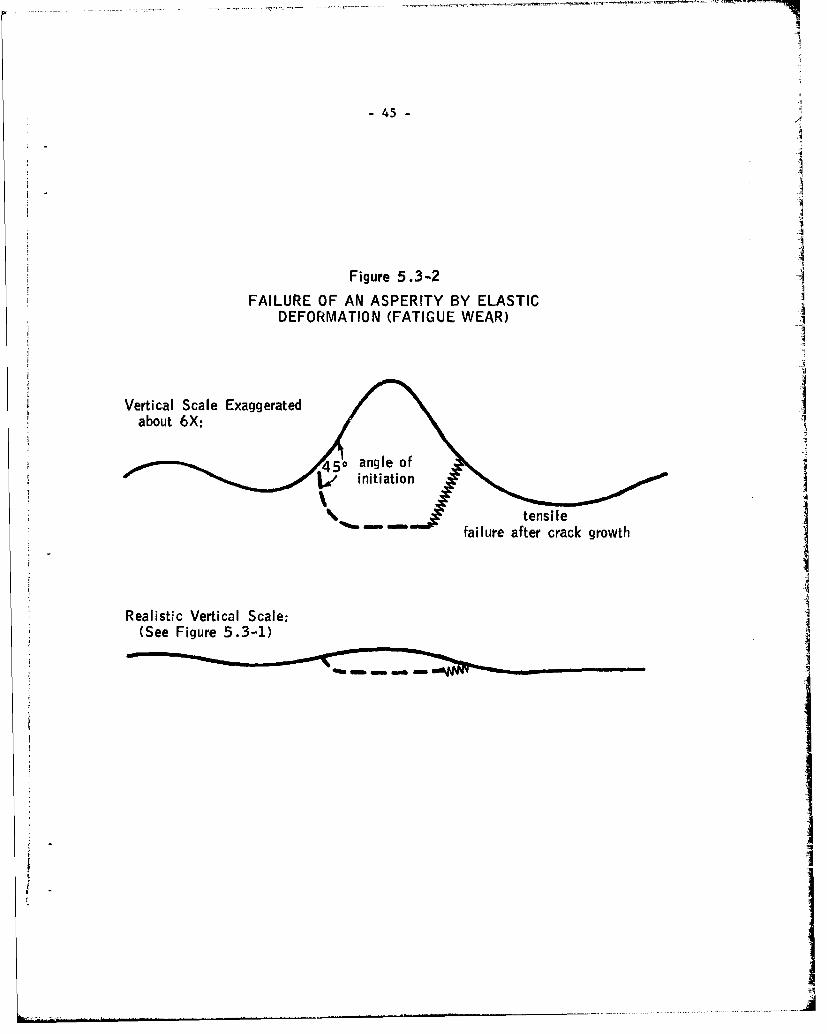
-45i
Figure 5.3-2FAILURE OF AN ASPERITY BY ELASTIC
DEFORMATION (FATIGUE WEAR) 1I
Vertical Scale Exaggeratedabout 6X:I
initiation
tensilefailure after crack growth
Realistic Vertical Scale:(See Figure 5.3-1) , I

-46-
It is possible to adjust the model for different heat creatments of the samealloy, as the hardness is a third parameter. However, that requires assumingthe coefficient of friction to be independent of the hardness. As discussedbelow in Section 5,12, this assumption is very hard to justify. The re-
stricted choice of oils is very irksome to lubricant chemists (Table 5.3-1).
TABLE 5.3-1
LUBRICANTS USED IN DEVELOPING
MODEL I
OIL A: (Socony-Mobil Gargoyle PE 797)
Paraffinic base stock, 32 cst @ 1000 F, with antioxidant and anti-rust.
Flash - 405, Pour - +20, Gravity = 33.0 API, VI = 105, Neut. No. = 0.05
OIL B: (Esso Standard Millcot K-50)
Naphthenic base stock, 85 cst @ IO0 °F, 1% tricresyl phosphate and
about 0.04% of 200,000 M.W. (Staudinger) Polybutene.
OIL C: (Texaco MIL-0-5606)
Naphthenic base stock, 15 cst @ 100'F, r1.5% tricresyl phosphate, a
zinc dialkyl dithiocarbamate and a benzothiazole, plus 5-10% of
polymethacrylate (Private communication from R. S. Fein, May 17, 1971).
Flash - 200, Pour - -75, Gravity = 1.15/1.18 sp. gr., VI 188.
OILO1 A + 0.: wt. % Stearic acid.
Another limitation that is clearly expressed is that sliding velocitiesmus not *- h:.,h, enough to generate a temperature rise that would affect the para-metks. Ith:._4 t it has not been published, the IBM workers have determined that
suii.abl - "ameizers can be obtained by heating the test machine to the anticipatedte pera:.re riS (Bayer 1970). Metal properties do not change much, but those ofpLa;ticL do. efficients of friction tend to be lower under the "high speed"onditiois.

- 47 -
The most serious restriction of all is that the published data wereall obtained at 10% relative humidity (Bayer 1962), They are not generally
applicable at humidities greater than 35%, hut this was not recognized untilabout 1969 and has just beet published (Vaessen 1971). It will be discussedin Section 5.3.3.
As a result of these limitations and the way they were expressed, inunfamiliar terms and by casual mention in the articles, lubrication engineershave tended o be very critical of Model IA. Actually, the criticism seems tobe based on attempts to use it completely outside its limitations, both expressedand unexpressed. It is the feeling of the writer that such an attitude is quiteunsound; instead, it is much more to the point to find out what is good aboutModel I that permits it to correlate all the observations on 520 systems, andthen to try various means towards generalizing it. The authors (Bayer 1970) donot plan to extend the model as it already serves its purpose at IBM. However,they suggest that anyone interested in doing so could prepare tables for othertemperatures and humidities. Plastics in particular need such special handling.
5.3.1 Analysis for Zero-Wear (Model IA)
All of Model I is tied to a concept of unit travel called a "pass"and defined as the distance of sliding equal to the Hertz contact area dimensionin the direction of motion. Model IA uses the criterion for zero wear that themaximum shear stress in the contact area T must be smaller than a certainfraction, G, of the yield stress in shear mXthe material, T . Hence, the follow-ing inequality defines "zero wear conditions": Y
tma G<t3 (5.3-1)max y
When the number of passes (N) is 2000, G has the reference value G0 .GR can have one of three possible values, depending on the materials and lubri-cant. For full hydrodynamic lubrication G = 1.00. For boundary lubrication
RGR = 0.54 designates systems with low susceptibility to transfer and G = 0.20for those with high susceptibility. No systems showing GR values intermediatebetween 0.20 and 0.54 have ever been detected, indicating that these representdifferent sub-regimes. Values of G are tabulated for over 500 systems, and
Rfor unlisted systems GR = 0.20 is usually assumed. For N> 2000 passe-
1/9= GR (2000) (5.3-2)
It must be realized that these two v'rlues of GR can lead to verymuch wider differences in design than just their ratio of 2.7, which appliesonly to the Hertzian stress. In terms of allowable load, the ratio is (2.7)
3
= 19.5, or in zero-wear life at a given load it is (2.7) 9 = 13L,136. Thus, afalse assumption of 0R= 0.20 leads to a very conservative design, and a morecertain means for selection is highly desireable. Scanning MacGregor's Table111-3, we find that the lubricant tends to dominate the situation, as shown inTable 5.3-I. Essentially all unlubricated systems fail by adhesive wear, andall stearic acid solution lubricated systems by fatigue. Beyond that, thepattern is less clear.

I
-48-
TABLE 5.3-TI IEffect of Materials on Mode of Wear
(Ratio of Fatigue Mode to Total Tests)
Alloys in PlatenBall Lubricant Stainless Steel Nickel Copper Aluminum Total % Total
52100 None 0/7 1/20 0/3 0/3 0/6 1/39 2.5A 2/7 9/20 0/3 2/3 6/6 19/39 48.5B 3/7 10/20 2/3 2/3 4/6 21/39 54.0C 0/7 4/20 0/3 2/3 3/6 10/39 25.5D 4/4 13/13 0/0 3/3 6/6 26/26 100.0
302SS None 0/7 1/19 0/3 0/3 0/6 1/38 2.5A 6/7 12/19 0/3 2/3 5/6 25/38 66.0B 5/7 13/18 0/3 1/3 6/6 25/37 67.5C 3/7 7/18 0/3 2/3 5/6 27/37 46.0D 4/7 13/13 0/0 2/2 6/6 24/24 100.0
BRASS None 0/7 0/19 0/3 0/3 0/6 0/38 0.0A 0/7 0/19 1/3 1/3 2/6 4/38 10.5B 4/7 20/19 313 2/3 1/6 20/38 52.5C 0/7 0/19 0/3 2/3 0/6 2/38 5.5D 1/1 9/9 0/0 0/0 0/0 10/10 100.0 I

I
- 49 -
It is evident that the made of failure is :ighly dependent on both ball andplaten metallurgy. The three oils might be expected to line up according totheir tricresyl phosphate content B C A, but actually come closer to their vis-cosity ranking B A C. It appears that the n,'mbers from which Table 5.3-11 was
compiled still contain some hydrodynamic lifting, despite the authors' effortsto screen this out into the C = 1.00 mode. Recent advances in this area arediscussed below, in Section 5.7.
Use of the model is by stepwise calculation. First, the contact stressT is calculated from ;he Hertz formula appropriate to the geometry, the load,tleXradii of curvature, the Young's modulus and Poisson's ratio of the materials,
and the coefficient of friction of the system, F. A stress concentration factormay he used to correct the Hertz formula for sharp corner-, and non-Hertz casescan also be handled. A very ingenious system is provided for handling plated,
case-hardened and other nonhomogeneous materials. Values of F must be lookedup from the same table as G , obtained experimentally or estim ited by analogyfrom listed systems, As will be discussed below, this estimate must be madewith care, as an error at this point can have unexpectedly large consequences.
The number of passes for zero wear (N ) may be estimated by combiningInequality (5.3-1). with 9(at3on (5.3-2):
/T GR\
No = 2000 9 (5.3-3)
However, the lifetime of each member must be considered separately.
For the "fixed spot" member, on which the contact spot does not move, the zero-wear travel d 0in inches of relative travel is given by
0
d SL = HN (5.3-4)
where H is the length of the Hertz contact spot in the direction of travel, Sthe distance traveled per revolution or stroke and L the lifetime in revolu-
tions or strokes. 0
For the "moving spot" member, on which the contact spot keeps moving,
d = SL = SN (5.3-5)0 0 0
The lower of these d values is taken as the lifetime of the system.
The equation for the sphere is
(5.3-6)

50-50 4
where q is the maximum stress in the T Hertz contact area and V1 is Poisson'sratio for the metal of the sphere. For1m~is geometry
q,= .___ ,L_ __l,,
] 11,., 1
,. (5.3-7). 4
where W is the load, El, and E are Young's modulus for sphere and plane, and r
is the radius of the sphere. By definition
qo = 6 W/H" (5.3-8)
where H is the Hertz dimension in the direction of travel.
Combining all these equations,
2000(-vyGR) 1 1.06
o = (/I - 2vi)2/l6+F) 9 (6W) 2 '6 7E') 6 4 (Ei
where 2lI/E' V( -v)/E 1 + (I - V2/E 2
As Poisson's ratio is usually about 1/3, the first term in thedenominator of Equation (5.3-9) can be apprcximated by
(0.007 + F2 ) 4 "
This simplification helps to illustrate the serious consequences of mis-estimatilgF. Taking the example of a copper ball on 52100 steel used by Beerbower (1971A)and discussed briefly in 5.3.2, an error of 0.01 in F leads to an 18-fold changein d Mathematical methods for estimating F are discussed in some detail in 5.12.
0|
Equation (5.3-9) also denIonstrales the approximate equivalence 01 ModelIA to the Palmgren (Lundberg 1949) function d W3 = constant since F is assuredto be a constant for any given combination of0 materials, regardless of load andgeometry. Thus, Model IA has the correct dimensional relationship for a fatiguefailure; its application to adhesive failure must, at this point, be regarded asempirical.
The fact that "zero-wear" periods are rarely reported in the adhesivemode probably reflects the relatively low do values which could easily be missed.The IBM workers ubserved this to happen in 313 cases (out of 520), which shouldbe proof enough of the reality of the phenomenon.

-51 -
This model is given a brief numerical evaluation in Section 5.3.2.For the present, it can be concluded that Model IA is useful in locating pointA in Figure 2-1 but needs generalization for higher speeds and humidities. Italso needs more reliable methods for estimating GR and F (see Section 5.12).
5.3.2 Testing Model IA
Tests were built around using the data obtained by Rowe (1966) indeveloping Model 11. This involved similar geometry and many other factors incommon. It was no' ?alized at first, but the low humidity was also important.Two differences die cause some concern; Rowe loaded his machine more heavilythan Bayer would have, and lie conducted his test in a nitrogen atmosphere. Thelatter proved to be of little significance as Bayer reported his wear to belargely metallic, so his dry air had little corrosive effect in the Model IIIsense.
The results have already been published (Beerbower 1971A), and it wouldnot be valuable to go through them in great detail. A computer was programmedto print out the zero-wear distance for various loads and coefficients of fric-tion; the results are shown in Table 5.3-1lI. It was rather disappointing tofind that these distances were so short Rowe would scarcely have observed them.Fortunately, another set of data turned up at the last moment. Vaessen andde Gee (1971) had msentioned these tests to the writer during a visit to theirlaboratory. Their data areshown in Table 5.3-IV. While they do not coincide1007 with Model IA, it is evident that they achieved satisfactory predictionsonly if the humidity at their test machine wis kept as low as that in the IBMlaboratory. Their data are too fragmentary co serve this purpose, but it isevident that they have established the need for a substantial increase in thescope of Model I. it will be necessary to provide some sort of tabulation ofthe "critical relative humidity" for various metals, above which they are coatedwith a film of water which is presumably bound by the corrosion products. Table5.3-V shows the observations of Vuessen and de Gee, in comparison with those ofHudson (1929). It also appears that fatigue failure may well show a proportionateresponse to relative humidity, through hydrogen embrittlement, on hard steelsbut not on most other metals (Berry 1967). The water is not '"uomalous" but issimply bound to the oxides (Dal 1965) as confirmed by interviewing J. P. Roberts,
Comparison of Model IA wi tL Appeldoorn's (1967A) data on 13 pure hydro-carbons in air at 50 + 15% RH proved very conclusively that the model is notapplicable to steel at that humidity. Out of 72 points, 28 were predicted forzero wear, and none were observed. Oil selection was not a problem, as actualF values were used. The details are shown in Table 5.3-VI.
The writer published the results of the latter tests as conments onthe Va2ssen and de Gee paper (Beerbower 1971F). The authors responded with essen-tially a fresh development of Model IA, "in a classical manner". Changed to thesymbols of this STAF, they proceed from the premise that surface fatigue is themain process, and any other nodes mentioned are merely tendencies during thezero-wear period. Hence, all contacts are elastic (cf. Figure 5.3-1), whichimplies polymeric or very lightly loaded metal surfaces.
- -N

-52-
LfD '0 r. 0 C-4
H-4 -~ "
0) 0 0 '
%0 x n X x
m ~ 'H m '0 -
I
o0 0a,0 1V) r- .4p 00 -C 14
'00 O\0 0m . o
r- LI00 - 0
0n< 0 0 0 0 .-1 - H -~-C%4x N
xO - xH 0
0 C0u u.
0 0 00 0 0)
'H- r. CO 0 '
N -4 '4 ~ -0
N N
CO;
d) .,, f- 11)-
- NO In
CD C D 001N ~ 00 -

- 53 -
TABLE 5.3-tV
NOBLE METAL ALLOY TESTS OF ZERO-WEAR MODEL
['in = 70% Ag, 20% Au, 10% Cu; Disc = 55% Cu, 18% Ni, 27% Zn
Test duration 72 hrs
LOAD WEAR RATE OF ZERO-WEAR PERIOD COEFFICIENT PREDICTED
(is) PIN (tm/hr) (hrs) OF FRICTION (F) ZERO-WEAR (hrs)
Relative Humidity = 0%
7 <0.01 >72 - 1820
8 <0.01 >72 - 530
10 0.7 3 0.8-+O.6 72
15 1.8 1 0.8-*0.6 2
40 2.4 <0.02 0.6 3.10 -
60 4.1 <0.02 0.6 8.10 - 6
Relative Humidity = 60%
20 <0.01 >72 0.6 57000
30 <0.01 >72 0.6 1520
40 <0.01 >72 0.6 110
50 42 9 0.6-0.5 15
60 50 0.5 0.5 3
70 62 0.5 0.5 0.75

r
I
- 54 -
TABLE 5.3-V
CRITICAL RELATIVE HUMIDITIES OF ALLOYS
Alloy Composition Critical RH 2% Weight Gain Method and Reference
55 Cu, 18 Ni, 27 Zn 55% - Wear Test (Vaessen 1971)
90 Cu, 9.5 Sn, 0.5P 45 -
85 Cu, 15 Zn 35 -
70 Ag, 20 Au, 10 Cu 55 -
99.9 Cu 30 -
70 Cu, 30 Zn 60 70 Weight gain (Hudson 1929)
60 Cu, 40 Zn ,-60 75 "
70 Ni, 30 Cu -'60 75
Zn ~-75 80
Cu -75 80
Al -80 95+
Ni* 42 60
Ni 65 70
80 Ni, 20 Cr 65 70
80 Cu, 20 Ni 70 75-80
Fe -"80 -100
A

- 55 -
TABLE 5.3-VI
ZERO-WEAR PREPICTIONS ON PUREHYDROCARBONS
Code Hydrocarbon Load (grams)
30 60 120 240 480 1000 2000
1 n-Octane - -
2 n-Nonane -* + - -
3 n-Butylbenzene - -
4 Diethyl cyclohexane - -
5 n-Dodecane + + + -
6 Tetralin + + + -
7 Decalin + + -
8 1-Methyl naphthalene + + + - -
9 1-Hexadecene + + + - -
10 n-Hexadecane + + + + - -
11 Heptamethyl nonane + + + - - -
12 i-Propyl bihexyl + + + -
13 Dimethano decalin + + + -
Code: + predicted zero-wear, not observed- predicted finite wear, observed.
Materials: 52100 steel ball on 52100 steel cylinder
Conditions: 50±15% relative humidity air, 240 rpm, 32 minutes.
*Reversal due to an abnormally high F value at 30 gin.
- 56 -
Most materials show surface fatigue in 103 to 104 cycles if TmaxOTy for 0.95<a<1.00. However, we must consider that on a microscale the trueasperity stress (Tmax) is greater than the mean Tmax used by Bayer by a stressconcentration factor (W) so that
trnax Vtinax (5.3-10)
If, for a certain material, N is the endurance for Tax 'OT then
Tma x = 4ty/4 (5.3-11)
Applying the Lundberg-Palmgrcn (1949) relation
No = N 5 Tymx (5.3-12)
where the exponent 9 is a rough value. This is identical to (5.3-3) if GR =
nc/p and N = 2000. Because of the 9th power, the value of N is not very critical,and use of (say) 16000, about the upper limit of cycles to failure, Tnax increasesnot more than 26%. Thus, 2000 is a plausible value, and Model IA is no longerempirical.
The reason for GR values clustering around 0.2 and 0.5 must lie in theadhesive bonding tendency of the materials. The authors feel that every dry sys-tem starts running with CR around 0.5 (or p 2). If adhesion is high, transfertakes place in the first few passes. Even if continued transfer is prevented(as by oxidation) the result will be a drastic increase in %. It seems reason-able that q, would level off at about 5; hence, GR : 0.20 is the result. Ifthis does not happen, adhesive wear takes over and fatigue never "gets a chance"to become the principal mode of wear.
They end "A consequence of this reasoning is that, in each system withGR Z 0.2, it must be possible to find evidence of weld formation and transferafter a small number of passes; Further, although it is reasonable to assumethat the usual machining processes all result in roughly the same "start" valueof 4P Z2, it should be possible to produce surfaces with higher ' values by ma-chining alone. We recommend that future research aimed at clarification of themodel, should be performed along these lines."
5.3.3 Analysis of Finite Wear (Model IB)
The end of the zero-wear period represents an abrupt transition intoanother regime. The criteria already discussed are used to classify this intoone or the other of the two modes - fatigue with 0R = 0.54 or adhesive with GR= 0.20. However, it is quite possible for the mode to change almost immediatelyafter finite wear starts on a ball, since the contact geometry soon becomes flat-on-flat.
- 57 -
Under fairly light loads, this can cause a shift from adhesive to fatigue wear,so that an experiment may be necessary to avoid a very serious error in pre-diction. A shift from fatigue to adhesion is highly improbable.
It must be recognized at the start that only one of the surfaces isexpected to show finite wear, while the other one is expected to remain in thezero-wear condition described in Equation (5.3-1). The wear on the first sur-face is predicted by a differential equation which is basically a statement thatwear is a function of the energy dissipated per pass:
. dV (5.3-13)
This equation can be integrated only for specific situations, of whichonly the Bowden-Leben type machine used at IBM will be illustrated. ConvertingA , the cross-sectional area of the wear track, to the more useful wear trackwidth (in this case, equal to ball scar diameter) is done by an approximationbased on a triangular area formula
3A t w (5.3-14)16r
Wear on the ball results in a flat-to-flat geometry, so that
2 0.5Ti H = 4W(O.25 + F) (53-15)mx7Tw '(.-5
Making these substitutions and integrating for ball wear,
0180.530 2 0.265 (.-6w C(LrS) w (0.25 + F) (53-16)
where C includes the original C' times several numerical constants. Neither C'nor C can be developed directly from material properties.
By establishing a formalization of the definition of zero wear, it ispossible to establish a useful relationship between Models IA and IB. This isdone by defining the depth of the "zero" wear scar as half the surface roughness,D. From this and the triangle approximation, the zero wear scar width
w = (8rD)l/2 (5.3-17)
Assuming that all the other factors in Equation (5.3-16) remain constant,
w = w (L/L0 ) 0.118(5.3-18)
For platen wear the exponent becomes 0.133; for adhesive wear of the ball, 0.250and of the platen 0.333.

?I
-58 -
These exponents may be converted to a volume/distance wear rate forcomparison with Equation (5.1-4) and other models, by using an approximate formulafor ball wear:
V = irw /64r (5.3-19)
where r is the ball radius. Combining this with Equations (5.3-4,6,8 and 18)results in the working equation for fatigue wear on the ball:
-3 D2W1 26(E')31 l - 2v 1)/16 + F2] 2 . 12
(V/d) = 4.80xlO d0 .528 2 ( 4.25 (5.3-20)
y r
Similar equations may be built up for ball adhesive wear, and platenwear in both modes. All resemble (5.3-20) except for the exponents. Both adhesivesituations have d to the 0 power, as in Equation (%.1-4), but they do not have
W to the first power due to involvement of F. This is discussed further in 6.1.
Bayer demonstrated that L is independent of surface finish (1962).It is proper to substitute the L value obtained from Equation (5.3-1) intoEquation (5.3-14) as this point represents the intersection of the zero wearline with the finite wear curve. This is a discontinuity, where the ball ceasesto have a spherical contact on the plane. Another discontinuity comes when thesecond member starts to wear, and Equation (5.3-14) is not applicable above thispoint.
It is evident that Equation (5.3-20) shows a much greater dependenceof wear on surface finish than most investigators find in the boundary regimes(de Gee 1969). Bayer's tying D to the coarser surface (1968A) has been reconsideredand the writer believes it best to use the roughness of the surface expected tofirst show wear. This is necessary by the definition (5.3-14) and is compatiblewith the general nature of adhesive wear. It is important to use peak-to-valley(PTV) values for D. If only root-mean-square (RMS) values are available, they mustbe multiplied by 2 v- (Beerbower 1971A) , if the surface is assumed to be sinus-oidal as was done inall calculations in this STAF. Akin (1971) uses an emiricalfactor of 4.5 for less idealized surfaces, and also a factor of 5.4 for centerline average (CLA) values (personal communication, March 14, 1972).
There is a case in which the roughness of the nonwearing surface issignificant, but it is so special as to be outside the scope of this study.It is usually the result of very poor design in which the harder member actsas a file on the softer one. This is known as "two-body abrasive wear", ai dis set aside. However, the similar case in which hard foreign matter embedsin one surface to create the "file" is covered in 5.9.
At this point it is necessary to look again at the definitions oftianomalous". Figure 2-1 is predicated on the idea, expressed in Equation (5.1-4),of a wear rate that does not vary wiLh time. Fatigue wear as described abovevaries aa the -0.528 or -0.60 power of the distance (or time at any constant
velocity) counted from the start of finite wear. Prior to Lhat, it is "zero" asdefined in Equation (5.3-17). Rather than to attempt to broaden the concept ofFigure 2-1 to accommodate this special case, it seems preferable to live withthe fact that in fRtigue mode "wcar rate" musL imply "relative to the standardlubricant, in fatigue mode, after the same distance of travel."

- 59 -
5.3.4 Testing Model IB
The finite wear Model IB was screened against the same three sets ofdata. Table 5.3-VII has already been published (Beerbower 1971B) and need not befurther discussed, but the comparison with Rowe's (1966) data in Figure 5.3-3 isnew. This plot required a little thought, as Rowe did not report details suchas individual run length. Hence, the lines for Model IB represent about theupper and lower limits of his experiments (39,000 and 390,000 inches in Table5.3-VII). The upper limit of Bayer's criterion d_ < H falls below Rowe's lowestload, but his correlation line vas transferred (aong with most of his points)to Figure 5.3-3. The worst problem was that when the fatigue constants (G =0.54 and exponent = 0.118) were used, predictions were far too low; when the hightransfer constants (G = 0.20 and exponent = 0.250) were used, predictions weretoo high. Bayer was hnsulted by phone; he had encountered cases where the zerowear period was high-transfer and the change to finite wear also produced a changeto fatigue mode. The reverse (fatigue to transfer) was most unlikely. The com-bination G = 0.20 and exponent - 0.118 proved an excellent fit to the data, asshown in F~gure 5.3-3. While this is plausible, it does represent one more cautionon Model I that had never been published.
The Vaessen and de Gee (1971) data are too limited for a numerical com-parison, but again the low RH predictions seem to be about right.
The Appeldoorn (1967A) data, as might be expected from Model IA, werecompletely different from the predictions. At low loads, wear rates were severalthousand times those predicted. The gap narrowed until at about 1000 grams load(incipient scuffing) the predicted and actual lines crossed. Thus, not only wasthe model inapplicable, but apparently a mixed mode existed. This is discussed Ifurther below. (see 6.3 and 7.12).
At present, we can only conclude, as before, that Model I is adequatefor 10-307. RH, and capable of expansion.
5.4 Adhesive Wear (Model II)
It is evident from Section 5.3.1 that a value of G (the allowablefraction of yield stress for a zero-wear life of 2000 passesi = 0.2 means adhesivewear, but in symbols more appropriate to the fatigue mode. It might even be con- Isidered to be P way of expressing the negative anomalies from that mode, just as
0.54< GR <1.00 expresses the positive anomalies, due to quasi-hydrodynamic lubrica-tion.
The main line of development of the adhesive mode goes back to Bowdenand Tabor (1950), though its primary source is lost in antiquity. Their labora-tory work led Archard (1956) to formulate Equation (5.1-4). The development ofthis is instructive enough to justify pausing for a brief review. The originalassumption was that the asperities are plastically deformed by the load. However,this was quite illogical and an alternative derivation based on elastic deforma-tion of a surface covered with asperities of random height was shown to yieldresults which are at least dimensionally consistent.
__i

-60-
H 1-1 -4 't7l OD 14 4 - 4 m -- 1 -4 0 C
-4 -4 - 14 -4 H- -1 -4 ".4 -- H- H4 H. -1x I x x m x I I1 I I x m I x I
C ' -1 0 H q ' 0 'r- . '0 Ml -N N 0
.- i H -04 -4 H- 0 1 0 4 -4 (N H- 04 24
I o tI I ID u o n co IT m %n I T coI
Hq H Hq H H4 H H H H- H- -4 H H
In x K K K K XX M K K x K xX K x
H C I en H 4 r- m C.' -4 H O '. N
44I I I . .
0 0 0 0 0 0 0 0 0 0 0
-4 m rI 4* . 0 0 N. el 0o In CO 0'. I n
I I I I I . , I I c
C . 4 (N CO CT 4 Cfl ON c4 4T LC H4 HO C
m.4 (NH 1- CD H (N 4 CT'N H e (nH NmCT
U 0- (N H HO CT' (N H D HO 0 C )' el (N H
>~~~~ re 0 0 0 0 0 0 0 0 0.
fi T~ C'I HA H H A4 r H H j HCT
(n I- mN H (N (N ( ' I'. N 'C Czt -3W m '0 0 W
HOT H.4 H H I-4H -H H -I tn I 1 -
0 I m In In I N I0 I0 H,43 Cl 0000)0 0 0 000 0,Hc - 4 40 4 r -4 r4 .4
(n z
tr. Vr L. C
14 C4 CN H 4 C'( N He4ten (

-61-
Figure 5.3-3
COMPARISON OF MEASURED AND PREDICTED WEAR RATES-COPPER SPHERE ON STEEL DISK, F = 0.25 + 0.01
I I IA
Measured Rate 0
0
00 0
-10 0 0'00Limit of Data
-1 010 cm. Travel
10~ c;.m00 oo ,Limit of Validity
0 A 1(d <H)-3Predicted Rate 0
0.1 1 10 100 1000LOAD, GRAMS
Legend
o Predicted by Model IB for 10~ cm. "ravel
A Predicted by Model 113 for 106 cm. travel
0 Actual wear rate measured by Rowe (1966)

-62-
The plastic model gives as the true area of contact W/P , where Pm is the hard-ness (i.e., the yield stress in compression under penetration hardness geometry).The adhered junctions formed by the deformation are assumed to have a consistentshear strength per unit area (r ) which creates the force due to friction,the coefficient of friction Y
F = TY/P (5.4-1)
which is consistent with Amontons' law since F is independent of load and apparentcontact area, and dependent only on material properties. A
From the same concept comes the wear model, by assuming that thesejunctions are sometimes stronger than the hulk material. This is justified onthe basis that the surface is work-hardened while there are stress cracks beneath
this "Bielby layer". Then, if each encounter produces a wear particle, as shownin Figures 5.4-1 through 5.4-4, the wear volume (V) will be proportional to thedistance traveled (d) and the true area of contact (W/P ). This is the sourceof Equation (5.1-4), (v/d) =KW/P . The constant K has come to be known as
the "specific wear rate". if the wear particle is assumed to be hemispherical,K = 1/3. This is sometimes included in the equation, so any "wear constant"quoted must be identified.
Experience shows that it is extremely rare for each encounter to yielda particle, so that K values usually are far below 1/3. Rabinowicz' (1968) Kvalues are shown in Table 5.4-1; these were originally published as "3K" but wereadjusted to fit Equation (5.1-4).
Equation (5.1-4) is so simple, and fits so much of the accumulated data,that there is a tendency to raise it to the status of a "law" of nature. Noteveryone is in agreement; this includes Prof. Archard who realizes the limita-tions of his model far better than many of his followers. Bikerman (1970) has
been particularly critical of the whole adhesion theory of friction and wear.Unfortunately, his criticism is usually stated so broadly, and so much orientedto his main career as an adhesives technologist, that lubrication engineers tendto turn away without considering any of the points he is trying to make. Hisprincipal one is that Amontons' law can be derived from non-adhesion concepts.
However, his model equation
F = tan 81 (5.4-2)
where elis the asperity slope, requires a slope of 450, far beyond those found
on surfaces, to explain the very ordinary value of F = 1.0. This tends to lendsupport to over-emphasis of the adhesion theory; as will be shown below, severalother wear modes are required to explain even ordinary lubrication, and adhesion
is not necessarily even the most important.

63 --
Figure 5.4-1
ASPERITIES BEFORE COLLISION
Relative Motion
Vertical Scale Exaggeratedabout 6X:
Time = 0
Realistic Vertical Scale:
See Note on Figure 5.3-1

- 64 -
Figure 5.4-2
START OF ADHESIVE WEAI
Vertical Scale Exaggerated about 6X:
Time I millisecond
Realistic Vertical Scale:
See Note on Figure 5.3-1

65-
Figure 5.4-3
CONTINUATION OF ADHESIVE WEAR
Vertical Scale Exaggerated about 6X:
Elastic Deformation
Crack
Time 3
Realistic Vertical Scale:
See Note on Figure 5.3-1

- 66 -
Figure 5.4-4
COMPLETION OF ADHESIVE WEAR
Vert-cal Scale Exaggerated about 6X:
Time 13
Realistic Vertical Scale:
See Note on Figure 5.3-1

- 67 -
TABLE 5.4-I
Specific Wear Rates for VariousMetal Combinations *
Combination Rate x 10-5 Combination Rate x 10-
Cu-Pb 0.3 Zn-Zn 39.Ni-Pb 0.7 Mg-Al 52.Fe-Ag 2.3 Zn-Cu 62.Ni-Ag 2.3 Fe-Cu 64.Fe-Pb 2.3 Ag-Cu 66.AI-Pb 4.7 Pb-Pb 79.Ag-Pb 8.3 Ni-Mg 95.Mg-Pb 8.7 Zn-Mg 97.Zn-Pb 8.7 Al-Al 99.Ag-Ag 11.3 Cu-Mg 101.Al-Zn 13.0 Ag-Ag 108.Al-Ni 15.7 Mg-Mg 122.Al-Cu 16.0 Fe-Mg 128.Al-Ag 17.7 Fe-Ni 198.Al-Fe 20.0 Fe-Fe 258.Fe-Zn 28.0 Cu-Ni 270.Ag-Zn 28.0 Cu-Cu 420.Ni-Zn 36.7 Ni-Ni 952.
* Data by H. H. Hultgren, B. S. Thesis, MIT 1966, cited by Rabinowicz (1971B).See also comments on Merchant (1968) and unsigned article in Product Engineering(August 15, 1966, p1l). Conditions were unlubricated sliding in air, accordingto Rabinowicz (personal communication, March 3, 1972), between two contactingannular specimens, OD = 1", ID = 0.75", pressed together with a forre of 400 gm,and rotated together at a relative angular speed of 120 rpm.

- 6b -
A more constructive criticism was made by Feng (1952, 54A, 55, 57B. 58), whostressed the difficulty of losing the wear particle from the opposing surface(Figure 5.4-4) if it is truly welded in place. His alternative is the highlyplausible one that the wear particle locks to the opposing asperity by meansof step-dislocations, which form a saw-tooth-li<e profile and its replica(Figure 5.4-5). Since this lock holds only as long as the force causing rup-ture lasts, the particle may drop off at once, or perhaps be retained as transfer.Another of Feng's points was used above in explaining the Archard model, thatwork hardening and subsurface cracking help to explain the separation of a moreor less uniformly sized crop of particles. Since the energy consumed is thesame as in the Archard model, Amontons' law is valid for the Feng model. Thefriction-rec.ucing ability of contamination and lubrication is explained bothby reduced dislocation amplitude and alT- by increased film thickness. Thismodel was not carried on to a complete wear equation, but appears to be leadingtowards Equation (5.1-4). It has the very important property that V is thedifference between a maximum transfer Vo, depending on load, speed, work-harden-ing, etc., but not on environment, and VL which depends on environment only.There is no explicit way to introduce any parameters for lubricant quality, butVL includes lubricant. With due respect for the fact that Figures 5.4-1 to 5are exaggerated in the vertical scale by about 6-fold, it appears that themechanismn shown in Figure 5.4-3 would permit a rLlatively small weld to peeloff a piece of metal by compressing it horizontally while progressive tensionfailure extends the crack across the asperity. Since a shear stress parallelto the surface can be viewed as a compressive stress in the leading zone combinedwith a tensile stress in the trailing zone, this mechanism results in Equation(5.4-1) though the meaning of Ty may not be exactly what Archard had in mind. Thus,the Archard and Feng models are by no means mathematically incompatible.
The Archard model was directly concerned with dry sliding, and theintroduction of lubricant terms was due to Rowe, who presented his modifica-tions in three papers of increasing degrees of sophistication (1966, 1967,1970). The basic equation is a modification of Equation (5.1-4)
V = k_,|y (5,4-3)d P.
where km is what is left of K and presumably now equal to 1/3. Y is the Vonlises function for plastic flow which also appears in Equation (5.3-15).
y = (I + 3F2) 0 :5 (5.4-4)
There is room for debate on the use of 3, 4 or even 12 in Equation (5.4-4).Spurr (1964) has thrown some light on this matter, which helps to justify 3in the most relevant cases. There may also be some justification for makingit a function of Poisson's ratio (v), as in Equation (5.3-6).
- -...--- -~ - - & - - -

* n i'~lfM - . ~ 5 h was wop-I- aw.,eraie ,-,e 4 "PW =lflW ---.-=
- -r --r '" :.. ..... " iTT= ' . .. .'
- 69 -
FIGURE 5.4-5
THE INTERLOCKED DISLOCATION MODEL
(b)
Sketch showing roughened interace of pair of actuallycontacting high spots with contaminated surfaces. (a) ForCase that surface film is tenacious, and thin as compared toaverage roughening of interface. (b) Same as (,:) except thatsurface film is brittle. Establishment of metal.to.meral contacton regions shown by dotted lines is possible. (C) for casethat thickness of surface film is close to or greater than averagedepth of roughening of interface.
VERTICAL SCALE EXAGGERATED ABOUT 5OX.

- 70 -
5,4.1 Adhesive Wear With Simple Lubricants (Model IIA)
The key concept in Equation (5.4-3) is the fractional film defect(a) ,s defined by Kingsbury (1960)
-x . (5.4-5)a = !- exp Ut°
where X is the diameter of the spot associated with an adsorbed molecule, Ethe heat of adsorption, R the gas constant and U the sliding velocity.
The surface temperature is
0.5T =T + 1.040 x 10 5F F(U546s b (kI + k2) (5.4-6)
where Tb is the bulk lubricant temperature and k, and k2 the thermal con-ductivities of both surfaces. This is the "surface temperature rise" equationused by Rowe. Many other versions are available, the most sophisticated beingthat of Francis (1971).
The fundamental time of vibration of an adsorbed molecule is
t 4.75 x 10 - (5.4-7)
where M is the molecular weight of the lubricant, Vm its molecular volumeand Tm its melting point.
All of these input values can be estimated or are known quiteprecisely. Rowe tested this equation by back-calculating from wear experi-ments, but the present plan is to use it for design purposes and then judgethe results against both general and anomalous experience. For this purposeone may regard W, U, M, Vm and to as preselected parameters. Pm is obtainablefrom the Diamond Pyramid Hardness, Vickers Hardness Number, etc. or fromMacGregor's Table 111-4. k has a theoretical value for hemispherical wearparticles of 0.33, shown by Rowe to be of the right order of magnitude.
.1The values of X are not so generally available, and it is proposed
to use a simpler parameter, (6Vm/ITNa)1/3 which has proved to be of greatvalue in predicting surface tree energies. This is the diameter of thesphere associated with the surface molecule. Hence,
-t exp (32 x l0 .ERTS (5.4-8)•3 3 x 10
- 5 U(M/T m) 0 .5
As Rowe pointed out, valles of a do not often exceed 0.Cl, so the exponentin Equation (5.4-8) is also quite small and a very close approximation maybe made by simpiitying to
I i i II

I
-71 -
- exp (-ERTs)a 50(5.4-9)
3.23 x 10 U(M/Tm )
Values of Tm are readily available for pure compounds, but for
mixtures such as lubricating oils they simply do not exist. (The pour pointonly indicates that enough wax has coagulated to gel the liquid, or that the oilhas reached a viscosity of about 300,000 centistokes.) Hence, in such cases ageneralized melting point based on the liquid/vapor critical point will be used.
T = 0.40 T (5.4-10) Am c
C IIt must be mentioned that de Boer (1968) has recently taken considerable
exception to the practice of regarding to as the vibration time. A way of
using his new ideas and also eliminating Equation (5.4-10) is discussed in5.4.2.1
As in Model I, the lack of a reliable method for predicting F is
an embarrassment, and possible methods are discussed in 5.12. As a start,
the tabulated values for Model I cover many likely combinations of materialsand lubricants.
A serious question raised by the writer (Beerbower 1971A) still
remains unanswered. This concerns the n:4ture of a when viewed as the fractionaicofect in two films. Rowe,and Kingsbury before him, used ci as if it concerned onlyone memberia--d the other were bare. Since that is most unlikely,
A = U a% (5.4-11)r s
where ar and a re the defects for the two surfaces, would be the Logical
solution based on the probability of matching two bare spots. However, thishas the effe-t 0 cutting tn half Rowe's eminently satisfactory valve ofE 11700 cal/mole. To preserve this, we will arbitrarily define
U W 1 r exp [--(Es+ Er)/2RT] (5..12)
and attempt to justify this geometric mean submodel.
Evaluation of E is quite difficult; fortunately, at the low valuesinvolved, high precision is not required. Very few values are available in
the literature, and Rowe was forced to compare his experimental energies (orheats, synonymous in this case) with works of adhesion from the literature.The work represents only about 60% of this energy (Philippoff 1960) but that
seems trivial compared to other uncertainties. One vexing problem is what todo about the variation of E with o, as shown in Figure 5.4-6, drawn from dataquoted by Bond (1962). It is evident that tho metal surface varies, with aiew "ac.ive sites" having up to 3 times the heat of adsorption of the averagesurface. WJhich is the correct valje of E for use in Equation (5.4-9)?
Obviously, not the. maximum value at a = 1.00, since these are the sites leastlikely tv be uncovered by the process described in Equation (5.4-8), nor the

-72 -
Figure 5.4-6
HEAT OF ADSORPTION OF VAPORVERSLIS FRACTION NOT COVERED
Langinuir Model
I.-
I-
0I-e0~0
LU
0 0.5 1.0
FRACTION NOT COVERED (a)

- 73 -C
mean value from Figure 5.4-6 which includes them. On the other hand, is itlikely that the energy at am 0.01 on Figure 5.4-6 corresponds to that on abearing surface, when the data was obtained from a vacuum evaporated filmand the real surface was formed by the violent process shown in Figure 5.4-5?
Some effort is made to answer these questions in 5.4.2 and Appendix V,but the best answer seems to be that only E values obtained from friction andwear data should be used for design purposes. It is to be hoped, but notpromised, that E will depend only on materials and lubricant with a minoradjustment for Ts .
Viewed for design purposes, Model IIA would require considerableinput data. These are listed in Table 5.4-lI.
TABLE 5.4-IT
INPUT DATA FOR MODEL ITA
Engineering Data: W, U, Tb, F*, rl,
Lubricant Data: M, Vmi AHv) y * Te, &*
Metals Data: Pr, Elm,y1, B, AHs*, Vm*(Two sets
M
Required)
* Redundant for alternate paths.
For Yodel IIC, the same data must beprovided on additives as indicated abovefor "lubricant".
5.4.2 Testing Model IIA
Once again, the Appeldoorn (1967A)data was used for comparison with
Model hIA. The computation plan was to set km = 1/3 and use actual values ofF, V/d and W to calculate first T., then a, then E. Thus, the working equationassembled within the computer was
(I43F 2 0 .5 K (ex4fE/R(T + 1.040 lO- 5 Rn 0 5 0 5fkl(V/d) = (I .3- F2 3.2""dO U(M/Ta2' 05U(/T-25m /,.4-lJ)

- 74 -
Since actual Tm values were available, Equation (5.4-10) was not used. The
results are shown in Table 5,4-IIl. It is evident that the values of E obtained
are by 'to means constant for a given hydrocarbon and are more or less independentof hydr-)carbon type. This is a very serious blow to the entire concept, and it wasserious-y questionedwhether the data might be at fault, due to loose control on
humidity. Another set of data from the same report, in which atmosphere control
was excellent but commercial fuels without additives were tested, was then analysed
by the same procedure (using ASTM D 2386 freezing point for Tm) . The results, shown
in Table 5.4-IV, are equally discouraging. Finally, a small amount of data using
one of the fuels and varying the metallurgy was put through the same routine. Thistime a slight trend could be found, harder metal giving higher E for a given load.
Empirilally, it wis observed that the ratio E/Ts was essentiallya constant for each hydrocarbon. This was startling, since it also makesexp(-E/RTs) a constant, thus throwing all the variation in ac into to (since Uis constant). This violates Rowe's equation (5.4-7) if Vm is considered con-stant; even when corrected for expansion to Ts, the change in V2 / 3 is not
enough to account for the variation in a. Another explanation is considered inAppendix V.
De~oer (1968) has seriously questioned the use of such equationsas (5.4-7) for to. He does not offer any simple substitute, but only a series
of increasingly complex expressions for various cases:
5.4.2.1 For a freely translating and rotating molecule of such low frequency(t.) that hvz <<kTs, where h is Plank's and k is Bultzman's constant,
t = I/V z (5.4-14)
which corresponds to Equation (5.4-7).
5.4.2.2 If the perpendicular vibration is practically in its lowest state,
t= h/kT5 (5.4-15)
which corresponds to gas adsorbed near 25*C.
5.4.2.3 If either translation or rotation is seriously hindered,
to C< h/kTs (5.4-10)
This is comparable to benzene on charcoal, and seems most appro-priate to Model IIA.
5.4.2.4 If all translation mobility is lost, Inequality (5.4-16) is stillobeyed, but to is smaller than before. This case seems appropriate toModel 11C. The raolecule cannot slide, but it can hop from site to site;deBoer cites an example of E = 10000 cal/mole, and assumes A Q for hoppingto be 5000 cal/mole. The time of adsorption (t) may be nhout 3 x 1O"6 sec.,

-75-
00 14 4
I en I t 7) r ITH
tu o If n i%n N0 .2 N m 0 L
e4 a% L C~ c 0 0 7) LA 7) N 0 N A 0
0 LA -. C0% 0 H H 4n N 7)I H (n '~
'-u c 07) 0 0 % H LA '01 1. LA 7 4 N
rzaolc 'I * I1-
1 7)I 7) 7 ) 4 )4 4 4 4
I4'0 A 4 LA 7) 0% 0 % 7 NA L
-) 7 ) 4 4 4 4 -4 14 14 14 4 4
-Lr 4 0n LA 0T Cen N C 0 0 C 0
7) 7) 7)4 7) 7) 4 -* 4 4q 4 4 4
I~ ~ ~~. m
NN n j"C1 C. n e
44 00 x0to
H ~ c 0 N) H A 0 H L0i I- 6 4) 4(JO~ LA m LA LA LA 4 4 LvA A L L
0 -4- 4 i P
-d 4 N 1 4 ) 1 4 4 4L 4C4
01 a14 - d - i1 0 4ou LA 0i 0 n 4 0o H LA LA 4 5
04 N ) 7) 7 ) 4 7)l ) 7
444
(4 0 H 0% H '. 0' 0 C H N 7 fn

- 76 -
TABLE 5.4-IV
HEATS OF ADSORPTION OF COMMERCIAL LIQUIDSON STEEL CALCULATED FROM WEAR RATES
Heat of Adsorption(kcal/mole) Ratio (EIT 3 )
Load (gas) : 240 480 1000 24_ 480 1000Liquid Atmosphere
Synth. Isopar. Dry Argon 16.4 17.9 20.0 43.1 44.5 45.7
Wet Argon 16.1 17.5 20.4 43.5 44.8 45.8
Dry Air 16.2 16.9 17.6 42.5 40.5 41.7
Wet Air 15.3 15.2 18.5 40.4 36.8 38.1
JP-5 Dry Argon 17.1 17.7 20.0 44.8 44.3 44.5
Wet Argon 17.2 17.8 18.6 44.5 44.2 42.3
Dry Air 19.2 18.1 28.4 44.7 42.0 42.2
Wet Air 15.5 16.5 25.2 38.6 40.0 40.0
RAF-176-64 Dry Argon 16.6 17.2 18.5 46.0 44.0 45.0
Wet Argon 16.7 17.6 18.4 44.3 45.0 43.7
Dry Air 17.4 16.9 -- 43.7 41.9 --
Wet Air 15.6 16.7 17.6 41.3 41.0 40.7
PW-523 Dry Argon 17.9 17.2 19.2 45.2 42.9 46.2
Wet Argon 17.4 18.0 19.3 44.1 44.3 45.2
Dry Air 14.8 15.5 22.0 39.4 40.1 39.7
Wet Air 15.7 15.7 19.5 38.7 38.8 38.2
JP--4 Dry Argon 17.0 18.1 22.2 45.0 46.3 46.2
Wet Argon 17.3 18.5 19,8 45.1 45.9 44.5
Dry Air 16.7 18.2 -- 44.7 45.6 --
Wet Air 16.2 15.8 -- 4218 38.4 --
Conditions: 52100 Steel, 240 rpm, 32 minutes,
Grand Han lor Argon --------- 44.5 ---------
Cratd H--an for Air ----------

- 77 -
in which case the temporary "halting time"
t, - to exp ( AQ/RTs ) (5o4 -l?)
comes to 5 x 10⁻¹⁰ see and the molecule makes about 6000 hops before beingdesorbed.
Inequalities are not very promising) but it must be rememberedthat all this means is setting k free again to become an "adjustable para-meter", which can now be defined as
k'm = h/3tokTs (5.4-18)
which helps to explain why Rowe never was able to get km = 1/3. This meanseither returning to his approach of evaluating both km and E from data, orarriving at E by the surface free energy methods discussed above and inAppendix V. Since we have the additional complication of an iterative solu-tion for F, it would seem unwise Lo simultaneously attempt his graphicalmethod for E. Hence, it is proposed to revise Model IIA into:
(V/d) = kmW _ = kmWp 2Lexp(-E/RTs) = W 3kT Xexp(-E/Ts) (5.4-19)
Pmxp(-E/RT 5 Fm Y.y.LXhEB 5
Unfortunately, time has not permitted any testing of Equation(5.4-18), even to the extent of determining whether the presence of Ts outsidethe exponential will permit E to remain constant. However, its derivationseems to justify its being high on the agenda for future study.
5.4.3 Adhesive Wear with Gas and Vapor Lubricants (Model liB)
In his second article, Rowe (1967) carried the model to includethe reversible adsorption of vapor lubricants. To do this, he establisheda slightly different definition of X, the diameter of the circular spotassociated with an adsorbed molecule
X = 2/(rn)0 .5 '5.4-20)
where n is the number of molecules per unit area. While this is compatiblewith his X in Model IIA, it is not related to V1 /3 in the way proposed forEquation (5.4-19) until adsorption approaches a compact monolayer. Thispermitted him to relate X to Henry's law and the.Langmuir isotherm principle.
While Model TIB is a notable scientific achievement, its engineeringapplication is too limited for consideration in this study. Like all Rowe'smodels, it involves reversible processes, which exclude the internctions ofoxygen and humidity with most engineering materials. Those concerned withgraphite, or unlubricated wear in inert atmospheres, may wish to test itfurther.

- 78 -
5.4.4 Adhesive Wear With a Compounded Lubricant (Model 1IC)
Model TIA was designed only for pure liquids, and 1iB for puregases. These limitations were removrl by development of the idea of tem-porary residence of both additive and base fluid on the metal surface in adynamic equilibrium. If a and 1 represent the fractional film defects ofthe area occupied at rest by the two species, respectively
13 (5.4-21)
where 0 is the area fraction occupied at rest by additive. Since each ofthese develops a film defect related to its heat of adsorption as in Equation(5.4-9), this becomes
where A E is the difference in heats of adsorption, x lh2 ratio of molecularI
areas, t o tie ratio of vibration times, X the molecular area of the base f]lid,and to its vibration time.
It is now necessary to evaluate 0, and Rowe chose one of the severz lpossible ways. He set up an equilibrium constant for the .idsorptien-desorptionprocesses of both species which will eventually result in 0 satisfying theGibbs-Duhem requirement of minimum free energy in the system. This results ina special expression for \ = 1, relating the wear rate to friction functionratio (V/yd) for a lubricant with concentration c of an additive, to tile sameratio (V/Yd)b for the base fluid;
. j , (5-.423)
where AS is the entropy change of the entire system.
For the ease where x values are nut sini lar, Rowe ran into nmoredifficulty in eliminating 0. 'Ti.s utose largely because ihis geas incl!iceievaluating x from wear data. If the approach shorn under lidel IIA is taken,this problem is minimized since x simply equals the cube root of tw ratiothe molar volumeq for additive and base fluid. In addition, t o bccomes theratio of the critical temperatures of the two specius. Wen, als often happens,Tc for the additive is not known, it can usual y be estimated lby the LIydIsOrI
method as discussed in Reid and Sherwood (I mh), ii the pioin int ('1, ) i> knOwn.
It is also quite possible to av,,id thes e difficulties by precalcu-lating the composition af the adsorbed !.ayer at eqoilibritmi. Ee rett (1) 5provides means for doing this from activity co(efficients, w4hich Ca. he deivedfrom solubility parameters as described by Prausniz (191"4). Aiiother ailuro1chis to apply the necessary x correction. to Equation (5.4-15) ,'a d cv,lunitm theentropty change as discussed iii Appenldix Vii. ('rosvep (1071) !-iv(ys ;I Dr.k :Jlrefor the dire-'t determinaLion of 1E ill - flw miTrocaloriMLet..

- 79 -
In any case, the tools are available to perform the necessary
manipulation on binary or multicomponent systems. The choice of going intoModel llC with corrections for x / 1 or into Model IIA with a weighted averagevalue of E would be largely one of convenience.
One factor completely ignored in Model II is the fact that puremetals are rarely, if ever, encountered in lubrication engineering. Thisis not particularly hard to deal with in the case of solid-solution alloys.Buckley (1969) has shown that even I atomic percent or less of aluminumalloyed in copper or iron will diffuse to the surface to produce a highlyenriched layer. This is not any specific reaction of aluminum but merelythe same principle that causes soap to coat the surface of water. It iscomnonly believed that Gibbs postulated attraction of low energy tomponentsto the surface, but this is not the case. This principle merely states thatwhen they are brought to the surface by any process, they will tend to remainthere because their departure would cause an increase in free energy, aSecond Law violation. The Gibbs-Duhnm equation merely predicts equilibrium,and the rate of attaining it is controlled by relatively sluggish solid dif-fusion.
This raises the question of the time scale of Model IIC. Whentwo asperities impact as shown in Figures 5.4-1 through 5.4-5, the resultmay be a surviving film or a bare bpot. Assuming that even the survivalcase requires renewal of the film due to partial rupture, we may calculatecertain times on any reasonable set of parameters. Table 5.4-V shows atypical case. The "wearing" members were calculated on the basis of timeto wear a depth of D/2 peak-to-peak (RMS v-2), and the "non-wearing" memberson Model IA. It is evident that the time for diffusion of additive fromsolution is very limited for the "fixed spot" (ball) member, and quite generousfor the "moving spot" (plane) member, regardless of where the wear is takingplace. Whether the time is sufficient for metallic diffusion on the "movingspot" member remains to be investigated. If it is, such alloys can be handledsimply by the Hildebrand (1950) method for mixtures (see Equation 5.5-14).The low surface free energy component may be a metal, or sometimes a carbide, etc.
Table 5.4-V represents an example of the sort of new informationthat arises from this type of analysis. Neither Model I nor II alone wouldlead to the valuable conclusion that additives must be tailored to fit the"moving spot" member if they are to be effective. As far as the writer knows,this principle has never been recognized before, but there is every reason toaccept it as valid based both on its derivation and on practical experience.On this basis, E must be calculated for the "moving spot" member, but Eb forthe harder member, for use in Equation (5.4-21). A more rigorous solution, interms of cI and 01, may be justifiable in the future.
Model II may also be useful in predicting the transition pointat Y in Fig. 2-1, by reason of the rapid rise of the double exponential inEquation (5.4-5), as pointed out by Kingsbury (1960) whose eariy work led toModel 11A. He went so far as to set up an equation for this "characteristictemperature", Tt:
7; Af-(i r-it) (5.4-24)
-. . . . . -2R -
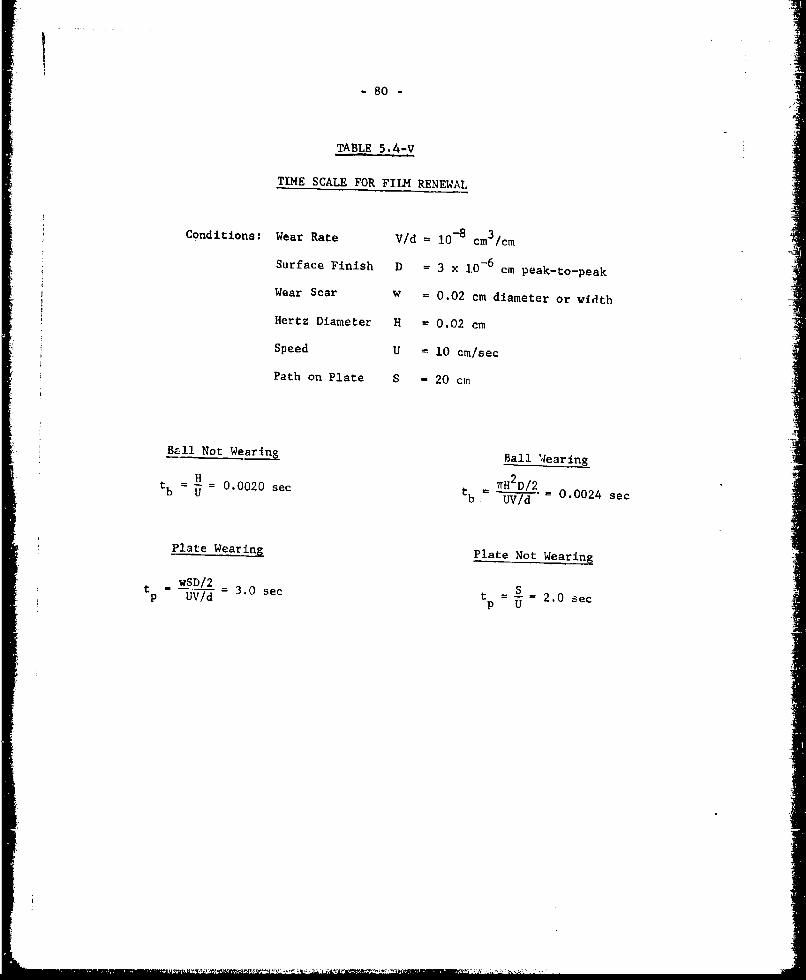
I
- 80 -
TABLE 5.4-V
TIME SCALE FOR FILM RENEWAL
Conditions: Wear Rate V/d 10-8 c 3 /cm
Surface Finish D = 3 x 10⁻⁶ cm peak-to-peak
Wear Sear w = 0.02 cm diameter or width
Hertz Diameter H = 0.02 cm
Speed U = 10 cm/sec
Path on Plate S = 20 cm
Ball Not Wearing Ball Wearing
= H 2 HD/2tb = - = 0.0020 sec tb = - 0.0024 sec
Plate Wearing Plate Not Wearing
t wSD/2 =3.0 sec t 2.0 secp 2

81 -
which defines the conditions for a maximum dct/dT. While this model doesnot produce a vertical line transition as shown in Figure 2-1, the lattermust be regarded as schematic. Data in the Y region scatter enough to fita very steep sigmoid curve equally well.
In view of the difficulties encountered with IIA, no tests wererun on model IIC. Probably the application of Equation (5.4-18) will openup the way to do this. In spite of the difficulties encountered in the tests,it appears that the Bayer, Feng, Archard and Rowe approaches are convergingto a common solution to the problems of reversible surface energetics. Withthe geometry of Model I put in, this would produce a design program which,with additional inputs shown in Table 5.4-I, appears fairly complete.Actually, there is a great deal missing from it, as will be shown belowunder Model III.
5.4.5 Severe Wear (Model lID)
Brockley (1965) proposed a model for wear so severe that it mustbe classified as "scuffing" and so outside the scope of this STAF. For thesake of completeness, it results in the equation
K = (n/4) see2 9= 7/4 cos2 0 (5.4-25)
where Ois the angle of the asperity slope at the impact point. Since thismodel generates spheroidal particles, the maximum value of K is 1.0 ratherthan 1/3. This corresponds to an angle of 27.6o, high enough not to interferewith the use of Model LID on any surface likely to be encountered.
Brockley provides one test for this model, which seems adequate forthe purpose of this STAF and not worth discussing here.
5.5 The Irreversible Chemistry Models - ReactionWith the Atmosphere and/or the Lubricant (Model lI)
Model II was based on what might be termed reversible interactions;the adhesion of a metal to another, to a lubricant or to an additive by meansof forces ranging from purely physical ones to temporary chemical bonds. Asa borderline case between these and reactions, we mny use the fatty acids whichhave provided so much information to the scientists and practical help to thelubrication engineers. Opinions vary a great deal as to how these substancesbond to surfaces. It appears that, as is typical in boundary lubrication, every-one is partly right and partly wrong. There is every reason to believe thatacids first are attached to the surface by hydrogen bonds through a complex lay-er as shown in Figure 5.5-1. In due course, through the combined effects oftemperature, pressure and time, it is probable that elimination of waLer leadsto covalently bonded soaps. These will be dealt with in Section 5.5.7; thepoint to be made now was how this is the dividing line between Models II andIII, and also how important it is.

-82 -
Figure 5 .5-1
THE HYDRATED OXIDE LAYER ON IRON
Humid Air
H20
Fe2O3~
FeC $O '(( .~
Fe* -
DisocteaMta
Note: Interfaces are drawn as planes since actual contours are not known.

-83- 1The irreversible reactions may be put into four groups2 corrosion of
the met,9ls by the atmosphere, corrosion of the metals by the additives, poly-merization of the lubricant by catalytic action of the metals, and reaction ofthe additives with metals - or more often corrosion products - to form solidfilm lubricants. The last is partly redundant with the second, but must beviewed both ways to appreciate the sacrifice sometimes made in wear rate for thesake of a high scuff load. The general nature of these competitive reactionsis illustrated in Figure 5.5-2. Truly, as Prof. Archard described it, "lubrica-tion is a very intense process in a very small reactor."
5.5.1 Corrosive Wear by the Atmosphere (Mode. 11A)
All metallic surfaces (except for the noble metals) come into use com-pletely covered with corrosion products, so that the first increment removed frommoving, load-carrying surfaces is certain to be "corrosive wear". Subsequentevents may continue the same sequence of corroding and removing layers, or mayproceed along one of the alternate paths of adhesion, plowing and fatigue. Someconfusion arises because these alternates may produce metal particles which thencorrode almost instantly, but that is outside the scope of Model IliA. On theothe: hand, there is some reason to classify some wear as fatigue of the layerof corrosion products, which is definitely within the scope. As a result, thereis some uncertainty as to how much wear is due to corrosion phenomena, but anincreosing number of cases are being identified as corrosive wear. Detailedattempts to render this mechanism predictable have isolated four specific cases,all of which have been fitted with mathematical models of potential value inengiaeelinlg design.
5.5.1.) Oxidative Wear of Unlubricated Steel Surfaces (Model liA-I) has beenstudied by Quinn (1967, 1968-9, 1971A & B). He has evolved three models and madesome progress in fitting them to his experimental data on steel in air at 150 0 Cto 450'C. Starting from the "parabolic ox:idation" equation, in which the depthof the oxide layer varies with the square root of the time, he first developeda rate equation which contained four adjustable parameters. These included thedistance along which a wearing contact is made, and the critical thickness ofthe layer before breaking, as well as the two constants needed for an Arrheniusrate equation. His model was improved by Rowe (1968), who showed that the dis-tance could be eliminated, and the fit to the data improved, by using a morerigorous definition of the probability of a contact producing a wear particle.This "Quiin-Rowe" equation, in the present symbols, is:
(V/d) = KWA exp (-Q/iRTs)hCUP m (5.5-)
where V/d = wear volume of metal per unit travel (cm 3/cm)
K = a wear constant
W = load (gm force)
A = Arrhenius constant for "parabolic" oxidation

-84 -
Figure 5.5-2
Vertical Scale Exaggerated about 6X:
The Post-Wear Process
Mea pedn

- 85 -
Q - activation energy for "parabolic" oxidation (cal/mole)
R = gas constant (cal/mole, 0C)
T = contact temperature (OK)
- molar volume of oxide/molar volume of metal
h .. critical oxide thickness = wear particle thickness (cm)C
U = relative velocity (cm/sec)
P = hardness of asperities (gm force/cm )
K is related to the probability, P, that a contact will produce a wear particleby K/h = P/2r, where r is the radius of a wearing contact junction. Rowesuggested a different means for converting oxide volume to metal volume, but 0is simpler. Very recently, Tenwick and Earles (1971) made a similar analysisand also arrived at Equation (5.5-1). In addition, they corrected P for tem-
perature variation with two empirical auxiliary equations, which add little tothe analysis.
Both Quinn (1971B) and Tenwick and Earles (1971) also derived essen-tially identical equations based on the "linear" oxidation model, a simplifica-tion of a logarithmic equation. The result is simpler as it does not contaihf he,which is difficult to measure, but is limited to temperatures below 2000 C:
(V/d) = (K 1WA I /PmUO)exp(-Q /RT ) (5.5-2)
where K1 = 1/3 (according to Tenwick and Earles)
A 1 and Q] are constants for the linear Arrhenius equation
Quinn's third model (1971A) was aimed at eliminating h while
retaining the parabolic oxidation model. It took the form:
(V/d) = (WA0 5 /P m t05 )exp(-Q/2RT) (5.5-3)
Quinn's assumption for Equation (5.5-3) is "that at all times during
the period t of an established wear rate, the real contact area is subject tooxidation at the contact temperature (T s)," in our symbols (including using W/P
for the real contact :.eas). He then proceeds to calculate total volume of oxiRe(=V 0) by the parabolic equation, just as if all of the oxide were still in place.
This is a fallacy, as the oxide is flaking off. The parabolic equation is basedon the decrease in diffusion due to the build-up of oxide, so t should start atzero after each wear eveLIL. Ab shown by Lao (1)69), this leads back to the linearlaw.

- 86 -
Presumably because he detected this fallacy, Quinn withdrew Equation(5.5-3) before publication (1971B). However, it fits his data remarkably well.In Figure 5.5-3, his Figure 3 (1968-9) iF replotted and interpreted both ways;less data need be discarded to fit (5.5-3) than (5.5-1). Hence, (5.5-3) willbe retained, on an empirical basis, and discussed in Section 5.5.2.
5.5.1.2 Corrosive wear of lubricated steel surfaces (Model IllA-2) by the atom-phere has been studied by Tao (1968A, 1969). The first paper made a detailed
study, based on the diffusion rate of oxygen through hydrocarbons. He started
with the basic differential equations for two-dimensional steady-state diffu-
sion, and some simplifying assumptions about the ball-on-cylinder apparatus.
These included smooth surfaces, a uniform clearance ($), fresh oil saturatod withoxygen and humidity brought in by viscous drag, instantaneous reaction of the sur-
face followed by immediate removal of the FeO(OH), and wear only at the upper
(ball) surface. From these he arrived at the following equation:
'~ TiiQ1KLi7§I~j t~p-.3l~ \I Ii(5.5-4)
where Tis the time, C0 the initial oxygen concentration, Ua the mean oil flow
velocity, p the oil density, H the Hertz contact diameter, w the scar width on
the ball (measured parallel to the cylinder axis), A the mass diffusivity and U
the sliding velocity.
Tao was able to use this equation to compute clearances, and obtainedquite plausible values based on wear rates in air by neglecting the exponential
term and substituting a value of W from a run of known duration. This was basedon the fact that the exponential becomes negligibly small as the concentrationof oxygen in the oil leaving the action zone approaches zero. With this simpli-
fi cation,
" - 0082pf C,,tU (5.5-5)
The value of C0 was shown to be a function of the oxygen partial pres-sure (p), the density of the lubricant at 60 F (P0O) and other factors as defined
above, by the writer (ASTM 1970, Method D 2779).
3.00 p prO 0 - ,.O (5.5-6)
(.h =7
b 6 pIA)l4l(Tb-70Ol 1 + 5.347)
No equations were set up to handle humidity as it appeared that air of
,50% RH would provide an adequate supply of 1120 to keep the reaction supplied.
Tao demonstrated, in fact, that Equation (5.5-5) was only in error by about 10%
regardless of the humidity.
A tentative dependence of w on the "compliance", a complex term involv-ing W and D, was demonstrated but the relationship to Model TB cannot be establishedwithout a good deal more work.
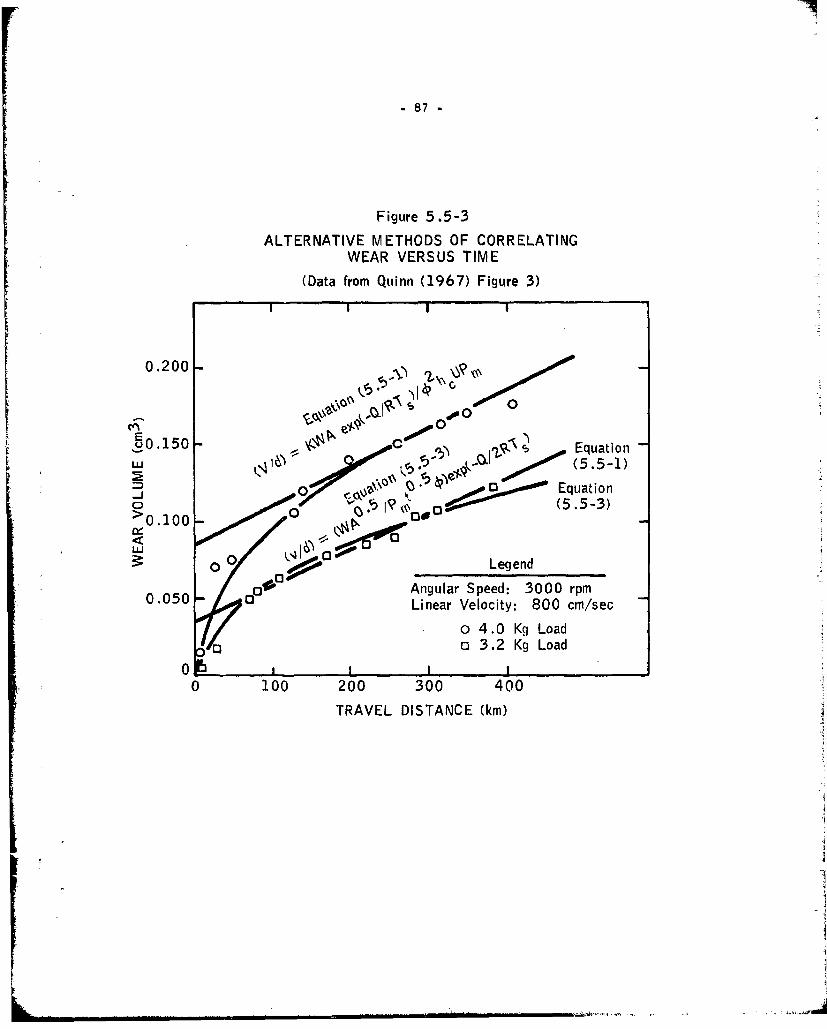
- 87 -
Figure 5.5-3
ALTERNATIVE METHODS OF CORRELATINGWEAR VERSUS TIME
(Data from Quinn (1967) Figure 3)I i I i
0.200 -
o,\o , ,\ s 0 0O p 0
~00 0 Equation
0 Equation.b (5.5-3)
>0.100 0w0 0 Legend
5 -Angular Speed: 3000 rpm0.050 0! Linear Velocity: 800 cm/sec
o 4.0 Kg LoadC) o 3.2 Kg Load
0 100 200 300 400
TRAVEL DISTANCE (km)

- 88 -
Obviously, this is only a paitial model, as Equa tion (5.5-5) would in-dic:te that no wear takes place at C0 = 0. This is not true, as shown in sun-sequent work by the same group with argon. flowever, no attempt was made then toincorporate this observation into Nodel liA.
After conversion to a form consistent with Equations (5.1-4) and (5.4-3),and neglecting Tao's correction for Hertz spot diameter, Equation (5.5-5) becomes
(V/d) v (4.92 po tC 0 ) 1.33 (U t )0.33 (5.5-7)
Later he analyzed the relative importance of metal oxidation and oxideremoval in controlling the wear rote by two more models (1969). The first wasbased on the parabolic oxidation equation followed by an abrupt removal of theoxide layer. Assuming that the oxidation takes place at the Blok-Archard flashtemperature, which depends on the square root of the load, it was possible toestablish a load-wear relationship by way of the activation energy of oxidation:
(Vtd) = (kt/Uhc2 )exp(-2Q/RT) (5. 5-8)
The fit to the time data was not as good as for Equation (5.5-5), and fittingthe load data left something to be desired.
The second new model assumed instant oxidarion, followed by removal ofthe oxide in accordance with the Archard equation (5.1-4). This fit the dataeven more poor1y than Equation (5.5-8).
To did not discuss the role of geometry in either paper, but a personalinterview led to further insight nto the reasons why the peculiar exponents arerequired in Equation (5.5-7). The "starvation" for oxygen in the exit oil, whichis an essential part of the simplification of Equation (5.5-4), also leads to aspecial de :ndence on the geometry. With a spheriral member, the wear rate in-creases with wear since the oil intake area is 4w, and the oxygen flow AjwUCo, Ifwe altered the geometry to a cylindrical pin, the result would be a special formof Equation (5.1-4):
(V/d) = Ks 0OE C,/Pm (5.5-9)
where K is a special wear coefficient for this "starved" case, and C is a func-tion of W. This will be further discussed in Section 5.5.2.

- 89 -
5.5.2 Testing Model IliA
Since the unlubricated case is outside the scope of this STAF, Equations(5.5-1) through (5.5-3) were not subjected to any real test. The authors' valuesof q are shown in Table 5.5-1 along with some literature values. Obviously, theexperimental values are considerabty lower. One problem is that the literaturevalues show a discontinuity, as shown in Figure 5.5-4. Another is that the dis-locations, etc., discussed above are likely to affect the pre-exponential factorA, and may well have an effect on Q. It all depends on what is limiting the re-
action rate. If Sakurai (1967) (see 5.5.3) is correct, and the whole process islimited by the diffusion rate of iron ion vacancy, the dislocations will not affectA or Q, but will have an effect on h by weakening the Fe/Fe0 bond strength.
c
The Tao Model IlITA-2 for starved corrosion has been checked against twosets of data. However, the procedure used for one depends on simplificationsdeveloped in Section 6.1, so the discussion will be given under that heading.
The only poitt to be made at present is that Tao's values of Q in Table 5-XV areas plausible as those of Quinn and Tenwick.
The other point is that Tao's Equation (5.5-5) calls for A linear de-pendence of wear rate on oxygen content. As shown in Equation (5.5-6), this isin turn a quadratic function of oil density, for hydrocarbons. A test plot wasmade of the Appeldoorn data on 13 pure hydrocarbons and five jet fuels. Theresults are not very gratifying, as shown in Figure 5.5-5. (The point numbersrefer to the hydiocarbons in Table 5.4-I11. Points for the fuels are identifiedon the Figure). The ASTM constant of 0.980 for zero solubility was replaced by1.163 derived from Appeldoorn's limiLed data, as the former would give negativesolubility (and wear rate) for I-Methyl naphthalene and Dimethano decalin. Useof the ASTM constant had not given any better correlation.
Points 2, 3, 15 and 18 were already under suspicion, and may be con-sidered bad data. However, it is obvious that it would be necessary to throw
out about half the remaining data to obtain a reasonable correlation coefficient.Apparently some other cause is contributing to high wear on a great many hydro-carbons. On the other hand, it appears that Tao's estimate that all the oxygenwould be depleted before leaving the action zone is justified as there is only
one point seriously below the line. Thus, we may accept Equation (5.5-7) as being
reasonably well verified.
After a good deal of work had been done with it, two weaknesses werefound in the Appeldoorn data. The first has been touched on briefly, that wearat some of the higher loads could be called "incipient scuffing". These do notinclude the 240 gram load used here. The second lies in the fact that the dataentered in the notebooks had been processed to the extent of averaging tlhe twodiameters of the wear spot by (a + b)/2, rather than the more precise ViRThis might be expected to produce a bias rather than increased scatter, if therewere no wear whatever on the cylinder, but in fact the ratio a/b does vary, atany given load. Some of this has recently been traced to variations in cylinder
finish, but it is impossible to do this for the older data. Thus, iL must berecognized that such tests as Figure 5.5-5 are bound to cast more doubt than isproper on the model. Any follow-on program must record the a and b values, as
well as more details on cylinder reproducibility.
I

LI
-90-
Table 5.5-1 jComparison of Activation Energies for the Oxidation of Iron
Author Equation Q (KC&I/mo le)
Quinn (1967) (5.5-1) 7.2 to 18
Tenwick & Earles (1971) (5.5-1) 5.32
(4.4-1) Corrected for Temperature 2.46
Quinn (1971B) (5.5-2) 4.4 to 12.2
Quinn (1971B) Static 49
Tao (1969) (5.5-5) 3.36
Tao (1969) Static 9.6C

-91-
Figure 5.5-4
RATE CONSTANT FOR STATIC OXIDATIONOF IRON VERSUS TEMPERATURE
0 8400C-7-
-8, Kubaschewski (1962), cited byz Quinn (1967)
C-,
-j10 o 600 0C
SE -11U
= 4000Cx~Verno~n, cited by Tao (1969)
S-14- 200 0C0*m
-15-0ff. Oo
-16- 0
-17--18 II
0.5 1.0 1.5 2.0 2.5 3.01/T0 Kelvin

-92-I
Figure -5.5-5
CORRELATION OF WEAR RATEWITH HYDROCARBON DENSITY
Legend
2.-Code Fuel25 1.-13 See Table 5.4-I1
14 Synthetic Isoparaffin15 JP-5 0216 RAF-176-6417 PW-523
::P2.0O>18 JP-4 03
+ 017
015
04
< 1.0 06 0wU0 o 0
016 Skope V1 r
01
00
09 -0.8 -0.7 -0.6 -0.5 -0.4
log [Q (1.163 -Q)]

- 93-
This criticism was not mentioned under Modeli I and IT, as there isno doubt as to their failure to predict even the order of magnitude of the wearrate.
One subject not yet mentioned here is the c ion of alloys, thoughQuinn touches on it (1968-9). Fowle (1968) has stud e ratios of oxidesformed on alloys and found that the fraction coated x aach oxide was moreclosely related to the free energy of formation of the oaide than to the com-position of the alloy. This may not be helpful, as rates of oxide formationare not readily predictable from these free energies according to Kubaschewski(1962). In all his examples, the oxide ratios are about as would be predicted bysurface free energy considerations (see Equation (5.5-14) and Appendix VI). Thus,the preliminary work for extending Model liA to alloys is already laid.
5.5.3 Corrosion by Additives (Model IIIB)
Sakurai has published a series of papers (1965, 1966, 1967, 1970) whichconcentrate on the kinetics of the reactions at the interface of steel with oilcontaining "corrosive" additives. The first of these (1965) established threevery important points. The most general concerns additives which follow theparabolic corrosion "law" used in developing Equation (5.5-1). These were foundto exclude only dibenzyldisulfide, benzyl chloride and zinc dialkyl-dithio-phos-phates which follow irregular patterns, and two chlorine compounds which followa new "cubic law". These latter are hexachlorethane and chlorinated paraffin,both of which appear to form a polymeric film in addition to the layer of corro-sion products which leads to the "parabolic law". It appears that this relationto Quinn's work is no coincidence as the second point is that oxides are moreprevalent in the layer than sulfides - contrary to past beliefs. (With chlorine,the products tend to be FeCl :4H 0 and FeO(OH) after the "parabolic" reactions;whatever causes the "cubic" aw was not identified). The third point was thatreaction rate was essentially independent of additive concentration, showing thatdiffusion through the corrosion products layer is limiting. While the authorscorrelated the reaction rates with Mean Hertz scuff load, no wear model wasformulated.
The next paper (1966) used an NACA-type test machine rather than thehot-wire static method, with the added sophistication of radioactively tracedadditives. However, no direct measurement of wear ratet was made, and the only
wear equation given is a relationship between wear and the rate constants cal-culated from Geiger counts. As Rowe commented (Sakaurai 1966), this assumes thatall the wear involved i3 corrosive, and that all the sulfide becomes wear debriswhich is hard to justify on the data as shown. The author agreed with thesecomments. Otherwise, the paper confirms the previous results (1965).
The third paper (1967) covered the reactions of two phosphates, twophosphites and one trithiophosphite with steel, using the hot wire test, theTimken machine and the 4-ball machine. The film was found to be mainly basiciron phosphate, with traces of phosphides, except with the thiophosphate whereFeS predominated and some Fe 0 and phosphate were suspected.
2 3

S94
The important finding was that the film resistance to the flow of ironion vacancy rose very rapidly with time on both acid and neutral phosphites and
phosphates. The exponent of film thickness, calculated by the present authors,
was from 4.5 to 5.2. Thiophosphate gave the usual sulfur exponent of 2.0. Only
sketchy attempts were made to analyze the data, which included four readings:
(a) Timken OK load (i.e., last step before scuffing),
(b) Timken wear from 10 lb to OK load.
(c) Change in surface finish on Timken block.
(d) 4-Ball wear, load and time not specifically stated.
It should be recognized that the high exponents given above were ob-
tained from the data obtained after an initial period of i to 5 minutes of nearly"linear law" corrosion, as shown by the 45' initial slopes in Figure 5.5-6. Thesame problem arises as on Quinn's data (Figure 5.5-3); where should the "break-in"
period be considered to end? However, in this case it is even more crucial, since
the possible exponents cover a five-fold rather than a two-fold range. There isnot sufficient data to reach a firm conclusion on the exponents before the knee,
but the present coauthor feels that future work should be concentrated in that re-gion, since the lifetime of an asperity is probably far less than one minute.
5.5.4 Formation of Surface Resin (Model IIIC)
The growth of an organic material on and around wear spots has probablybeen casually observed for quite a long time. Unfortunately, products of the air
oxidation of lubricant are very similar in appearance and composition and eventend to form preferentially at the air-metal-oil zone of interaction. Suchdeposits are known as "lacquet," which shades into a thicker version known as"varnish". Eventually varnish may go on to form a black crust known as "coke,"
even though it is partly soluble in ketones and phenols.
The material we are calling "surface resin" was first reported (1958) as aseparate entity by Hermance and Egan. They found it forming on noble metalswitch contacts exposed to organic vapors, and named it "friction polymer"--anatural enough choice of words but somewhat misleading as the process is notprimarily dependent on friction and the material is not a polymer by accepted
terminology. These statements may seem didactic but will be explained in detailbelow.
Dietrich (1959) in Germany promptly followed up with another study,confirming and supplementing the original paper. Campbell (1962) tried to test
their findings, hut his equipment and conditions were so different that comparison
is difficult. Fein (19658)followed up Campbell's work and concluded the materialwas significantly involved in a good boundary lubrication. Chaikin (1967) pursued
the original line, and further confirmed it.

Figure 5.5-6
CORROSION OF STEEL WIRE BY PHOSPHORUS LUBEADDITIVES AS A FUNCTION OF REACTION TIME
-3 0-1 .-"."
(3 0 e bs~*
0 V.oaw
Z5xlO pop
00
1000
~~0
510 5
0.5 1.0 5.0 10 50
REACTION TIME, Minutes
LI

-96- -
A third line was started by Furey (1965) who set out to deliberately Iincrease the yield by adding a di-acid glycol half-ester to the lubricant. The
idea was to set up a reaction at the wear zone to form long chains of ester
polymer. The writer found this to be true, but also found much tendency topolymerize outside the contact area, resulting in heavy sludge and varnish. Some-what earlier Furey (1959) had patented tetra-alkyl titanates which proved useful
as anti-scuff additives, and Matuzak covered silicones for the same purpose.
Neither patent gives a realistic mechanism; both are now believed to be due to
surface resin. The titanates polymerize when heated alone or used in paint; and
Tabor (1969) has shown that the silicones polymerize on polished copper.
None of the above work resulted in any sort of mathematical model. Thewriter consulted with Dr. G. C. Bond, an authority on catalysis by metals andlearned that there were fairly substantial grounds for such a development. It
was evident from Bond's work in correlating data from many sources that the re- Iactions yielding free radicals at the metal surface followed Arrhenius-type
equations, and that there was a relation between the activation energy and thephysical (atomic) properties of the metal. In light of other studies, directedat the time to predicting E for Model II, it seemed that the surface free energy
would be more appropriate than any parameter Bond had tried, though his
included the closely related AH. Values of Y, were calculated (as discussed inAppendix IV) by
Y= 0.0715 (AH - RT)/V2/3 (5.5-10) 1where AP is the heat of sublimation at 25CC.
5
Some trial plots were made with data cited by Bond in his book (1962)
(in his Table IV, p.195) on the exchange of deuterium with the hydrogen in ethane.
The data were reported in terms of log r (reaction rate). lcg A, and E. Plotting
E versus Y, gave a very rough correlation; it was evident that there was an un-controlled variable. Since log A was probably related to dehydrogenation, a nd
the given values were fairly constant, the mean value of 23.0 was used to recal-culate E'. The resulting plot was much smoother, as shown in Figure 5.5-7, and
was fitted by
E' = 24300 - 5.36 Y (5.5-11) j2 _
This equation is not dimensionally consistent, as Y is in ergs/cm and
E' in cal/mol. This could have been avoided by using AE (= 4 H - RT), but Yhas more adaptability as shown later. We may consider tRat Equation (5.5-I1)
justifies tentative adoption of two hypotheses:
I. E has linear dependence on 'yl (or AEs), and
2. A is independent of the metal.

- 97 -
These were tested by plotting the data from Hermance (1958) and Dietrich(1959), after adjusting the latter to a comparable number of wipes and for thepartial pressure of naphthalene used. The result was a surprisingly good fit toa modified Arrhenius equation (see Figure 5.5-8):
log r = 30.4 y R'T - 0.25 (5.5-12)
where R' is the gas constant in ergs/molaK. It is somewhat presumptuous to in-clude T, as all the data were obtained at 250C, but it seems logically justifiable.This equation might be said to conceal a third adjustable parameter, as the -0.25no doubt includes both log A and a constant related to the 24,300 in Equation(5.5-11). It may be necessary to keep these separate, as discussed in the next
section, when other hydrocarbons are involved.
There are two kinds of deviations to be accounted for in Figure 5.5-8.A number of metals completely failed to produce resin. In every case, data eitherfrom Hermance and Egan's paper (1958) or Kubaschewski (1962) showed that the metalwill oxidize rapidly in air at room temperature. The other exceptions were theexcessive activity of platinum for benzene and rhodium for naphthalene, and palla-dium for both.
In order to explain these results, it is necessary to digress briefly.The fact that metals react more rapidly when they have been distorted is commonknowledge, but there has been relatively little quantitative data published. Hoar(1962, 1964) carried out a long series of experiments on the corrosion rates ofvarious stainless alloys which had been subjected to stresses beyond the yieldpoint. The rate ran about 10 times as high as that of annealed metal in the firstpaper cited (1962). Later work led to dissolution rates of 150 to 1000 times thebase case, and the 1964 paper showed a ratio of over 10,000 times. Similar workwas independently carried out by France (1970) on mild steel; he found the corro-sion rate was increased by a factor of up to 400. A recent survey of German lite-rature (Naeser 1970) revealed 13 cases of metals and 25 of non-metals which showedeffects of "mechanical activation". Hoar's coworker Scully (1963) explained thisphenomenon on the basis of dislocations which had emerged from the surface, re-sulting in local high-energy spots. A similar explanation was advanced by Bond(1966) to explain why the heats of adsorption on fresh, vacuum-deposited metalsurfaces were far above average. As sketched in Figure 5.5-9, the step edge (B)of a screw dislocation has bice the orbital energy available of a flat surface(A). In the later stages of distortion, one might expect a ridge (C) to showthree times the energy of a flat, and finally the tip of pyramid to show aboutfive times the basic value. These local "hot spot" energies must be added to thesurface free energy, following the definitions in Appendix IV, and averaged toget the surface stress.
It is the writer's belief that the reason for the platinum and rhodiumdiscrepancies in Figure 5.5-8 is that thf experimenters dislocated these specimensduring preparation. If they had annealed them, they would have restared the sur-face free energy, as shewn in a recent interchange between Merchant and Bikerman(1968). Thus, it is probable that the surface stress (a) should be used to re-place y in Equation (5.5-12) but we do not have any sure method formeasuring it.

- 98 -
Figure 5.5-7
CORRELATION OF ACTIVATION ENERGIES OF METALSFOR ETHANE-DEUTERIUM EXCHANGE
woiOOO
0Ta
Mo0 0 Pt
2000 V 0 o Ni
Cr OZr0 0 Pd
1000
ol0 10 20
ACTIVATION ENERGY, kcal/mol
(for A - 1023

-99 -
Ln 0('I I-00
cc 0 A
0 w
LL
00
CL
C14 -0 =Li
~ ~* u
0. u~J .- G
C.CD.11 - C0 < 0 0 0 0 (n
'0 >
)4.6J < N SdI 90 X Q i]CA0 SV9UVj-

rI
-100-
Figure 5.5-9
DISLOCATIONS AT SURFACES
Nominal SurfaceA ~VY~Undisturbed Lattice
Step
Step Edge 0=1.1Y
I Step(Elevated)
Screw Dislocation
Ridge
Compressiona= =2Y,1 or more
Pyramid
0=5Y 1 or more
o= Surface StressY= Surface Free Energy

101-
The palladium situation could be explained on the same basis. However,as both Hermance and Dietrich found abnormal activity, even in alloys contain-ing Pd, it would appear that this element has some property which makes it by-peractive. One obvious property is its exceptional capacity for absorbing hydro-gen as the hydride. This would tend to drive the reaction
2 Pd + C6 H6 - CH* + Pd2H (5.5-13)
rather more forcibly than the corresponding one for platinum, etc., where ft must2diffuse away. (The stoichometric nature of Pd it is not firmly established).2
One further detail on Figure 5.5-9 is of interest. The surface freeenergies of the alloys were calculated by an extremely simple model of Hildebrand's(1950, p.408, Equation (26)) in which a "perfect solution" is assumed. For this,we must take VU 3 as constant; since for palladium, silver and gold, V = 8.9,10.3 and 10.3 respectively, for all alloys we may use 4.2/3 - 4.54 cm2m The equa-tion, in which X3 represents the mole fraction of the higher surface free energy
material, is ____
m = " RT n(1-X 3 )+ X3 exp - (5.5-14)M ,-V 2/3\ L 3 PRTL 11
As nay be seen in Figure 5.5-8, the alloys respond with very gratifying linearity
of r versus ym. This matter is discussed further in Appendix Vt.
It is also gratifying to see the way the metals line up for some otherinteractions. The heat of adsorption of hydrogen ranks the following metals ap-propriate ly
W > Ta > Mo > Ni " Fe > Pd > Rh (5.5-15)
except that rhodium should come before nickel. Similar data for ethylene are lesssatisfying, as two sets of data ( Bond 1962) neither agree with each other or withth(: Ylranking. Trapnell (1956) also reports data on eth ne adsorption; unlikeFigure 5.5-7, his values for molecules adsorbed per 10 " 19 mg of metal form twocurves, with Ti, Cr, and Mo about ten times as active as the seven metals whichfall into approximate order. It is evident that there is a considerable amountof art in producing the films used in this work, since the reproducibility betweenlaboratories is rather poor. Variations in surface stress and contamination wouldaccount for most of the scatter.
Turning next to the reactivity of hydrocarbons in surface resin forma-tion, Dr. Bond (1970) predicted the following ranking:
olefins > isoparaffins > naphthenes w aromatics > paraffins (5.5-16)
This is about the same ranking as for many other reactions, including oxidation.Olefins are rare in mineral oils, it being a matter of some note that only oilsfrom Pennsylvania crude show a double bond, and that this has been used as a basisfor prosecution of those falsely claiming their oil to be of such origin. Itmay or may not be coincidence that these oils have always been considcred to havepeculiarly good lubricating properties. Loomis (1971) has shown that resins fromPennsylvania crude have anti-wear properties.

- 102 -
Another source of double bonds in lubricants is the fairly commonpractice of adding a small amount (up to l0o%)of animal fatty oils, largelyglyceryl trioleate, to aid in boundary lubrication. The benefits have beenattributed to Model II type adsorption on the metal, but the ester does notadsorb very well until It becomes hydrolyzed in service.
A third source of olefin is the u,,:e of polymers as viscosity indeximprovers. These are always made from some olefinic monomer and (unless speciallyhydrogenated after polymerization) retain a double bond at one end of each chain.Furthermore, these chains tend to break in service, exposing more olefins. Theamount is not very large; perhaps 0.1% of the olefinic nature of the monomer ispresent in fresh additive and no more than 0.3 to 0.5% in used oil. lowever,Okrent (1961A, 1961B, 1964) found that these additives provide for lower frictionand wear in automotive engines than plain oils of the same viscosity. By thetime of the third paper cited, he had arrived at an explanation of this fact,based on the theory of elastic relaxation of the polymer under the varying loadand shear in an engine, but not everyone is fully satisfied with it.
Thus, we have three cases in which the users are prepared to pay asubstantial premium for a lubricant because, for reasons which they do not clear-ly understand, it does a better job. The decline in sales of Pennsylvania oilwas not precipitated by development of solvent refining, which yields productsbetter in physical properties than this "standard of excellence." There was aconsiderable lag before solvent refined oils were fully accepted (about 20 years)and their acceptance coincided both with the exhaustion of the Pennsylvania fieldsand the wide-spread use of polymeric additives.
The writer does not mean to imply that these observations prove thesethree cases all arise from surface resin, but merely that the coincidence that theonly olefinic lubricants in common use all are considered to be of premium qualitydemands a little investigation. In addition, data by Fein (1965B) and Appledoorn(1967A) indicate that olefins tend to lubricate at least slightly better thonsaturates of the same viscosity. Buckley (1970) also showed that two unsaturatedhydrocarbons, ethylene and acetylene, adsorb more strongly on clean iron surfacesthan do methane and ethane, and cause more decrease in the adhesion between twosurfaces for equivalent surface coverage. Hansen (1970B)studied the decompositionof these two gases on tungsten, and Morecroft (1971) extended the work to octa-decane and decanoic acid. Both reacted to give hydrogen and methane, showing thathis evaporated iron film was vigorously reactive.
The attack on isoparaffins is essentially a dehydrogenation, as visualizedby Eischens (1969):
71" 33R-Cll - RC* + H2 (5.5-17)
3 C 2

- 103 -
The hydrogen is free to diffuse away into the metal or oil, Carbide formLtionmay be very important, as discussed in Section 5.9, due to multiple radicalia-lion. The rcaction which takes place with other pure hydrocarbons is essentially
similar. The free radicals produced are very prone to form resin with any oxygenpresent, but even in do-oxygenated helium they can polymerize (Kingsbury 1968).In the latter case, the reaction is fairly slow, and probably proceeds throughoil-soluble dimer etc. until an insoluble state is reached.
The course of events in air is considerably more rapid and complicated,due to immediate interaction of the free radicals with oxygen, to form hydroper-
oxide radical and various other species. Surprisingly, the nitrogen of the airalso gets involved; the ability of a bearing to fix nitrogen tells a good dealabout the energies involved. The reaction may ell be that of the Ilaber process
FeN1 + 3112 Catalyst0 2NHt3 (5.5-18)
which is usually ca ried out at 200 atmospheres and 50O0C.
The product has definitely been shown to contain C-0 groups (Fein 1965B),which appear to be in the form of esters, soaps, ketones and amides. This was con-firmed by Goldblatt (unpublished). Another evidence of the energies involved is
that pure aromatics yield aliphatic surface resin, an observed by lermance (1958),Fein (19651B)and Goldbiatt (unpublished).
}ermance (1958) also published a great deal of data on the solvent re-sistance of the resin made from benzene vapor, The writer analyzed his data bythe Hansen (1967) method, discussed in Appendix V. The results are shown inFigure 5.5-10. Briefly, the three quadrants represent the faces of a three dimen-sional plot, so that placing the two 6D axes together would produce a corner ofa space in which two spheres hang suspended. Each solvent is represented by apoint on each surface, and the spheres by a circle on each surface. The coordinatesare 6 , the contribution of London forces to the Hildebrand (1950) solubility para-meter; 6p, the contribution of the Keesom (permanent dipole) forces; and t, the
contribution of the electron-acceptor ("hydrogen bond") and related forces. Non-solvent points fall outside the spheres, and hence outside the circles on two ormore quadrarns, while solvent points must fall inside the circles on all threequadrants co be properly correlaed as discussed in Appendix VIII. It will be
noted that all solvents e:ce ot nitrobouzene (ONO2 ) fall in the proper areas.
The plot required two spheres to contain all the solvents except DNO,, andexclude the non-solvents. This Pattern is typical 0t mixtures and copolymers Nseer-bower 1969). In this case, the small eor sphere appears to center around ester-type
resins, while the larger sphere is characteristic of acids and amides.
Similar plots of data by Coldblatt (unpublished) are shown in Figure
5.5-11 for resin from naphthenic base-stock, The resemblance to that from benzene
is very striking. On the other hand, resin from a mixed aromatic-ist'paraffinic
lubricant showed a very different pattern, as shown in Figure 5.5-12.
I I I I - t,- * " Tw" v ' t ' ''t~ . i *, ,,- ,r-4,?

-104 -
Figure 5.5-10
DATA ANALYSIS ONHERMANCE AND EGAN FRICTION POLYMER
10 4100
80
4 7 - +0 04- + 00 0 0 6 +0
5000 0
x 4
.0 0O~NO~o b 02 ~N 2
0 1
L I0 No Action
0x Product Swells Slightly 80 0
(Sealed tube (ia 200*C)8+ Slight Swelling Under Microscope 3 3APartly Soluble 0 0O1-arely Soluble 925 Interactions Explained 9 * I
Interaction (nitrobenzene, 103
'**j

105
Figure 5.5-11
SOLUBILITY PARAMETER OF RESINFORMED FROM NAPHTHENIC BASE STOCK
+++
0 6
0 0
* 0 0 0 03( pI
ex 2 0
105 *. 8.5 7.5 SL 7
705 1 3 +
* No Action 8 .0-ySlight Swelling 85 A
+ Swelling
SPartly Soluble0o3 Totally Soluble 95
10.0-
Ai
10.5-
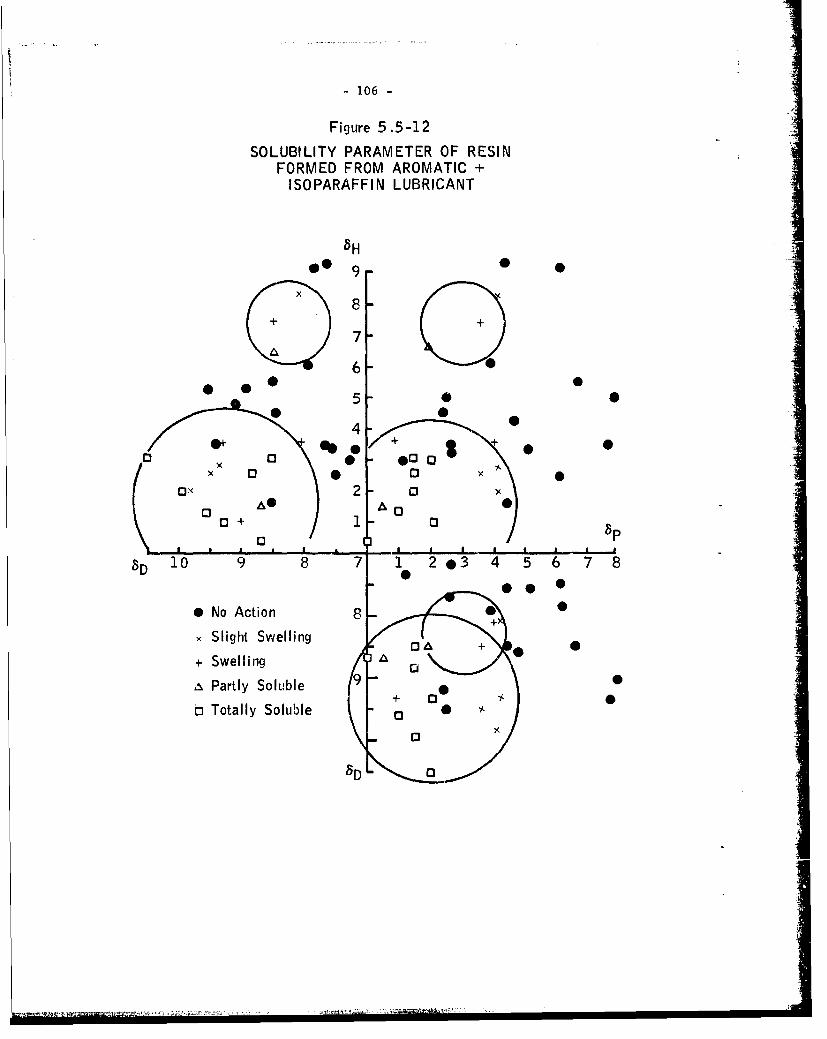
-106-
Figure 5.5-12
SOLUBILITY PARAMETER OF RESINFORMED FROM AROMATIC +
ISOPARAFFIN LUBRICANT
x
7
6 0
4 0
1300 C 0
8D10 9 8 7 1 020o3 4 5 6 7 8
0 N o A t i o n 8
.Slight Swelling
+ Swelling
,NPartly Soluble0
b Totally Soluble
* -'~,s '~ --. -~ " -

-107
This is one of the many pieces of evidence which led Goldblatt (1971) to developa further model to account for the blending anomaly, which is discussed in thenext two sections.
5.5.5 The Charge-Transfer Mechanism (Model IIID)
As discussed in the previous section, dehydrogenation followed by poly-merization is a fairly straight-forward process. The fact that oxidation frequentlyaccompanies the "polymerization" merely increases the rate of resin formation and doesnot change the basic mechanism of Equation 5.5-17. Goldblatt's model goes farbeyond this, as it depends on another mechanism to supplement the rather sluggishreactions so far discussed. The whole scheme is shown in Table 5.5-11, in slightlydifferent symbols and language from those in the original. Another version, per-haps more easily understood, is shown in Figure 5.5-13.
The first process was discussed in Section 5.5.4, in considerable detail.However, it must be added that the deformation process also releases a consider-able flow of electrons from the metal. These "exoelectrons," which are oftencalled after Kramer (who discovered them), are emitted at a rate which falls offexponentially with time as if it were radioactive decay with a few hours half life.This leads naturally to the third process the acceptance of an electron by a poly-nuclear aromatic which has already been adsorbed in process #2. The presence ofthe resulting radical anion (Ar. was demonstrated by Goldblatt in several ingeniousexperiments.
Ar; when set free by process #3a, is a very active chemical, and canparticipate in the various other processes, #4, 6, 7, and 8. Process #4 is oneof those Goldblatt demonstrated; he used a-Fe 0 to destroy 1-methyl naphthalenide.Both #3b and #4 can generate wear debris. If M:Arj dissolves before desorption,very fine metal will result (i.e., the lamp-black like material often associatedwith mild wear). In process #4, Ari attacks aged surface and in doing so, detachesoxide which becomes an abrasive to perpetuate step (I) in a chain reaction viaprocess #5.
If Ari last long enough, it can reach other compounds than those at thesurface. In ordinary air, both H 20 and 0 are at hand to quench Ar; and Goldblattfeels this accounts for air alleviating t9e high wear observed with dry inert at-mospheres. Process #6 results in dihydroaromatic, which is really an olefin andhence prone to oxidize to a resin such as process #7 generates directly.
Process #8 is a major source of resin, and is considered to be the mainexplanation of the blending effect (Anomaly 3.5). Process #9 is merely a variantin which #7 and #8 take place simultaneously.
This is too large a set of reactions to include in Equation (5.5-12),which was actually only set up to cover metal + aromatic + 0 processes corres-ponding to #1, #2, #3, and #7. Of course, as #6 tends to en in the same way as
#/, it can be counted in, but #4, #8, and #9 are new business. Of course, withtwo empirical parameters Equation (5.5-12) car, be adjusted to cover almost anysituation, especially as one of them is the difference of two terms. The dangeris that it can be adjusted too easily, and so does not serve as a very good
screening tool.

- 108 -
TABLE 5.5-I
The Charge Transfer Mechanism
Aged Metal Surface deformat > Active Metal (M) #1
M + Polynuclear Aromatic (Ar) adsorption M:Ar #2
M:Ar ionization > H+ Are #3a
M+:Ar; desorption 7p M + Ar- #3bAre + MOx reduction> MOx (abrasive) #4
deformation rsie
Aged Metal + Abrasive e #5
Ar; + H 20 --> Ar-He + OH ->ArH 2 #6
Are + -2 -- >Ar + 02e --> Peroxide -- >Acid or Resin #7
Ar; + Aliphatic (Ap) --->Ar:Ap Adduct --->Resin #8
Ar; + Ap + 02 peroxidation _> Acid or Resin #9

109Iw
ww
(n L)w w
LL L
ww wc
Iz 00xL) <I- C)1
_ 0 CO
<~ <
ww0 InI
Ow
w
ti- 0z
ww
w C)
110 -
More data are needed to determine whether it is applicable to other acomatics.Actually, benzene is unique, and being able to lump it with naphthalene may havebeen an accident. If not, (5.5-12) should apply to all non-alkylated aromatics.Alkylated ones must be sharply divided into those having a benzylic hydrogen,and others. The "others" must be tested against (5.5-12), but the "benzylic"class have a special weakness to oxidation that would upset the whole model.
If (5.5-12) is to be extended to more general use, it will be necessaryto correct the dimensional imbalance by putting cm2/mol into the right-hand side,or by going back to AE . The second would cost us the flexibility of yI in deal-ing with surface stress (Appendix IV) and alloys (Appendix VI). However, thismight not be too serious as G is almost impossible to measure directly and theelectrical data from Hoar (1964) and Francis (1970) could as easily be appliedto augment AE . Equation (5.5-12) could very easily be converted to a "surfaceenergy of sublimation" (y V 2/3). The effect on Figure 5.5-8 would he trivialas V =Io cm3 for most of The active metals.
Assimilating processes #6 and #7 into mathematical form requires know-ledge of the solubility of H20 and 02, which is available, and perhaps of theirrates of diffusion and reaction. However, on the basis of Tao's Model liA workand success with Equation (5.5-5), it appears that these reactions might also behandled on a concentration-only basis. Certainly processes #6 and #7 are asrapid as would be the direct oxidation of metal, but in this case the supply ofradical anions is also limiting as was not the case with the metal. Thus, itwill be necessary to regard Equation (5.5-12) as the starting point of a rathercomplex set of equations. These must necessarily involve the concentration ofArS as a function of the distance from its points of origin.
One factor not previously considered is the effect of pressure on poly-merization. Weale (1967) gives an equation which is adaptable as follows:
In(/lO = " , (5.5-19)
where k and k are the rate constants at q pressure and at one atmosphererespectively,°and AV /V is the fi'actional change in volume on polymerization.This predicts for a typical reaction in which AV /V = 0.20, an accelerationof approximately 10,000 fold under q = 20,000 aTmospheres. When interviewed,
he pointed out that this reasoning does not hold if the lubricant solidifies,and cited a summary by Babb (1963) of data on freezing under pressure.
5.5.6 Testing Model IIID
It is difficult to subject these models to wear rate analysis in viewof their incomplete status. First, it will be necessary to formulate equationsthat express the lubricant composition in terms leading to another equation tojoin with (5.5-12). The following excerpt from a recent paper by Goldblatt andthe writer (Beerbower i971F) gives some ideas as to how this might be done interms of measurable parameters of aromatic and heteroatom molecules. The questionsto be answered were "Why do heteroatom molecules increase wear in petroleum lubri-cants?" and "Which types of heteroatom molecules are particularly bad?"

- 111 -
"In this model, the aromatic adsorbs onto the freshly uncovered metalsurface, and accepts an electron from it to form a radical anion. This anionmay then undergo one or more of three competing reactions:
[1] React with another hydrocarbon to foem "surface resin",
[2] Be quenched by water, oxygen or anothe electron acceptor, or
13] Form a metal-organic compound, a kind of corrosive wear.
Reaction [I is the way in which aromatics improve the wear rates of paraffins.The surface resin serves a solid film lubricant, and also enhances hydrodynamiclubrication by partly filling the anti-asperities (Beerbower 1971A),
"Reaction 12) is the one involved in the questions. The most generalanswer is that the most efficient electron capturing species will interfere mostcompletely with the enhancement. A special answer is that in the absence ofoxygen, this same species would enhance Reaction [3], and so increase wear abovethat found with paraffin alone."
"One measure of the quenching ability of a species is its capture rateof solvated electrons. Table 5.5-111 lists observed rates of capture as deter-mined by Hart (1964). Pyridine and nitrobenzene show high rates, the latter being100 times is fast as naphthalene. From this one would predict that both wouldinterfere with lubrication by paraffin-aromatic blends. No data was available onring-sulfur compounds, but the aromaticity of thiophede is slightly greater thanthat of pyridine (Kanekar 1967), so the rate should also be slightly greater. Ithas also been found that in competitive metalation of beozothiophene and N-methyl-indole, the former is preferentially metalated (Shirley 1964). Carbon disulfideis also very efficient at electron capture, the rate being about the same as fornitrobenzene.
"Another criterion for predicting the effects of heteroatom species isthe type of reactions the intermediates might undergo. Nitrogen heterocyclicmolecules form intermediates that are probably innocuous. On the other hand,sulfur compound intermediates are highly reactive, as shown by their thermal in-stability (Gerdil 1963), znd thus are prowear agents. Since aromatic ring sul-furs are more reactive than aromatic ring nitrogens, one would expect the sulfurs -to be the more detrimental.
"A brief screening of some naturally occurring heteroatom species isshown in Table 5.5-IV. It is clear that pyridine and indole do not promote wear,though there is some effect on friction. On the other hand, benzothiophene isextremely prowear. So is nitrobenzene, a nonring nitrogen molecule which waspredicted to be quite reactive. Similar data were reported by Rudston (1971)who showed that several sulfur compounds promoted wear in white oil, while nitro-gen compounds such as pyridine and indole reduced wear as predicted.
a
rI
I I I I I I I llli-iT11Fl~gi:I'q'lllII iI

-112-
TABLE 5.5-IT
ABSOLUTE RATE FORCAPTURE OF A WATER-SOLVATED
E LECTRON
Acceptor PHRate (M' 1sec -
Benzene 7 7 x 10⁶
Aniline 11.9 2 x 1
Naphth~alene 7 3.1 x 10 8
Nitrobenzene 7 3 x 10 10
Pyridine 7.3 1 x 0
Carbon Disulfide 7.7 3.1 x 10 10

-113 -
TABLE 5.5-IV
HETEROATOM MOLECULES SHOW PROWEAR OR INCREASED FRICTIONIN MIXED (50/50) ISOPARAFFIN-AROMATIC BASE STOCK(l )
PercentWear Scar Coefficient He,:eroatom
Additive Diameter (mm) of Friction Species in Oil
None 0.38 0.08 0
2% Nitrobenzene NO2 0.55 0.13 0.74
2% Pyridine 0.34 0.12 0.36
N
2% Indole 0.38 0.09 0.24
2% Benzochiuphene 0.53 0.10 0.47
2 o 5 s I
(1) 4-Ball test, 15 mins., 77*F, wet air atmosphere, 1230 rpm,20 kg load, 52100 steel.
I=I

- 14
"BIsed on rnose studies, iL t1,y be con:luded that among the variousheteroatom molecules occuring in petroleum, the sulfur compounds are among themost detrimental to wear in mixed paraffin-polynuclear aromatic blends."
Since the comments quoted above were written, we have come to believethat the electron transfer energy (V62 ) can well he substituted for the valuesin Table 5.5-111, but further study of this matter is needed.
5.5.7 Formation of Soap Films (Model IIIE)
The concept of additives forming covalent compounds with the metal sur-face is at least as old as that of reversible adsorption (Bowden 1950). However,no mathematical model has been suggested up to now. The nearest approach hasbeen that of Kreuz (1969) who demonstrated that such films can be removed by thesolvent action of the base fluid. This had always been a strong argument forreversible adsorption, as it was hard to explain how a covalent film could everfail. However, Kreuz did not carry his work to its logical conclusion by apply-ing the Hildebrand (1950) theory of regular solutions. This may have been be-cause Kreuz found quite sharp "solubilization" temperatures for his soap films,which were essentially independent of concentration; in fact, they could berelated to the transition point at Y in Figure 2-1l. Such behavior is not pre-dicted by the Hildebrand theory because it relates only to London forces and thesoaps include major polar and hydrogen bonding, Prediction of the behavior ofsuch systems requires the Hansen (1967) modification, which predicts a rathersharp miscibility when the molar volume of the solid is very large with respectto that of the base fluid, V
m
) 2 2(6D- )D2 + 0.25 (6-6P2)2 + 0.25 (6 l-H2 < RTt/2V (5.5-20)
where 6 etc. are the partial parameters of the soap, and those with subscript2 are t ose for the lubricant.
This method will require more work, especially since 6,, and , for soapsare not so easily calculated as for polymers, but it does offer aesign ossibili-
ties. It also has the complication that it leads back to Model II-C, since dissolvedsoaps are still "additives" and must be treated according to their E values onthe metals.
No published data except that of Kreuz (1969) is available, and thatis too scanty for a real test of Equation (5.5-20) . However, unpublished datab~i Goldblatt, Harting and Panzer each, in various %,ays, support this model. Ofthe three only Goldblatt has actually carried it through the wear rates; in hisopinion, the combination with Model V will be of real signiticance but only ina limited number of cases.
5.6 Metallurgical Compatibility (Model IV)
The models discussed so far have attempted to provide general cover-age of the whole span from 0 to Y in Figure 2-1, The remaining ones are morespecialized, and tend to be directed only to locating a limit in the same sensethat Model IA serves to locate point 0. Model IV serves only to define whathappens at point Y, and perhaps beyond it to point Z.

- 115 -
Investigation of the scuffing transition phenomenon has already beenmentioned under Models II and IIl, with some plausible explanations avnilable.However, there is reason to believe that when all lubricating films have failed(including the metal oxide), the nature of the metals in contact may spell thedifference between moderate wear and scoring or even welding. Such "self-lubri-cating" pairs are well known; the steel "worm" driving a bronze gear is a classicexample. Naturally, such pairs show high transfer when unlubricated; as Johnson(1970B) pointed out, everything sticks to everything because the London forcespresenit in all matter are totally non-discriminating.
A number of investigators have sought other couples with even more favor-able properties than steel + bronze. Rabinowicz, oe of the most diligent investi-gators of Model IV, was able to cite eleven studies (1971A), though he had todiscard one of these as it was based on an unfortunate choice of metals. The remain:ing ten, along with several he failed to cite and the MacGregor data for Model I,are discussed in Section 5.6.3. The concensus of these workers appears to be thattransition involves some degree of interpenetration of one metal into the other,to form a solid solution.
This leads to two models, one based on the bulk energies of the metalsand the other on the surface energies. As discussed under Model IIIC, these areclosely related, but they will be handled separately at present.
5.6.1 The Bulk Energy Model (IVA)
Hildebrand (1950) established a simple rule for the miscibility tempera-ture of two metals which form a regular solution. This usually takes place ataround 50/59% by volume. If we adopt this as a model for transition temperature,
Tt = VI + V 2
(6 -6 2 )
2 (5.6-1)
where V and V are the molar volumes of the metals while 6 and 6 are theirsolubility parameters. If Tt is less than the surface temperature T., scoring
will take place.
A computer run on this model was published (Beerbower 1971A). It showed
that unrealistic Tt values (up to 39000*K) resulted, so a less simplified versionof the Hildebrand equation which permits insertion of other concentrations wasused:
2 2
01 '-2(6(5-6-2)R [01(1 - V/V 2 ) + In(l - 01i)
Runs were made with 01 (defined as the volume fraction of the high 6 metal) set
at 95%, but the predictions were still far higher than ever observed at transition
(up to 13,400 0K). However, 0 = 0.05 gave quite reasonable-looking values of T,
with a maximum of 906°K (633*C for Zn-Zr. There also appears to be an appropriate
relation between T = 300°K and behavior at about room temperature, as discussed
in Section 5.6.3.

- 116 -
5.6.2 The Surface Free Energy Model (IVBI)
Rabinowicz (196511)cited surface free energy, and especially the ratioof it to hardness (,/P,), as a key parameter in friction and wear. In a recentarticle (1971A), he-undertook to link this with the static coefficient of fric-tion
Fs = 0.2 + C1A1 2/PMI (5.6-3)
where C is a constant for constant surface geometry, Au, is the work of ad-hesion I y -Y12' where Y12 is the interfacial frU energy), and P isthe penetradion iardness of the softer metal.
Since neither A1 2 nor y 2 can be readily measured nor rigorouslycalculated, he proceeds to make t e rather drastic assumption that A2 -C2 (Y1 + Y2)
' so that
F 0.3 + C1 C2 (yi + Y2)/Pml (5.6-4)
Values of C2 were determined empirically, for five situations, fromthe largest collection (210 pairs) of static friction data ever published.The procedure was to sort the data into sets, based on binary phase diagramsfrom the literature. The sets were the four categories shown in Figure 5.6-1plus "identical" for metals sliding on themselves. All five sets were thouplotted separately, F versus 1-g [(y. + lv_/Pml], using the log function simplyto "spread the points out more effectively . Since the "compatible" group of97 pairs was largest, it was used as the standard for slope of the resultingbest straight line. This line was then transferred to the other plots, and a"best fit" line drawn parallel to it. By arbitrarily setting C = 0.5 for thefirst plot, he eliminated C and arrived at C2 values for the oiher four sets.These are shown in Table 5.i-I as "measured". The measured values were "ad-justed" to those in the last column (C') "to spread the values out more evenly".It is not made clear how the adjustment process was handled, but it was obviouslyguided by his awareness that C' cannot exceed 1.00. Down to the last line, theadjusted values fit 2
' = 2/3 C2 + 1/6 (5.6-5)C2
fairly well, but he apparently abandoned linearity to force agreement with hispaper (Rabinowicz 1966) even though this was at odds with his book (1965B).
Several steps in this model are far from mathematically rigorous.When the paper was presented, Steijn commented that basing a linear coefficientsuch as C on a semilog plot was unsound. Rabinowicz admitted this, but indi-cated tha? he felt it gave correct results. Setting the "compatible" group atC2
= 0.50 is also a dubious procedure; setting "identical" at 1.00 would be muchmore defensible. Further discussion will be given in Section 5.6.3.

- 17 .
In his latest article (1971B), Rabinowica dropped out the surfaceenergy model and merely compared Figure 5,6-lwith ten sets of friction data.These included 70 of his 210 pairs for static friction in air, covering arestricted hardness range since apparently hardness has an independent influ-ence on F . Two other sets of static friction in vacuum are also included.Two small sets of adhesion in vacuum data were combined. Six sets of kineticdata, including one previously unpublished, were used.
TABLE 5.6-IJi
VALUE OF COMPATIBILITY PARAMETER C2
Measured AdjustedValue Value
Condition Symbol of C of C,
Identical 1.25 1.00
Compatible Q .50 .50
LimitedCompatibility .25 .32
LimitedCompatible .16 .20
Incompatible 0 .15 .125
The "model" was simply the standard method for correlation coeffi-
cient by ranking. The coefficient was determined for each set of data, and forsubsets in several cases where atmosphere or temperature was varied. Weardata was also correlated, when available. Both static and kinetic data showedaverage friction coefficients of 0.28, but the kinetic data showeJ less scatter.Wear correlated with a coefficient of 0.56, and less scatter than kinetic fric-tion.
These coefficients are cited as evidence that compatibility is a fac-
tor in friction and wear. By ordinary standards, coefficients less than 0.85are considered unconvincing, so that the effect of this paper is to indicatethat other factors dominate the process. This "model" does not require furtherdiscussion, since IVA appears to provide more satisfactory correlations.

I
- 118 -
Figure 5.6-1
COMPATIBILITIES OF METAL PAIRS .
Mo Co Fe Pt Ti Au Al Mg Sn IW Cr Ni Nb Zr Cu Ag Zn Cd Pb
In 000 0 0 00 1) 10 0 010i
, g , 0Q.W 0 Q10 o 01 o1)1zn Q)o0oo0 0Q.0oQool00 C-Ag O-- -O*1*]* 0vO (W.Cd O o o oo~~io0*o
Au 0. _Q •N 0 0 1) 00 1 10
T i 0 0 0 j) 0 0 0 00Zr ©i 0 C) 0 1) 4 0 ,Pt Oi 0110 0 0 0Nb 1
Fe000100
Ni 5 O DCo-
Cr 0C
The assumed compatibility relationships, based on the binaryphase diagrams . Like metal pairs, not shown, are assumed metallUrgi-
cally compatible by definition.
* -Two liquid phases, Solid soIltion less than 0 .10/,..
i& -Two liquid phases, solid solution greater than 0.1'/,, or one liquid"-phase, solid Solution less than 0.1%.
)-One liquid phase, solid solution between 0.17, and 1nl,..s
O -One liquid phase, solid solution over 1'/,,.,
Blank boxes indicate insufficient information. :
AI0~)0~00~0"0_ , 1 '

- 119 -
5.6.3 Testing Model IVA (MetallurgicalCompatibility)
Despite its obvious limitations, Model IV has a fascination about itthat has led to an amazing amount of work being done and reported. It hasalso led to more analysis than it may seem proper to include in a study oflubrication.
The laboratory work cited by Rabinowicz (1971B) in his analysis, anda good deal which he did not cite, is listed in Table 5.6-I. The former in-cludes his own static Lests (1971A), some by Tomlinson (1929) on which hecasts serious doubt, and two sets of static tests in vacuum. None of theseseem useful for testing Model IVA, nor do the two sets of adhesion tests inhigh vacuum. One of these was already cited by the writer, as was the kineticwork of Roach (1955), Coffin (1956), and Machlin (1954). The work by Grau(1966) had not been previously published, but will be useful here.
Rabinowicz cited only one paper on alloys (Moeller 1967), and handledthat quite crudely by assuming that they would perform as if 100% composed ofthe main constituent. This is by no means in all cases; Equation (4.4-15)shows how binary blends can be haodled, while Shain a'd Prausnitz (1964) carrythis idea further. Work on alloys aot cited includes Cornelius and Roberts(1961), and five other related papers. Most important, in terms of quantityas well as tie-in with Model I, is the work of MacGregor (1964), which was alsoneglected.
A partial analysis of four of the sets of data was made, in accordancewith Equation (5.6-1) and published (Beerbower 1971A) in the form of predictedtemperatures at the 50% miscibility point. The success ratings had to allow forthe results from the laboratories containing contradictions, part of which mayhave been caused by the lack of a clear definition of "scoring". The writerattempted to bring the data to a comnon basis, in which "rough", "abraded",etc., were converted to "poor" scoring resistance, "smooth" or low wear ratesto "good", and intermediate descriptions to "fair". where data in helium wasavailable, it was given preference over that in air or in air-saturated kero-sene. All hexagonal (HCP)metals were excluded from the ratings; as shown byBuckley (1966), these follow different rules than the common cubic metals. Thecriteria of success were based on an arbitrary choice of Poor = O-2000OK,Fair = 2000-4000*K, Good = 40004+K. These unrealistic temperatures resultfrom their being based on complete miscibility at about 50/50% by volume.
As mentioned in Section 5.6.1, new computer runs were made on Equa-tion (5.6-2). The results at 01 = 0.05 as shown in Table 5.6-111 for variousmetals on iron, and in 5.6-oV for various nonferrous combinations. This timethe success of predictions was rated on an "absolute" basis, with the poor/fairsplit at 300*K (27*C). The Fair/Good split was made arbitrarily at 400*K, andVery Poor below 750K. Since the data of Grau and Itoh were obtained by a methodcomparable to those of Coffin and Machlln, they were included, and this improvedthree of the HCP ratings. The categories were: Poor (F = 0.66 to 1.07), Fair(F = 0.51 to 0.65) and Good (F = 0.36 to 0.50). The pairs improved were Cu-Zn,Al-Cd, and Ag-Zn, now counted "correct" on the basis of Footnote c in Table
+ 5.6-1V.

-120-
.0 0 US0)%
3.4 UN 3 4 4 4
-4 00 X0 1- 0 u.2~ 0 r.I.2 4~
0 0 4) Q 2nc
44 41 C4 2 Cd
. 0 0- 4J~ If S If ~ f C) O"JJ Q .a0 WH) US A. > 4) aJ
4 0 0 m 544 w w4I? It14 V. 4) uC r4 bO. JJ J CO 4 .4
041 w- mr wC~ 0 C w 0>1 cc *4 4 H .04 2 H4 r441 -0 .044 ?A H1 J. "( .
4 0 0o $- 0. w~ U. 04 H0 0H 0 H 0 w . F- 4) w4H.4 0 = H Lo >1 J0
-,4 1 14) u 14I I4 0 .. IVc) 0 0 mS 00H4O w Q) w 3w.1a: a
L)z n H C bfH~4iU En O U4 U3 m
'4-4 H0-
(a)2 ~ H O 0 00 (4 - 4.J 4) 4. O (44 444 4
3-4 $-1 $4 $4- $4 $4 $4 C 44C 4 q4 Q
4) 44) 4)--4 3.4 4 -H 4 H -, 4- -4 4I
43) 4C 0, 0 H W r 1 44 4) 0 r4H 04r r4-jr 4 44 4 A Wr
-4. .,4 -. ,4 H .A 3 0 09C C: H4 0C34 C.-4.- r. W q C) 0.Id14k~ r4 4 "4H l r H3 "4 :3 4 4 4 . .,I
LA~$40 0 0 Q0
U~~ ~ ) 0 . , 4 4 -)4 -A - A4)4)j 4 .4 41 & 4)U 4) 4) a) Lj 4 . 4 " 4J 4H J 4 ' v 4 . 4) $ )
w 4 1 1 . 4.JHH.4J AJ -A4) -H HHH&j V.H4r4 2W.4,.)n V)HH *.:.2. 2 2 H2 2d 4 V C
0
H, 04 0 0
(.2 0 00 00 .,10 Ul )P-4 . - 4 0 0(n r 4 4 U 4J 40 UH 0H d
X- 4 4) a - C u14.4 4-o 4-' cu4-3444W. U4 0 14 )02 .2 .2 (0 X$.9 P. 0 0 0 0 00 0o22 0 0 :12
C.. En 9z CA o O C CACC pa

121 -
TABLE 5.6-111
PREDICTIONS OF SCORING RESISTANCE ON IRON
5%
Miscibility TemperatureAt. Rating from Literature Equation(5.
6-2)
No Metal Crystal (AL. B!2 D~L LR. d K Success
4 Be HCP Very Poor a... ... 13 VP +c I12 Mg HCP Poor -- Good Good/Fair -- 528 G +c
13 Al FCC Poor Poor -- Fair -- 131 P Tb
14 Si DIA Very Poor .. ...... 106 P .420 Ca FCC Very Poor .. ...... 604 G -22 Ti HCP Very Poor .. .. Fair -- 69 VP tc24 Cr BCC Very Poor -- Good ... 14 VP +b
26 Fe BCC Very Poor .. ...... 0 VP +
27 Co HC? Very Poor Poor . .... 12 VP +28 Ni FCC Vcry Poor -- Poor -- Poor 7 VP 4d29 Cu FCC Fair/Poor Poor -- Poor Fair 17 VP +30 Zn HCP Poor Poor Fair Fair Fair 496 G
3 2 G e D I A G o o d .. ... .. . 1 9 9 P
40 Zr HCP Very Poor -- Poor Fair -- 62 VP41 Cb(Nb) BCC Very Poor .. ...... 54 VP +4 2 M o B C C V e r y P o o r .. ... .. . 4 1 V P +
45 Rh FCC Very Poor .. ...... 35 VP +
46 Pd FCC Very Poor .. ...... 33 VP +
47 Ag FCC Good -- Fair Good -- 164 P -
48 Cd HCP Good/Fair Good Gooda Fair Fair 626 C +r4 9 I n F C C G o o d .. ... ... . 3 6 9 c +
50 Sn DIA Good .. .... Good 304 G +51 Sb LAM Good .. ...... 367 G +56 Ba BCC Poor .. ...... 687G58 Ce HCP Very Poor .. .... 285 P +(
73 Ta BCC Very Poor -- Fair .... 194 P +b
74 W BCC Poor -- Fair . 281 P +b77 Ir FCC Very Poor .. .. 129 P +d78 PL FCC Very Poor .. 476 G
79 Au FCC Very Poor .. 77 P + d81 T1 HCP Good .. ... 5.1 G +c82 Pb FCC Good -- Good Good/Fair Good 4768dG +b
83 Bi LAM Good -- Fair .... 502 G +b
90 Th FCC Very Poor .. .. .... 130 p :-d
92 U BCC Very Poor .. .. .... 35 VP +
BCC - Body Centered Cubic DIA - Diamond StructureFCC - Face Centered Cubic LAM = Lamellar or Sheet Structure
HCP - Hexagonal Close Packed
(,) Scoring against 1045 steel at 4640 fpm, kerosene lubricant. (Roach 1956)(B ) Static coefficient of friction in vacuum (Ernst 1940).
(C) Scar appearance in air and helium (Coffin 1956).() Static friction in air and nitrogen or argon (Machlin 1954).
(F) Kinetic friction in air (Grau 1966).
- Incorrect a - In helium only
-4- Correct b - Counted correct on most favorable data
+ - Conflicting Data c - HCP, counted correct on favorable data
d = counting Very Poor equal to Poor
'37;

1 22 -
TABLE 5.6-IV
PREDICTION OF SCORING RESISTANCE2
Nonferrous CouplesA
Miscibility Temperature
Rating From Literature Equaon 5.6-2)
Metal Pair Crystal (B (C) D jj. deg, K Success
Al-Zn FCC-HCP Poor -- Fair Poor 210 P +CCo-Cu HCP-FCC Poor - 54 VP Td.Al-Co FCC-HCP Poor --- - 195 p +
Cu-Cd FCC-HCP Poor -- Poor Fair 473 GCu-Zn FCC-HCP Poor -- Poor/Fair Fair 350 F tSb-Zn LAM-HCP Poor --- - 10 VP +dAl-Cd FCC-HCP Good - Fair 337 F kBi-Cd LAM-HCP Good --- - 45 VP -
Cd-Zn HCP-HCP Good -- Fair 30 P -
Zn-Ri HCP-LAM Good --- - 15 VP -
Cu-Ni FCC-FCC -- Poor Poor 43 VP +dCr-Mo BCC-BCC -- Poor - 128 P +Ti-Zn HCP-HCP -- Poor --- 404 G -
Ag-Cu FCC-FCC -- Poor Fair Poor 85 P _b
Cr-Ni BCC-FCC -- Poor - 38 P +Al-W FCC-BCC -- Poor - 789 G -
Cu-Sn FCC-DIA -- Good a -- 202 P -
Ni-Sn FCC-DIA -- Fair -- Fair 357 F +t
Al-'n FCC-HCP -- Poor Fair -- 210 P +-cAg-Ta FCC-$AC' - Good -- 811 G +Cu-Mo FCC-BCC -- Very Good --- 145 P -
AS-Cr FCC-BCC -- Fair/Good 94 -- g~P -
Cu- it FCC-BCC -- Good -- 435 GAl-Pb FCC-FCC -- Good a rair Fair 208 P .Cu--W FCC-BCC -- Good -- 504 CCu-Pb FCC-FCC - - Poor Good 348 F +Cu-Ti FCC-HiCP - - Poor/Fair -- 23 P +Al-Cu FCC-FCC - - Poor Poor 61 P +Cu-Mg FCC-HCP - - Pour -- 389 F -
Pb-Ti FCC-MCP - -- Fair -- 345 F +Zn-Zr RCP-HCP - -- Poor -- 906 G -
Ti-Zn HCP-HCP - - Fair -- 404 GCAg-Zn FCC-HCP - - Fair Poor 165 P ICAg-Al FCC-FCC - - Poor -- 4 P +Al-Mg FCC-HCP - Poor -- 249 P +Al-Ti FCC-HCP - -- Fair/Poor -- 18 P *Al-Ni FCC-FCC - Fair Poor 176 P bAg-Cu FCC-FCC - -- Poor -- 85 P +Ag-Ti FCC-HCP - Fair -- 39 P -
Ag-Zr FCC-HCP - -- Good -- 76 P -
Cd-Mg HCP-HCP - - Poor -- 9 P +-
Cd-Ti HCP-HCP - - Poor -- 538 C -
Cd-Zr HCP.-HCP - Good -- 891 VG +Mg-Ti HCP-14CF - - Poor -- 413 G
Ag-Mg FCC-HCP - Fair -- 206 P
See Table 5.6-111 for symbols and notes

- 123 -
Both the 0 = 0.50 and the 0 - 0.05 predictions gave the same total
scores on success, wich are shown in Table 5.6-V. This is surprising, since16 pairs are rated differently at 0 1 0.05 than at 50/50. The changes, whichwere mostly from "Fair" to "Poor" or "tood", exactly balanced out. It is evi-dent that Model IV works best on cubic/cubic systems; that diamond and lamellarcan be added to this with little loss of precision (75% versus 76% for cubicalone); and that hexagonal metals are not as well predicted with either cubic(68%) or other hexagonal (38%) types.
As pointed out by Hildebrand (1950), perfect success with this modelis unlikely due to intermetallic compound formation and also to crystallinetransitions of many metals at elevated temperatures. However, as a tool formaking a quick estimate on an unknown pair, Model IVA at least offers a 75%chance of success if HCP metals are excluded. At best, it offers some assur-ance that the Hildebrand blending equation (5.5-14) may also be usable onalloys.
Rabinowicz' Model IVB study of his static friction data has alreadybeen discussed. However, the relevance of dry static friction to the presentstudy is slight. It is of more interest to apply his general ideas to thelarge block of kinetic data from MacGregor (1964). Since most of the metalsare alloys, it is not possible to apply Figure 5.6-1. Rather than taking thetime to compute Y from Equation (5.5-14) for all these alloys, it was mostexpedient to revert to the original concepts in Rabinowicz' book (1965), that
is a function of Pm . As pointed out by the writer (Beerbower 1971A), thisfunction is
300 P 3m (5.6-6)
As a first pass, the values of F and P were plotted directly without takingthe cube root. A number of plots had To be made, as three kinds of balls wereused. Some of the correlations were strikingly good, and others quite sketchy.Rather than reproduce these charts in detail, only the highlights are given:
1. Six aluminum alloys gave fair to good linear correla-tions, each ball causing a distinctive slope (F/Pm);
brass = -0.0046, 52100 steel = -0.010, 302 stainless =-0.013.
2. Seven stainless steels plot well, except on brass wherethe scatter is bad. Slopes are 302 stainless = -0.008,52100 steel = -0.009.
3. Phosphorus bronze seems to be in a class by itself,which is as predicted (deGee 1971).
4. Two other copper and three nic!.el alloys plot together,with considerable scatter. They lie near the line forthe stainless steels.
II

-124-
TABLE 5.6-V
Success of Compatibility Predictions
Cubic Hexagonal IrregularFCC or BCC) RP DAadLM
Cubic; 28/37 17/25 5/7
Hexagonal: (17/25) 3/8 1/3
Cubic plusIrregular: 33/44 18/28 (5/7)
Overall Success 50/72 69.2%

- 125 -
5. The carbon and alloy steels are a rather mixedcollection, twenty in number (but with a differ-ent member not tested on each ball).
The writer is half convinced that the carbon and alloy steel plotscan be represented by inverted "V"s, with all the peaks at Pm - 320 kg/mm2 .The peak heights would then be: brass, F = 0.80; 302 stainless, F r 1.05;52100 steel, F % 0.85. Scatter is too severe to attempt to read slopes, butthey tend to be lower than those reported above for aluminum alloys.
There is hope that a more refined study might produce some usablerules for F, just as Table 5.3-11 offers some hope for rules of GR, but neitherpromises to be easy. Worst of all will be analysis of the data on oils A, B,and C; there is no evident connection between those F values and those for thedry case discussed below in 5.12.
5.7 Mixed Film Lubrication (Model V)
There may have been a thought, when the term "boundary lubrication"was coined, that it represented a fairly broad band of mixed conditions. How-ever, over the years a mental wall has been built up between the hydrodynamicand the boundary regimes. It seems to have become a literal wall lately; atthe joint ASLE/ASME annual conference, the two groups customarily meet simul-taneously in separate rooms. Fortunately, several of the experts on both sidesare making attempts to explore the interesting possibilities of mixed films,in which the load is shared between the asperity tops and the anti-asperityvalleys.
Many of the test machines in comon use were designed to provide
"pure" boundary conditions. Of these, the 4-ball machine has usually beenconsidered the purest, but even it shows an effect that can be attributed toviscosity, as shown in Figure 5.7-1 by Rudston (1971). Of course, there is
reason to believe that higher molecular weight hydrocarbons have a higher heatof adsorption than lower ones, which tends to raise a question on this andsimilar data as to whether we are not simply seeing a Model II effect. Afterreviewing the models, none of which are as complete as could be desired, a moreserious analysis will be made in Section 5.7.6.
5.7.1 Empirical Load-Sharing (Model VA)
Sakurai (1971) probably has used less theory in his model than anyother author cited in this report. Being oriented to boundary lubrication, heignored all the EHD work cited below and set his own specialty in first place,with the ERD effects appearing as the residual. His final equation is
[ dVd- = k2 (Pa-Ph- + Ph. exp(-k 4U)] exp(-k 3U) (5.7-1)
dd !h

-126-
Figure 5.7-1EFFECT OF WHITE OIL VISCOSITY ON WEAR
.. ........... 1 .0Four-Bali Test
Load :15 kg 0.9Speed :1500 rev/minDuration: 60 min
-0.8E
E
-0.6 w-In Ar <I * O0.5 ~
I ~ ~ * bE* - *~o.4S uIn Nitrogen w I
0.3 L
-~-Hertz Diameter0.Oil oil oil Oil0.
j I I -0.1
0 10 -2-0 30 40 50 60 70 soKINEMATIC VISCOSITY AT 100 0F, cSt
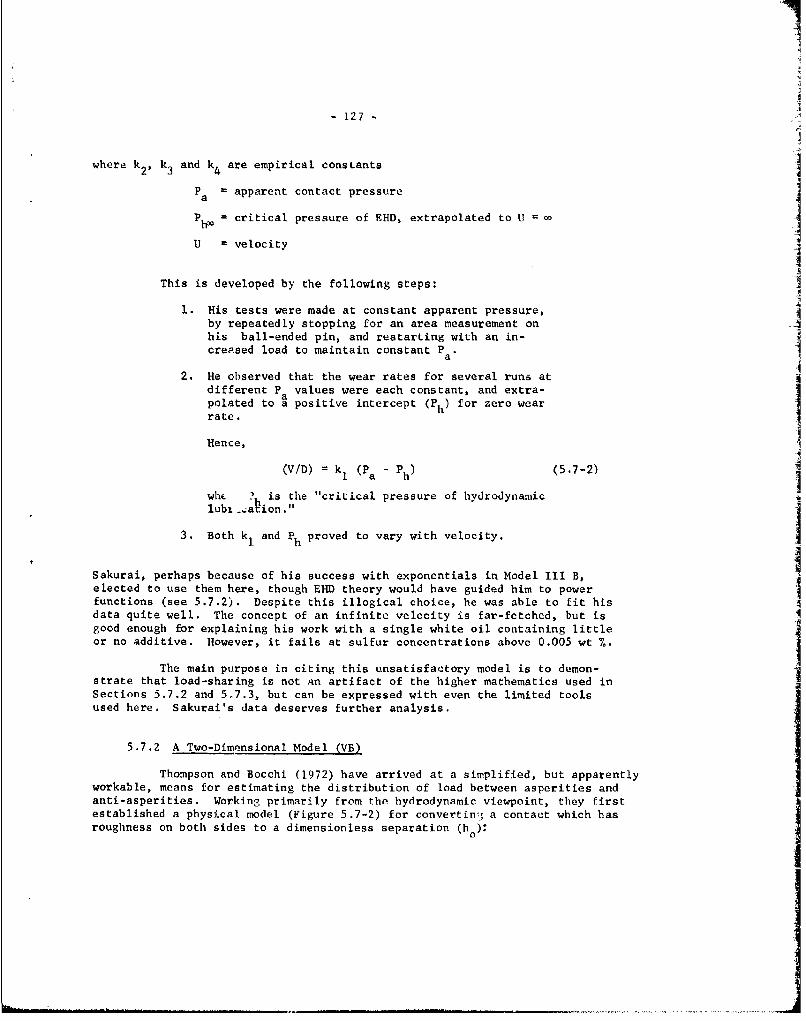
- 127 -
where k2, k3 and k are empirical constants
Pa = apparent contact pressure
PhP = critical pressure of EHD, extrapolated to U =
U = velocity
This is developed by the following steps:
1. His tests were made at constant apparent pressure,by repeatedly stopping for an area measurement onhis ball-ended pin, and restarting with an in-creased load to maintain constant P .
a
2. He observed that the wear rates for several runs atdifferent Pa values were each constant, and extra-
polated to a positive intercept (Ph) for zero wearrate.
Hence,
(V/D) = k1 (P a - Ph ) (5.7-2)
wh ? is the "critical pressure of hydrodynamiclub _aion."
3. Both k1 and Ph proved to vary with velocity.
Sakurai, perhaps because of his success with exponentials in Model III B,elected to use them here, though EHD theory would have guided him to powerfunctions (see 5.7.2). Despite this illogical choice, he was able to fit hisdata quite well. The concept of an infinite velocity is far-fetched, but isgood enough for explaining his work with a single white oil containing littleor no additive. However, it fails at sulfur concentrations above 0.005 wt %.
The main purpose in citing this unsatisfactory model is to demon-strate that load-sharing is not an artifact of the higher mathematics used inSections 5.7.2 and 5.7.3, but can be expressed with even the limited toolsused here. Sakurai's data deserves further analysis.
5.7.2 A Two-Dimensional Model (VB)
Thompson and Bocchi (1972) have arrived at a simplified, but apparentlyworkable, means for estimating the distribution of load between asperities andanti-asperities. Working primarily from the hydrodynamic viewpoint, they firstestablished a physical model (Figure 5.7-2) for convertin, a contact which has
roughness on both sides to a dimensionless separation (he)

- 128 -
Figure 5.7-2
TWO-DIMENSIONAL PHYSICAL MODEL
wI
1
I
r 2
/ A
a. Model Geometry for Contact of Cylindrical Machine Components
x U 1
dI
b. A Model for the Micro-Geometry of the Contact Illustrated in a
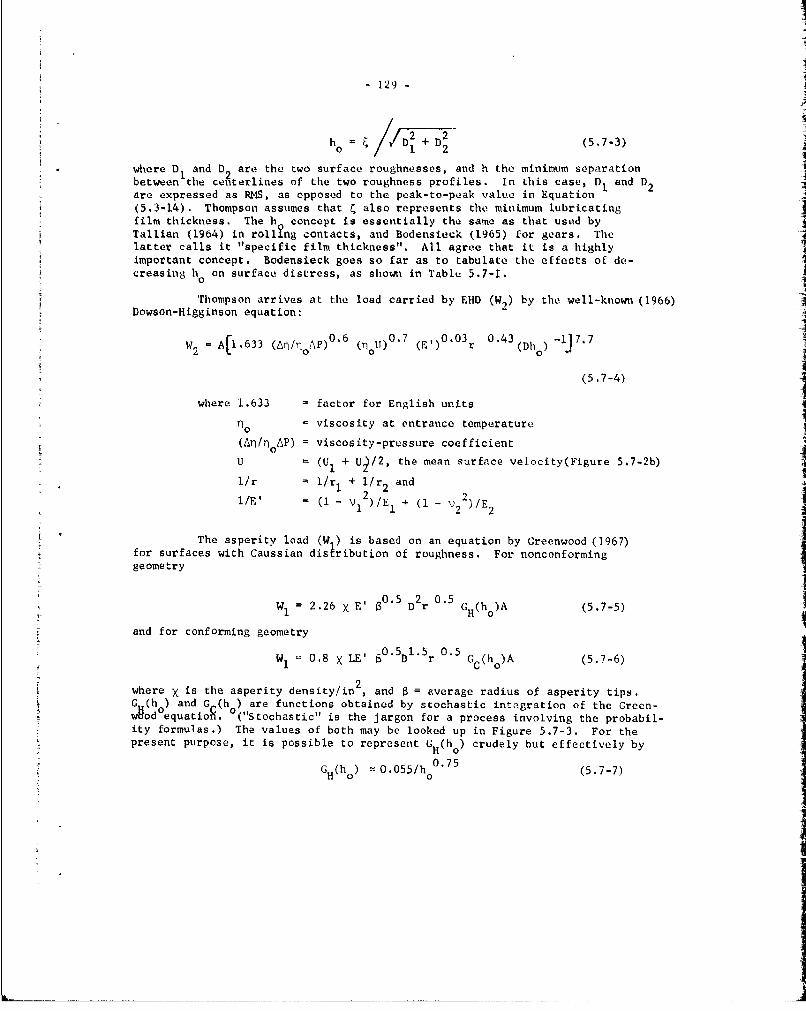
129-
~ 2ho /1) + D2 (-73
h 0 ~ 1 2(7)
where D1 and D2 are the two surface roughnesses, and h the minimum separation1 2between the centerlines of the two roughness profiles. In this case, D and Dare expressed as RMS, as opposed to the peak-to-peak value in Equation
(5.3-14). Thompson assumes that also represents the minimum lubricatingfilm thickness. The ho concept is essentially the same as that used byTallian (1964) in rolling contacts, and Bodensieck (1965) for gears. Thelatter calls it "specific film thickness". All agree that it is a highlyImportant concept. Bodensieck goes so far as to tabulate the effects of de-creasing h on surface distress, as shown in Table 5.7-I.
0
Thompson arrives at the load carried by EHD (W2) by the well-known (1966)Dowson-Higginson equation:
W A[1.633 (An/no0 P)0 '6 ( U) 0 7 (E')O'O r 0 "4 3 (Dh) -J 7 . 7
(5.7-4)
where 1.633 = factor for English units 4
T1 = viscosity at entrance temperature
(AnIn AP) = viscosity-pressure coefficient
U U I + U/2, the mean surface velocity(Figure 5.7-2b)
I/r = I/r + /r2 and
lI/E' = - V12 )/E + (1 - ;2)/E
The asperity load (W1) is based on an equation by Greenwood (1967)
for surfaces with Caussian distribution of roughness. For nonconforminggeometry
WI 2.26 X E' 0.5 2 0.5 (h)A (5.7-5)
and for conforming geometry
0.5 1.5 0.5-*W1 " 0.8 X LE' 0"D r G (1h )A (5.7-6)
2where X is the asperity density/in , and B = average radius of asperity tips.G_(h ) and Gc(h ) are functions obtained by stochastic integration of the Green-wodoequation. ("Stochastic" is the jargon for a process involving the probabil-ity formulas.) The values of both may be looked up in Figure 5.7-3. For thepresent purpose, it is possible to represent GH(h) crudely but effectively by
075G ) H ( 0.055/h o (5.7-7)
..... ... ....

I- 130 -
TABLE 5..7-I
GEAR SURFACE DISTRESS AS A FUNCTION OF SPECIFIC
FILM THICKNESS
Specific Film
Thickness (ho) Type of Surface DeteriorationOver 1.5 None (Full hydrodynamic lubrication)
1.3 to 1.5 Slight marking
1.2 to 1.3 Improvement with straight oil1.1 to 1.3 Improvement with E.P AdditivesBelow 1.1 Scoring, Spalling, Galling, Seizing, Scuffing, etc.(or 1.2)
Below 1.0 Pitting (More closely related to surface compressive stress)Below 0.8 Abrasive wear
Below 0.5 Rippling and Ridging

-13l
Figure 5.7-3
INTEGRATED VALUES OF G C AND G H
.40
.35
.30-
.25
z<.20
.15C
.10
G H
.05
0.0 12 3
MINIMUM FILM THICKNESS(h0)

- 132 -
from 0.20 < ho <0.70, and
GH(h) 4.55/ho2 (5.7-8)
from 0.70 < h < 1.50. As these are the regions of greatest interest, we may 4obtain a better view of Thompson's result by setting, for the above limits,
Who7 .7-0.055 JHho 6 9 5 j= 0 (5.7-9) -:
and Who7 7 4 .55 J1Hh0 1-L O (5.7-10)
where J . the known portion of (4.5-6), andHjL = the known portion of (4.5-5). 1
Since W, the total load, is also known, t!lese equations are readilysolvable by machine or graphical methods, though not exactly. A typical solu-tion, for a journal bearing problem described in detail in Thompson's report(1972), is shown it, Figure 5.7-4. The results seem plausible, though not muchdata was cited in support of it.
There has beon criticism of this model based on using the vD 2 + D2rule for averaging two surface roughnesses, since it was derived for staticcontacts, and on some other simplifications. None of these appear fatal, butthe model can certainly use some more work. A minor effort to test Model VA ismade in Section 5.7.6.
5.7.3 The One-Dimensional Model VC
Christensen (1971), in the latest of a long series of papers, hasproduced a set of solutions to the load-sharing problem which are more rigor-ous than Thompson's, but less easily followed. He recognizes three cases:
a. One-dimensional, longitudinal structure
b. One-dimensional, transverse structure
c. Uniform, isotropic structure.
The last of these is relatively difficult to deal with, and Christen..
sen points out that it also is not necessarily the most important. Light wearand running in tend to produce the longitudinal case (a), so that it has spe-cial interest. Machining across the direction of sliding would generate case(b), at least until wear converts it to case (c) or eventually (a).

- 133-
Figure 5.7-4
TWO-DIMENSIONAL SOLUTION FOR A JOURNAL BEARING900 , ' ' " ' ' ' ' ' 1' "
511111 5 111 511 115 1I
800
0
700 o
~/500-600/
500 0
0400- 0
La-
200
0
100 --o
o _2 ? , ,o2 3 4 5S10 2 103 104 105
APPLIED LOAD (W/A), Ib/in
-i-

I
- 134 -
These three cases are shown in Figure 5.7-5, in which certain param-eters are also defined. To use these, it is necessary to give a measure ofthe roughness variation. Though this is known to be typically Gaussian, con-
venience dictates representing it by a probability density polynomial such as
5 7f(h.) + (5.7-11) 3h 1 ~32 L35 cJ )+ 7 c J,~
where h takes account of roughness measured from the nominal level, and 2c is
the maxImum peak-to-valley roughness (D in Section 5.3).
He defines an "expectancy operator" E(X) by
A
E(X) . x f(x) dx (5.7-12)
where f(X) is the probability density function of the random variable X.
He then sets up a Reynolds-type equation for the longitudinal struc-ture
3) +. [dX H Y [- H = 6nU -E(H) (5.7-13)
where p p(x, y) is the (predetermined) mean hydrodynamic pressure. Similarequations can be set up for cases (b) and (c).
These can be integrated for any specific geometry, and he chose a
plane slider of length Z = 1 and constataL inclination m, as shown in Figure5.7-5. The resulting plots of his film thickness parameter versus load andfriction appear to be quite satisfactory. With additional assumptions, he
then generalizes into the mixed regime. Figure 5.7-6 shows a Stribeck typediagram for three hypothetical cases, calculated on the above principles. Hewas much impressed by the fact that, even under conditions of severe roughness,
less than 1% of the total bearing area is in boundary lubrication.
Thus, the friction is dominated by the boundary shear stress, while
the load-carrying ability is mainly hydrodynamic in nature. The fact that thecurves separate to the left of the dividing line helps to explain why theStribeck function 1j/W has never been very helpful in mixed lubrication.Cases A and B differ in material properties, but not in boundary coefficientof friction; evidently all these factors enter into the position of the line.
Cases B and C give an even more striking illustration. With all materialpropp~ties constant, simply shifting the variable from W to nU changes F by alarge factor.
Another example of the end-products to be had from Model VC is shown
in Figure 5.7-7 where film collapse due to thermal instability is predicted.Load is slowly increased up to point A. Collapse takes place due to the reverse
......... . ....... .,, ,

-135
Figure 5.7-5
ONE AND TWO DIMENSIONAL PHYSICAL MODELS
4'..H
a) Longitudinal roughness
b) Transverse roughness
z
Hi
x
c) Uniform roughness

-1.36-
Figure 5.7-6
STRIBECK-TYPE DIAGRAM FROM THE ONE-DIMENSIONAL MODEL
Mixed regime Hydrodynamic regime
4 -
0.006
iRiII
WA
zI
0.008U-
0
0.006
lI-
' 0.004
w
d 0.002
o0 I I a f0 2 4681 I "
Case A: Material hardness = highBoundary shear stress =highBoundary frict. coeff. =0.05
constant qU load varyingCase B: Material hardness =low
Boundary shear stress =lowBoundary frict. coeff. =0.05
Case C: Material data as for case B constant load iUL varying

- 137 -
Figure 5.7-7
FILM COLLAPSE DUE TO THERMAL INSTABILITYTHEORETICAL PREDICTION
1.6
w 1.2 BS0 10.8 -
0.4 A
080 0.4 0.8 1.2 1 .6 2.10 8
LOAD w (dyn)
Figure 5.7-8
FILM COLLAPSE DUE TO THERMAL INSTABILITYEXPERIMENTAL VERIFICATION
I I I i
6° /5
4 B
0
I-I
U. 2
1 ( ,,/A
O 20 40 60 80 100= LOAD (Kp/cm2 )

- 138 -
curvature of the line, and friction jumps to point B. This is a purely theo-retical diagram, but experimental verification is shown in Figure 5.7-8. Itis indeed a triumph that the two figures are nearly identical in shape.
The above description of how Figures 5.7-5 through 5.7-7 were cal-culated is quite incomplete. Although Christensen gave more details than arequoted, he omitted some of his assumptions and methodology for getting fromEquation (5.7-13) to the Stribeck diagram and the thermal collapse plot.Publication of these vital details is promised in the near future.
5.7.4 Gear Surface Damage (Model VD)
Bodensieck (1965) has worked out a model, apparently quite indepen-dently, which has much in conmon with Christensen's and also Tallian's (1964).It starts with the definition of specific film thickness
h0 /D = 0.274nsUR/D (5.7-14)
where rj is the viscosity at surface temperature (T) and U the rollingvelocity. The constant 0.274 applies to English units. le obtains T fromthe equivalent of Equation (5.4-6). s
The next step was an empirical observation that the coefficient offriction could be related to h by
0
F = (0 .0212/h o ) + 0.0125 (5.7-15)I
which fits a great deal of data from various sources quite well. He felt that.the constants might vary with the type of lubricant, but did not find any datato indicate such variation.
The problem of putting D into peak-to-valley terms was solved in adifferent way than in Section 5.3.3. Table 5.7-IT shows the multipliers recom-mended for various manufacturing methods. He felt that only the value for"ground" was fully verified.
The results obtained on an experimental program designed to testModel VD were shown in Table 5.7-I. The h values were calculated from Equa-tion (5.7-14), and the second columns are ?he test data.
Model VD does not really go the whole way to a load distribution be-tween asperities and EHD, and perhaps should not be included in Section 5.7.However, it does show what might logically be the next step forward by AGMA.
The reader is cautioned that Bodensieck defined ho from the average
roughness of the surfaces rather than the sum as did Thompson, Christensen, andothers. His system is self-consistent but must not be mingled with the others
indiscriminately.

-139-
I.J
TABLE 5.7-11
ROUGHNESS CONVERS ION FACTORS FOR VARIOUSGEAR MAkNUFACTURING, METHODS
METHOD OF RTO PEAK-TO-VALLEYFINISHING ROOT MEAN SQUARE
Shaping 2.0
Hobbing 1.8
Shaving 1.5
Grinding 1.4*
Lapping or 1.3
Honing
*Only pritnding has been thoroughly verified on this scale.

!I
-140 -
5.7.5 A Tentative Break-in Mechanism
(Model V)
At this point, it will not be necessary to develop the detailedmathematics to show that Model III can be combined with Model V in severalways to produce a picture of break-in or running in which has little to dowith the conventional ideas. After the initial scraping off of extra-highasperities, the bare spots serve as sites for generating resin. This partlyfills the anti-asperities, which increases the EHD share and so relieves theremaining asperities. After this, the system tends to be self-regulating,since depletion of the surface resin produces a negative feed-back in the formof increased asperity contact, which in turn gives the needed relief by gen-erating more resin. Thus, a properly broken in bearing neither scuffs norgenerates the excessive amount of resin known as "lacquer" or "varnish", butmerely maintains its "glaze".
5.7.6 Testing Model V (Mixed Film Lubrication)
The situation on Model V is still too fragmentary to permitnumerical analysis. However, it should be possible to assess the importance ofthis model in terms of both need and applicability.
5.7.6.1 Need for Model V
As shown in Figure 5.7-1, not even the 4-ball machine is free fromviscosity effects (though, as mentioned in Section 5.7, viscosity is not theonly variable in that figure). Sakurai's data also support the concept thateven test machines which are designed to rule out EHD effects, as shown inFigure 5.7-9, still respond to velocity.
The internal evidence in Thompson's (1972) paper, as exhibited inFigure 5.7-4, indicates that a fairly constant 1% of the load is carried by theasperities. This is in very reassuring agreement with Christensen's findingsof less than 1% in boundary lubricaticn for Model VC. Thus, the experimental-ists and theoreticians agree thal the EHI correction is sizable.
5.7.6.2 Applicability of Model V
It appears that Thompson's work shows considerably less load de-pendence than Sakurai's. The fact that the latter chose to express his loadas "apparent pressure" should not create any problem. The trouble becomesevident when an attempt is made to use Model VB with flat-on-flat geometry.For this case, r = r1 = r2 = -, so that W and W = ' and the equations be-come unsolvable. In Aodel VC, the same siluation arises in a different way;when m = 0, though not shown in Figure 5.7-6, the solution becomes indeterminate.Model VD does not have any capability for handling pure sliding, as Equation(5.7-14) requires the rolling velocity.

I
-141
Figure 5.7-9
EXPERIMENTAL DEPENDANCE OF WEAR RATE ON APPARENT IBEARING PRESSURE
5 ,
0 II-Io _
LS 2 N I
5 15 25 35
CONTACT PRESSURE, P, KG/MM2

-142-
Thus, none of the models is capable of being used on Sakurai'sdata. Rudston's data, on the other hand, could be viewed as spherical geometryand "solved" by Model VB, if we ignore the fact that as soon as wear starts,the geometry becomes essentially flat-on-flat as in Model 11.
Another problem not faced by the model makers is the extremelyhigh probability of a change in D due to break-in. This is the same problemnoted in Section 5.1.2; as mentioned there, it will always he a problem. Per-haps Table 5.7-i represents a good empirical way of handling it. As rioted inSection 5.3.3, a survey of lubrication engineers on a world-wide basis showedmuch less concern with initial D values than is shown by the theoreticians(Beglinger 1969). 0stvik (1968-9) shows data on .D, but no general model..
Recent work by Tallian (1971), not yet published, will help inthrowing some light on these matters.
5.8 Rolling Contact Fatigue (Model VI)
Another of the limiting conditions that may be encountered is adecrease in the lifetime of rolling element bearings in lubricants that havebeen optimized for boundary lubrication. This is not a point that can be
located on Figure 2-1, as noted in Section 2, since it involves fatigue. Inmany cases, separate lubrication of the ball or roller bearing sounds ideal.However, such a policy applied rigidly would certainly increase the cost ofgear boxes and could not be practical at all until sealing of rotating shaftsbecomes more perfect than can be foreseen at present.
5.8.1 The Interfacial Free Energy (12 Theory
Up until recently, it has been taken for granted that strong wettingis an unmitigated blessing, though Bowers (1956) raised the question as towhether this was true. Campbell (1957) investigated and concluded it was not,while Clayfield (1957B)reached the opposite conclusion. Rounds (1962, 1967) has
shown that some additives which enhance boundary lubrication can have adverse ef-
fects on ball bearing fatigue. Unfortunately, his tests were conducted withoutcontrolling the humidity. High humidity promotes fatigue, (see 5.8.3), butthere is independent reason to believe his conclusion may be correct. The stand-
ard Griffith equation for the minimum force (Wo ) to propagate a crack of length
(Z) In a solid isW2 Eiy 1/Z (5.8-1)
lhere Elis the Young's modulus and Y, the surface free energy of the solid.!or submerged solids, Y12 (= Yl + y 2"A 12) must replace Y tending to lower
;O. Data on crystalline materials certainly bears this ou (imanaka 1968)data on glass usually takes the opposite trend. Thit. is somewhat Un-
expected, since Equation (5.8-1) was basically derived for glassy solids.The reduction in strength of materials on wetting is generally known as the
Rehbiiper effect (Likhtman 1958), while the increase in strength is known asthe Joffe effect (Westbrook 1968). Examples of both are shown in Appendix V.
-..." .. .' i , ...,-- -= .. ... i ... 1 ..... I

- 143 -
5.8.2 Testing the Tnterfacial
Free Energy Model VIA
Many workers have tested Model VIA. Westwood has been particu-larly active (1968, 1970A, B), and cites many examples to which Equation
(5.8-1) is not applicable. Stoloff (1968)'has demonstrated this for many
cases of metals wetted by liquid metals. Westwood (1970A) offers specificexplanations, some of which are illustrated in Figure 5.8-1. An intrudingmetal atom (or organic molecule) B in a crack ending at A-A will probablyaffect the cleavage plane strength (a) but not the slip plaRe strength (')While simple wetting at A-A0 tends to decrease a, chemical reaction at thatpoint may increase it. Since most tension failures include a large ductilecomponent depending on x, the effect of wetting may b- trivial. In manynon-metals, the liquid may exert electron-binding effects which completelyover-ride surface free energy and result in specific responses to hydrogenbonding. These are not violations of the Gibbs principle nor the second lawof thermodynamics, but merely have less obvious explanations than the oneshown in Equation (5.8-I).
Some workers object to Equation (5.8-1) on the grounds thatit is all too often applied to systems having some degree of ductility withoutadequate recognition of the need for a large (and non-rigorous) positive corr-ection term. A negative correction term is also needed; as pointed out byFox (1970), there is a substantial temperature rise in the zone A-A of Figure5.8-1. This is further developed in Appendix IV. 0
Data by Rounds (1962) on fatigue of steel balls in various lubri-cants are shown in Table 5.8-i. These have not yet been plotted into a Hansendiagram, as discussed in 5.11.4 below and in Appendix V, but good results willprobably not be achieved since the circle would have to enclose paraffinic oils,acids (including the mono- and dialkyl-phosphates) and halogenated fluids, butexclude all other fluids. Thus, wetcing does not explain the data. WorK by
Appeldoorn (1965) using one ceramic ball tends to confirm that point, as shownin Figure 5.8-2. On the other hand, if sliding fatigue data are admissable evidence,
Table 5.3-11 makes a strong case for a correlation to high wetting energy as Oil D
contains 0.2% stearic acid. Clearly, the choice of both base stocks and additivesmay be fatigue limited, though in sliding, fatigue is the lesser of two evils.
5.8.3 The Hydrogen Embrittlement Theory(Model Vl,.
An important alternative to 5.8.1 is that reduction in fatigue .life cancome from hydrogen embrittlement. This arose from work by Grunberg (1960), who found
strong absorption of hydrogen from wet oil. Schatzberg (1968, 1970A-B) continued
this work. Frank (1957) showed that abrasion increased the permeation- rate. The
fact that high carbon steel is especially prone to such damage is noted by Berry
(1967), and Vitovek (1964) traced this to the formation of sub-surface bubbles of
methane, which cannot diffuse out again as does hydrogen. This is further discussed
in 7.9. As shown by Bradley.(1970) paraffins are prone to electron damage; thismay generate hydrogen, as may acids, so Rounds' data are partly explainable byH2, plus the c arbon pick-up of Model 11lC.
It is to be hoped that some way around the conflict of interestsbetween rolling and sliding elements can be found. For the moment, it appearsthat decreasing Y12 to protect gears entails some risk of decrea:ing #j, onball bearings in the saute hIuuuing.

- 144 -
Figure 5.8-1
THE INTERFACIAL FREE ENERGY THEORYOF FATIGUE CRACKING
w00 1
Schematic illustration of a crackA /Slip Plane in a solid, subjected to an
B * increasing force Wo. The bondCleavage Plane A-Ao constitutes the crack tip,
A and B is a surface-active liquido metal atom.
w0

- 145 -
TABLE 5.8-I
FATIGUE OF STEEL BALLS IN VARIOUS LUBRICANTS
Relative valuesViscosity At, CAt tR.o Wear Running Weibuli
Chemical composition It v F 21OF VI life rate torque slope
Mineral oilsNaphhenic rineral oil 13. 2.85 36 1.33 31.7 1.52 3.40
Naphthenic mineral oil 33.4 4.49 3 1.24 34.9 1.49 2.35Naphthenic mineral oil 110 8.17 8 2.13 18.6 1.38 2.33Naphthenic mineral oil 262 12.3 -26 2.58' 3,64 1.36' 2.18'Napt thenic mineral oil 1120 29.0 -S 2.68 3.2 1.27 2.24Par-.ffinic mineral oil 5.21 1.74 91 0.644 873 1.949 1.63'
Paraffinic mineral oi 10.2 2.55 82 0.610 683 1,96' 1.504
Paraffinic mineral oil 59.0 7.45 95 0.95' 92.2' 1.49' 1.57'
Parafnic mineral oil 262 20.6 100 1.03' 8.84 1.33' 0.946
Paraffinic mineral oii 463 30.3 101 0.97' 1.63 1.20' 1.18'
E.iers
Isodecyl pela rgonate 4.74 1.69 118 0.' 5 1.06 1.18 1.72
Dipropylene glycol dipelargonate 9.36 2.64 132 2.98 6.82 1.14 3.63Di-2-e~hylhexyl sebaca.e 12.8 3.34 154 1.76' 1.94' 1.19' 0.59'
Di-2-ethylhexyl phthalate 20.8 4.23 125 2.61 19.6 1.29 0.59
Trimethylulpropane eater 23.7 4.82 140 1.5 3.40 1.13 0.86Pentaerythritol ester 20.4 5.01 130 2.95 3.29 1.15 1.66
Tridecyl azelate 36 6.38 134 1.90 5.16 1.44 1.64
Di-alkyl dimerate 81.2 12.0 133 2.91 2.39 1.16 2.02
Diester 188.2 20.4 122 1.03 2.08 1.09 1.34Diester 273.7 28.9 125 0,60 2.85 1.02 1.26
Fatty acids and alcohols
Pelargonic acid 5.7 1.92 167 0.49 27.5 0.96 1.39
Oieic acid 20.9 4.94 171 0.23' 29.6' 0.85' 0.90'
Saturated fatty acid 27.3 5.25 136 0.46 2.86 0.91 0.74
Branched C1 . acid 36.0 6.24 99 0.56 37.0 0.93 0.48
n-D..cyl alcohol 9.0 1.93 -209 0.51 76.5 1.36 3.85
Cyclohexanol 26.6 2.39 -639 1.53 38.2 1.61 1.13Oleyl alcohol 18.9 3.32 13 1.01 2.45 0.85 0.49
Ethylene glycol 9.44 2.01 -57 1.04 17.3 0.73 0.80
Dipropylene glycol 33.8 3.18 -- 385 1.40 86.5 1.47 1.16
Triethylene glycol 18.7 3.35 23 1.78 72.3 1.14 0.85
Glycerin 224.4 11.56 -15 2.30 16.5 0.68 0.93
Polyglycols
Polyglycols (propyle'e 13.10 2.95 78 2.31 45 1.60 2.66
oxide, ethylene oxide 36.5 6.80 144 1.28' 31.9' 1.23' 0.60'
polymers) 65.0 11.0 142 0.88 7.50 1.25 0.93141 21.9 140 0.81 45.S 1.28 1.22
Phosphate estersTri(2 .ethylhexyl) phosphate 8.03 2.29 107 1.01 2.57 1.06 1.56
2-Ethylhexyl dicresylphosphate 16.63 3.14 27 0.92 2.30 1.10 2.06
TricresYl phosphate 30.8 4.12 -- 35 1.20 4.34 1.8. 1.50
Triaryl phosphate 63.4 6.16 10 3.01 29.2 1.82 2.11
Triaryl phosphate 246.4 9.49 -148 2.75 12.3 173 4.35
Mono and dialkyl phosphate(C12 average) 113.2 15.05 129 0.12 707 0.86 1.41
Di-dodecyl phosphite 13.2 3 SS 183 0.54 26.9 0.84 1.20
iI
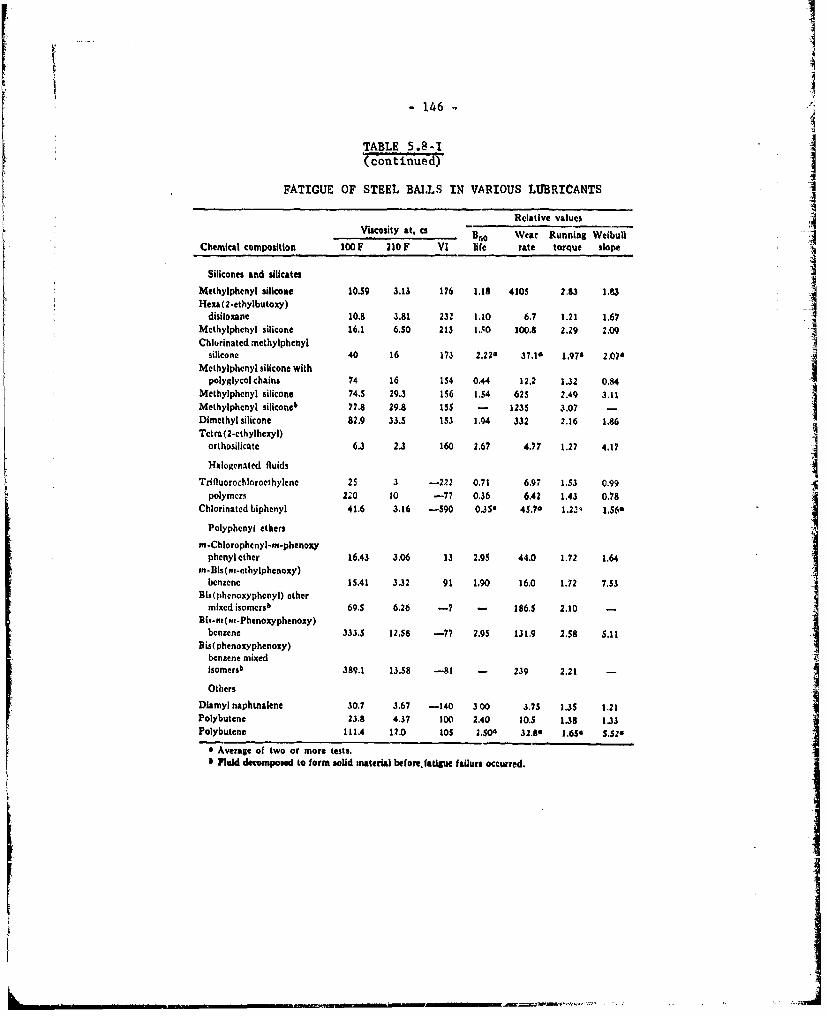
-146-
TABLE 5.8-I
FATIGUE OF STEEL BALLS IN VARIOUS LUBRICANTS
Relative valuesViscosity at, ca Bro Wear Running Welbull
Chemical composition 100 F 210 F VI life rate torque slope
Silicones and silicates
Methylphenyl silicone 10.59 3.13 176 1.18 4105 2.83 1.83Hexa ( 2-ethylbutoxy )
disiloxane 10.8 3.81 232 1.10 6.7 1.21 1.67Methylphenyl silicone 16.1 6.50 213 1..0 100.8 2.29 2.09Chlorinated methylphenyl
silicone 40 16 173 2.229 37,14 1.97k 2.07'Methylphenyl silicone with
polyglycol chains 74 16 154 0.44 12.2 1.32 0.84Methylphenyl silicone 74.5 29.3 156 1.54 625 2.49 3.11Methylphcnyl silicone0 77.8 29.8 155 - 1235 3.07 -Dimethyl silicone 82.9 33.5 153 1.94 332 2.16 1.86Tetra (2-ethylhexyl) :'
orthosilicate 6.3 2.3 160 2.67 4.77 1.27 4.17
Halogenated fluidsTrifluorochloroethylcnc 25 3 -222 0.71 6.97 1.53 0.99
polymers 20 10 -77 0.36 6.42 1.43 0.78Chlorinated biphenyl 41.6 3.16 -590 0.35 45.76 1.2.19 1.56'
Polyphenyi ethers
m-Chlorophcnyl-m-phenoxyphenyl ether 16.43 3.06 13 2.95 44.0 1.72 1.64
m'-Bis(rn-ethylphenoxy)benzene 15.41 3.32 91 1.90 16.0 1.72 7.53
Bis(phenoxypheny]) ethermixed isomers b 69.5 6.26 -7 - 186,5 2.10 -is-rn (m-Phenoxyphenoxy)benzene 333.5 12.58 -77 2.95 131.9 2.58 5.11
Bis(phenoxyphenoxy)benzene mixedisomersb 389.1 13.58 -81 - 239 2.21 -
Others
Diamyl naphtnalene 30.7 3.67 -140 300 3.75 1.35 1.21Polybutene 23.8 4.37 100 2.40 10.5 1.38 1.33Polybutene 111.4 12.0 105 2.504 32.8' 1.65' 5.526
6 Average of two or more tests.6 Fluid decomposed to form solid material before fatigue failure occurred.

-147
Figure 5 .8-2FATIGUE RESULTS WITH ONE
CRYSTALLIZED GLASS AND THREE STEEL BALLS
Weibull Distribution Function95
80
60Li
400
IL020 V0
L
6
4
10510 6 10 7 108
LIFE, STRESS CYCLES

-148-
On the more optimistic side, in a recent interview Mahncke (1971)of SKF Industries indicated Lhat fatigue cracking of bearing balls was arelatively minor problem compared to those caused by oil oxidation, etc. Itappears that until these problems are solved, Model VI will not limit progress.
5.9 Abrasive Wear (Model VII)
As assumed in Section 2, there will be no abrasive wear until the systembecomes contaminated with wear products from one of the primary processes. Thislimits the nature of the abrasive particles to the following classes:
(a) Bits of the hydrated oxide coating found on all new parts.
(b) Metallic debris from break-in. This can be minimi:zed by carefulfitting, or even by breaking in, flushing and refilling at the~factory.
(c) Metallic particles from fatigue wear (Figure 5.3-2).
(d) Metallic particles from wear by adhesion or interlocked disloca-
tion and transfer (Figures 5.4-4 and 5).
(e) Products from corrosive wear.
(f) Carbide particles from Model IIIC.
(g) Colloidal particles from Process O3b (Table 5.5-IT).
(h) Oxide particles from Process #4 (Table 5.5-IT).
This assortment of material can be described a little more simply ifwe look at the damage potential rather than the process in question. The ran'-ing might well then be, in increasing severity:
(g) Colloidal particles are pLobably harmless.
(e) Halides, sulfide and phosphate particles are not very harmful.(b), (c), (d) Metal particles can vary from mildly to severely
abrasive, but tend to the severe side.
(f) Carbides tend to be severly abrasive.
Once abrasion due to oxide or carbide begins, it can result in anotherclass of particles:
(i) Metal chips cut off the harder parts. These are in a class withoxides.
The abrasive wear processes are of two kinds; embedded particles (two-body abrasion) and free-moving particles (three-body abrasion).

-149-
5.9.1 Two-Body Abrasion (Model VIIA)
Most of the work has been done in this area. Finkin (1968B) made a com-prehensive study of abrasive wear in general and was able to cite 42 references,most of them from the UK and USSR. The sole commentator cited 7 more, as evi-
dence of US interest. However, only Rabinowicz (1965A, B) has really done muchin the US towards a model.
The mechanism of two-body abrasion is brutally simple, as shown in
Figure 5.9-lA, from which
2(V/d) r tan = W tan @/P (5.9-1)m
where r and e are given special definitions. A6 .A.3wn in the figure, r is theradius (or half-width) of the cut, and @ the angle of contact. This is a specialform of Equation (5.1-4), with K = tan e.
Krushchov (1956A, B) found Equation (5.1 -4) to be valid for 12 commer-cially pure cubic and hexagonal metals (some in two different grades) and twocarbon steels, as shown in Figure 5.9-2. He also performed experiments to test
an equation he derived for nonhomogeneous bodies (1958). For such materials,the effective hardness is
Pin = Z(PiO ) (5.9-2)
where P. is the hardness of phast: i, and 9. its volume fraction. If the body is
porous, (l-E9.) is the volume fraction of voids.
Heat hardened steels and work hardened metals showed branched lines inwhich the annealed metal falls on the line of Figure 5.9-2, but hardening pullsit off as shown in Figures 5.9-3 and 5.9-4. All these can be expressed by
(V/d) - K W/ [P + C (P -Po)] (5.9-3)
where P is the annealed hardness0
Pm is the hardness after treatment
C is a constant for the metal.
The value of Cm is unpredictable. For steels, it is positive and varies positivelywith P ; for nonferrous metals (including 18% Cr/ 9% Ni stainless steel) it can be
zero or even slightly negative.
Spurr and Newcomb (1957) found a relation to Young's modulus (E I) similar
to Equation (5.1-4). Krushchov and Babichev (1960) followed up on this, and changed
it to
(V/d) E 1.3(5.9-4)

-150 -
Figure 5.9-1
TWO-BODY ABRASIVE WEAR
Abrasive Grain, ' 2r ,L ' /
Rem ye .~~-. Surface -
A -Abrasive Wear Model in Which a Cone Removes Material from a Surface
Rolling Fixed(Non-Abrasive) (Abrasive)
B - Sketch of Abrasive Particles Between Rubbing Surfaces
Figure 5.9-2
ABRASIVE WEAR AS A FUNCTION OF HARDNESS
40
Ti
. 30 Cr0 y12
20 Co Fe,Ni
I- N;
(n 0OCu
an Al
0 Pb0 100 200 300
HARDNESS, P 0-Kg/mm 2
Wear resistance, r, versus hardness, Po, ercially pure metals andtwo annealed steels; y12 is 1 .2 percent c; and 40 is 0.41 percent
carbon steel.

- 151
Figure 5.9-3
EFFECT OF HEAT- 80 ,HARDENING ON ABRASIVE
WEAR
'/6O X12160 0W.,-
o 0W 0w0
I-0~40
00
w20 0FeWear resistance, e , versus M"
hardness, Pm, for four heattreated steels and three puremetals (see Figure 5.9-2for steel codes) 0 I L ,
0 200 400 600 800HARDNESS, Pm' kg/mm2
Figure 5.9-4 80 I I
EFFECT OF WORK-HARDENING ON ABRASIVE
WEAR
60- W
°40 _
Wear resistance, (, versus 20 3hardness, Pm, for workhardened metals- 1-lowbrass, 2-aluminum bronze, 1 23-beryllium copper, 4-18Cr- - U9Ni steel, and 5-0.45percent carbon steel 0
0 200 400 600
HARDNESS, Po' kg/mm 2

- 1J2 - .
1521
but this again showed branching for heat-hardened steels so was no improvementon Equation (5.9-3).
Giltrow (1970) correlated wear coefficient (K) with the square root ofcohesive energy, for material from polyethylene to tungsten, but did not includeother variables. This is provocative but not immediately useful.
Equation (5.9-3), or a combination of (5.1-4) and (5.9-2), include nothingat a[j. about the abrasive except that it is much harder than the metal. Nathan andJot.,. (1967) showed that when the ratio of metal to abrasive hardness (Pm/Pa) isless than 30,
(V/d) - W log (Pm/Pa) (5.9-5)
their previous work had showed that, up to r = 35 Pm,
(V/d) = K'r (U + b) W (5.9-6)
where (U + b) = velocity plus a constant. Combining these:
(V/d) =K'r (U + b) W log (P /Pa) (5.9-7)m a
which has little resemblance to the other work. However, it is probably closerto the situation of self-generated wear particles than Equation (5.9-3), if welimit the particles to those softer than the harder metal of the pair. This sit.-uation was considered quite unsatisfactory by Finkin (1968B), and the writer agrees.
More research is needed.
5.9.2 Automotive Abrasion (Model VIIB)
Turning from the laboratory use of simulative machines and pure com-ponents, at the other extreme are the field te;3ts of Duckworth and Forrester(1957). They dealt with this complicated situation by dimensional analysis.The teal heart of the problem was that iron particles from the oil embedded intothe soft metal of the bearings so that the principal wear observed was on thehard steel crankshaft. Thus, their model is primarily concerned with the abilityof the bearings to "swallow" the abrasive particle to where it ceased to beharmful.
With a large block of data, covering 10 bearing materials in a numberof vehicles, they arrived at the conclusion that their results were best corre-lated by plotting
PV(V/d) - versus m im (5.9-8)
RV/rmC p G

- 153 -
where (V/d) = wear rate relative to white metalR
T = melting point of lowest constituent,m
C specific heat (cal/mole 'C)
21P hardness (kg/mm
V molar volume of principal constituent (cm3)
G free energy of oxidation of principal constituent (cal/mole)
where all properties are based on bearing metal.
Their plot is shown in Figure 5.9-5. They claim a correlation co-efficient of 0.91 and explanation of 84% of the variance. While one may criti-cize some of their parameters, the results are impressive.
Unfortunately, there is no way to relate this to other situations, asspeed and load were subject to continuous variation. This model might be con-sidered for further development, as it appears to be the only one offering helpon the embedding mechanism of abrasion control. However, a great deal remainsto be clarified on it.
5.9.3 Three-Body Abrasion (Model VIIC)
The situation with a freely moving abrasive particle is shown on theleft in Figure 5.9-1, from Rabinowicz (1965B). While this is labeled "Non-Abrasive" in contrast to a similar particle on the right which has become em-bedded in the surface, it is not fully established that 3-body (left) is notresponsible for at least part of the wear. Finkin (1968B) estimates that 90%° ofthe wear in a "3-body" system is actually 2-body. He goes on to assume that:"The relative wear rates of materials experienced in the two situations areidentical, however, so one may use a test method employing either principle".Most of the work seems to be done with dry abrasive powders, and even those testsare less common than those with fixed (two-body) abrasive. Rarest of all arethe tests of moat interest in this report, in which a low concentration of theabrasive is suspended in a viscous lubricant. (High concentration slurries ofabrasives, such as lapping compounds, are not relevant). The model must contain,as Babichev (1962) has shown for unlubricated wear, the relation of wear to supplyrate of abrasive particles. This consists of an extremely steep initial slopefollowed by a zero-slope plateau. Lomakin (1956) showed that for pumping a drill-ing mud containing various concentrations of sharp quartz particles, the 0.15% byweight naturally prejent gave a wear rate of 5.3 mg/hr. At 1% by weight, wearwas 5.9 mg/hr and linear to 20% by weight. If we assume, as he did, that at 0%wear would have been 0 mg/hr, than the "curve" is two straight lines with a ratioin slopes of 133/1, a remarkably abrupt transition.
This phenomenon seems to be substantiated by Rabinowicz (1965A), andby Finkin's observation that doing a moderate job of filtration on industrialequipment frequently does no good at all.

-154-
Figure 5.9-AUTOMOTIVE BEARING WEAR CORRELATION
0.3 (3
_EO0.20003
S0.1
0100 200 300 400 500 600 700 800 900 1000
P V m/G

- 155 -
In this case, the minimum concentration is present even when the (typically) in-adequate filter is operative, so that clogging it so that the bypass opens really
does little additional harm.
Another interesting point about Lomakin's data (1956) is that he observeda time-dependence of wear rate. Like most experimentalists, he was so infatuated
with Equation (5.1-4) that he discarded all such data as being some sort of break-
in process. Of course, break-in has not been at all characteristic of abrasive
wear studies. His unscreened data may be expressed by
(V/d) = Kp d0
.3 3
W (5.9-9)
Another member of the Krushchov group published (Maev 1965) an extensivestudy on abrasion by ingested dust in a simulated Diesel engine cylinder. Sizedparticles of quartz and corundum were used, with three natural dusts for compari-son. The results were fitted to a model which was primarily oriented to air-
cleaner efficiency, and so not well suited for the present purpose. Briefly,
these observations were made:
5.9.3.1 Any injection of abrasive into the system began to lose its effect one
to five hours later, presumably due to size reduction. Up to then wear
was linear with time.
5.9.3.2 Particles of I Pm diameter had only a minor effect over the concentra-
tion range studied, 0.0% to 0.40%. The latter showed about double therate of clean oil. The clean oil wear rate was established after 40-50
hours run-in.
5.9.3.3 The wear rate shows a peculiar variation with particle diameter, with a
rapid rise from I to 3 11m and a decreasing rate of rise above 3 pm.(Figure 5.9-6) While it does not level off at the maximum tested size
of 10 1m, it might do so at a larger diameter.
5.9.3.4 The wear rate is characterized by Maev as a linear function of the con-
centration, for any particle size, from 0.01to 0.40%. However, the lines
do not pass through the zero concentration point (except for I pm, whichis too low to be very precise), and the lines for 7 and l0 lm show dis-tinct curvature.
5.9.3.5 If logically justified, the data could be forced to fit a model
(V/d) = kDC a0 5
(5.9-10)
where D is the particle diameter and C a the concentration. This would
assume Macv's precision to be considerably less than he states it to be,
and involves best-fit straight lines in Figure 5.9-6 in place of his curves,as well as curving his straight lines in 5.9.3.4. These are consider-
able liberties to take with an experimenter's data, :nd will be kept in
abeyance unless further justification develops.

- 156 -
Figure 5.9-6
WEAR RATE AS A FUNCTION OF PARTICLESIZE AND CONCENTRATION
140 1 1 1 1
.4 0 wt 1,1
120 J
0 0 .25 wt
100-
80- 0
4:
400
60 - 0.05 wt%
40 - a
20-0 ° "
0
0 1 2 3 4 5 6 7 8 9 10
PARTICLE DIAMETER (I n)

- L57 -
Despite the millions of dollars spent on particulate contaminationcontrol in the aerospace industry, very few reports have appeared that givequantitative justification for the "super-cleaning" program. In almost everycase where studies have been reported, the benefits cited were freedom fromplugging jets, Jamming servo valves, etc. In a recent symposium (ASTM 1971A)the same pattern was continued, but Fitch (pp 39-49) gave some data on pumpfailure which may be attributed largely to abrasive wear. The results werequite surprising in that they indicated thresholds for both particle diameterand concentration below which no damage took place within 30 minutes. In alater paper (Fitch 1971B) he gives further details on a simpler test procedureto obtain the diameter threshold and express it as a sensitivity index. How-ever, he is careful to avoid saying that all the loss in volumetric efficiencyis due to wear, so that his model is not quite what we need.
Tao (1970) also added small doses of dusts of controlled diameters toa vane pump test loop, and observed a threshold effect. he did not run enoughpoints to locate it exactly, and his use of a vane pump created an ambiguitywhich he did not recognize at that time. This type of pump has two modes offailure, both of which were apparently taking place during Tao's experiments. Thefirst is wear, primarily on the ring and vanes, due to the discharge pressure forc-ing the vanes into intimate contact with the ring. Ordinarily, this continues(after break-in) on a linear basis with time until the vanes are so short that theydrop out of the slots. There is little or no loss of volumetric efflciency duringthis process.
The second mode of failure is by jamming the vanes in the slots, so thatthe pressure behind the vanes is not transmitted to the vane/ring sealing contact.If this mode is 100% of the failure, essentially no wear takes place. Tao's dataindicate that he was operating in a mixture of these two modes most of the time.
A mathematical model arises when we try to predict whether the parti-cle will become fixed. Tao showed that both wear and loss of volumetric efficiencycould be brought back to essentially those of the liquid without abrasive, by add-ing a surfactant with a strong affinity for the particles (oleic acid for Fe orFe203, or C amine for SiO.
2 3' 182It appears to be writer that these effects could all be predicted by the
work of Hamaker (who was not concerned with wear or lubrication). He publishedtwo papers (1937, 1938) on the mutual attraction of spherical particles, both dryand immersed in a liquid, due to London forces. In addition, his formulation ex-tended to the case of a particle being attracted to an "infinite" solid body. Forthese cases, he defines A as an attractive energy constant for a given set ofmaterials, D1 and D as the diameters of the particles, d their separation (surfaceto surface), and F 2 the force between them. If D1 - co(i.e., a solid body),
F = AD2/12d2 (5.9-10)
y 2
Hamaker calculated that A must lie between 19.7 x 10¹⁴ and 3 x 10
12
ergs as extremes with most substances around 7 x 10 ergs. Immersion in a liquidreduces A, but not very much.
I~ ~ --

158 -'
i
In his second paper, he specifically calculated that a dry sphere of 30 Jm dia-meter will adhere to a surface against the force of gravity, and under water 12Jim was small enough to "adhere completely". It would appear that we have thebasis for some selectivity that would lead to the observation of Rabinowicz (1965B)that only l(/ adhere (cf Finkin (1968B), above) in that particles are rarely allthe same size. In addition, Hamaker shows that shape variations would cause fur- i
ther selectivity.
Gregory (1969) has reviewed the various methods of calculating A, andconcluded that, even though they do not produce entirely consistent results, theaccuracy is adequate for most purposes. Spielman (1970) illustrates the use ofsuch numbers in predicting the capture of particles from flowing liquids. On the Aother hand, Donald (1971) warns that electrostatic forces may easily outweigh the
London forces. His data were taken in air, but obviously havea direct analogy toliquid systems where both the forces of attraction and washing away are greater.
Void (1961) made another step forward by calculating the effects of sur-factant layers around the particles. The result was a very great weakening of F ,due mainly to the increase in d. Thus, the effect of acid and amine is explained.
This is a long way from making up a model wear equation, but combiningthe ideas that wear due to fine, soft particles follows Equation (4.8-7), and thatthree-body wear is really two-body wear times an "efficiency factor" based on theHamaker-Vold theory, should be a good start in that direction.
Another matter that needs to be taken care of by such a model is the
peculiar effect of humidity on abrasion resistance. Rabinowicz (1967) noted thatwater vapor incre.ses the wear rate by about 15% in summer over that in winter, onunlubricated tests. Be attributes this to a film condensed on the abrasive, com-parable to that postulated by Vaessen for the "zero-wear" model (1971).
5.10 Fretting Corrosion (Model VIII)
Fretting corrosion is usually considered as a separate subject fromcorrosive wear, but the model is so related to III as to warrant brief mention,It also is instructive, being one of the most sophisticated so far developed.Uhlig, Feng, Tierney and McClellan (1953) started with a logarithmic law ofoxidation (which was used by Tenwick (1971) but immediately simplified to linearform). Their equation, in consistent symbols, etc., is:
(V/d) = (k WO0.5 /fjQ ) - [2k W/fjp (7P )0.5j + (k 2W/p) (5.10-1)0 m 0 m a n
where k and k2 are empirical constants
j = slip (amplitude),
f = frequency
P = metal density
m 4 tsfizMc tP~

- 159 -
The first two terms represent corrosion and the third concerns "mechanical" wear.The authors show appropriate data to establish the dependence of wear or load and
frequency. The effect of humidity is also demonstrated, but is not large enough
to warrant inclusion in Equation (5.10-I), while the effect of temperature is not
regular enough to include. Both of these factors are included in k , which must
be determined experimentally for any given metals under appropriate environmentalconditions.
This model is remarkably sophisticated, especially considering that itis older than any of the work cited above. The authors appear to have anticipated
most of the problems encountered by other modelers, and taken care of them for.I
their special case. Especially interesting is their handling of the exponent of JW in the first and third terms, so that it varies from 0.5 for pure corrosive wearto 1.0 for noncorrosive wear. (The middle term in the equation represents a more
refined treatment of converting the logarithmic oxidation equation to linear form
than was used by Tenwick (1971), and is negligible at loads high in comparison
with P).m
This model has held up so well that a recent review (Hurricks 1970) was
not able to recommend any change in the mathematics (see also Feng 1953, 1954B, 1956A).
5.11 Auxiliary Models on Surface Free Energy
In order to analyze the models more completely, it will be helpful to
establish a few methods for obtaining the surface constants needed for variousmaterials. Several approximations have already been cited (5.4.2, 5.8.1), but
several others need to be covered at this point.
5.11.1 Surface Free Energy of Liquids
Very early in this study it appeared that the surface free energies of a
number of materials would be required. The work on liquids was carried forward as
far as seemed necessary, and was released for publication (Beerbower 1971B). The
complete reprint appears as Appendix III.
Briefly, it proved possible to calculate the surface free energy of most
liquids from the energy of vaporization. Some exceptional cases (acids, alcohols,metal halides and certain "irregular" metals) required special handling, but most
organic and metallic liquids follow the equation
= 0.0715 V 1 2 + 0.632 (6p2 + 2 (5.11-1)Y2
=001Vm H6 S~ll
where V molar volume9
6 2 London cohesive energy density2
6 =Keesom cohesive energy density
62 Hf-bond cohesive energy densityH
For regular metals, 6p and 6H are zero.

-160-
5.11.2 Surface Free Energy of Solids
The surface energies of solids are much more complicated than those ofliquids. The whole situation in reviewed in Appendix IV, which is an editedversion of the Appendix to Progress Report No. 1 on this project.
In brief, the surface stress (see 5.5.4) cannot be calculated. In mostcrystals, it is quite feasible to calculate a surface free energy at the meltingpoint by
1.m - 14 A2 m (5,11-2)
and then to reduce it to working temperature by
1.2Y =Y (1- R)
(5.1-3)
where y is t"e surface free energy at 00 K, and TR the ratio of actual to criticaltemperaiure, from which
1.2
Y1 = 1.14 Y2m[1 - TR)/(l T )J (5.11-4)
where TRm is the reduced temperature at the melting point.
Alternatively,
Yl = 0.0715 v1 /3 (AHs - RT) (5.11-5)
will give about the same result. The problem is that all three kinds of faces haveslightly different Y1 values, and the equations yield only one YS value. Which facedoes it represent - or does it represent an average? In any case, what is the rele-vance to a typical multicrystalline solid?
A little thought will show that y from liquid or vapor data must representthe smoothest surface, typically the 100 face. This is simply because both are assmooth as it is possible for matter to be. In terms of Fermi surfaces, all inter-faces are quite lumpy, and to a nuclear physiciit they consist of an array of tinysharp points.
The multicrystal requires a different approach, based on the Gibbs prin-ciple. No doubt most solids violate the principle by exhibiting greater than theminimum free energy, but this is only because they are not in equilibrium. Justas the high surface free energy component in an alloy will be swallowed beneaththe surface on annealing as in Equation (4.4-15), so will he more active faces beswallowed. Thus, Equations (5.11-3, 4 and 5) give the surface free energy of theannealed multicrystaline solid. To this must be added corrections for any incom-plete crystal reorientation, stress, dislocations and high-energy impurities, whenand if such corrections are known.

- 161 -
5.11.3 Surface Free Energy of Mixtures
This has already been partly covered in 5.5.4. However, Clever and hisstudents, Myers (1969) and Schmidt (1967) have gone a step beyond iildebrand. Anarticle putting their work in more available form is awaiting publication. Theproblem is further discussed in Appendix VI.
5.11.4 Interfacial Free Energy
As indicated in 5.4.1 and 5.6.2, there is really no good model for in-terfacial free energy of organic/metal or me.tal/metal interfaces. Good (1970),who had done the most comprehensive job on interfacial energies, shies away fromthe metals. The Russians are doing an excellent job of data-gathering, and alsohave a good record on modeling, so can be expected to solve this problem even-tually. Their best effort so far has been by Zadumkin and Karashaev, who set upan electrostatic equation
A 12 B(- I)/( E + 1) (5.11-6)
where B is a constant for any metal, which is proportional to its contact poten-tial against a hydrocarbon. The supporting evidence on mercury Zadumkin (1965)and gallium (Karashaev 1968) is favorable. The writer has shown (1971A) that Bmust vary with temperature, and also used Equation (5.11-6) to explain the multi-laycrs of stearic acid in Anomaly 4.11,4 (see 7.11.4). However, he has some reser-vations about using only the dielectric coostant (E) to characterize a lubricant's
boundary action.
The most exciting development in the U.S. is the new approach taken byHansen (1970A), who simply plotted contours of constant wetting angle on his 66 6 coordinates. At the center of interaction lies the point for the three
P Henergies of the solid surface. From these it should be possible to calculate A12for any liquid of known %arameters 1,v
A12 = 0.286 V1V2 (Dl %D 4 a lp2 + b 12) (5.11-7)12 1/ 173 2
(VI / + V2 )
but the proof of this equation is nonp too firm (see below).
As a tool for classifying lubricants, Tiansen plots have beeo made directlyfrom the coefficients of friction, with coi.niderable success. Data by Senior itd
West (1971) on polyethylene at various levels of surface EulfonatiMn were plotted(feer over 1971M, in Figures 5.11-I, 2 and 3. Only the 6l.-H quadrant is shown, as
most of the situation in the other two qiadrants may be inferred from the distribl-Lion of points lHete. 'Iwo facts should be kepL in mind -
(a) A)l lhi ] nt(ractiig liquids Ilo,. F) :rst fil] within the c~rClo
in cI tLhreev quadron, ;, but we,.kly interacttng ones need only fail
out i z, in ont. to I,. ,r,'perly ccrtc-.tvd.

-162-
HANSN PLT OFFigure 5.11--lHANEN LOTOFFRICTION ON POLYETHYLENE
8H (UNTREATED)16
14 .58
.66
12
C.j 10 .54
1- 8 -. 54
.52o 6
A Center of InteractionM vethylene Iodide
00* FOUr Points at Origin4 c'j.2 (Coefficients of Friction
634('I- 3.63 -. 22, .20, .18, 21)
' -3.53
2 16 .30. .25
0 2 4 6 8 10 12 5 14
PO LAR PARAM ET ER (cal/cm 3 0.5

- 1 -2
Figure 5.11-2
HANSEN PLOT OF FRICTION ON POLYETHYLENETREATED WITH H2 S2 0 7 for
TWO MINUTES16 " ' I I ' i ' I ' I
.4714
.42
12
9,
E 10.27 .52U
w- 8 .30
, 8
2 6 Center of Interaction
0 I* Methylene IodideFour Points at Origin
4 (Coefficients of Friction4 -1.21 ' = .21, .19, .16, .19)"
A ,"!- .62C a '30
2 9.? 1 2 .23.20
0 2 4 6 8 10 12 L 14
POLAR PARAMETER (cal/cm 3)0.5

-164
Figure 5.11-3
HANSEN PLOT OF FRICTION ON POLYETHYLENETREATED WITH H S 07 for
81, FIVE MINUTES16
.4014
.32
12
Ct)
E_10
10.21 38
LU.2
Ll 8.2
w18 A Center of Interaction
6 Methylene Iodide0 (Coefficients of Friction
=20, .19, .16, .19)40 p
ID c: .56N .18
1.17 171210 68 10 12 ap14
POLAR PARAMETER (cal/cm305
165 -
(b) Methylene iodide, unless repurified just before the test, usuallyshows up as noncorrelated because of spontaneous decomposition.
It will be noted that, except as cited in (b), all points are correlatedsatisfactorily. In addition, it is clear that sulfonation of polyethylene notonly caises the H bond parameter (as would be expected) but also increases thetolerance on 6 D eand 6 and Sp (indicated by increased radius of the circle) anddecreases the value o F at the center. Thus, it appears that A12 was indeed
increased. The authors, in their closure, noted that the center for cos 0 = 0does not coincide with that for F = 0.25. The writer feels this difference isto be expected, due to the distorted surface exposed in the friction tests.
Comparable data on metals is extremely hard to obtain, due to the extra-ordinary reactivity of freshly cut surfaces. Indeed, one may seriously questionwhether wetting is a factor in lubricating such surfaces except as a prelude toreaction. One source of data on fresh metal surfaces is metal cutting experiments.One of the most comprehensive was that of Ernst and Merchant (1941), whose dataon turning aluminum with a battery of pure liquids have remained unexpla;.ned forabout 30 years. A complete 3-quadrant plot of the data is shown in Figure 5.11-4,which shows that only CCId, CH3 OH, C6H NH and HCOOC H do not conform. The firstis notorious for decomposing under suc ctditions, so the success score is 37/40or 92.5%. Turpentine, olive oil, glycerol and water were also successfully pre-dicted but are not counted as the parameters are not very precisely known. Thevariable used for the contours is the cutting ratio (R ), which is related to Fby
F = cot (2 sin'R - T) (5.11-7)
where is the rake angle of the cutting tool.
The other way of plotting such data is shown in Figure 5.11-5. In thismethod, a computer is used to evaluate the two constants shown as 0.25 in Equation(5.5-20). The resulting "heat of mixing" (or wetting) is then plotted against themeasured variable; this was elastomer swelling in the original article (Beerbower1969) but here is a function of R devised to linearize the data. The fit is againquite good - but CH NH and HCOO8H , which fitted poorly on Figure 5.11-4, are seento be fairly well correiated, whil H C1, CC14 and CH OH proved intractable.CH COOC H and CH CHO were further out ihan expected, but even with the,, in, thecorrelaon coefficient was 0.85.
There is some reason to believe that what is being correlated in Figures5.11-4 - 5 is not A at all, but an energy of chemical reaction. The key com-pounds are all alcohols, which are known to react with aluminum
2 Al + 6 OH - P 2 Al(OR) 3 + 3H2 t (5.11-8)
S. ~e-~

- 166 -
0n0 )i -0 0
Ix 0000 OaLi
C5j 0COO ZI
0 E - I.-I('JN I.- 1
I <i
2 LQ
-J
0 0~
0- ULL
0 0C
(I)r
Li - L
o LS -. L
Li N

167 -
Figure 5.11-5
CORRELATION OF CUTTING RATIO WITH INTERACTION PARAMETERS
CUTTING COMMERCIAL "PURE" Al,DEPTH OF CUT = 0.005"CUTTING SPEED = 5.5"/mmn.
I I I I I
0 POINTS NOT REGRESSED
10A KNOWN CHEMICAL INTERACTION
0. * METHANOL PETROLEUMLL ETHER
<(N-- -1 1Of. CARBON
A TETRACHLORIDE
z -i
o/ ,'. 5 , ,
04 5+ CHLOROBENZENE
LUU
CUTTING RATIO FUNCTION, 1/(cr - 0. 13)
.I-ii- - 1- I .. .iP-'=. . .., *1 - .. ..* ETHYL ACETATE,, , .. ...... ., .. ..,,

- 168 -
The question is, in the few microseconds available at the edge of thecutting tool, can Reaction (5.11-8) prevail over Equation (5.11-7)? A good dealdepends on the answer - or on similar data from a better planned experiment withliquids of modern purity. If Equation (5.11-7) dominates, then it is possibleto H-bond to metals and the entire structure built by Fowkes (1967) on the oppo-site assumption is invalidated. The only other study of metal-wetting of com-parable scope is Harkins (1920) on mercury, often analyzed but seldom repeated.The data are about 50 years old, and questions of purity inevitably arise - thoughHarkins took much more pains on this detail than Ernst and Merchant. Analysisof their data shows about the same level of 61 (Appendix V), and so does an un-published study by Panzer on aluminum powder.
5.11.5 Interfacial Entropy
To fit Model II, the total energy of adhesion, often called the heatof adsorption, is required. This is
E = W12 + TAS1 2 (5.11-9) 1While some approaches to the entropy of wetting (TAS12 ) are discussed in Appen-dix VII, this must be classed as a problem for which no validated solution isavailable.
5.12 Predicting the Coefficient of Friction (F)
As indicated in Sect'on 5.3 it is essential to free the designer fromthe need for an F value for each combination of two metals, one lubricant and oneatmosphere that he might encounter. Adding temperature (T) as a parameter, anda modest collection of five metals (taken two at a time) and five each of theother factors, requires tabulation of 55 or 3125 values of F for this very lowlevel of flexibility.
There has always been an intuitive connection between wear rate and F,but those who have sought to express it have been discouraged (by themselves ortheir co-workers) because of the glaring exceptions to any rule. A recent articleon brake design (Eudier 1969) cites "Friction Without Wear" as a realistic goal.Thus, any rule for (V/d) versus (F) must be limited to carefully defined regimeson Figure 2-1. j
Abrasive wear has been modeled already by Goddard (1962) as
(V/d) - K"W (F - F ) (5.12-1)o
where F is the coefficient of friction without abrasive. This equation has notbeen ve'ry widely accepted or validated, and certainly must not be used for non-
abrasive wear.
Model IB contains within it the assumption of a relation of these vari-
ables
(V/d) ( _1 -y v)k1 6 + F 2 4 ' 5 0 (5,12-2)
-(5,12-2)

- 169 "
which, for Poisson's ratio (V) - 0.33, approaches the usual fatigue mode ninthpower function. This is also applied, with less justification, to high transfer,or "adhesive wear", mode.
To produce an empirical model, the pure hydrocarbon data were taken fromAppeldoorn (1967A) and regressed on a log (V/d) = m log F + b basis. Of the origi-nal 72 points, 21 were discarded because of excessive scatter. Most of those dis-carded were either at the lowest load where readings were uncertain, or at thehighest where incipient scuffing was suspected. The result was m = 7.45, with acorrelation coefficient of 0.823.
To improve this coefficient, it was decided to follow the precedent ofothers (Rabinowicz 1965B)and regress the specific wear rate K (; P V/Wd). It wasalso postulated that use of the von Mises function for plastic deformation, usedin Equations (5.3-13) and (5.4-4), would be more useful. As mentioned in Section5.4, several values have been suggested for "n" in (1 + nF2 ), such as 3 (Rowe 1967),4 (Bayer 1962) or 12 (Spurr 1964), so a multiple regression was run with "n" leftfree. The result was
K = (P mV/Wd) = 4.96 x 10- 14 (1 + 10.42F 2 ) 4.84 (5.12-3)
with a correlation coefficient of 0.87.
Some data is available in Cornelius and Roberts (1961) which may be use-ful, even though lubricated onl-y by gas (and sor.e inherent lubricating propertiesof the alloys used). Unfortunately, their data was available only as a semi-logplot, one decade per inch, so that values scaled from it were not precise enoughto regress. Replotting their curves on log-log paper (from their Figure 16) gave
exponents that -'ere, in some case, quite close to that in Equation (5.12-3). Theywere an odd assortment of metals and conditions:
Line 2 = 5(r/. Co, 33% Cr, 13% W, 2.5% C shaft in nitrided steel sleeve, CO 2,.
Line 6b = 53% Co, 31% Cr, 14% W, 1.0% C shaft in 50% Co, 33% Cr, 13% W, 2.5% Csleeve, CO2 , at 200
0 C or above,
Line 6c = 50% Co, 33% Cr, 13% W, 2.5 C shaft in same alloy sleeve, CO2 , at 375 0 Cor above,
Line 8 = Nitrided steel shaft in nitrided steel sleeve, He atmosphere.
Several other combinations, not systematically different, gave exponents
of 1.93, or F3 .8 5 . (Lines I and 4.)
Cornelius (1961) also quoted some data from Rabinowicz (1958), which had
been published without much explanation. The writer took the opportunity to ask
Rabinowicz about this at the May, 1971 ASLE Meeting, and learned that the two upper
lines on his chart (Figure 5.12-1) represent a different mode from the lower ones.

- 170-
Figure 5.12-1
CORRELATION OF COEFFICIENT OF FRICTION WITHWEAR AND VELOCITY
0.6
z Of,,0.5 ;.
0 >LL
l--
W 0.3
U-u .. K = 1 0 - 4
Iw 0.2 -
0.1 -
K 10l -6 :-
0.01 0.1 1.0 10 100 1000
VELOCITY, ft/min
NOTE: According to Prof. Rabinowicz (personal interview, May, 1971)the two upper lines represent a different wear mode from the two lowerlines. This information was omitted from the publication (1958) throughan editorial error.

- 171 -
This was very gratifying, as the lower ones apparently conform well with Equation(5.12-3), while the others conform well with Cornelius' lines 1 and 4. Apparent-ly the latter mode may relate to incipient scuffing.
It is now possible to return to Model II, and eliminate F as an inputparameter. If we assume that
1 = (1 10.24F 2 )0 5 (5.12-4)
in place of Rowe's very similar Equation (5.4-4), solving (5.12-3) for this quan-tity results in
y (Pm V/5 x 10" 14Wd) 0 .10 3 (5.12-5)
Substituting this into Equation (5.4-18), which is Rowe's Model hIAwith the newer de Boer concept included, we obtain as a working equation
(V/d)0 "897 = 2.19 x 10⁴k'(W/P) 0"897 (Vm) 0333(Ts/U)exp(-E/RTs) (5.12-6)
As mentioned in 5.4, this requires an iterative solution. The reasonlies in the surface temperature (T ) which must be obtained from Equation (5.4-6)by substituting a value of F computed from Equation (5.12-3). While no exactsolution is possible, programming such problems on a modern computer is elemen-tary. Even the substitution of a sophisticated equation for T , such as thatderived by Francis (1971) would not cause any serious difficulty. The end resultscould well be given to the designers in the form of charts, such as Figures 5.1-1through 5.1-4, or Figure 5.7-3 and 5.7-6.

- 172 -
6. COMPARISON AND COMBINATION OFTHE MODELS WITH EACH OTHER
In Section 5, each model was considered more or less in its own areaof proved performance. The results were not entirely re-assuring, as even thelimited testing possible revealed failures to provide correct "predictions" ofexisting data. It appeared that it would be informative to investigate howthe models compared with one another. From this study arose the possibilityof combining them to represent mixed modes of wear.
6.1, Reduction to Standard Format
The models as set forth above are a rather heterogeneous collectionof equations, which do not lend themselves to easy comparison. It would bevery advantageous to put them all into a conmon form, related to Equation(5.1-4):
(V/d) = K dmnWUp (6.1-1)
This format also lends itself to analysis of data which does not fit exactlywith any of the models. As seen in Section 5, this is all too common.
StarLing wilh Model IA, by definition (V/d) - 0, and U is of no sig-nificance so that p = 0. Either m or n, or both, may be _
Model IB is already nearly in proper form. For fatigue,
(V/d) = K' dm' (W y)n U0 (6.1-2)
For ball wear, m' = -0.528 and n' = 2.12. If we accept EquaLion (5.12-4) asthe definition of y, rather than (5.3-15) or (5.4-4), then
y 2 .12 - (2 x 10 PII V/Wd) 2.12/9.68 = (2 x 10¹³P V/Wd)0.236 (6.1-3)
and
(V/d) = Kf dmwU) (6.1-4)
K l13p 0.23611/0.764where Kf = j( 2 x 10³p) j , . = (m'- 0.236)/0.764 = -1.000 and n
(n'- 0.24)/0.764 = 2.64. For platen wear, m' = -0.60 and n' = 1.65. Hence,ut = (m'- 0.171)/0.829 = -0.921 and n = (n'- 0.171)/0.829 : 1.79.
In the high transfer mode, for all wear m' = 0 and n' = 2.12, and forplaten wear m' = 0 and n' = 1.65. Hence, for ball weat m = (0 - 0.236)/0.746 =-0.31 and n = 2.64. For platc-n wear m = (0 - 0.171 ) In,9:))= -0.20b and n = 2.79.

- 173 -
Models IIA and liA require quite a different approach, as the ex-ponential term must be converted to a power function. Expanding it into aseries as Uhlig (1953) did for the logarithmic oxidation law yields a cumber-some polynomial as exp(-x) is slower to converge than if (x).
It was simpler to compute the values of the real variable Wexp(-E/RTand correlate them with Wt. The results are shown in Figure 6.1-1. While the5
curve is continuous, it can easily be split into two nearly straight portionswith the "knee" always at 331 gm load for the standard velocity. The loadswere from 30 to 2000 gm, the latter being near the scuff load on the ball-on-cylinder machine, and the E steps from 3 to 15 kcal/mol. The constants for the52100 steel used were F = 0.21, Pm = 7.46 x l07 gm/cm 2 , and thermal conductiv-ity = 0.144 cal/ 0 C sec cm, with a velocity of 55.8 cm/sec. Equation (5.4-6)was used for T..
The same technique was followed for the evaluation of p. The velocitysteps covered were from 4 to 1920 cm/sec, the loads were 120 and 1000 gm, and
the values 3 to 15 kcal/mol. The slopes were equal to E/1400 above the knees.The latter were located at 24 cm/sec for 120 gm and 46 cm/sec for 1000 gmloads, and are the criteria for the "high U" and "low U" columns in Table6.1-1. This table presents m, n and p values for all the equations. Theloads were put on a "% Scuff Load" basis by dividing by 2000, though that is avery crude approximation. The n and p ranges shown for corrosive wear cor-
respond to minimum and maximum Q values; for adhesive wear, Rowe's value of11.7 kcal/mol was used.
Model IliA requires further attention due to the presence of hC inEquation (5.5-1). This is the critical thickness of the cap of corrosion prod-ucts on an asperity before it breaks off. As Tenwick (1971) pointed out, manyfactors nmay affect hc , but for the present purposes all of these are to be heldconstant except load and T.. The potential wear particle may be treated as arigid body, since it is probabl', mostly Fe3 04 , held to the metal by a bond whichis weak due to the volume disparity 0 and the fact that only the London forcesact across the interface. Hence, it will tend to pull off in bending moment -that is, by rotation about the trailing edge as a hinge - when the torque ex-erted by friction equals that of the bond tensile strength times its lever arm:
FWhc = r3N (6.1-5)
where T y is the tensile strength per unit area, which should depend only on thematerials involved (and very slightly on T.). This concept is illustrated inFigure 6.1-2, and the symbols are defined there. At this point, we have sub-stituted two unknown quantities, r and N, for hc, which appears to be a netloss. However, any one of them can be eliminated by the equation used byArchard in developing Equation (5.1-4). It is
7rrN = W/P (6.1-6)

- 174 -
Figure 6.1-1
TRANSFORMATION OF EXPONENTIALINTO A POWER FUNCTION
Q =3000 cal/mol '/0
100
103 Ix 0
c 1l
I0 000
0.10 40/
00
10 -21
U =44 cm/sec
1 10 100 i 000
LOAD (gin) OR VELOCITY (cin/sec)

- 175 -
Figure 6.1-2
TORQUE BALANCE FOR REMOVAL OFAN OXIDE CAP (CORROSIVE WEAR)
Vertical Scale Exaggeratedabout 2X:
hc = Critical height fo, Fe3 0 4 cap
r = Radius of capF Coefficient of friction
W = Load r = Tensile yield stress of boundaryFor an average asperity
h FW - frr 3 T NC yN = Number of asperities involved

- 176 -
The question is, which of the three is least apt to vary with load? All theevidence favors r, since wear particles tend to be fairly uniform in diameter.Hence, we can eliminate N, which certainly varies with W, leaving
h T rIP F (6.1-7)
Simplifying quation (5.12-2),
F a (V/d)1 / 9 (6.1-8)
so that
lh (V/d)-0.111 (6.1-9)
and
1..11
(V/d) - KWA exp(-Q/RT s)/0 2UP M (6.1-10)
Exponents calculated in this way are shown in Table 6.1-1 as "Equa-tion (5.5-1)".
Since Equation (5.5-7) expresses load only in terms of , empiricalexponents were used in Table 6.1-I for this one case.
The abrasive wear equations present no problems, being already instandard format.
6.2 Checkin jModels Aainst Each Other
Table 6.1-I provides an opportunity to review the general nature ofwhat has been accomplished so far. It is clear that fatigue mode stands outquite clearly with high negative "m" exponents. Rather surprisingly, if theempirical Equation (5.5-3) is accepted as fitting Quinn's data (Figure 5.5-3)the possibility arises that his tests were dominated by fatigue rather thancorrosion.
Of the three corrosive wear equations, it appears that (5.5-2) is themost rigorous, and also the most appropriate for lubricated systems where thetemperature rise is more moderate than in the dry systems for which it wasdeveloped.
The two choices for adhesive wear turn out to be less different thanappeared from their different formats, provided Equation (5.3-16) is not usedoutside Bayer's stated conditions. As will be seen, m values from the
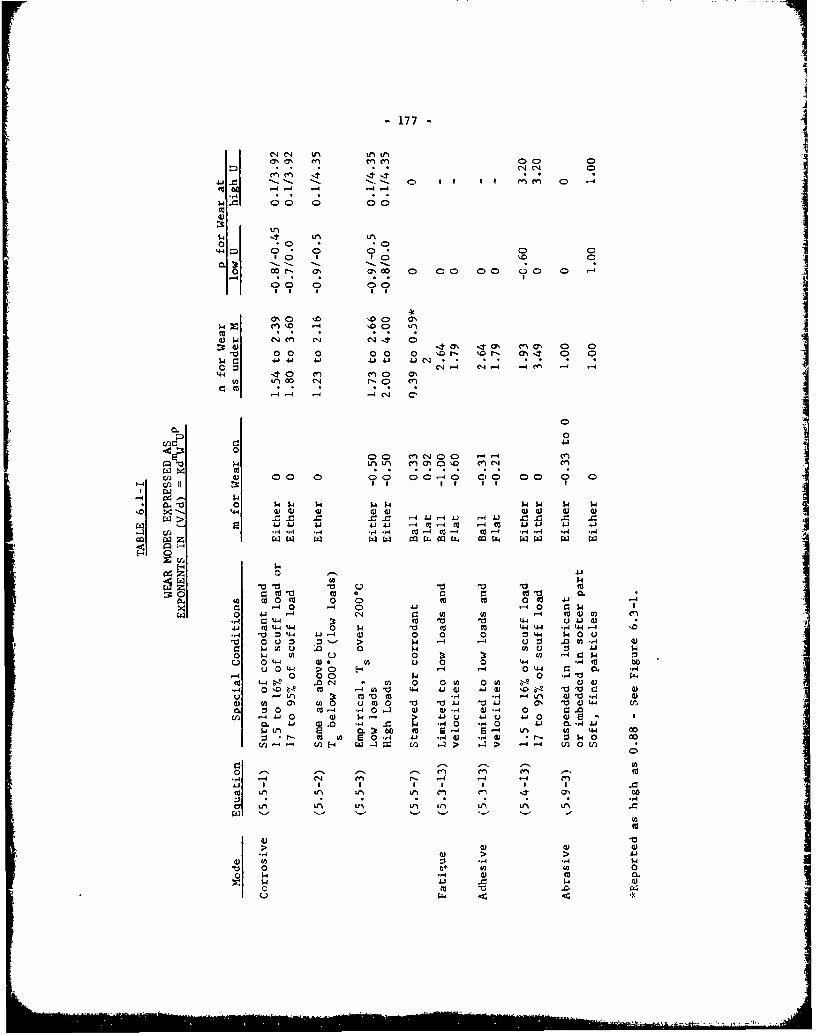
-1771- - '4 -4 4 ~ 4 4
0 0
m00 to Co 0 0%
i0 a1 00 0 0 0 0 1-0 0 0 00 N 0 0
w c -J 4 4.J ~4.J -4 414 1 -41 Ji 4 4
0') n 4 : - '
-4' -4 4- C4
0 40
Cl (40C-4 0 0 (41 4 0(41 4n
0 -0 -0 04 -0 0.
Cs 0 4 $4 1 ' 4 $4 4 $4 4 '*r4 w4- w w 0 w0 '4- w I
4 C4 (4~~'- -a -C 4 (j14 W .4j 4 -a-- a v4'- 44 4 - M- 0 0 4 0 C (4 4 1 -
-4~ .' 4 - 00 ( ,4 t - t 0 0C - 4 -4 .4 * 4400- pa w -4 - 04- ca 4. w w w
C 0 00a 0 *-to o o 4'(! 4- 0 O' 4 0 01 ( 4 0 r. $4)
0 .41 4 C3 44 0 )- L t o )'4 44 ( O ( 0 (d41 a ' . 1 0 ' 44 0 '41 )'- J
(411 *.L-40 4 "0 4)H 4- 4 0 4 .,4. --4 0 44 4 w-a 0 a- ( 0 Z44 $44 0
a. (4. --4 w0 u~ *.4 *0 W4 0 -A1-4r (A 0 ~ ~ p4 04. (1 (4 '41 4$4 Cr-(4 ) 04-- *.4 *,4 r $4 zu 0 44 (0 E-4l -4 1 44 0 -44 G. 0(0
-40 0 4 -4 -4 4 '0Pca 4 -0 - l 0 0 A 0 U * 4) 4)
0 08- d - A" - J4 44) %06 4 )v V C 4)-- 4t a C-4 -4)% 4) - 1 (
4) 04 -4 42 - U 4 - 41 -4 0
CL 0 - .0 .( , 4 04 01Q-A
0 -4 CI a 0 -"4 4 4 4) % 4 0 00

- 178 -
laboratories are not so precise as to distinguish between 0 and -0.26 + 0.05very often, an- n = 1.93 for Equation (5.4-3) neatly splits the differencebetween ball and disc wear which Rowe did not include in Model IIA. Thus,either may be used with roughly similar results, but (5.4-3) is so much lesshened in with restrictions on load, velocity and humidity that it seems moreattractive. The principal difference between the Russian Equation (5.9-3) andEquation (5.9-7) is that th~e latter recognizes a velocity effect not presentwith coarse abrasives.
These exponents should not only be useful in data analysis, but alsocan serve in the wear laboratory as a quick check by the experimenter as tohow his test is progressing. Merely plotting three log-log charts would tellhim at a glance which mode his machine is running in - or perhaps that he isin a mixed mode as exemplified by Equation (5.10-1) for fretting corrosion.
6.3 Comparison with Literature Data
An interesting set of data by Schatzberg (1970A)was the first indica-tion that this exponent method of analysis might be useful. It was shown to becompatible with the Appeldoorn (1967A) data by the author, but had the virtueof including conditions not covered by the latter. As the writer pointed out(1971A), much of Schatzberg's data appears to be a form of surface fatigue, asits onset appears to be related to the Palmgren function W3do = constant. Ex-ponents, similar enough to be explained by the difference in geometry, ap-peared in Schatzberg's 4-ball data. However, it was the most corrosive condi-tion (wet oxygen) which gave wear rates fitted by m = 0, while the least cor-rosive (dry argon) was fitted by m = -0.67. The latter also fitted dry oxygenin 3 out of 4 cases, while wet argon was fitted in 3 out of 4 cases by m =
-0.36. Bayer had very rarely found cases between m = 0 and m - -0.5 in both dryand lubricated tests running in air at 10% relative humidity, so the wet argondata seemed to represent a third mode not previously recognized, as showo inTable 6.3-1.
In the present context, we find Archard's equation for adhesive wear,Bayer's for high-transfer, Equations (5.1-1) and (5.5-2) for dry rubbing andSchatzberg's wet oxygen data all in excellent agreement. Can all these beclassed as "corrosive wear"? It appears that this would be difficult, and thattwo different phenomena coincidentally result in m = 0. It is interesting tonote that Quinn (1968-9) also reported substantial transfer in the first fewminutes of his externally heated experiments, so that we might eventually de-cide that all of the dry-rubbing experiments proceeded by the alternative "wearfirst, oxidize later" machanism.
The rest of the situation is tven less clear, as shown in Figure6.3-1. According to Quinn's third interpretation (1971A) of his data, m = i-0.558, with deviations as low as -0.323 and as high as -0.93+. If, in fact,his specimens were experiencing Bayer's "low-transfer" wear, as implied by thefact that both average m = -0,50 + 0.05, he should have found i "zero-wear"period at the start of the run, as did Schatzberg for most of his cases. Zero-
wear is defined by Bayer as "wear less than half the peak-to-peak surface finish

- 179 -
TABLE 6.3-I
VARIATION OF WEAR RATE WITH LOADIN VARIOUS ATMOSPHERES
Ratio (A log(V/d)/A log W) = nOxidizing Argon
Lubricant Level Wet Dry Wet Dry
MIL-H-6083C 02 1.98 --(a) 1.2(b) 1.01
MIL-H-5606B 02 1.45 2.1(a) 0.8(b) 1.24
MIL-L-17672B 02 0.5(b) 2.1(a) 1.16 1.0(b)
Emulsifiable 02 1.33 1.2(b) 1.6(b) 1.20Hydraulic Fluid
Synthetic Isoparaffin Air 2.4(b) 1.58 0.12 0.15White Oil
JP-5 Air 1.4(b) 2.07 1.77 1.12
RAF-176-64 Air 1.24 2.0(a) --(b) --(b)
PW-523 Air 0.9(a) 1.06 0.60 --(b)
JP-4 Air --(a) -- (a) --(b) --(b)
(a) Not enough data for reliable value.
(b) Erratic data.
La.

-180-
Figure 6.3-).VARIATION OF WEAR RATE WITH TRAVEL IN
VARIOUJS ATMOSPHERES10-
'0
LU
< ~Quinii-Rowe-Tenwick EqUationl (5.5-1)U. 0 Archard EquationI (5.1-4)U-1O Rayer High Transfer (1968A)
Scliatzberci, Wet O>yygen (1970A)
u S chatzberg , Arclon, Water Lubricant
10 C Q~iin un 1 (1 67) (19 70A)
0 Schatzberg, Wet Argon (19 70A)4/ Bayer Run D (1962) ---- QUin Equation
0 ayer Equation (5.3-16), Low Transfer
Schatzberg, Dry Argon or OxycienAppelcdoorn (1969), Dry Argjon
0.1 11.0 10 50
RELATIVE DISTANCE SINCE START

- 181 -
of the coarser member." Quinn probably could not have detected a zero-wear
period because his measurements were only taken in steps of 106 cm travel.
The lowest value of m reported is -0,858, by Appeldoorn, Goldman andTao (1969), for dry argon. No zero-wear period was reported; it would be pre-dicted to be less than the I minute at which the first measurement was taken,for the 1000 gm load they used (at least for the dry air case discussed furtherbelow. Bayer's zero-wear predictions may not be applicable in argondespite the good finite wear results in nitrogen shown in Figure 5.3-3.)
Tao's work is quite unusual in predicting and detecting a case ofm > 0. This may well be due to the combination of oxygen starvation, in whichthe wear particles absorb all the oxygen dissolved in the oil between entryand exit, with spherical geometry. The starvation would not appear for Schatz-berg with his pure oxygen nor Bayer with his relatively light loading. Thespherical geometry causes a rapid increase in total oxygen intake with wear,as this is proportional to wear scar diameter (i.e., to V0 .25). This leads tohis relationship of scar diameter cubed to time, and thus to m = 0.33. Quinnused a wedge-shaped pin, and no lubricant, so that Equation (4.4-7) does notapply to his work. Adjusting it to his geometry would lead to m = 0 and a ver-sion of Equation (5.5-2) containing Co as a variable, which might be more gen-
erally useful than Equation (5.5-7).
Another case of m > i was reported by Appeldoorn, Goldman and Tao(1969) and Schatzberg (1970A). This was obtained with water as the lubricant andoxygen as the atmosphere. Again the spherical geometry and oxygen starvationserve to explain the result of m = 0.88 (Figure 6.3-1). Although this casemight appear to approach the ultimate in corrosiveness, it is oxygen starvedbacause gases are much less soluble in water than in oils.
Neither Quinn's later work (1971B)nor Tenwick and Earle's (1971) werereported in sufficient detail for analysis by this method.
Time dependence of wear has been reported by a number of people onthe 4-ball machine. A particularly large study by Appeldoorn, Campion and Tao(1966) resulted in many cases of m = 0, using cetane in room air (45-65% RH).All showed an appreciable period of (V/d) = 0, but this can hardly be equatedwith Bayer's zero-wear period since it tends to increase with load and is muchlonger than his equations would predict for loads of 10 to 50 kg. The onlycondition deviating from oi = 0 was 50 kg at 1200 rpm; here m = -0.32. It is notlegitimate to make a direct comparison as both oil and machine geometry were
different, and there is reason to believe that all loads above about 10 kg in-volved some degree of scuffing wear. (See 7.11.9, Delay of Transition.)
Thup, study of the values of m does not lead to an unambiguous mathe-matical criterion for distinguishing corrosive wear from the other modes. Itseems probable that a better case could be made for using Bayer's zero-wearperiod (do) if there were more data on this model under corrosive conditions.Schatzberg shows that do falls off from its usual level for dry argon or oxy-gen by a tactor ot about 3 with wet argon, and as much as ten-fold with wetoxygen. Vaessen and dcGee (1971) showed a similar effect of humidity on the

1 i
- 152 - i
I
zero-wear life of noble metal contacts. Our study of some data by Appeldoorn(1967A) on the wear of 52100 steel with 13 pure hydrocarbons in air at 35 to 65%
relative humidity shows that, while Bayer's model for 100i RH predicted zero-
wear for 28 out of 72 tests, actually none were observed (Table 5.3-VI). Thus, Ad 0has interesting possibilities.
The study of "n" gives some further insight as to the meaning of the Ivarious data. In Equation (5.5-7), n depends on the elastohydrodynamic solu-tion of the relation of h to w. Tao (1969) shows a good relationship of wearto the ERD "compliance"; ?or humid air, n = 0.39 and for dry air n = 0.59. iStudy of the data on 13 pure hydrocarbons (Appeldoorn 1967A) mentioned above.yielded n values from 0.44 to 1.18. This excludes n-nonane and n-butyl ben-zene, which both showed abnormally high wear rates and n = 2.05. The varia- Ition in n of the 11 best values showed a vague tendency to correlate with den-sity, which is known to have a large effect on oxygen solubility, but obtain-ing a reasonable correlation coefficient would have meant discarding all but 6or 7 of the original 13 values.
An analysis was also made of wear data on five commercial liquids:JP-4, JP-5, a UK jet fuel, a U.S. jet fuel, and a synthetic isoparaffinic whiteoil (Appeldoorn 1967A). None of these liquids contained any surface-active addi-tive. The n-values were quite erratic and did not correlate with the atmos-
pheres, which varied in corrosive tendency from dry argon to wet air. In sixcases, the scatter was too bad to arrive at an n value, and in four others nis of dubious value because of scanty or erratic data. These results are shownin Table 5.3-1, along with the breakdown of Schatzberg's (1970A)data for fouroils in four atmospheres. Again, some points had to be rated "dubious", fourfor scanty data and five for erratic data, leaving only 7/16. In one case,there is evidence of the "bifurcated" behavior described by Ling (1962), inwhich replicate results fall into two distinct groups of high and low wear.
This case, Emulsifiable Hydraulic Fluid in dry argon, was counted as valid inTable 6.3-1 because there was enough low-wear data to use for an n value.Again, the results show no clear-cut trend with corrosive tendency, though itis notable that in every case worth reporting, wet air or oxygen gives a
higher n value than dry argon. The dry air and wet argon data are difficultto explain.
An analysis of variance was made on the wear rates of the five com-
mercial liquids, using only the 240 and 480 gm loads as the 1000 gm load
caused scuffing in some cases. The most important of the primary variableswere humidity and oxygen content, both of which were significant at the 99%
confidence level or greater. Load was significant at the 95% level. Theinteraction of oxygen with humidity was also significant at the 99% level, nndthat of load with oxygen at the 95% level. (The significance of liquid tendedto be suppressed by the narrow range tested.)
The effects of the primary variables, plus the two interactions shown
to be significant, accounted for 64% of the variance. 'he remaining 36% canbe attributed to the sum of minor interactions, experimental errors, unsus-pected variables and perhaps to the existence of a bimodal sit,,ation.

- 183 -
The above analysis demonstrates the value of the m-n-p "finger-print"system as a diagnostic tool. It also demonstrates rather clearly that manyexponents are outside any theoretically predicted range (Table 6.3-1). It isevident that wear in the "pure" modes discussed above is the uxception, and thatfurther explanations must be sought. To do so by creating more models appearsunwise , since the five already considered work well under the extreme condi-tions for which only one mode is possible. It would be far preferable to"blend" them on a nonlinear basis. This involves setting up a compound equa-tion of the type
(V/d) = (Vf+V+V+Vf +Vfc + V + Vfac)/d + (Vd/d) (6.3-1)
where the subscripts f, a, c and d refer to fatigue, adhesion, corrosion andabrasion, respectively. This not only recognizes the prevalence of mixedmodes, but permits compensation for their interactions.
In the above equation, abrasion has a unique role. Since all of themathematical models for primary wear (Vf, Va, Vc) assume clean parts and lubri-cant, there will be no abrasion until wear particles have accumulated. Thus,Vd becomes a function of V, of uncertain form but probably a step-function. Inorder to account for the low n exponents in some of the actual tests, it appearsthat Vd must become so large as to overshadow all the other terms in thesecases.
When Vd does not dominate the equation, it is possible to make somepredictions about the interaction terms. For instance, it is known that cor-rosion greatly accelerates fatigue (for example, by hydrogen embrittlement ofiron) so that V_ will tend to be large and positive. On the other hand,Bayer has shown that adhesion and fatigue rarely, if ever, coexist - presum-ably because adhesive wear destroys the microcracks from which fatigue pro-pagates. Hence, V (the wear due to the interaction of fatigue with adhe-sion) will always e 0. Since adhesion and corrosion are dimensionallysimilar, It may be hoped that V and V. will prove to be neglig'ble.If so, only Vfe needs to be eva Gated.
Two other models which are needed to complete the picture are underdevelopment. One is a correction for the portion of W carried by the partialhydrodynamic film in the antiasperities (see 5.7). This must be further cor-rected for any build-up of surface resin, soaps and other organic solids inthe antiasperities (see 5.5.4 to 5.5.7).
It appears that adequate models are available for the primary causesof wear. Work should now be concentrated on the secondary or correction modelsof abrasion, hydrodynamic load-sharing and surface resin with considerable con-fidence that these six models will contain all the necessary building blocksfor a complete system of wear prediction and antiwear design. In fact, it isnot too soon to start systematic collection of some of the necessary values foruse by design engineers. The key values will include the fatigue parametersalready collected, but at several levels of humidity and temperature. They

- 184 -
will also include the activation energies and energies of adsorption as col-lected by the corrosion and adhesion workers. There is every reason to be-lieve that such values taken under static conditions are useless, due to lackof the dislocations, deformationc and electron emission of real bearing sur-faces. Bence, compilation of the energy tables should be based on dynamic testresults only.
6.4 Perspective on the Modes of Wear
At this point, it is possible to take a broader view of the modes andregimes of wear than was possible in Figure 2-1 or in any individual model. Suchperspective is attempted in Figure 6.4-1, in which dimensionless variables areplotted rather than the simple ones used before. The ordinate, specific wear rate,is merely the K from Equation (5.1-4). This contains the hardness, normally con-stant for .- given system, and also the load. A plot of Figure 2-1 on K-W co-ordinates would be no different from the V/d-W plot, but a chart of K vs (W - X)would consist of two horizontal lines with vertical lines at Y and Z. The major 0. 1 3difference in Figure 6.4-1 is in the use of ho . Since this is proportional to Wthe abcissa scale is inverted from that in Figure 2-1.
The specific film thickness ties Figure 6.4-1 completely to Model V,which seems clearly established as the necessary starting point for all seriousstudy. It consists of the hydrodynamic film thickness as derived by Dowson andHigginson (1966) divided by the effective roughness of the two surfaces (Tallian1954, Valori 1965). Thus, it includes load, viscosity, velocity and roughnessas parameters as shown in Equation (5.7-4) but with W2
= W.
The plot represents the situation for a given system at any given time,but cannot include time as a third dimension. Perhaps some future worker can pro-vide a series of plots at various times, as done in Figures 5.4-1 through 5.4-4,to show the important stages. At least, Models I, II, TliA and IV are clearlyshown, along with the three transition zones. It must be borne in mind thatthese are "forbidden zones" within which a machine cannot continue to operate;it must "jump" across, usually Ln the direction of higher specific wear rate.In eor-parison to the solid lines bounding the transition zones, the dasthed linesIare both arbitrary and ill-defined. In particular, the line between "zero-wear"
and "molecular wear" should not he taken too seriously.
Figure 6.4-1 resembles jn sonic ways the basic patterni used by K. L.Johnson (1970A)on which to build a grid of lines on which only one parameter isallowed to vary at a time. Such lines might, in the future, be added to Figure6.4-1, to show what effect changing load, velocity and viscosity would have onlthe specific wear rate. Other lines might he drawn to represent changing "lubri-city" and roughness, and one might oven hope to indicate such time-dependentprocesses as break-in, fatigue and abrasion by such a grid. The following ex-amples may help to clariiy the many uses if Figure 6.4-1:
6.4.1 Increasing load will generate a curve lending to the left from a start-itg point in "ZERO or MOLECILAR WAR" up to SEIZURE. If tile metallurgy preventsseizure, the upper end will be in "SELF-LUBRICATED".
6.4.2 Decreasing viscosity produce..C another tLrve, with the zame ctartitqgand end points but of n different shdt,,!.

-185
V) I I I~
00
If 0/ L,1
0 LL0a0
Q <00 ..
I *
v)) C- V
IL N-
(L J ;3 0 N 0
/ C) LLIL -@ I n 0 N
x -4C0
oo
2 n pa nq I aL0 I//c
C -N m
CD!eL~NV) 0UdPA 1'1V VMDJ0d
0#ad

6.4.3rv ng ti tor asit , Z eL oc t wil-I he mor e, cotlplex, star c i ngi nearly hori~nintaland urvig upto IURE or "SL,-LF-LUBRICATED7
6.4.4 Docreasinrrk %kef adqosjon would iatofvricf, uv~oeto the USUal end point. satofvrialscrigoe
6.4.5 Break-in niigh hhe saudnyh*0 blow the seu f fjnli t rans~ it i nshi ti g o he rig t an o n aJi a f l a W re being decreased .
6.4.o Lbrasion wolld start in ADHESIVE CORROS1IF, FATIGUE or MIXED, andtend to move upward and slightly to tilt right, perhaps levuling off at R < 10-2but never entering SEVERE (scuffing) or SPIZURE.
6.4.7 Ftil'W Would rise vortic~illy front "2ERO-WAR" to the higher partof SLIDING FA'TIGUE.
0,.4.8 EP Lubricat0 1 1 would start in ADHE SIVE~ moving upward and to the right
into thlt MIX D and CORROSIVE modes. Tho shift to the right depenlds onl Count 1O,the Er' film cm part of $;if it wer I not h" ' t would b iih vt~et because the asper:Lit.es wouldl grow a I itt to .
0.5 Cob'inn th Modlsfo Do s_______
The tricks used in Section 63.2 to reduce' thev models to standard formatfor screening purposes inay havo themir uses in dosign, hut a great deal moare willbe required. An illustrative plan was worked out, under the guidance of Dr. L.S.Akin of General Electric, "s shown in Fi,,ure o.5i-1 It begins with the assump-tion that the problem has boon cl,!rly .;tarod; in, this catse, that a set of gearsare required to work< at a certaia load at s3peed, within a few constraints ontatmosphere and temperatulre.. Akin (1 9 1) ,I~ .nce re lvased a much more completeversion.
The first step reqUireJ is to assume somo design parameters. Thesewill be based on the engineeir's experitence, personal Or departmenital, vwito simi-lar problems. Somu constrainits mav also 1be Suipplied by the customer, especial'yin military work. These may include0 Use of one Of a few specificatit~fi lubricacits,metals, etc., and frequently entail volume or weight limitgtions.
this first tipproximatiLon gear set is then sjubjected to stop-wlie analysis . First, M1odul V is applied to determnet thet specific film thickness (hralat the most criical. point whre toe teeU1 i tip) (addendum) contacts the root Ideden-
tum) . This may be done by moans of the lDowson-)ligg~fl5 0 n equation (5.7-4), as
shown in Tal)e 6. i-. The- result sets the, designer onto one of three pathways,indicated by the regimes on Figure 6.4-1. Of course, if ho 1: 0.5 there is no"pathway as this leads to immediat. seizurc of like-metal gears. Thus, the threepathways would be ho = .5 to 1.5, ho l. to 3.0 and ho -1 3.0. The' last. ofthese woiild be so conservative as to represent~ wastteful practice, Cspe-Cially inmilitary work.

aj~ ~~ ~ LL LJmQ L-= -') ,- LU k
> JA
-oo
0 -,
0 -
OWO
QLj LLUu
LLLU
< -I a0 '
ajILD w I
iz v) 4
CID

- 188 -
Pursuing the ho = 0.5 to 1.5 pathway, it is evident from Figure 6.4-1that one may be in either the adhesive or fatigue mode. This is shown by ModelI to depend on both metallurgy and lubricant. The designer will have Lo choosebetween unlike metals and high film strength lubricant (i.e., stearic acid addi-tive in Table 5.3-1) at the second fork in Figure 6.5-1. If he chooses themetallurgical (Model IV) route, he will have to face the fact that metals suffi-ciently unlike to prevent adhesion tend to include one of lower strength than theother; thus, he will be limited by tooth bending or breakage and must reconsiderwhether his design is adequate for the shock loadings, etc., to be expected inmilitary service, where extraordinary abuse must be anticipated. If acceptable,this design is nearly optimum for equipment of limited lifetime.
If he chooses the high film strength additive route in Figure 6.5-1,he must be prepared to accept the fact that such lubricants are more corrosive,and being less stable, also tend to increase their corrosivity more rapidly,than the bland lubricant of the left-hand branch. However, the greatest problemmay be desorption temperature leading to scuffing in hot climates, etc. If thistest is passed, then a good limited-life design is available.
When h0 is 1.5 to 3.0, the designer is basically conservative. Hemust still test for adhesive wear by Model 1, but will probably pass it. Forsuch a set-up, only bland lubricant and like metals need to considered. Theconservative nature of the first choice indicates that a fairly long lifetimeis contemplated, so the possibilities of corrosive and corrosion-fatigue wear(which were ignored on the first branch) must be taken into account. If theModel IlIA test is passed, a conservative design results.
It may prove that corrosion or corrosion-fatigue will be rapid enoughto cause concern. A test is then made as to whether this will lead to an abra-sive failure in which the primary wear particles start a cascade of secondary,tertiary, etc., particles. If this is not the case, then the design is stil4lacceptable on a conservative basis.
If there is substantial danger of a cascade, then filtration may beconsidered. However, this violates the goal of this STAF in that such a systemis NOT maintenance-free, and so would be acceptable only as a last resort. Useof anti-abrasive additives might provide a way out of this difficulty - but prob-ably with some sacrifice of lubricant stability.
The scheme outlined above assumes that a number of gaps in the modelswill be filled; it is illustrative only, and definitely NOT ready for use by de-signers.

- 189 -
7. REVIEW AND EXPLANATION OF THE ANOMALIES
At last, with the models as well sorted out as is possinle at thistime, we can look again and see what, if anything, has been left unexplainedby this new arrangement of old and new information. Perhaps some of the' .
following discussion belabors the obvious, in light of what has alreadybeen said in discussion of the models, but it seems best to consolidateeverything into focus.
7.1 The Base Case
It has long been believed that the vital link in lubrication withfatty oils was the free acid, which is either present or quite promptlyproduced by hydrolysis. This is quite in accordance with Model IIC, andperhaps that is all that is needed. The water film needed for hydrolysisis available, as shown in Figure 5.5-1, as long as the humidity is highenough according to Table 5.3-V. Even in the absence of such a film,the fat will usually carry enough dissoived water to give adequate acidity.This is vital, as esters do not adsorb strongly enough to provide muchfilm strength.
No doubt the process described above accounts for the protectivefilm that forms on a new part. Events may even progress beyond this, tothe formation of a soap film, in accordance with Model IIIB, duringbreak-in or even sooner. Thus, the anti-asperities are partly filledwith soap. Finally, Model IIIC may add to this layer of soap an incrementof surface resin. Though this is hardly needed to complete the break-inprocess, the double bonds of fatty oils make it very probable.
A mineral oil will not carry out this process with the sameefficiency. For many years it was believed that "natural surfactants"were involved in Model IIC adsorption. Groszek (1967-8), Rudston(1971) and the writer (1971A) have all thrown this into disrepute.Only Model IIA, a relatively low energy process, is helpful, andthe "natural surfactants' range from neutral to harmful. Model IIIBsoap formation is possible only with very poorly refined (or partlyoxidized) oils. Model IIIC resin tends to be soluble, and carbideformation may cause it to do as much harm as good. Thus, Model IIIDis probably the main process that permits break-in and subsequentlow-wear operation possible.

I lO -
Steel and bronze are both capable of Model ITIC catalyticactivity, but are easily poisoned by oxygen as shown in Figure 5.5-8.Their ability to perform in Model IIID may not be correlated with surfacefree energy, but steel is well known to emit exo-electrons.
This pair has very favorable anti-scoring characteristics. Ironand copper have a Model IVA (5%) miscibility temperature of only 17'K, asshown in Table 5.6-1, while iron and tin go to 304'K. The latter wouldbe the more appropriate since the low y. of tin will cause it to pre-dominate at the surface. However, this is just barely above roomtemperature (880 F), and Model IVA is much too naive to predict thissystem. Model IVB and Figure 5.6-1 do better, but the true situationinvolves both Fe C and Sn6 Cu ,, for which parameters are not available.It can only be said that some further work on Model IV using both theblending equation (5.5-14) and more data on intermetallac compound,,would be required to "predict" what everyone has known for 4,000 years--but if it predicted just one more pair as widely useful as steel onbronze, the work would be well spent.
7.2 Anomalies Involving Lead
The low V of lead places it so low on Figures 5.5-7 and 8 thatit may he considered "non-catalytic", though Model IIIC implies that"negligible activity" would be more appropriate. The same factor shouldresult in a very low E value in Model Il. Thus, its esceptional per-formance is not predicted by the chemical models. Even when it formsa soap in Model ITIE, the low melting point and high solubility in oilpreclude much aid to the load-sharing of Model V. Only Model IV shedssome light on this anomaly, since lead is the most immiscible of allmetals. Figure 5.6-1 shows ten pairs with two phases; iron with 8pairs is in second place. hile Tables 5.6-I and II are not completeenough to tell the story, this is also predictable by Model IVA.Apparently the usefulness of lead in bearings depends largely on itsability to remain as a separate phase and exude when it is needed,to serve as a lubricant. The low y value causes it to spread on mostmetals. This is an interesting case of the sort of phenomenon in-vestigated by Bondi (1953).
Another peculiarity of lead is that it does not work - harden,being one of the few metals which anneal at or below room temperature.This is reflected in Model VIB, where abrasion is prevented byembedding the wear particles so deeply they become harmless.
The effect of lead-based additives is less clear-cut, as notedin 4.2. This question cannot be resolved by any of the models, as we donot have F values for these additives to put into Model IIC, nor enoughdata on the physical properties of lead sulfide, halides etc. to be surethat they would flow into the anti-asperities and provide i1) lift forModel V. liouever, this seems to be one of the best modes of action.Another closely related possibility is that the additives serve as,homogeneous catalysts for the oxidation steps in Model TIIC and D.At any rate, investigation of the lead anumallt-. dt -,rvks high priority'.
If
I
191 -
The effect of lead-based additives is less clear-cut, as noted in 1.2.This question cannot be resolved by any of the models, ao we do not have E valuesfor these additives to put into Model IIC, nor enough data on the physical pro-perties of lead sulfide, halides etc. to be sure that they would flow into theanti-asperities and provide EID lift for Model V. However, this seems to be oneof the best modes of action. Another closely related possibility is that theadditives serve as homogeneouj catalysts for the oxidation steps in Model IIIC
and D. At any rate, investigation of the lead anomalies deserves high priority.
7.3 Anomalies Involving Calcium
Calcium has been used so widely that it is surprising so little is knownabout its mode of action. One thing that is striking is that the lattice
spacing of many calcium compounds is close to that of iron. This is not enoughin itself to provide high E values for Model IIC, but the solid film people (Devine1968) have shown it to be a strong factor in selection of appropriate heavy metalchalcogenides, such as MoS , WTe2 etc. to fit specific metal lattices. It is pro-bable that the exceptionalty large volume of the calcium atom fits it uniquely
for some roles in additives. While this cannot be extended to other elements,there is a great deal that can be done to increase the number of applications ofthis very cheap, high film-strength additive.
The derivation of Equation (5.11-7) involves the Girifalco and Good cor-
rection for volume disparity of molecules which are 73 random orientation, so thatthe interacting area of each may be represented by Y This is certainly nottrue for asymmetric, oriented molecules such as calcium dialkylaryl sulfonate,
calcium caprylate-acetate etc. Smith (1969A,B) has done valuable work on theorientation of molecules on mercury. This work should be repeated withgallium, since mercury is so irregular in its surface free energy and crystal
form (See Appendix III). With such data available, Model IIC may prove to
be adequate for this anomaly.
7.4 Other Elements
Of the elements listed in Section 3.4, only iodine warrants detailed dis-
cussion. As noted, this element appears to be unique. Most of the models to which
so much time has been devoted are concerned with wear, and friction is a secondary
consideration. If we can trust Equation (5.12-3) (which is an open question)
iodine must also produce an extremely low wear rate. In fact, the F values in
Figure 4-1 are out of the boundary range entirely; in no case did MacGregor
(1964) report any value to compare with Furey's (1966).
- 192 -
Comparison with Figure 5.7-6 raises a suspicion that what we are seeing is an ex-treme case of shifting of Stribeck minimum to the left. Though the F values donot go as low as the 0.0005 shown by Christensen, it must be recognized thatFurey's conditions would not necessarily produce the same F value at theS tribeck minimum. The question is, how can iodine produce such a situation?The only guide available is Model VI, and the only mechanism is reduction ofthe surface roughness. This cannot be attributed to selective corrosion ofthe asperities down to a "chemically polished" surface. Among the manypieces of evidence for this statement is the fact that iodine also works onglass/glass systems. It appears that some sort of polymer forma-zion is goingon, but it clearly obeys a different set of rules from those of Models IICand D.
A recent paper by Brown (1968) of General Electric shows that aniodine-silicone complex is an effective low friction lubricant. This addsanother piece to the puzzle. It appears that complex formation is a frequentpart of the iodine anomaly. This calls to mind the fact that something verylike hydrogen bonding takes place with halogens. There is also the fact,recentli emphasized by Bagley (1971), that under pressure hydrogen bondedspecies such as alcohols appear to increase their degree of aggregation fromthe usual oligomers to quite high molecular weights under pressure. Theiodine effect tends to increase with load, at least over a range, whichreinforces this ad hoc theory.
It is therefore the writer's speculation that iodine works bythe formation under pressure of a temporary polymer with substantial elasticity.According to Okrent's reasoning (1964), such a material would have quitesubstantial ability to support a load without increasing the friction overthat of the unthickened oil. The effects would all disappear when thelubricant leaves the pressure zone.
This hypothesis can readily be tested by conducting a few tests -
at high pressure, with both low and high shear rates. Suitable equipment hasbeen described by a number of laboratories.
7.5 Optima in Blended Lubricants
It should be obvious from the detailed discussion in Section 5.5.4 and5.5.5 that the various blend anomalies are due to surface resin formation. Threedetailed discussions are given, on specific phenomena.
7.5.1 The DuPont Patents
While this might have been discussed in Section 5.3.4, it seems moreappropriate here as many of the liquids and all of the catalysts discussed in itaro blends. The dupont bulletin (1971) is rather cautious about the mechanism,
and concentrates on the many performance tests in which these alloys have shownup well. The name "LP alloys" is tied to lubricant L/roducing on page 1, and to
Loves Phase on pae 8, so apparently the writer of the bulletin was less sure of
the formcr concept than some of the inventors discussed below. Laves Phase refers
to hard intermeallic compounds which separate from several types of al loys (Nevitt
1963). The prototypes are MgZn 2 (hexagonal), MgGu2 (cubic) and MgNia (hexagon1al),but the current preferences are Co 3 Mo2 Si and CoMoSi. These are quite hard (Pm =
1000 to 1500), iudicating quite high surface free energy. Whether this is directlyapplicablo in Equation (5.5-12) is open to question, but the DuPont data tends tosupport rhar idea.
I

1
193 -
Unlike solid solutions, two (or more) phase alloys are not subject to the Gibbsequilibrium, and any Laves phase present at the surface will remain there. Theseven patents fall into three groups:
U.S. Patent 3257178 covers metal articles coated with Laves phase alloys,and offers only metalurgical theory. The phases are named for Dr. Fritz Laves,no reference given, and consist of compounds of one large and two small atoms, soarranged as to permit the most complete occupation of space. The ratio of radiimay be 1.05 to 1.68.
U.S. Patent 3331700 is a division of the first, and adds some micrographsand details of coating procedure.
U.S. Patent 3361560 was filed later, but is very similar. These threedo not mention lubricdtion, but cite the alloys as resistant to wear, abrasion,oxidation and corrosion.
U.S. Patent 3180012 covers shaped articles made from these alloys, in-cluding turbine blades, tools and dies.
U.S. Patent 3410732 is similar, and suggests use as seal faces and im-pact mills for breaking up chemical sludges.
U.S. Patent 3507775 is described as a "lubricant producing system", andis largely devoted to the subject of polymerizing light hydrocarbons to lubricantviscosity. Gasoline vapor and liquid are both cited as suitable starting materials,along with various "environmental media". This includes the chemical sludgesmentioned above, and liquids such as are shown in Table 7-I.
U.S. Patent 3513084 goes on in the same vein, adding little of theore-tical interest.
Table 7-T is of much interest, especially as most of the liquids arenot in the classes considered polymerizable in Sections 5.5.4 and 5. The testswere run by rotating a ring of Co 5Mo2 Si2 against one of 0.9 wt./ carbon steel at180 ft/min. under the liquid. While the picture is muddied by the apparentlypointless variation in load (PV), it is evident that some sort of optimum wasapproached, in coefficient if friction at least, by the blends. The relative wearcoefficient, on the other hand, seems to negate Equation (5.12-3), and optimizesat octanol; only at the extremes are the two coeffients in agreement. No simpleexplanation will serve; perhaps interaction of maximum work of adhesion for onecoefficient and ease of polymerization for the other would serve. The specialproperties of hexagonal metals may also be involved, since these would be shared
by hexagonal intermetallic compounds. In any case, this anomaly has enough potential
to deserve further study.
I : I I I- I: ... .' a : I I - :1
I:'H FIJ I

194-
TABLE 7-I
FRICTION AND dEAR OF LAVER PHI4SEALLOY WITH VARIOUS LIQUID LUBES
Example Environmental Coefficient PV Total Wear Relative WearNo. Liquid of Friction xlOO (mils/IO0 hrs' Coefficient
7,15 Gasoline 0.10 1200 <0.05* 0.004*
24 Methanol 0.14 >100 0.3 <0.3
25 Ethanol 0.11 >400 1.1 <0.28
26 n-Butanol 0,12 >300 0.5 <0.17
27 n-Octanol 0.10 >500 <0.05* <0.01*
28 ButyraLdehyde 0.13 >100 1.0 <1.0
29 10 wt % Ethanol 0.05 50 0.2 0.4
90 Trichloroethylene
30 10 wt % n-Butanol 0.02 50 1.4 2.890 Trichloroethylene
Control Trichloroethvlene 0.3 27 44. 163.
* Reported as "0", re-interpreted on apparent precision of authors' means
of i easuremnent.

- 195 -
7.5.2 The Silicone Anomaly
In effect, Tabor (1965)has already taken care of this matter. Apparentlysilicone is so prone to polymerization that even copper can catalyze it. The result-ing film tends to be brittle--too fragile to be much help in lubrication and probablyeven abrasive. In .is second paper (1969),Tabor showed that stearic acid added tothe silicone appeared to copolymerize with it, to form an excellent lubricant film.Assuming this is the mode of action for ester-silicone blends makes this a clear-cut case of Model 111C.
7.5.3 Aromatic-Aliphatic Blends
The following is a condensation of a paper by Goldblatt and the writer(197), which explains these blends primarily in terms of Model 1lID:
"Recently a paper was published which demonstrated that the whole oilis a poorer lubricant than either its aromatic or paraffinic fraction. In this workGroszek (1967-8) showed that the portions eluted with pentane (the paraffins andnaphthenes) and Isopropanol (the aromatics and polars) from silica gel are superiorlubricants to the original sample. On the other hand, Appeldoorn and Tao (1968B),
working with pure polynuclear aromatics such as t-methylnaphthalene, demonstratedthat paraffinic-aromatic mixtures behave synergistically. The purpose of thisnote is to suggest an explanation for the apparently contradictory results - i.e.,
that Groszek observed an antagonism and Appeldoorn and Tao observed a synergism.
"Based upon some other work (Goldblatt 1970), which demonstrates that the 4addition of certain additives (e.g., TCP) to mixed aromatic-paraffin stocks causes
increased wear, it was decided to investigate this prowear effect observed by Groszek.
"A 1000 coastal distillate was separated into various fractions, one con-
taining the saturates (paraffins and nqphthenes), three containing different amounts
of 1 ring, 2 and 3 ring, and 4 and 5 ring aromatics and one containing the non-
hydrocarbon "polar" fraction. This latter cut probably includes much of the nitrogen,oxygen, and some of the sulfur compounds. This corresponds to (Croszek's lastfraction rather than his "surface active material". The aromatic cuts were analyzedmass spectrometrically and the details of this analysis appear in Table 7-11.As can be seen, all the cuts contain substantial amounts of aromatics ranging fromone to five rings per molecule. The details of the alkyl and nanhthenyl substi-tutions on these aromatic structures are omitted from Table 7-I for clarity.
"In Table 7-111 are listed wear data for the 1000 coastal distillate oiland its fractions. As can be seen, the aromatic fractions tend to give lower wear.
This improvement tends to become poorer as the percentage of polynuclears decrease.
The poorest results are those obtained with the saturates cut. This trend of de-
creasing wear with increasing aromaticity is similar to the data presented by
Groszek in Figures 19.3 and 19.4 appearing in his paper. However, he observes a
maximum in wear which was not observed here, probably because we lumped all sat-
urates together. His final fraction, in each case, shows a slight increase in
wear similar to that found here for the nonhydrocarbon cut.
S !I

-196-
TABLE 7-11
MASS SPECTRAL ANALYSIS OF 1000 COASTAL DISTILLATE OIL
1st Aromatic Cut 2nd Aromatic Cut 3rd Aromatic Cut
Z Benzenes 50.7 49.9 39.5
22,3 ring 33.5 35.3 38.3
% 4,5 ring 7.2 8.3 13.0
X sulfur compounds 7.6 6.5 8.2(2,3,4,5 ring)
% sulfur 0.3 0.46 0.64

- 197 -
TABLE 7-I1
WEAR DATA FOR COMPONENTS OF 1000 COASTAL DISTILLATE(a)
Wear Scar
Fraction Diameter (mm)
Saturates 0,43
Ist Aromatic Cut 0.37
2nd Aromatic Cut 0.30
3rd Aromatic Cut 0.25
Nonhydrocarbon 0.33
63% Saturates37% Mixed Aromatics(b Blend A 0.40
62% Saturates36% Mixed Aromatics(b) Blend B 0.47
2% Nonhydrocarbon
(a) 4-Ball machine, 15 kg, 1200 rpm, 125*F, Dry Air,15 min. These test conditions are not comparableto the 1 hr, 200C test conditions in Ref. 1. TheWSD are therefore expected to be different althoughthe relative values are correct.
(b) Blended in their naturally occurring proportions.Contains about 50% single ring aromatics.
- 198 -
"The most important point is that our Blend A (Table 7-I1) shows some
improvement over the saturates alone due to replacing the aromatic cuts. On theother hand, reconstituting the original oil by adding the 2% of polar nonhydro-carbons (Blend B) gave a wear rate greater than that of any component, confirm-ing Groszek's observations. Thus, addition of natural polar compounds to themixed aromatic-saturates blend had the same effect as that observed for TCP. Thedifferences observed between Appeldoorn aud To on the one hand and Groszek onthe other may very well be related to this prowear effect of compounds in mixedbase stocks. Appeldoori and Tao were working with pure aromatics. Addition ofthest to the paraffin produced only the beneficial behavior they reported. Theoils with which Groszek was working contained large quantities of polar impurities,and, hence, he observed prowear on the total mixture.
"Two significant conclusions may be drawn from this work:
(a) polar impurities within naturally occurring petroleum fractionsvery frequently have a detrimental effect upon the lubricatingability of the pure hydrocarbon fractions,
(b) heavily alkylated polynuclear aromatics are less efficient anti-wear additives than a monoalkylated aromatic. This latter con-clusion may he drawn from the fact that the additive effects re-ported by Appeldoorn and Tao are substantially greater than thoseobserved in thi. work. While these conclusions appear to he com-pletely validated for 52100 steel on the 4-Ball machine in air, itmust be recognized that they h.ve not been confirmed for any otherconcentrations, metals, machines and atmospheres than those shown
in Table 7-111."
7.6 Competition of Additives For Surfaces
It is evident from the previous section that no simple model can beginto explain the intricacies of additive action. In highly idealized situations,such as those of Studt (1968), reversible chemistry (Model lit) provides such easyanswers as to constitute no anomaly at all, whereas most of the real field problems.are related to Model IIIC and D. Admittedly, there are loose ends, but the writer
feels confident that a modest investment oC laboratory and mathematical work willfit these under the general heading of Model III.
7.7 Roles of Humidity And Oxygen
The reader is referred to Section 5.5.5 and 5.5.0 for a good deal of theexplanation on the paradoxical effects of water vapor and oxygen. However, thereis more to be said about water than about any other chemical species--, not un-common situation, since ordinary water co.tains quite enough anomalies to satisfymost people! Table 7-,IV shows the various forms of involvement the. have beennoted so far in this report. It is evident that not only is it impractical toeliminate water, but that the results would not all be beneficial. Instead, the
goal should be to understand the ten or more interactions in Table 7-IV and to
find means to counteract the harmful ones.
i j

- 199
TABLE 7-IV
VARIOUS ROLES OF WATER IN LUBRICATION MODELS
Model Wear Mode RH* Role of Water, Vapor or Liquid 1I Sliding Fatigue Decreases zero-wear life and increases finite
and High Transfer wear rate, piobably by embrittlement.
> Increases zero-wear life and decreases finite Iwear, due to liquid film.
II Adhesive or Any Displaces base stock, increases wear.Locked Dislocation Displaces or couples additives to oxide.
IlIA Corrosion by 02 Any "Catalytic" transfer aid, increases wear.
IIIB Soap Formation Any "Catalytic" reaction aid, decreases wear.
IIIC Dehydrogenation Any Poisons catalytic action of some metals.
IIID Electron Transfer Any Destroys anionic radicals, increases wear,
IIIE Soap Formation Any Reaction aid, decreases wear.
IV Corrosion Any Increases scuff load (increases wear by liA).
VI Rolling Fatigue Any Decreases life by embrittlement.
VII Abrasion > Prevents adhesion to two-body situation, re-
duces wear.
* Relative Humidity < subcritical or > supercritical.
"Any" humidity does not include 0 to 1 ppm H20 by weight;effects above and below critical are not yet identified.

- 200 -
The situation on oxygen is similar, but not quite so complicated. As
indicated in Figure 5.3-3, Rowe's data from a nitrogen atmosphere fits Model
1B for dry air. On the other hand, some mechanism (perhaps Model 1ID) is sensitive
to a part per mitllion or less of oxygen, zia Bicher (1908) reported a drastic loss oflubricating ability at that level.
There is a great deal of work needed to make sure that al these conflict-ing mechanisms are clarified, but perhaps less than 1007o understanding will serve
as a basis for combatting the worst ones.
7.8 The Sharp Transition To Scuffing Wear
The transition at Y has received a great deal of attention, both because
of its technical importance aa a limiting condition in geor design (Section 4.1.2),
but also its fascination as a scieutific puzzle. Model IV, as already mentioned,shares the same fascination and represents a special aspect of the same problem.
However. the principal concern in this Section is with identical metal parts,
Model 1 does not recognize loads approaching the scuffing level, butmost of the others touch on this problem one way or another. Model II includes
Equation (5.4-23), which purports to set up a critical condition for catastrophicdesorption. Cameron and his students (Grew 1969) h,ave taken this so literally as to
list "desorption temperatures" for various additives; though there is some ques-
tion as whether the term is applicable, the phenomenon is certainly clear-cut.
It depends on the metallurgy, the base-stock and quite possibly on the running
conditions. Most striking is the dependence on matching the molar volumes of additiveand base oil (Askwith 1966). The writer (1971C) has demonstrated that a very sinfi-lar case in emulsion technology can be explained on tie basis of minimizing the
entropy of mixing of additive and base oil, but this development still lacks rigor.
Models lIlA and B do not contain any equation specifically related to
scuffing, but atmospheric corrosion is widely recognized as a factor. Roberts (19b9)
goes into considerable detail on this phenomenon as part of his paper on "Lubrication
(Without Oils)". Additive corrosion used to be considered the whole basis of LP
scuff prevention.
Models I11C, 1) and E explicitly describe, in Equation (5.5-20), how theprotective films of soap or resin can he expected to fail. Actually this equationis opt to give a slow "transition" when resin is tested under static conditions,
it is the "snowball effect" in which a little loss of resin causes T. to rise,which causes further loss of resin and so on. This is probably the most plausible
of all explana tions of the "seizure delay" noted by Pike (1970), if we assume that
test parts come covered with a thin iilI of resin. Despite the "cleaning" given to
such test parts, they are hopelessly contaminated by areospace standards (Buckley 1966).
Model V carries, in Figures 5.7-7nnd 8 , a very convincing demonstr,tion
of the way an END film can go into instability. It seems quite unlike'y that this
model would work with additives present. but it might be related to the Blok I1937i
postulate of a constant scoring value of T, for any given viscosity of non-additive
oils. The writer discussed Blok's p;ipor (1970) at some length, considering ill the
various surces of instability known at that time, and concluded that the one fac-
tar that vas constant was the viscosity of the oil at the aspeirity tip temperature,
by Equation (5.4-6).

- 201
Th . derivation is much too long to quote here, but the outcome was that gears willnot fail on non-additive oils of 100*F boilio.g range when the viscosir'y at Ts isover 1.87 + 0.06 cps, and will probably fail below 1.18 + 0.06 cps (Table 7-Y).
Between these values their failure is probabilistic. Similar results can be ex-tracted from a paper b) Fein (1967), with the pass-fail limits on the 4-ball machineat 2.7 times these values. This was attributed to differences in geometry. Blok
protested, quite rightly, that it was the viscosity at Tb that controlled lossthrough the anti-aspLrities and held that it was bubble formation due to vaporiza-tion at Ts ( riebe 1970) that caused the breakdown. Tallian (1971) agrees thatthe viscosity at TS is not the relevant factor.
Reconsideration of Table 7-V has led the writer to conclude that Blok
is probably correct, especially since he unpublished data that show lubricants
made by blending kerosene with heavy oil scuff at a lower temperature than
straight-cut oils of the same viscosity. Since vapor pressure is often most ap- !
propriately handled as log (PV), the total pressure column was converted to
log 4pa). This function showed a definite relationship to scoring tem-
perature: at TL, it was 2.627 + 0.057, and at Tu it was 2.656 + 0.0A9. While
the difference is significant only at a low confidence level, it does indicate
that experiments in which log (Pv + Pa) was measured rather than estimated would
be highly desirable. Further clarification of Model VC by Christensen will beawaited with the greatest interest.
Models VI and VII have nothing to offer on this matter, though it is wellknown that three-body abrasion (probably both kinds together) can prevent scuffing--
at the price of high wear rates.
In short, we suffer from an embarrassment of too many explanations, and atpresent none of them can be definitely eliminated. Moreover, it seems that therewill be several survivors, as Model IV cannot ue eliminated and there appear to beat least two more mechanisms (additive and non additive) at work. However, hope is
in sight to cut out the dead wood in the next year or two.
7.9 Effect of Aniti.-Wear Additives on Fatig~ue
Since Model VI was specifically brought in to deal with fatigue, and hasbeen discussed in Section 5.8, there is little more to be said about Equation (5.8-1).However, that section was fairly specific to rolling fatigue, and the aromaly isnot necessarily limited to that specific case. In addition, it seems probable (asindicated in Table 7-IV) that humidity plays more of e role than its own high sur-
face free energy would predict by Equation 5.8-1.
The writer has not located any mathematical model for hydrogen embrittle-ment, nor for the specific symptoms of fatigue due to such embrittlement. There is
a regular flood of articles under the headings "corrosion fatigue", "stress corro- Ision", "hydrogen embrittlement", etc. which rarely come to the attention of the lub-rication engineer. The writer has been unable to even read all of these articles I
published during the contract period, let alone make a critical survey of them. Afew that were found to be .-f special interest are listed in the bibliography(Hoar 1962, 1964, Scully 1963, Vitovec 1964, Burg 1967, France 1970, Naesar 1970).
From the volume of publications it is clear that there are many unsolved problems,and many workers engaged in solving them. It would seem that all this activitymight solve the problems of the jubrication engineers without effort on their part,but the writer believes better solutions will. be reached sooner if the matter isnot left entirely to the structural and corrosion engineers. In addition, someproblems (uspecially in the U.S. Navy) seem ':o be so urgent that action is alady

-202-
5' IN ~ (N C'0 N~ CO -- I i
(V0)
(ii E-44 -
cioF
-Ai
0 >
-4-
C)II
-A r~.
-L 0 -4 CO
o ~ '-4 M
~I o~I
0 0 C)
-'0 'D
S 0 -4 CO> l
o:~ca,
(j-..- I' 1- cci~ ~ ~ (
C; -1 0 j I

- 203 -
under way. A very recent paper by Schatzber, (1970B) provides some empiricalanswers for combatting fatigue induced by water; a new model which takes theseinto account is badly needed.
In trying to fit models to fatigue wear, we must not lose sight of thefact that two or more modes are possible. The situation depicted in Figure 5.3-2is characterized by Tallian as "traction", in which the frictional force FW/N isapplying tension at the crack. Rolling fatigue tends to pull cracks on both sidesof the Hertz spot, and the model may be different--even in terms of what effect
Y12 might have, unlikely though that seems.
A much more likely cause for "failure" of Equation (5.8-1 ) would bechanges in YI. Should this be replaced by Ul, the surface stress, which includes
YI plus dislocation and work-hardening energies? Equation (5.9-7) tends to showthat for abrasion, cbi;ws are not that simple, and that both Y, (=300P° 1 / 3 ) ando I (presumably =30OPI / -) would be needed.
In addition, there is the very important consideration that the chemi-cal species at the surface after a long series of non-wear encounters, as shownin Figure 5.3-1, or wear encounters as shown in Figure 5.4-4, may no longer be metalat all - but carbide. This would be especially likely at low humidity due to theradical-quenching effect of H 0. Kragelskii(1965) notes that many metals form"white layers" at the broken-in surface. In the case of iron, this can generallybe identified as cementite (Fe3C), more familiar as "white cast iron". Recentlyanother iron carbide (Fe 2 0 C9 ) has been identified; for years it was known onlyby its characteristic X-ray lines. It is important to note that carbides are"ceramics", and hence fall on the lower line in Rabinowicz' (1965B) chart reproducedin Figure 7-1. Hence, they are far more prone to cracking; even though harderthan metals, they are lower in YI. Hence, carbide formation can result in greatlyreduced fatigue life.
Finally, there is the by-product of carbide formation by Reaction (4.4-18),which is hydrogen. This would be a relatively small amount compared to that producedfrom water. However, it is well known that hydrogen embrittles only hard steels--that is, those with a high cementite content, from which we might decude that the com-bination Fe C + I gives a compound or complex which is exceptionally brittle.However, Viovec ?1964)has shown that result is subsurface bubbles of CH4 , whichcannot diffuse away and so builds up pressure.
In short, there is a great deal to be done to determine the parameters,but combining Models IIIC and VI appears to explain why there can be conflictingreports on the effect of additives on fatigue.
7.10 The Break-in Anomalies
Setting aside the asperity-cutting effects of break-in, important though
they are, as being easily explained, we are left with quite a wide variety of
phenomena that take place in the first few minutes or hours of operation. The results
are so well known, and have been so well described by Crook (l98-9)that a very brief
listing will serve. The gear, bearing or other device that has been properly broken
in will carry at least twice the load that would have caused scuffing in its orgi-
nal condition. The wear rate will also be low as 1/25 of that originally found at
the same load, and the friction is generally lower by as much as 50/, more or less
in line with Equation (5.12-3).

- 204 -
Figure 7-1
CORRELATION OF SURFACE FREE ENERGYWITH HARDNESS
!I I I NbOw I2000 -
Pt 3Ni Ej W
C3 Co N-
Fe 0 Os VCAu Cu 0 0
, 1000 - Al 13 Be T03 a ~ TiCO0Za0 Ag Al 2 3 Z
, 500 Pb 0 0Mg
TbLB ar ZrO2Ga Sb0 0
< LiFu_ Mica,y 200 -ONa Mic
0 OCaCO 3C03
100 - Slope = 0.32
0 K o KCI
0.1 1 10 100 1000
HARDNESS, kg/rmn2
Plot of surface energy at the melting point against hardness at roomtemperature, for some metals and non-metals.

- 205 -
Perhaps the greatest anomaly of break-in is that most test. machines arerun on new parts, suddenly brought to full load with no chance to build Up what-ever protective layers are responsible for the excellent performance of the machinesthey arp sipl-oqed to stimulate. Some engineers justify this on the basis that thetest without break-in provides a "safety factor". Actually, a factor which varieswidely with the chemistry and physics of the system cn hardly be Justified; atrue safety factor is a known allowance for uncertainties in the design equations,the materials of construction, and the overloads the average user imposes.
A second rationalization for this bad practice might be that extremepressure lubrication was first widely applied in metal cutting. This is the onearea in which virgin metal is encountered at every pass (except for the tool sur-face, which may or may not be subject to break-in). Hence, many of the testmachines that are used to test gear and hearing lubricants were developed for the
flcui working oil formulators and purchasers, and have bKen thrust into other ser-vices with little or no thought. Fein (1967) has shown a good deal of what can bedone simply by making adjustments to the test procedure on certain test machines.Most engineers, however, seem to blame the machine geometry, and are very loathto even consider the fact that they are trying to telescope years of service intoa 10 or even 2 minute run, when they say that some machine does not correlate withfield. Of all the test devices in conmon use, only the Ryder gear machine (ASTPIMethod D 1947) even approaches a realistic break-in period.
There is little choice in models for break-in among those listed. Models
I1IC and D are the only ones which offer a reaction period that is comparable withthe observed results. To these may be added the soap formation of Model IIIEin some circumstances. No doubt oilier effects, such as work-hardening, are important,but that is outside the scope of this report. Model IV might be considered in thespecial aspect of the diffusion of alloys by Equation (5.5-14), where the heat anddislocation speed up the diffusion of a low surface free energy component to whereit can do the most good. It is also possible that the Feng version of Model II(Figure 5.4-5) will, when complete, be of some use in this connection.
7.11 Miscellaneous Anomalies
To preserve the pattern of Section 4, this group of anomalies are allrelegated to subheadings, though some of them receive extended treatment whileothers are barely mentioned.
7.11.1 Anomalously Low Frcltion in Transmissions
Since this anomaly was put en the list, Li (1970) has investigated thematter further, with somewhat less startling results. F-values were found to de-crease (without steps) in response to both time and temperature. Though isothermalconditions were not rigorously r.aintained in any test, and in some tests tempera-ture was allowed to rise with time, the writer feels that Li's experiments show de-finite evidence of Model IIIC and V break-in, as outlined in 5.7.5. The "glaze"
must have been rather high in oxygen content (and 6,,) since it recisted the solventaction of paraffinic oil, even at 500*F.
7.11.2 Anomalous Wetting Energy
This is illustrated in Figure 7-2, plotted from data by Blrnett andZisman (1968). Unfort'Inotily, they did not use enough liquids to permit plottinga Hansen diagram, which might well have shown how the three partial parameters acton a metal which is hiriod under the variety of laya> so'wiw in Figure 5.5-1. (Inthis case, one or another of the iron oxides may be absent as the authors polishedtheir specimens under water).

- 206 -
Figure 7-2
ZISMAN-GANS PLOT OF WETTING POWEROF ORGANIC LIQUIDS ON METALS
(AT RELATIVE HUMIDITY - 0.6/o)
2.2\
II2.0 Zirconi tim
1.8 C
1. Copper
%% 1 2 y 2 (1+K 1 2 30.4. 1.4 1 <N x 2.4.
- * Nickel 2Nicke 73.6 ergs/cm
'~ on
r- 1.2 I>y-linl ft-D " , %12 =67.0 -
AlumninLum
1.0W " W 63.4
0.8 0
0.6 1I 1 I
0 10 20 30 40 502
=SURFACE FREE ENERGY OF LIQUID (ergs/cm

- 207 -
The arithmetic on Figure 7-2 is based on the conclusion which was originallypublished in Germany by Philippoff (1960) and more recently by Cans (1970) in-dependently in the U.S., that the work of adhesion A1 2 for liquids with Y2 belowthe "critical surface tension" yc cannot equal the often quoted but incorrect"2V'. The A1 2 values shown are of dubious value, due to the hydrated oxideetc. layers, but agree well with Harkins (1950) and Clayfield (1957A). (See Appendix V.)
Another model to be tested here is the Zadumkin-Karashaev Equation(5.11-6). Since the energy involved comes from ordinary electrostatic forces,and the intervening layers are essentially all dielectric material, this shouldapply over substantial distances. Suitable contact potentials for the metals arelisted by Bewig and Zisman (1964). As this seemed borderline to the present study,the necessary rather complicated calculations have not been carried out. However,the discussion below (7.11-4) on stearic acid multilayers gives some idea of thepossibilities.
7.11.3 Group B Metals
Group S Metals have been analysed under Model IV, and found not to haveany special properties not accounted for by their solubility parameters and molarvolumes. (Soe 5.5). Conversion of these to surface frce energies is discussedin Appendix IV.
7.11.4 Multilayers of Stearic Acid
A recent paper by Allen et al (1969A) tried to show that multi-layers of stearic acid were of great value in boundary lubrication. The writer'scomments are quoted below:
"The authors make an excellent zase for the existence of ordered multi-layers of stearic acid, and a plausible one for their importance in boundary lub-rication. However, there is much evidence that such layers have no practical valuewhen forces greater than a few dynes/cm are involved.
"On the positive side is a very recent paper by Takenaka (1971) in whichmultilayers built up by repeated application frou a w@ter surface showed a firmmonoclinic crystallite system with a spacing of 23.8 A and an inclination of 27to 35'.
"On the negative side, Vold (95) observed 20 years ago that even Blodgettlayers on dilute HCI have about 22% of voids until compressed. Ries and Kimball(1954 showed that the void fraction varies across the film, from circular islandsof 3000 to 50,000 X that are 10/ covered to lIrge areas with nearly 100/ voids.Spink @96) showed that about 70/ of the monolayer was readily removed by evapor-ation from mica or silver surfaces. Block and Simms (196) showed 55% of the mono-layer to be readily desorbed, and 61% readily exchanged, from steel surfaces.Timmons et al (1968) confirmed this, in more detail, as 6/ by thermal desorption,5W/ by solvent desorption and 60% by exchange from iron. Anderson et al (1961applied this work to aluminum, platinum, copper and gold surfaces, with similarresults.

- 208 -
"The point made by these six papers is that not even ONE layer of stearicacid is bound to metal tightly enough to resist 6(07 removal by even the mildest forces.The reason for this is evident from analysis of the cohesive energies of the variousjoints in the multilayer. Stearic acid rarely encounters bare metal; the ordinarycontact is with a hydrous oxide surface such as FeO(ON). While initially the en-counter must result in chemisorptlon, aging will harden this into covalent bondingsuch as FeO(OCOC17113 5 ). Probably the 40% coverage is of this nature, and theother 607, is hydrogen bonded (H-bond), with Keesom (permanent dipole) and London"dispersion" energies also contributing. The second layer of acid can only contactthe first through the hydrocarbon tails, and thus the bond has only the Londonenergy. The third layer is again hydrogen bonded, and so forth. The resultingstructure results
Cohesive Energy (kcal/mole)
Joint Coval ent Jlzdrogen Keesom London Total
0.40 x 100 0.00 x 5 0.60 x 1 0.60 x 1 44.2
2 0 0 0 1.0x 1 1.0
3 0 1.00 x 5 1.00 X 1 1.00 x 1 7.0
In addition to the weak second joint, there is every reason to expect a
fur''er weakening due tc liquid invasion of the structure. As pointed out by Levineand Zisman (195 there is a recognizable difference between the Blodgett layerspicked off a water surface and layers laid down by adsorption from nonvolatile sol-vents. Beerbower and Hill (1971C) show that this is predictable from the enthalpyand entropy relations. The exact amount of liquid depends on the H-bond, Keesom,and London cohesive energies of surfactant (i.e., stearic acid) and liquid, and theratio of their molar volumes. While this work was primarily directed to interfacelayers in emulsions, it can equally well be used to explain the peaks noted by
A!kviith et al (1960). Thus, the multilayer will contain between 40 and 60% of liquidan be of a rather mushy consistency.
"The question is, if the authors feel a multilayer of this sort is sovaluable, why do we not get all the benefits cited by using grease in the firstplace?
"As the writer showed ([971A), there is a strong antiwear effect from thick,semisolid films, but these are the result of catalytic oxypoly-nerization of the base
oil-additive mixture at the rare encounters with bare metal. When such contact doesoccur, presumably at a fresh wear spot, this "friction polymer" forms. Since it iscaused by wear rather than friction, and is an oligomer with 0 and CO links ratherthan a polymer, we prefer to call it "surface resin".
"While our laboratory has not had any opportunity to check out this matter,it might be of interest to note that Zadumkin et al have come out with a model forinterfacia] energies which helps to explain how these multilayers are formed (1965).In very condensed form, ihis states that the work of adhesion A12 of an organic liquid
to a metal depends on the square of the contact potential of the metal against a non-polar liquid V. two other metal constants, and the dielectric constant of the liquid
1

- 209 -
A12 kV2(E - I)/( 1) (7.11-1)
where k contains the other two metal constants. These are presumably not highlyvariable from metal to metal, as they relate to Thomas-Fermi transformations.This equation has been verified for liquid galliumand mercury against a numberof pure organic liquids.
"As the Cibbs-Duhem principle requires that a system equilibrate withthe minimum free energy, the work of adhesion (- C) will maximize, which leadsa mixture to separate with the higher dielectric constant species accumulatingnear the interface. Taking the dielectric constants of hexadecane = 2.00 and ofstearic acid = 2.34 at 20*C, and the contact potentials against hexane from Bewigand Zisman (1964), the relative works of adhesion may be calculated:
hexadecane on chromium = 0.016k ergs/cm2
stearic acid on chromium - 0.019khexadecane on gold - 0.0055kstearic acid on gold - 0.0068k
"Thus, chromium or alloys in which chromium forms the surface have dis-criminating power of 0.003k, while gold has only 0.0013k ergs/cm 2 and so will forma much more fragile layer".
Smith (1970) attributed multilayers of acid to soap formation.
7.11.5 Freshly Purified Cetane
The only anomaly here lies in the fact that the changes in the cetanewhich has been exposed to light are so subtle as not to have been readily detected.Without further investigation, the writer believes that the principal change is thepresence of free radicals, which help in triggering off the Model IIIC reaction(5.5-17).
7.11.6 Complex Organic Phosphates
Time has not permitted any investigation of this matter, nor was theproject funded for any laboratory work. It can only be speculated that theselarge molecules (castor oil-P 205 reaction product and Ca3 (PO4 )2 plus oleic acid,perhaps partly reacted) act through formation of soap-like films by Model IIIE.
7.11.7 Diesel Engine Scuffing
The anomaly involved at this point is not only that discussed under thecompetition of additives, where typical anti-wear aoditives increase wear. Thereal bomb-shell was the discovery by Rogers (1970 that a simulative test devicegave ordinary wear on cast iron when dry, but rapidly shifted into "scuffing"wear on being lubricated.Simultaneously, an exceptionally thick "white layer" developed. The author failedto make the obvious statement that this particular white layer was Fe3 C eitherfrom caution or ignorance, but did offer the opinion that Fe3C in the wear debriswas caused by carbide formation using the carbon from the lubricant. At first,this seemed to be an unnecessary complication, as gray cast iron already containsenough carbon (in the form of graphite) that it can be converted to white castiron (partically pure Fe3C) by melting and quick chilling to prevent decomposi-tion into ferrite and graphite.

- 210 -
Subsequent studies of the litarature, especially Eischens' article(1969) showed that indeed hydrocarbon lubricants might undergo complete dehydro-genation by Model IIIC, to yield Fe 3C. The effect of this an fatigue has al-ready been discussed in Section 7,9.
7.11.8 Suspension of Particles
This was fully covered under Section 5.9.3, in what might be designatedas Model VIID. It should be emphasized once more, however, that a great deal re-mains to be done. At present, it is not possible to put together a consistentlist of Hamaker constants, nor is any procedure available for computing them.It is highly probable that one can be developed from 6D values (and y values) forthe material of the particle--but we do not always know what the particle is, nordo we always have 6D values for it (Fe203, for example, has never had its heat ofvaporization determined due to low vapor pressure below its decomposition point).Fowkes has a new method of computation under development, but so far has notreleased details (1970). Hansen (1969) has shown that sedimentation of pigmentscan be correlated with his three parameters, plotting the same way as for solubil-ity or wetting. Parfitt (1967) presented a review of the subject featuring the"DLVO" (Deryaguin-Landau-Verwey-Overbeek) model, which is considered to be morecomplete than the Hamaker-Vold version.
7.11.9 Delay of Transition
It was mentioned under Section 5.3.9 that transition delay might becaused by slow dissolution of surface resin formed from metal-working oils used inpreparing test parts. Actually, this is not the most plausible explanation. Itseems more likely that some fatigue phenmonon is taking place. Figure 7-3 showsPike's (1970) 4-ball data on cetane without additive, replotted on log-log paper.It is evident that the data fits fairly well to the Lundgren (1949) formula, W3do =
constant (see Section 5.3.2).
Unfortunately, the addition of stearic acid, shown by MacGregor (1964) to Ifavor fatigue over adhesion, causes the negative slope to drop from 0.333 to about0.065. This indicates that a mixed mode, probably "Quasi-Hydrodynamic" (see Table 2-1)has replaced the simple fatigue observed with cetane.
In addition, Appeldoorn (1966) shows data with a positive slope(Table 7-VI ), for cetane on the 4-ball machine; no theory is likely to reconcilethese data with Pike's.
7.11.10 Formation of Gold-Oxygen Layer
It has recently been confirmed (Runk 1971), and serves to emphasizethe point made by Zisman (1969) that the wetting of metals is a fairly complexprocess unlike that of organics and ceramics. As discussed in Appendix V,metals appear to bond to organic liquids by an electron donor-acceptor energyclosely related to hydrogen bonding, and the oxygen may well play a vital role.Pask (1970) felt that good bonding MUST involve non-London forces, and if atall possible, covalent energy. This anomaly has been assigned to Model II,since it clearly involves reversible surface chemistry.
V k

Figure 7-3
TRANSITION DELAY TRAVEL AS APOWER FUNCTION OF LOAD
Mixed Mode20X d W1 constant
,40
- -+
457-
0- 50 10@0 0 00 00 50
TRAVELc BEFRE ANSIIO (c)+

I
-212 -
TABLE 7-VI
"ZERO-WEAR" PERIODS AT HIGH LOADSON THE 4-BALL MACHINE WITH CETANE
AS LUBRICANT
DELAY PERIOD IN MINUTES - 770 F STARTING TEMPERATURE
Load (kg.): 5 10 30 50
600 rpm 0.71 0.80 4.64 18.50
1200 rpm -- 0.74 5.00 6.85
1800 rpm -- 0.33 15.90 --

I
- 213 -
7.11.11 Water Solutions as Lubricants
There is a good deal going on in this area, all apparently more orless dependent on surface resin formation. However, it appears borderline tothe scope of this report, and much of the information is proprietary, so thisanomaly is merely cited as another success for Model IIIC.
7.11.12 "Bifurcated" Wear .a
Saibel (1970)has provided a very elegant solution for this matter, basedon his equations for birth-and-death statistics of asperity contacts. Others (4.11.12)feel, with some justification, that the explanation is much simpler, and merely dueto proximity to ai transition point such as Y in Figure 2-1. In such a case, wearcould continue on a "normal" basis indefinitely in the absence of a perturbation Isuch as proposed by Blok (1970). However, once wear enters the scuffing mode,
return to "normal" would he quite difficult, requiring a new break-in, as discussedin Section 4.8, at a much lower load.
One case came to light which scarcely can be explained by the "proximityin England reported that an oil soluble barium salt of an anti-smoke additive was
put into diesel fuel and tested in a London taxi fleet. Wear on about half thevane pumps was doubled over that for the base fuel, while the others decreasedto half the wear rate. All tests on metallurgy etc., revealed no differences.No explanation other than Saibel's statistical one has yet been offered.
7.11.13 High Friction on Titanium
The trouble with titanium seems to be primarily associated with peculiarcrystal structure (Buckley 1966). Most hexagonal metals are quite easy to lubricate;cobalt in particular gives good friction and wear even when lubricated only with itsown oxide (Roberts 1969). The principal difference is in the ratio of prism lattice Idimensions, c/a, where c is the spacing in the axial direction and a that mea-sured across one of the six flats. Cobalt has a ratio of 1.624, whiletitanium is only 1.587. This difference is augmented by a tendency to slipparallel to the flat, rather than at right angles to the axis, so that rubbing a
titanium surface tilts the prisms into a saw-tooth configuration. The resultingsurface is shown in Figure 7-4. The effect may be compared to attempting toslide with bare feet on a bathroom floor paved wih loose hexagonal tiles.
Rabinowicz (pe:sonal communication) doubts that the c/a ratio is the soleexplanation, as other hexagonal metalr with similar ratios lubricate normally. It
is only the group IVA (Ti, Zr, Hf) which is peculiar. fie also published a paper (1955)on lubricating titanium with a variety of synthetics, and feels iodine is not anybetter than chlorine and fluorine.
It is evident that the problem is fundamental to this metal (or group). Effortsare being made to alleviate it by alloying with tin (Johnson 1970B) or with high oxygencontents. However, the best approach would be to reduce the traction force (FW/N)on each asperity to such a point that it could not cause the tilting shown inFigure 7-/. Apparently iodine-based lubricants function in this way. They donot have any specific reaction with titanium, since they show the same low frictionon other metals and even on glass. Even if the mechanism proposed in Section 5.3.3proves to be unique, it may still be possible to make further improvements on thepresent iodine-silicone polymer (Brown 1968), and it appears that such a mechanism couldat least be simulated with hydrogen bonding to replace halogen bonding. Such asystem would at lont be relatively non-corro.ive.
.... ltlJ

- 21.4
Figure 7-4PROBABLE MECHANISM FOR HIGH
FRICTION ON TITANIUM
V~9~AnnealedTitanium Asperity
Stationary
- 215 -
7.11.14 Austenite Versus Martensite
The writer is not well qualifited to investigate this matter,but has not turned up any further evidence to support Grew's theory. On theother hand, the various versions of Model IV do not seem to explain his results,so the matter remains open.
7.12 Recapitulation of Anomaly Explanations
In the preceding subsections an attempt has been made to deal witheach anomaly in terms of which models are applicable. The results aresummarized in Table 7-VII. It appears that most of the phenomena can beexplained, at least qualitatively, in terms of the models. On the 28 casesconsidered, only one (Pustenite vs. Martensite) was left completely un-explained, and that primarily due to lack of interest. In cases 7.3, 7.4and 7.11.12 special purpose models had to be invoked that were not otherwiseuseful. The "hexagonal theory" arose twice; perhaps it should have hadspecial billing as "Model IVC".
It is obviously not possible to base any reliable conclusions ona "body count", but the fact that Model III shows up 21 times .n Table 7-VII israther impressive. Much of this is due to the surface resin Models IIIC(10 times) and IIID (6 times).
Put in another way, the models have been tested as to their abilityto explain extraordinary lubrication, in addition to the evaluation againstordinary lubrication in Sections 5 and 6. Each of them has earned somerecognition, even though in some cases this is quite limited. Thus, allof them require inclusion in the over-all design manual which is the distantgoal of this study. The weakest member is undoubtedly Model II as described.While it does represent a real situation, it usefulness will be trivialuntil the Feng dislocation traL.sfer mechanism has been incorporated. Inother words, simple adhesive wear is so rare as to be cf very little interest,but transfer wear describes a mode which is worthy of further study. Suchstudy would be motivated by a desire to prevent transfer in favor of fatigue,for reasons clear in Figures 6.4-1 and 6.5-1.
The encouragement gained from Table 7-VII is very substantial interms of Justification for proceeding towards this goal.. The fact thateight of the explanations can be considered quantitative, and twelvequalitative (with the means at hand to upgrade them) is strong evidencethat the phase of generalization discussed in Section 3.3 is indeed far
advanced. Specifically, the established practices of using fatty oils,mineral oils, bronze-on-steel (7.1) leaded systems (7.2) and good break-in (7.10) have been given explanations which the writer feels are consider-
ably sounder than any previous attempts. While less complete, the attemptat explaining the effect of calcium compounds (7.3) also represents adistinct advance in explaining an accepted practice.

- 216 -
TABIE 7-VII
SUMMARY OF EXPLANATIONS FOR THE ANOMALIES IN SECTION 7
Sub-
Section Anomaly Applicable Models and Notes Adel Uay__ I7.1. Base Case - Fatty oils III B and C + V B
- Mineral oils III 1) + V B- Bronze on steel IV A
7.2 Lead IV A7.3 Calcium II C + Lattice matching C -7 4 Iodine "Temporary polymer" D 47.5* Blends III C and D + V B 37.6 Additive Competitlon II C, III C and 1) B
7.7 Humidity and Oxygen I, II, lII, IV, VI, and VII C I7.8 Transition to Scuffing II, 111 B-C-U, IV and V A
7.9 Additives and Fatigue III C and VI C
7.10 Break-in III B, C and D, plus physical smoothing B j
7.11.1 Low Friction in Transmissions III C + V B7.11.2 Anomalous Wetting Energy 11 A7.11.3 Group B Metals IV and hexagonal theory A
7.11.4 Stearic Acid Multilayers II A
7.11.5 Freshly Purified Cetane III C B
7.11.6 Complex Phosphates III E 1)
7.11.7 Diesel Scuffing III C A
7.11.8 Particle Suspension VI 1) B
7.11.9 Delay of Transition I B
7.11.10 Gold-Oxygen Layer 11 B C ,
7.11.11 Water Solution Lubes III C 2
7.11.12 Bifurcated Data Statistical theory 1)
7.11.13 Titanium Hexagonal theory A I7.11.14 Austenite vs. Martensite Not explained
Counted as three cases (7.5.1 on LP alloys,7.5.2 on silicone blonds and 7.5.3 onaliphatic-aromatic blends.)
** Adequacy ratings: A = QuantitativeB
= QualitativeC = Plausible1) = SpLt"ilative

- 217 -
While the scuffing transition (7.8) was rated "A", it would have
been more satisfying if one model had won out over all others. However,the results ern be interpreted as providing several routes to preventingscuffing; there may not be a single "best answer." This anomaly clearlydemands farther research, as does the closely related delay (7.11.9).
One other "A" rating deserves special mention. It appearsto the writer that a perfectly valid explanation for diesel scuffing(7.11.7) has been synthesized in the course of this study, and that afew check tests may provide a solution to this vexing problem.
The limitation on the successes with the additive competitionand atmospheric effects (7.5, 7.6 and 7.7) is largely due to the newnessof Model IIID. As further research is made on this complex of chemicalreactions, progress to "A" ratings should be rapid. (Actually, 7.5.2 onsilicones would be so rated, but the forms of Table 7-VIl did not permitsuch fine distinctions).
In the case of titanium friction and scuffing (7.11.13), an"A" explanation does not seem to lead to any easy solution. However,with the problem more clearly stated than in the past, we may hope foradditional progress.
The success of Model IV on the "Group B" metals (7.11.3) isgratifying, and should lead rapidly to experimentation with other non-scuffing alloys (for use with steel shafts, etc.) that do not containvigorous oxidation catalysts such as copper. All such work will cer-tainly become part of the proposed manual.
The "B" rating on paricle suspension (7.11.8), when raised toan "A" level by further work, could have very dramatic effects on theconcept of oil filtration and cleanliness. If simple additives (Tao 1970)can eliminate abrasive wear, we are at least a year closer to zero-main-tenance design than would be possible by the use of filters.
Other "A" and "B" successes (7.11.1, 7.11.2, 7.11.4, 7.11.5 and7.11.11) can only be counted as advances in general understanding sincethey are too specialized to provide much meat for manual writing. Thesame applies to some less successful explanations (7.11.6, 7.11.10,
: 7.11.12, 7.11.14).
Elevation of the friction-reduction by iodine to "A" statuscould be a major break-through, or not, depending on the nature of thesolution. The ad hoc model proposed (7.4) would lead to a whole newclass of additives, if verified, and yield some very easy routes tolow friction and wear. If this theory of temporary electron-transferbondr leads to lubricants as maintenance-free as the synovial fluid inanimal joints, the proposed design manual could be quite brief.
I I I I

- 2i8 -
Finally, the lack of complete success on fatigue (7.9) needsattention, even though rolling fatigue is still a minor problem becauseof other failures predominating. A clear-cut solution to this anomalymight well open up routes to sliding fatigue, thus solving some problemswith Model I and delay of transition (7.11.9) and bringing the designmanual closer.
7.13 Immediate Applications of Anomalies
It would seem desireable to take advantage of as many of theanomalies as possible without waiting for further research. In a fewcases, this should be possible.
7.13.1 Lead
Fro, all indications, the use of leaded alloys, platings andlubricants could be considerably expanded. In spite of the currentpopular hysteria on this metal, its use does not often creath, environmentalproblems, and there are many precedents to support this statement.(Actually, the incentive for lead-free gas-oline is to prevent damage tothe catalytic mufflers soon to be added to cars; toxicity appears to bea minor problem.) Use in many cases would not involve re-design, butmetely calling for existing alloys and lubricants in unconvention 1 places,in the full expectation of red,:-ed maintenance.
7.13.2 Calcium
The promises are less definite for calcium, but the possibilityof using high-calcium marine diesel type lubricants for other servicesshould not be neglected. They have undoubtedly been tested, but perhapsnot under realistic conditions of break-in.
7.13.3 Diesel Scuffing
While the discussion of this problem in 7.11.7 and 7.12 suggeststhe most probable cause of this problem, it does not provide a solution.The latter must come from observations, such as those by Montgomery (]69)that engines which develop proper "glaze" during break-in do i, L scuff.Hence, addition of anything tending to promote surface resin formation tothe oil, or cylinder wall metal, may b. expected to alleviate the problem.
7.13.4 Particle Suspension
While Model VII is far from complete, it is at least known thatfatty acid will render Fe203 non-abrasive, while octadec .l amine does thesame for Si 2. Any systems suffering from abrasi.1e contamination witheither of these, or similar compounds (A1 20. , etc.) may be expected toshow a dramatic response to these additives.

- 219 -
8. RECOMMENDED RESEARCH PLAN
It is evident that the Models discussed above go a lung waytoward explaining the various phenomena that occur in boundary lubrication,including those classed as "anomalous"; but there is still a considerableway to go before the models will be useful to the designer in assuringone-shot, lifetime lubrication for bearings operating in the boundary regime.
8.1 The Incentives for Further Work
The goal of the recommended effort is to extend the lubricationperiod of Army (and other) vehicles and equipment without incurringexcessive wear - hopefully to the designed lifetime of the equipment.
The Army has a wide variety of lubricaLion needs, most of whichare being attacked by supplying well-standardized lubricants for fieldservicing. However, the life of the lubricated equipment depends uponseveral factors:
I. The correct lubricant at the time and place that relubricationis due,
2. Personnel trained, equipped and motivated to do a proper jobof maintenance,
3. Opportunity to carry out these duties before excessive weartakes place, and
4. Facilities for relubrication without abrasive or watercontamination.
Even under non-combat conditions, the chances of getting all four factorsat once are none too good. As a result, maintenance may come too late, orindeed even be harmful. For example, it has been noted (in civilian vehicles)that 90% of the wheel bearing failures occur within 1000 miles afterrelubrication. This sort of statistic is harder to obtain on militaryvehicles, but it seems unlikely to be more favorable.
On the other hand, the replacement of a sealed-for-life ballbearing requires a minimum of logistics. It carries with it a lubricantselected for that bearing and inserted under ideal conditions at thefactory. The personnel need not be skilled beyond the elementary abilityto recognize and take out a defective unit and replace it with anotherwith the same model number. Application of this technique to engines,gearboxes, etc., will not be easy; but if a lifetime of about five yearswithout excessive wear can be demonstrated - and this is not unreasonable -the result would be a dramatic decrease in POT, logistics problems with onlya modest increase in the logistics of prelubricated-and-sealed spare parts.
-L

- 220 -
Beyond the improvement of logistics, there are clear benefits
to he gained from improved lubrication itself. Jost (1966)has estimated
potential savings (to British industry) of over $ 1,000,000,000per year
from improved lubrication and reduction of friction, the least of which isthe saving in the cost of lubricants; as follows:
ESTIrATI:) PA'I' FIOM BETTER
1,11 1 ,AT 70N
'our-o ~'f :Ivi l- 7 n f Total
reduction in civrgy cotiumption through lower friction 5.4
;'cduct iOn in n inpouer 1 .9
Savi n-s in Ili c,ait cn ts 1.9
Soivil . in rin*t on.'n co and replacement cos ts 44 .7
SaviiFgs of lo,: es consequential upon breakdown 22.3
3;ivne" in iIvestmcnt de to hi'her uTtiligation ratiosMnd grca ter mech,'nical offici ,-Iy 4.3
SIvilng'3 in investnent throulh increased life of machinery 1) . 5
100 .0
Comparable savings should be demonstrable for any large user of lubricatedmachinery.
There are also incentives in the reduction of the amount of
empirical testing that is now necessary to design a new machine element.
Currently, a machine designer will typically select P bearing or a gear
from a commercial catalog, thus automatically determining the metallurgy.
The maintenance engineer selects a lubricant of the viscosity specified
in the machine instruction booklet, and the lubricant formulator modifiesone of his regular p.oducts to fit it if complaints start to build up.Occasionally, there are copferences, on a spot basis, if the machine designerfaces an unusual problem, and there may be an attempt to review some
possibilities before the design is frozen. However, this is all too rare.

- 221 -
Military designing differs from industrial problems mainly inthat everyone involved knows that the lubricant must, barring exceptionalcircumstances, meet one or another of the existing MIL specifications.There may be some intervention by a technical expert from the procuringagency, if something out of the ordinary is being designed. However, the
tendency is to let the contractor use his best judgement.
Handbook guidance is scanty, and it provides no factors forlubricant quality (other than MIL specs). The result is over-design,except in the aircraft and aerospace fields where weight is of primeimportance. Where such optimization is required, an iterative - andexpensive - shop program is usually employed in which a prototype isbuilt, tested to failure, rebuilt and so on until an acceptable compromiseis achieved.
In none of this is anybody to blame, but it is clear that greateconomies and greatly improved performance could be achieved if it werepossible to DESIGN for zero maintenance in lubricated military equipment.The program recommended herein offers promise of such design.
8.2 Forecast of Possible Achievements
At present, we have seven mathematical models which partiallypredict the wear which will be experienced by a given bearing with agiven load, a given metallurgy and a given lubricant. Seven differentmodels are needed because each one essentially describes a single modeor mechanism of wear and all of them are important. The bearing, of
course, sees all the modes - or whichever one happens to dominate - anda complete model would have to be a synthesis of all the fragmentary models,with suitable coefficients so as to yield the correct net wear rate in areal condition.
It now appears that such a synthesis could be made, given someadditional theoretical work and some additional data; which would accountfor wear as it is normally encountered over the whole range of metallurgy,lubricants and conditions which are used. More significantly, such acombined model would also explain the anomalously low wear rates which aresometimes encountered and would open the way to obtain such low wear rateson a routine basis. And that would improve the normal wear expectancy tothe point that heavy-duty military machinery could be designed to run untilobsolete without the necessity for any field re-lubrication or wear-causedrepairs.
The above is quite a realistic expectation. Many anti-frictionbearings are already being supplied factory-lubricated for life, and someautomobile engines have already been run as long as 60,000 miles withoutrelubrication and without appreciable loss of performance.

- 222 -
The development of the model is a realistic expectation, too.Each of the seven component models accounts for a wear mode at leastqualitatively, and some give good quantitative predictions. They alsoaccount, at least qualitatively, for nearly all the known instances ofextraordinarily good lubricant performance. It certainly appears thatforeseeable programs - detailed in the next sections - can probably lead to a.complete and quantitative description of wear which will take into accountall significant factors of metallurgy, lubricant and environment.
However, one more step is needed. A mathematical model, whilean essential step in the development of the technology, is not a tool whichis useful to shop people and machine designers. it needs to be translated,or converted, into a design manual useable by practical people, a manual
which will provide charts of metallurgy vs. lubricant, load vs. wear,environment vs. additives --- all the working details necessary for a designerto engineer a bea ne-lubricant system to meet his requirements.
The writing of such a manual would be a painstaking task, but itwould be quite feasible with the aid of the completed boundary lubricationModel. It is estimated that the model could be completed in approxitatelytwo years, given the requisite resources, and that the Design Manual couldbe completed in approximately one more year.
8.3 The Plan of Attack
What is required is a design manual which will take into accountall the variations in bearing metallurgy and geometry, in lubricant chemistryand physical properties, and in surrounding atmospheres. With such amanual, a machine designer could engineer a bearing-lubricant element asa system, with confidence that it will have an acceptable failure-freelifetime without the necessity for periodic maintenance. Such a manualcould be written if the model discussed above were extended and quantifiedas now seems possible.
A program to arrive at a design manual would encompass threeinter-related phases:
* Fill in the Remaining Gaps in the Models
The various models havo been carried about as far as they can bewith existing data resources, but there are still some important
gaps in their coverage of the boundary phenomena. These gaps need
to be filled in by further theoretical work and by further analysis of
such data as are available. This task is estimated to require approxi-
mately 15 man-years to accomplish.
* Test the Models by Crucial Laboratory Experiments
In several instances, laboratory data are needed to furnish numericalcoefficients for the symbolic equations already worked out, and thesemust be obtained in close consultation with the theoreticians. Thereare also cases where it is not yet possible to choose between twoalternate formulations kt modelsand data are needed to select theright, or best, one. This task is estimated to require approximately6 man-years to accomplish.

- 223 -
a Write the Design Manual
Translate the completed and quantified mathematical models intoa form useful and intelligible to industrial factory designersand military planners. This task is estimated to require approxi-mately 1.5 man years to accomplish.
In view of the great benefits to be derived by the field users, itis recommended that the completion of this work be considered at an early date.It is also suggested that sponsorship be shared by all the Armed Forces, NASAand DOT, under the general leadership of the Army, since all will benefit fromthe advent of zero-maintenance vehicle bearings.
i
I
.II
II

- 224 -
APPENDIX I
NOMENCLATURE
Some symbols which appear only on one page of the text are definedthere but not in this Appendix. Certain symbols which are used only for sur-face properties in Appendices III-VI are also omitted from Appendix I.
LATIN
A - Arrhenius (pre-exponential) constant; length of cylindrical contact -IA - projected bearing areap 2At = cross-sectional area of wear track (cm
A - work of adhesion (ergs/cm )122B = electric charging energy of metal (ergs-cm2)c - additive concentration in mole fraction
C,C' = constants in finite wear equations
C1C2,C 2 a constants in metal compatibility equations
Ca - concentration of abrasive powder (%)
Cm = constant for metal in abrasive wear equation
Co = oxygen concentration in lubricant (gm/gm)
d = sliding distance (cm)
d = zero-wear sliding distance (cm)o
D = surface roughness (pin or pm)
D = surface roughness after running in
E - energy (heat of adsorption (cal/mol or ergs/cm2 )AE = difference in heat of adsorption of additive (Ea) and base
fluid (Eb) (cal/mol)
E,E = energy of adsorption on rider and specimen (cal/mol)ry sEVE 2 - Young's modulus of solids (psi)
IE' (1 -12)/E 1 + U - V 2)/E2F = coefficient of friction
G allowable fraction of T for zero-wear
G = G for 2000 passes
h = Planck's constant (6.5 x 10 erg sec)
h = critical thickness of corrosion products film (cm)C
h = specific film thickness
H = Hertz contact dimension (in or cm)
AH = heat of sublimation (cal/gm mol)
AH = heat of vaporization (cal/gm mol)

- 225 -
J - mechanical equivalent of heat (ft lb/BTU)k- Boltzman's constant (1.4 x 10⁻¹ 6 ergsldeg C)
k - "wear coefficient" for metal-metal contact areamk 1k 2 thermal conductivities (cal/sec-cm-'C); in 5.1.1, (BTU/ft-hr-CF)
K - specific wear rate (archard constant)
K . specific wear rate due to fatiguef,
K2 interfacial wetting factor
L - number of revolutions or strokes
L - L for zero-wear period0M - molecular weight (gm/mol)
n - number of molecules per unit area (cm-); exponent of load insimplified wear equations
N - number of passes
N - Avagadro's numbera
N - N for zaro-wear0
p - exponent of velocity in simplified wear equations
"PV" - apparent pressure (W/A) times velocity (lb/ft-sec)" k 2
qo maximum stress in Hertz contact area (psi or kg/mm
Q - activation energy for oxidation of metal (cal/mol)
r = 1/(i/r + I/r2 ), the harmonic mean of surface radii (in or cm)
r,r 2 = individual radii of surfaces (in or cm)
R - molar gas constant (cal/mcl-*K); R' is same (ergs/mol-0 K)
S = distance traveled per revolution or stroke (in or cm)
AS = total entropy change associated with adsorption (eu)
t = time (sec)
t = vibrational time of adsorbed molecule (sec)o
T = bulk temperature of lubricant (°K)b
T = critical temperature (°K)c
T = melting point (°K)mT = temperature of surface (°K)
S
Tt = transition temperature at scuffing (oK)
U = sliding velocity (cm/sec)
V = wear volume (cm3)
V = molar volume (cm3/mol)n
w = width of wear track (cm ur in)
w = w for end of zero-wear period (cm or in)0
W = load (gms or. lbs)W1 = load carried by asperties (lb)

- 226 -
W - load carried by EHD film (lb)2x - ratio of molar diameters
X - diameter of adsorbed molecule (cm)
X3 - mole fraction of alloying component
NOMENCLATURE - GREEK
A - fractional film defect (for additive in Model II C)
arasW fractional film defects on rider and specimen
- fractional base fluid film defect
y - von Mises friction function for plastic flow (1 + 3F )0 .5
Y= surface free energy of lower phase (ergs/cm 2)2 surface free energy of upper phase (ergs/cm2)
Y3 -surface free energy of second component in blend or alloy (ergs/cm)
Y12 interfacial free energy (ergs/cm2 )Ym surface free energy of blend or alloy (ergs/cm
2 )
6D London force solubility parameter (cal/cm 3)0 5
6 electron transfer (H-bond) contribution to solubility parameterH (cal/cm3)0 .5
1,6 2 = solubility parameters of metal pair (cal/cm3 )0 .5
= - dielectric constant of lubricant; resistance to wear in 5.9
0= viscosity at entrance (bulk) temperature (poise)
nl - viscosity at surface temperature
0 - contact angle (deg)
61 = asperity slope (deg)
1i, 2 = Poisson's ratio of solids
= thickness of lubricant film ( in or m)
p = density of oil (gm/cm3 )
Po = at 60'F (15'C) (gm/cm 3 )
a = surface stress (ergs/cm2)T - maximum shear stress in contact area (psi)max
T = yield stress in shear of solid (psi)y= fractional surface coverage by additivet ratio V (oxide)/V (metal)
m m¢= volume fraction of higher solubility parameter metal
APPENDIX 1I
BIBLIOGRAPHY
Akin, L. S., "An Interdisciplinary Lubrication Theory for Gears - withparticular emphasis on the scuffing mode of failure", GeneralElectric Co., Marine Turbine and Gear Dept., West Lynn, Mass. (19?1).
Akhmatov, A. S., "Molecular Physics of Boundary Lubrication", Moscow (1963)(Translation available from Israel Program for Scientific Transla-tions, Kiryat Moshe, P. 0. Box 7145, Jerusalem, Israel.)
Allen, C. M., and Drauglis, E., "Boundary Layer Lubrication: Monolayer orMultilayer", Wear, 14, 363 (1969A).
Allen, B. C., "The Surface Free Energy of Solid Molybdenum", J. Less Com. Met.17, 403 (1969B).
Allur, K. C., and Forbes, E. S., "The Load-Carrying Mechanism of Organic SulfurCompounds - Application of Electron Probe Microanalysis," ASLE Trans.11, 162-175 (1968).
Anderson, J. L., Baker, R. A., and Forbes, J. F., "Application of EvaporativeRate Analysis to the Surface Properties of Metals", J. Coll. andInterface Sci. 31, 372-381 (1969).
Arderson, J. L., "Evaporative Rate Analysis (ERA) Symposium", Org. Coat. Plast.Chem, ACS Preprint 30, No. 1, 442-457 (1970).
Anonymous, "The Long, Hot Slide from Tokyo to Osaka", Ind. Res. 12, No. 2, 56
(Feb. 1970).
Antler, M., "Otganometallics in Lubrication", I&EC 51, 753-758 (1959).
*Antler, M., "The Lubrication of Gold", Wear 644-65 (1963).
Antonoff, G,, Chanin, M. and Hecht, M., "Equilibria in Partially MiscibleLiquids",J. Phys. Chem. 46, 492-499 (1942).
Appeldoorn, J. K. and Royle, R. C., "Lubricant Fatigue Testing", LubricationEng. 21, 45 (1965).
Appeldoorn, J. K., Campion, R. J., Tao, F. F. et al., Tech. Rep. AFAPL -
TR-66-89, Part I (August 1966).
Appeldoorn, J. K. and Tao, F. F., Tech. Rep. AFAPL-66-89, Part II, (September1967A).
Appeldoorn, J. K., "Physical and Chemical Aspects of Boundary Lubrication",Erdoel Kohle, 20, 559 (1967B).
*Appeldoorn, J. K., Goldman, I. B. and Tao, F. F.; Tech. Rep. AFAPL - TR-66-89,Part III (July 1968A).
Appeldoorn, J. K. and "Tao, F. F., "'he Lubricity characteristics of HeavyAromatics", Wear, 12, 117 (1968B).
Appeldoorn, .. K., Goldman, I. 13. and Tao, F. F., "Corrosive Wear by AtmosphericOxygen and Moisture", ASLE Trans. 12, 140 (19b9)

- 228 -
Archard, J. F. and Hirst, W., "The Wear of Metals Under Unlubricatod Condi-tions", Proc. Roy. Soc. A236, 397-410 (1956).
*Archard, J. F., "Elastic Deformation and the Laws of Friction", Proc. Roy.
Soc. A243, 190-205 (1957).
*Archard, J. F., "The Temperature of Rubbing Surfaces", Wear, 2, 438 (1959).
Askwith, T. C., Cameron, A., and Crouch, R. F., "Chain Length of Additivein Relation to Lubricants in Thin Film and Boundary Lubrication",Proc. Roy. Soc., 291A, 500-519 (1966).
*ASTM, "Symposium on the Properties of Surfaces", STP 340, Amer. Soc. Test.
Mat,, Philadelphia, 1963.
ASTM Annual Book of Standards, Parts 17 and 18, Amer. Soc. Test. Mat..Philadelphia, 1970.
ASTM, "Hydraulic System Cleanlin_,ss", STP 491, Amer. Soc. Test. Mat.,Philadelphia, 1971.
Babb, S. E., Jr., "Parameters in the Simon Equation Relating Pressure andMelting Temperature", Rev. Mod. Phys. 35, 400-413 (1963).
Babichev, M. A., "Investigation of the Abrasive W4ear of Metals by the BrinellMethod", Fric. and Wear in Mach., (transl. by ASME) 14, 1-29 (1962).
Bagley, E. B., Nelson, T. P. and Scigliano, J. M., "Three-Dimensional Solubil-ity Parameters and Their Relationship to Internal Pressure Measure-ments in Polar and Hydrogen-Bonding Solvents", j. Paint Tech., 43,No. 555, 35 (1971).
Bayer, R. G., Clinton, W. C., Nelson, C. W. and Schumacher, R. A., "Engineering
Model for Wear", Wear, 5, 378 (1962).
Bayer, R. G., "Prediction of Wear in a Sliding System", Wear, 11, 319 (1968A).
*Baver, R. G. and Schumacher, R. A., "On the Significance of Surface Fatigue inSliding Friction", Wear, 12, 173 (1968B).
Bayer, R. G. and Ku, T. C., Personal Interview, A-ril 22, 1970.
Beatty, H. A.. "Organolead Compounds as Lubricant Additives", First Int. Conf.on Organolead Chem. and Its Applns., U. S. Army, Natick Labs (1967).
Beerbower, A. and Dickey, J. R., "Advanced Methods for Predicting Elasromer-Fluids Interactions", ASLE Trans. 12, 1-12 (1969).
Beerbower, A., "A Critical Survey of Mathematical Models for Boundary Lubri-cation", ASLH Trans. 14, 90-104 (1971A).
Beerbower, A., "Surface Free Energy: A New Relationship to Bulk Energies",J. Coll. Interf. Sci. 35, 126-132 (1971B).

eLrI))W ,r, A,\. nix! l ll, , >1, ., 'iii. ( vh,.v tin rlyV Pt jo of Emiilsiona - A
Fundame'ntal Basis for the I[LB Concept", McCutcheon 's DetergenLS and
Emulsifiers Annual (1971C).
Beerbower, A. and coldblatt, I. L., "An Interpretation of Wear Observed with
Natural Hydrocarbons", wear 18, 421-425 (1971D).
Beerbower, A. and Panzer, J., Con, sents on "Interaction Between Lubricants and
Plastic Bearing Surfaces", Wear 18, 481-487 (1971E).
Beerbower, A. and Garabrant, A. R., Comnents on "Influence of Water Vapour on
the Wear of Lightly Loaded Contacts", Wear 18, 492-496 (1971F).
Beerbower, A., Consents on "Ordered Multilayered Films: Key to Effective Lubri-
cation", by C. M. Allen, E. Drauglis, and N. F. Hartman, awaiting
publication in ASLE Trans, (1972A).
Beeroower, A. "The Environmental Capabil.ity of Liquid Lubricants", NASA
Symposium, on liquid Lubricants, awaiting publication (19723).
Begelinger, A., "Questionnaire on the Relation Between Surface Condition and
Friction, Wear and Lubrication - Sumnary Report", Metaalirstituut TNO,
Delft, Netherlands (Sept. 1969).
Bernett, M. K. and Zisman, W. A., "Effect of Adsorbed Water on the CriticalSurface Tension of Wetting on Metal Surfaces", J. Coll. and Interf.Sci., 28, 243-249 (1968).
Berry, W. E., "Stress-Corrosion Crocking and Its Relation to Petroleum Industry
Materials", W. Va. Univ. - Tech. Bull. 86, p. 416, Oct. 1967.
Bewig, K. W. and Zisman, W. A., "Surface Potentials and Induced Polarization in
Nonpolar Liquids Adsorbed on Metals", J. Phys. Chem. 68, 1804-13(1964).
l'.eber, It. E., Klaus, E. E. and Tewksbury, E- J., "A Study of Tricreyl Phos-phate as an Additive for Boundary Lubrication", ASLE Trans. 11, 155-
161 (1968).
Bigelow, W. C., Glass, E. and Zisman, W. A.. "Oleophobic Monolayers. II.
Temperature Effects and Energy of Adsorption", J. Coll. Sci. 2, 563 (1947)
Bikerman, j. J., "Thermodynamics, Adhesion and Sliding Friction", I. Lubr.Tech. (Trans. ASME Ser. f) 42, 243-247 (1970).
*bisson, E. E. and Anderson, W. J., "Advanced Bearing Technology", NASA SP-38,1964.
Blakely, J. H. and Malya, P. S., "Surface Energies from Transport Measurements",
in "Surfaces and Interfaces I - Chkmical and Physical Characteristics",
J. J. Burke, N. L. Reed and V. Wiss, eds., Proc. 13th Sagamore ArmyMat. Res. Conf., Syracuse U. Press 1966.

- 230 - jBlanks, R. F., and Prausnitz, J. M., "The Thermodynamics of Polymer Solubility
in Polar and Nonpolar Systems", I&EC Fundamentals, 3, 1 (1964).
Block, A. and Simms, B. B., "Desorpt:ion and Exchange of Adsorbed Octadecylamineand Stearic Acid on Steel and Glass", J. Coll. atnd Interface Sci. 25,
514-518 (1967).
Biok. H., "Surface Temperature Under Extreme Pressure Conditions", Second WorldPetrol. Cong., Section 4, Paris (1937).
Blok, H., "The Postulate About the Constancy of Scoring Tomperattr "', 153-248,Proc. Interdisciplinary Ap roach to the Lubrication of ConcentratedContacts, NASA SP-237, Washington, D.C. (1970).
Bodensieck, E. J., "Specific Film Thickness - An Index of Gear Tooth SurfaceDeterioration", Preprint, Aerospace Gear Comm., AGMA Neetirtg,Sept. 13-14 (1965).
Bond, G. C., "Catalysis by Metals", Academic Press, London and New York, 1962.
Bond, G. C., "Adsorption and Coordination of Unsaturated Hydrocarbons withMetal Surfaces and Metal Atoms", Disc. Farad. Soc. No. 41, 200 (1966).
Bond, G. C., Personal Interview (March 25. 1970).
Bnndi, A., "The Spreading of Liquid Metals on Solid Surfaces", Chem. Rv. 52,417-458 (1953).
Bondi, A., "Physical Properties of Molecular Crystals, Liquids and Glasses",John Wiley & Sons, 1968.
Boner, C. J., "Manufacture and Application of Lubricating< Greases", Reinhold,N.Y. 1954.
Bowden, F. P. and Tabor, D., "The Friction and Lubrication of Solids", OxfordUniversity Press, London and New York, 1950.
*Bowden, F. P., and Tabor, D., "Friction and Lubrication", John Wiley and Sons,
NY., 1956.
*Bowden, F. P. and Tabor, D., "The Friction and Lubrication of Solids", Claren-don Press, Oxford, 1964.
Bowers, R. C., Cottington, R. L., Thomas, 1. N. and Zisman, W. A., "BoundaryLubrication Studies of Typical Fluoroest -rs", Lubr. Eng. 12, 245(1956).
Bradley, A., "Organic Polymer Coating Deposited from a Gas Discharge", Ind.Eng. Chem. Prod. Res. Develop., 9, l, 101 (1970).
*Brewer, L., "Prediction of High Temperature Metollic Phase Dia'rams, in "HighStrength Materials", V. F. Zackay, ed., Wiley, 1904.
Brockly, C. A. and Fleming, c. K., "A ode] Ju',cti¢n Study of stvere MvtallicWear", Wear 8, 3/4-380 (1965)

- 2A -
*Brophy, J. E., Militz, R. 0. and Zisman, W. A., "I)imethyl-Silicone-Polymer
Fluids and Their Performance Chiaracteristics in Unilaterally Loaded
Journal Bearings", Trans. AS.1 68, 355 (1946).
Brown, E. D., "Methyl Alkyl Silicones. A New Class of Lubricants", ASLE Trans.9-31-35 (1966).
Brown, E. D. and Owens, R. S., "The Development of a Non-Corrosive Non-ToxicIodine Containing Lubricant and Cutting Fluid", Div. Petr. Chem. ACSPreprint 13, B5-B14 (1968).
Brown, E. D., Jr., "Effect of Temperature on Lubricity of Lubricating Silicones,"Wear 15, 131-135 (1970).
Bryant, L. F., Speiser, R. and Hirth, J. P., "Some Interfacial Properties ofFcc Cobalt", Trans. of the Metallurgical Soc. AIME 242, 1145 (1968).
Buckley, D. H. and Johnson, R. L., "Friction and Wear of Hexagonal Metals andAlloys as Related to Crystal Structure and Lattice Parameters inVacuum," ASLE Trans. 9, 121 (1966).
Buckley, D. H., "A LEED Study of the A,1hesion of Cold to Copper and Copper-Aluminum Alloys", Tech. Note D-5351, NASA, 4ashington, D.C. (Aug. 1969).
Buckley, D. H1., "Interaction of Methane, Ethane, Ethylene and Acetylene with an
Iron (001) Surface and Their Influence on Adhesion Studied with LEEDand Auger", Tech. Note D-5822, "ASA, Washington, D.C. (May 1970).
*Buckley, D. H., "Friction, Wear and Lubric.tion in Vacuum", NASA SP-277,
Sci. and Tech. Inf. Off., NASA, Washington, D. C. 1971
*Cameron, A., "Principles of Lubrication", Longmans, London 1966.
Campbell. W. E., Pilarczyk, K. and Papp, C. A., "Effect of Wettability of aLubricant on Journal Bearing Performance", Proc. Conf. Lubr. & Wear,ITE, London, 46-52 (1957).
Campbell, W. E. and Lee, Jr., R. E., "Polymer Formation on Sliding Metals inAir Saturated with Organic Vapors", ASLE Trans. 5, 91 (1962).
Carr, D. S., "Organelead Lubricant Additives", Ini. Lubr. 19, #12 463-4 (1967).
Chaikin, S. W., "On Frictional Polymer", Wear 10, 49 (1967).
Christensen, H., "Some Aspects of the Functioaal Influence of Surface Roughnessin Lubrication", Wear 17, 149-162 (1971).
Clayfield, 1.. J. eL al, "The Spreading Pressures and Works of Adhesion ofLiquid Hydrocarbons on Chrome-Steel and Chromium Surfaces", Secondnt. Cong. of Surf. Act., Butterworths, London (1957A).
Clayfie]d, ,. J., Matthews, .1. B. and Whittml, T. V., "The Importance of Oil-Metal Adesiina in Lubrication", Pr, c. Conf. Lubr. & Wear, IE, London,326-332 (1957B) I

-232
*Cocks, M. and Tallian, T. E., "Sliding Contacts in Rolling Bearings", ASLETrans. 14, 32-40 (1971).
Coffin, L. F., Jr., "A Study of the Sliding of Metals, with Particular Referenceto Atmosphere", Lubr. Eng. 12, 50 (1956).
*Coleman, V., "Gcer Design Cons iderat ions", p. 551, Interdise. Appr. to the Lubr.of Conc. Cont., NASA SP-237, Washington, D.C. (1970).
Cornelius, D. F. and Roberts, W. H., "Friction and Wear of Metals in Gases upto 600 C", ASLE Trans. 4, 20-32 (1961).
Crook, A. W., "Some Studies en Weair and Lubrication", Wear 2, 364-393, (1958-59).
Currie, C. C. and H-omrel, M. C., "Boundary Lubricating Character is ties of Organo-polysiloxanes", Ind. Eng. Chem. 42, 2452-6 (1950).
Dal, P. H. and Berden, W. J. If., "Bound Water on Clay", Science of Ceramics 259-79 (1965).
Davies, R. L, and Morris, A., Eqse Pet. Ltd., personal interview ksept. 22, 19b9).
*Davis, K. A., "A Study of the Effectiveness of Selected Antiwear Additives inSynthetic Esters", Air Force Maturials Laboratory Technical ReportAFML-TR-69-301 (July, 1970).
de Boor, J. H., "Mobility Of Molecules along Adsorbing Surfaces", from "MolecularProcesses on Solid Surfaces", 'McGraw-lill, New York, 1968.
do Gee, A. W. j., Vaessen, C. It. G. and Beglinger, A., "The Influunct, of Comn-position and Structure on the Sliding Wear of Copper-Tin-Le0ad Alloys",ASLE Trans. 12, 44 (1969),
do Gee, A. W. J., Vausseti, G. H. G. and Begelinger, A., "Influence of Phosphoruson the Load Carrying Capacity under Boundary Lubrication Conditions ofCopper-6 Tin", ASLE Trans. 14, 116-123 (1971).
Domorest, K. E., and Whitaiker, A. E., "Effect of Various Lubricants and BaseMaterials on Friction ait Ultrahigh Loads', ASLE Trans. 9, 160-170(1966).
LVemorest, K., P Lrsonal interview (August 18, 1969).
Devine, M. J1. and Sander, L. F., "Tntoratomic Spacing concept for Solid Lubricant-Metal Systems", presentod at Symposium on Chemistry of Lubrication,Division of Petroleum Chumistry, Inc., Armer. Chem. Soc., San Francisco,Calif. (April 1908).
Dicko:,rt, 1. .1. and Rowe,. C. N., "Dtpoit ion of Gold on Rubbing Surfaces", NaturePhys. sci. 231, 87-88 (May 24, 1971).
, 33
Dietrichi, V. I. and Honrath-Barkhausen, M.: "Zur Bildung widsrstands.'rbl~hnderBelUge organishen Ursprungs auf olektrischen Kontakten, Zeit." furAngw. Phys., vol XI, Heuft 10, 399 (1959).
Donald, D. K., "Contribution of Charge to Powder Particle Adhesion", Org. coat.& Plas. Chem. ACS Preprint 31, No. 2, 47-54 (1971).
Dowson, D. and Higginson, G. R., "Elastohydrodynamic Lubrication", PergamonPress, New York, 1966.
Duckworth, W. E. and Forrester, P. G., "Wear of Lubricated Journal Bearings",Proc. Conf. on Lubr. and Wear, IME, London, 1957.
Dudley, D. W., "Information Sheet - Gear Scoring Design Guide for Aerospace Spurand Helical Power Gears", AGMA 217.01, Am. Gear Manuf. Assoc., Washing-ton, 1965.
Duga, J. J., "Surface Energy of Ceramic Materials", DCIC Report 69-2, AD691019,
Clearinghouse, Springfield, Va., 1969.
du Pont, Petroleum Chemicals Division, "ILP Alloys - Bulletin No. 1", May 1971.
FEberhart, J. G., "The Surface Tenion and Critical Properties of Liquid Metals"J. Col,. and Interf. Sci. 33, 191-2 (1970).
Ehrlich, G., "Atomistics of Metal St'rfaces", in "Surface Phenonlena of Metals',S-C I.- Monograph No. 28, 13-38 (19611)
Lischens, R. P., "Catalytic Studies Related to Boundary Lubrication", in "Bound-ary Lubrication: An Appraisal of World Literature", F. F. Ling,E.- E. Klaus and R. S . Fein, eds., ASME, 61. 1969.
Ernst, H. and Merchant, M. E., "Surface Friction of Clean Metals - A Basic Factorin the Metal Cutting Procoss", Proc. Spec. Suimm. Cox~f. on Frict. andSurf. Fin., MIT Press, 76-101 (1940).
Ernst, H. and Merchant M. E., "Chip Formation, Friction and High-Quality Ma-chined Surfaces", Surface Treatment of Metals, Trans. ASM 29, 299(1941).
Eudier, M. and Youssef, H., "Considerations on the Theory of Friction: FrictionWithout Wear", Powd. Met. 12, No. 24, 462-470 (1969).
*Evdokimov, V. D., "Exoelectron Emission in Sliding Friction," Dokl. Akad. Nauk,USSR, 175, 563 (1967).
Everett, D. H., "Thermodynamics of Adsorption from Solution. Part 2 -Imperfr'ct
Solutions", Trans. Faraday Soc. 61, 2478 (1965).

- 234 -
*Fein, R. S., "Transition Temperatures with Four Ball Machine", ASLE Trans. 3,
34 (1960).
*Fein, R. S. and Kreuz, K. L., "Chemistry of BounJary Lubrication of Steel byHydrocarbons", ASLE Trans. 8, 29 (1965A).
Fein, R. S., "Effects of Lubricants on Transition Temperature", ASLE Trans. 8,59-68 (1965B).
Fein, R. S., "Operating Procedure Effects on Critical Temperature", ASLE Trans.I0, 373-385 (1967).
*Fcin, R. S. and Kreuz, K. L., "Cyclohexane Vapor Lubrication of Steel", ACS Div.of Pet. Chem. Preprints, 13, [327 (1968).
*Fein, R. S., "Chemistry in Concentrated-Conjunction Lubrication", p. 489,
Interdisc. Appr. to the Lubr. of conc. Cont., NASA SP-237, Washingtei,D.C. (1970).
Feng, I-M., "Metal Transfer and Wear", J. Appl. Phys. 23, 1011 (1952).
Feng, I-. and Rightmire, B. C., "The Mechanism of Fretting", Lul-ricaLion Engineer-ing 9, 134 (June 1953).
Feng, I-M., "A New Theory of Metal Transfer and Wear", Lubrication Engineering10, 34-8 (1954A).
Feng, I-M. and Uhlig, H. H., "Fretting Corrosion of Mild Steel in Air and inNitrogen", J. Appl. Mech. 21, 395-400 (1954B).
Feng, I-M., "An Analysis of the Effect of Various Factors on Metal Transfer andWear Between Specimen Pairs of Same Metal and Same Shape, I. TheBasic Scheme of Formulation of 'Motal Transfer and Wear", J. Appl. Phys.26, 24 (1955). II. "Effect of the Surrounding Atmosphere", J. Appl.Phys. 2b, 28 (1955).
Feng, I-M. and Rightmirc, B. G., "An Experimental Study of Fretting", Inst. Mech.Eng. 170, 1055-60 (1956A).
*Feng, I-M. and Chang, C. I., "Critical Thickness of Surface Film in BoundaryLubrication", J. Appl. Mech. 23, 458-460 (1956B).
*Feng, I-M., "The Influence of Surface Activity on Friction and Surface Damage",Proc. Second international Congress of Surface ACkivity, III, 539
Acadetnic Press, New York, 1957A.
Feng, I-M., "Plastic Roughening and Wear", International Conference on Lubrica-tion and Wear, Inst. Mech. Eng. October 1-3, 1957B).

- 235 -
Feng, I-M., "Mechanisms of Wear", Symposium on the Chemistry of Solid Surfaces,OOR, 1958.
*Feng, I-M., "Pyrolysis of Zinc Dialkyl Phosphorodithionates", Wear 3, 309-(1960).
*Feng, I-M. and Chalk, H., "Effects of Gases and Liquids in Lubricating Films onLubrication and Surface Damage", Wear 4, 257-68 (1961).
*Feng, I-N., "A New Approach in Interpreting the Four-Ball Wear Results", wear 5,275 (1962).
Feng, I-M., Perilstoin, W. L. and Adams, M. R., "Solid Film Deposition and Non-Sacrificial Boundary Lubrication", ASLE Trans. 6, 60-66 (1963).
Finkin, E. F., "The Sliding of Copper-Based Sintered Material Against Steel inParaffinic Mineral Oil", Wear 11, 341-353 (1968A).
Finkin, E. F., "Abrasive Wear", in "Evaluation of Wear Testing", Spec. Tech.Pub. 446, Amer. Soc. Test. Mat., (1968B).
Fitch, E. C., "Requirements for an Effective Program in Fluid ContaminationControl", ASTM STP 491, pp. 39-49 (1971A).
Fitch, E. C., "The Compatibility of Hydraulic Power Components with ContaminatedFluid Environments", Deutsche Messe- u. Ausstellungs-A, Abt. Vb -copies available from author at School of Mechanical and AerospaceEngineering, Oklahoma State University, Stillwater, Oklahoma 74074(1971B).
-AFitzsimmons, V. G. et al., "Dimethyl-Silicone-Polymer Fluids and Their Perform-ance Characteristics in Hydraulic Systems", Trans. ASMIE 68, 361 (1946).
Forbes, E. S., Allum, K. G., Neustadter, E. L. and Reid, A. J. D., "The Load-Carrying Properties of Diestor Disulfides", Wear 15, 341-352 (1970).
Fowkes, F. M., "Surface Chemistry", in "Treatise on Adhesives and Adhesion",R. A. Patrick, ed., p. 362, Marcel Dekker, Inc. (1966).
Fowkes, F. M., "Intermolecular and Interatomic Forces at Interfaces", in "Surfacesand Interfaces I - Chemical and Physical Characteristics", Burke, Reed &Weiss, eds., p. 197, Syracuse Univ. Press (1967).
Fowle, T. I., "Interaction Between Bearing Metals and Lubricants", Paper 3, JointCourse on Tribology, The Institution of Metallurgists, London (1968).
Fowles, P. E., personal communication, Nov. 30, 1970.
Fox, P. J. and Soria-Ruiz, J., "Fracture-Induced Thermal Docomposition in BrittleCrystalline Solids", Proc. Roy. Soc. London, A317, 79-90, (1970).
France, W. D., Jr., "Effects of Stress and Plastic Deformation on the Corrosionof Steel", Corrosion-NACE 26, No. 5, 189-199 (1970).

- 236 "
Francis, Ii. A., "Interfacial Temperature Distribution Within a Sliding HertzianContact", ASLE Trans. 14, 41-54 (1971).
Frank, R. G. and Swets, 1. E., "Hydrogen Permeation Through Steel During Abra-sion", J. Appl. Phys., 28, 380 (1957).
Frewitg, J. J., "The Influence of Tempersture on Boundary Lubrication",Proc. Roy. Soc. AI81, 23-42 (1942).
Frewing, J. J., "The Heat of Adsorption of long-Chain Compounds and Their
Effect on Boundary Lubrication", Proc. Roy. Soc. A182, 270-285 (1943).
*Fuks, G. I., "The Polymolecular Component of the Lubricating Boundary Layer",Ibid., 2, p. 159 (1964).
Furey, M. .., "Titanium Coordination Compounds as Corrosion Inhibitors", U.S.Pat. 2,891,910 (June 22, 1959).
*Furey, M. J. and Appeldoorn, J. K., "The Effect of Lubricant Viscosity on Netal-lic Contact and Friction in a Sliding System", ASLE Trans. 5, 149-159 (1962).
Furey, M. J., "Oil Compositions Containing Anti-wear Additives", U.S. Pat.3,180,910 (April 27, 1965).
Furey, N. J., "The Action of Iodine in Producing Extremely Low Friction", Wear9, 369 (1966).
Gans, D. M., "Positive Final Spreading Coefficients", J. Paint. Tech., 42, No.550, 653 (1970).
*Gatos, H. C., "Structure of Surfaces and Their Interactions", in "Interdiscip-linary Approach to Friction and Wear", NASA SP-181, p. 7-84, Washing-ton, D.C. 1968.
Gerdil, R. and Lucken, E. A. C., "Radical Anions Containing Sulfur Atoms in aConjugated System", Proc. Chem. Soc. 1963, 144 (1963).
Getzen, F. W., "Bulk-to-Surface Distribution Coefficient5 and Surface ActivityCoefficients from Surface Tension Measurements", J. Coll . and Interf.Sci, 37, 668-677 (1971).
Gilman, J. J., "Direct Measurement of tha Surface Energies of Crystals", J.Appl. Physics. 31, 2208 (1960).
Ciltrow, J. P., "A Relationship Between Abrasive Wear and the Cohesive Energyof Materials", Wear 15, 71-78 (1970).
Glicksman, M. E. nd Vold, C. L., "Determination of Absolute Solid-Liquid Inter-facial Free Energies in Metals", Acta Met. 17, il, 1-Il (1969). (Seealso cotnents by R. J . Holylev and L. 1. Murr, and response by authors,Scripta Mut. 3, 783-792 (1969)).

- 235 -
Feng, I-M., "Mechanisms of Wear", Symposium on the Chemistry of Solid Surfaces,OOR, 1958. -r
*Feng, I-M., "Pyrolysis of Zinc Dialkyl Phosphorodithionates", Wear 3, 309-(1960)•
*Feng, I-M and Chalk, H., "Effects of Gases and Liquids in Lubricating Films onLubrication and Surface Damage", Wear 4, 257-68 (1961).
*Feng, I-M., "A New Approach in Interpreting the Four-Ball Wear Results", Wear 5,275 (1962).
Feng, I-M., Perilstein, W. L. and Adams, M. R., "Solid Film Deposition and Non-Sacrificial Boundary Lubrication", ASLE Trans. 6, 60-66 (1963).
Finkin, E. F., "The Sliding of Copper-Based Sintered Material Against Steel inParaffinic Mineral Oil", Wear II, 341-353 (1968A).
Finkin, E. F., "Abrasive Wear", in "Evaluation of Wear Testing", Spec. Tech. APub. 446, Amer. Soc. Test. Mat., (1968B).
Fitch, E, C., "Requirements for an Effective Program in Fluid ContaminationControl", ASTM STP 491, pp. 39-49 (1971A).
Fitch, E. C., "The Compatibility of Hydraulic Power Components with ContaminatedFluid Environments", Deutsche Messe- u. Ausstellungs-AG, Abt. Vb -copies available from author at School of Mechanical and AerospaceEngineering, Oklahoma State University, Stillwater, Oklahoma 74074(1971B).
-itzsimmons, V. G. et al., "Dimethyl-Silicone-Polymer Fluids and Their Perform-ance Characteristics in Hydraulic Systems", Trans. ASME 68, 361 (1946).
Forbes, E. S., Allum, X. G., Neustadter, E. L. and Reid, A. J. D., "The Load-Carrying Properties of Diester Disulfides", Wear 15, 341-352 (1970).
Fowkes, F. M., "Surface Chemistry", in "Treatise on Adhesives and Adhesion",R. A. Patrick, ed., p. 362, Marcel Dekker, Inc. (1966).
Fowkes, F. M., "Intermolecular and Interatomic Forces at Interfaces", in "Surfacesand Interfaces I - Chemical and Physical Characteristics", Burke, Reed &Weiss, eds., p. 197, Syracuse Univ. Press (1967).
Fowle, T. I., "Interaction Between Bearing Metals and Lubricants", Paper 3, JointCourse on Tribology, The Institution of Metallurgists, London (1968).
Fowles, P. E., personal communication, Nov. 30, 1970.
Fox, P. J. and Soria-Ruiz, J., "Fracture-Induced Thermal Decomposition in BrittleCrystalline Solids", Proc. Roy. Soc. London, A317, 79-90, (1970).
France, W. D., Jr., "Effects of Stress and Plastic Deformation on the ;'orrosionof Steel", Corrosion-NACE 26, No. 5, 189-199 (1970). i
I
- 237 -
Goddard, J. and Wilman, H., "A Theory of Friction and Wear During the Abrasionof Metals", Wear 5, 114-135 (1962).
Goldblatt, I. L. and Appeldoorn, J. K., "The Antiwear Behavior of TCP in Differ-ent Atmospheres and Different Base Stocks", ASLE Trans. 13, 203-214(1970).
Goldblatt, I. L., "A Model for the Lubrication Behavior of Polynuclear Aromatics",I&EC Prod. Res. and Dev., 10, 270-8 (1971).
Goldman, I. B., "Corrosive Wear as a Failure Mode in Lubricated Gear Contacts",Wear 14, 431-444 (1969).
Goldman, I. B., Appeldoorn, J. K. and Tao, F. F., "Scuffing as Influenced byOxygen and Moisture", ASLE Trans. 13, 29-38 (1970).
Good, R. J. and Elbing, E., "Generalization of Theory for Estimation of Inter-facial Energies", Ind. & Eng. Chem., 62, 54-78 (1970).
Gordy, W. and Stanford, S. C., "Spectroscopic Evidence for Hydrogen Bonds:Comparison of Proton-Attracting Properties of Liquids. Ill."J. Chem. Phys. 7, 93-99 (1939).
Grau, F. E. and Itoh, M. (1966) - quoted in Rabinowicz (1971B).
*Greenwood, J. A. and Williamson, J. B. P., "Contact of Normally Flat Surfaces",
Proc. Roy. Soc. A295, 300-319 (1966).
Greenwood, J. A. and Tripp, J. H., "The Elastic Contact of Rough Spheres", J. ofAppl. Mech., 34, 153 (1967).
Gregory, J., "The Calculation of Hamaker Constants", Advan. Colloid. InterfaceSci. 2, 396-417 (1969).
Grew, W. J. S., "Transition Temperatures of Lubricants", Ph.D. Thesis, ImperialColl. of Sci. and Tech., Sept. 1969.
Griebe, R. W., Winter, E. F. R. and Schoenhals, R. J., "Choking and Shock Phe-nomena in a Single Component Two-Phase Flow Including Vibrational Ef-fects", Warme- und Stoffubertragung, Bd. 3, 7-18 (1970).
t1r se, A. V.. "The Relationship Between the Surface Tensions and Energies ofLi aid Metals and Their Critical Temperatures", J. Inorg. Nucl. Chem.24, 147-156 (1962).
C )sse, '- "The Relationship Between Surface Tension and Energy of LiquidM a's and Their Heat of Vaporization at the Melting Point", J. Inorg.Nuc¢l. Chem.26, 1349 (1964).
-roszti4, A. ., "Preferential Adsorption of Compounds with Long Methylene Chainson Cast Iron, Graphite, Boron Nitride, and Molybdenum Disulfide",ASLE Trans. 9, 67-76 (1966).
Gi.:szek, A. J., "Weir-Reducing Properties of Mineral Oils and Their Fractions",Proc. InsLn. Mech. Eng. 182, Pt 3N, 160-168 (1967-8).
Groszek, A. J., 'eits of Preferential Adsorption of Boundary Additives at Ironand Iron O:ide/'.iquid Hydrocarbon Interfaces", ASLE Trans. 13, 278-287 (1970).

- 238 -
Groszek, A. J., "BP Symposium on the Significance of the Heats of Adsorption at
the Solid/Liquid Interface", BP Research Centre, Middlesex (5th March 1971)
*Groszek, A. J., "Role of Adsorption in Liquid Lubrication", NASA Symposium on
Interdisciplinary Approach to Liquid Iubricant Technology (1972).
Grunberg, L. et al, "Hydrogen Diffusion n Water-Accloritod Rolling SurfareFatigue", Nature 188, No. 4757, 1182-3 (iq6nf).
Guastalla, J., "Recent Work on Surface Activity, Wetting and Dewetting", J.
Coll. and InLerf. Sci. 11, 623-636 (1956).
Hamaker, H. C., "London-van der Waals Attraction Between Spherical Particles",Physica 4, 1058 (1937).
Hamaker, F. C., "London-van der Walls Forces in Colloidal Systems", Rec. Tray.Chim. 57, 61-72 (1938). (In English)
Hansen, C. M., "The Three-Dimensional Solubility Parameter - Key to Paint Com-ponent Affinities", J. Paint Tech., 39, No. 505, p. 105 and No. 511,pp. 505 and 511 (1967).
Hansen, C. M., "The Universality of the Solubility Parameter", I&EC Prod. Res.and Day., 8, 2 (1.969).
Hansen, C. M., "Characterization of Surfaces by Spreading Liquids", J. PaintTech., 42, No. 550, 660 (1970A)
Hansen, C, M. and Beerbower, A., "Solubility Parameters", Encyl. Chem. Tech.2nd ed. Supp. Vol., (1971).
Hansen, R. M. and Gardner, N. C., "A Field Emission Study of the Docompositicn ofAcetylene and Ethylene on Tungsten", J. Phys. Chem. 74, 3466-3453(1970t).
Harkins, W. D. and Grafton, E. H., "Surface Tension and Molecular Attrnction:On the Adhesional Work Between Mercury and Organic Liquids", J. Am.Chem. Soc., 42, 2534 (41920).
*Harkins, W. D. and Cheng, Y. C., "The Orientation of Molecules in Surfaces. VI.Cohesion, Adhesion, Tensile Strength, Tensile Energy, Negative SurfaceEnergy, Interfacial Tension, and Molecular Attraction", .J. Am. Chem.Soc., 43, 35 (1921).
Harkins, W. D. and Loesser, E. H., "Surfaces of Solids-Molecular InteractionBetween Metals and Hydrocarbons", J. Chem. Phys., 18, 556 (1950).
Harris, T. A., "Rolling Bearing Analysis", Wiley, New York, 1966.
Hart, E. J., Gordon, S., and Thomas, J. K., "Rate Constants of Hydrated Elec-tron Reactions with Organic Compounds", .1. Chem. Phys. 68, 1271 (1964).
Helpinstill, J. C. and van Winkle, M., "'Prediction of Infinite Dilution ACtj'jtyCoefficiviis for Polar-Polar Binary Systems", I&EC Proc. Des'gn andDev. 7, 213-219 (1968).
- 239 -
Hermance, H. W. and Egan, T. F., "Organic Deposits on Precious Metal Contacts",Bell Syst. Tech. Journ., 37, No. 3, 739 (1958).
Hildebrand, J. H. and Scott, R. L., "The Solubility of Non-Electrolytes, 3rd Ed,Dover, New York, 1950.
Hoar, T. P. and West, J. M., "Mechano-Chemical Anodic Dissolution of AusteniticStainless Steel in Hot Chloride Solution", Proc. Roy. Soc. A268, 30 4 -.315 (1962).
Hoar, T. P. and Scully, J. C., "Mechanochemical Anodic Dissolution of AusteniticStainless Steel in Hot Chloride Solution at Controlled Electrode Po-tential", J. Electrochem. Soc.lll, No. 3, 348-352 (1964).
Hordon, M, J., "Adhesion of Metals in High Vacuum", in "Adhesion and Cold Weld-ing of Materials in Space Environment", ASTM STP-431, 109-127 (1967).
*Horth, A. C. et al., "Use of Laboratory Ball Joint Test to Predict ChassisGrease Performance", Paper 379B, presented at SAE Surner Meeting,St. Louis, Missouri (1961).
* Hoy, K. L., "New Values of the Solubility Parameters from Vapor Pressure Data",J. Paint Tech., 42, No. 541, 76 (1970).
Hudson, J. C., "Atmospheric Corrosion of Metals", Trans. Farad. Soc. 25, 177-252 (1929). (See especially p. 207-8).
Hultgren, H. H., "Compatibility in Sliding Metals", B.S. Thesis, MIT (1956).
Hurricks, P. L., "The Mechanism of Fretting - A Review", Wear 15, 389-409 (1970).
Imanaka, 0., "Surface Energy and Fracture of Materials", Kinzoku Hyomen Gijutsu19, 424 (1968).
* Jenmet, A. E., "Inter-Relation of Surface Chemistry of Silicones and Diestersat Elevated Temperatures", Wear 15, 137-141 (1970A).
* Jemmet, A. E., "Review of Recent Silicone Work", Wear 15, 143-148 (19708).
Johnson, K. I. and Keller, D. V., "Effect of Contamination on the Adhesion ofMetallic Couples in Ultra High Vacuum", J. Appl. Phys. 38, 1896-1904(1967).
Johnson, K. L., "Regimes of Elasthydrodynamic Lubrication", IE Jour. Mech. Eng.Sci. 12, 9-16 (1970A).
Johnson, R. E. and Dettre, R. H., "Contact Angle Hysteresis: I. Study of anIdealized Rough Surface, pp. 112-135; II. Contact Angle Measurementson Rough Surfaces, pp. 136-144", in "Contact Angle, Wettability andAdhesion", Adv. in Chem. Ser. 43, ACS, Washington, D.C., 1964.

I4
- 240 -
Johnson, R. E. and Dettre, R. H., 1, ,ttability and Contact Angles", in "Surfaceand Colloid Science", E. Matijeoic, Ed., 2, 85: Wiley, 1968.
Johnson, R. L., Godfrey, D. and Bisson E. E., "Friction of Surface Films Formedby Decomposition of Common Libricants of Several Types", NACA TN 2076(April 1950).
Johnson, R. L., Informal talk at Inc. Res. Group on Wear of Eng. Mat., Delft,Holland, April 2, 1970B).
Jones, D. R. H. and Chadwick, G. A., "Experimental Measurement of the Solid-Liquid Incerfacial Energies of Transparent Materials", Phil. Nag. 22-176, 291-300 (1970).
Jost, P., "Lubrication (Tribology)," Her Majesty's Stationery Office, London,1966.
Kagiya, T., bumida, Y. aid Louc, T., "A Measiicc of the El 'ctron-dona ting pow crand ,- ectron-accepting Powe-r of Liquid Organic Compounds", Bull. Chem.Soc. Japa. 41, 767-773 (1968).
Kanekar, C. R. and Khetrapal, C. L., "Estimation of Aromaticity from DilutionShifts - An Extension of Uie Method for Compounds Without Protons",Curr. Sci. 36, o7 (1967).
Kannel, J. W., "A Study of the Influence of Lubricants on High Speed Rollings-Contact Bearing Performance", Technical Report ASD-TDR-61-643, PartVIII (June 1968).
Karashaev, A. A., Zadumkin, S. N. and Kuphno, A. I., "Temperature Dependence ofthe Surface Tension of Gallium and Its Interfacial Tension at theInterface with Some Nonpolar Organic Liquids", Poverkh. YavleniyaRasplavakh 1968, 219-225 (1968).
Keller, D. V., "Adhesion Between Solid Metals", Wear 6, 353-365 (1963). 1Khrushchov, M. M. and Babichev, M. A., "An Investigation of the Wear of Metals
and Alloys by Rubbing on an Abrasive Surface", Friction and Wear inMachinery, Vol. 11, American Society of Mechanical Engineers, 1-12,
1956A.
Khrushchov, M. M. and Babichev, M. A., "Investigation of the Effect of AbrasiveHardness on Wear of Mtals", Friction and Wear in Machinery, Vol. 11,American Society of Mechanical Engineers, 13-10, 1956B.
Khrushchov, . M., "Resistance of Metals to 'Wonr by Abrasion, as Related to
Hardness", Proceedings of the Conference on Lubrication and Wear,London, Institution of Mechanical Engineers, 1957, pp. 655-659.
Khrushchov, M. :i. and Babichev, M. A., "Resistance to Abrasive Wear of Struc-turally Inhomogeneous Materials", Friction and Wear in Machinery, 12,ASI'W Transl. 5-24 (1958).

- 241 -
Khrushchov, M. M. and Babichev, M. A., "Resistance to Abrasion and the Elastic
Moduli of Metals and Alloys", in Russian, Dokl. Akad. Nauk. SSSR 131,
No. 6, 1319-22; in English, Soy. Phys. Doklady5, No. 2, 410-412 (1960).
Khrushchov, M. M. and Babichev, M. A., "Correspondence Between the Relative
Abrasive-Wear Resistance of Metals, Alloys and Some Minerals, and
their Moduli of Elasticity", Fric. and Wear in Machinery 17, 1-A(1962) ASME Transl. 1965A.
Khrushchov, M. M. and Babichev, M. A., "Abrasive-Wear Resistance and the Modulusof Elasticity of Heat-Treated Steels", Fric. and Wear in Machinery 17,9-18 (1962) ASME Transl. 1965B.
Khrushchov, M. M. and Babichev, M. A., "The Effect of Heat Treatment and WorkHardening on the Resistance to Abrasive Wear of Some Alloy Steels",Fric. and Wear in Machinery 19, 1-15 (1965) ASME Transl. 1967.
Kingsbury, E. P., "The Heat of Adsorption of a Boundary Lubricant", ASLE Trans.2, 30 (1960).
Kingsbury, E. P., "Experimental Observations on Instrument Ball Bearings", MITInst. Lab. Report E-2316, Sept. 1968.
Kislyl, P. S. and Kuzenkova, M. A., "Estimation of the Surface Energy of SomeMetals and Refractory Compounds", Porosh. Met. 9 (10), 39-43 (1969).
*Klaus, E. E. and Fieber, H. E., "Effects of P32 Impurities on the Behavior ofTricresyl Phosphate on Steel", ASLE Transl. 8, 12 (1965).
Klemgard, E. N., "The Manufacture of Lubricating Greases", Reinhold, N.Y. 1937.
Kolfenbach, J. J. and Morway, A. J., "New Thickener System Extends Range ofMultipurpose Greases", Fifth World Pet. Cong. VI, 239 (1959).
Kostikov, V. I., Kharitonov, A. V. and Savenko, V. I., "Determination of SurfaceEnergy for Titanium in the Solid Phase", Fiz. Met. Metalloid, 26, 568(1968).
Kotz I. A. and Kuhlmann-Wilsdorf, D., "A Theory of the Interfacial EnergyBetween a Crystal and its Melt", Appl. Phys. Letters 9, #2, 96 (1966).
Kragelskii, I. V., "Friction and Wear", Transl. in Eng. by Butterworths, Ltd.,1965.
Kramer, J., "Studies with the Geiger Point Counter on Worked Nonmetals", Z.Physik, 128, 538 (1950).
Kreuz, K. L., Fein, R. S. and Rand, S. J., "Solubilization Effects in BoundaryLubrication", ACS Petr. Div. Preprint, A126 (Sept. 7-12, 1969).

' ..
242 -
*Ku, T. C. and Pimbley, W. T., "Effect of Temperature on the Emission of Electronsfrom Abraded Surfaces of Beryllium, Calcium, Aluminum and Magnesium,"J. Appl. Phys., 32, 124 (1961).
Kubaschewski, 0. and Hopkins, B. E., "Oxidation of Metals and Alloys", 2nd F.d.Academic Press, New York, 1962.
Kubaschewski. 0. et al., "Metallurgical Thermochemistry", 4th Ed., Pergammon,New York, 1967.
*Kuznetsov, V. D. "Metal Transfer and Build-Up in Friction and Metal Cutting",
ist E . ed., Pergamnon Press, 1965-6.
Lang, N. D. anti Kohn, W., "Theory of Metal Surfaces: Charge Density and SurfaceEnergy", Phys. Rev. B, 1, 4555-4568 (1970).
Lee, L.-H., "Adhesion of Higlh Polners. IT. W WetJabiJity of astoemers", J. Polv.Sci. Part A-2 5, 1103-1118 (1967).
Lee, L.-H., "Relationships Between Surface Wettability and Glass Temperatures A
of High Polymers", J. Appl. Poly Sci. 12, 719-730 (1968).
Levine, 0. and Zisman, W. A., "Physical Properties of Monolayers Adsorbed at theSolid Interface. II. Mechanical Durability of Aliphatic Polar Com-pounds and Effect of Halogenation", J. Phys. Chem. 61, 1188 (1957).
Li, K. Y. and Ling, F. F., "The Sliding of Copper-Based Sintered Material AgainstSteel in Paraffinic Mineral Oil", Wear 15, 249-256 (1970).
Likhtman, P. A., Rebinder, P. A., and Karpenko, c. V., "Effect of a SurfaceActive Medium on the Deformation of Metals", Her 'Majesty's StationeryOffice, 1958.
Ling, F. F. and Weiner, R. S., "A Bifurcation Phenomenon of Static Friction",TraLs. ASME, Ser. E, 28, 213-7 (1962).
Ling, F. F., et al.,"Boundary Lubrication. An Appraisal of world Literature",American Society of Mechanical Engineers, New MorK, 1969.
Lomakin, V. S., "Investigation of Wear of Sleeves and Piston Rings of Mud Pumps",Friction and wear in Machinery (transl. by ASMIK) 11, 39 (1956).
*Loomis, W. R. and Hady, W. F., "Lubrication with Some Polyphonyl fthcrs and S1per-refined Mineral Oils in 600 F (316 C) Incrted Pump Loop", NASA TN% D-509o(1969).
Loomis, W. R. and Johnson, R. L., "Resin Additive Improves Performance ,)f HighTemperature Hydrocarbon Lubricants", NASA Tic. Brief 71-10394 (1971).
Lundberg, C. and Palmgren, A., "Dynamic rapacity cf Rolling Bearings", 1. Appl.Mech. 16, No. 2, 165-172 (1949).
MacGregor, C. W., "Handbook of Analytical Design for Wuair", C'l 7 Pre-ss, New Y,'rk1964.
Machlin, L. S. and Yankee, W. R., "Friction of Clean M'.tals attd Oxides witLh SpecialReferuiu Lo Titanium", J. Appl . ['Phys. 25, 576-581 ,1954).

- 243 -
Maev, V. E., "Investigations on the Abrasive Properties of Small Solid Mineral
Particles", Fric. and Wear in Mach. 19, ASME Transl. 51-64 (1965).
Maffiolo, G., Vidal, J. and Renon, H., "Cohesive Energy of Liquid Hydrocarbons",
Ind. Eng. Chem. Fundam. 11, 100-105 (1972).
Mahncke, H., personal communication (1971).
Maitland, A. H. and Chadwick, G. A., "The Cleavage Energy of Zinc", Phil. Mag.16, 645-651 (1969).
Matuszak, A. H. and Morway, A. J., "Synthetic Lubricating Composition", U.S.Pat. 2,889,281 (June 2, 1959).
*Mayer, S. W., "Dependence of Surface Tension on Temperature", J. Chem. Phys. 38,
1803 (1963).
*Mays, C. W., Vermaak, J. S. and Kuhlmann-Wilsdorf, D., "On Surface Stress andSurface Tension: II. Determination of the Surface Stress of Gold",Surf. Sci. 12, 134-140 (1968).
*McClellan, A. L., "Tables of Experimental Dipole Moments", Freeman (San Fran-cisco), 1963.
*McCooi, J. I., "Load Ratings and Fatigue Life Predictions for Ball and Roller
Bearings", ASME Trans., Ser. F, Jour. of Lubr. Tech., 92, 16-22 (1970).
Merchant, M. E., "Friction and Adhesion", in "Interdisciplinary Approach toFriction and Wear", NASA SP-181, Washington, D.C., 1968.
*Mints, R. I. and Kortov, V. S., "Exoelectronic Emission During the Deformation
of the Surface of Austenitic Steels by the Action of Microshock",Tr. Uralsk Politekhn Inst., 143, 15 (1965).
Moeller, C. E. and Noland, M. C., "Cold Welding Tendencies and FrictionalStudies of Clean Metals in Ultra-High Vacuum", ASLE Trans. 10, 146-157
(1967).
Montgomery, R. S., "Run-In and Glaze Formation on Gray Cast Iron Surfaces",Wear 14, 99-105 (1969).
*Montgomery, R. S., "Friction and Wear of Some Bronzes under Lubricated Recipro-cating Sliding", Wear 15, 373-387 (1970).
Moorthy, V. K. and Tooley, F. V., "Effect of Certain Organic Liquids on Strengthof Glass", J. Am. Cer. Soc. 39, 215-7 (1956).
Morecroft, D. W., "Reaction of n-Octadecane and Decoic Acid with Clean Iron Sur-faces", Wear 18, 333-340 (1971).
Morris, J. A., "Metallic Bearing Materials", in "Lubrication and Lubricants",E. R. Braithwaite, Ed., Elsevier Publ. Co., 1967.
Muilins, W. W., in "Metal Surfaces: Structure, Energetics and Kinetics", 17(American Society for Metals, Ohio, 1962).
*Murlson, C. A., "Investigation of Thin Films of Organic Substances by Electron
Diffraction", Phil. Ming., 17, 201 (1934).

- 44-
Murr, L V "S L I ack tog -Foul t Anomna t ies aind t 11 Muasuremeon t of 1S.i tiack in.g-Etu It FreeEnergy iF.C.TiFlm", Tb in Set . Films 4, 389-412 (1969)
Myers, IR. S., "Thei~rmodynamics of Liquid solutions, Parts A and V3, Ph.D. ThoLs is,E'mory U'. ( 19 (19).
Naeser, G., "M-1chanical Ac:tivation of" Solid Materials aind Its Teochnological Sig-nificance", Tlot. Jour. Powder Mot . 0, Ne. 2, 3-12 (1970).
Nathan, C. K. and lones, 1W. 3.., "nInflnIce Of' the Hardness of Abrasive--s on theAbrc,stve Wear of 'Mtals", Lubr. and Wear F ifth Cony., Inst. MuchI. :og.,London, 215-221 (1967).
Nuzde, 'N. 1.ulAt., "'Dry Ruhbin.g, Boarings - A ude to lX'sigii ond MaterialSelection'', No. o8018, Engineering Sciercus Date CoiL, 251-259 ReLgentSt., teondon, 14. 1 (19Lo8).
Neumann, A. W. and Tatner-, W., "''The, 'enprattirf' Do;lcndenut -'f Contact And * cIa, -Po~~utaf~er~th~un/n13uone'~J. Coll. Inil mInen. Sci. 34, 1-8 (1970).
aNeumann , A . 14. and Coot!, R . T., ''The niodynornic.- of Contaect A na lea . 1 . Hete roguneousSolid Surface" 9 J. Cll, and Interi. Sci. 38, 341-358 (19472) .
Nevitt, M. V., ''Alley Chemuistry of TUranisition Eleens" Tble XIII, pp. 161-178,in "Electronic '4tincture and Alloy Chemiistry of the Trans ition Ele0-ments", Ed . P. B.Ieck, i nterscience-Wiluy, New York 1963.
Nurse, R. W., "Surface Energyv, AdhesionanCoeinnSldsPc.th efSilicate Ind., Buidapest, 129-141 (1968).
0' Conneoll, J. 1). and Prau1snit:s, J . N!., ''Applicat ion of S rtis tic-il Mechanics'',]nd. Eng. Chum. 60, 36 (1968).
O'Connor, T. J_ Bo'yd, -1. and k\'allene, E. A., "S tandard Handbook of' Labricot ionEngineering'', McGraw-Hfill, New York 1968.
Okrent, E' . U1., "Thle Effect of Luibr icant Viscosity end Composit ion on EngineoFriction and Iariot Wear'', ASET 1rolls. 4, 97-108 (1901.A)
Okient, H . 1., "111he Fffect of Lubrican't Viscosity aind Compesitiion on End injFriction and !ioar ing wt-ar. 11 .'' ASLE Tfrans. 4, 257-26? (1961)B
0ket,!'. H.,''Icnginc Friction rind Boening, Wear . ITT . 'The RuIle Of ElastSicityin Bearing Purfonnmince", ASLE Trans. 7, 147-152 (19(14-.
0 tvik, R. and' Chrite1:nsen1, H1., ''Ciangf-s in Suirfacte linptogirijiv *withIn'', 1'r''. I. -M. E. 183(32') ,57-61 (11968-9))
a 1o.dy, J. F. and I' f inde 11, W. 1., 'TuCilcu'la tion of Cohecsive and Adhts lyeE,.nergius frc'm Intermolecular Forces at a Surface"l, j. Phys. Cho. 72,1407 (19)68).
Panzer, J..,''p''n of 51d Iir Free 1Eni-rgv f'r.- Wk't icyJi. C-itf. Iln. Jltilf. Sc ,-i nii
0puiblication (1972).

Parfitt, C. D., "Dispersion", J. Oil Col. Chem. Assoc. 50, 822-843 (1967).
Pask, J. A., Personal Interview (Jan. 9, 1970).
Peterson, M. B. and Johnson, R. L., "Factors Influencing Friction and Wear withSolid Lubricants", Lubrication Eng., 1__, 325 (1955).
Philippoff, W., "Grenzflachenerscheinungen an Kolloid", in "KolloidchemischesTaschenbuch, 5. Aufl. Akademische Verlagsgesellschaft Geest and PortigK.-G., Leipzig, 1960.
Pike, W. C. and Spillman, D. T., "Effects of Seizure-Delay on Transition Tem-peratures in the 4-Ball Machine", ASLE Trans. 13, 127-133 (1970).
Prausnitz, J. M., "Molecular Thermodynamics of Fluid-Phase Equilibria", Prentice-Hall, Englewood Cliffs, New Jersey, 1969.
Quayle, 0. R., "The Parachors of Organic Compounds", Chem. Rev. 53, 439-589 (1953).
Quinn, T. F. J., "The Effect of 'Hot-Spot' Temperatures on the Unlubricated Wearof Steel", ASLE Trans. 10, 158-168 (1967).
Quinn, T. F. J., "An Experimental Study of the Thermal Aspects of Sliding Con-tacts and Their Relationship to the Unlubricated Sliding of Steel",Proc. Instn. Mech. Eng., 183, Pt3P, 129 (1968-9).
Quinn, T. F. J., "Oxidative Wear Mechanisms, Chemical Effects at Bearing Sur-faces", Conference at Swansea, Preprint pages 187-201 (January 1971A).
Quinn, T. F. J., "Oxidative Wear Mechanisms", Wear 18, 413-420 (1971B).
Rabinowicz, E. and Kingsbury, E. P., "Lubricants for Titanium", Metal Prog.(May 1955).
Rabinowicz, E., "New Coefficients Predict Wear of Metal Parts", Prod. Eng. 39,71-73 (June 23, 1958).
Rabinowicz, E. and Mutis, A., "Effect of Abrasive Particle Size on Wear", Wear 8,381-390 (1965A).
Rabinowicz. E., "Friction and Wear of Materials", John Wiley and Son., ':. York,19656.
Rabinowicz, E., "Compatibility Criteria for Sliding Metals", in "Friction andLubrication in Deformation Processi'g",New York, 90-101 (1966).
Rabitiowicz, E., "Lubrication of Metal Surfaces by Oxide Films", ASLE Trans. 10,400-407 (1967).
Rabi.nwicz, E., "The Determination of the Compatibility of Metals through Static
Friction Tests", ASLE Trans. 14, 198-205 (1971A).
Rabinowicz, E., "The Influence of Compatibility on Different Tribological
Phenomena", ASLE Trans. 14, 206-212 (19718).

- 246 -
*Ramsey, J. A., "The Emission of Electrons from Aluminum Abraded in ALmospheres
of Air, Oxygen, Nitrogen and Water Vapor", Surf. Sci. 8, 313 (1967).
Reid, R. C. and Sherwood, T. K., "Properties of Gases and Liquids", 2nd Ed.
McGraw-iljl, New York, 1966.
Rhee, S. K., "Wetting of Ceramics by Liquid Aluminum", J. An'. Cer. Soc. 53,386-389 (see also, 409) (1970).
Rhee, S. K., "Wetting of Ceramics by Liquid Metals", J. Am. Cer. Soc. 54, 332-4(see also 376-381) (1971).
Ries, If. L., Jr. and Kimball, W. A., "Electron Micrographs of Monolayers ofStearic Acid," Nature 4613, 901 (1958).
Roach, A. E., Goodzeit, C. L. and Hunnicut, R. P., "Scoring Characteristics ofThirty-Eight Different Elemental Metals in High-Speed Sliding Contactwith Steel", Trans. ASNE 78, 1659 (1956).
*Roberts, R. W. and Owens, R. S., "Titanium Lubrication", Nature 200, 357 (1963A).
*Roberts, R. W., "Adsorption and Decomposition of Hydrocarbons on Clean Metal
Films", Brit. J. Appl. Phys. 14, 485 (1963r).
*Roberts, R. W., "Reactions of Saturated Hydrocarbons with Clean Rhodium Films",
Ann. N.Y. Acad. Sci. 101, 766 (1968).
Roberts, W. H., "Lubrication Without Oils", Paper No. 6 presented 30 Sept. -
1 Oct. 1969 at National Center of Tribology symposium UKAEA, Risley,Warrington, Lancs, England.
Rogers, 11. D., "The Mece'anism of Scuffing in Diesel Engines," Wear, 15, 105 (1970).
gounds, F. G., "Effects of Base Oil Viscosity and Type on Bearing Ball Fatigue",ASLE Trans. 5. 172 (1962).
Rounds, F. G, "Some Effects of Additives on Rolling Contact Fatigue", ASLETrans. 10, 243 (1967).
Rowe, C. N., "Some Aspects of the Heat of Adsorption in the Function of a BoundaryLubricant", ASLE Trans. 9, 100 (19b6).
Rowe, C. N., "A Relation Between Adhesive Wear and Heat of Adsorption for theVapor Lubrication of Graphite", ASLE Trans. 10, 10 (1967).
Rowe, C. N., Conments on "Wear" by J. F. Archard, Interdlsc. App. to Fric. andWear, NASA SP-l81, p. 314 (1968).
Rowe, C. N., "Role of Additive Adsorption in the Mitigation of Wear", ASLETrans. 13, 179-188 (1970).
Rowe, G. W. and de Gee, A. V. T., "Friction, Wear and Lubrication - Tribolgy -
Glossary", Org. for Econ. Co-op. and Dcv. Paris, (avil;,b 1, frmOECD Publications Cnter, Suite 1305, 1750 Pennsylvania Ave., N.W.,Washington, D.C. 20006, phone (202)298-8755), 1969.

- 247 -
Rudston, S. C. and Whitby, R. D., "The Effect of Model Lubricating Oil Consti-tuents on the Wear of Steel", J. Inst. Petr., 57, 189-203 (1971).
Runk, R. B., Shanefield, D. J., Brandner, J. L. and Radke, L. L., "Adhesion ofGold on Sapphire", Abst. in Cer. Bull. 50, 398 (Apr. 1971).
Saibel, E., "A Statistical Approach to Run-In and the Dependence of Coefficientof Friction on Velocity", Paper IRG-70-4, Delft, Holland (April 2,1970).
Sakurai, T. and Baba, T. (title not tranqlated), J. Ja.. Petr. Inst. 1,33-58 (1958).
Sakurai, T. and Sato, K., "A Kinetic Study on th,- Reaction of Labeled SulfurCompounds with Steel Surfaces during Boundary Lubrication," ASLETrans. 8, 39-47 (1965).
Sakurai, T. and Sato, K., "Study of Corrosivity and Correlation Between ChemicalReactivity and Load Carrying Capacity o-" Oils Containing Extreme Pres-sure Agents", ASLE Trans. 9, 77-87 (196(0).
Sakurai, T., Okabe, H. and Takahashi, Y., "A Kinetic Study of Labeled SulfurCompounds in Binary Additive Systems During Boundary Lubrication,"ASLE Trans. 10, 91-101 (1967).
Sakurai, T. and Sato, K., "Chemical Reactivity and Load Carrying Capacity ofLubricating Oils Containing Phosphorus Compounds", ASLE Trans. 13,252-261 (1970),
Sakurai, T. and Okabe, H., "Wear Rate of Copper Under Boundary Lubrication",
ASLE Trans. 14, 221-225 (1971).
Schatzberg, P. and Felsen, I. M., "The Influence of Water and Oxygen on RollingContact Lubrication", ACS Petr. Div. Preprints 13, #2, B49-60 (1968).
Schatzberg, P., "Influence of Water and Oxygen in Lubricating Oils on SlidingWear", Lubr. Eng., 301 (Sept. 1970); conmments 462 (Dec. 1970A).
Schaczberg, P., "Inhibition of Water-Accelerated Rolling-Contact Fatigue", ASMEPreprint 70LUB-9, 1970B.
Schmidt, R. L., "I - Application of Theoretical Models to thA Surface Tensionof Binary Mixtures", Ph. D. Thesis, Emory U, (1967).
Scully, J. C. and Hoar, T. P., "Mechanochemical Anodic Dissolution of Iron-
Nickel Alloys in Hot Chloride Solution at Controlled Electrode Poten-tial", Proo. 2nd Int. Cong. on Met. Corr., N.A.C.E., New York (1963).
Senior, J. M. and West, G. H.. "Interaction Between Lubricants and Plastic BearingSurfaces", Wear 18, 311-324 (1971).
" .. .. ' ' .. .i .. i i i i i - .... -wi i

- 248 -
Shain, S. A. and Prausnitz, J. M., "Thermodynamics and lnterfi.cial Tension ofMulticomponent Liquid-Liquid Interfaces", A.I.Ch.E. Jour. 10, 766 (1964).
Shaw, P. E. and Leavey, E. W. L., "Friction of Dry Solids in Vacuo", Phil. Mag.,Series 7, 10, 809-822 (1930).
Shirley, D. A. and Goan, J. C., "Competitive Metalation of Some Nitrogen and Sul-fur Containing Heterocycles", .3. Organomet. Chem. 2, 304 (19E4).
Sikorski, M. E., Correlation of the Coefficient of Adhesion with Various Physicaland Mechanical Properties of Metals", ASME Jour. of Basic Eng. 85,279 (1963).
Small, P.A., "Some Factors Affecting the Solubility of Polymers", J. Appl. Chem.3, 71 (1953).
Smith, A. J. and Cameron, A., "Preliminary Studies of Thick Surface Films",Special Discusssions of the Faraday Society, No. 1 (1970).
Smith, T., "Theoretical Equations of State and Molecular Configuration of Rod-Shaped Molecules on a Metal Surface: Alkanes, Alcohols, and CarboxylicAcids on Hlg", .1. Coll. Interfo Sci. 30, 183-199 (1969 A).
Smith, T., "Spherical and Flat Shaped Molecules on a Mercury Surface", J. Coll.Interf. Sci . 31, 270-277 (19693).
Spielman, L. A. and Goren, S. L., "Capture of Small Particles by London Forcesfrom Low Speed Liquid Flows", Envir. Sci. and Tech. 4, No. 2, 135-140(1970).
Spink, J. A., "Thermal Desorption of Stearic Acid Monolayers from Silver andMica", J. Coll. and Interface Sci. 24, 61-70 (1967).
Spurr, R. T. and Newcomb, T. P., "The Friction and Wear of Various MaterialsSliding Against Unlubricated Surfaces of Different Types and Degreesof Roughness", Proceedings of the Conference on Lubrication and Wear,London, Institution of Mechanical Engineers, 1957, pp. 269-275.
Spurr, R. T., "Frictional Behavior of Metals on a Crossed Cylinder Apparatus",Wear, 5, 55-59 (1962).
Spurr, R. T., "The Coefficient of Friertin of Metals", Wear 7, 330-333 (1964).
S,.urr, R. T., "The Coefficient of Friction of Metals at Slip", Wear, 10, 332 (1967).
Spurr, R. T., "Boundary Lubrication of Metals", Wear 14, 207 (1969).
Spurr, R. T., "The Wear Rato of Metals", Wear, 17, 279-283 (1971).
S pucr, R. T., The Static and Dynamlc Friction of Metals", Wear 19, 61-65 (1972).
Stoloff, 4. S., "Liquid Metal Embrittlement", in "Surfaces and Interfaces 11",1. .1. Burke, N. L. Reed and V. Weiss, eds., Sagamore Army Nat, Res.Conf. .14, 157-182, Syracuse I' Press (1968).
St.udt, P., "Correlation Between Adsorbability and Eff-ctiveness of E.F. Addi-tives in Lubricating Oils", Erdoel Kohle ?1 12:784 (1968).

- 249 -
Tabor, D. and Winer, W. 0., "Silicone Fluids: Their Action as Boundary Lubri-cants", ASLE Trans. 8, 69-77 (1965).
Tabor, D. and Willis, R. F., "The Formation of Silicone Polymer Films on MetalSurfaces at High Temperatures and Their Boundary Lubricating Proper-ties", Wear 13, 381 (1969).
Takenaka, T., Nogami, K., Gotoh, H. and Gotoh, R., "Studies on Built-up Filmsby Means of the Polarized Infrared ATR Spectrum. I. Built-up Filmsof Stearic Acid", J. Coll. and Interface Sci. 35, 395-402 (1971).
Tallian, T. E., Chiu, Y. P., et al, "Lubricant Films in Rolling Contact ofRange Surfaces", A.S.L.E. Transactions 7, 2, p. 109 (1964).
*Tallian, T. E. and McCool, J. L., "The Observation of Individual AsperityInteractions in Lubricated Point Contact", ASLE Trans. 11, 176-190(1968).
Tallian, T. E., Personal communication (1971).
Tao, F. F., "The Role of Diffusion in Corrosive Wear", ASLE Trans. 11, 121 (1968A)
Tao, F. F. and Appeldoorn, J. K., "The Ball-on-Cylinder Test for Evaluating JetFuel Lubricity", ASLE Trans., 11, 345 (19683).
Tao, F. F., "A Study of Oxidation Phenomena in Corrosive Wear", ASLE Trans. 12,97 (1969).
Tao, F. F. and Appeldoorn, J. K., "An Experimental Study of the Wear caused byLoose Abrasive Particles in Oil", ASLE Trans. 13, 169 (1970).
Tenwick, N. and Earles, S. W. E., "A Simplified Theory for the Oxidative Wearof Steels", Wear 18, 381-392 (1971).
Thompson, R. A. and Bocchi, W., "A Model for Asperity Load Sharing in LubricatedContacts", ASLE Trans. 15, 67-79 (1972).
Thomsen, E. S., "Concerning Solubility Parameters", Farmaceuten, 30, 44-48 (1967).
Timmons, C. 0., Patterson, R. L. and Lockhart, L. B., Jr., "The Adsorption of C14 _Labeled Stearic Acid on Iron", J. Coll. and Interface Sci. 26, 120-127(1968).
Tomlinson, G. A., "A Molecular Theory of Friction", Phil Mag., Series 7, 7, 905-939 (1929).
Trapnell, B. M. W., "Paraffin Sorption on Clean Metals. Part 1: The Behaviourof Different Metals towards CH and C H" Trans. Farad. Soc. 52, 1618(1956).
Turnbull, D., "Formation of Crystal Nuclei in Liquid Metals", J. Appl. Phys. 21,1022 (1950).
Udin, H., Sheler, A. J. and Wuilff, W., "The Srfaco Tension of Solid Copper",AII1hI Metal Trans. 185, 186-190 (1949).
........... ...... .. . ' . . .. . . . . . . .. " . . . . ..

I
- 250 -
Uhlig, H. H., Feng, I-M., Tierney, W. D. and McClellan, A., "A Fundamental In-vestigation of Fretting Corrosion", NACA Tech. Note 30294 (1953)
Vaessen, G. H. G. and do Gce, W. J., "Influence of Water Vapour on the Wear ofLightly Loaded Contacts" Preprint of Conf. on Chemical Effects atBearing Surfaces", Wear 18, 325-332 (1971).
Valori, R. R., Tallian, T. W. and Sibley, L. B., "Elastohydrodynaiic Film Ef-fects on Load-Life Behavior of Rolling Contacts", ASME Preprint 65-LUBS-Il (June 6-8, 3965).
*Vaubel, G. and Baessler, H., "Determination of the Energy of Conduction Statesia Anthracene Crystals by Photoetnission of Electrons from Sodium",Phys. Status Solo., 26, 599 (1968).
Vere, R. A., "Lubricity of Aviation Turbine-Fuels", SAE Trans. 78, Sect. 4,2237-45 (1969).
Vermaak, J. S., Mays, C. W. and Kuhlmann-Wilsdorf, D., "On Surface -Lrcss andSurface Tension: I. Theoretical Considerations", Surf. Sci. 12, 128(1968).
Vinogradov, C. V., Laing, K., and Pavlooskays, N. T., "Effects of Prooxidants andAntioxidants on the Lubricating Action of Petroleum Oils", Neftekjimiya,
1, 427 (1961).
*Vinogradov, C. V., Nametkin, N. S. and Nossov, M. I., "Antiwear and AntifrictionProperties of Polyorganosiloxanes and Their Mixtt res with Hydrocar-bons", J. Basic, Engr., Trans. ASME 747-753 (1965).
Vitovec, F. H., "The :;rowth Rate of Fissures During Hydrogen Attack of Steels",Proc. A.P.I., 44 III, 179-188 (1964).
Void, M. J., "Molecular Cross Sections in Films of Fatty Acids on Water", 3.Coll. Sci. 7, 196-8 (1952).
Vold, M. J., "The Effect of Adsorption on the Van der Walls Interaction of Sphe-rical Colloidal Particles", J. Coll. Sci. 16, 1-12 (1961).
Warke, W. K. et al., "The Effect of Lead on Micro'-Crack initiation and Propaga-tion in Alloy Steels - Final Report - Phase II", U S. Army Tank Cmnm.Contract No. DA-20-113-AMC-10820(T), Technical Report No. 1)0752, AD701 047 (November 1969).
Weale, K. E., "Chemical Reactions at High Pressures", Chemical Engineering Series,Spon., London (1967).
Weimer, R. F. and Prausnitz, J. M., "Screen Extraction Solvents This Way", Hydr.Proc. Petr, Ref., 44, *9, 237 (1965).
Wenzel, R. N., "Surface RoLIghness and Contact Angle", J. Plhyzi. Chem. 5-3,1466-7(1949)

25u1
Westbrook, J. H., "Surface Effects on the Mechanical Properties of Non-Metals",in "Surfaces and Interfaces II", J. J. Burke, N. L. Reed and V. Weiss,eds, Sagamore Army Mat. Res. Conf. 14, 95-138, Syracuse U. Press(1968).
Westwood, A. R. C. and Lye, R. G.., "The Technological Significance of Surfacesand interfaces", in "Surfaces and Interfaces 1I". J, J. Burke, N. L.Reed and V. Weiss, eds, Sagamore Army Mat. Res. Conf. 14±, Syracuse U,Press (1968).
Westwood, A. R. C., "A Conceptual Approach to Understanding Environment-Sensi-tive Mechanical Behavior", Proc. Mech. Fail. Prey. Group it, 3-8 (1970A)
Westwood, A. R. C. and Goldheim, D. L., "Mechanism for Environmental Control ofDrilling in MgO and CaF 2Monocrystals", J. Amer. Cer. Soc. 53, 142-147(197CO).2
*Widom, B., "Intermolecular Forces and the Nature of the Liquid State", Science157, 175 (1967).
*Wigotsky, V. W., "Liquid and Solid Lubrication", Design News 23, 37- (Dec. 6,1968).
*Willams, R. A., "Investigation of Exoelectron Emission from Various MaterialsUsing Abrasion and Ultrasonic Techniques". AD-64242-2 (1966).
*Williamson, J.B.P., "Topography of Solid Surfaces", in "InterdisciplinaryApproach to Friction and Wear", NASA SP-181, Washington, D.C., 1968.
Wistreich, J. G., "Lubrication in Wire Drawing", Proc. Conf. Lube and Wear,Paper 4C, p. 505 (1957).
Wittman, F., "on the Influence of Surface Energy on the Strength of a PorousSolid", Z. Angew Phys. 25, 160 (1968).
*Wojcliechowski, K. F., "Note on Metal Surface Energy", Acta Physica Polonica,XXVI, 185 (1964).
Wu, S., "Estimation of the Critical Surface Tension for Polymers from molecularConstitution by a Modified Hildebrand -Scott Equation", J. Phys. Chen.72, 3332 (1968).
Wu, S. "Surface and Interfacial Tension of Polymer Melts - I - Polyethylene,Polyisobutylene and Polyvinyl Acetate", J. Coil,. and Interf. Sci.31, 153 (1969).
Zadumkin, S. N. and Karashaevo A. A., "Surface Energy at Metal/DielectricLiquid Interfaces", Soviet Materials Science (Eng. Trans.) 1, No. 2,86 (1965).

- 252 -
Zadumkin, S. N. and Temrokov, A. I., "Simple Methods for Calculation of SurfaceEnergy and Surface Tension of Ionic Crystals", Izv. Vys. Uch. Zved.Fizika Ii, No. 9, 40-51 (1968).
Zettlemoyer, A. C., "Chemistry and Metallurgy of Wettiig Solid Surfaces",
in "Ohmic Contacts Semicond, Symp.", ed: B, Schwartz, 48-66 (1968).
Zisman, W. A., "Relation of Equilibrium Contact Angle to Liquid and Solid Con-stitution",in'"Contact Angle, Wettability and Adhesion, p.1, Advancesin Chemistry Series, #43, American Chemical Society, Washington, D.C.(1964).
Zisman, W. A., "Surface Energetics of Wetting, Spreading and Adhesion", J. PaintTech. 44, NO. b64, 42-57 (1972).
* References marked with an asterisk are not specifically keyed in the text,for various reasons. Some were dropped in favor of more recent work, othersare of such general interest as to have influenced sections too numerous tomenLion, and still others arc simply good background.

-253-
APPENDIX Ill
fli'1,inted lean fox is i. ori Coimoiri A ND t.NTRIIAer Ac, &,:. , V1','il mi' , N*1 1. ktnamor 1971copNvat 0 197I I,.% -keili'tni [Ine, Ine. inted in U S .4.
Surface Free Energy: A New Relationship to Bulk Energies
A. BEERI3OWEII
Gov'ernmient Rlesearch Laboratories, kRnso Research arid Enqinceig ro., Ibirlden, V\ew Jersey r1 ?SORteceived May 27, 1970
Bly flieails of nil equaltioni contailiiig two adjuIstale coetficienits it is lmssible torelate thetmirf ace frcc clrgy t0 tile l'licrgy of v llplri zan I, Wgi llg the 11ISr liS F~l niiileters for ILondm i foree inc rgy, polar enea'rgy, anld hydlrogeoi') di og enlergy,. Thetechnique is applicaible tol simle ,irgaide licliids, ixturells of sililfib hllitids, and~mi-st liquiid nicia:ls. Ifydroxy compuil~ll~s, av1idit, and I -tii urge lie qLilkd, ertaini
hexagonal anirre'glar FiItnl15, FiFIil lit fusepd 11idlvi Fs it'ir specil Versionls of
the baii equationi.
1. ORGAN IC LTQU Ii ) dipoles, and pl'ubabi 'y othIer ititeractills,.
Hildebrand 11itd S-cott (1) derived atit I li~hCt 'ttlt 4b ~zdiequationi relating suirface free energy -y to) 0(11416011 (1) lt thll dat a fur thiIns-ire
enegyof apriztin:gleiIoillly nout available. A. far better 111(1-
energy of Vaor z~lt bitccdtre uIses thle Cu riespi 111liiig slates pr inici -
-y ( I ' A ~ 1]1)0 111111 a Thilf~lit'lI,''le latter. ks tIi roca rbui of sim il ar niolevu I ar sh1ape to
mwhere All,~ is the molar hleat of vaporcizat in, thatt of th11 Com~pound ill ni q lst hn1, .4 isPL17 tile ivork (of vaporlization11 (getula I ly Simnply thle 'cri-y of vapI ll sat ion of tile
closely approximated by 1', the1 gas- con- iunamollip aIt tilie siitnv redleell tempera-stant times the absolute toellattlet), V ture (T' T,) alild molar. volume. (Charts forthe molar volume, and .V Avogadiro's tis pulrpose \\ere pi blishwIl 1)". Weilr al11(
for "'regular" stibst anees 'tll(i as. hv(lIro- higher valuies tlk wI ~ere usrol by liatineill
Carbons and somcl ilot111rglue h(li t is. Ill (2). TIhe writer (4) extendedi'l thl'si' Chiartsaddition, their numecll4I evl 1141 ii IleC- but ai tually 11.011 lialelt'Is. \41 111s ill tiliesuited ill anl arbitrIary value of KA', mid1( i11ex1)onctlt of -Y equaling 0.84, whlic el est roved P~resenit aIrt icle a re tal1kvt friomt refer' je CC
tile dimensional 1)41lantev. A\ mo1re getiaa1 111 141s011 's lat11 arI:tile (5).
relationlshlip would be tiseftil hi'e~lllse of' ft(le 11401501 lrigitlallyv lbt:Iiilei B b1v trialim rveen l U d -1 diti (1 m r rtIigill t o ti lv I jilliil rs n
calsiel' to ille!1L1ue 41 -lUrf aIC' frve e'ligy t lal ill till hyt1 Iikk tll be evalua:t 'i, Ile sllbse-
to meiCII4tI' (111'
vnporiz4Ltioni van he slit into three, ('1111 "f %%Ih s ttivil Ill' 1w 111 (pit .lifilsIlig aF
poneiisl'l()la liwitllteeeg fis Ili VIA iv-litli rI- 1-3i illulll-i a pl-oull c(irat~r d ml (:11gin .I as mvi TIv I r iI,1+ R 4-

-254-
SUItFACE FREE ENEMGY
quently showed (5) that quite precise values which resist separat ion during surface forani-could be obtained by: tion, and K = K'/N111, Eq. 11] becomes: 2
B-1210S 41 - n + -yp2 [3= K(A + aB + bC)/VI 3. 17]B- V .2 t + n' (Y )A, [1 Computer evaltiat ion of this equation
where i is the dielectric constant, n the gives K = 0.07147, a = 0.643, b = 0,620index of refraction, and p the dipole moment. with it correlation coefficient of 0.984 forThe writer later showed that good approxi- 100 liquids at 25'C. Rlegular liquids, vice-maltions could be obtained by tron donors, and electron acceptors were
included, but dotnor-acceptors containingB - 336 lu2 [4] OH and COON groups were not. The -y
or values were intterpil)ated frunm Quayle (7)oro 25*C.
B -[RT~i - 1)(e - n1)]/[*(n 2 + 2)], [4.41 This value of K came to the attention ofa colleague, Dr. E. G. Baker. He commented
which require fewer data. Hansen's and the (8) that some of his worklhad led to a siiihiarwriter's values were expressed in terms of factor since "thle molecules of most liquidspartial polar solubility parameter bp , from tend to occupy positionls, onl thle average, atwhich the corners oif regular octahedra. Once that
B = 5..2 [5]postulate is made the number of nearest-B = V82. 151neighbors may immediate ' v be calculated
The "hydrogen-bonding" energy C is the as 11.247 from knowledge of tile total di.most difficult to obtain directly. Hansen (5) hecdral angle, expressed is a mutltiple of 2r.demonstrated that acceptable values, of C If SUChI struICtures persist throughout liquids,or the partial parameter au could be calcu- u'l to and including the surface lavers, thelated simply for hydroxy compound.,. His4 number of nearest -neighbors wouldi drop toequation, slightly modified by tile writer 8 at the interface. Tuel( latter result can(4), is easily be deduced by constructing a SurYface
layer otit of half-octalicd-a. InI the nest ofC = 4050 i, (6] half-octahledra, the edges of thle square
bases atre shared. AXccordingly, thle fttionlwhere mn is the niumber of OH groups. He of "bonds" between niearest-neighibors thatapparently did not recognize anl extension of ar brke atteitrf I eivethsthis rule *to the monocarboxvlIic acids, but aeistongen t fe iterr, woul bie (tot4osehis C values are well fitted by uising )It = 0.3. existin i1124 th interior, wolPefor1ing7th
InI the study reported below, B andl C necessar'- cailculation of mttltiplyitn- bYvalues from references 4 and 5 were used 4.18.3 X 10 eal. erg and dividimng by 2XI 1wvhere available. To fill in gaps, Mu Values1- (s itie cuttinig 1 C111 of liquid prtodtuced 2fromt 'McClellan (6) were converted to B (71m2) we obtain K = 0.07152. Iloth of itsvalues with the use of Eq. [4], anid C wats feel thlat sitelt ac-nreecnt by twvo diffeetdetermined b\ difference -with tilie use of :tpprles '111d with i t :tdlj ttst nielt whlat -Eq. (2]. In1 a fe'v eases, B and C~ values for ev11r, itniplives thlat D)r. Baket's valuie of afunctionlal groups wer esttiated onl t lie 'S - tc-'-' ~ fbasis of faimily relat ionuships along- thle littes dervs ill w1C ittni)r of tiviglbtof Eq. [61. It would be very , v s-i civictc :hi.Nc e(tiatii
Ini extattldiitg Ell. III to Cove.'r Comtpllex into' a1 tispt'rsiccc terinT -, andcr at ''tcchr" ivrioliquids,, it wa-s assttmedl thwt tlte enlerg\- of ".. ill keviciccc with th ic,' cttit-, of sevendt recetiitsturface format ioti woutld ttot ialtlel tilte ftil :,cith,-rst. cr ti l'4 fattt-111 11: ilt,\.w cc uisevaluies of Bi and C, sitnce thecse forces ar rit IP 1' :11144- ill i :L cc 11' l,:1r -," I tcrt all ]I.
bc,,cctouc, )4. It~~' Itht,~ wricr fnels in~t to Icc siSpecific ilt lireetiort. Th 1 fores, beitng i, 1tir.luc tnOIll fiot d hr clj1'hcdi:cti trc':ccv tint ri-.omnilidirect i''ril, arte Carrie'd at fill, -trelgt It. ri:dI sital"1 ctc cc s Iho 11c"I it l (11't c ltist r~l (1iLWhten we let a!? :tnd WC rv'lu'eee tile valueIs %%li ritiict-mtsch':,Ii wclclinve t"tl'scorrect(-([l for the iminibet' of ttuleettlor piris aiilYctl inl itsc

- 255 -
BEERBOWER
19PARITY
LIN40-
00
30-
0 10 20 30 40 50 60 70 so
OBSERVED SURFACE FREE ENERGY (ems/m2)
Fzo. 1. Comparison of calculated and observed surface free energies for general class of liquids ()paraffinic monohydric alcohols (*), acids, phenols, and &mines (A), and some commercial mixtutres ofgeneral class liquids (0).
bonds at the surface has fundamental that some explanation is required. Possibly,significance. the equality of a find b implies that til bond
The values of a and b are less fundamenital. is due to an induced dipole (3), though itThey can even be considered equal without seems more likely that these factors bothany great loss of accuracy of correlation. represent a correction for tile entropy ofSuch equality would be consistent wvith the formation of molecular doublets.thinking of Weimer and Prausnitz (3), who Electron donor-accepter liquids fall intolumped B and C together with it coefficient two groups. The first of these is tile paraffinicbetween 0.100 and 0.208 for ]iquid-liqluid moniohydroxy alcohols, which aire: o stronglyextractions. Even .when they were kept hydrogen bonded as to resist pa ir- bre.i kingseparate, Hansen (5) found both a antd b = and so give an exceptionaflly low value of b.0.25 to fit his data on 10,000 polymer solu- As the vahmu of K obtained independcntlytions, and the writer (4) found a = b = for this gr'oup was ess-ntially the same ais0.19 for rubber swelling, Tile resulting for tile other liquiids, Baker's value of 0.0715correlation is showna in Fig. 1, based oil is used. A computed runl onl 15 alcohols
0.0 15 A + 0.32( + )11'21. 81 resulted in a -- 1.044 anld b -- 0.060. In'i'= 0071 [A+ 0632B +C~ll~ i '. 8]view of tihe snaill nunmber of dlata points,
It is generally believed, flint proon donors there would be "enltizillyv no loss in ae.such as chloroform and accepitors stlcl :as ruricy in rounn li hese ohf toa c e t o n e C a n ni o t h y~ d r o gl e i n b ou d t o t hi e i n - y = K A + I + ,0 0 ) V 1 "9 )selves. However, the evidence herle is ,s o=/'( +OOO) " 9
clear thalt a bond off the sinv' wieral pr'op- The lpoinis, plotted in Fig. 1, N11l os close toertien exists~ in ealch of thtee purile 14i1u411 thline 111 wsColhl be des ired. \1pl-lix lly, tie
dirnl ~tCdddan lwlle .:,i~r. ~l.I1,. ,.I.Juill a.11

- 256 =
SURFACE FREE ENEIIGY
strong hydrogen bonding causes the lower was the n-paraffin hydrocarbons, for whichenergy dilxde bonds to behave as if they tile calculated results are too high by anwere London forces. amount that increases as , mle power of V.
Although it may seem paradoxical, the This is believed to represent increasingglycols and glycerol had to be excluded from deviation from Baker's octahedral geometrythis class. The same applies to ring alcohols due to their elongated shape.such as benzyl, furfuryl, and cyclohexyl. A number of commercial liquids for whichBoth groups fit into the general class. If all A, B, C, and -y were known are also plottedthese cases are due to steric hindrance, it in Fig. 1. These are mostly hydrocarbonwould appear likely that heavily hindered solvents, lubricants, and rubber process oils.tertiary nleohtils -would behave in a similar The fit is sufficiently good that Eq. 18] hasmanner. However, triethyl carbinol (7) been adopted for estimating the solubilityshows only 25.2 ergs/cm2 ; this would class parameters of such liquids from surface freeit with the other paraffinic monohydroxy energy measurements.alcohols.
The last group is more heterogeneous but It. LIQUID METALsseems to be logically consistent. The corn- The liquid metals present a somewhatpounds included are the acids, phenols, and simpler picture than the organic liquids soamines, but not the amides. Computer far considered, and their properties at theanalysis of 16 data points yielded a = 2.018 melting point have already been correlatedand b = 0.45. After rounding off a and on a common basis with some organics byadjusting b, we obtained Bondi (9). Grosse (10) developed an equa-
K(A + 2.OB + 0.481C)/ . [11 tion for most of the metals closely related to
The extraordinary behavior of the polar y = 0.0665 6H,/IV2S [11]energy, which apparently works twice, cinbe attributed to the imperfection of the (obtained by combining his equation 13] withvapor of these compounds. It is known that his final one on page 1361). This was putthe vapor of acetic acid is essentially all into better form by Schonhorn (11), whodimerized; this, of course, leads to a low based his analysis on the statistical me-value of AH,.. This effect results in a lower chanics "scaled particle theory" of 'MayerA1I than is needed to account for the high (12):surface free energy. It appears that thedimer is held together by dipole forces rather = 0.0737 AEc/V2:3. 112]than hydrogen bonds. The dimcrized vapor This differs from the conclusion reached foralso accounts for the special value m = 0.5 the organic liquids only by a factor of 1.03for acids, noted under Eq. [G]. and by the absence of the polar and H bond
These points (3 acids, 3 phenols, 9 amines, terms. Schonliorn limited this equation toand water) are shown in Fig. 1. Water fits the cubic and tetragonal metals; this mightbest with this group, though its A, B, and C well be considered consistent with Baker'sparameters had to be adjusted from Hansen's octahedral model. Both Grosse and Schon-tentative values (5) to fit both E'qs. [2] and horn found it necessary to set uip a separate[9]. The values arrived at were A = 1040, equation for the hexagonal and rhombohe-B = 1095, and C = 7720 cal per mole. dral metals. Schionliorn's version is again the
The scatter may be attributed to litera- more logical, and consist-. simply of Eq. [121ture errors ol v, 1o a lack of precision of A multiplied by (i2/2)"'. The results of sub-and 11, to variations in a and b in violation stittting Btker's valiue of K = 0.0715 intoof the assumpthim that all compounds must these two equations are shown ill Fig. 2.fit I.(,. 18], 1 1, or 110] with nlo gradatiotis in Onie special case is that of bismintth, whichbetween, or tfo:t mixture of cautses. literature Grosse found behaves as a cubic metalvalues below 1.5 eIgs,/c Ic -are especially despite its h(exagonl structure, lie at-Suspect. Ole grlll found difficult to liaulle tributed this :.limaly to its other peculiarity
JoIrM1, Of Cooid I"md ItPfrr/We ,S eIne, Vol. U, N', I, ,h1111tiqty 197,l

-257
BEERBOWERt
3000
W lest A 14I
PARITY21 2000- LINE
:1 Pt-0 a
Cc
oi 0.
N *Ca
Q1 A *A
100 011
0C
0 K* A g
0 0020030
DEEVDSUFC RE %rY Sq
Fw . ufaefeeeeris fte iui eal t hirnetLipolt
of expttigion i reig The at a fo*-11.SAT
cimae netaneouht ftethr Te ufcefe cries of fueakl
Fia 2 Srfae re eergesofth liuAna :ls at theisrfc reltn entryofhlie
ofi exago oal frele. The dart frorblm metals arsenic SnionandLTStt
lies ar te uncctin og totether Theifctin suN rface faare eneris offueailal istem, tand tuse fyGose gemaiumbI apped to \ h lalidae recepdaet CCeaIlcl os atten-Ybett(1 usless oing 10 imponrties ut -eis tionelaned ther iq. asca Thering fa data o
mot oftheuthre" e an ireu correate bit othew inonc sElt. 11o1,espit the fctthe simplostgo tile eqaions:II-lilil isd t a ""I ' t' er of I ox.ides, arphom hes ad
maddite.A ddional diccute oaieipliin moy eao ll strtwi , tho fofm Ths triaetstheys'hoa rue. Tewort 11,1yncas1pro metL doubt arseican Slolionv, aVSn bilm Iie
lies~ ~ ~ ~ ~~~~~1)i inteeitneofthrcasfctos(o rfc h at (12,2cr redlefiuhto ovill itsthanstt i ucbic tro e Hil or 811(1 i tihldceet('IwIisrdvsat) clefo if ni tin.luytevl bwe u cal sa colirrelat('l in efill. [As. Thel avalalelp as
S~ a'tstuctre'il~l uei~uv a" c~m li base ll Onsito' Eq. 13], deit th lsoe c01le%'', alon i Ii ga1lium11-, tile hatll 111e ootfeehlds r h m o damagnseinao ti) t l cni11ila if 1,1- 1 . .. peristI inl c t I f yin s T Ik " is d cas
they how s tht. mny me alstiiil tisld (loint ii hasI Seht o dC5isro l the'
onl th -liu .m30rcur', / Vn. ea 1iiinm llascel lilt (forse' ass1ltil)itIl tatra~ "5(fI
ti tn Latre. an i~rrv Nl h hlti tt,' na

-258-
SURFACE FREE ENERGY
600 - - - - -
400 hF A LINC
6.
IaC
Aqa
;C31 00 2 ~ *KFzDIAL
10 Cs SRAC MNHALIDES
V4U0
Fia. 3.~~~~~ urace Afre enr3o h ue ea aie eta oae o 28
duios aue Ohrshaesicefild o enrg b n mprca dvso, twa 3s
The. 3.nergiefre ttr of taorzaio feecl ued mea halides (eapolte + o 228 8,/P
from Kubaschewsk i's (13) valuies for latent K(0.342 A + 2B). /U%,. [16]heat of cvaporit ion at 2.5'C, a11d the surIfacefret energies extrapolaied to tie sanme The dipole moments were obtained fromt emperatutre, with ithe use of equations of thle M rctIvlani (6). rThe results are plotted inform discussed in detail by Du~ga (14). Fig. :3.
The monioliailides were nlext examinled. No satisfactor 'y explaoiat ii canl be offeredFittinig an equation it thle t ype of 1141 for thle 0.342. Even substiit ting ai reguilarproved im possible, :is a I osit ive inlttechpt, t et ral ted n iii ode I fir III( e 1101f- o' I (Ied rilww; required: rcsults onl ,y in a factor of 0.511 , and further
[eduIt;iti ould reqjiliro asIillpt iotis wliieiil,y=0.02:38 AE.'I? + 50. [1 duti] Nt% ltt~$ o ht
hlardl ' seemn just ifiet i neetil' htTo necomit for this intercept, it appeared MI[aycr (12) hod( 1111 troubile obt:ilitIIg Wgodlogicald to turn'l to tile organlic :1t11ad -y vailiets from tOe Comll('s bi lit Y of Iliesoaimtic, where aI similar situnationl arom, (Eq. liqulids, So thlit tilt wilolmlal y is ippat1elitl ly110]). Both clai~ses 'Ire ikt il lvl ionlic. B~y aIssociate'd withI AU,. Illuhps ti ,1w o'adding in addi ioil Ioh:Li ('tt('l (M,' owliimiell tell sooilvls icti b)'y Pat t'i'SoiIpr(stinuably :tlreadvy irwitnls B ? *3i p, (I.)) will li'lp to clIthis imater.per Eq. 1,11), atil then.I n-diiig the Llndon Tl' data onl (iliwlit's ianer selarel' aid

-259 -
IB EERIBOW ERI
no dipole mnioents are available The far- Ri",FIITI':NCESthest we call go is t simple equation: 1. JiI,,'. J. Ii. AND 'LITT, 1t. L., The A
00ul[i 'itv of No ehe rilytis 3rd ed Rein-,a i 0.05;59 gEtiif m , [171 hol, New Y,,i'k, 1950. A
'. .AN s N, C. M., JIour. of Paint Tech., 39,which implies i pO sition intermidiate #M)5, 105 (1967).
between the mIIono-) and trilalides. The six :1. wEV'i:it, V. F ., A :it Pitutesirz, J. M.. Hydro-
data poiut available arc shloiti in Fig. 3. carbon Proc. 'der. Ref., 44. 2:37 (1965).4. . to p;nW , A., .%st)D Iw(KE:Y, J. It., .ASLE
CONCLU IONS Trans., 12, 1 (l0G9.
The octahedral model served well for the 5- 1[ NF, C'. M..ANDt SK iti'P, K., Jour. ofPoaint 'T'ce., 319, ri511, -P1.5 (I116). .
general class of liquids with ueak throughl Pi Tct'I. 9, 5., "T .5 ( i nell)
moderate interctions bet%%een mi notcule., lilmle Monw itts." t'. If. Freean, Saun
even w\'hen contplicated bly the fr'e electron Farn, isto, 106:1forces in liquid meta. However, very long 7. 0i , (. It., Chii. Rev. 53. 439 (1953).molecules or tho,e exertiig sl)'eeit interae. S. B %KR:. E,. (;.. Private coiniti ication, March
tions such as hydrogen acceptor-donor, 24, I:i6.
acid-base, or ionic forces require special 9. loNiii, A , (hent. le'r. 62. 417 (1953).
values of one or hoth of tie i 10. (GtosF. A. \., .1. nrg. Nu-i. Chcn., 26, 1.349
parameters, an,(d monohalids violate the (1964). c,-m. 71, 4578
all~~11 thesio% It.,id Jo far1s iii-esigaed 71, 4578~tiiitgeometric model completely. Thus, one (191;7).gencral equatioi nta d ft , sl it-cific oiie.j cover l.I.1.\r:1, S. W ., J. Pi ,.C, t o-tn. 67. 21611 W191;3. Aa ll t h e liq u id :S ,6 o fa r in v e .-i g a te d . 1 3 . 0~'l .C l l -l l ., t ./ at ., " M '% e t ll htirv i c l
Tfhruiiolierilsl ry", 4i t h -,i. 'erguiiiu 1Press,
ACIKNOWI1,I E;I.NT New iurk, 1!1(;7.14 t,.'(;%, .1. J., IDICC itlpui-I fill-2 (AI)91019)
This work was siuppriri 'i iii iar 1 IC S. Arniv (:eiringhiisi', ipfnitlg1il, Virginit, Juiine,
Cotirt u .N -DAW 1)A I('19t-i9-C.-i )33, adminsiered
b' thue flesetrch Tedhinlugy IDivi.,iwt, Armly 15. P.TRiusON. 1...AND It USTtOi, A. K., J. 'hys.lescarch Olhte, Arlingtoin, Virginii. ('heit. 74, 10(67 (1970.
1-
15 N-.
-.,.

A
- 260 -
APPENDIX IV
THE SUr2ACE FREE ENERGY OF SOLIDS
IV.1 Introduction
The importance of the surface free energy of solids in lubricationwas vaguely recognized many years ago, but it was not until Prof. Rabinowicz'(1965) book appeared that the central role of this energy was brought intofocus. Despite the crude methods and data he was forced to use at that Lime,he made a good case; in a very real sense, it was out of his work that thepossibility of this STAF arose, This Appendix is largely devoted to updatinghis work, applying modern chemical engineering techniques to the correlationof the spotty data available and to the prediction of missing values. Fortu-nately, there has been a convergence of interests among motallurgists, ceramicexperts and paint technologists which has resulted in much new insight onsolids. (This Appendix first appeared in Progress Report No. 1, Sept. 9, 196),but has been iargc.ly re-written since that time.)
IV.2 Definitions
It is not possible to discuss the surfaces of solids until certainterms have been defined. This is particulariy true because of the wiespreadabuse of the phrase "surface tension." This term was apparently first coinedby von Segner in 1751 for liquids, in which true tension is rarely exhibitud; iits spread to solids awm ounts to a semantic disaster.
It might well be mentioned that the term "surface" is itself mislead-ing, since every surface must, in reality, be an interface. However, as a mat-ter of convention, we will continue to use surface to represent the interfaceof a solid or liquid against a gas or its own vapor. The word intIerface thusrepresents the area of contact of two liquids, or solids, or one of e:ach.Tension, if used at all, will apply only to the bulk tensile stress in solids.
The reader must be warned that some authors reverse these sr.ybols,and that others reverse the meanings; the results approach chaos (1ullins 196)2,Johnson 1968, Vrt iaak 1968, Zadtimkiv 9,'8) . in this STAF, the symbols and de-finitions above and below will be strictly followed.
IV.2.1 Surface! V 1,E,'_.' (properly specific surface f-ftc unergy) is the!central property of interest to those workin,, w-ith the interfacial propertiesof matter. It is defined as the reversible work required to create a unit arzoaof the surface at constant volume, tempcrature and chemical p-Lentia . ThIs,it is a Gibbs free energy and not that defined by Helmholtz. It is almostuniversally designated by "Y", and is valid for ,ll pure l]q,ids and solids.Although this strict definition would make it inapplicab, t.o multicmipolientsystems, where the surface free energy of the mixture
+ 0 (; )(V-1

- 261 -
where p. and Fi are the chemical potential and excess surface per unit areaof component i, this fine distinction will be neglected for the present.
The origin of the term "tension" in this conuection was in Von Segner'sconcept of a "contractile skin" of special surface material whose tension re-sisted the "internal pressure" of the liquid. The correlation of bulk and sur-face properties, with no need for special densities or energies at the surface,should help to dispel the idea of this "skin" which is, unfortunately, stillbeing taught. Actually, the second law of thermodynamics requires that eachsystem seek the lowest free energy configuration which accounts for thespherical shape of drops, capillary rise and other pheaomena that so puzzledthe scientists of the 17th and 18th centuries. It is interesting that ifvon Segner had thought in terms of energies rather thE.n forces, his mode]would conform almost exactly to Appendix III where the surface free energy isshown to balance the cohesive energy density (E./V). The latter term is be-lieved to correspond almost exactly to the old idea cf internal pressure(Hildebrand 1950) though not all agree (Bagley 1971)
IV.2.2 Total Surface Energy has not been involveo in such semantic contro-versy, perhaps because it is not used so often. It consists of the free energyplus an entropy term:
E = y + T di (IV-2)dT
Many authors refer to this property simply as "surface energ,", which is quitelegitimate. Unfortunately, this term is also sometimes used carelessly for thesurface free energy, so it is best avoided.
IV.2.3 Surface Stress. For a solid, it is also necessary to consider thereversible work done in extending the surface by one unit area. This is bestreferred to as the surface stress, 0. While y is a scalar (non-directional)energy, i is a tensor quantity and is equal to
a = ¥ + ly (IV-3)dS
where dS is the specifi reversible surface strain. For liquids, a = y.
IV.2.4 Surface Distortion cannot be defined thermodynamically, but is veryreal. It represents the total of the various stored mechanical energies suchas disloc.tions, and elastic tensions or compressions, over and above the Sur-face Stress. The effect is clearly visible during corrosion, when the dis-torted spots invariably corrode first. It also has more subtle symptoms, suchas the discharge of "Kramer" (1950) electrons which blacken photographic film,generate H2 0, and perhaps cont-ribute to forming surface resin.
- 262 -
IV.3 Measurement Techniques and Calculation Methods
In contrast to liquids, whose surface properties are easily measured,solids require difficult and often indirect techniques. Nothing approachingthe ring or capillary method is available; the nearest approach to that wasRabinowicz' correlation of surface free cnergy with pyramid hardness (Figure 7-1), which has so far yielded only rough approximations. The methods discussedbelow have been reviewed in greater detail by Duga (1969) but some of the anal-ysis is new.
IV.3.1 Direct Measurements
The outstanding procedure is the "zero creep method", first broughtto reliability by Udin (1949) and since used by many others. It is carried outby hanging a series of thin wires or foils in an inert atmosphere at a con-trolled temperature near the melting point. Monocrystal specimens are pre-ferred but multicrystal ones have been showi to introduce less than l07 error,for which an approximate correction can be made. Unfortunately, this methodcan only be applied to materials with a fair amount of ductility, and even withthose it must be run at near the melting point to avoid intolerably long wait-ing for the decision as to which load will neither rise due to surface forcenor stretch due to gravity. The surface free energy is numerically equal tothis critical lo~d (in dynes) divided by the circumference of the specimen (incm.). as ergsicm . Methods for adjusting the data from the undesirably hightemperatures at which they are deterMined are discussed in Appendix VII.
The other direct method has been discussed briefly in Section 6.8.1.It depends on the Griffith principle, that the work required to extend a crackis expended in generating new surface. There has been much controversy aboutthis method since its application by Gilman (1960), on both theoretical andpractical grounds. Unfortunately, again, this method can rarely be checked onthe same materials for which zero creep data is available, since the criteriaare essentially opposite. The Gilman method requires non-ductile specimens,so is generally run at liquid nitrogen temperature.
The practical problem is to overcowe the effects of residual ductil-ity in the specimens; this is handled fairly well by breaking at a series ofstrain rates, and extrapolating the results to zero strain rate. Theoreticalpoints include the argument that really this method measures 1 rather than .,which raises a question of the sign of d Y/dS in Equation (IV-3). Some feel itis positive so that 0 is always greater than Y; others, who ire more orientedto the calculations from lattice parameters (see IV.3.4 below), tend to regardit as negative, even to the point of driving 77 to nugativc valu s (Mullins1962, Zadumkin 1963, Johnson 1968, Vernaak 1968). This question is probhblyonly of academic interest compared to that raised by Fox (1970), who esitimatedlarge temperature rises in the tip of the crack (Fl gure 5.8-1, point A-A').These were based both on very approximate calculations, ;ind on observations ofcrack-initiated detonations in crystalline cxplosives. This Lnmpraturt risewas more than enough to explain the deviations note..d below in IV.3 below. AsFox's calculations were too crude to oerve as a correction factar, this methodis definitely NOT rucuimnended.

I- 263
IV.3.2 Measurem2nts of Liquid Interactions
Most of the discussion on solid-liquid interactions is properly re-legated to Appendix V. However, there is one case which need not be post-poned, as it is relatively simple - the interaction of a solid with its ownmelt. This does require use of the controversial rule proposed in 1907 byAntonoff (1942), that the interfacial free energy is the difference betweenthe surface free energies of the two phases measured against theit commonvapor:
Y12 = Y2 - YJ (1V-4)
(The convention I = lower phase and 2 = upper phase will be used in subscripts.)This has to be applied to phases that are mutually saturated, as surely a solidand its melt will be.
The first technique, by Turnbull (1950), measured y12 by means ofthe maximum degree of supercooling required to make isolated roplets of theliquid nucleate homogeneously. By reasoning too complicated to cite here, he
was able to show Lhat combining this ATm with AHf, Tm and two estimated con-stants led to a solution for y 2 . Since y, the liquid surface free energy,is readily measured, the addit on of this ?o y12 yields the desired y- for thesolid. I
The second technique (Glicksman 1969) involved measuring the dihedralangle between adjoining crystals, T, and the lattice tilt misorientation angleP. While these angles are not independent, it appears better to measure both.Then,
1Y12 = Eoln 9/2 (A' - cos (T/2)) (IV-5)
where A' is a constant (eliminated in a regression procedure), and E is a func-tio.i of the Burgers vector (lattice spacing) and the elastic constan~s of thesrlid, to be measured in separate tests at the melting point. This technique:,as not been as thoroughly tested as Turnbull's but appears to give good re-sults (IV.4 below).
Both of these methods have the same limitation as Udin's of giving1 near the melting point and so requiring adjustment to the desired tempera-
ture. The use of other liquids solves this problem but introduces many others.Perhaps the greatest sacrifice is loss of the quite reasonable assurance of aclean interface in the rurnbull and ulicksman methods. Where a solid surfacemust be fabricated and brought into interaction with a liquid, contamination isalmost inevitable, and drastic cleaning procedures are in order (Buckley 1966),but forming the solid from the liquid prevents most of the possibilities.

A
-264-
Zisman (1964) and his group have done a great deal of work on contact
angles, from which arose the concept of a "critical surface tension", y . Thisis the surface free energy of the liquid, from a "homologous" series of hydro -
and halo-carbons, which will just spread on the solid. Though Zisman has is-sued many warnings against using Y as the surface free energy of the solid,some experimenters persist in doing so - to their own discredit. One of themost dramatic warnings was by Burnett and Zisman (1968); as shown in Figure7-2, they found Ye to be the same for all metals. The true meaning of ycwill be discussed in Appendix V.
IV.3.3 Calculation Methods
It is highly desirable to have a system for calculating surface freeenergies of solids, because of the limited supply (and accuracy) of literaturevalues, and also for increased understanding. As will be seen in Appendices Vand VII, there are unanswered questions on interfacial matters and also on theentropy of surface formation which a good mathematical model of surface freeenergies would help to answer. Two approaches have L'env tried; one is basedon bulk energies and parallels Appendix III, while the other is more funda-mental.
IV.3.3.1 Calculation from Bulk Energies
If the reasoning in Appendix !II is as sound as the results indicate,it should be possible to calculate not only y values for solids but even par-tial values as suggested in Footnote 2, page 254. Several possible modes offer
themselves; the simplest being to substitute the heat of sublimation (AH) forthat of vaporization and change the molar volume to that of the solid. X lessheroic approach is to use the measured value of y2 at the melting point, andadjust it via the heat (/1HM) and volume (.,Vf) change of fusion to the solidjust below melting. Suitatle heat values are listed by Kubaschewski (1967) formany substances. These concepts are by no means new, having aeen forecast by
Bondi (1953) and further developed by others (Duga 1969). What is new is theadditional degree of flexibility afforded by the Hansen parameters, as demon-strated in Appendix III. Discussion of the latter will be given in Appendix V.
IV.3.3.2 Calculation from Lattice Parameters
An amazing number of papers have been published on generation of sur-face properties from the basic lattice spacings, inter-atomic forces and elec-tron distributions. Many of the results have been ridiculous, including thenegative values for c mentioned above, but the results are getting closer toreality. In a recent paper, many of the metals were predicted (Lang 1970) towithin t:xperimental error. The sole exception was lead, which might possiblytie in with its anomalous behavior (4.2, 7.2).

- 265 -
The post significant finding of these workers is that each pair offaces on anisotropic crystals has a surface free energy unlike the other pairs.This is really not surprising when one examines a crystal lattice model; allthree pairs have clearly different atomic arrangements, even fon elements; forcompounds, -he difference is even more striking. Some of the computations aredetailed enough to show the concentration of free energy at corners (Bruce1965); this is in rough agreement with the experimental dislocation energiesin Section 5.6.5.
One method deserves special mention because of its very close ties tothe Glicksman method (IV.3.2). It was developed by Kotzi (1966), and startedfrom the same E° function for simple tilt boundaries:
E = Gb/47 (1 - V) (IV-6)o
where G is the modulus of rigidity, b the Burgers vector and V Poisson's ratio,all measured by the melting point. From this and a few other considerations,including averaging in E for twist boundaries (Gb/2),o
0.85 [ 1 1 ] b (IV-7)Y12 16- - v
where 0 mi the maximum angle of misorientation. Taking this as 25° and V as1/3,
Y12 = 0.0258 Gb (IV-8)
iV.4 Comparison of Experimental and Calculated Results
In order to implement Rabinowicz' theories, as well as those of theinterfacial workers in Appendix V, it is necessary to examine the tools whichare available in a critical manner. The following sections attempt this, buttime has not permitted inclusion of all the latest data. The reader should goback of mid-1970 or earlier to collect the flood of experimental results com-ing from all parts of the world, and regard the following only as a beginningto an ever-sharpening focus on the y values of solids.
IV.4.1 Organic Solids
In contrast to the profusion of data on organic liquids, very littlehas been done on organic crystalt. Up to the cut-off date (February 1971 onChemical Abstracts and Engineering Index) only one study (Jones 1970) had beenreported. He used the Glicksman method on camphene and succinonitrile. Theresults appear plausible, but there is only the heat of fusion theory against

- 266 -
which to compare them. His results on water and phosphorus are subject tochecks; the water data disagrees with nucleation and some theories, but checksvery well with KotzC. The phosphorus data checks both nucleation and heat offusion quite well. Fortunately, this neglect is no great loss to lubricationtheory.
More relevant is the work on polymers and plastics, which have in-creasing importance for oil-less and lubricated bearings (see 5.1). Some verygood data have been obtained from polymer melts (Lee 1967, 1968; Wu 1969)though there are two questions on extrapolation to room or working temperature.The first concerns the degree of crystallinity. Polymers which simply becomeglassy are no problem, but many undergo partial crystallization at a fairlysharp temperature, leaving the rest of the polymer as an "atactic" glassy vis-coelastic liquid. Should y be corrected for the heat of fusion of the "iso-tactic" portion? Fortunately, this would he a small correction and can be ig-nored for a first approximation. The second is one which haunts ll workers onsolids - is the surface of the same composition as that of the liquid? As men-tioned in 5.5.4, the Gibbs principle states that at equilibrium the system willachieve the configuration with the least free energy. In simple hydrocarbonpolymers, this will lead to the atactic phase domin.ting the surface so that theY estimated from the liquid tests will be correct. However, many polymers arecomplex in the sense that each link contains groups of two different cohesivenergy densities. As in the case of the monohydric alcohols (Appendix Iii), thismay lead to some sort of surface orientation if the geometry of the moleculepermits. Thus, while the dimethyl silicones can exhibit only one kind of sur-face consisting of methyl groups somewhat modified by the -0-Si-O-Si- backbone,the methyl tetradecyl silicones (Brown (t$70) can exhibit remarkably wax-likecharacteristics under some circumstances, while other conditions bring outresponses typical of the backbone. Even more impressive are liquid mixtures;as discussed in Appendix VI, these will show surfaces typical of the total mix-ture on a short-time scale (such as foaming in a distillation tower) but re-flect the properties of the lower y component on a long-time basis. As liquidsapproach the glass transition point, the meaning of "short time" must be expandedto approach infinity, due to the increased viscous resistance to segregation ofchemical types or groups. This parallels the phenomenon of "plastic memory",in which physical distortions held in a polymer are frozen, only to have thepiece revert to its original shape on warming.
Thus, a piece of plastic may have one surface, when cooled fromi itsmelt, which corresponds quite closely to that. of the melt, and quite anothersurface when sliced below its glass transition temperature. The latter wouldbe a true sampling of all the chemical groups on a numerical basis, as opposedto the essentially Gibbs situition on the cooled melt, and hence would show ahigher y value. Other possibilities arise when a surface cooled by some othermedium than air is considered; presumably water quenchinw would call forth quitea different Gibbs situation, with any hydrogen bonds as exposed as possible,while metal etc. molds would doubtless cause special surfaces more related toAppendix V. Somne of LhesO would have higher ) values than the cold-cut surface.However. annealing in air would restore the 'r value extrapolated from th, i.eLIt.

- 267 -
In view of these peculiar variations in surface composition, it isnot surprising that variations in yc are found, nor that they increase withincreasing complexity of the polymers. Low values of yc appear to match fairlywell with y values extrapolated from melts, but at higher values y tends tobe lower. This is due to the fact that the probe liquids used cannot interactwith all the forces at the polymer surface (Appendix V).
Wu (1968) provided an excellent fit of the yc data on most of the com-mon plastics, with an equation developed from Hildebrand (1950). However, itcontains several features that make it unacceptable on any other than a crudeempirical basis. It is dimensionally unbalanced, and is keyed to the numberof atoms in the monomer. Wu builds up his energies from the Small (1953) sys-tem, and so his results include the London, Keesom and some of the electronacceptor "H-bond" forces. As shown by Panzer (1972), this gives a very in-adequate picture of wetting energy, but Wu's is the only system that permitsbuilding up y from the structural formula and so must be mentioned. The ex-perimental measurement of the partial surface free energies is taken up inSection 5.11 and Appendix V; this is the recommended approach for all polymersand plastics.
IV.4.2 Metallic Solids
Until recently, surface free energy values for solid metals simplywere not available, and many surface chemists working mainly with liquids stillbelieve that to be the case. As recently as 1965, Rabinowicz was ableto find only the values for liquid metals discussed in Appendix IIl, and for afew solid non-metals. Since then, the materials scientists have made a gooddeal of progress. Direct measurements on nine metals are shown in Figure IV-l;these were obtained by Udin (1949), Blakely (1966) and Allen (1969B). The com-parison is with data on the liquid near the melting point as compiled byGrosse (1964). The very low value for nickel was verified by repeated experi-ments by Blakely; the low position of the whole iron group is probably due tonegative volume changes on fusion. The cobalt value is by Bryant (1968), andis believed correct. A low value for molybdenum in Progress Report No. I hasbeen replaced by a later one (Ehrlich 1968).
Also plotted in Figure IV-l are a number of results obtained by com-bining Grosse's value for the liquid with y . Most of the latter are fromTurnbull (1950), but Bi is from Glicksman (169) and Pb (same method) was re-ported by Jones (1970) from unpublished data by R. L. Morris. Agreement withthe Udin method is extremely gratifying, as are the high correlation coeffi-cicnts of the Udin method alone (0.982) or the three combined (0.981). Thus,we may say that the problem of predicting surface free energies of solid metalsjust below the melting point is solved by multiplying the liquid value by 1.14,with a few exceptions due to negative change of volume on fusion.
The single Gilman cleavage value shown is for an exceptionally brittlemetal, zinc (Maitland 1969). It falls far below the line. This cannot be at-tributed to its hexagonal structure, as other hexagonals (Ti, Co) fit the linequite well. The fault must lie in the cleavage method, probably due to the Fox(1970) temperature rise as the negative dy/ds idea seems increasingly untenable.

IV.4.3 Ceramic (Inorganic Non-Metal) Solids
Work on ceramics has largely been limited to the Gilman method. Asshown in Figure IV-l, the results line up quite well with that for zinc, andshow a fairly respectable correlation coefficient of 0.927. Obviously, theconclusion must be that the Oilman method does not yield results which are com-parable with the v:ore creep or other methods, and which are far lower than theliquid values. One might set up an empirical correction factor of 1.14/0.66and multiply all Gilman results by 1.73, but it would seem wisor to wait untilsome substances have been run by all the methods. It would not he easy tofind a material brittle enough for the Gilman and ductile enough for the lidinmethod, but some of Gilman's samples could be tested for nucleation or di-hedral angle. (Ho reported several for which no )2 was available, that are notshown in Figure TV-I.) Perhaps in the uncorrelate 1970-71 data there isenough evidence to make this decision. Meanwhile, casual scanning of it. (in-cluding Jones' P and 1I,,0) indicates that the three methods that agree agj goodenoug-. A single point on Figure V-1 was derived by -y) + 0.0715 .H f/V' ; it.was for A1203, and appears to fit the line quite well, -o this route is alsoopen.
Nurse, (1968) gives a number of other methods for use on ceramnics,Some are not relevant, but other . are quite provocative if regarded as possiblesources for surface distortion energies.
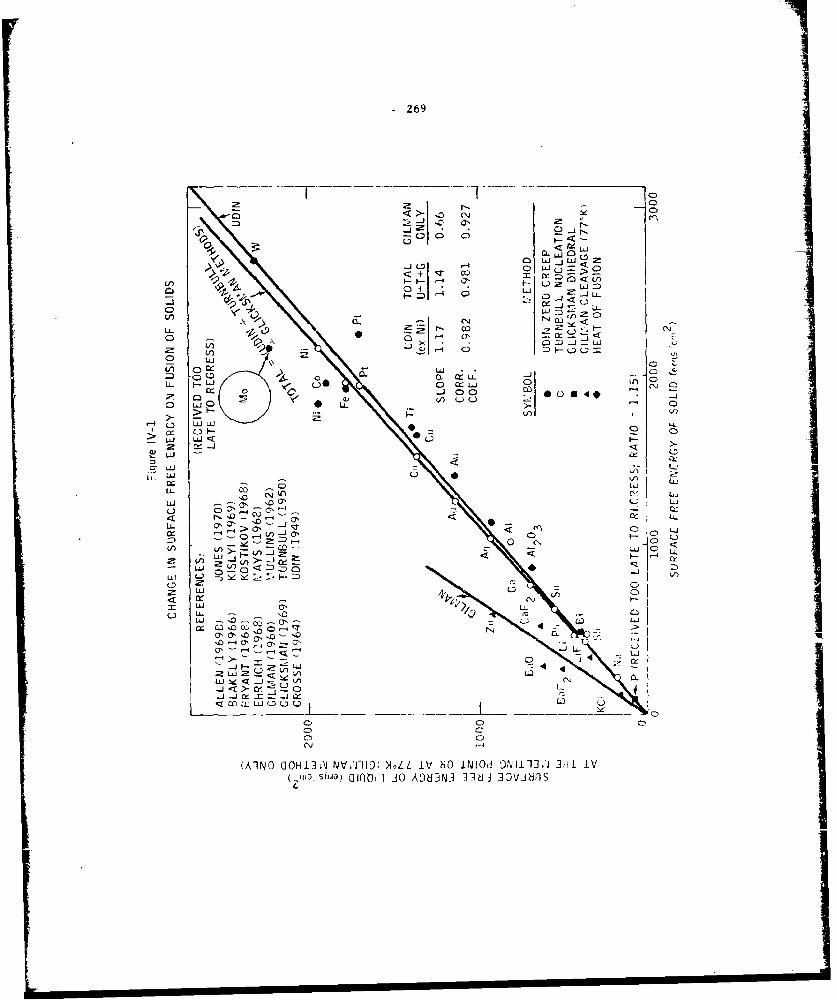
-269
Z ND<o LYJ~ C' aJ C.
%) _j Ua
0L0
22 A CD
LLa
0- W k L C >
00 0
C) ujLZin kI - iYA03 w U
uj uj0-a"-'
0u-ja
ui0 2!Ujo
LL cr ' --oAL
> - L1J
0)1
tn 01- -C

-270- 1
APPENDIX V
INTERFACIA!. ENE RIFSOF PURE LIQUIDS ON SOLIDS
V. 1 Introduction
It was anticipated, when Appendices III and IV were fitst prepared, thatthey would p:ovide more or less direct solutions to the various interfacial energiesinvolved in lubrication. These may be classified as follows: (1) metal/metal, (2)ceramic/metal, (3) ceramic/ceramic, (4) organic/ceramic and (5) organic/metal. Itnow appears that only classes (1), (2) and (3) can be solved in such wholesale fash- 4ion-and these all concern unlubricated systems, borderline to the scope of thisSTAF. Class (4) proves to be of only transitory interest, since it only covers oilwetting a film of corrosion products that will soon be swept away. The main objec-tive was class (5), and it is evident from Sections 5.5.4 and 5.5.5 that metalswith higher rI (or harder; see Figure 7.1) than copper or silver ;ire only wettedby lubricants for the brief time it takes to decompose the lubricant (and perhapsto convert the metal to carbide). Thus, class (5) proues to be limited to thesofter metals (babbitt, bronze, lead) which are usually paired with steel, and itis necessary to establish a class (6) covering the interfacial energy of oil againstthe surface resin formed by its decomposition.
V. 2 Definitions
As before, it is necessary to deal with energies that have been mis-named and re-named to the point of chaos. The convention I = lower phase and 2 =upper phase (Philippoff 1960) will be continued. interfncial free energy hasalready been defined in Appendix TV and discussed in Sections 5.8, 5.11 and 7.11.2.Equation (IV-4) and (IV-5) are both special cases of the general equation
"'12 = Ylv - rZvY-12 (V-l)
where K12 is the ratio discussed in 7.4 and Figure 7-1. For the Antonoff (19142)situation K = 1.000. If there is a contact angl (e), KJ2 = cos 9, and forstrongly weing systems K12 >1, even up to 6. (Philippoft 1960, Gans 1970).
V. 2.1 Spreading Pressure
An important aspect of Equation (V-l) is the "v'" subscripts, indicatingthat and 1-2 are measured against the vapor common to both phases, ratherthan air. This difference is usually trivial for w t o e
-I by less than 1% because the lower phase is frequently the less volatile, sinceit is a solid (or a dense liquid). The difference between y, and yv can havemuch more dramatic effects; it is defined by
= "I Y-lv (V-2)
This is the spreading "pressure", which is not a pressure at all but an energy.The writer would like to see it more appropriately renamed, but will use the ar-chaic "pressure" in this Appendix even though some (Claytield 1957A) use thisterm for "spreading coefficient" (see V. 2.3). Where possible without creating
1 :
. . .. = i t ,, . ' ' I ....... ........ . . . .... .° : .. l - . . ... .. .. '

-271-
technical problems, the "v" subscripts will be omitted. Thus, Equations (V-I)and (V-2) combine to
Tl 2= l7 T 2 K2 (V-2A)
Spreading pressure at equilibrium can be estimated from the vapor ad-sorption isotherm and the Gibbs adsorption equation (Zettlemoyer 1968), butwith lubricants the low vapor pressure means that equilibrium may not be attainedfor a long time. Even without this complication, the problem is a formidable one,since the vapor adsorption isotherm is not easy to measure and even more difficultto predict.
When K<l2 >1.0, the spreading pressure as such disappears, but an equi-valent problem arises. The use of Equation (IV-4) is so set about with rules(Antonoff 1942) that it is a major task to perform a prediction. First, thesolubility of each phase in the other must be computed. This can be done (Praus-nitz 1969, Good 1970), but with increasing difficulty as the compounds increasein polarity.
Surface free energies must then be computed as discussed in Appendix VI.However, the experimental approach is not easy either, since Antonoff required 10days of equilibation for phenol-water, and 30 days for isobutyric acid or iso-amyl alcohol-water interfaces.
It should never be thought that such precautions are un-necessary becausethe phases are "immiscible." Literally all substances are mutually soluble to someextent; even the solubility of mercury in i-octane can be both computed and mea-sured at about 5 p mole/liter (Thomsen 1968). Thus, Equations (IV-4) and (V-l)are deceptively simple, though such low soluLilities as that of mercury in i-octanecan be neglected.
V. 2.2 Work of Adhesion
This term, at least, appears to be universally accepted. It is the mech-anical work (a special sort of free energy) exerted in pulling a unit area of phase2 away from phase 1, and is calculated by
A12 = Y1 + 2 T12 = 1,2 (1 + K12 ) (V-3)
It is important to realize that A and y behave in opposiee ways; poor adhesionis characterized by high y12 and 19w A b, hile good wetting typically Thows highA and low In fact, even negatie volues of y have been seriously discussed,bu the writer considers these to be merely mathemat cal abstractions expressingdemands for free energy which are soon filled. Even the poorest wetting cannot
produce a zero value of A12; the universality of London forces assures that K12 willalways be greater than -1.0; very rarely is it even as low as -0.866 (8 = 1500).
V. 2.3 Spreading "Coefficient" (Free Energy)
Another combination of r, Y2 and )l2 which has some usefulness is thespreading free energy
F2 1 = Y- - Y2 - -1 2- 2 = -2(K12 ) (V-4)

- 272 -
This describes the spreading of phase 2 or phase 1.; for the inverted case, ifphase I can be floated on,2,
F 1 2 = 2 - )"1 - 1"12 = A12 - 2)- = I' (K2 I) (V-5)
As can be sooti from these equations, F is in no sense a coefficient, and use ofthis term should be discouraged. Apparently "spreading pressure" means F21 inEngland (Clayfield 1957A).
V. 2.4 Adhesion "Tension" (Free Energy)
Among the other left-overs fom past ages is the concept of an "odhe-sion tension." This ihould properly be called adhesion free energy, and is de-fined by
B12 - K1 2 "r2 = A1 2 - 2 = 1 12 (V-6)
B12 is not very useful within the scope of this STAF.
V. 2.5 Heat of Immersion
The value needed for this STAF is the heat of immersion (Section 5.4),sometimes called "heat of wetting." It is related to the total surface energy(IV. 2.2), and is defined by
E2 AI 2 - TA 12 12 - T (dAN 2 /dT) = (i + KI 2 ) E2 - 2T (dK 1 2 /d1) (V-7)
Use of this equation requires measuring A12 or K1 2 at more than one temperature,which the surface chemaist rarely does. The importance of the entropy trni (T,'S 1 2)varies with the system. Philippoff (1960) cited work showing 'SI2 to representI38 to 40% of E12 for organic/inorganic interfaces. This will be further discussedin Appendix VII, but it is of interest to note hero that 1:12 shows only slightvariation with temperature.
V. 2.6 Heat of Adsorption
Generally means "from the vapor phase", and so should differ from theheat of immersion by a heat of vaporization. Both must be expresse9 in consistentunits, which requires knowledge of the surface coverage in moles/cm . As anapproximation, the "molecular diameter" used in Equation (5.4-8) may be used, sothe heat of adsorption
2= /3 V 2/3 (V-8)12 = E2 + "v /(4/3)2/ ia N
where J is the mechanical equivalent of heat (ergs/cal) . Of course, if the "vapor"is a fixed gas (above T,), &I = 0 and H12 = E2,
The same term is often used for the differential heat of adsorption fromsolution, &E in Equation (5.4-21), with quite confusing results. Methods for AEare discussed in Appendix VI, under "Heat of Displacement."

I
~73
V. 3 Calculation and Measurement of Interfacial Energies
While Good (1970) has developed excellent methods for calculating liquid/liquid interfacial energies, he expresses strong reservations about the use of
these or other proposed computations on liquid/solid systems. However, for thosewilling to study through some 1.25 equations, his paper does offer some hope for
going beyond his stated limitations. In Section V.4 some attempts will be shown
for computing solid/solid interfacial free energies from the 71 values inAppendix IV. However, the rest of this section is limited to the many methodsfor measurements at the liquid/solid interface.
V. 3.1 Contact Angle Method
The basic technique for contact angle measurement is simple, but theinterpretation can present formidable problems. One of these is evaluationof the spreading "pressure" (7), as mentioned in V.2.1. All too frequently itis either ignored or assumed to be zero, with chaotic results. Gans (1970) gives qan excellent summary of the methods that may be used without getting into thedifficulties of vapor adsorption. Using the extrapolation procedure in Fig. 7-2,he obtained F12 values for liquids spreading on liquids. By analogy, this shouldalso apply to smooth, uniform solids wetted by liquids.
On less idealized solids, complications arise (Zettlemoyer 1968, Zisman1972) . Surface roughness has an effect on contact angle which can be estimatedby well-known methods (Wenzel 1949), but heterogeneity creates a different typeof problem. In this case, there is a difference between advancing and recedingcontact angles known as hysteresis (Johnson 1964, Neumann 1972). The advancingangle relates to the low energy portions of the surface, and the receding angleto the higher energy portions. The worst problem is the ubiquity of subtle sur-face contamination. The current horrible example was that a considerable liter-
ature was built up on the "contact angle of water on gold," until Zisman (1972)showed that, in hydrocarbon-free atmospheres, water wets gold readily and completely.
_ Despite all these hazards, the contact angle merhod has given much helpto those concerned with adhesion to plastics (Zisman 1964, 1972). Perhaps it
would have been more useful in lubrication if it were not for the high Y1 ofmetals which leads to K12 >1.0, and the irreversible chemistry noted in 5.4.4. I
Contact angle data are not meaningful until analysed into some sort ofpattern. A number of attempts have been made to do this; only three will be dis-cussed below. 7
V. 3.1,1 The Straight Line Assumption
Zisman (1964) set up a "homologous" series of liquids designed to pro-vide non-polar interactions with solids. We now know that the higher y2 liquidsactually are both polar and H-bonded (Panzer 1972), but this series proved to
yield straight lines when cos ) was plotted against y as shown in Figure 7-2.Other series, including those known to H-bond, tended2also to give straightlines with a different y- " The "non-polar" series has received the most atten-tion because of its appaent dependence on London forces alone.
This line can be described by yc and the slope m (= AK1 2/6 12):

-,274 -
K = m (I Y2 + I (V-8)
which provides an analytical solution to the problem solved graphically in Figure7-2. By combining Equation (V-8) and (V-3).
A1 2 = (2 + myy2) 2- m 12 (V-9)
This con be differentiated with respect to 12 and set equal to zero to
locate the maximum work of adhesion:
dA12/d 2 2 + m yc -2m12 = 0 (V-10)
from which
y2 0.y c + I/m (V-Il)
For aluminum, yc = 45 and m = 0.0052, so the maximum work of adhesioncomes at y2 = 200; for zirconium (m = 0.028), it comes at 1, = 60 ergs/cm . Thus,it appears that for all the metals in Figure 7-2 (and all ofhers up to m = 0.044,which would he a very energetic metal) the principle stated by Campbell (1957)that a partially wetting liquid provides optimum lubrication may he valid. How-ever, it must he remembered that the surfaces in Figure 7-2 (Bernett 1968) wereprepared in such a way as to leave a hydrated oxide surface, and also that thelinearity of Equation (V-8) is limited to Zismpn's hydrocarbon-holocarbon series(Panzer 1972). The latter certainly does not include anything approaching ), =200; such a liquid would have to be either ionic or metallic (Appendix III).
Even with these reservations, it is still interesting to check what theA12 maxima would be. Combining Equations (V-9) and (V-1l),
(A 1 2 ) max = I/mn + Ic + 0.25 m yc2 (V12)
The result for aluminum is 236, and that for zirconium 96 ergs/cm2 . Both areappreciably higher than the 2 y freqiuently quoted. To complete the picture,the contact angles of these hypothetical optimum lubricants would be 51.5 ° onzirconium and 80.8* on aluminum.
V. 3.1.2 The Hansen Plot Approach
The Hansen partial solubility parameters were discussed briefly in Sec-
tion 5 and Appendix Ill, and are covered quite thoroughly in Appendix VIII.However, a few improvements in the system have been made which should be coveredbefore proceeding further.
V. 3.1.3.1 A new homomorph chart for 6 was recently devised, and is awaiting pub-lication (Beerbwer 1972R), for n-al and isoparaffin hydrocarbons of essentiallyunlimited molar volume (Figure V-i). It presumably combines the best features ofthose by Blanks (1964) and Beerbower (1969), and may be used for determiaing theLondon force partial solubility parameter ( D) of any non-cyclic cn-pound for whichV and TR can be estimated. Maffiolo (1972) has just published an elegant methodfor cmouting cohesive energies, but its relation to Figure V-I has not been tested.

- 275 -
z -1
o < >UJILL LL
'I))
01C-))
L0C.. 0 0n Li
t-:1-
01) 33 V ~ 3~lNCN -

- 27b -
V. 3.1.2.2 A valuable new correlation which offers a simple route to thedispersion parameter, and can also be applied to liquids of indefinite composition,has recently been made by 14. M. Salathiel (personal communication, 1971). teshowed that 88 compoundS in Appendix VIII for which sodium D-line refractiveindices (% ) were available at 25C were fitted by the equation
S= = 4.22 (nDQ - 1) + 3.75 (V-13)
to Within:tO.s units. Inclusion of 64 mere compounds for which values wereavailable only at other tomperoturus did not change the slope but did increasethe sca tter. The writer added unpublished values for 21 petroleum solvents, whichresulted in only minor readjustment of Equation (V-13), as shown in Figure V-2.
V. 3.1.2.3 A partial table of group contributions to the polar and electrontransfer parameters was published by Hanser (197J)(see Appendix VIII)0 A morecomplete Version is awaiting publication (Beerbower 1972B). These are of use inestimating the properties of synthetic lubricants, including even those whichhave not Yet been made. By this means it should be possible to "design" alubricant to match a given surface for which the three partial parameters areknown, or to minimize At 2 if that is desired for combatting fatigue.
V. 3.1.2.4 Broadening the scope of 3 from the original concept of hydarogenbonding hs been accomplished gradually, until now it oppears best to des-cribe it as tie "electron transfer parameter." Ragiya (1968) repeated the mea-surements of Gordy (J939) and found that many of the older data were inaccurate.lie classed these measurements as electron donor energy, and correlated them withionization potential, Lewis base number (pKb ) , iodine charge-transfer and coordina-tin power with diethyl 21 nc. Electron acceptor energy, measured by shift of theC=O banu , was less impressive but did correlate with Lewis acid number (pK,).
For use as an engineering tool, the writer feels that the "donor" energyalready shown to correlate wi th VO (Beerbower 1969) is all that is needed. Thisencompasses a] the i-eracrions, Uy using the scaling factor b in Appendix Ill,Equation [7] it 1,000 for vaporization, 0.643 for surface formation and 0.25 forsolution. This loss of scientific exactitude relieves us of the necessity forstrict accountability for "donor" and "acceptor", and permits viewing V6' as theenergy of an electron trnsaction. i
V. 3.1.2. 5 As many authors have pointed out, 61 can not be expected to obey thegeometric mean rule which is central to the solubility parameter concept
A2 A 0. 5 (V-14)
This fiict had to be recognized in preparing Appendix VIII. The geometric mean,Is s Iv!nIf by I sa 1 (1953), lad r h,' frm
6= (Y: 6)/X 'i (V-5)
2This worked out well for 6 and 6p, but not for 6 where the energy V6 2 provedto be the better group contribution.
Zttleinyor (1968) observed that, in cases where the geometric mean

- 277 -
Figure V-2
PREDICTION OF LONDON PARAMETERFROM REFRACTIVE INDEX
2.7
2.6
i0
2.5 -
2.4 .0 0
2.3+0
040 -4- 0
.2.2
CM a
*+
2.0 .
t ,88 Points fromHansen (1971)
+" and the CRC Handbook
1.9 - "of Chemistry & Physics2.1 4.22 ( 2 _ + 3.746 + 0.5
D, D
.8 -+ 21 points from
unpublished data
on petroleum solvents1.71
6 7 8 9 10 11 12 136o AT 25
0 C 0l

4
J
- 278 -
was inappropriate, the arithmetic mean could be used, and this approach will befollowed for 61 as an engineering approximation.
V. 3.1.2.6
The original Hansen plots were used for polymer solubiility, and thecontour circles (representing the three projections of a spheroid on the 2o,0/BH, 8 H/5 p and 8 p/28 D planes) were drawn at the "almost completely soluble"(see Figures 5.4-10, II and 12). This concept was expanded by Beerbower (1969)to cover elastomers, and the contours were drawn at 25%/, swelling of elastounern.The third version (Hansen 1970) used cos 9 as the plotted variable, and thecontour was drawn at cos A = 1.0 to enclose all spreading cases. His paper gave J
data on two plastics, and also a mixture of them which proved to be quite dif-ferent from what would be expected. He also showed that two chromated "tinplate"surfaces showed appreciable response to 0'H. This is discussed in V. 3.9.2.
It is evident that these plots -provide a very powerful tool for da ta
analysis. lowever, aside from the untested Equation (5.11-7), no method isavailable to convert them to work of adhesi on. A cecent advance in processingcontact angle data is discussed in the next section.
V. 3.1.3 The Panzer Plot Approach
Panzer (1972) followed up the iden expressed it, Appendix III , Footnote2, and converted the partial parameters listed in Appcndix VIEI tr partial 4sir-face free energies. Having reviewed all the various methoIds tor anlivs ng con-tact angle data and found Hansen's (1970) to be the be.st-, he wanted to go a stepfurther. One fault in the plots discussed in the ahove Section is that theytake no account of the molar ye lume (V). To the paint technologists, this is 3 ofno great moment as most of their solvents fall into the class V = 100 20 cm ,and for most of their solutes V - . This is not true for lubricanrs. P;a-zer saw that the type of equarion suggested hy Fowkes would simplify this andother problems:
d p) hY= d2 + "p + I-2 (V-lb)
dIwhere I rpPresents the London force contribution, the Keesom force contribu-tion and yI tie electron transfer contribution, with room for expansion it ionic(t) or metallic (ym ) forces are involved.
As was to be expected from the scitter in Appendix Ill Figure 1, someproblems were encountered with poor fitting. Panzer solved this by adjiistitivall three parameters proportionately to add up to the observed ) . These aid istedpartial surface free energies were thet plotted, just as the partial 5 valuvs are,in a Hansen type plot.
The results, based on the number of probe liquids shown in Table V-I,proved to be somewhat simpler than those from the Ilansen plots. Thou'h ellipsoidswere required in several -ases with the y plots, a bimodal response obtained withthe 6 plots was el misated, The rentors found are shown in Table V-I. However,it is necessary to give serious thought to the conversion of these vuergive intowork of adhesion, since Panzer did not den] with that step. Fowkes (1964) workedfrom the premise that
112= -+ I2 - 2 Ji 7 (V-17)
.]

-279. .=
where only London forces crossed the interface.
TABLE V-I
RESULTS OF PANZER PLOTSI
Number Of d hSolid Probe Liquids Y I - -
n-Octacosane 40 21.8 0,6 1.1 23.5
Polymethyl 78 25.9 5.3 1.7 32.9
methocrylate IVersamide 930 79 26.8 3.3 1.5 31.6
Lithium Stearate 70 22.8 2.0 1.0 25.8
However, this has gradually had to be extended to include terms forother forces. Combining (V1-17) and (V-3), and adding p and h terms,
AI2 - 2Y 2 P + (V-18)h
Since T probably dces not obey the geometric mean rule, as discussedin the previous section, remains unresolved. Acting on Zettlemoyer's (1968)suggestion that the erithmeic mean could be successfully substituted, it verytentatively proposed that h
Y12 ' YI + 2(-9
would provide an easily testable completion to Equation (V-18). Any group chargedwith continuing this program should be instructed to replot all the Hansen chartsmentioned in the various sections, to determine whether the Panzer-Hansen methodleads to plausible values of A12, via Equation (V-19) or some alternative route
(i.e., the harmonic mean).
V. 3.2 The Panzer Powder Wetting Method
Panzer (1972) reported work closely related to the contact angle studiesin the same paper, based on powder wetting. This idea can be traced back tovarious studies on sedimentation volume etc., but took the unique form of titrat-ing a powder with the probe liquid until the next drop wetted the container wall.This point can be related to the adhesion "tension" (free energy) I1, Resultscan be obtained with both wetting and non-wettiog liquids, and plots of titrationvolume against .1 show a maximum. Panzer prepared both 6 and y plots (see V.3.1.2and 3) for versamIde and lithium hydroxy stearate and found them similar to hiscontact angle plots. More recently, he has used this technique on aluminum powder(personal commnunication) and (;oldblatt has tried it on iron powder (personal corn-unication) as prepared by Groszek (1970). Both metals were found to show appre-ciable op and 6 H energies. Problems in preparing relevant metal powders are dis-cussed in V.3.6 below, and the results are discussed in V.3.9.2

- 280 -
V. 3.3 Liqui.d Metal Interfacial Methods
Although liquid-liquid interfaces are outside the scope of thi.s STAF,it seems relevant to include a Hansen plot of Harkins' (1920) data for work ofadhesion on mercury (Figure V-3). It is evident that this metal, like chromatedtin, participates in electron transfer bonding. Mention has been made of the
work by Zadumkin (1965) on mercury and Karashaev 1968) oil gallium. The formeris included in Figure V-3, but the gallium data is too scanty for a Hansen plot.
Bridging the gap is Smith's (1969 A and B) use of a film balance formeasurements on mercury. The most startling result was that fatty acids with lessthan 15 carbons stand with the COO away from the metal while the longer acidstake the conventional position of COOH down.
Presumably liquid meLal data can event ua lly be used in predicting A 9on solid metals by using All as shown in Appendix IV. However, mercurv is tooirregular for such studies, and there is not enough data yet (in liquid regularmetals to test this idea.
V. 3.4 The Film Balance Method
Use of the Langmuir-type film balance for measuring work of adhesion isrelatively rare, but offers some advantages over the contact angle method. Theversion developed by Washhurn and Andeison seems well adapted to the liquid/solidinterface problem.
Clayfield (1957A) measured the adhesion of a variety of pure hydrocarbonsto chrome-steel and chromium surfaces, and later (1957B) extended the study tonew and used lubricating oils. The procedure is quite simple: The cleaned metalplate is placed in tile trough and the water level raised to just cover it. Amonolayer of a suitable compound such aq n-octadecanol is floated on the waterand 0.02 ml of hydrocarbon dropped in so it breaks through the film and thewater to wet the metal. The octadeconol layer is thcn pressed up with the fi Imbalance, and tile force/cmn to just prevent spreading of the oil on the metal isrecorded as the critical film pressure (F). 'The situation is then as shown inB of Figure V-4. Calibration of the apparatILs by varying the depth of waterpermits evaluation of the contact angles, from which the work of adhesion on16.5% chrome steel is
A 12 = 0.525F + 13.3 + 2-2 (V-20)
The results for some typical hydrocarbons on chr,.mium surfaces are shownin Table V-Il. These are the extreme values found for isoparaffitns, naphthenesand arowatics, and led Clayfield to conclude that the composition of the oildid not cause drastic changes in A 2. He also found thait there was a great diff-
erence in solids. Organics gave Fc values (not converted t, A 1 2 , for unstatedreasons) of 13 to 28, chromium gave 7 to 20, and various chrome steels gave 0 to14. Eight other steels containing less than 1.67% chromium, and aluminum, showedhydrophilic surfaces (F <0), and could not be tesqted by this method. Even thechrome steels, when ioncbombarded and first wet with water, became hydrophilic.The lipophilic surfaces reported in Table V-il were first wet with any of seve-ral organics. Hexane, cyclohexane, benrene and other apparently all gave simi-lar results. Evidently Model !!!C s,.r arc re-;i ; ; " V,,uVtid in this phenomenon.

I
- 281 -
Figure V-3
WORK OF ADHESION OFLIQUIDS ON MERCURY
10 0H
9
7+ +
5 3
+C3
+ Y
12 3 4 5 7 8D + 0 0 0
o 161 to 233 o +
+ 146 to 160
131 to 145 +I 110 to 130
(ergs/cm2 )9Center: 160
8p : .5 0 0
I11- 8D
Data from: Girifalco and Good, J. Phys. Chem. 61, 904-9 (1957), exceptthe value for nitroethane was altered to conform to Harkins' value in "PhysicalChemistry of Surface Films", Reinhold, 1952, page 29. Four acids werenot plotted as they bhow evidence of chemical reaction with the metal surface.
I " + . . .. .. .... I + ' : + i I I I I

-282-
FIGURE V-4
On INWVATERt LAYrk WITHCO 0ISN
I~L P A .LIN -M0
TSSV
Cinjsin the oil lensimetl Pla~txater laye, S)ystei in measuvring spreading pressureof oil 0750 mel01 surface. D..iilsaewt ihconroioims.si, f. 7ut sPrior t,the b lee-Poi wtl corntressinq, film, Presvre .1s /.ii4r t h /e ciia im/fSi,C, Rrea/.a7,aY of Wltfr froms Oil tens vuih cointresmg firt piessurt just loiter than thecritical film Piessure. D, IIiter laser almost eombitlelv receded iih ccmporo.i,, pl
Pirso~ire much lower than7 tise crir'cnl Jun;I psessure
TABLE V-II
Typical Works of Adhecsion OnChromium by Washburn - Anderson Balance
________ Hydrocarbon ______ (dynes/ci-,) (osrgsl/cm
7-butyl tridecane 22.0 78.8
7,12-dimethyl 9,lO-di-n-hexl octadecane 7.0 63.0
1,l-dihexahydrobenzyl undecane-- 11. 7 80.2
3.,4-dlcyclohexyi butane 12.6 81.1
1,6-diphenyl hexane 17.0 93.4
l,4-.ci-n-heptyl benzene 9.3 76.2
I
283 -
This method gave plausible results, but the question of the nature ofthe surface renders it of dubious value.
V. 3.5 The Guastalla Wetting Balance
Guastalla (1956) devised a modification of the Wilhelmy method in whicha plate of the metal is withdrawn from the liquid while recording the force-distance diagram. Return of the metal to the liquid in the same way gives ahysteresis loss unless the plate is smooth, uniform, rigid and free from orientedfilm on the withdrawal. Limited data on iron (M. W. Hill, personal communication)showed A1 2 values of 79 to 92 for three esters.
This method, like that of Clayfield, is subject to all sorts of variationsin the surface preparation. Hill polished his steel in air and then solvent washed,so the results may be comparable to Clayfield's but not to Bernett's (1968).
V. 3.6 Heat of Immersion (Liquid Phase)
The study of heats of immersion by direct calorimetry actually precededYoung's initial statement of Equation (V-1) in 1805, since Leslie reported avalue in 1802. A very recent report by Groszek 11971) contains the minutes ofa meeting on calorimetry, consisting of two geneial papers, one on the direct andfour on the flow method of calorimetry. Both are discussed below, but have so
much in common that a number of points may be disctissed as if they were onemethod.
In all such experiments, the solid is reduced to powdered form, since
the energy output is only from 10 to 100 ergs/cm 2 and a powder of at least 5 m2 /
gm is required to get a precise reading. An auxiliary experiment is requiredto determine the surface area of another sample of the same powder, usually by
the "BET" cyogenic nitrogen isotherm method. The whole problem lies in the
preparation of the powder, and may be divided into the usual two parts: (I) Isthe surface contaminated? (2) How much strain energy was stored from the powder-ing process? To these we must add two special questions (3) is this surfacerelevant to the lubrication process? (4) Is a chemical reaction taking place?
In answer to (1), it is very nearly impossible to prepare a powder onthis humid, contaminated Earth which can be described as "pure" without seriousreservations. Furthermore, the calorimetric procedures do not provide the nec-essary information for a clear-cut decision on this matter. One can only try
successively refined cleaning techniques until no further change in E12 takesplace, and this does not prove cleanliness.
In (2) as in (1), it is very nearly impossible to make a powder whichdoes not contain strain energy. Presumably the worst of the strain can be re-moved by annealing, but the preponderance of edges and corners (Figure 5.5-9)cannot be eliminated without sir.tering the powder. The question of detection ofthese excess energies (see Figure 5.4-6) is discussed below.
Question (3) is a very unpleasant one, and the answer must be, at best,a qualified negative. Unlefs the study involves metal cutting, where the lubricantsees raw metal every pass, powder surfaces will not resemble the service condition
very closely. Where a break-in process is involved, they are definitely misleading.
.ad

-284
Question (4) can probably be answered by close study of the contents ofthe calorimeter a fter -he rest, or by sotie sort of desorption experiments.
V. 3.6.1 Direct CalorimetrY
The procedure is simply to break a ca'psule oL Li powder under the liquidin the calorimeter and measure the temperature rise. Zettlemoyer (1968) and
Tideswell (Groszek 1971) have reviewed this mattor. It is possible to map the 4
energetics of heterogeneities by taking heat of immersion on powder precoatedwith varying amounts of the vapor of the same liquid (Zet tlemoyer). Tideswe 11concentra ted on the relatively neglecte-d problem of we tting by mixtures (see
Appendix VI), and his curves could be interpreted t. showing tat "Gr'pho"4
(a graphitized carbon black) has active sites. lie exprensed considerable sur-prise at these shapes; they did not fit any of the usual patterns. Of course, itmust be recognized that the graphite crystal is extremely anise.tropic, having,, alow (120 to 220 ergs/cm2 ) surface free energy on the flats, and i very highon the sides. The latter would relate to tile high boi.ling point of about 6000CC.
V. 3.6.2 Flow Calorimetry
This im port t n techni que has been appe 1 td prima r fly to suo I u t n andso is relegated to Appendix VI.
V. 3.7 Hea-t of Adsorption (Vapor Phase)
As mentioned in V. 2.5, heat olf aidsorption usually implieS adslrptionfrom the vapor phase, including fixed gases. The catalyst workers hove done f
great deal of good work on metal-organic interaction; most of it is difficultreading for the outsider. Eischens (1969) has done mLIch to trans late thisdata into lubrication terms, and Bond (1962) to relate it to the physical chemi s-try of metals. Hiowever, the data tend to he taken on the lighter hydroc,1rhon:,and fixed gases, so the applicability of the methods to lubricants has not beenclearly established. Tihere is a serious prroblem of delivering sufficient vaorto the metol surface to permit good calorimetry, when even the lightest lubri-cints require 20 0 C or more to generate 10 torrs of vapor pressure. This is above
the range desired by most lubrication engineers. Another problem is the fact thatsuch molecules tend to "chemisorb", with irreversible chemical t,e.,, eVL atroom t-emperattire, as shown by Morocrvfl" (1971). Such chemical re,iot [on: arereadily detected by catalyst methodsi, and in fact were predictable trom th,: dato
on C4 and lighter hydrocarbons (Eischcns 1969)
The method most favored for calorimetry (Bond 1962) uses a wire or fi 1mof the metal , under adiabatic condit ions. The metal qpecimen is calibrtted tobe its own resistance thermometer, providing that any chemical chi nges do notaffect its integrity, Powdered metals can also ho used but the problems melti ,ted
above are all present. Wires can be drawn and nnnealed with considerahle slran11cethat subsequent cleaning, by ion sputtering in vacuum for instance, will removethe contamination nnd some of the work hardening. The resulting surface is notusually homogeneous (Figure 5.4-6) energetically. Films are mout often vapordeposited, by the hot filament, inn sputtering or simi 'ar methods. There is rea-son to believe they are more reactive than the same metal would be in blk (R. L.Johnson 1970).

- 285 -
V. 3.8 Heat of Desorption (Evaporition)
A very new method is described by Anderson (1970) who terms it "Evapora-tive Rate Analysis." In brief, it requires preparation of a "clean" surface, towhich is added essentially one monolayer of the liquid by deposition from a vola-tile solvent such as cydopentane. The liquid must be radioactive enough thatthe radiation from less than a monolayer can be monitored readily. The specimenis placed on a heating stage under a Geiger counter, and a small, steady flow ofgas passed over it until tile counter shows complete desorption. The experimentis run at several temperatures, and the evaporation rate at each is used in theClausis-Clapeyron equation, as if it were a vapor pressure, to calculate anapparent heat of desorption. This, of course, is the sum of the heat of adsorp-tion plus that of vaporization (V.2.6).
Results from this method are too few to judge its value, but the usualproblems of surface preparation are all present. One new bit of information fromAnderson's work is that water vapor displaced most additives from oxidized alumi-num.
V. 3.9 Dynamic Methods
Although a relation between heat of adsorption and friction/wearreduction was implicit in the thinking of many earlier workers, no oneseems to have attempted to calculate E from dynamic tests until Frewing(1943) did so. His model was limited to adsorption from solutions(Appendir: VI) but with the methods now available it is possible to re-examine a great deal of data, taken for less specific purposes on avariety of pure liquids lubricating solids.
V. 3.9.1 The Stick-Slip Transition
In an earlier paper, Frewing (1942) reported the temperatures(Ti) at which an abrupt transition from smooth sliding in a Bowden-Leben(sphere on platen, see Section 5.3) took place with various compounds,when the temperature of the platen was raised by external heat. A numberof these temperatures are listed in Table V-Ill, along with the meltingpoints (Tm) of the compounds. Frewing found a definite relation betweenTm and T .. In all tests with hydrocarbons (hexadecane, diphenylmethane,paraffin wax, biphenyl and bis-p-biphenyl methane), alcohols (lauryl andceryl), ketones (methyl heptadecyl, myristone and benzophenone) and amides(acetamide, pelargonamide and myristamide) Tt = Tm
The acids showed a fairly constant difference of Tt- Tm= 70 + 5 0C.Those below pelargonic are not reported since rapid evaporation andcorrosion led to problems in getting the data, The methyl esters showedTr - Tm = 50 + 50C., but the stearatcs of various alcohols showed a responseexprossable by Tt - Tm = 60 (28 - n) + 50 C., where n is the number ofcarbons in the alcohol. (The values in Table V-Ill are correct; Frewing'sFigure 7 has the ordinate scale misnumbered). The glycol and glycerolester data, and that on dimethyl esters, are too scanty to draw any con-clusions except that they are unlike the simple esters of either class.

- 286 -
TABLE V - III
Temperatures of Melting (T ) and
Transition (T t ) for Various Compounds 0C)Ttt
Compound Tm TA
Pelargonic Acid 12 90 68Capric Acid 30 95 65Lauric Acid 47 120 73Myristic Acid 57 125 68Palmitic Acid 63 130 67Stearic Acid 70 145 75
Oleic Acid 14 85 71Elaidic Acid 45 120 75
Methyl Laurate 0 45 45Methyl Myristate 18 65 47Methyl Stearate 38 95 47
Methyl Arachidate 53 110 57Methyl Cerotate 82 135 53
Ethyl Stearate 33 90 57
Butyl Stearate 28 80 52Hexyl Stearate 28 75 47
Lauryl Stearate 44 85 41Stearyl Stearate 60 85 25Cerotyl Stearate 72 77 5
Ferric Stearate ill 113 2
Glycol Dimyristate 61 85 24
Glycol Distearate 76 115 39
Glycerol Trimyristate 56 80 24
Glycerol Tristearate 71 105 34
Dimethyl Succinate 19.5 55 35Dimethyl Sebacate 28 35 7

- 287 -
Frewing was unable to analyse his data mathematically, 30 years ago.It would certainly be worthwhile to subject the excellent block of datato modern analytical methods. The Kingsbury-Rowe method will be discussedin 3.8.3.
Another possible method of analysis, which was not tried, istho Hansen plot. However, it is evident that normal esters with thesame total C, H and 0 count, which would have the same partial parameters,will not give the same Tt when chosen from the methyl eaters and thestearates. For example, methyl stearate (C 1, 95°C.), ethyl stearate(C , 90C.), methyl arachidate (C2 1, ll0C. and butyl stearate (C8028.) which would plot quite close together, can obviously not be ?Httedwith a circle.
This contrasts strongly with the good fit obtained in Figures5.11-1, 2 and 3, where Bowden-Leben machine friction values were plotted.Frewing did not report enough friction data for this purpose, nor didSenior and West (1971) heat their apparatus. It appears, despite thislack of confirming evidence, that there is reason to regard Tt as basicallyunsuited to Hansen plotting. One reason would be that the parametersall decrease with increasing temperature, and not at the same rate (Hansen1971).
The Panzer plot (V. 3.1.3) has not been tested, but itobviously will encounter the same problem on esters.
V. 3.8.2 Metal Cutting Friction
As far as the writer knows, the work of Ernst (1941) shownin Figures 5.11.4 and 5 is unique. However, it obviously has a gooddeal to recommend it, this being one of the few cases where a trulyuncontaminated solid surface can be contacted with a liquid. Whilesome doybt was expressed in Section 5.11 as to whether the 5H valuereported for aluminum was real, recent data on powder wetting (Panzer,personal communication) has given similar data on "clean" aluminumpowder using liquids quite unlikely to undergo Reaction (5.11-8).Thus, we have a number of cases of metal wetting in which both 6 and5 H are important, as shown in Table V-IV. Hence it appears that Fowkes'(1966) assumption that electron transfer across an interface to metaldoes not take place is disproved.
A moderate extension of the cutting method is to plot breakingstrength for the Hansen contours. A plot of data from Imanaka (1968)is shown in Figure V-5, which illustrates the Rehbinder effect of decreasingthe crushing strength of Al 0 . The contour is 2.15 kg force, and all
2 3data except that on water are satisfactorily resolved. Figure V-6 showsdata by Moorthy (1956), which shows the Joff( effect of increasing thefracture strength of soda-lime glass. The contour surface is at 20%increase over that under water, or 29% over that in air.

- 288 -
TABLE V- IV
Partial Solubility Parameters of Metal Surfaces
Metal Author (year)_ wn p* J
Chromated "Tin Plate A" Hansen (1970) 5.0 -0.3 5.2
Chromated "Tin Plate B" Hansen (1970) 6.9 -0.2 6.3
Iron Powder (new) Goldblatt (unpublished) 8.1 5.7 3.0
Iron Powder** Goldblatt (unpublished) 8.6 1.9 3.0
Aluminum, Fresh Cut Ernst (1941) 8.4 2.6 6.5
Aluminum Powder Panzer (unpublished) 7.9 3.0 7.1
Mercury (liquid) Harkins (1920) 9.5 3.5 3.5 1
* Negative values represent mathematical artifacts rather than anyreal "negative energy"
** Ground under hexane per Groszek (1969) ,
'1
%1
..... .: i I I : I =i.... | | ,- ,: :l j' I ' ! " •

-289-
Figure V-5
THE REHIBINDER EFFECT
+07rL 14 -Center- 8 H = 9 .25207tH8H= 6.0 H 20.720 13- PD 5 0 +
12
10-
3- + 0
00 0
+
Imanaka, Kinoku Hyomen GijutsoH219, #10. 424-9 (1968). 8Crushing Strength of A1203
Granules - Kg Force + I
(There must be another circlefar up t~o include the stronginteraction with water) 5D 0
*2.20 to 2.61 (air)+ 2.10 to 2.19 101o 1 .9 7 (H20) to 2.09

- 290 -
Figure V-6THE JOFFE EFFECT
15 8 H+ +19
14
13
0 11 36
9/-
A. 18
620% increase in strength,
5 based on strength under water
4+ + 16 + 18
3
+ 2 *0 +14
00+ 1 +I --
0...10O 9.5 9 8. .5 7 1 4 8
EFFECT OF LIQUID IMMERSION 7.5 3 4 5 0
ON FRACTURE STRENGTH OF ?0SODA-LIME GLASS 8 +
(Moorthy and Tooley, + +J. Am. Cer. Soc. 39, 8.5
215-7, (1956) 9 LD
0 0-10'/,, increase+ 11-20% increaseo 21-33% increase(Water is 9% increase over air)

" 291 -
V. 3.8.3 The Kingsbury-Rowe Method
Two examples of the use of Model IA to obtain energies of
"adsorption", or more likely chemlsorption, were shown in Tables 5.4-111
and IV. Garabrant (personal communication) noted that the function (E/T )was far more constant than E. At the time it was not realized that
Frewing (1943) had predicted, for stick-slip conditions presumably
corresponding to adhesive wear, the film defect ( a) and hence (E/RT.)
would be constant for any given compound. While Frewing had intende5
this to apply to the adsorption of an active additive from an inert
solvent (Appendix VI), its applicability to a pure liquid appears at
least plausible.
The use of Model IA requires two pieces of data to arrive
at an a value, while Frewing's (1942) data provides only T . Such data
could be analyzed by Equation (5.4-24), modified as indicated in 5.4.1
to give
eTt = exp (-E/RT ) )(V.21)2R 3.23 X 10' U (M/T m)0
This work has not been carried out because the Kingsbury
equation requires an iterative solution for E, and more pressing
matters prevented setting up such a program. Had Frewing varied the
velocity (U), the applicability of Fquation (V-21) could have been
tested very easily since either E or Tt, and their ratio, would have
to vary with U, but he always used 0.005 cm/sec. Other experimenters
have varied velocity, but apparently have not covered such a wide range
of pure liquids and have tended to use solutions (Grew 1969) as
discussed in Appendix VI.
In view of de Boer's (1968) objections on the t concept used
in developing it, perhaps work with Equation (V-21) shoulS be deferred
in favor of developing some new model. The modification from 5.4.2 cannot
be used, since it requires two readings on each lubricant to evaluate k1X,
and Frewing's data consists only of Tt .
V. 3.9 Conclusions
It is evident that the outcome of this review of test methods
is largely negative, in that most of them are applicable only to irrelevant
surfaces. The results are summarized in Table V-V. Clearly, the one
method which can be clearly related to the low wear rates with which
this STAF is concerned is the Kingsbury-Rowe method. While this has been
applied only to ball-on-cylinder data, there is no reason to doubt its
applicability to other geometries. It must be recognized that the constant
value of E/RT5 noted above was computed from the model which de Boer (1968)
considers inappropriate, so that more work is necessary along the lines
of Equation (5.4-19) to be sure this outcome is not a coincidence. However,
at the present time there is every reason to place the main emphasis on
collecting data suitable for this model.

-292
toto 4 4
$- w4 14 -H 4 w M
.4 0 W 4 14 0 CC W-W .o cj '4 CC .4'
CC ~ C 0 CC
0) j. 4.'1 - 0 4 '4 4-4 CC 1
410 4. '4 C
w" w
0 I- >444 .I 1 -40 4 '. 0. 0 14
$4 .4 v-1 CC 14 'A4 0 w4 w0- " 1. 4-4 0
H- > 14. 4 >
04-
P4 V0 w. C 0
CC m -4W ~ 4 ~ .~
-I .0 w~4C) C. .0 4 '- ) C440 '-4 '4~ 04 4 - -4 -4 4
014 0 wi 0 14 ) wH 0 ) 0w. 0- 41 0. .
0 p1 4 H . D
00 0)N 1w -
41 9w CC 049 zm 0 C w-H- =' I ,CM0 C
0 u -4 wa
wC m40'44 0 0 w 14) C
0 0 .' 0 0 '
1*4 41 wC r= >' C 44.4 "o4 -A *'. bJoC :
W4 W 0. '4 41 H - CC
.,j w U . 0 0~I1
tn~~~~- -4 mr4 1 1 >4.4t '-4 1-4
AC 'H rx 0. w el P4
1410 0
0c 0'4 ., -
0) 4.4 14UC1 C(d 14CC1
04 -4-
41 O - U4 4-4 .4, u
P. 4J .14 4 (Ain4
a -4 .q 0

- 293 -
V. 4. Solid/Solid Interfacial Free EnerRy
Rabinowicz (1965) undertook to establish the relations betweenA. 1 for the two metals and their friction-wear properties, mainly inun ubricated sliding. His basic equations are
A 12 2 Y 1 for identifical surfaces s
A 1 3/4 ( I + Y 2 for compatible surfaces (V-22)
A1 2 i/2( 71 + Y72 for incompatible surfaces
where "compatible" and "incompatible" are as defined in 5.6.2.
In addition, he derives a number of model equations which deservefurther testing. The diameter of a hemispherical particle produced byadhesive wear
Dp _ 6 EA 2 /( 1 T ) 2 (V-22)
where E1, , add T, refer to the wearing surface. This can be simplifiedby assuming v /3 and T E - 0.003 to
yl
D = 60,000 A1 2/Pm (V-23)p
Another model, considering only the properties of the wearing surface,gives
D P 12,000 Y /Pm (-24)p m
From this relation, he derives a flash temperature
Ts - Tb = 9400 F yI U/J (kI + k2 ) (V-25)
where 9400 is the units conversion factor for T in OF, 7., in ergs/cm 2
for the softer material, and U in ft./min.
His model for abrasive wear requires two equations. The criticalabrasive size is that below which there is a strong dependence of wear rateon size, while above it the rate is independent of size. For 3-body abrLqion
D = 120,000 y /P (V-26)
and for 2-body abrasion
Dc = 24,000 y i/Pm
His Figure 7.15 indicate that D often exceeded these values, probablybecause average particle sizes rather than maximum sizes were plotted.

294 -
Finally, he proposes that under boundary lubrication conditions
the effective work of adhesion is
Ae = c A 2 + (I -)A (V-27) I
where ct is the fractional film defect and A the work of adhesion ofthe lubricated surfaces. In the writer's opinion, the latter is Inegligible, and hence the diameter of the lubricated wear particle
D = O D (V-28)L p
Rabinowicz was concerned because another model, based onfriction effects, gave 4
D 0.5DL = Dp29)
To the writer, this is merely another case of the ambiguous definitionof a. If the more rigorous definition in Equation (5.4-12) is accepted,then
D s 0 . S D :DL = 'r s p
and Equation (V-29) simply becomes the special case where Ur,or us = 1.00.
I

- 295 -
APPENDIX VI
SURFACE AND INTERFACIAL FREE ENERGIES OF MIXTURES
VI. 1. Introduction
While the surfaces of blended liquids are immenso.y more complicatedthan those of pure ones, a great deal less can be said about them. The struc-ture of this Appendix will generally follow that of Appendix V, except that onlyone problem exists on nomenclature. It is the common use of "heat of adsorp-tion" for what will he called here "heat of displacement." This is the A E re-quired in Equation (5.4-22) for Model IIC, and may now be defined more speci-fically by
13 E2- E (VI - 1)
where E1 3 is the heat of imnersion in pure additive.
The point: which needs emphasis, first, last and always. is th " verx
substance is "surface active" under the proper circumstances. Put in anotherway, in every blend containing two substances which differ in more than veryminor details, the composition at the surface will be different from that in thebulk. This is the result of the fnmous Gibbs principle, which states that everysystem will equilibrate into the configuration having minimum free energy.
The above statements are generally recognized to be true, though notusually expressed so emphatically. What is not so widely recognized is that the"surface" is but one of an infinite number of possible interfaces, and that thecomposition which gives the minimum free energy at the air interface is quite un-likely to appear where the blend interacts with another liquid or solid. Forexample, a solution of 1% stearic acid in cetane will show very nearly 0% acidat the air interface, about 40% at a metal interface (see 7.11.4) and close to100% at an interface with water.
Vl. 2. Computation of Interfacial FreeEnergies of Blends
There have been several approaches taken to establish the free energyat the air-liquid interface. Hildebrand (1950) set up a system based on totalsolubility parameters, and Clever's students Schmidt (1967) and Myers (1969) im-proved on it. They took care of deviations from actuality by making adjustmentsto the molar area, which Hildebrand had defined in terms of molar volume (V) tothe 2/3 power. Getzen (1971) recently summed up all sueh work and reduced it toeasily usable form, but his method need not be discussed here since it does notlead to interfacial energies.
I
II

-296-
Shain (1964) took a more general approach by calculating the activitycoefficients of a solute inl two imiscible solvents, and relating them to con-centrations at the interface. The method is too complex to quote here, and ap-pears to be limited to liquids forming more or less regular solutions. How-ever, it is undoubtedly capable of being expanded by use of the Hansen partialparameters. Whether such expansion can be extended to metal/liquid interfacesremains to be seen.
Everett (1965) attempted to set up a system for the amount of adsorp-tion at solid interfaces. However, it is better adapted to correlating datathan to predicting it. -
IVI. 3. Measurement of Interfacial Energies
of Blends on Solids
In general, the test methods used for pure liquids (Appendix V) canbe run on blends. However, interpretation of the results can present seriousproblems in some cases, while the additional freedom to vary concentration makesothers easier to interpret. The following methods involve problems which justifyruling them out without discussion:
1. Contact angle.
2. Powder wetting.
3. Liquid metal tests.
4. Heat of immersion by direct calorimetry.
5. Heat of adsorption - vapor phase.
6. Work of adhesion by metal cutting.
The remaining methods, plus an electrical effect not covered in Appendix V, arediscussed below.
VI. 3.1 Heat of Displacement by FlowMicro-Calorimeter
One of the most popular tools at present is the flow calorimeterdeveloped by Groszek (1966, 1967-8, 1970, 1971). In this device, a small bed ofthe powder to be studied is packed between layers of inert powder with appro-priate temperature sensors imbedded. A steady flow of a pure hydrocarbon ispassed through the bed until thermal equilibrium is established. The system iscalibrated with small "injections" of electrical heating.
VI. 3.1.1 Steady Flow Technique
I this procedure, the pure hydrocarbon is suddenly replaced with adilute solution of the additive, and recording begun. The rise in temperatureis proportional to the heat of displacement (A E), and its plot against time
j

- 297 -
corresponds to a plot of 6 E versus (1 - Q), the fraction of surface covered byadditive. When the experiment has gone as far as desired (often to a m o) theflow of pure solvent is resumed and the differential heat of desorption is re-corded. Some combinations desorb completely; others show apparently permanent:chemisorption.
As an added experiment, a second additive may be used to displace thefirst. There have been fewer of these experiments than of the single-additivetype, but one investigation by Jaycock (Groszek 1971) covered the very import-ant situation in which water is the first "additive."
VI. 3.1.2 Pulse Injection Technique
Alternatively, small pulses of more concentrated additive solutionare injected into the solvent stream. There seem to be some cases where it isdesireable to use both techniques, but the steady flow is usually favored.
VI. 3.1.3 Concentration-Step Technique
The best procedure is to pursue the first concentration until heatevolution ceases, after which a stronger solution is used, and so forth. Thispermits application of the Langmuir equation, in modified form, as a check onthe fraction of surface coverage (I - U).
Far too many data have been reported on metals and oxides (Groszek1971) for review here. The method is very promising, despite the inevitableproblems with powders.
VI. 3.2 Wettability Transition Temperature
A method resembling that of Guastalla (V.3.6) but not fundamentallyrelated was used by Bigelow (1947). A square of carefully cleared platinum wasdipped repeatedly into a solution of fatty acid in dicyclohexyl or cetane, untilthe surface became repellant to the solution. This system was then heated andtested until a temperature was reached at which the dipper remained wetted. Thiswas considered to be the temperature at which a constant (unknown) value of(I - C)/a existed. The experiment was repeated at several concentrations.
Plotting the log of concentration against the reciprocal of abnolutetemperature gave a slope which, handled by the Van't Hoff equation, provided aheat of displacement. Typical results (from bicyclohexyl) were stearic acid =1G.0 kcal/mole and octadecanol = 10.0 kcal/mole. These identical values seemrather unlikely in light of present knowledge, and the method has not been usedextensively.

-298 -
VI. 3.3 Rectification Effect Transition
Sakurai (1953) found that a small DC current flowed betoeen a flatplate and a spherical surface separated by a lubricant film. This effectvanished abruptly with an increase in load or in temperature. Assuming, asusual, that this represents a definite value of (I - t)/u, the log concentration -
reciprocal temperature calculation gave the following A E values on platinum:
Myristic acid in cetane = 10.4 kcal/mole
Stearic acid in cetane = 10.6 kcal/mole
Palmitic acid in decalin = 10.6 keal/mole
Iron palmitate in cetane = 12.1 kcal/mole
Iron stearate in cecane = 12.7 kcal/mole
Because this paper is available only in Japanese, it seems to havebeen neglected and no further use of the method made (Grew 1969).
VI. 3.4 The Frewing Dynamic Method
Frewing (1943) extended his work on pure compounds to solutions inwhite mineral oil. This gave him the additional degree of freedom needed toperform calculations of heat of displacement. The reasoning was as describedabove (VI.3.1.2), as was the calculation method. The transition point was takenagain as the stick-slip. Grew (1969) takes exception to this practice, sincestick-slip is highly apparatus-dependent, but concedes that stick-slip usuallybegins simultaneously with the sharp increase in friction which he regards asthe best indication of transition.
The data were handled in the way outlined above. Typical values areshown in Table VI-I. The relcvaice of these values is uncertain in view ofFrewing's practice of running each test on a fresh track, presumably coatedwith hydrous oxide. His data indicate that adsorption was reversible.
VI. 3.5 The Cameron Dynamic Method
Askwith (1966) used the same mathematics to process data from the morerelevant surfaces produced by a 4-ball machine operated at 200 rpm, and Grew(1969) carried the work further. The results were most illuminating, especiallythe "chain-matching" effect shown in Figure VI-I. Briefly, it appears that theoptimum fatty acid to use in a given n-paraffin is that with the same chainlength. The writer has explained this (Beerbower 1971C) on the basis that theoptimum comes when molar volumes are matched because this minimizes the "ideal"entropy of mixing (Hildebrand 1950; see also 7.11.4).
This method is presently the most fully developed dynamic test for A E,and can presumably be applied to essentially any test machine in which bulk tem-perature is controlled independently of frictional heating. However, it depends

- 299 -
TABLE VI-IA
HEATS OF DISPLACEMENT FROM WHITE OIL BYFREWING (1943) DYNAMIC METHOD
Additive A E (cal/mole)
Capric Acid 12,500
Myristic Acid 13,000
Stearic Acid 13,000
Oleic Acid 13,500
a-Bromo Stearic Acid 10,000
UZ-Iodo Stearic Acid 10,000
O-Hydroxy Stearic Acid 13,500
Methyl Stearate 8,600
Ethyl Stearate 3,900
n-Butyl 9- 3,200
tn-Hexy' 6,900
n-0ctadt drate 4,900
Glycol Disteax~te 10,500
Glycerol Tristearate 7,800
Octadecyl Acetate 7,500
Octadecyl Chloride 14,509
Octadecyl Iodide 7,500
1-Nitro Octadecane 13,000
Octadecyl Cyanide 4,300
Octadecyl Thiocyanate 4,700

-300
FIGURE VI-l
S40o
number of carbon atoms in satur'ated additiveA S cuffing tests with hexadocans (0), tetradocano ((3) and decano (*)with a range of acids. (i) oleic aocid, and (ii) elaidic acid in tetradecane.
All concentrations =0.003 Molar
600I~ 120/
S400[
048 12 16 20numbor of carbon atoms in saturatod mcid
B - Scuaffing teasts with 0-03m additivos in hoxcndoeane: acids (C0, 11.0 raviiii.0, 200); amines (A) and alcohol.s (0). (i) Elaidio and orucio acids; (ii) bromsidic acid,.(iii) olajo acid.

- 301 -
on detection of a friction transition, so that a sensitive measure of frictionis essential. The results must be supplemented with E12 values (Appendix V)to obtain the full picture for Model IIC. One problem not yet solved is thatdesorption from martensitic steels has proved impractical so austenitic steelsmust be used.
VI. 3.6 The Rowe Dynamic Method
This has been discussed bricfly under Model IIC (see 5.5.4). Itcannot be recommended as a means for gathering E and A E data until furtherexperimental and theoretical work is completed. 19owever, it does have the ad-vantage of using both wear and friction data and so may be considered more so-phisticated than the Cameron dynamic method.
VI. 3.7 Conclusions
Though more complicated than for pure liquids, wetting by mixturesis in fairly good shape as a source of design manual data. The methods aresummarized in Table VI-II, with the Cameron dynamic method currently in thebest position.

-302-
00 i
414
to >3 r. C .
43 4
o 1 43.0 44 0 3
0U 43 43:j
4. $4 U 4 U U '
1.4 - -4 C h ~
-4- 44r40 43
.4 0 0 CU 0 0
E-44 44 U CU t
o 0 0 -4 -4 ~
-'-4
0
o~~C -4- i i h0J .- 4 w. ".4 "
-'4 '4 '4v-4J hi r
*l -4 V '0 C C0ui ' .3 .4 .04 0
04 -,4 41 i~ "4 v- 'i C) CU0 41 4 v-k hi hi
C4 04 0.w U P

- 303 -
APPENDIX VII
SURFACE AND INTERFACIAL ENTROPIES
VII. I. Introduction
The need for entropy values in boundary lubrication is two-fold. Asindicated in Appendix IV, most of the surface free energy data on solids (y)can be obtained only near or at the melting point, and requires adjustment 10T. or T A lesser problem of the same sort is adjustment of liquid (12)values prom the usual 20 or 25*C. The other sort of problem is the conversionof frae energy or work of adhesion to total energy (E) or heat of immersion(E 1 1). As shown in Appendices V and VI, some of the most relevant test methodsyield E and A E values direct, so this Appendix will make only a minimum ef-fort on Those points. Indeed, there is relatively little work to report onL S12.
In this Appendix, the emphasis is on predictive methods. Correla-tion methods are cited only where predictions cannot be made. Experimentalmethods are omitted, as these are all well known.
VII. 2. Surface Entropy of Organic Liquids
The literature on dy 2 /dT is extremely prolific. This interest canbe traced to the pioneer work of E8tvs, who correctly identified the two keyparameters in 1886. His equation
7 - kE (Tc - T - 6)/V 21 3 (VII-l)
where kE is the "Ebtvds constant", T the critical temperature and V the molarvolume, is still rated as useful by eid (1966). The temperature correction of6*K was added in 1893 by Ramsay, and is trivial except near T . Unfortunately,Equation (VII-l) is accurate only for non-polar liquids of low molecular weight,for which kE = 2.12. It decreases with polarity and increases with molecularweight, so a higher ketone or ester may also have kE = 2.12 by coincidence.
A more accurate correlation was suggested by van der Waals in 1894:
Y = k T 1/3 P 2/3 (1 - T )I 2 (VII-2)
where P is the critical pressure and T the reduced temperature (T/T ). Thefactor and exponent 1.2 were supposeg to be universal constants foc all ma-terials,Vbut this has not proved to be very accurate (Reid 1966). Better re-suits are obtained with
k = 0.133 a - 0.281 (VII- )v c

-304 -
where a is the Riedel factor, but large errors result with polar compounds,due in part to variation of the exponent from 0.99 to 1.23. However, elimina-tion of k T 1/3 p 2/3 gives a simplified form
9' (- TR) 1.2 (VII-4)
where y is the (extrapolated) value at 00 K. Reid (1966) recommends this foradjusting y to any temperature.
The most elaborate system is that of Macleod, further developed bySugden and put into final form by Quayle (1953),
Y = (P (p - d)/M)4 (VII-5)
where P is the "Parachor", a constant for each liquid which is claimed to beindependent of temperature, M the molecular weight, p the density of the liquidand d that of the vapor. In most cases, d is negligible and the equation be-comes simply
y = (P/V)4 (VII-6)
The Parachor can be calculated with fairly good accuracy from tabu-lated values for various functional groups. Lee (1967) has made a comparisonof this system of "building blocks" against Small's (1953), on the basis ofpredicting values of yc for polymers, and came to the conclusion that Small'swere better. However, the latter are only useful at 25°C. It must be recog-nized that part of the apparent constancy of P is due simply to the high ex-ponent 4, which has a strong tendency to hide significant deviations in y.
A third set of building blocks are those due to Lyderson, but mostreadily available in Reid (1966). Values of T may be built up by using themin the equation
T c = Tb/(0. 5 6 7 + 4) - (X 42 (VII-7)
where Tb is the boiling point at one atmosphere. If needed, P and V can bebcbuilt up by similar procedures. The T values may then be useS in the Watsonequation as expressed by Bondi (1968).
SHv = H 0 (1 - T )0.38 (VII-8)I0 R
where H0 is the extrapolated heat of vaporization at OK. Bondi provides build-0ing blocks for Ho . This can be shown to be essentially consistent with Equation(WI-I0

-305
It would be desirable to have the separate contributions ot the A, Band C energies of Appendix III to dv/dT. As worked out by Panzer (1972), seev.3.1.3,
Y Yd+ p+ 7h KA/V 23+ KaB/V 23+ KbC/V 23 (VII-9)
Differentiating the first term,
d-yd /dr KdA/V 2 /3dT - 2ayd (VII-lO)
Substituting ZAHk, from Equation (VII-8) for A leads to the complicated
d7 d MdT -K (0.38 %0/(l - T R) 0.62 _ R)/V 2 /3 _ 27ya/3 (VII-li)
where H~is the heat of vaporization of the homomorph at OOK.
A simpler approach uses one of Hildebrand's (1950) approximations
where ais the tlhermal expansivity, dV/VdT.
=2From this and A =V55, algebraic manipulation of the first term inEquation (VII-9) gives
d(lnV/ )/dT 2V-2.17aZ (VII-13)
This is not oniy far from rigorous, but also is not as simple as itappears to be, since a itself is a complicated function of TR. Bondi shows thatpaC, which is identical to dp/dT, is essentially constant over the range 0.4 < TR<0.8, but conversion of Equation (VII-13) to this form does not eliminate the
problem as P remains in the equation.
Similar treatment of Equation (VII-l) yields
d(lny )/dr = -1.38a - 2.12 /y d V2/3 & -3.7CI (VII -14)
and of Equation (VII-6) yields
d(1n7y)/dT = -4.Ocx (VII-15)
Obviously, these cannot all be right, even allowing for the fact thatEquation (VII-15) includes polar as well as non-polar liquids.

- 306 -
A better solution is offered by differentiating Equation (VII-4)
dd(lny )dT - -11/9 (Te - T) (VII-16)
which eliminates both a and p. This should certainly be valid for regularliquids and the homomorphs, using T values from Equation (VII-7).
Duga (1969) took another approach by combining Equation (VII-5) witha vapor pressure relationship and the Clausius-Clapeyron equation
T In P = -ay (M/(p - d))2/3 + b (VII-17)
(a and b are not the same as in VII-9)which he feels gives justification for a factor of 6/5 rather than 11/9 inEquation (VII-16). The difference is trivial; it is the fact that these twoapproaches resulted in essentially the same relationship that is important.
The polar contribution to d7/dT has never been worked out, but Equa-tions [3], [4] and [4A) in Appendix III should contain the necessary informa-tion. Even though dA/dT is essentially zero, Equaton 13] presents a formid-able problem of differentiation as the result will contain a, dc/dT and dn/dTin a complex pattern. The molar refraction has been used as a correction toEquation (VII-6), but only over the range 20-30C. It has the effect of cal-
culating a sort of apparent density from n values and yet another set of build-ing-blocks. The problem is the lack of dn/dT values over a wide range, whichalso limits the usefulness of Equation [4A]. Thus, we are left with the admit-tedly crude Equation 14] as a working tool. Its weakness cLn easily be demon-strated, using dipole moments from Bondi's (1968) Table 14.28 for the alkyl-methyl ketones, where the C=O group contributes 2.81 + 0.03 esu. Conversion tobp values by Equations [4] and [5] gives values which-are at variance with those
of Equation [3] and Hansen's nearly identical experimental values in AppendixVIII, Table I.
However, as an approximation we can use
d(ln9P)/dT = -2a Y/3 (VII-18)
since diA/dT = 0.
The contribution of hydrogen and other electron transfer bonding in-cluded in C was relatively well worked out by Bondi (1968), from whose earlierwork Equation (6] in Appendix III was derived. The details are given in Ap-
pendix VIII, page 907. Since Equation [6] is so well documented, we may use itwithout many reservations, the only obvious one being that Bondi may well haveincluded some B energy in the C energy values.
d(lny h)/dT = mb(dC/CdT) - 2mba/3 (VTI-19)
where dC/dT is taken from Bondi's tabulation.
j

- 307 -
Assembling these three parts, we can now write with considerable con-fidence for all organic liquids:
-dy/dT - 1.22/Td(Tc - T) + 2a a/3yP + 2mb C1/3yh - mbdC/tCPdT
(VII-20)
The temperature coefficients of the partial solubility parameters areshown in Appendix VIII, p. 328. Blanks (1964), Weimer (1965) and Helpinstill(1968) published lists giving vilues of b (usually symbolized as "k") and r,which is equal to (5P2 + 5H 2)0 . , While heir values are reasonably consistent,some serious problems arise at this point. In the first place, the two laterarticles give higher values of 5f at 298*K than Blanks, whose chart was followedby Hansen (1967) and Beerbower ('969). Hopefully, Figure V-1 resolves thisdiscrepancy, but these authors also present values for . and 7 at other tempera-tures which are not consistent with the equations in Appendix VIII. By analogy,the equations in Appendix VII should be used with some caution, until they havebeen compared with compilations of y data such as Quayle (1953) which cover con-siderable ranges of T.
VII. 3. Surface Entropy of Liquid Ceramics
Some work has be.n done to correlate dy/dT data on fused salts aneoxides by Duga (1969). However, there are some serious problems in predictingdy/dT for materials on which no experimental data exists. This is frequentlythe case for T c, which requires much higher temperatures than A Hv . Values ofT for organic compounds may be calculated by Equation (VII-7), but there are nobuilding-blocks for the inorganic compounds in Lyderson's tables (Reid 1966).
However, consistent values of T are obtainable from Equation (VII-16)when Y values are available at three temperatures. These may then be used toconstruct the entire curve from T to 0°K. The results tend to justify the com-mon practice of treating dy/dT asconstant over the narrow ranges in which ex-
perimental Y values are usually available, since most of the curvature takesplace in the upper 20% of the range. Generally, 7 values extrapolated to 298 0Kon the linear assumption have proved to be correct to within about 2%.
VII. 4. Surface Entropies of Liquid Metals
The only metal for which T had then been determined experimentallywas mercury, but Grosse (1962) estimated T values for many metals from the den-sities of liquid and vapor at high temperafures. These were then used in Equa-tion (VII-l) to correlate the available y data on the liquid phase of thosemetals. The results were quite plausible in some cases, but in others the re-sults appear quite discrepant. Mercury is, as usual, quite anomalous. The well-known high dy/dT exceeds even that predicted by T = 1733*K. His values of theslope in Equation (VIT-16) vary from 0.249 for Cd to 1.282 for Na, compared withthe accepted value of 1.222 or 1.200.

- 308 -
Eberhart (1970) had T values for the five alkali metals, as well as
a newer value for Hg of 1758 + SoK. Crosse's values for Na and K proved to beabout 10% too high. He tested the 'lborresponding states" version of Equation(VII-l)
SV V2/3 - KE-r (VII-21)'0 c E (VI-1
where 7 is the value of 7 extrapolated to OK, Vc is V at Tc and the acceptedvalue o? K E is 4.3.C
The KE results varied from 3.7 for Hg through 2.2 for Na to l.8 for Rband Cs, showing chat metals do not follow the corresponding states principle.The data were wel.l fitted by the empirical
YO (Vc - 27 + 4) = (1.66 + 0.02) Tc (VII-22)
In order to check this against Grosse's Tc values, it would be necessary to esti-mate V for the 15 metals, and reliable methods are not available. Meanwhile,Equation (VII-I) can be used to estimate y from Grosse's Tc and o values.
VII. 5. Surface Entropy of Solids
Conversion of the above equations to use on solids does not presentany serious problem. Both Kubaschewski (1967) and Duga (1969) proceed to useA H as a replacement for A H , with considerable justification. The fact thatthe coefficient of thermal expansion ((X) is a great deal lower for solids thanfor liquids does not create much difficulty, if we accept the validity ofEquation (II1-15). Presumably, the solid will follow the same rule, with y =
1.14 7, as in V.4.2, and cX * 0.01 (1. Thus, the slope from T to O°K will beconsiderably flatter than from T to T -6, and the slope wilT be predictablefrom ( /CX data when such is available. c
Equations have not yet beer. developed for dividing the surfaco entropyof organic solids into d, p and h component. However, the fact that the surfaceproperties are all strongly dependent on V leads the writer to believe thatsimply substituting CX for 0 in the appropriate equations will serve the purpose.
s
VII. 6. Entropy of Liquid/Liquid Interfaces
In contrast to the extensive literature on air/liquid interfacial en-tropies, there has not been much done with liquid/liquid interfaces. The methodsof Good (1970) are applicable, but are not emphasized in his article. Sincesuch interfaces are outside the scope of this STAF, no attempt will be made hereto carry this work forward.

- *309 -
V1I. 7. Entropy of Liquid/Solid Interfaces
As there are no accepted prediction methods for the air/solid orliquid/liquid interfaces, it is to be expected that the liquid/solid interfacialentropy is not yet predictable. In fact, there is not even mich experimentaldata on this matter. Neumann(1970) has contributed a study of the variation
with temperature of contact angle of organic liquids on plastics, and Rhee
(1970, 1971) has done the same for liquid metals on ceramics. The latterstudy resulted in the conclusion that the Zisman (1964) linear relation of cos 0
to 72 is obeyed, so that dA /dT can be calculated. This is, of course, merelyone of the latest and best H various articles on high temperature wetting sinceBondi's (1953) classic review, but it is quite difficult to generalize anythingfrom them.
The most important category for the present purpose is the entropy oforganic liquid/solid metal interfaces, and no articles on that subject have beenlocated.
If the "heat of immersion" (E) in V.2.5 is regarded as a true heatrather than an energy, the function E/Ts becomes the entropy of inmersion. Asshown in 5.4.2, this is essentially constant at 40.8 for hydrocarbons in air or.52100 steel, with a standard deviation of about 1.3. Though this is based onquestionable assumptions, it is a very practical engineering tool for a dynamicmeasure of interfacial entropy.
VII. 8. Entropy of MJixed Liquid/Solid Interfaces
Since this is the most complicated of all such systems, it can beclassed as "unpredictable by present methnds." Very few experimental resultshave been reported, and there is not even enough theory to analyze such data asexists.
VII. 9. Conclusions
There is more than adequate theory for the prediction of the surfaceentropies of organic liquids. However, as the complexity is increased towardsthe goal of mixed liquids on solid metals, theory and even experiment becomecompletely inadequate. Thus, even if works of adhesion were known for thesesystems, no means for converting them to heats of immersion is available.
As concluded in Appendices V and VI for entirely different reasons,the best way to obtain heats of immersion and heats of displacement is by thedynamic methods for friction and/cr wear.
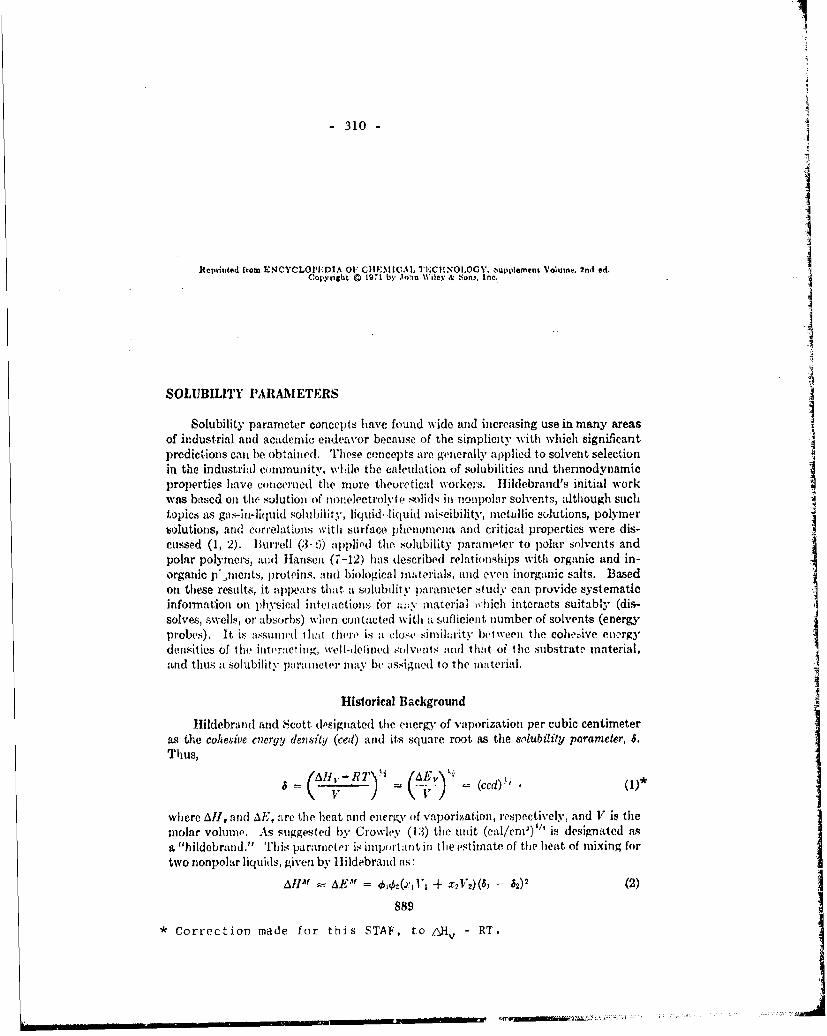
-310-
Rtoptivted fror ENCYCLOPI DIA 01' CI1CAL TE.CINOI.OGY. Volpec~ ~num,n 2nd ed.Copyright C) 19TI by John Niley & N5oun . Inc.
SOLUBILITY PARAMETERS
Solubility parameter concepts have found wide and increasing use in many areasof industrial and academic endeavor beeause of the simplicity with which significantpredictions CaIL be obtained. These concepts are gnerally applied to solvent selectionin the industrial community. whlile the cakculationl of solubilities and thermodynamicproperties have concerned the mure theore~tical workers. lidldebrand's initial workwas based on the solution of nonelectrolyte- Solids in iionpolan' solvents, although sucht.opics 11" gas-ili-liquid Soluh1ility, liquid--liquid isicibility, mietallic sulutions, polymerisolutioiis, and correlations with surface lhenoniona and critical properties were dis-cussed (1, 2). Burrell (;3-6)) applipd the solubility lparanwier to polar solvents andpolar polymers, and Ilansen (7-12) has dlescribed relationships with organic and in-organic p *nients, p~roteins. and( biological materials, and even inorganic salts. Based
on these results, it appoars that. & solubility paraiaeter -tudy can provide systematicinformation on physical inteiactions; for any material w~hich interacts suitably (dis,solves, swells, or absorbs) wilen contacted with a suflicieit, number of solvents (energyprobes). It i:s assumied thIat (here is a dlcise sinihrity bet wer-ii the colieive eniwrgYdeiisitics of the internct illg, %vell-lefinvd .4olvi-rnts anid t hot of thle substrate material,and thus a solubility painenter may be assigned to the material.
Historical Background
Hildebrand and Scott (ksignatedl the energy of vaporization per cubic centimeteras the cohesive energy devns fey (ced) and its square root as the &'oubiiiy parame~r, 6.Thus, (AR,.- R (AE, (CeIwhere all, and AE. are the heat aind energy of vaporiz~ation, respectively, and V is themnolar volumeo. As suggested by Crowley (13) thte unit (Cal/cnl) I" is designated a;
"hildebrand.'' T1hiis paramieter is, important in the estitnate of the heat, of mixing forItwo nonpolar liquids, given by I hildebrand as:
AllTM AEA( =4.(l +X 2V2)(61 - SO)2 (2)j
*Correction made for this STAF, to / ,- RT.j

- 21.1 -
SOLUBILITY PARAMETERS
Tile heat of mixing AH '1 and the energy of mixing AE are equal when there is no
volume change on mixing. The O's are the volume fractions of the liquids, and tilex's are their mole fractions.
Consideration of the free energy equation
AGm = AHM - TASMf (3)
quickly shows that the negative AGM values necessary for solution to occur can beachieved by reducing AH M , which in turn means that a, and 52 should be similar invalue. The entropy of mixing AS, can be assumed to be positive, and generally doesnot receive much attention, at least from the practical approaches to using solubilityparameter theory.
Burrell (3-6) was the first to apply the solubility parameter to practical (polar)systems. He grouped a large number of solvents into three classes according to their"low," "medium," and "high" hydrogen bonding capacities, and u'7cd these groupingstogether with the solubility parameter itself to aid in solvent selection in the paintindustry. Following this lead, various refinements were proposed to quantify a hy-drogen bonding parameter (14, 15), and ultimately a three-parameter system using thesolubility parameter, the dipole moment, and a hydrogen bonding parameter (basedon shifts in the 4-micron band for methyl deuteroxide) was proposed (13, 16).
Other approaches to account for polar bonding have been developed along the linesproposed by Van Arkel (17) and lildebrand (17a), and particularly by Prausnitz andco-workers (18-20). The basis of this approach is that the cohesive energy arises fromboth the permanent dipole molecular interactions and the London "dispersion" typeatomic interactions. The latter have been estimated as being equal to the energy ofvaporization of a homomorph at the same reduPd temperature, T/T, where T, is th.:critical temperature. The homomorph of a polar molecule is a nonpolar molecule hav.-ing very nearly the same size and shape as those of the polar molecule. Each solventis assigned a polar solubility parameter and a nonpolar solubility parameter. Thisdivision has been used to estimate solubilities (18, 20), to aid in solvent selection forextractions (19), and to calculate activity coefficients (21). A somewhat similar ap-proach to division of tile cohesive energy was described by Gardon (22) in which a frac-tional.polarity was estimated.
In any of these systems, as well as the one proposed by Hansen, described in moredetail below, a proper estimate of the nonpolar contribution is important. The homo-morph concept appears to be the current best choice, since use of ionization potentialsin various potential equations does not account for the effects of inner shell electrons.On the other hand, this approach tacitly assutnes that the hydrocarbon homomorph'sentire cohesive energy is (tue to London forces, which is not exactly true. This is anarea for future research.
If it is assumed (7-12) that the cohesive energy, AE, arises from contributionsfrom hydrogen bonding AE,,, as well as )ermanent-dipole-permanelt-dipole inter-actions, ., and nonpolar interactions, AEf, the following equation can be written:
AE = AE, + AE, + AE11 (4)
Dividing this equation by the ini 'ar volume of a solvent, I'. gives:
AE A],, Al,' AE,,S...+

- 312 -
SOLUBILITY PARAMETERS
or
62 - 5D2 + 87 + 62 (6)
where
= (AE/ V)"' (7)
is the usual equation for the solubility parameter,
=D (8)
is the dispersion component of the solubility parameter,
6, = (.A/ V)'h' (9)
i the polar component of the solubility parameter, and6.1= (AEm/V) 'I' (10)
is the hydrogen bonding component of the solubility l)arameter. Permanent dipole-induced dipole interactions are generally small compared to the other forces (24), withall errors being largely grouped into the 6, component. Those parameters are given inTable 1 for a number of solvents. The parameters listed in Table I were developedthrough independent calculations for the individual values where data were availableand have been checked by numerous solubility evaluations (7, S, 10-12) and comparedto other systems for their accuracy (25). The nonpolar contribution was estimatedfrom homomorph considerations; the hydrogen bond values agree well with AH,measurements of about 4,650 cal for each OH group, and the polar contribution wascalculated from a slight modification of B6ttcher's equation (26):
12,108 e - 1 11)1-2
2 f + n, 2
where V is the molar volume, i is the dielectric constant (static value), n, is the indexof refraction for D light (sodium), and 4 is the dipole moment expressed in l)ebye units(10:- 1 (esu) (cm)).
It must be emphasized at this point that. "hydrogen bonding" is being used ratherloosely in this article, and that some more ambiguous term such "weak chemicalbonds," or perhaps "association bonds" might be better. However, historical consid-erations favor continuation of this loose usage, at least for the present article, withthe understanding thai some 7r-bonds, quadrupole and octapole interactions, and prob-ably other yet unnamed forces are included in 6,! and AE1.
The energies calculated as described fit equation 4 or 6 very well where all fourterms can be estimated independently. These quantities can also be estimated fromthe parameters in the other systems described above by use of the simplified equ-tionsof Beerbower (25), such as
6P z. 18.3 A/'"V (Ila)
but paramuters so calculated may be in error by =- 1.7 hildebrand. A better solution isto extend the "group contributions" nwntioned :bove for -01-1 to most of the com-mon functional groups.
Th0, group concept was first, appliid to total parimieters by SmalL, but his workwas updated and extended by Hoy (23), They felt that V6 contributions from por-

- 313 -
Table 1. Solubility Parameters of Various Uquids at 250C
Molar Parametersvolume hildebrands,
Class Code Name V 6D AP ax
paraffin hydrocarbons 1 n-butane 101.4 6.9 0 0 4
2 n-pentane 116.2 7.1 0 03 i-pentne 117.4 6.7 0 04 n-hexane 131.6 7.3 0 0 A5 n-heptane 117.4 7.5 0 06 n-octane 163.5 7.6 0 07 2,2,4-trimethylpentane 168.1 7.0 0 08 a-nonane 179.7 7.7 0 09 n-decane 195.9 7.7 0 0
10 n-dodecane 228.6 7.8 0 011 n-hexadecane 294 1 8.0 0 012 n-eicosane 359.8 8.1 0 013 cyclohexane 108.7 8.2 0 0.1,14 methylcyclohexane 128.3 7.8 0 0.514.1 cis-decahydronaphthalene 156.9 9.2 0 014.2 trans-decahydronaphthalene 159.9 8.8 0 0
aromatic hydro- 15 benzene 89.4 9.0 01 1.0carbons 16 toluene 106.8 8.8 0.7 1.0
16.1 naphthaleve' 111.5 9.4 1.0 2.917 styrene 115.6 9.1 0.5 2.018 o-xylene 121.2 8.7 0.5 1.519 ethylbenzene 123.1 8.7 U :5 0.7
19.1 J-methylnaphthale--e 138.8 10.1 0.1 2.320 mneitylene 139.8 8.8 0 0.321 tetrahydronaphthalene 136.0' 9.6' 1.0 1.421.1 biphenyl 154.1 10.5 0.5 1.022 p-diethylbenzene 156.9 8.8 0 0.3
balohydrocarbons 23 methyl chloride 55.4 7.50 3.0 1.924 methylene dichloride 63.9 8.9 3.1 3.024.1 bromochloromethane 65.0 8.5 2.8 1.725 hlorodifluoromethane 72.9 6.0 3.) 2.8
26 dichlorofluoromethane 7.5.4 7.7 1.5 2.827 ethyl bromide 76.9 8.1 3.9 2.527.1 1,1-dichloroethyleue 79.0 8.3 3.3 2.228 ethylene dichloride 79.4 9.3 ° 3.6 2.028.1 methylene di-iodide' 80.5 8.7 1.9 2.7
29 chloroform 80.7 8.7 1.5 2.829.1 1,1-dichloroethane 84.8 8.1 4.0 0.229.2 ethylene dibromide 87.0 9.6 3.3 5.930 bromoform 87.5 10.5 2.0 3.0'31 n-propyl chloridp 88.1 7.8 3.8 1.032 trichloroethylenie 90.2 8.8 1.5 2.033 dichlorodifluoronethane 92.3 6.0 1.0 034 trichlorofluorometiawe 92.8 7.5 1.0 035 bromotrifluoromethane 97.0 4.7 1.2 036 carbon tetrachloride 97.1 8.7 0 0.337 1,1,1-trichloroethane 100.4 8.3 2.1 1.038 tetrachloroethylene 101. I 9.3 3.2' 1.439 chlorobentene 102.1 9.3 2.1 1.039.1 n-butylchloride 104.9 8.0 2.7 1.039.2 1, l,2,2-tetrachloroethane 105.2' 9.2 2.5 4.640 bromobenzenc 105.3 10.0 2.7 2.0
41 o-dichlorobenzene 112.8 9.4 3. 1 1.642 benzyl chloride 115.0 9.21 3.5 1.3 I
iklaI

- 314 -
Table I (conintued)
Molar Parametersvolume, hildebrands,
Clam Code Name V at, Sp all
42.1 1,1,2 2-tetrabroinnethanr' 1 16.8 I I. I 2.5 -1.0-13 1,2.dieIlorotet ratioroet haik:' 117.0 6.2 0.9 044 1,1,2-triehlorotrifluoroethnne 119.2 7.2 0.(8 045 cyclohexyl ehloride 121.3 s 5 2.7 1.046 1-bromonaphthalene 140.0 9.9 I.5 2.047 trichlorobiphenyl- 187.0 9.-1, 2.tf 2.048 perfluorornethyleycloliexiai 19t.0 6.1 0 C)49 perfluorodimethylcyclohexaule 4 217.4 6.1 (1 050 perfluoro-n-heptane 227.3 5.9 0 0
ethers 51 furan 72.5 8.7 0.9 2.651.1 epiehlorhydrin 79.9 9.3 5.0 1.8
51.2 tetrahydrofurani 81.7 8.2 2.8 3.951.3 1,4-dioxane 85.7 9.3 0.9 3.651.4 methylale CH2t(OCI[): 88.8 7.4 0.9 4.252 diethyl ether 104.8 7.1 1.4 2.553 his(2-chloroethyl) ether 117.6 9.2 4.4 2.8'53.1 anisolee 119.1 8.7 2.0 3.353.2 di-(2-methoxyethyl) ether 142.0 7.7 3.0 4.553.3 dibenzyl ether' 192.7 9.5 1.8 3.653.4 di-(2-chloro-i-propyl) ether' 146.0 9.3 4.0 2.554 bis-(m-phenoxvphenyl) ether 373.0 9.6 1.5 2.5
ketones 55 acetone 74.0 7.6 5.1 3.456 methyl ethyl ketone 90.1 7.8 4.4 2.5
57 cyclohexanoie 104.0 8.7 3.1 2.558 diethyl ketone 106.4 7.7 3.7 2.358.1 mesityl oxide 115.6 S.0 3.5 3.059 acetophenone 117.4 9.61 4.2 1.860 methyl i-butyl ketoic 125.8 7.5 3.0 2.061 methyl i-amvl ketone 142.8 7.8 2.8 2.061.1 isophorone 150.5 8.1 4.0 3.662 di-(i-butyl) ketone 177.1 7.8 1.8 2.0
aldehydes 63 acetaldehyde, 57.1 7.2 3.9 5.563.1 furfuraldehyde .3.2 9.1, 7.3 2.564 butyraldchyde SS.5 7.2 2.6, 3.4'65 benzaldehyde 101.5 9, 5 3. 6 2.6
V.< 1. 66 ethylene carbonale 66.0 9.5 10.6 2.566.1 -.-bttyrolactone 76.8 9.3 8.1 3.666.2 methyl acetate 79.7 7.6 3.5 3.767 ethyl formate S0.2 7.6 4.1 4.167.1 propylene carbo:ntc .SS.0 9. 8 A. 8 2.068 ethyl chloroformate 95.6 7.6 4.9 3.369. ethyl acetate 9S. 5 7.7" 2.6 3.5a69. I trimethyl phophale 99.9 8.2 7.8 5.070 diethyl carbonate 121. S. 1 1.5 3.071 dithyl sulfate 131.5 7.7 7.2 3.572 n-btityl acetate 132.5 7.7 1.8 3.172.1 i-biityl aretale 133.5 7.41 1 ., 3.172.2 2-elhoxyethyl acetate 136.2 7.s 2.3 5.21.3 i-amyl aetate I1,18.8 7,5 I.5 3. I173. 1 i-butyl i-butyrrit 163'. 7.4 I 4 2.974 litnethyl phthl d , .e 16:1. q .1" . " '2A77p 4,thyl 6 111l110111111 ' 160) S 1).l 11 1,I I,
75. ! triethyl phsdhu. 171. s.2 *. .1; ;.716 diethyl phthhtte I1S, SI 1,,7 2,276,1 .lu -mmtyl phlhail:111. I. 6f, .7 -1,2 2.(1711.2 n-butyl letizyl phihlidat, 306. 9. : 5i.5 I .5
(continucd)

.. -- - - --.. .. - -- -"- = == *
w -* --u'iw--- - e-,
- 315 -
Table 1 (continued)A
Molar Parameters
volume, hi.ldebrands,
Class Code Name v a,) SP *ir
77 tricresyl phosphate 316. 9.3 6.0 2,278 tri-n-butyl phosphate 345. 8.0 3.1 2.179 i-propyl palmitate, 330. 7.0 1.9 1.879.1 di-n-butyl sebacate 339. 6.8 2.2 2.079.2 methyl oleated ;340. 7.1 1.9 1.879.3 diontyl phthalate 377. 8.1 3.4 1.580 di --- butyl stearate :382. 7.1 1.8 1.7 _
nitrogen compounds $1 acetonitrile 62.6 7.5 8.8 3.081.1 acrylonitrile 67.1 8.0 8.5 3.382 propionitrile 70.9 7.5 7.0 2.783 butyronitrile 87.0 7.5 6.1 2.584 benzonitrile 102.6 8.5 4.4 1.685 nitromethane 54.3 7.7 9.2 2.586 nitroethane 71.5 7.8 7.6 2.287 2-nitropropane 86.9 7.9 5.9 2.088 nitrobenzene 102.7 9.8 4.2 2.089 ethanolamine 60.2 8.4 7.6 10.489.1 ethylene diamine 67.3 8.1 4.3 8.389.2 1,1-dimethylhydrazine 76.0 7.5 2.9 5.489.3 2-pyrrolidone 76.4 9.5 8.5 5.590 pyridine S0 9 9.3 4.3 2.991 n-propylanie 83.0 8.3 2.4 4.292 morpholine 87.1 9.2 2.4 4.593 aniline 91.5 9.5 2.5 5.093.1 N-methyl-2-pyrrolidone 96.5 8,8 6.0 3.594 n-butylamine 99.0 7.9a 2.2' 3.995 diethylamine 103.2 7.3 1.1 3.095.1 diethylenetriamine 108.0 8.2 6.5 7.096 cyclohexylarnine 115.2 8. 5 1.5 3.296.1 quinoline 118.0 9.5 3.4 3.797 di-n-propylamine 136.9 7, 5 0.7 2.098 formamide 39.8 8.4 12.8 9.399 dimethylformamide 77.0 8.5 6.7 5.599.1 N,N-dimethylacetamide 92.5 8.2 5.6 5.099.2 tetramethylurea 120.4 8.2 4.0 5.499.3 hexaniethyl phosphoramide, 175.7 9.0 4.2 5.5
sulfur compounds 100 carbon disulfide 60.0 10.0 0 0.3101 dimethyl sulfoxide 71,3 9.0 8.0 5.0101.1 ethanethiol' 74.3 7.7 3.2 3.5102 dimethyl sulfonet 75, 9.3 9.5 6.0103 diethyl sulfide 108,2 8.3 1.5 1.0
acid halides and 104 acetyl chloride 71,0 7.7 5.2 1.9anhydrides 104.1 succinic anhydride 66.8 9.1 9.4 8.1
105 acetic anhydride 94, .5 7.8' 5.7' 5.0'monohydric 120 methanol 40.7 7.4 6.0 10.9
121 ethanol 08.5 7.7 4.3 0.5121.1 ethylene cyanohydrill
(hydranrylonitrile 6 68,3 8.4 9.2 8.6121.2 allyi alcohol, 68.4 7.9 5.3 8.2
alcohols 122 1-propanol 75.2 7.8 3.3 8.5123 2-propanol 76.8 7.7 3.0 8.0123.1 3-chloro-- -propanol 84.2 8.6 2.8 7.2
124 furfuryl alcohol 86 5 8.- 3.7 7.4
125 1-butinol 91.5 7.8 2.8 7.7126 2-butanol 92.0 7.7 2.8 7.1
I

- 316 -
Table I fcn tinued)
Molar Parametersvolume, h -ildebra -nds,
Class Code Name V 1 ar air
126.1 2-methyl-l-propanol 92.8 7.4 2.8 7.8126.2 benzyl alcohol 103.6 9.0 3.1 6.7127 cyclohexanol 106.0 8.5 2.0 6.6128 -pentanol 109.0 7.8 2.2 6.8129 2-ethyl-l-butanol 123.2 7.7 2.1 6.6129.1 diacetone alcohol 124.2 7.7 4.0 5.3129.2 1,3-dimethyl-l-tianol 127.2 7.5 1.6 6.0130 ethyl lactate 115, 7.8 3.7 6.1130.1 n-butyl lactate 149. 7.7 3.2 5.0131 ethylene gly ol monomethyl ether 79.1 7.9 4.5 8.0132 ethylene glycol monoethyl ether 97.8 7.9 4.5 7.0132. 1 diethylene glycol monomethyl
ether 118.0 7.9 3.8 6.2132.' diethylene glyeol monoethyl ether 130.9 7.9 4.5 6.0133 othylene glycol mono-n-butyl
ether 131.6 7.8 2.5 6.0133.1 2-ethyl-1-hexanoi 157.0 7.8 1.6 5.8134 1-octanol 157.7 8.3 1.6 5.8134.1 2-octanol 159.1 7.9) 2.4 5.4134 2 diethylene glyeol monn-n-Nityl
ether 170.6 7.8 3.4 5.2135 1-decanol 191.8 8.6 1.3 4.913r "tridecyl alcohol" 242. 7.0 1.5 4.4136.1 " ionyl" phentoxy etihanol 275. 8.2 5.0 4.1137 oleyl alcohold 316. 7.0 1.3 3.9137. I triethylene glycol m()Iio-flleyl ether 418.5 6.5 1.5 4,1
acids 140 formic acid :47.8 7.0 0.8 8.1141 acetic acid 57.1 7.1 3.9 6.6141.1 benzoic acid 6 100. 8.9 3.4 4.8142 'n-butvricacid, 110. 7.3 2.0 5.2142.1 n-octoic arid, 159. 7.4 1.6 4.0143 oleic acidd 320. 7.0 1.5 2.7143. 1 stearic aci& 326. 8.0 1.6 2.7
phenols 144 phenol A7.5 9.9 2.9 7.3144.1 1,3-benzenldioll 87.5 8.8 4 1 10.3145 m-cresol 104.7 8.8 2.5 6.3145.1 o-methoxypheuiol' 109.5 8.8 4.0 6.5146 methyl salicylate 1 29. 7.8 3.9 6.0147 "nonyl" phenol' 231. 8.1 2.0 4.5
water 148 water, 18( 7.6, 7.8, 20.7,polyhydrie alcohols 149 ethylene glycol 55.8 8.3 5.4 12.7
150 glycerol 73.3 8.5 5.9 14.3150.1 propylene glycol 73.6 8.2 4.6 11.4150.2 1,3-butanediol 89.it 8.1 4.9 10.5151 diethylene glycol 95.3 7.9 7.2 10.0152 triethylene glycol 114.0 7.8 6.1 9.1
153 hexylene glycol 123,0 7.7 4.1 8.7154 dipropylene glycold (mixed isomers,
see Vol. 10, p. 651) 131.3 7.8 9.9 9.0
Altered fron previouLAy pullihed value.b Solid, treated as supercooled liquid.
Valuea uncertain.'Impure commercial product of this nominal formula,

- 317 -
SOLUBILITY PARAMETERS
tions of a molecule would be additive, and obtained good precision. However, hy-drogen bonding is usually additive on an energy (Vil) basis (28). The near-constancyof A for each group in McClellan's (27) Appendix B, along with equation 1 1a led to cor-relating both V8p and V5p'. The former showed greater precision and freedom fromhydrocarbon portion effects, and so was used in Table 2 while the hydrogen bondingcolumns use VS,'. The precision shown is the full range for the data (about =-2standard deviations).
Table 2. Group Contributions to Partial Solubility Parameters
Function .I Polar parameter, H-bond parameter, VSHI, cal/molgroup VOp, (cal, cc)'/'/mol Aliphatic Aromatic
-F 225 + 25' 10 0-Cl 300 : 100 100 t 20, 100 20
Ch 175 125 165 -h 10" 180 -k- 10,-Br 300 -4- 25 5ou _+ 100 500 = 100-I 325 h 25- 1000 E 200--- 200 -b 50 1150 = 300b 1250 :E 3002'CO 390 f 15 800 --250 400 A 125,-COo- 250 :h 25 1250 + 150 800 + 1506-CN 525 .'i 50 200 550 =k 200,-NO, 500 i 50 400.=-50 400 = 504-Nil, 300 d I0M', 1350 -L 200 2250 : 200,NH 100 L 15 750 =1: 200-O1 250 -h 30 46.50 - 400' 4650 + 500(-OH)s n(170 -h 25) n(4650 A: 400) n(4650 -h 400)6_-COOH 220 =L 10 2750 -4 250 2250 + 2503
* Two or less compounds tested, confidence limits by analogy.'Unpublished infrared data included in correlation.* Data from (28), corrected to 25*C and Vap' subtracted. For important steric shielding effects,
see his Tables 7.6 and 7.7 (page 205).
Most of the data were taken from Table 1, using compounds having only onefunctional group. In addition, excess heats of vaporization from Bondi (28) and Wei-mer (19), and from gas-liquid chromatography by Martire (29), were corrected for di-pole interaction and used for hydrogen bonding. An unpublished infrared methodsimilar to that cited by Crowley (13) was also used. Some Sp values from equation1 la were used where Table 1 data were sparse (ie, on -F).
The reader is cautioned against indiscriminate addition of functional groups as ispermitted in Small's system. For -OH, 8H is additive and 8p nearly so; but the effectof adding a second chlorine reduces 8p and may or may not double 6H. Most spectacu-lar is the effect of ortho -- COO-- groups in phthalate; they combine to quadruple6,. Addition of an ether group causes such complex effects that Hoy (23) calls theproducts "chameleon"; some of the benefits are discussed below under emulsions, butmathematical prediction requires further study.
Practical Use of the Solubility Parameter
Solvent Selection for Coatings. The most widespread practical use of the solu-bility parameter has been within the paint and related industries since these areintimately associated with solvent selection, Indeed, most of the practical develop-

- 318 -
SOLUBILITY PARAMETERS
ments outlined in the previous section were by workers in the paint field. The usualprocedure is to perform a solubility-parameter study by contacting the solute (poly-mer) in question with a limited number of solvents chosen specifically to examine be-havior at all levels of the parameters concerned. These data are then plotted in asuitable manner and a region of solubility is defined by those solvents found to dis-solve the particular polymer. Plotting the data is a straightforward procedure whenonly two solvent parameters are used, but requires more effort when the three-di-mensional systems are employed (Fig. 1). Various means to plot three parametershave been suggested including projections along each of the three axes (12, 25), useof triangular coordinates (30), and contour plotting (16). It has also been suggestedthat the 8p. vs am plot in the Hansen system is sufficiently accurate for most practicalpurposes (Fig. 2). It should be remembered, however, that cyclic, halogenated, anda few other special solvents have relatively high 6, components, as do most polymers,and are, therefore, somewhat more potent than indicated by this plot. Fig. 1 also hasthe advantage that the solubility region is a circle rather than an irregular shaped bodyas is found in the other systems. A computer can be very useful in calculations and inplotting.
Having defined a region of solubility, one can proceed to use it in solving practicalproblems. Solvent selection can be systematically worked out according to the re-quirements of the solvent for evaporation rate, flash point, toxicity, etc, and finallythe requirement that the solb ent or solvent blend chosen lie within the region of solu-bility. Many practical solutions to this problem involve boundary solvent mixtures,since hydrocarbon diluents are used as much as possible for economic reasons. A rulefor the average solubility parameter of a mixed solvent based on the volume fractionsof the solvents is sufficiently accurate in practice. The effect of diluents (nonsolvents)is seen since the average solubility parameter approaches a boundary as their concen-tration increases. One can also systematically choose a mixed, good solvent composedexclusively of nonsolvents, by choosing nonsolvents located, respectively, on oppositesides of the region of solubility. It is possible to make use of combinations of alcoholsand hydrocarbons in such situations, perhaps including a third, slow, good solvent asinsurance that the last solvent leaving the film is a good one. Plasticizers can contrib-ute to the average solubility parameter of a system and should not be neglected incalculations or graphic solutions to problems.
In general, one can quickly determine all possible combinations of solvents whichwill solve a particular solubility problem. It may be useful to remember that the solu-tion viscosity at high polymer concentration can be decreased by selectively using sol-vent blends where the solvent viscosity itself is low, and where the solubility parameterof the solvent approaches that of the polymer. Returning to the example of an alco-hol-hydrocarbon mixed solvent, it is well known that additions of 1-butanol (viscosity= 2.96 cP) to xylene (viscosity = 0.87 cP) will produce this viscosity reductioneffect in spite of the greater neat viscosity of the 1-butanol. Had ethanol been choseninstead of 1-butanol, the effect would have been more pronounced because of its lowerviscosity and higher 51,. Similar examples can be found by considering solubility pa-rameter plots, such as Fig. 1 or 2.
Selection of Other Coating Ingredients. In addition to solvent selection one canuse solubility-pararneter (energy) concepts to help understand and solve other types ofpractical problems. Burrell's articles are filled with examples. Liquid miscibilityplots can be constructed, if desired, and problems concerning polymer compatibility

319
SOLUBILITY PARAMETERS
: 6,
10
91 -- -- - - -
7
1 5
1 4 1,
1 23 4 5 6 7 8 9 > 1
I -'I
Fig. 1. Solubility plot for poly(methyl methaerylate) based on nolutin in milvents of differet delt avalues. The circles represent areaw within which the soluhility ik 10%- or more.
can be systematically approached since polymers having essentially the same solubilityparameters (dissolve in the same solvents) are more likely to be compatible because oftheir physical similarity. Crystallinity and high molecular weight may far outweighthese factors, however. Other examples inhclde the formulation of thixotropic systemswhere (in alkyd systems) one customarily reacts a small amount of hydrocarbon in-soluble material into the system late in the synthesis of the vehicle. These hydro-carbon insoluble portions form loosely bound domains in hydrocarbon solvent; thesedomains provide body to the system while at rest and are easily broken by shear(brushing) to allow even flow during application. Small additions of alcohol will alsodestroy the domains and the thixotropie behavior, illustrating that one does not al-ways want good solvents.
Some work on the relation of sohihilit-y parameters to pignment dispersion has beenreported, but this has not been explored as much as the importance of the processwarrants (31-33). In general, if a pignient suspends for )rolonged periods in the liq-uids used in a solubility-parameter study of its surface lroperties, that. pigieut will beeasily wet by a suitable binder. The most suitable binder from this point of view

3
320
SOLUBILITY PARAMETERSt7
G) tlmet hltornmamnde
6 (D 2 Natropropine
- Acetone~~Elthylte gqlycol=nuriumethyl ether c
SiNttivI ethyl ketone t 110 n S4 CyclotieXairone 0 0 1 0s rp,.ton D1.quil dcolIol
" Methyl isobutyl ketone-- O G exhylvne chloride
TLthioVdrofurai, a ( 1 -B utanol0 Ethyl acelate j
Orthyleneglycol monometmyl ether scettte 42 t 8utyl acetatte
T r ic h lo r o e th y le n e (D C h lo ro fo rm
0 Xylene
LHexae Fg2.ooiat lne0 - -e I I 1 I I]
1 2 3 4 5 6 7 a 9 10
Fig. 2. SolubWility parmnieter plw for ,.on solvetls, 4
would be one dissolving in the Same solvents that suspend the pigment. Adsorptionseenis to be greater in a poor sol'-,nt than in a good one, but stability my be greaterin a better solvent since the polymer molecules apparently extend more ill the betterIsolvent nflintAinifg greater iiiterpartielh diSt:nces (31 34). Adsorption of polymnersas well as surface-active agenits is better cotlsidered ill terms of nonsolubilitv ratherthan solubility, since the Gibbs prineiple, requires that the tota! sytem free energ" be- Icome stabilized at. the hwest, possible value. According to the particular situationthis may be arranged to occur with high energy portions being adsorbed on a highenergy solid surface, or perhaps in a wttter phase. L.ow energy portions may remainin an urganic veh'eh,, or if heyv , arv not .ompllatibh the, ina ( bg ydrotrboln, silicon)they will atp;a'it r it. the lowest aergy surf'ace availabhe, tht air-liquid intetrfae. I
Dispersion-type coatings can also be analyzed from a solubility parameter pointof view. The general principle is to distribute the film former in a stabilized manner,in a relatively fast evaporating medium, be it, water or hydrocarbon solvent. Filmformation fron the dispersed state requires the flo\ing together of the dispersed par-ticles. Th is intimate intermingling of the particles is effected by a liquid known as acoalescing solvent, which is added to impart, lhe required mobility to the polynior mole-cules. To be effective, the slowly ,vevaporting, coalescing solvent must be such thatthe solubility paraneter of the last, solvent to volatilize is located within the region ofsolubility for the tilm-forming material. ()rgatosols are formulated oil similar prin-ciples, with a boundar'y solvent. mixture in the initial stable system. The solvent im-proves with the loss of t.he( poorer solvent cud a film is formed, aided by the applicationof heat in most cases.
Tin general, visual observations of 10" ", olutions" are suitable for a solubilityartlnlneter study. Higher or lower cot ietantralions may hi used il lparticular problems.

- 321 -
SOLUBILITY PARAMETERS
Low degrees of swelling (solution) in noncrosslinked polymer systems essentiallydefine concentric regions surrounding those usually described as "soluble" on a solu-bility parameter plot.
Other Studies on Polymers. Beerbower (25) has systematized selection of croa-linked elastomers for use in contact with various types of liquids. This is illustrated inFigure 3, where the swelling of polysulfide rubber has been plotted on the plane ob-tained by opening out the three-dimensional corner of Figure 1 along the 6
D axis andflattening it. Each liquid appears in each quadrant, so that this presentation is 50%redundant. The 25% swelling contours are presented here as rectangles as a simplifi-cation to permit expressing them as "pass or fail" limits, but could have been shown asthe projections of two ellipsoids. This figure is of special interest since it unexpectedlyrevealed that the rubber consisted of a block copolymer-a finding which was laterverified by independent investigation.
A third method of presentation is shown in Figure 4. This is a computer proce-dure, as it requires simultaneous evaluation of 6,, 6p and 6H for the elastomer, twoweighting factors for the differences in Sp and 6,, the maximum possible swelling,Q..1 , and a constant related to the relative molar volumes of the liquid and elastomer(between crosslinks). As there is some question as to the true constancy of the lastfactor, it is suggested that investigators develop their own program for such problems,and especially for copolymers. Only vulcanized natural rubber was evaluated by thecomputer procedure, but results on twelve other ehstomers were correlated by theflattened three-dimensional approach. The results were successful in terms of predict.ing "pass" or "fail" on the 25% swell criterion in 97% of over 1000 data points.
9
8OU
* .
* 5
0 4 0
• Oe e e
SS14 13 12 11 10 9 8 7 6 5 4 3o 2 " 6 7 9 0 1
00 81
-o
Fig. 3. Birnioal 25% sweel contour of polysulfide rubber (CST). LEu.:-osi: a, greater thaii 350%swell; 0, = 101 to 350% swell; X, 51 to 100%; +, 26 t( 50%; 0, 11 to 25%; arid *0 to 10%.

322 -
SOLUBILITY PARAMETERS
600
500 -
400
300 -
200 A
a* AS(1) * *! " (4)&
9~ 0 o ,, .-- 80 () t70soI40 -(l1
30 - A 2)
20-MI
100 I 1 1
0 10 20 30 40 so 60 70 80
, Cdl,'C
Fig. 4. Correlation of swell of natural rubber with radius of spheroid; all values of swell werenormalized for vulcanization level of 2.75 pph sulfur. rhe equation of the line is logic Q = logic
- 0,0 R,; R.', (=0 -- S)' + 0.19 (61- + 3.9)' + 0.19 (6) - 3.A)'. L;K'i;D: X, binarymixtures from ref. 35; 0, pure compom'iids from ref. 35; A, pure compounds from ref. 36; and 0,pure compounds from ref. 37. (1) indicat 4s hexane-ethyl acetate system; (2), aniline; (3), CCI:F:and (4), benzaldehyde.
Another important prol)erty of a polymer is its wettability. This has been char-acterized by Zisman (38) iii a critical surface tenision, -y,, defined t.u the surface freeenergy of the most energct.iu nonhydrogen-bonded liquid to wet the polymer com-pletely (ie, contact angle = 00). Wu (39) has been able to correlate these Y, valueswith the solubility parameteN of the polymers as calculated by Small's (40) method.His prefrred equation is dimensionally unbalanced, but he also offers a second, bal-anced equation which gives about the same results. As an example, Wu calculates yj
for polyisopreac in the following way:The monomer is considered in simple groups, with the double bond which enters
into polymerization disregarded. "Force constants" according to Small are tabulated,multiplied by the number of groups of this class, and summed up:
-CH& 1X 214 = 214CH2 1 X 133 = 133CH- 1X28 = 28
-CH---CH-- I X 222 = 222H IX90 =9ZF = 687
This is substituted into the equation
- = 0.229(ZF)1d.7/o.3Mi.'7 (lib)

- 323 -
SOLUBILITY PARAMETERS
where d is the polymer density, x the number of atoms in the monomer and M themonomer molecular weight. The result of this calculation is -j, = 30.7, compared with31 by actual measurement. Presumably, the constants more recently computed byHoy (23) would give approximately the same value.
An alternative approach was published by Hansen (40a), in which the cosine ofthe contact angle is used in place of the solubility on a plot similar to Figure 1. Thecircles are then drawn to enclose all liquids which spread on the surface. The resultis a set of three partial parameters to characterize the surface, rather than a y, value.The technique, like Zisman's, may be applied to metallic and other surfaces as well asplastics.
Surface Free Energies. Hildebrand (2) established the relationship betweensolubility parameter and surface free energy as a simple quadratic equation, but un-fortunately was unable to provide a theoretical value for the constant in it. Evenmore unfortunately, he then set up a dimensionally unbalanced equation which hasbeen widely used, with confusing results (see preceding section). Beerbower (41) hascarried the analysis through on a three-dimensional parameter basis, and was able tocorrelate the surface free energies of most organic liquids, fused salts, and liquid metalswith one equation:
-y = 0.0715V'/'[56b + 0.632(6,2 + 5H2)) (12)
Special equations were required for aliphatic alcohols, for alkali halides, for fivemetals roughly grouped as "irregular," and for -y,. The constant was derived from thenumber of nearest neighbors lost in surface formation, assuming that the moleculestend to occupy, on" the average, the comers of regular octahedra. This postulate hasother justifications, but the greatest is that it yields a value of 0.07152, while empiricalfit of the data on organic solvents had previously given 0.07147.
Hildebrand (2) suggests that the solubility parameters of blends may be esti-mated by summing the parameters of the components multiplied by their volume frac-tions. This works well enough for polymer interactions (7, 25) but cannul. be appliedto surface free energies of blends due to enrichment at the surface in accordance withthe.Gibb,-Duhem principle of minimizing the free energy of the system. This ap-proach presumably gives the instant free energy of a freshly formed surface, which isuseful in such fast-moving processes is fractional distillation. Hildebrand's solutionto this problem is not entirely satisfactory, though Clever (41a) has done a great dealof work on evaluating it and has developed a computer program for the purpose. Thepredictions are quite accurate but are made so at the cost of uising the molar surfaceareas of the components as adjustable parameters. The deviation from the "real"areas as expressed by a V'/' function is minor in regular liquids but becomes sizablewith increasing irregularity. An alternative approach was worked out by Shain (42)and applied by Sprow (43) with good success, again for simple mixtures. Beerbower(25) reported use of the volume blending rule along with chromatographic separationfor the solubility parameters of petroleum fractions, and more recently has used equa-tion 12 to estimate these from the surface free energies. This again falls into theregular solution category, and there is still need for much work in prediction of surfacefree energies from three-dimensional parameters for blends of irregular li(uiids. Inaddition, the rate of attaining the Gibbs-Duhem equilibrium has not been ad,,tquItelypredicted.
Liquid-Liquid Interactions. O'tv Of fle faCt0 rs llfen'[ rIVi J'1lokvd in ib.! us, ofsolubility parameters is the vital imlportance nf he molar V1'hmos when predict ing

-324-
SOLUBILIT Y PARAMETERS
solubilities, and such rules-of-Chumb as "liquids differing by 2 hildebrands art, in-completely miscible" can be quite misleading. 'rite reatson is that disparity of miolarvolume plays a duel role hiere, as it builds up not only AS, hut also the entropy. Hilde-brand's equation (ref. I (43a) (eq. 10.3) shows this %ver 'y clearly, and has been used byBeerbower (25) to correlaite the aniline point (AS'l'N\I MIt-thod D -6l I) wN 'ith thle soli-
bilty armetrsan~ mlarv(li1ne at2.C o hdro~ihoi slvetsAssuming thatthe 'consolute temperatutre'' ((CST) conies at th 0" 'G-b.\-vohinw point, whch\ ani(4-1) show's is utsuAly trute, and using 10.6 as te hi' epirical solubility parameter of aniline(approximately 5j. + 0.25 [61,2 + 51,]) he arrived at the relation
- 10.6 [1e A~ D + 46 (13)
whereR1 = 1 .98N4, the gnsconstanrt, in e~l((' noe.This expression fits the anilinepoint (A, in 'F) and molar volumes of 41. hydrocarbon solvents withiin +0.8 hilde-brand. However, the relationship fails for oleins and esters, NN here thec CST dloes notfall near 50%-bv-voltiipe poinit. Hilebrin's qution colita.ilis ineaiiS for' adjustingto other eoiisolite( voluohes. bt itesten ns~ot tested.
It will be noted that, the above ea.miple uises the single p~arameter, with a some-what arbitirary adjustnmnt for 31. and 61, For liquid -liquid(l xtractions. this is notadequate, and Weimer (1)) has deelpe mtlieis for h andling polar-nonpolar inter-actions. Helpinst-ill (21) extendled thiis to l4liripolar systemns. Unfortunately, botharticles contain niispriiits. andl (]!)) in jpp(e tiuaredsco)rreCtion. -'igre 1-3 ntiarticle actuailly lt al/cm3' rather than cal1/--mol1 as stated, andI equation 9 lacks thefactor ''RT" in th e last two terms. Worstof allthe ltomomnorph charts in these articlesyield 51) v11lues that are higiier thani those from Blaniks (18) which were the basis forsuccess .ful correlatimns (S, 10, 11. 2-5. 3N, -15). Even miore unfortunately, Beerbower(2-5) propagated the problem bo vxternlinig the samne charts to higher molar volumnes,hut he did not make, use of them. In o((er to take advatage iof tie valuesgin Table 1,it is necessary t~o continue use- of the Blanks chart.
Despite thes-e difficulties, the two articles onl liquid-liquid extraction make a veryimportant point.. Both ,ise a tw~o-lpart parameter, the polar and hiydrogen-hondingforces., br(ilig lum11ped toget I nr ill I he follo wing ex-pression:
72 +5 ± 12 (14)
This paramneter, 7r, is used with a correlation factfor, or as defined by Weimer, a,correct IOTI terml wh10h in' effect becomes a facetor. The, need for this has been attrib-uted to failure of real systerms to mneet one, of Ilildebraind's assumiptions (19), and tothe (directional niire of the polar and h,.ydrowen-borid forces (3q). In any case, theneed for this ('orreCt ion is vry real . The valutes found for various situations are asfollows:
(Jon rcrioie.JFaclor). 1) Liquid I.1do',yi-1111i WIilliIcfrcc
0.250 poilyiners, sirf:ictanmt s, pigmnents 10. 191 vulcanized polv, isoprene'. 250. 632 its own va:por 3S0). 208, 0,202 iandffltis 19, 210. 170, 0. '/24 o lefins 19, 21().100, 0. 10 Of, rornatics 19, 21
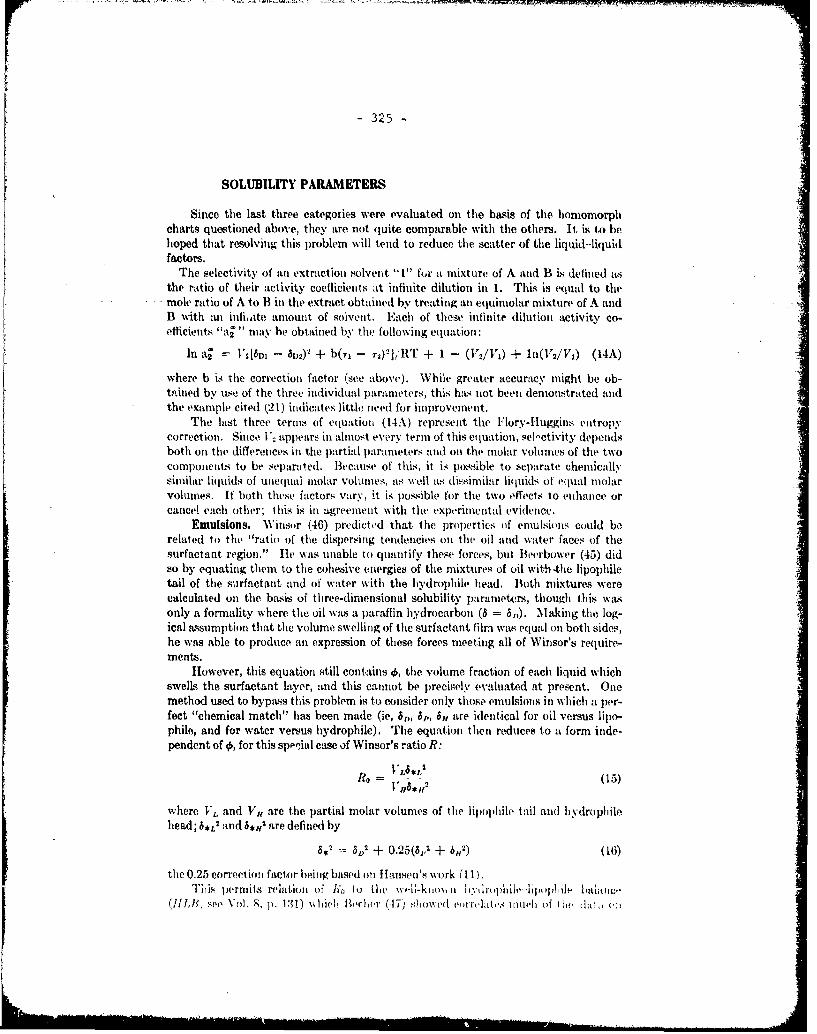
-325
SOLUBILITY PARAMETERS
Since the last three categories were evaluated oin the basis of the honomorphcharts questioned above, they are not quite comiparable, with the others. It is to behoped that resolving- this problem will tend to reduce the scatter of the liquid--liquidfactors.
The selectivity of an extraction solvent "I'' for a mixture of A and B is defined asthe ratio of their activity coefficients A infinite dilution ill 1. This is equal to themole ratio of A to B inl the extract obtained by' treating an equiniolar mixture of A andB with an infiatte amiount of solvent. Each of these infinite dilution activity co-efficients "a; "' may be obtained by the following equationl:
Ina = 1l2[bo - b5D,) + b(Tl - r 2 )"I r1 + 1 - (V2/1"1) + 1n(V'2/V1 ) (14A)
where b in the correction factor (ziee above). While greater accuracy miight be ob-tained by use of the three individual parameters, this has not been demionstrated andthe example cited (21) indicates little need for improvement.
The last three ternis of equation (14A) represent the Flory-Iluggins entropyicorrection. Since Vj appear- in almost every termn of this equation, seb-ctivity depenidsboth on the differences inl the p~artial parameters .1nd on1 the molar volumes of the twocomponents to be separvied. Because of this, it is possible to separate chemically'Similar liquids of uneqlual molar volumes, as well as dis similar liquids of equal miolarvolumes, If both these factors vary', it is p)ossible for the two effects to enhiance orcancel each other; this is in agreement with the experimental evidlence.
Emulsions. Winsur (46) predicted that the properties of emliionIs could berelated to the "ratio of the dispersing tendencies on the oil and water faces, of thesurfactant region." lie wias unable to quantify these forces, but literbower (45) didso by equating them to the cohesive energies of the mixtures of oil with-the lipophileAtail of the surfactant and of water with the hydropliile head. Buth mixtures werecalculated onl the basis of three-dimensional solubility paranieters, though this wasonly a formality where the oil wasm a paraffin hydrocarbon (5 =61)). Making the log-ical assumption that the volume swellinig of the surfactant film was equal onl both sides,he was able to produce an expression of these forces meeting all of Winsor's require-ments.
However, this equation still contains 0, the volume fraction of each liquid whichswells the surfactant layor, and this cannot be precisely evaluated at present. Onemethod used to bypass this problem is to consider only those emullsionls inl which a1 per-fect "chemical match" has been made (ie, 6,r) 6p, 6,1 are identical for oil versus lipo-phile, and for water versus hydrophile). The equation then reduces, to a form inde-pendent of 0, for this sppfeial case of Winsor's ratio R:
where V, and Vff are the partial molar volumes of the lijpphile tail and hydrophilehead; 6*L and 6
*n2 are defined by
6* =32 + 0.25(6,,2 + 6,2) (1w)
the 0.25 correction factor heinig based onl Hansen's work (11).Tii rmil's reiati(,II of I, io tlie w'1ki, i id-plim-hjnjislan~co
(11J,1, s('1- Vol. S. 11. 131) Ndijeb Kti'lwei (4717) Alowed eu11114.11ii~ of Ile 1:11, o:1

-326-
SOLUBILITY PARAMETERS
nonionic emulsions. Since HLB is defined as. 20M,,/(AL + M) where M is molecularweight,
0=,ym' ( 20 di (17)
where dH and dL are the densities of head and tail.
This valuable relationship helps to validate both the Winsor theory, which lackednumerical data, and the HLB theory, which was entirely empirical. Another approachto the swelling fraction problem was to assume that 0 = 0.5. This resulted in an equa-tion which correlated the data on emulsions made in water, formamide, and mixturesof these, but not those made in glycols.
Use of these equations for the design of O/W (oil-in-water) emulsions made withethoxylated surfactants requires only the assumption that the supply of emulsifier isadequate to cover at least 50% of the droplet surface. The steps are as follows:
1. Determine V0 and 6*o for the oil to be emulsified. Unless the oil is exception-ally polar or hydrogen-bonded, the value of a or 6D may be used for 3.. If a surfacefree energy is available, equation 12 may be used as an approximation.
3*,o _ - V/_0.0715 V"'/. (17a)
2. Correlation of literature data for the optimum value of R0 for oil in water
emlulsionis leads to the working version of equzation 17:
HLBo = 20 +o2/(5,o2 + 3S.4) (17b)
where HLB is the required HLB value for the emulsifier.3. An emulsifier is selected which meets the above criteria of HLBo and 6-L
6,o. The terni L is determined by Small's method (37), cal'lating the 7 Y 'aides(town to hut not inciudin. the first elier or ester (-G-) !i.kage. A thi'd -based on experience, is that FL = Vo. Rarely is a single emulsifier Avail:-ble whichmeets all three criteria, and it is customary to blend two or more. This practice Isespecially beneficial when different types of lipophile are blended (47), probably be-cause of increased entropy.
4. All that remains is to set the percentage of emulsifier. Becher (47) providessome calculation methods, but it is probably best to make a test series to determinethe balance of economy versus stability.
Solubility of Gases. Hildebrand (1) gave a chart which is reasonably accurate forpredicting the solubility at 25 0 C of simple gases in regular liquids with solubilityparameters from 6 to 10. This work has been greatly extended by Prausnitz (48),who removed not only the temperature limitation but also other limitations. Theirapproach is basically that of "condensing" the gas to a hypothetical state having aliquid-like volume. This hypothetical fluid is then blended with the solvent on essen-tially a liquid miscibility basis. The key information is the molar volume and solu-bility parameter of the gas as "condensed" at 25°C. Appropriate values for commongases are listed in Table 3. These are used ill the following e'quation:
I A " V(3 1 - 52)2 0(c= _ ;exp . (17)
where X2 is the mol fraction of the gas in solution, f2O is the fugacity of the pure gas at

- 327 -
SOLUBILITY PARAMETERS
initial conditions (taken as one atmosphere partial pressure) and f2L is the fugacity ofthe hypothetical liquefied gas. The latter is obtained from Fig. 5, adapted from Praus-nitz (48). The critical temperature (T,) and pressure (P,) of the solute gas are alsorequired. For gases of ordinary low solubility, 01 (the volume fraction of solvent) maybe taken as unity.
Table S. "Liquid" Volumes and Solubility Parameters for Gaseous Solutes at 25°C
Gas V, cc/g-rnol 8, (cal/cc)"'
N, 32.4 2.58 0CO 32.1 3.130, 33.0 4,0Ar 57.1 5.33CH4 52 5.68CO 155 6.0Kr 65 6.4
U4 65 6.6C1Hl 70 6,6Rn 70 8.83CIS 74 8.7
J. M. Prausnitg. and F. H. Shair, A.I.Ch.E.J. 7,682 (1961); also reference 48.
Special methods are required for the light gases 112, He, and Ne, which requirecorrections based on quantum mechanics, and for reactive gases such as HCI, SO2 andNHz. Hydrogen-bonding gases are given special treatment (48).
Effects of Temperature on Solubility Parameters. The success cited above inhandling miscibility and gas solubility problems at various temperatures from theparameters at 250C is due to a feature of the regular solution model, cited by Praus-uitz (48). This is that the value of the complex functions
V2012(6 - 62)2 and V,021(61 -/h)2 (18)
are independent of temperature (as long as the composition remains constant). Since01 and 01 vary only slightly with temperature, (6 - 62) is often mearly temperature in-
6I
4
0.4
02
0.1o. r, lo 1.4- 1 212 2.6 3 0
T,If'
Fig. 5. Fugaeity Uf lypjthCti(Aal liqUid at 1 atmosphere.
j

- 328
SOLUBILITY PARAMETERS
dependent. Hildebrand (2) gave an estimate of the variation of individual solubilityparameters of nonpolar liquids
d- 1.25a5D (19)dT
where a is the temperature coefficient of expansion, d(lnV)/dT. This is not very exact,as he warns the reader, and he suggests a more sophisticated method. However, it ispossible to derive an even more exact relationship from the well-known Watson equa-tion for variation of AH, with temperature:
d6D/dT = -Db[a/6 + 0.6 T1'. 2/ D 2 (T, - T)2 -2] (20)
It is now evident that the "constancy" of (61 - 62) is true only when the criticaltemperatures of the two materials are comparable, or a happy combination of a, T,and 8D exists.
The polar parameter may be handled more simply, since p is independent oftemperature. Differentiation of equation 11a gives
d5,/dT = -5pa/2 (21)
There is no rigorous way of arriving at values of the temperature coefficient of thehydrogen bonding parameter, but Bondi (28) has provided empirical values at 100°Calong with some of the AEy values cited in Table 2. Assuming as above that d(AEp)/dT = 0, his numbers should reflect only d(AEff)/dT. Dividing them by the excessheats of vaporization and averaging the four results leads to
d6H/dT = -5V(1.22 X 10- 1 + a/2) (22)
Processing some of Weimer's data (19) the same way gives several more results of.bout the same magnitude, though averaging slightly lower.
By way of example, the rates of charnge for two liquids are shown in Table 4.
Table 4. Hates of Change for Two Liquids
Equation
19, 21, 22,Liquid dSD/dT dae/dT d6n/dT
acetone* -11.1 X 10 - -3.0 X 10- 3 -6.1 X 10-
l-propanol -9..3 X 1O- -1.6 X 10- -14.5 X 10- 3
The value for d8D/dT, as calculated by equation 20, would be - 10.7 X 10- 1, art insignificantimprovement.
This points up the importance of the level of hydrogen bomdihng, since it, is gen-erally believed that these bonds weaken rapidly with temperature. Actually, this istrue only for alcohols and is due to equation 22 being the sum of the two.
Effects of Pressure on Parameters. Large increases in pressure tend to increaseall the solubilityparanieters because of he dvere.se in V, and may be considered in ageneral way to be equivaent to reductions in temperature. Compressibility measurc-ments afford a means to study cohesive energy, as h)o.lit(d out by Hildebrand (2), andcurrently by Bagley (49).
A very interesting extension of the solitbility p[arantete," concept has been made by

-329 1SOLUBILITY PARAMETERS
Giddings (50) who applied it to supercritical gases compressed to liquid-like densities.The results have been useful in predicting the correct gas to use in high-pressure gaschromatography, and also in other problems relating to solubility in these peculiarfluids.
The above examphas should be sufficient to demonstrate how various types ofphysical-chemical problems can be analyzed systematically and simply in terms of theenergy concepts made possible by suitable interpretation of the solubility parameter.Understanding physical phenomena in terms of energies allows analysis of how materialscan be expected to interact, a prime requisite for solving everyday industrial problems.
Theoretical Implications of the Solubility Parameter
The theoretical implications of an understanding of energy interactions amongmaterials are too numerous to relate here. Prausnitz (48) has gone into this in somedetail, and has demonstrated the interchangeability of solubility parameters, Flory-Huggins inter.action p.rameters, and actlivity coefficients. In doing so, he emphasizesa point often overlooked, that the definition of 6 in equation 1 describes the energyof vaporization required to expand the vapor isothermally to infinite volume. He. alsorelates this type of correlation to the more general Prigogine and corresponding statestheories (51). However, there is still work needed to tie in Hansen's work with Mar-on's (52), annd Patterson's (53). The notable absence here of numbers related to ac-ceptor-donor interactions has disturbed numerous people, but this arose only in thesurface-free-energy work (4 1) and could be easily handled by correction factors. Thesuccess of solubility parameter concepts in explaining the data as completely as theydo ha s been said to rest upon compensating errons; if so, the compensation is excellent.It has also been suggested (54) that. the Hansen solubility-paranieter sysiem should beinverted, the solvents being represented as spheres having radii proportional to (RT/V)", thus leading to reducing radii with increasing molecular weight (ie, polymers aspoints h.lping to explain incompatibility more readily). This last consideration hasgenerally been resolved in an arbitrary manner by treating the material concerned asthe volume on solubility parameter plots, since this is generally what is of greatestconcern in a given situation. The success of the solubility parameter in the (partial)characterization of inorganic salts and other materials in terms of the properties oforganic liquids, suggests that terms can be included in equations 4 and 6 to includethe energies arising from ionic and ,etallic type interactions. Work on surface-activ,agents and also bearing materials is being continued. Questinis concerning entropyare yet to be resolved, but we do know that the free energy must be close to zero in aboundary region on a solubility plot. The Flory-Huggins parameter should also beclose to 1/2 in the same region.
In spite of these many questions, some significant progres's has been made in thearea of relating surface phenomena to bulk liquid properties. The correlation ofHildebrand and Scott has been rewritten in terms of the Hansen solubility parameterswith excellent correlation for most liquids (41).
Conclusion. It. is h, d tha t his brhif expo Isition of the past perfrnitinee aridthe exl,,ted fittrt. of a very 11Sfn pra(tieal ',oil will stin iulit, 1niIre interest andaction oil the part of practical and thelretical workers dike. There is much to bedone :and. hopefully. the three-parameor i tur of tie soluhility iar:i.ntwler will nitimped- proi)rosg. If there lro, throe (orin mor) ind,!eiidtn, effeets, quite simply, three

- 330
SOLUBILITY PARAMETERS
(or more) parameters are required to describe them. Certainly there are other effectdin the solubility question, but the 6 D, 6, and 8,u parameterr, have demonstrated sig-nificance, with molar volume as a necessary fourth parameter in most cases.
The challenge to understand the physical interactions among all types of materialsin terms of their energy properties should be recognized and met, not only in bulksystems, but also at interfaces.
ACKNoWLEDGMENT: The work reported in this article was supported in part by Army ContractNo. DA11C19-69-C-0033, administered by tle llesearch Technology D)ivimion, Army ReiearchOffice, Arlington, Va.
Bibliography
1. J. lildehrandand It. Scott, hCgular .olutinns, Prent.ice-1hill, Englewood Cliffs, N.J., 1962.2. J. Hildebrand and I. 6vott, Solubility, of Non-Eletrol/trs, 3rd ed., Reinhold Publishing Corp.,
New York, 1949.3. II. Burrell, Arn. Chi'. Scoc., Diision of Organic Coatings Plastics Chemistry, PreprintA 28 (1),
682-708 (1968).4. II. Burrell, Offic. Dig. 27 (369), 726 (1955).5. 11. Burrell, Offir. Dig. 29 (394), 1159 (1957).6. 11. Burrell, 17I Federation il'.-Issoriations dr "'1'chnicriens d,s Industries des Peintsrea, Vernis,
Emriau ct Erierrs d'Irprimerie de 'Enrope Coti, ritale, Congress Book, 1962, p. 21.7. C. IM. Iansen, Id. Eng. Chi',n. Prod, Res. Div. 8, 2 (11169).S. C. I. llan enn,ine il I Tvrh1nial U ivnvritry of lDetnark, l)an,i..h Teclnical
Press, Copenhagen, 1967.9. C. M. Hans.en, Farsg Lack 14 (I), L,-22; (2), 23-25 (1968).
10. C. ,IN. IIansen, J. Paint Technol. 39 (505), 104 (1967j.11. C. M. Hansen, J. Paint Techrol. 39 (511), 505 (1967).12. C. 'M. Hansen and K. Ska'rup, J. Paint Technol. 39 (511), 511 (1967 I.13. J. 1). Crowley, (. S. Teagule, arid J. W. Lowe, J. 'aint lTchnol. 38 (496), 2U16 (1966).14. L. P. Lieberman, Offic. Dig. 34 (444), 30 (1962).15. M. l)vek and P. Iloyer, Farbe lnl, 70, ',22 (10641.16. J. I). Crowley, G. 9. Teague, and J. W. I.rrwv, J. Paint Te-chnol. 39 (504), Iit 1967).17. A. E. Van Arkel and S. E. VIes, Rie. Tray. Chin. 55, 407 (1936); A. E. Van Arkel, Trans.
Faraday Soc. 42B, 81 (1946).17a. Reference 1, p. 167.18. M. F. Blanks and J.. M. l'rausnitz, Ind. Eng. ('he .Fi d. 3, 1 (1964).19. It. F. Weimer and J. ]NI. Prinasnitz, Hldnoearbon Proc. Pctr. Ref. 44, 237 (1965).
20. H. G. Harris and J. 1. Prausnnitz, Ind,. Eny. Che'm. hinnd. 8, 180 (1969).21. J. 6. Tlelpinstill and MI. Van Winkh,, ld Erig. ('hrm. Prnc. Res. Dir. 7, 213 (ltiS).22. j. i.. Gardon, ,J. Pnia Technol. 38 (492), 43 (1966).23. K. L. Iloy, .1. l'aint Tchnol. 42 (541), 76 (1970).24. I. J. Good, in Treatiir on ,ldhesion and Adhesirs, It. L. Patrick, ed., Miareel )ekker, Inc.,
New York, 1967.25. A, Beerhower and .l. ]:. l)iekey, i.S.L.E. Trans. 12.1 (1969l.26. C. J. F. Bithoer, Throrl of Ehctrie Polarization, Ekevier, New York, 19,52, Chap. 5.27. A. L. McClllan, Tabhis of Erpri,'tal Dipole .lornicnis, Frecrini, Inc., San Franlcirco, 1963.28. A. Bondi, Physicrl Prop rti, s of .Ilotcular Crystanls, Liquiis, ard Gla.s vs, John Wiley & Sors,
Inc., New York, 106N.29. 11). E. ,Martirn and P. icil, .1. l'hyi. 'hm . 72, 3478 (1968).30. J. P. Tems, J. Patn" Tchiol. 40, 10- 25 (19!t).31. P. Sorensen, j. Oil r ('h misls' .C /ssoo. 50, (3), 226(1967'.32. K. Skaarup, Farg Lack 14, (2), 28-42; 14, (3), 45-56 (196S).33. A. Vinther and A. P'eter yn, I'crfkran:ek 10. 2(; 9 (1967!.34. W. D. Schaeffer, Amn. Ink Maker 43 (5), 54 ( 195i).35. (t. Gee, Trans. Inst. Rubber Ind. 18, 266- 2sl k 194:1).

- 331 -
SOLUBILITY PARAMETERS
36. B. 3. Eiseman, Jr., Refrigeration Eng. 57, 1171 (1949).37. Anonymous, Enjay Butyl Rubber Chemical Resistance Handbook, Enjay Chemical Co., New
York, 1964.38. W. A. Zisman, in Contact Angle, Weiaabslity and Adhesion, Advance# in Chemistry Series No. 48,
American Chemical Society, Washington, D.C., 1964, pp. 1-54.39. S. Wu, J. Phys. Chem. 72, 3332 (1968).40. P. Small, J. Appl. Chem. 3. 71 (1953).
=40a. C. M. Hansen, J. Paint Tech. 42 (550), 660 (1970).41. A. Beerbower, J. Coll. Interf. Sci., 35. 126 (1971).
41a. H. L. Clever, J. Coll. Interf. Sci., awaiting publication.42. S. A. Shain and J. M. Prausnitz, A.I.Ch.E.J. 10. 766 (1964).43. F. B. Sprow and J. M. Prausnitz, Trans. Faraday Soc. 62, 1105 (1965).
43a. Reference 1, p. 143.44. A. W. Francis, Crilical Solution Temperature#, Advances in Chemistry Series No. 1, American
Chemical Society, Washington, D.C., 1961.45. A. Beerbower and J. Nixon, Am. Chem. Soc. . Div. Preprints 14 (1), 62 (1969).46. P. Winsor, Solvent Properties of Amnphiphilir Co,,,punds, Butterworth Scientific Publications,,
Ltd., London, 1954.47. P. Becher, Emulsions, Theory and Practice, 2nd ed., Amni. Chemn. Soc. Monograph Series No. 162,
Reinhold Publishing Corp., Inc., New York, 1965.48. J. M. Prausnitz, Molecular Thermodynamics of Fluid-Phase Equilibria, Prentice-Hall, Engle-
wood Cliffs, N.J., 1969.49. E. B. Bagley, T. P. Nelson,, J. W. Barlow, and S-A. Chen, Ind. Eng. Chem. Fundamentals 9, 93
(1970).50. J. C. Giddings, N. M. Myers, L. McLaren, and It. A. Keller, Science 162, 67 (1968).51. J. M. Prausnitz, Chem. Eng. Sci. 20, 703 (1965).52. S. H. Maron and C. A. Daniels. J. Macromol. Sci.-Phys. B2 (3) 449-461 (1968); B2 (3), 463-
477 (1908); B2 (4), 591-602 (1968); B2 (4), 743-767 (1968); B2 (4), 591-602 (1968).53. D. Patterson, J. Polymer Sci. Part C Polymer Synp. No. 16, 3379 (1968).54. T. Kahler and S. L. Knudsen, Student Report, Technical Univ. of Denmark, 1967.
CoARLs HANsENPPG Industries, Inc.
ALAN BEiREOWEBEsso Research and Engineering Co
- -- elm
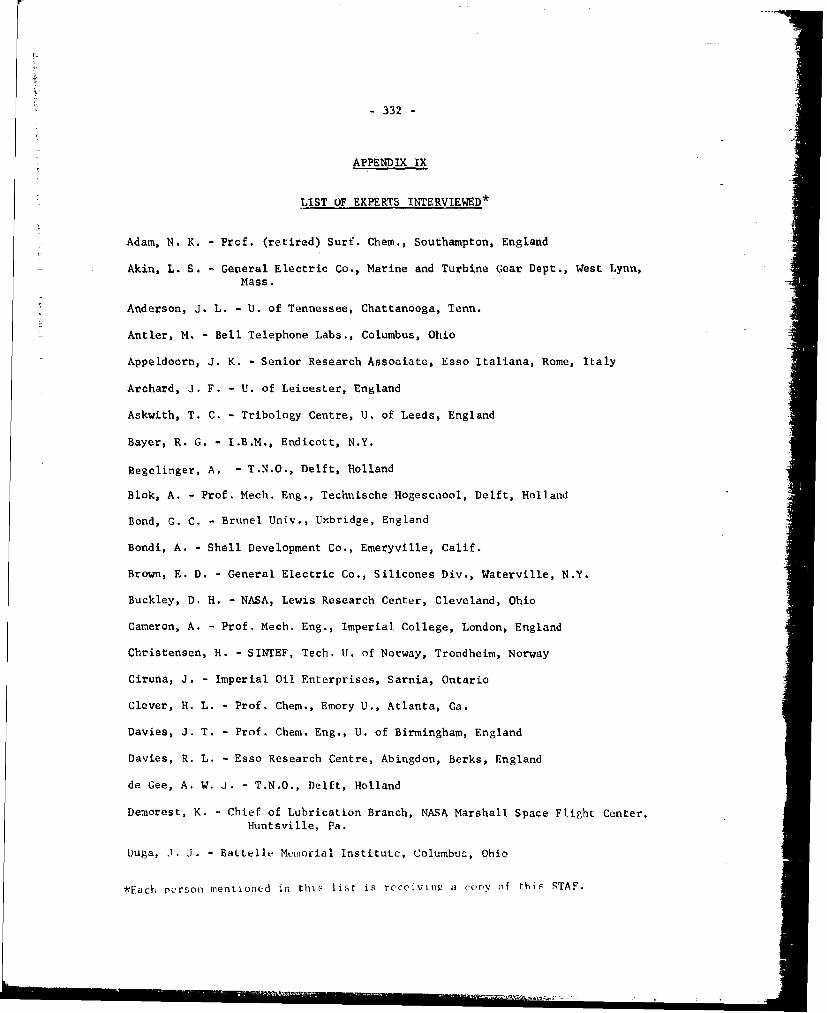
- 332 -
APPENDIX IX
LIST OF EXPERTS INTERVIEWED*
Adam, N. K. - Prof. (retired) Surf. Chem., Southampton, England
Akin, L. S. - General Electric Co., Marine and Turbine Gear Dept., West Lynn,Mass.
Anderson, J. L. - U. of Tennessee, Chattanooga, Tenn.
Antler, M. - Bell Telephone Labs., Columbus, Ohio
Appeldoorn, J. K. - Senior Research Associate, Esso Italiana, Rome, Italy
Archard, J. F. - U. of Leicester, England
Askwith, T. C. - Tribology Centre, U. of Leeds, England
Bayer, R. G. - I.B.M., Endicott, N.Y.
Begelinger, A. - T.N.O., Delft, Holland
Blok, A. - Prof. Mech. Eng., Technische HogescAool, Delft, Holland
Bond, G. C. - Brunel Univ., Uxbridge, England
Bondi, A. - Shell Development Co., Emeryville, Calif.
Brown, E. D. - General Electric Co., Silicones Div., Waterville, N.Y.
Buckley, D. H. - NASA, Lewis Research Center, Cleveland, Ohio
Cameron, A. - Prof. Mech. Eng., Imperial College, London, England
Christensen, H. - SINTEF, Tech. U. of Norway, Trondheim, Norway
Ciruna, J. - Imperial Oil Enterprises, Sarnia, Ontario
Clever, H. L. - Prof. Chem., Emory U., Atlanta, Ga.
Davies, J. T. - Prof. Chem. Eng., U. of Birmingham, England
Davies, R. L. - Esso Research Centre, Abingdon, Berks, England
de Gee, A. W. J. - T.N.O., Delft, Holland
Demorest, K. - Chief of Lubrication Branch, NASA Marshall Space Flight Center,Huntsville, Pa.
Duga, J. J. - Battelle Memorial Institute, Columbus, Ohio
*Each Person mentioned in this list is receivine a cory of this STAF.

- 333 -
IX - 2
Egan, T. F. - Bell Labs, Holmdel, N.Y.
Fein, R. S. - Texaco Research Center, Beacon, N.Y.
Feng, I-M. - Esso Research and Engineering Co., Linden, N.J.
Feurstenau, D. W. - Prof. Mat. Sci. and Eng., U. of Cal., Berkeley, Cal.
Finkin, E. F. - Mechanical Tech. Inc., Latham, N.Y.
Fowkes, F. M. - Prof. Coll. Chem., Lehigh U., Bethlehem, Pa.
Fowles, P. E. - Mobil Research Center, Princeton, N.J.
Goldblatt, I. R. - Esso Research and Engineering Co., Linden, N.J.
Goldman, I. B. - Western Electric Co., Princeton, N.J.
Good, R. J. - Prof. Chem. Eng., State U. of N.Y., Buffalo, N.Y.
Grew, W. J. S. - Imperial College, London, England
Groszek, A. J. BP Research Centre, Sunbury-on-Thames, England
Hansen, C. M. - P.P.G. Industries, Springdale, Pa.
Hermance, H. W. - *etired), Bell Labs., Holmdel, N.J.
Johnson, R. L. - Chief of Lubr. Branch, NASA Lewis Research Center, Cleveland,Ohio
Kingsbury, E. P. - MIT Instrumentation Lab, Cambridge, Mass.
Klaus, E. E. - Prof. Chem. Eng., Penn. State U., University Park, Pa.
Ku, T. C. - I.B.M., Sndicott, N.Y.
Leslie, R. L. - Vickers Inc., Troy, Mich.
Neumann, A. W. - Prof. Mech. Eng., U. of Toronto, Ontario, Canada
Oliver, D. R. - U. of Birmingham, England
Panzer, J. - Esso Research and Engineering Co., Linden, N.J.
Pask, J. A. - Prof. Ceram. Eng., U. of Cal., Berkeley, Cal.
Philippoff, W. - Esso Research and Engineering Co., Linden, N.J.
Prausnitz, J. M. - Prof. Chem. Eng., U. of Cal. Berkeley, Cal.
Rabinowicz, E. - Prof. Mech. Eng., MIT, Cambridge, 'Mass.

- 334 -
IX - 3
Robbins, E. J. - Risley Tribology Centre, Warrington, England
Rowe, C. N. - Mobil Research Center, Princeton, N.J.
Saibel, E. - Carnegie Inst., Pittsburgh, Pa.
Salomon, G. -T.N.O., Delft, Holland
Smith, A. J. - Imperial College, London
Tabor, D. - Prof. Surface Chem., Cambridge, England
Tao, F. F. - Esso Research and Engineering Co., Linden, N.J.
Vaessen, G. H. G. - T.N.O., Delft, Holland
Weale, K. E. - Prof. Chem. Eng., Imperial College, London
Wilkinson, C. S. - McDonnell Douglas Co., Santa Monica, Cal.
Zisman, W. A. - Naval Res. Lab., Washington, D.C.

-335-
APPENDIX X
PUBLICATIONS RESULTING FROM THIS CONTRACT
* "A Critical Survey of Mathematical Models for Boundary Lubrication"ABLE Trans. 14, 90-104 (1971).*
e "Surface Free Energy: A New Relationship to Bulk Energies", J. Coll. andInterf. Sci. 35, 126-132 (1971).**
* "Solubility Parameters", (with C. M. Hansen), Encyl. Chem. Tech. 2nd ed.Supp. Vol. 889-910 (1971).
" The Environmental Capability of Liquid Lubricants", NASA Symposium,on Interdisciplinary Approach to Liquid Lubricant Technology,awaiting publication (1972).
* Received Alfred E. Hunt Award from ASLE as best paper of 1971.
** More than 70 requests for reprints from all over the world have beenreceived. I
i
III