AMPTIAC - DTIC
337
731-3-r.— 3+ AMPTIAC OR NL-4350 UC-25 — Metals, Ceramics, and Materials FUELS AND MATERIALS DEVELOPMENT PROGRAM QUARTERLY PROGRESS REPORT FOR PERIOD ENDING SEPTEMBER 30, 1968 Reproduced From Best Available Copy OAK RIDGE NATIONAL LABORATORY operated by UNION CARBIDE CORPORATION for the U.S. ATOMIC ENERGY COMMISSION DISTRIBUTION STATEMENT A Approved for PubHc Release Distribution Unlimited 20000711 189 jffiß QUALIT1 INSPECTED 4
-
Upload
khangminh22 -
Category
Documents
-
view
0 -
download
0
Transcript of AMPTIAC - DTIC
731-3-r.— 3+
AMPTIAC OR NL-4350 UC-25 — Metals, Ceramics, and Materials
FUELS AND MATERIALS DEVELOPMENT PROGRAM
QUARTERLY PROGRESS REPORT
FOR PERIOD ENDING SEPTEMBER 30, 1968
Reproduced From Best Available Copy
OAK RIDGE NATIONAL LABORATORY operated by
UNION CARBIDE CORPORATION for the
U.S. ATOMIC ENERGY COMMISSION
DISTRIBUTION STATEMENT A Approved for PubHc Release
Distribution Unlimited 20000711 189 jffiß QUALIT1 INSPECTED 4

1
Pr inted in the United States of America. Avai able from Clear inghouse for Federal Scientific and Techn cal In format ion, I ational Bureau of Standards
U.S. Department of Commerce, Spr ingfield Virgin a 22151
Price: P inted Copy *
LEGAL NOTICE
This report was prepared as an account of Government sponsored work. Neither the United States,
nor the Commission, nor any person acting on behalf of the Commission:
A. Makes any warranty or representation, expressed or implied, with respect to the accuracy,
completeness, or usefulness of the information contained in this report, or that the use of
any information, apparatus, method, or process disclosed in this report may not infringe
privately owned rights; or
B. Assumes any liabilities with respect to the use of, or for damages resulting from the use of
any information, apparatus, method, or process disclosed in this report.
As used in the above, "person acting on behalf of the Commission" includes any employee or
contractor of the Commission, or employee of such contractor, to the extent that such employee
or contractor of the Commission, or employee of such contractor prepares, disseminates, or
provides access to, any information pursuant to his employment or contract with the Commission,
or his employment with such contractor.

tl\C\C
ORNL-4-350
Contract No. W-74-05-eng-26
METALS AND CERAMICS DIVISION
FUELS AND MATERIALS DEVELOPMENT PROGRAM QUARTERLY PROGRESS
REPORT FOR PERIOD ENDING SEPTEMBER 30, 1968
Compiled by
P. Patriarca' ¥. 0. Harms
Edited by
D. J. Rucker
FEBRUARY 1969
OAK RIDGE NATIONAL LABORATORY Oak Ridge, Tennessee
operated by UNION CARBIDE CORPORATION
for the U.S. ATOMIC ENERGY COMMISSION

Ill
FOREWORD
This quarterly progress report describes research and development
on nuclear fuels and materials performed at the Oak Ridge National
Laboratory for the U.S. Atomic Energy Commission. With several excep-
tions, as noted below in the listing of specific programs, the work is
sponsored by the Fuels and Materials Branch of the Division of Reactor
Development and Technology. Classified aspects of the Nitride Fuels
Development activity and work on fuels and materials for isotope heat
sources are covered in separate ORNL progress reports.
The report is presented in five parts according to AEC Activity
titles provided by the Fuels and Materials Branch, RDT.
Program Title Person Principal
ORNL Division(s) in Charge Investigator(s)
I. Fuels and Claddings
Sol-Gel Fast Reactor Fuels
Metals and Ceramics P. Patriarca A. L. Lotts Chemical Technology J. L. Scott Reactor R. E. Brooksbank
Nitride Fuels Development
Metals and Ceramics W. 0. Harms Reactor
Reactor Chemistry 0. Sisman
J. L. H. C.
R. M. J. G.
Scott McCurdy
Carroll Morgan
Fission-Gas Release and Physical Proper ties of Fuel Mate- rials During Irradiation
Zirconium Metallurgy Metals and Ceramics C. J. McHargue P. L. Rittenhouse
II. Coolants
Alkali-Metal Corrosion Studies
Metals and Ceramics W. 0. Harms Reactor
J. H. DeVan A. P. Litman R. E. MacPherson
Preceding Pag^S Blank
\

IV
Program Title ORNL Division(s) Person in Charge
Principal Investigator(s)
III. Radiation Damage to Structural Materials
Behavior of Refrac- Reactor Chemistry G. M. Watson tory Materials Under Irradiation
Fast-Neutron Irradia- Reactor Chemistry G. M. Watson tion Effects on Electrical Insulators*
G. W. Keilholtz
G. W. Keilholtz
Mechanical Proper- ties Research and LMFBR Cladding and Structural Mate- rials Development**
Radiation Effects in Alloys and Struc- tural Materials
Metals and Ceramics C. J. McHargue J. R. Weir
Solid State D. S. Billington M. S. Wechsler
IV. Techniques of Fabrication and Testing
Tungsten Metallurgy Metals and Ceramics W. 0. Harms
Nondestructive Test Development
Metals and Ceramics W. 0. Harms
Joining Research Metals and Ceramics G. M. Adamson on Nuclear Materials
Fuel Element Fabri- Metals and Ceramics G. M. Adamson cation Development
H. Inouye W. R. Martin G. M. Slaughter J. 0. Stiegler J. R. Weir
R. W. McClung
G. M. Slaughter
J. V. Cathcart W. R. Martin R. W. McClung
Sponsored by Reactor Power Systems Branch, Division of Space Nuclear Systems.
■*-*.
Partially sponsored by Liquid Metals Branch, Division of Reactor Development and Technology.
r Person Principal
Program Title ORHL Division(s) in Charge Investigator(s)
V. Engineering Properties of Reactor Materials
Physical and Mechan- Metals and Ceramics W. 0. Harms H. Inouye ical Metallurgy of R. W. McClung Refractory Alloys D. L. McElroy
G. M. Slaughter J. R. Weir
Vll
CONTENTS
Page
Summary xiii
Part I. Fuels and Claddings
1. Sol-Gel Fast Reactor Fuels 3
Preparation of Sol-Gel (U,Pu)02 Fuels 3
Development of Fabrication Processes 4
Sphere-Pac 4
Pelletizing of Sol-Gel (U,Pu)02 5
Capsule Fabrication 8
Sodium Filling System 9
Characterization of (U,Pu)02 Fuels 13
Analytical Chemistry 13
Manufacture of Standard Samples of UO2 14
Thermal Conductivity of Sol-Gel Fast Reactor Fuels IS
Deformation of U02 20
Irradiation Testing of Sol-Gel (U,Pu)02 Fuels 21
Uninstrumented Thermal Flux Irradiation Tests .... 22
ORR Instrumented Tests 25
Transient Testing of Sol-Gel-Derived (U,Pu)02 Fuels 29
Fast Flux Irradiation Tests 31
Irradiation Test Calculations 32
2. Nitride Fuels Development 33
Synthesis, Fabrication, and Characterization of Nitride Fuels 34
Synthesis and Fabrication of UN 34
Characterization of UN 35
Synthesis, Fabrication, and Characterization of Mixed Nitrides 37
VI11
Studies on Synthesis, Fabrication, and Thermodynamic Properties of Carbonitride Fuels 39
Manufacture of UC, UN, and U(C,N) from U02 39
Studies on Compatibility of Mixed-Nitride and Carbonitride Fuels with IMFBR Cladding Alloys ...... 48
Compatibility of Vanadium Alloys with Nitride Fuels 48
Fuel-Cladding Thermal Conductance 56
Irradiation Testing of Nitride Fuels 62
Model Studies on Nitride Fuel Pins 64
3. Fission-Gas Release and Physical Properties of Fuel Materials During Irradiation 67
Effect of Fission Density on Release of Fission Gas from Enriched Single-Crystal U02 Spheres 67
Determination of Amount of Nonfission Heating Required for In-Reactor Thermal Diffusivity Measurements 67
Effect of Temperature, Fission Density, and Burnup on the Thermal Diffusivity and Fission-Gas Release of UN 72
Effect of Temperature, Fission Density, and Burnup on the Fission-Gas Release from Sol-Gel (Uo.8oPuo.2o)C-2 Microspheres 74
Effect of Temperature, Fission Density, and Low Burnup on Fission-Gas Release from (U0.75Pu0i25)02 .... 76
A Technique for Handling Pu02 Specimens Outside Glove Boxes 76
Fission-Gas Release Studies on Fine-Grained High- Density Spheres of (U,Pu)02 78
4. Zirconium Metallurgy 79
Fabrication and Texture Control of Zirconium Tubing .... 79
Texture Effects, Texture Development, and Anisotropy of Properties 81
Circumferential Texture Variation in Zircaloy Tubing 81
Texture Gradients in Thin-Walled Zircaloy Tubing ... 82

IX
Part II. Coolants
5. Alkali-Metal Corrosion Studies 87
Mass Transfer of Interstitial Impurities Between Vanadium Alloys and Sodium 87
Oxygen Effects on the Compatibility of Vanadium and Sodium 87
Interstitial Mass Transport Between Type 300 Series Stainless Steels and Vanadium Alloys 91
Interstitial Effects on Mechanical Properties of Vanadium Alloys 93
Compatibility of Stainless Steel and Insulation in LMFBR Systems 94
Effect of Insulation on Oxidation of Stainless Steel . 95
Effect of Sodium on Oxidation of Stainless Steel — Insulation Couples 100
Corrosion of Refractory Alloys in Lithium, Potassium, and Sodium 102
Compatibility of Boiling Potassium with Refractory Alloys 103
Effect of Oxygen on Compatibility of Refractory Metals and Alkali Metals 120
Corrosion of Refractory Alloys by Lithium 127
Part III. Radiation Damage to Structural Materials
6. Behavior of Refractory Materials Under Irradiation 139
Irradiation Damage to Nonfissionable Refractory Materials 139
Refractory Metal Carbides 139
Refractory Metal Nitrides 14-3
Effects of Irradiation on LMFBR Fuels 145
Irradiations of Depleted UN-UC Fuel 145
7. Fast-Neutron Irradiation Effects on Electrical Insulators . . 146
General Survey of Fast-Neutron Effects on Electrical Insulators 146
Irradiation of High-Density, Commercial AI2O3 Products Considered for Thermionic Insulators 146
Irradiations in ETR 146
Irradiations in EBR-II 147
Irradiations of Metal-Clad A1203 Specimens 147
•
x •
y/ti. Mechanical Properties Research and LMFBR Cladding and Structural Materials Development 148
Development of Titanium-Modified Type 304 Stainless Steel . 148
Development of Titanium-Modified Types 316 and 316L Stainless Steel 149
Radiation Effects in Type 316 and Titanium- Modified Type 316 Stainless Steel 152
Effects of Titanium and Carbon Variations in Incoloy 800 . 155
Radiation Damage in Incoloy 800 159
Mechanical Properties of Hastelloy N and Related Compositions 163
Aging of Titanium-Modified Hastelloy N ■ 163
Effects of Irradiation Temperature 166
Electron Microscopy Studies 169
v9. Radiation Effects in Alloys and Structural Materials 174
Radiation Effects on Pressure-Vessel Steels 174
Radiation Hardening and Embrittlement in ASTM A 212-B Steel 174
Electron Fractography of Irradiated A 212-B Pressure-Vessel Steel 182
Radiation Hardening and Embrittlement in ASTM A 533-B Steel 189
Properties of 12-in.-Thick ASTM A 533-B Class 1 and Class 2 Steels 194
Radiation Effects in Iron 202
Radiation Hardening in Iron 202
Radiation Effects in Vanadium 215
Trapping of Interstitial Impurities in Vanadium Defects Produced by Radiation ... 215
^10.
Part IV. Techniques of Fabrication and Testing
Tungsten Metallurgy 229
Primary and Secondary Working of Tungsten Alloys 229
Extrusion of Tungsten 229
Installation of New Tube Reducer 230
Chemical Vapor Deposition of Tungsten and Vanadium Alloys . 230
Deposition of Tungsten-Rhenium Alloys 230
Deposition of Vanadium Alloys 233
r XI
Metallurgical Properties of Tungsten Alloys 234
Recrystallization of Wrought CVD Tungsten 234
The Properties of CVD Tungsten Deposited from WC16 . . 237
v 11. Nondestructive Test Development 24-2
Electromagnetic Inspection Methods (Eddy Currents) . . . . 242
Analytical Studies 242
Probe Development 243
Ultrasonic Inspection Methods 245
Optical Visualization of Ultrasound 245
Frequency Analysis 246
V 12. Joining Research on Nuclear Materials 249
The Effect of Minor Variations in Chemical Composition on Weldability 249
The Effect of Minor Elements on the Hot-Cracking Tendencies of Inconel 600 250
Weldability of l&f> Cr-8$ Ni Class Stainless Steels . . 252
Development of Welding Procedures for Commercial and Modified Alloys 254
Joining Development in Support of Fast Flux Test Facility 254
The Effects of Defects on Mechanical Properties of Weldments 256
13. Fuel Element Fabrication Development 260
Irradiation Studies of Dispersion Plates 260
Fabrication of Fuel Plates 265
Investigations of Nonuniform Deformation in Simulated Fuel Plates 265
Study of the Fit of Fuel Compact to Frame Cavity . . . 265
Grinding and Crushing of UA1 Fuel 270
Mechanisms of Swelling in the UA1 -Al Compacts .... 276
Characterization of Sol-Gel U30g 276
Studies of Fuel Plate Surfaces 280
Vapor Fabrication of Fuels and Reactor Materials 282
Vapor Fabrication of PuÜ2 Powder from PuF6 282
Flame-Produced Material 282
Chemical Vapor Deposition of Silicon Carbide from Silicon Tetrachloride-Methane-Hydrogen Mixtures . . . 286

1
Xll
Development of Nondestructive Inspection Techniques .... 287
Scanner Calibration Studies 288
Radiographic Densitometry 288
Part V. Engineering Properties of Reactor Materials
V 14. Physical and Mechanical Metallurgy of Refractory Alloys .... 293
Basic Physical Metallurgy Studies 293
Solubility, Diffusivity, and Permeability of Interstitials in Refractory Metals 293
Interaction of Stress and Vacuum on Properties of Superalloys at Elevated Temperatures 294-
Development of Age-Hardening Refractory Alloys .... 296
Thermodynamics of Spinodally Decomposed Alloys .... 298
Welding and Brazing Development 302
Brazing Alloy Development 302
Physical Properties of Refractory Materials 306
Thermal Conductivity of Tungsten-Base Alloys 306
Development of a Thermal Conductivity Method Using Electrical Heating 310

Xlll
SUMMARY
PART I. FUELS AND CLADDINGS
Sol-Gel Fast Reactor Fuels
We are assessing the potential of sol-gel-derived (u,Pu)02 fuel
for use in the Fast Flux Test Facility. Emphasis this quarter has been
on preparing materials and capsules for irradiation testing in the EBR-II.
Five Sphere-Pac-loaded EBR-II capsules are being fabricated and
are scheduled to be completed by the first of November. After diffi-
culties in preparing crack-free microspheres for the EBR-II capsules,
we produced a sufficient quantity of spherical material with acceptable
packing characteristics. Equipment for loading the EBR-II capsules by
the Sphere-Pac process was installed and checked. Other equipment and
procedures for preparing the EBR-II capsules were developed and checked
and are being used in fabricating these capsules. We have continued to
investigate methods of pressing and sintering pellets with controlled
densities ranging from 80 to 95$ of theoretical density.
A series of analyses is now available for characterizing finished
fuel. We have developed a method for preparing stoichiometric UO2 that
is also applicable to the mixed oxides and will be used for preparing
analytical standards. Construction is continuing on the new radial heat
flow apparatus. Studies are under way to determine the thermal con-
ductivity of LiF to its melting point. The thermal conductivity of LiF
has been successfully calculated at room temperature in terms of phonon
mean free path, but an expression for conductivity that is applicable
at high temperatures is needed to compare conductivity values over
the whole range of temperatures investigated. Isostatically pressed
and die pressed UO2 powders were found to have similar stress-strain
curves at 1425°C. The stress leveled out at about 15,500 psi until the
deformation exceeded 10$. We found the activation energy for creep in
UO2 to be 142 kcal/mole between about 2 and 6$ deformation.
We began examining the fourth uninstrumented capsule in the ETR series.
Burnup analysis of the fuel indicates the linear heat rating on these
XIV
four rods - three of Sphere-Pac UO2 and one of pelletized UO2 - was in
excess of 20 kw/ft. This heat rating, which was higher than we antici-
pated, was probably caused by the flux in the irradiation position of
this capsule being higher than advertised. There was no evidence of
cladding strain in these rods, which achieved a burnup level of about
5$ FTMA. Metallographic examinations have not yet been made. We have
started developing a mathematical model to describe fuel densification
by the evaporization-condensation mechanism.
Metallographic examination of the fuel from the first instrumented
test of mixed-oxide Sphere-Pac fuel revealed attack of the central
molybdenum thermocouple well. The fuel body contains a significant
amount of a white deposit, probably Mo transported as the M0O3 vapor
and subsequently reduced.
We continued our evaluation of thermal neutron filters and of the
heat-transfer medium for use in the transient test program. We will
not use neutron filters on the first tests. Because of its significant
effect on cladding temperatures, Na will be used in preference to NaK.
The design for the five Series I EBR-II encapsulated test rods was com-
pleted, and the hardware has been procured. The required analysis of
hazards for these rods is well under way.
2. Nitride Fuels Development
Characterization studies on UN powders produced by the traditional
OKNL process have shown the powders to be acicular and smaller than
1 u in diameter. X-ray analysis showed them to contain 20 to 3O/0 higher
nitrides.
An extensive effort to control gaseous impurity levels in our
Plutonium glove boxes has led to operating levels of less than 10 ppm 0
and 20 ppm water vapor at argon flow rates that change the atmosphere in
the box five times per hour.
Kinetics studies on the reaction between UC2 and N to form UCN
showed that the process is controlled by the interface between UC2 and
UCN. The constant for the reaction rate, k , fits an Arrhenius relation-
ship:

XV
k = 85.9 exp (-77,700/RT) cm/sec .
Both single-phase UN with 400 ppm 0 and UN containing second-phase
UO2 (5000 ppm 0) were found to have reacted with V-15$ Cr-5# Ti after
100 hr at 1000°C. The reaction is thought to have been caused by the
Ti in the alloy.
3. Fission-Gas Release and Physical Properties of Fuel Materials During Irradiation
We need to know the nonfission (NF) heating for calculating thermal
diffusivity of fuel specimens during irradiation.
We have found that the NF heating of Cu in the C-l position of the
0RR can be represented by a linear function of the thermal neutron flux,
<t>:
NF heating (w/g) ■= (8.73 x 10"14-) 4> + 0.09 .
UN specimens developed many fine cracks during irradiation. The
gas-release measurements reflected the physical condition of the specimen.
Specimens of (U0.75 Puo-25)02 are being irradiated. We developed
a method for handling (U,Pu)02 specimens on the bench. The specimen was
coated with a protective layer of naphthalene to prevent the spread of
Plutonium contamination. After the specimen was encapsulated, the
coating was evaporated by heat and vacuum.
4. Zirconium Metallurgy
Seven of the twelve schedules for the manufacture of Zircaloy tubing
have been completed. These tubes have been reduced to final size by
tube reduction, swaging, planetary swaging, and cold drawing. Grain size
in the finished tubing depended only upon the degree of cold work in the
final reduction.
Circumferential variation in texture intensity of up to 400% has
been observed in tubing produced by experimental tube reduction. This
variation is directly attributable to improper die shape, to the ratio
of tube feed to rotation, and to the ratio of wall reduction to diameter
reduction.

XVI
Texture gradients and texture developments have been examined in
tubing fabricated by different techniques to identical dimensions from
identical starting materials and starting dimensions. Heavy reductions
in wall thickness promote texture gradients through the wall of the tubing
and align basal poles parallel to the radial direction, whereas large
reductions in diameter align basal poles at about ±60 deg from the radial
toward the tangential direction with no texture gradient through the wall
of the tubing.
PART II. COOLANTS
5. Alkali-Metal Corrosion Studies
The partitioning of 0 between V and Na was investigated in static
capsules tested at 600 and 800°C for 500 hr. We found that V containing
about 2000 ppm 0 has a much higher affinity for 0 in Na than do Nb and
Ta containing ^ 100 ppm 0. Vanadium containing 2000 ppm 0 was not
attacked by Na, in contrast to similarly doped Nb or Ta. Several thermal
convection loop assemblies were fabricated to investigate the partitioning
of C and N between V and 300 series stainless steels. The loops incor-
porate vanadium hot leg assemblies joined to stainless steel with dis-
similar metal braze joints.
We began a two-year effort to guide the selection of containment
piping and thermal insulation for IMFBR systems. This task includes a
comprehensive study of the literature and tests of the compatibility of
selected stainless steels and thermal insulation in air and inert gas,
with and without the presence of Na. Our experimental program incor-
porates an investigation of the causes and cures of catastrophic oxi-
dation, effects of small and large sodium leaks, and early leak detection.
We have completed our examination of two W—26$ Re refluxing capsules
that were operated 3000 hr with boiling K at 1200°C. One of the capsules
showed no evidence of corrosion, but the other showed a tungsten deposit
in the condenser and subsurface attack in the boiler. The latter capsule
was fabricated from arc-cast material and had a higher as-received oxygen
concentration than the unattacked capsule produced by a powder metallurgy
process. A mechanism was presented to relate the corrosion observed to
the higher initial oxygen content of the W—26$ Re alloy. We also

XVI1
completed our examination of a TZM natural-circulation loop that operated
with boiling K for 4400 hr at a 1200°C boiler-condenser temperature. The
loop showed no evidence of attack and only minor weight gains in the sub-
cooler region.
A D-43 alloy loop with D-43 alloy test section (FCL-8) which oper-
ated with boiling K for 10,000 hr was removed from the vacuum chamber
and sectioned for metallurgical examination. Detailed information is
presented on liquid-metal removal, metal cleanup, and visual examination
of boiler and condenser legs. No dimensional changes and no evidence
of mass transfer have been found in examinations to date on the loop
piping or specimens.
The role of 0 in the corrosion of Ta by K was evaluated at 800 and
1000°C. Tantalum specimens with pretest concentrations of 650 ppm 0 or
higher were penetrated by K at 800°C. The same occurred for specimens
with > 1000 ppm 0 at 1000°C. The conditions for penetration are com-
parable in many respects to those for the penetration of contaminated
Ta in Li. Oxygen contamination in the K did not lead to penetration
but increased the apparent solubility of Ta in Na. Preliminary studies
of the Nb-O-Na system show effects quite similar to the Ta-O-K system.
An analysis of the partitioning of 0 in the Zr-Na and Zr-K systems
was carried out in conjunction with the use of the zirconium-gettering
technique (GVF) for measuring the oxygen level of these alkali metal
systems. We found the partitioning coefficient, (i.e., atom fraction of 0 in Zr _} &t ^ to fee ter than lQ3 for both atom fraction of 0 in K or Ha' systems. This means that, under our experimental conditions, the 0
picked up by our zirconium getter tab gives a direct measure of the 0
initially present in our alkali metal sample.
Examination of a T-lll loop that circulated Li for 3000 hr at 1350°C
has revealed preferential transport of Hf from hot to cold regions.
Chemical analysis of insert specimens, which initially contained 2.5$> Hf,
showed the hafnium surface concentration to be 1.4$ at the hottest loop
position compared with 58% at the coldest point.
Work continued on the T-lll alloy test-bed loop (FCLLL-l) for studying
new refractory alloys, especially tungsten alloys, at temperatures to

XVI11
154-0°C in 20 fps liquid Li. All T-lll alloy assemblies have been fabri-
cated, all welds have been vacuum annealed, and all control specimens
with their furnace enclosures have been completed.
PART III. RADIATION DAMAGE TO STRUCTURAL MATERIALS
6. Behavior of Refractory Materials Under Irradiation
In-reactor thermal annealing reduced gross damage to explosion-
pressed carbides of refractory metals (Ti, Zr, Ta, Nb, W) irradiated at
1000 to 1100°C as compared to damage at 300 to 700°C. Volume expansion
was also reduced at 1000 to 1100°C except for the case of explosion-
pressed WC, which expanded slightly more at high temperature. The data
are generally consistent with results for hot-pressed and slip-cast
carbides.
Cylindrical specimens of the nitrides of Zr, Ti, Ta, and Nb were
irradiated at 1000 to 1100°C to fast-neutron fluences ranging from 0.4 to
2.3 x 10²¹ neutron/cm2 (> 1 Mev). Gross damage to ZrN was much less at
this temperature than at 150°C, whereas that to NbN was much greater
than at 150°C. The nitrides expanded significantly less at 1000 to
1100°C than at 150°C. The expansion was decidedly greater in the axial
direction than in the radial direction. We suggest that He from the
(n,a) reaction diffused in such a way as to produce preferential axial
expansion because the radial direction was constrained by the specimen
containers.
7. Fast-Neutron Irradiation Effects on Electrical Insulators
A short-term and a long-term assembly containing three commercial
AI2O3 products for evaluation for thermionic use, have been undergoing
irradiation in the ETR at 600, 800, and 1100°C. The irradiation of the
short-term assembly is now complete after fast-neutron doses between
about 0.3 and 1.8 X 10²¹ neutrons/cm2 (> 1 Mev). An assembly containing
metal-clad A1203 units prepared at other installations was fabricated
and inserted into the ETR for planned fluences ranging from 0.4- to
2 X 10²¹ neutrons/cm2.
XIX
8. Mechanical Properties Research and IMFBR Cladding and Structural Materials Development
Results of postirradiation tests on standard and titanium-modified
type 316 stainless steel continue to show that important thermally-
induced changes in the properties are occurring from 550 to 750°C. For
the standard type 316 stainless steel, we observe that the reduction in
tensile elongation is larger for the low-carbon alloy than for the high-
carbon alloy. We observe an increased postirradiation creep rate due
mainly to thermal aging and a reduced ductility due to neutron damage.
As the titanium content in 50-lb melts of type 316 stainless steel
is increased, the postirradiation ductility exhibits a maximum in the
range of 0.1 to 0.5$ Ti in both high- and low-carbon compositions. Upon
aging near 650°C, the ductility of the titanium-bearing alloys increases
with time.
We are continuing to investigate the effects of tubing fabrication
variables on the properties of the titanium-modified type 304 stainless
steel and have successfully processed tubing from both the high- and
low-carbon heats. The effects of processing variables on the tubing
yield and its mechanical properties are now being studied.
Further work on the influence of titanium concentration on the
postirradiation ductility of Incoloy 800 shows that the optimum titanium
concentration occurs at 0.1$ Ti in both high- and low-carbon melts. We
find that the creep strength parameters are strongly influenced by the
grain size and the composition, with the larger grain size and higher
alloy content favoring higher strength.
The modifications to the composition of Hastelloy N that we are
investigating have been found to introduce aging effects not found in
the standard composition. It appears that at temperatures above about
700°C the microstructure formed with time has a deleterious effect on
the properties that may be associated with compositional changes other
than the titanium addition.

XX
9. Radiation Effects in Alloys and Structural Materials
Several new techniques have now been employed in our study of the
radiation hardening and embrittlement of reactor pressure-vessel steels.
The impact machines in the laboratory and hot cell have been fitted with
strain gages whose calibrated output registers the load applied to the
sample during impact. The total energy to fracture determined from the
strain-gage output agrees with that indicated on the scale of the impact
machine. The general yield load, the maximum load, and the fracture
load were evaluated as a function of test temperature for unirradiated
A 212-B and A 533-B steel and for A 533-B steel irradiated at three
temperatures. The temperature at which the general yield load curve
intersects the maximum or fracture load curve appears to correlate well
with the ductile-to-brittle transition temperature (DBTT) determined on
a zero-fracture-energy criterion.
Unirradiated and irradiated steels have been observed by optical
and electron microscopy including electron fractography by replication
of the fracture surfaces. No major difference in appearance of the
unirradiated and irradiated material has been detected. Thin foils of
unirradiated and irradiated steel specimens were examined by transmission
electron microscopy; the irradiated foils showed no evidence of defect
clusters produced by radiation, although the exposure was sufficient to
cause significant hardening and embrittlement.
In conjunction with the Heavy Section Steel Technology Program, we
conducted impact and tensile tests on irradiated specimens from HSST
plate 01, a 12-in.-thick plate of A 533-B steel. In comparison with
other steels of the same general type, this steel displayed an inter-
mediate degree of radiation-embrittlement sensitivity. We also performed
impact and tensile tests on unirradiated specimens of several orientations
taken from several depths in HSST plate 02. Specimens from the surface
of the plate exhibited the lowest DBTT, and specimens of longitudinal
orientation showed the greatest ductile fracture energy.
Three aspects of radiation hardening in Fe are described: tem-
perature dependence, fluence dependence, and the effect of interstitial
solutes. After a low-fluence irradiation (l X 1016 neutrons/cm2), the
yield stress of vacuum-melted Fe is increased about the same amount
XXI
at all test temperatures; but after a higher-fluence irradiation
(3 X 10¹⁹ neutrons/cm2), the yield stress increase is larger at lower
test temperatures. When the radiation hardening of several irons was
analyzed on the basis of a square-root dependence on the fluence, the
rate of hardening was found to decrease with increasing exposure. The
amount of hardening was greater in samples with higher carbon concen-
trations. The effect of nitrogen content was studied in samples con-
taining less than 1 and about 20 ppm N by weight irradiated below
—50°C, where N is immobile. Upon postirradiation annealing to 250°C,
the rate of radiation-anneal hardening was about the same for the Fe
and Fe-20N materials. However, the magnitudes of the increase in
flow stress and the drop in yield upon strain aging decreased sharply
for Fe-20N annealed at 100°C, indicating that N is removed from solid
solution by becoming trapped at defects produced by radiation.
Finally, measurements of resistivity and internal friction have
been made on irradiated V. The results are similar to those for irra-
diated Nb in indicating that interstitial impurities (0 and N) migrate
to traps produced by radiation and are thus effectively removed from
solid solution.
PART TV. TECHNIQUES OF FABRICATION AND TESTING
10. Tungsten Metallurgy
Four tungsten duplex extrusion billets have been fabricated to
study the effect of prior work and extrusion preheat temperature on
the microstrueture of extruded billets. Installation of the high-
capacity 4-50,000-lb Aetna-Standard tube reducer is near completion.
In our studies of chemical vapor deposition, modification of the
substrate geometry has enabled us to produce two 3j X 14-in. sheets of
the nominal W—5$ Re alloy for mechanical property evaluation. The
rhenium content was 3.8 to 4.1$, and the thickness was 0.033 to
0.041 in. over the central 10 in. of the deposit. Attempts to deposit
V from VF5, VCI4., and VC13 have been unsuccessful up to 950°C because
of the formation of stable intermediate phases. An induction-heated

XXI1
deposition apparatus is being fabricated to enable deposition at higher
temperatures.
The rate of recrystallization of wrought CVD tungsten is loga-
rithmic, and recrystallization is 80/0 complete after 800 hr at 1800°C
if the material is not annealed at high temperature before rolling.
Grain growth at 1800°C is inhibited by small gas bubbles in fluoride
CVD tungsten (deposited from WFß) containing 7 ppm F but is not inhibited
by the same fluorine content in material deposited from WC1 . x
11. Nondestructive Test Development
We are developing new techniques and equipment for the nondestructive
testing of materials and components. The major emphasis has been on
eddy-current, ultrasonic, penetrating radiation, and holographic methods.
In our analytical work on electromagnetic phenomena, we have con-
tinued to use closed-form solutions to integral equations applicable
to a variety of eddy-current tests. This work has included determining
induced voltage in a through-transmission test and producing graphical
data relating sensitivity to defects to their relative position of the
defects within a specimen. Probe coils were designed and built for
drift-free operation at temperatures up to 175°C.
The mirror schlieren system has been tested and shown to have
improved sensitivity and resolution over the previous lens system. The
frequency-analysis system is being used both to analyze spatial char-
acteristics in ultrasonic pulses from transducers as a function of
frequency and to evaluate the effects of testing variables on the
frequency spectrum of the pulse.
12. Joining Research on Nuclear Materials
Studies concerning the effect of minor quantities of selected
elements on the susceptibility of Inconel 600 to hot cracking have
been conducted under subcontract at Rensselaer Polytechnic Institute.
They employed a newly developed weldability test, the TIGAMA.JIG, to
investigate the effects of. S, P, Mn, Si, Ti, and Al. A full factorial
experiment was conducted. They found that S and P both were detrimental.

XX111
The deleterious effect of S was minimized with either Mn and Si; when
both were present, however, they were not as effective as was either
one alone. The propensity toward hot cracking was reduced when Ti and
Al were added. They attributed this result to the excellent deoxidizing
capabilities of these elements.
An investigation of the effect of ferrite content and distribution
on the mechanical properties of stainless steel welds has been initiated.
A variety of ferrite contents will be achieved through variations in the
chemical composition of the filler metals. Both the quantity and dis-
tribution will be studied as functions of welding parameters.
We have begun our joining efforts in support of the fabrication
of the FFTF vessel. This is a thick-walled (l-^ to 3 in.) vessel that
may be fabricated by any one of a number of welding processes. Little
is known regarding the mechanical properties of austenitic weld metal,
particularly in the creep range, above <480°C. The program is concerned
with the mechanical properties of weldments in both the unirradiated
and irradiated conditions. Our efforts will include the evaluation of
filler metals, the determination of unirradiated weldment properties,
and the preparation of specimens for irradiation studies.
A program to determine the effect of defects on the mechanical
properties of weldments is also under way. We intend to determine when
a discontinuity becomes a flaw. Initially, we are working toward pro-
ducing typical weldment discontinuities. We have been successful in
producing microfissures in Inconel 600 using an electron-beam welder
and an overlapping weld-pass technique. A scanning electron microscope
has been employed to characterize the discontinuities produced.
13. Fuel Element Fabrication Development
Miniature fuel plates have been successfully prepared for the next
series of ETR loop tests. Principal variables being studied are increased
fuel loadings, higher burnups, increased percentage of fines, and the
use of burned oxides. Both the burned oxide and the higher percentage
of fines increased the ultrasonic attenuation and caused difficulty in
the nonbond test. The void volume was considerably higher in the plate

XXIV
containing the burned oxide. The rolled density, densification during
rolling, and fabrication voids in the core appear to be independent of
initial fines.
In a study of variation in clearance between both U3O3-AI and
UAI3-AI compacts and the aluminum frames during plate rolling, no
lusters were found when clearances as large as 4$ in either length or
width had been present. The degree of core end thickening (dogboning)
decreased with the better fits. It was, however, in all cases lower
than normal. We attribute this to the thin cladding used on these
plates. The spread in fuel cores during rolling was shown to vary
directly with the core thickness.
It was shown that different rolling characteristics occur in
rolling ATR fuel plates 8 and 19. As expected, severe dogboning
was encountered with both types of plates, with 19 being much worse.
Neither plate would meet ATR specifications for cladding thickness. In
both cases, square ends without flaking were obtained. The amount of
dogboning was determined by the scanner used for fuel homogeneity mea-
surements as well as by densitometer measurements of radiographs and
by metallography; good correlations were obtained between the methods.
The use of crushing rolls appears to be a much more efficient
method for crushing UAI3, the percentage of fines produced being by
far less than with previous techniques. A fluid energy mill was also
tried for such crushing but was found to be ineffective.
The inhibiting nature of Zr on the reaction between UAI3 and Al
was confirmed by the use of diffusion couples.
Rather than the large pores and cracks found in U3O8 produced by
other techniques, that produced by a sol-gel process contains an abun-
dance of minute voids distributed uniformly throughout the structure.
Such an oxide is predominantly orthorhombic with traces of the hexagonal
form. Characteristics of the oxide were determined. Such a material
would appear to be very attractive from the viewpoint of radiation
damage.
Electron micrographs show a pore structure is still present in
the more corrosion-resistant anodic film formed on Al in oxalic acid
XXV
at 4°C. The pore size, density, and degree of interconnections were
all reduced from those in films formed at room temperatures. When oxalic
acid films formed at 16°C were exposed in a flowing loop with a high
thermal gradient across the sample, thermal data from the loop indicated
a reduction in corrosion rate. However, metallographic examination of
the specimen after test failed to reveal any remnant of the original
anodic film.
A report was issued demonstrating the feasibility of converting
PuF6 to Pu02 by chemical vapor deposition. Work is now under way to
modify the equipment for handling mixed PuF6-UF6 gases.
The economics of the process for producing UO2 in a flame reactor
have been improved by showing that it is possible to vary the stoichi-
ometry of the reacting gases to produce a by-product HF with the desired
water content. The H2 and O2 were varied from 2 to 20 times the stoichio-
metric amounts. Efforts to increase the particle size of the flame-
produced oxides have not been successful. Heat treatments have broken
up agglomerates and thereby appear to have increased the percentage of
fines.
The feasibility of preparing duplex UO2-W powders in a flame reactor
was demonstrated. Pellets pressed and sintered from these powders con-
tained defects that resulted in thermal conductivities lower than
expected.
When SiC is deposited from silicon tetrachloride-methane-hydrogen
mixtures, the primary process parameter is temperature, with other
variables of only secondary importance. In general, the higher the
deposition temperature, the more carbon-rich the deposit stoichiometry
and the rougher the deposit morphology.
The study of the use of radiography and densitometry to determine
fuel homogeneity has revealed a bias in such a procedure when a
0.078-in.-diam aperture was used to measure small areas of inhomogeneity.
In some cases, errors as large as 33% were determined.

XXVI
PART V. ENGINEERING PROPERTIES OP REACTOR MATERIALS
14. Physical and Mechanical Metallurgy of Refractory Alloys
The rate at which Hf is precipitated from solid solutions of Nb-Hf
within the miscibility gap increases with the quenching rate from the
annealing temperature due to vacancies produced by quenching. Quenched
and aged alloys in the Nb-Hf, Ta-Hf, and Ta-Zr systems exhibit a
Rockwell-C hardness range from 20 to 60. A general equation has been
derived for AG , the free energy of mixing of spinodal alloys. The
diffusivity of N in W is 4.5 X 10⁻⁸ cm2/sec at 1600°C and increases
to 8.9 x 10"8 cm2/sec at 1800°C. The BET surface area of Haynes alloy
No. 25 in vacuum increases with the stress and accounts for the increase
in the evaporation rate of the alloy with stress. The creep strength
of Haynes alloy No. 25 in vacuum decreases as the specimen thickness
decreases.
The shear strengths of a number of brazing alloys developed in
this program have been determined by the Miller-Peaslee test. Brazes
made with Ta—10$ W base metal were all stronger at room temperature
than similar brazes made with TZM. This difference did not persist at
elevated temperatures, and, in fact, the TZM brazes made with alloys
from the titanium-zirconium system were stronger. In all instances the
shear strength of the brazes were high even at temperatures within 200°C
of the melting point of the brazing alloy.
Aging Ta—10$ W brazements at elevated temperatures for 50 hr did
not degrade the strength of the joints made with the Ti-Zr system alloys.
Brazes made with alloys from the Ti-V system did not fare as well after
a similar aging treatment; however, it should be noted that, regardless
of the filler metal employed, the strengths did remain impressively high.
The thermal conductivities of W, W-Re alloys and W—1.5$ Ta were
estimated by five methods. Thermal conductivities based on one of the
methods agreed reasonably well with the experimental values. A method
is being developed to measure thermal conductivities to 1700 K from
electrically heated wires.

PART I
FUELS AND CLADDINGS

1. SOL-GEL FAST REACTOR FUELS
A. L. Lotts
The purpose of this program is to obtain the technical data needed
to assess the potential of sol-gel-derived (U,Pu)02 fuel for liquid-
metal-cooled fast breeder reactors and to provide basic technology for
the development of commercial fabrication plants. The primary require-
ment is to establish an economical fabrication procedure that is
suitable for recycling irradiated fuel and that will produce a fuel rod
that meets the criteria for reliable and safe operation in a fast breeder
reactor. To meet this requirement, Sphere-Pac, pelletized, and extruded
fuels are fabricated and characterized and irradiated in capsules in
thermal and fast reactors to determine their operating limits.
Preparation of Sol-Gel (U,Pu)02 Fuels
¥. T. HfcDuffee
We prepared mixed UO2-PUO2 (80:20) sols equivalent to 3.8 kg metal
in efforts directed toward supplying dense microspheres for fabricating
the fuels for the EBR-II and TREAT experiments. The eight 150-g lots
of Pu02 sols were prepared according to the standard flowsheet in the
alpha facility, where this material was also blended with the UO2 sols
(prepared elsewhere). The enriched UO2 sols for the EBR-II fuel were
supplied in 300-g (U) lots; and, after blending with the appropriate
volume of PuÜ2 sol, these were cross blended to ensure uniform composi-
tion. Those sols prepared from natural U for the TREAT fuel were
blended with PuÜ2 sol in single batches. The mixed UO2-PUO2 sols were
formed into microspheres: 70$ were 4-20 to 595 |j. in diameter, and the
remainder were fines < 63 p. in diameter. Furnace malfunction resulted
in a melt-down of the furnace tube and contamination of the fines
fraction with Cr and Ni.
We made three attempts to prepare the microspheres needed for the
EBR-II fuel. All resulted in products > 96$ of theoretical density, but
yields were lower than desired. In the first attempt, we obtained a
4
50$ yield of spherical product, but metallographic examination revealed
microcracks. Nevertheless, this material had high packing density. In
the two subsequent attempts, the mixed sol feeds were prepared according
to a different flowsheet to reduce or eliminate the cracking that had
occurred earlier. The new process included a digestion at 100°C to
increase the average crystallite size of the fundamental sol particles.
The feed sols prepared by either method were difficult to form into
microspheres. Although we obtained a crack-free product > 96$ of
theoretical density, the yield of spherical microspheres was only 5 to
10$.
Development of Fabrication Processes
J. D. Sease
Fast reactors operating at high specific powers will require small-
diameter fuel pins containing a fuel of 80 to 90$ of theoretical density
with a high fissile loading. To satisfy the requirements of the fast
reactor, we are investigating various fabrication processes for using
sol-gel-derived (U,Pu)02 fuels. During the quarter, our fabrication
development has been concentrated on Sphere-Pac for EBR-II irradiation
capsules and pelletization for TREAT irradiation capsules.
Sphere-Pac (W. L. Moore)
Sphere-Pac loading of EBR-II irradiation capsules has been the main
effort this quarter. A loading glove box in the Interim Alpha
Laboratory was given cold check-out, and dummy EBR-II pins were loaded.
The major difference in loading the EBR-II pins from previous Sphere-
Pac loadings is that the 32-in. length of the EBR-II fuel pins requires
vibration coupling to the top of the fuel pin to facilitate loading them
in a glove box. We installed a well in the bottom of the box so that
the top of the fuel pin could be positioned at a convenient glove-port
height during loading. A vibrator with variable-angle stand was con-
structed and installed adjacent to the well. A scale and a shape
separator were also installed in this box. To minimize gas absorption

during loading, we added a system to purge the helium atmosphere of the
box. Using thoria microspheres, we successfully practice loaded dummy
EBR-II pins in the glove box.
Pelletizing of Sol-Gel (U,Pu)02 (R. A. Bradley)
Irradiation experiments planned for the TREAT, ORR, and EBR-II
reactors require sol-gel-derived urania-plutonia pellets of various
sizes and densities. Our objective is to develop fabrication procedures
and to produce the pellets for these irradiation experiments. Urania-
plutonia pellets with 84 ± 0.8 and 91.3 ± 0.9$ of theoretical density
and oxygen-to-metal ratios of 1.980 ± 0.005 are required for transient
tests in TREAT. Our main effort this quarter has been to establish a
process that would reproducibly satisfy these requirements.
Material Preparation and Characterization. — The preparation of the
sol-gel (Uo.g, Pu0.2)02 for TREAT has been described previously.1 The
preparation and characterization of this material are shown below:
Preparation
Chemical Analysis
Pu/(Pu + U) Ratio
W03 Content
Oxygen-to-Metal Ratio
Physical Properties
Bulk Density
BET Surface Area
Tray-dried in argon-purged stainless steel tray for 36 hr at 38°C and 18 hr at 86°C.
Ground in Ar in a fluid energy mill at 50 psi.
Redried for 18 hr at 90°C.
Pressed at 10,000 psi and granulated to —20 mesh.
0.200
0.065$
2.3 ± 0.1
5.4-2 g/cm3 = 4-9.0$ of theoretical
57 m2/g
"H/. L. Moore and R. A. Bradley, Fuels and Materials Development Program Quart. Progr. Rept. June 30, 1968, 0RNL-4330, pp. 7-8.

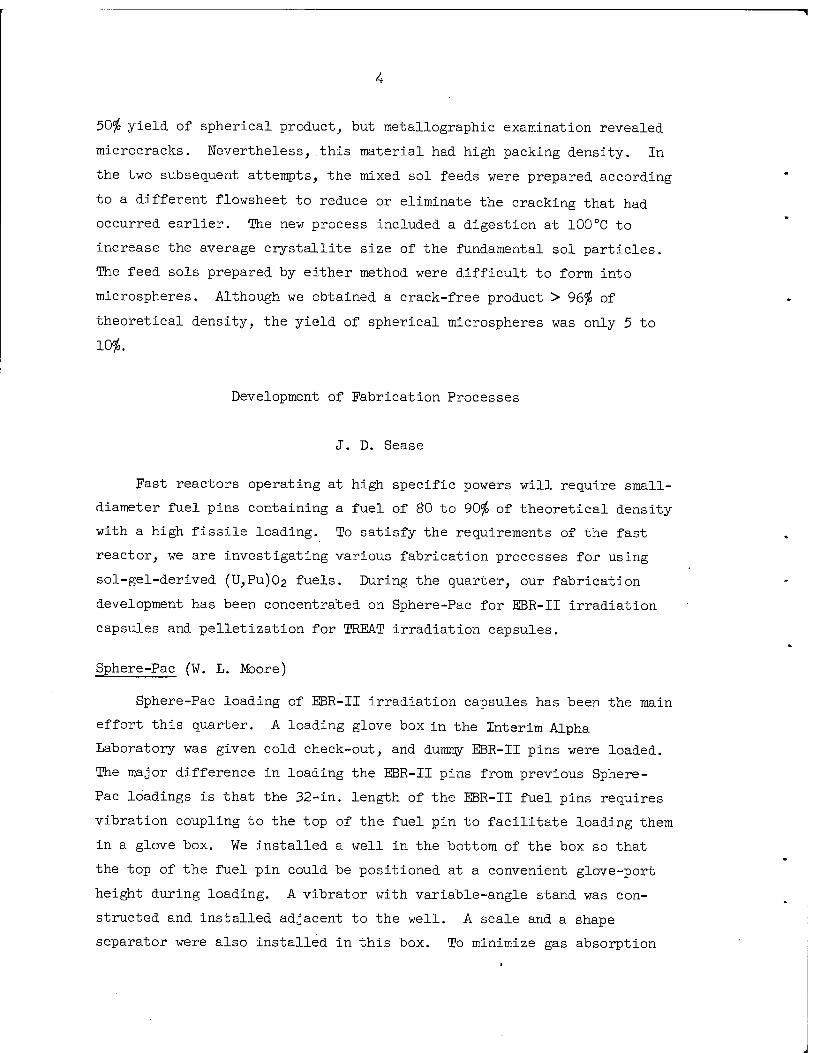
Pressing and Sintering. — Pellets were uniaxially pressed at 30,000
to 4-0,000 psi from the TREAT material and sintered at 125°C/hr to
1450°C in either CO2 or Ar-4$ H2. The forming pressures, green densities,
and sintered densities of pellets sintered in C02 and in dry Ar-4$ H2
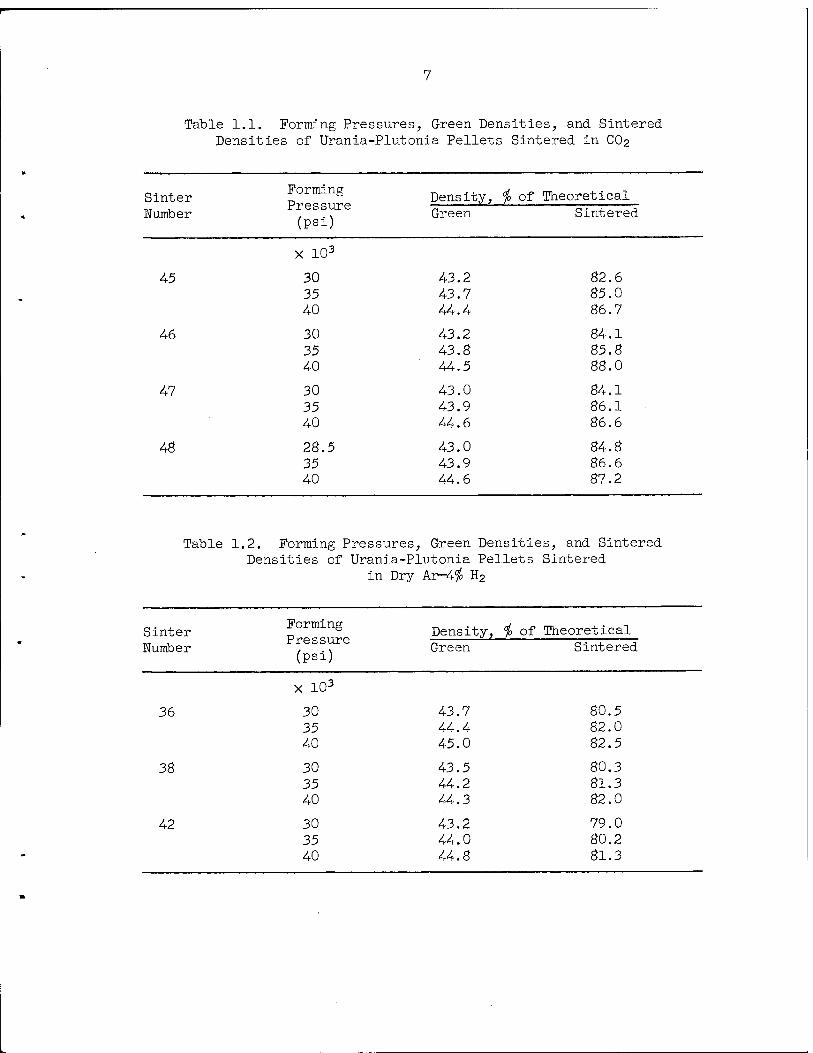
are given in Tables 1.1 and 1.2, respectively. The linear relationship
between green density and forming pressure is shown in Fig. 1.1(a) and
(b), respectively. The two curves show the average densities of pellets
sintered in C02 and in Ar-4$ H2 as a function of forming pressure. In
both cases there is a linear relationship between sintered density and
forming pressure, but the densities of pellets sintered in C02 are about
4$ higher than those sintered in dry Ar-4$ H2. The variability in the
green densities of pellets pressed at a given pressure is only about
±0.2$, but the variation in sintered density is 1.5 to 2.0$. Pellets
sintered in Ar-4$ H2 tend to develop hairline, laminar cracks during
sintering. Sintering in C02 eliminates the cracks but produces non-
uniform shrinkage that may result in density variations within the
pellets. Pellets sintered in C02 typically have 0.002-in. ovality at
the top and flare to 0.005 in. at the bottom.
Although we have produced pellets in the 84$ dense range from the
tray-dried, jet-milled TREAT powder, it is very difficult to control the
process. The very great surface area of the powder makes it difficult
to control its moisture content and oxygen-to-metal ratio. The moisture .
content affects the consolidation of the powder during pressing, and the
oxygen-to-metal ratio affects the sintering behavior. The high content
of volatiles in the tray-dried powder (about 7$ weight loss during
sintering) leads to pellet cracking.
We believe that calcining the powder before pelletizing, to reduce
the surface area to 5 to 20 m2/g and to adjust the oxygen-to-metal ratio
to about 2.1 to 2.2, would make it easier to control the sintered density
and eliminate cracking. Studies are in progress to establish calcining
conditions that will yield a stable powder for producing pellets.
7
Table 1 .1. Forming Pre ssures , Green Densities, and Sintered Densit ies of Urania -Plutonia Pellet s Sintered in CO2
Sinter Number
Forming Pressure (psi)
Density, Green
$ of Theoretical Sintered
X 103
45 30 43.2 82.6
- 35 40
43.7 44.4
85.0 86.7
46 30 35 40
43.2 43.8 44.5
84.1 85.8 88.0
47 30 35 40
43.0 43.9 44.6
84.1 86.1 86.6
48 28.5 35 40
43.0 43.9 44.6
84.8 86.6 87.2
Table 1 2. Forming Pre ssures Green Densities, and Sintered Dei isities of Urania-Plutonia Pellets Sintered
• in Dry Ar-4$ H2
Sinter Number
Forming Pressure (psi)
Density, Green
% of Theoretical Sintered
X 103
36 30 35 40
43.7 44.4 45.0
80.5 82.0 82.5
38 30 35
43.5 44.2
80.3 81.3
40 44.3 82.0
42 30 43.2 79.0 35 44.0 80.2 40 44.8 81.3
ORNL-DWG 68-12074
' u--^^*^
< \tl^***'^ ^s*0*^'
GREEN
co2— ~y^\
SINTERED
tf^0'
^—Ar- 4% H2
35 40
FORMING PRESSURE X 1CT3 (psi)
Fig. 1.1. Effect of Forming Pressure on Green and Sintered Densi- ties of (U,Pu)02 Pellets Sintered in C02 and Ar-4$ H2.
Capsule Fabrication (J. D. Sease, M. K. Preston, W. L. Moore)
As part of our fast fuels irradiation program, we have commitments
to fabricate three types of capsules: (1) EBR-II, (2) TREAT, and
(3) ORR. We plan to build the complete capsules for EBR-II and TREAT.
We shall fabricate only fueled portions of the ORR capsules.
EBR-II Capsules. - Fabrication of the five EBR-II capsules is in
progress and should be completed by the first of November. A cross
section of the EBR-II capsules is shown in Fig. 1.2. During this quarter,
we procured all hardware for the capsules, developed welding procedures,
and outlined and checked fabrication procedures.
We developed a procedure to keep the weld buildup on the outer
capsule within the maximum specified limit of 0.0018 in. on the diameter.
We improved the reliability of the tack weld of the fuel capsule to the
outer capsule by designing a special joint for this weld.
Procedures and run sheets for fabrication of the EBR-II capsules
were developed and checked with a dummy capsule.

ORNL-DWG 68H2492
-SODIUM
EBR-H MARK PI CAPSULE ASSEMBLY
SODIUM FILL TUBE
0.250in. ODx 0.016 WALL STAINLESS STEEL CLADDING TUBE
-EXTENSOMETER
-GAS PLENUM LINER
SPHERE-PACK BED (U-20% Pu)02
FUEL ROD ASSEMBLY
Fig. 1.2. Series I ORNL Oxide Fuels Tests in EBR-II.
TREAT Capsules. — We have completed detailed design of the TREAT
capsules and procured essentially all the hardware. We have begun
fabrication of selected hardware.
The major hardware items that have been completed are the pressure
vessels for three TREAT capsules. We encountered difficulties due to the
lack of a welder qualified to work with the 4-130 steel and able to make
the required joint and due to warping during final heat treating. A
welder was finally qualified for the material and weld joint of the pres-
sure vessel. The warping (about l/8 in.) was corrected mechanically, and
the final 4-55 °C drawing treatment was repeated to ensure that warping
would not reoccur during operation.
Sodium Filling System
The system for filling the heat-transfer annuli in the EBR-II and
TREAT capsules has been completed, and initial cold check-out runs have
been made. The completed sodium system without the protective shielding
is shown in Fig. 1.3. The sodium rig is shown schematically in Fig. 1.4.
The six major constituents indicated in the two figures are the
(1) pressurized gas supply, (2) vacuum source, (3) sodium trap,
10
PHOTO 93290
Fig. 1.3. Sodium Filling Apparatus Without Protective Shielding.

11
-tx>
ORNL-DWG 68H0213R
i| rHXl- Ar
"©
Fig. 1.4. Schematic of Sodium Filling Apparatus.
(•4) sodium supply tank, (5) sump, and (6) capsule furnace. All tubing
joints, with the exception of compression fittings on the gas supply-
header, are welded. The sodium filling system is shown with the pro-
tective shielding in place in Fig. 1.5.
We plan to first wet the walls of the capsule by flushing Na
through the capsule at 54-0°C and then fill the capsule at 175°C. Vacuum
will transfer Na in and out of the system.
In initial filling runs, we encountered a number of difficulties,
most of them due to inadequate heat tracing of lines. Additional heat
tracing solved most of these problems, and we are making additional
cold runs.

12
Fig. 1.5. Sodium Pill Apparatus With Protective Shielding in Place and With Relative Power Supplies and Instrumentation.
The eddy-current devices, which have been developed by the
Nondestructive Testing Group for detecting sodium level and voids,
appear to operate satisfactorily. The level probe, which is capable
of operating at 150°C, has indicated the sodium level within l/8 in. or
better. The eddy-current void detector appears to be capable of dis-
criminating a void smaller than l/32-in. in diameter by l/32-in. deep.

13
Characterization of (U,Pu)C>2 Fuels
¥. H. Pechin
The development of sol-gel fuel fabrication requires characterization
of the material to control the process and to determine which properties
are important in the irradiation behavior. The characterization requires
determination of both the chemical composition and the physical properties.
Analytical Chemistry (W. H. Pechin)
A series of chemical and physical analyses is now available for
characterization of the preirradiated mixed-oxide fuel. These are sum-
marized below:
Desired Constituent
Pt
U
Isotopic
Oxygen-to-Metal ratio
C
N
P
Cl
Metallic Impurities
Gas Release
Density
Surface Area
Method
Coulometric titration
Coulometric titration
Mass spectrography
Gravimetric oxidation — reduction
Combustion-gas chromatography
Spectrophotometry
Pyrohydrolysis — spectrophotometry
Pyrohydrolysis — spectrophotometry
Spectrographic (carrier distillation)
Vacuum heating — mass spectrography
Mercury porosimeter for microspheres, dimensions and weight for pellets.
BET analysis
The gravimetric determination of oxygen-to-metal ratio has been modified
from that described by Lyons2 in that the final reduction step is carried
2W. L. Lyons, The Measurement of Oxygen-to-Metal Ratio in Solid Solutions of Uranium and Plutonium Dioxides, GEAP-4-271 (May 31, 1963)

u
out at 850°C in Ar—4$ H2. The determination of microsphere density by-
mercury displacement has been modified to correct for incomplete filling
of the voids between spheres at low pressure. This modification involves
plotting the volume displaced at increasing pressures. The volume will
approach a constant value between the filling of intersphere voids and
the filling of the pores in the spheres. The carrier distillation on
the spectrographic analysis is required for the determination of B and
Cd.
A problem of increasing interest is the characterization of powders
from dried sols. At present, the measurement of surface area by the BET
method is the primary comparison. Particle size analysis and differ-
ential thermal analysis-thermal gravimetric analysis will be available
shortly, but the oxidation state of the metal ions in the powder is also
of interest. We have made two trials of dissolving the powder and
titrating the U(IV) in solution. Results indicate that only 50 to 60$
of the U is present as U(IV), which would make the oxygen-to-metal ratio
about 2:3. We are presently looking for a means to confirm these results.
Manufacture of Standard Samples of U02 (J. M. Leitnaker, K. E. Spear)
Since fissioning produces enough metal elements whose oxides are
less stable than the oxides of the type 316 stainless steel used for
cladding in an LMFBR, a stoichiometric oxide fuel, (U,Pu)02.oo> would
tend to oxidize the cladding. One current idea is to use a fuel with a
very low oxygen potential so that the fuel itself will act as a tailoring
agent. Since plans now call for irradiation of (U,Pu)Oi#9g±o.oi> we
must be able to distinguish between oxygen-to-metal ratios of 2.00 and
1.98 in order to fix the oxygen potential of the fuel.
There is no concensus on analytical methods for determining the
oxygen content of UO2 and mixed oxides. In fact, at least two "round
robins" are now being organized to compare results on the same samples
from laboratories in this country and elsewhere.
Young et al.3 recently expressed the variation of lattice parameter
with varying oxygen content in U02+x by the equation
3W. A. Young, L. Iynds, J. S. Mbhl, and G. G. Libowitz, An X-Ray and Density Study of Nonstoichiometry in Uranium Oxides, NAA-SR-6765 (1962).
15
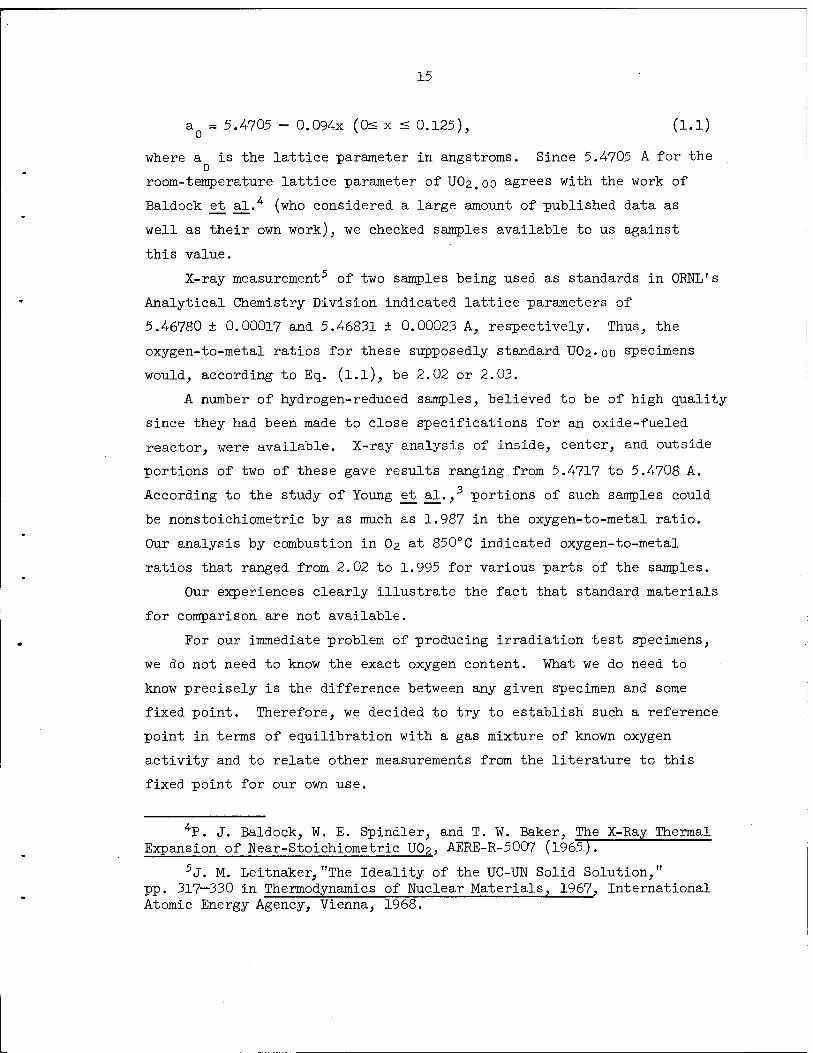
a = 5.4705 - 0.094x (0== x < 0.125), (l.l)
where a is the lattice parameter in angstroms. Since 5.4-705 A for the
room-temperature lattice parameter of UO2.00 agrees with the work of
Baidock et al.* (who considered a large amount of published data as
well as their own work), we checked samples available to us against
this value.
X-ray measurement5 of two samples being used as standards in OREL'S
Analytical Chemistry Division indicated lattice parameters of
5.4-6780 ± 0.00017 and 5.46831 ± 0.00023 A, respectively. Thus, the
oxygen-to-metal ratios for these supposedly standard UO2.00 specimens
would, according to Eq. (l.l), be 2.02 or 2.03.
A number of hydrogen-reduced samples, believed to be of high quality
since they had been made to close specifications for an oxide-fueled
reactor, were available. X-ray analysis of inside, center, and outside
portions of two of these gave results ranging from 5.4-717 to 5.4708 A.
According to the study of Young e_t al. ,3 portions of such samples could
be nonstoichiometric by as much as 1.987 in the oxygen-to-metal ratio.
Our analysis by combustion in O2 at 850°C indicated oxygen-to-metal
ratios that ranged from 2.02 to 1.995 for various parts of the samples.
Our experiences clearly illustrate the fact that standard materials
for comparison are not available.
For our immediate problem of producing irradiation test specimens,
we do not need to know the exact oxygen content. What we do need to
know precisely is the difference between any given specimen and some
fixed point. Therefore, we decided to try to establish such a reference
point in terms of equilibration with a gas mixture of known oxygen
activity and to relate other measurements from the literature to this
fixed point for our own use.
AV. J. Baldock, W. E. Spindler, and T. W. Baker, The X-Ray Thermal Expansion of Near-Stoichiometric U02, AERE-R-5007 (1965^
5<J. M. Leitnaker, "The Ideality of the UC-UN Solid Solution," pp. 317—330 in Thermodynamics of Nuclear Materials, 1967, International Atomic Energy Agency, Vienna, 1968.

16
To fix the oxygen composition for these samples, we chose to fix
the thermodynamic oxygen potential in a furnace and then equilibrate
UO2 samples in this furnace. Markin and Roberts6 have shown by measure-
ments of electromotive force that an enormous change in oxygen potential,
occurs close to the stoichiometric composition; at 850°C a 5G(02) value
of —100 kcal represents the steepest slope of the curve for SG(O2) VS
oxygen-to-uranium ratio. A C02-to-C0 ratio of 1:10, which approximates
this AG(02) value, is a very useful choice for fixing the oxygen potential
for small changes in the C02-to-C0 ratio would not be detectable in the
final product by any means now available. For example, even a change in
the ratio from 1:10 to 1:1 or to 1:20 would change the oxygen-to-uranium
ratio by only ±0.001.
Our starting material was a large (about 1 lb) batch of a laboratory
sample of urania with an oxygen-to-uranium ratio of about 2.1. Specto-
graphic analysis indicated < 100 ppm total impurities, principally Cu
(20 ppm) and Fe (40 ppm) . Samples were cold-pressed pellets 1/4- in. in
diameter and weighing about 2 g. We used a simple muffle furnace and con-
trolled the temperature to ±25°C. At the conclusion of an 18-hr run, the
boat in which the samples were placed was manually pushed to the cold zone
of the furnace where it cooled to below red heat within 2 min.
We used two techniques to examine the samples after this treatment.
In an argon-filled dry box, we took two x-ray specimens of each sample,
one from the surface of the pellet and one from near the center, so
that inhomogeneities might be detected. Second, we made duplicate
analyses for total uranium content by combustion to constant weight.
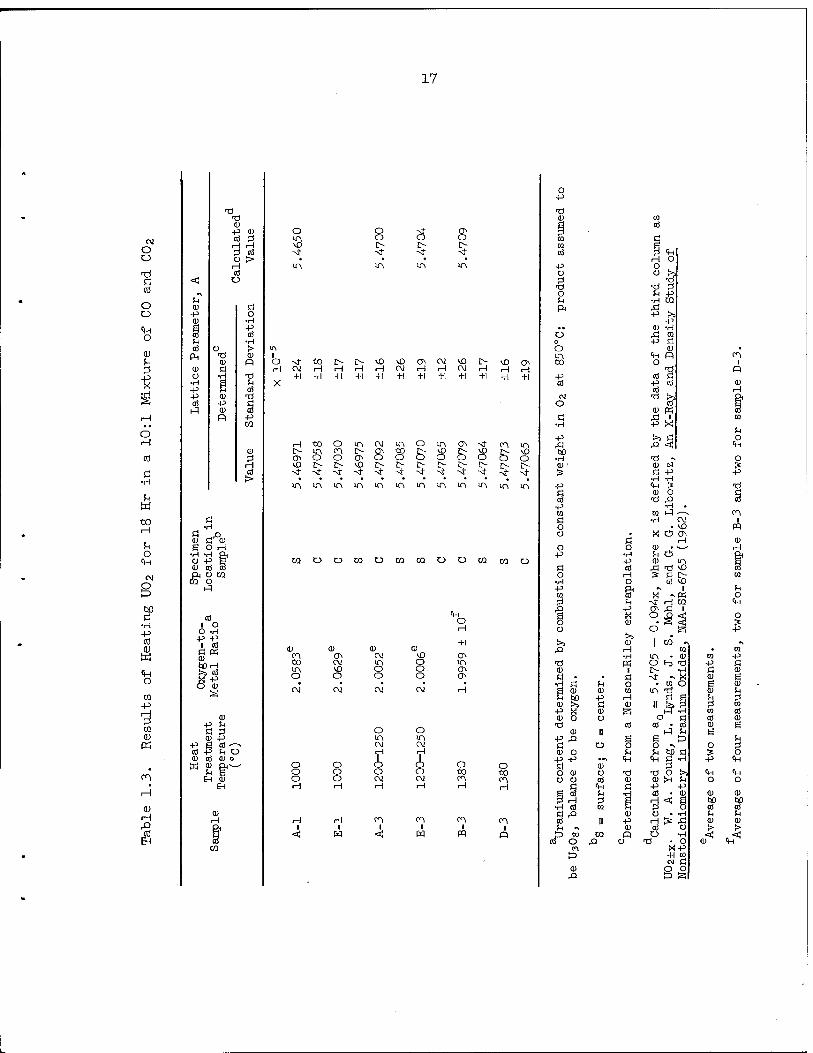
Results of the heat treatments are shown in Table 1.3. Two things
are noteworthy. The last set of samples heated (at 14-00°C) gives a
precision in lattice parameter and analysis that is excellent and perhaps
the limit of the measuring equipment. Thus, these samples almost cer-
tainly reached equilibrium throughout. The composition is about what
6T. L. Markin, L.E.J. Roberts, and A. Walter, "Thermodynamic Data for Uranium Oxides Between U02 and U308," pp. 693-711 in Thermodynamics of Nuclear Materials, International Atomic Energy Agency, Vienna, 1962.
17
CM o o -d ö CO
O o <H o <D
pi
1?
o H
S •H
fn W
to H
fn O
«in
CM
B bD Ö
•H -P CO Q) W
<H O
CQ
•P
CQ <L>
m H
0) H .Q CO
EH
-P (1)
Pn
CD O •H -P -P CO Hi
■Ö CD -P OS H pi o H Co o
Ö o
•H -P
CO •H l> CD R
■Ö JH CO
■d a cd -p CO
0)
CO >
-p g cd^ CO -P SH O
cd CD o CD "
o vO NT
o o S ON O
£> t> t> St NT st
o st «0 r- C\i H H +1 +1 +i
vO vO fT\ CM VO cv H H CM +1 +1 +1 +1
H to O ir\ CM iri 1^- IT\ CO 1^- ON tin (^ O c) r^ O O VO r- r- VO (^ f^ st st sf St sf sf
o &
in ON st *.<> i^- M) <.> C ) O !•*- i^- 1^ st sf sf
+1 +1
CO
&
H +1
st st inmminmminmiri
CQOOCQOCOCQOOWcOO
CH o H
+1 ) CD CU CU CO & CM vO ON to CM m o in IT! VO o o o o O o o 0>
o cr\ CM
O O O H
O O O H
H
O CM H
CO I
o CM H
i A O CM
CO I
H
O to CO H
CO I
pq
o «o ro H
CO
R
o •p
0)
•p Ü
o PI
O m to -p CO
N o Ö
•H
-P
M •H 0) '
cd -p w ö o o
o -p
Ö o •H +3 CO
I o
t>a ^> ■Ö CD
•d ö S CD K M <l) !>j -P K CD o -d
0)
(U o
o CU o o _ Ö g cd
■H cd
s-° to
U cu •P a cu CJ
0) Ü cd
CH
P" CO
cd° O ,Q
bO Ö
•~i !*
0)
18
is expected, being slightly on the low side. The lattice parameter
corresponds to the best recent determinations by Baidock et al.7 and by
Young et al.8 Thus, we conclude that the material prepared in this
rather simple way can be used as a standard for all oxygen analyses in
which a stoichiometry of essentially UO2.000 is wanted.
The second observation concerning the data is interesting but is
of less importance for our purpose. The samples heated at 1000°C had
an oxygen-to-uranium ratio considerably higher than 2.00, but the
lattice parameter, of the inside at least, was nearly that corresponding
to U02.000- The work of Young et al. makes clear that oxidation must
have taken place after the sample cooled. The lower lattice parameter
of the specimens from the outside of the samples indicates some oxidation
took place above 400°C, the lowest temperature at which oxidation pro-
duces an oxygen-rich single phase. Samples heated at 1000°C had a
sintered density of only 70$ of theoretical, while at 1200°C and above
the densities were about 95$> of theoretical. Clearly, reduced samples
cannot be removed from the furnace into the laboratory atmosphere for
weighing unless sufficient sintering has taken place so that reaction
with the atmosphere is negligible.
Although with our present equipment samples are below red heat in
a couple of minutes, the furnace is too hot to touch for several hours.
We are assembling an apparatus which should allow us to quench samples
more rapidly. With our new apparatus we should be able to prepare
samples with a predetermined deviation from a stoichiometric ratio.
Thermal Conductivity of Sol-Gel Fast Reactor Fuels (Peter Spindler)
Equipment for temperature control of the new radial heat flow
apparatus has arrived and is being installed. Eight new Pt—10$ Rh vs Pt
7P. J. Baldock, W. E. Spindler, and T. W. Baker, The X-Ray Thermal Expansion of Near-Stoichiometric U02, AERE-R-5007 (1965).
8W. A. Young, L. Iynds, J. S. Jfohl, and G. G. Libowitz, An X-Ray a Density Study of Nonstoichiometry in Uranium Oxides, NAA-SR-6765 (1962)

19
thermocouples were added to this system. A sample of single-crystal LiF
was installed in the old radial heat flow apparatus to obtain thermal
conductivity data to its melting point. These results will complement
the studies completed between 80 and 420 K. Using data on LiF available
in the literature, we completed a number of calculations to define
phonon and photon heat conduction effects. For example, Dugdale and
MacDonald9 show that the mean free path, Si, of phonons for an
insulator is a o
* " a7T ' (1.2)
where
a = lattice parameter, o
a = thermal expansion coefficient,
7 = Grüneisen constant,
T = temperature in K.
We calculated the thermal conductivity (A) for LiF at room temperature
to be 0.14-7 w cm"1 deg-1 from the well-known formula A = -öC £V (C = & 3 v v specific heat per unit volume, v = velocity of sound). For a , a, y,
c , and v, we used literature data. Our measured value was A n = v measured 0.139 w cm-1 deg-1. Since we had to use experimental data from different
authors, this is a very good agreement (6$). However, Dugdale and
MacDonald indicated that the assumptions for Z are valid only around
room temperature. At 85°C, for example, we find a deviation of 21$.
We believe this is due to combined uncertainties in the temperature
dependencies of experimental quantities needed to obtain i, c , and v.
For instance, values for the elastic moduli versus temperature are needed
to obtain y and c versus temperature. Numerous studies show agreement
for Cn, Ci2, and C44 at room temperature; but at lOOO K only two sets
of data exist, and these differ:
9J. S. Dugdale and D. K. MacDonald, Phys. Rev. 98, 1751 (1955),

20
Haussuhl10 Susse11
Cii (1011 dynes/cm2) 10.5
C12 (1011 dynes/cm2) 4.7
C44 (1011 dynes/cm2) 6.1
(cal g"1 K-1) 3.7 c V
4 0
1 3
4 9
6 1
The greatly different cv values indicate the dilemma for further calcu-
lation. Thus it seems necessary to find a similar semitheoretical
expression for A that is applicable for high temperatures in order to
be able to compare the A values over the whole temperature range investi-
gated. This will be one of the important steps in determining the
effects of infrared transmission and of vacancy formation with increasing
temperatures.
Deformation of UO2 (C. S. Morgan)
We have continued investigation of the deformation of polycrystalline
UO2 specimens prepared from sol-gel powder. Deformation studies involved
compression under an Ar-4$ H2 atmosphere. At 1425°C, UO2 specimens pre-
pared by isostatically pressing sol-gel powder and those prepared by
die pressing the same powder were found to have similar stress-strain
curves at a constant strain rate. The stress leveled out at about
15,500 psi until the deformation exceeded 10$.
We have extended high-temperature deformation studies to include
creep under constant stress. Deformation curves obtained under four
conditions are shown in Fig. 1.6. The activation energy of the creep
process between about 2 and 6$ deformation was 14-2 kcal/mole based on
data at a stress of 8000 psi (1525 and 1605°C) and was 120 kcal/mole
based on data obtained at a stress of 20,000 psi (1225 and 1325°C).
These values compare with an activation energy of about 100 kcal/mole
for diffusion of U in U02.
10S. Haussühl, Z. Physik. 159, 223 (1960). X1C. Susse, Compt. Rend. 2<47, 1174- (1958).

21
1000
TIME (min)
2000 3000 4000
ORNL-DWG 68-1Z0Z9
5000
100 200 300 TIME (min)
400 500
Fig. 1.6. Density).
Deformation of UO2 Sol-Gel Specimens (92% Theoretical
Further deformation tests will be made to determine long-term low-
stress creep rates to provide a background for deformation studies of
(U,Pu)C>2 specimens.
Irradiation Testing of Sol-Gel (U,Pu)02 Fuels
A. R. Olsen
The final evaluation of sol-gel-derived (U,Pu)02 fuels will be based
upon their irradiation performance. The irradiation testing program is
concentrating on comparative tests of the fabrication forms — Sphere-Pac,
pellets, and extrusions. The program includes thermal flux irradiations
of instrumented capsules to high burnup levels in relatively short times.

22
These tests will provide supplemental information essential to the
analysis of the fast flux irradiations in which the profiles of radial
fission-rate distribution and fuel temperature are more typical of
anticipated LMFBR operating conditions. The test program also includes
transient tests to investigate fuel performance under off-normal operating
conditions. An integral part of the irradiation test program is the
development of mathematical models to predict fuel behavior and com-
puter programs to perform the associated calculations.
Uninstrumented Thermal Flux Irradiation Tests (A. R. Olsen, J. Komatsu,12
R. B. Fitts)
Two capsules from a limited number of uninstrumented tests being
irradiated in the ETR are undergoing postirradiation examination, and
two are still being irradiated. The capsule design permits the simul-
taneous irradiation of four test rods, each containing a 3-in.-long fuel
column.
We are still evaluating the microstructural changes in capsule 43-112,
described previously.13 We are considering several mechanisms of void
migration and grain growth. Currently, we are concentrating on an
evaporation-condensation model, based on the work of others,14'-1'7 for
columnar grain growth in central regions of the fuel and are establishing
the calculation procedures to evaluate this model.
12 Guest Scientist from Power Reactor and Nuclear Fuel Development
Corp., Tokai, Japan. 13
A. R. Olsen, R. B. Fitts, and J. Komatsu, Fuels and Materials Development Program Quart. Frogr. Rept. June 30, 1968, 0RNL-4330 pp. 18-20.
V. B. Lawson and J. R. MacSwan, Thermal Simulation Experiments with a U02 Fuel Rod Assembly, CRFP-915 (I960).
15P. R. DeHalas and G. R. Horn, J. Nucl. Mater. 8, 207 (1963).
R. S. Barnes and R. S. Nelson, Theories of Swelling and Gas Retention in Reactor Materials, AERE-R-4952 (1965).
17F. H. Nichols, J. Nucl. Mater. 22, 216 (1967).

23
Although the evaluations are still in the early stages, one inter-
esting fact has evolved. Using the equations of Nichols18 and his
parameters for UO2 together with initial unrestructured temperature
profiles for the four fuel rods in capsule -43-112, calculated by our
PR0FIL program, we calculated rates of void migration for various radial
positions in the fuel. We then compared these curves with the observed
structures. We saw no columnar grain growth in rods 1 and 4, but there
was significant columnar grain growth in rods 2 and 3. From these
preliminary calculations and the constants used, we judge that columnar
grain growth stopped when the void migration rate fell below about
5 X 10"6 cm/sec. Although these preliminary calculations are encour-
aging, the model requires modifications to accommodate changes in the
rate of void migration as a function of prior restructuring and the
consequent changes in temperature distribution.
Postirradiation examination of capsule 43-103, which contained
three sol-gel UO2 Sphere-Pac rods and one UO2 pellet rod, has begun.
We have gamma scanned the capsule and taken dimensional measurements
from all fuel rods. All four rods were intact, and there is no indi-
cation of significant changes in the diameter of the cladding. The
fission-gas sampling and the sectioning for burnup analysis and metal-
lographic examination are complete.
The gamma scan for this capsule is reproduced in Fig. 1.7. The
appearance of the scans for the three Sphere-Pac rods in positions 1,
3, and 4 is normal, showing the typical flux peaking near the center
of the capsule. The scan of the rod fueled with UO2 pellets, however,
is not normal. The activity is excessively high at the bottom of the
fuel column, and the high activity extends into both the top and bottom
TI1O2 insulator regions.
The explanation for this unusual gamma scan is uncertain. As shown
in Table 1.4, however, we have calculated the time-averaged linear heat
ratings from the burnup analyses. Both the burnup levels and the heat
ratings exceed those proposed and calculated for this capsule. It appears,
from flux measurements made in adjacent locations while this capsule
was being irradiated, that the peak, unperturbed flux in the ETR position
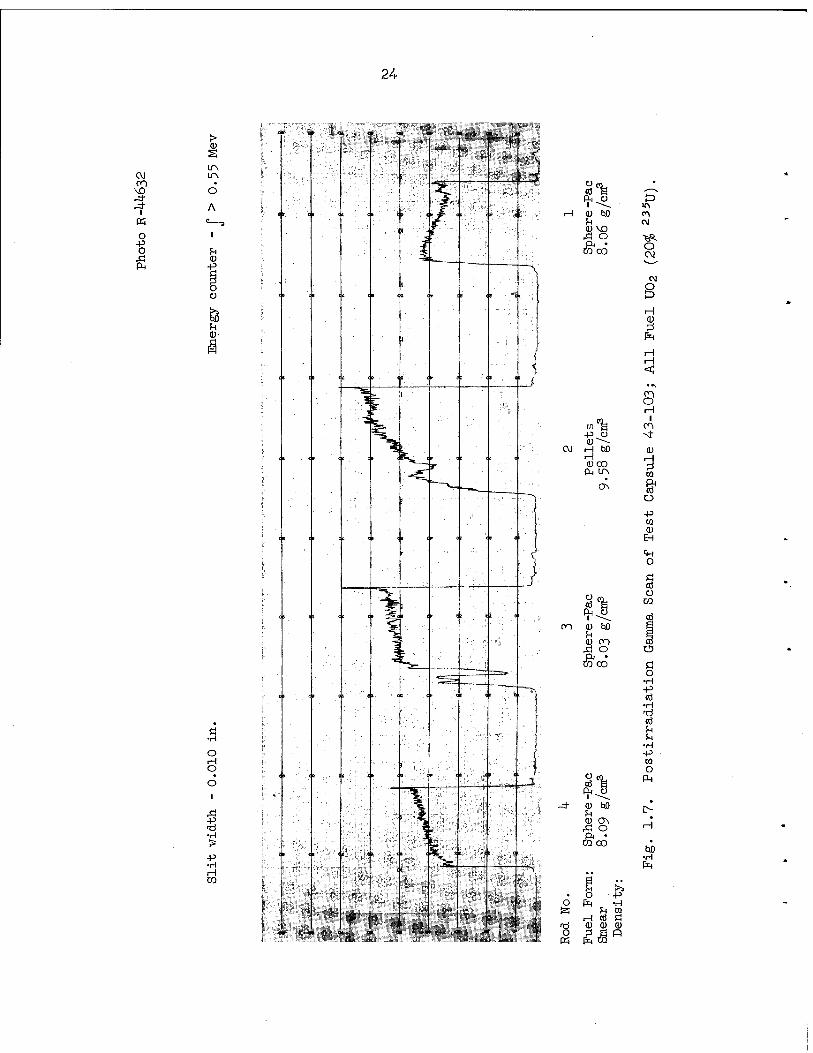
24
en \o j-
■
O P O
> S
d A
CD -P
O ü
Ö ■H
O H O d
I •H !S
-P •H H
5% ^^O.
H CD bO en h c\! (DVD Ä O >R ft • o CQ 00 CM
8 H CD
F-4
H H <
8 H
tn°fe C^l PJJ Ni- <U^-~.
<AI H bO di H H euro 3
CO P-l UA
ON & o -p CQ dl
EH
=H O
Ö cd
8«fc Ü
CQ
P^^ CO en 0) bO
U CD en i Ä o O P< •
CQ 00 Ö O
•H +3 CO •H
cd U u
•H P W o
S«*i PH
(^ o j- 0 bO L>
<U CT\ H Ä O P. •
CQ CO
>»
bO •H PR
• O •P o PH •H
fs; u rn i-H CO S
rrl 0) <D (1) Ü £<S P
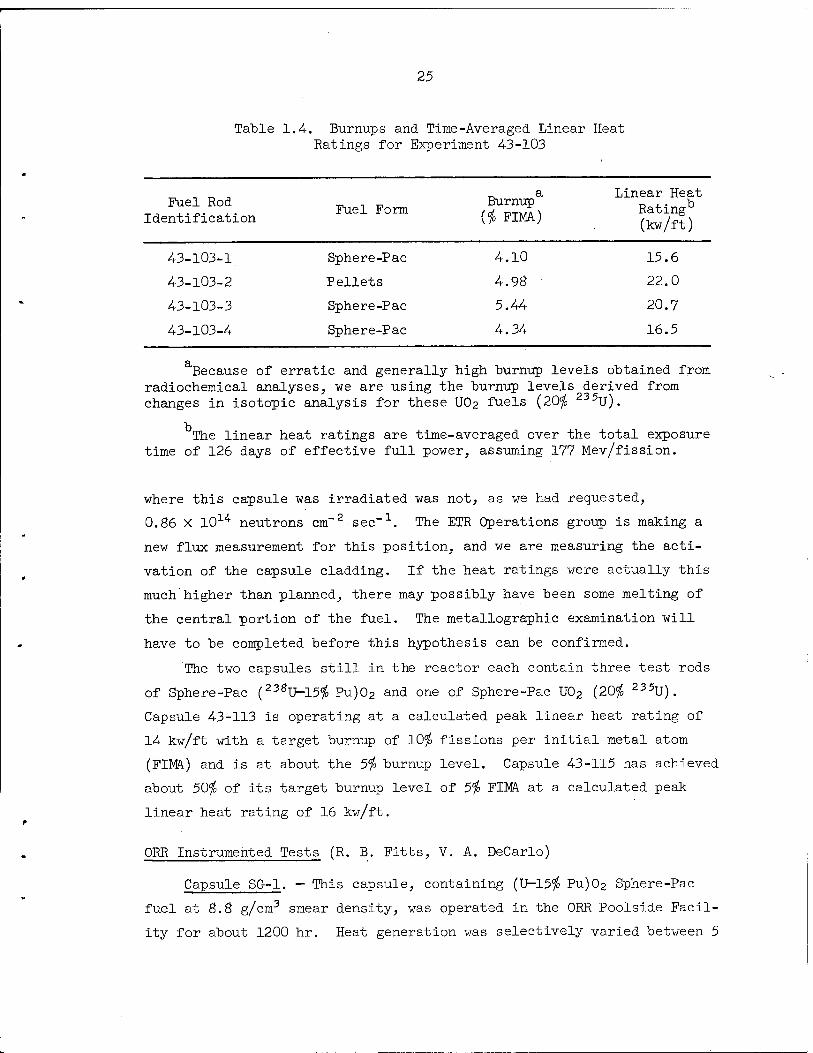
25
Table 1.4. Burnups and Time-Averaged Linear Heat Ratings for Experiment 4-3-103
Fuel Rod Identification
a Fuel Form
Burnup ($ FIMA)
Linear Heat Rating13
(kw/ft)
43-103-1
43-103-2
43-103-3
43-103-4
Sphere-Pac
Pellets
Sphere-Pac
Sphere-Pac
4.10
4.98
5.44
4.34
15.6
22.0
20.7
16.5
aT Because of erratic and generally high burnup levels obtained from radiochemical analyses, we are using the burnup levels derived from changes in isotopic analysis for these UO2 fuels (20$ 235U).
The linear heat ratings are time-averaged over the total exposure time of 126 days of effective full power, assuming 177 Mev/fission.
where this capsule was irradiated was not, as we had requested,
0.86 X lO1* neutrons cm-2 sec"1. The ETR Operations group is making a
new flux measurement for this position, and we are measuring the acti-
vation of the capsule cladding. If the heat ratings were actually this
much'higher than planned, there may possibly have been some melting of
the central portion of the fuel. The metallographic examination will
have to be completed before this hypothesis can be confirmed.
The two capsules still in the reactor each contain three test rods
of Sphere-Pac (238U-15$ Pu)02 and one of Sphere-Pac U02 (20$ 235U).
Capsule 43-113 is operating at a calculated peak linear heat rating of
14 kw/ft with a target burnup of 10$ fissions per initial metal atom
(FIMA.) and is at about the 5$ burnup level. Capsule 43-115 has achieved
about 50$ of its target burnup level of 5$ FIMA at a calculated peak
linear heat rating of 16 kw/ft.
ORR Instrumented Tests (R. B. Fitts, V. A. DeCarlo)
Capsule SG-1. — This capsule, containing (U—15$ Pu)C>2 Sphere-Pac
fuel at 8.8 g/cm3 smear density, was operated in the ORR Poolside Facil-
ity for about 1200 hr. Heat generation was selectively varied between 5
26
and 15 kw/ft. Operating temperatures compared favorably with design
predictions.
Erratic behavior of the central thermocouple was described in the
last quarterly report. lß We believe this was caused by the reaction
that we have observed metallographically between the Mo of the thermo-
couple well and some components of the fuel rod. A typical section
from the wall of the molybdenum well before irradiation is shown in
Fig. 1.8. The white material in the center of Fig. 1.9 is the Mo after
irradiation. The structure in this cross section is typical of this
fuel when it was operated at 15 kw/ft in other tests, except that a
large amount of white deposit, probably Mo, is distributed throughout
the fuel structure, as shown in Figs. 1.10 and 1.11. We hypothesize
that the redistribution of Mo occurred by the formation of Mo03 when
the temperature and temperature gradient were raised enough to initiate
significant oxygen migration in this fuel. This might be expected to
occur in the temperature range where fuel restructuring by the evaporation-
condensation mechanism becomes significant (about 1700°C). Reduction of
the M0O3 occurred as it moved to the cooler regions of the fuel. A
similar mechanism has been proposed for molybdenum redistribution
observed in a recent study of oxygen migration involving (U,Pu)C-2-x in
a molybdenum capsule.19 Since the initial oxygen-to-metal ratio in the
fuel would have a significant effect upon this reaction, and possibly a
similar reaction with the W—26$ Re to be used in the next capsule, we
have requested a reanalysis of the oxygen-to-metal ratio using archive
fuel samples.
Analysis of data from this capsule at selected times during operation
has yielded "smeared thermal conductivity" values, defined as
18R. B. Fitts and V. A. DeCarlo, Fuels and Materials Development Program Quart. Progr. Rept. June 30, 1968, ORNL 4330, pp. 20-23.
19Sodium-Cooled Reactors. Fast Ceramic Reactor Development Program. 26th Quart. Progr. Rept., February-April 1968, GEAP-5631 (June 1968) p. 62.

27
Fig. 1.8. Tube Wall of Molybdenum Thermocouple Well Before Irradiation.
R-t5236
Fig. 1.9. Cross Section of (U-l5fo Pu)02 Fuel Rod from Capsule SG-1.

28
Fig. 1.10. Fuel and Molybdenum at Edge of Central Thermocouple Well in Capsule SG-1.
| R-115239
■''■Y: ',",.'»' ■
TR.*.' •
J ' ■''
4" ■ ■
% * 1",' • ,' • ^ ,'t y :
, » °H > V ■ »
' ■ %r ', •
' . ^ \ *
... f ^ t •*$ j*: * " !' ^>J^ *? < X
■' • ^äJ*'/^'''
*
» •
'"V J *>
*3'. I,1 :
■<^ - ■'■
Fig. 1.11. Fuel and Molybdenum near Midradius in Capsule SG-1.

29
X-V^V2' (1.3) £ s
where
A = thermal conductivity,
TL = fuel central temperature, and L
T = temperature at inside surface of cladding.
These values range from 0.019 w cm-1 °C-1 between 375 and 825°C and to
0.015 w cm-1 °C-1 between 4-60 and 1300°C. These values increased with
time of operation at center-line temperatures above 1200°C as would be
expected if the density increased due to sintering at elevated tempera-
tures. After operation at temperatures above 1600°C for 180 hr, the
apparent thermal conductivity at temperatures below 1600°C increased 4-0$.
The high-temperature operation included the period of erratic thermo-
couple operation. This effect may be explained by fuel sintering, but
any explanation must also include the effects of the observed molybdenum
permeation of the fuel structure.
Capsule SG-2. — Difficulty in procuring the W—26$ Re thermocouple
wells for this capsule has caused a delay. We are now hoping to insert
the capsule into the reactor January 10, 1969.
Transient Testing of Sol-Gel-Derived (U,Pu)02 Fuels (C. M. Cox)
The purpose of the transient testing program is to investigate the
behavior of sol-gel-derived (U,Pu)02 fuels under conditions simulating
accidental power excursions. The initial transient experiments will be
conducted at the TREAT this winter. The TREAT program outlined for this
fiscal year includes four transient experiments with fuel that is not
preirradiated and six capsules that will be inserted into the ETR for
irradiation before transient tests. The fuel for all of these experi-
ments will be nominally (Uo.g,Puo.2)01.gg.
We continued our analysis of neutron filters and Na and NaK
coolants for TREAT capsules by calculating transient heat transfer for
a 155 Mwsec transient with a 200 msec initial reactor period. The shape

30
of the transient was assumed to coincide with that of TREAT transient20
554. The power density of an average specimen was taken as
9.3 x 10"5 w/cm3 per watt of TREAT power from our earlier calculations
for an unfiltered capsule, and the power profile for a cadmium-filtered
capsule was normalized to the same power density. We had previously
chosen Cd as being more effective than B or Eu.
We calculated temperatures for transient heat transfer with the
TOSS program,21 using physical properties appropriate for fuel of 81$
smear density. The results are partially summarized in Table 1.5.
For this particular case, the substitution of NaK for Na has a negli-
gible effect on the fuel temperatures but causes the peak temperatures
in the cladding to increase some 100°C. This would be undesirable in
our study of failure thresholds and mechanisms, so we intend to use Na
in all of our TREAT capsules. The flatter power profile associated with
°J. E. Hanson, J. H. Field, and S. A. Rabin, Experimental Studies of Transient Effects in Fast Reactor Fuels, Series II - Mixed Oxide (Pu02-U02) Irradiations, GEAP-4805 (June 1965). pp. -3-4.
21D. Bagwell, TOSS, An IBM-7090 Code for Computing Transient or Steady-State Temperature Distributions, K-1494 (December 1961).
Table 1.5. Some Results from Calculations of Transient Heat Transfer for TREAT Capsule TR-1, Subjected to Transient 554
Peak Temperatures, °C Case
Fuel Fuel Inner Cladding Center Average Cladding Average
Wo filter-NaK 2850 2380 845 805
No filter-Na 2850 2385 725 695
0.005-in. Cd filter3, Na 3015 2450 725 685
Normalized to an average-specimen power density of 9.3 X 10"5 w cm-3 w"1 (equivalent to the no-filter cases)
31
a 5-mil-thick cadmium filter is predicted to have negligible effects on
the cladding temperature. Although in the radial temperature profiles
fuel temperatures are somewhat higher and less peaking is predicted, we
do not judge the improvements to be sufficient to warrant the use of
neutron filters with the initial capsules. They may be required in
later experiments with highly enriched fuel that has been preirradiated
in the EBR-II reactor.
The capsule and fuel pins have been designed for the first four
capsules, and the drawings are being reviewed. We have begun preparing
the hazards analysis for these experiments.
We have constructed an induction furnace to be used for experiments
on thermal shock with sol-gel UO2 microspheres. These experiments will
initially investigate the mechanical stability of UO2 microspheres sub-
jected to severe temperature transients.
Fast Flux Irradiation Tests (A. R. Olsen, C. M. Cox)
The Series I encapsulated tests of Sphere-Pac sol-gel (U,Pu)02 fuels
are scheduled to be inserted into the EBR-II at the start of cycle 32.
The designs for fuel pin and capsule were shown in Fig. 1.2. All material
for cladding and capsule components is on hand and has been inspected.
Two of the fuel rods will have type 304 stainless steel cladding, and the
remaining three will have type 316 stainless steel tubing, which we
obtained from PNL. The 316 stainless steel tubing was the cleanest we
have inspected. Only one ultrasonically detectable flaw in excess of
our 0.00l-in.-deep 0.030-in.-long reference notch was detected in the
35 ft we received.
We plan to include the five Sphere-Pac fuel rods in a reconstituted
19-rod subassembly for insertion into an EBR-II row 4 position. The
hazards analysis for these tests is essentially complete, including
revisions based on the new rates of heat generation for the row 4 posi-
tions with the EBR-II operating at 50 Mw.
The initial hazards analysis is based on the design parameters with
an anticipated average burnup level of 5<$> FIMA in the position of highest
heat rating in a row 4 subassembly. However, we have begun to make
32
preliminary physics calculations for a more detailed operational pre-
diction. Using the GAM-II code,22 we have prepared 18-group spectrum-
averaged sets of EBR-II cross sections in format suitable for the ANISN
neutron transport code.23 A preliminary S4 ANISN calculation of the
EBR-II core, using Px scattering, predicted heat generation rates within
10$ of the reported EBR-II rates. All of these calculations will be
refined and compared with the empirical rates of fission-heat generation
reported for the EBR-II. A set of 1-group spectrum-averaged cross
sections was also prepared and used with the RIBD Program to calculate
the content of fission products and rates of heat generation after
irradiation for the hazards analysis.
Irradiation Test Calculations (C. M. Cox, F. J. Roman)
We have completed a draft of a report describing the PR0FIL code
for computing steady-state radial temperature distributions in (U,Pu)C>2
fuel pins. This program includes an empirical model of fuel densifi-
cation. We have begun work on an expanded version that accounts for
thermal expansion and swelling due to fission products.
G. D. Joanou and J. S. Dudek, GAM-II, A B3 Code for the Calculation of Fast-Neutron Spectra and Associated Multigroup Constants. GA-4265 (September 1963). ~~
W. W. Engle, Jr., A User's Manual for ANISN. K-1963 (March 1967).
33
2. NITRIDE FUELS DEVELOPMENT
W. 0. Harms J. L. Scott
The goals of this program are to investigate the properties and
behavior of mixed uranium-plutonium nitrides and carbonitrides as LMFBR
fuels and, through extension of irradiation conditions, to establish the
ultimate limitations of UN as a space-nuclear fuel.
Our goal is to develop LMFBR fuel elements that can operate at
linear heat ratings up to three times the limit now set for mixed oxides.
It is almost certain that the economic benefits of these higher heat
ratings -will be profound.
The major problems associated with the use of mixed nitrides or
carbonitrides as LMFBR fuels are (l) economical synthesis and fabrica-
tion, (2) compatibility with candidate cladding alloys, including the
effects of fuel burnup, (3) model studies on carbide and nitride pins
for LMFBR, and (4-) irradiation behavior.
In dealing with these problems, we place high priority on devel-
oping a quantitative description of the thermodynamic properties and
pertinent reaction kinetics in the materials systems of interest. This
information is applied to the development of fabrication schemes and to
the solution of compatibility problems. Promising combinations of fuel
and cladding are irradiated under simulated service conditions.
Our work in synthesis, fabrication, and characterization of nitride
fuels involves uranium nitride and carbonitride work for space-nuclear
and fundamental studies and preparative work for mixed uranium-plutonium
nitride and carbonitrides. For clarity, these two areas are described
separately, though our experience with one guides our strategy on the
other. Work on UN for space applications is described in classified
monthly reports.

34-
Synthesis, Fabrication, and Characterization of Nitride Fuels
Synthesis and Fabrication of UN (R. A. Potter)
We continued with the synthesis and fabrication of UN for distribu-
tion to groups concerned with irradiation test behavior and measurements
of physical properties of these materials. Several problems were
encountered.
Since our synthesis scheme is based on a batch process, we are
confronted with slight variations from one powder batch to the next.
These variations can be traced to a temperature gradient in the synthesis
furnace that influences the final nitrogen content and particle-size
distribution of the powder. Consequently, variations in the size of
the charge and the physical configuration and location of the starting
material (uranium metal) result in variations in the powder batches.
Usually we can compensate for these differences during fabrication and
sintering by adjusting pressing pressures, powder lubricant additions,
and sintering schedules. The morphology of our UN powders is such that
pressing faults, such as laminations, are inherent in samples formed by
uniaxial cold pressing unless a powder lubricant such as camphor is
employed during pressing and then made to sublimate by heating.
Recently, however, we have produced batches of powders with extremely
fine particle sizes. It is quite difficult to eject the lubricant from
the samples cold pressed from these powders. Heating sufficient to
drive out the tightly held lubricant can destroy the specimen if applied
too rapidly. This happened during initial heat treating of a UN disk
3/4 in. in diameter X l/4 in. in height containing i/o camphor. A
photomacrograph of this specimen is shown in Fig. 2.1.
During our subsequent efforts to utilize the powder for a set of
solid cylindrical test specimens, we tried cold pressing without the
aid of a lubricant. Although the specimens were successfully formed
and sintered to about 95/ of theoretical density and appeared sound,
during a grinding operation for dimensional sizing the ends flaked off
because of built-in pressing faults. Ultimately, we were able to prepare
the test specimens by reducing the lubricant from 1 to 1/2/ and by

35
-88831*
Fig. 2.1. Photomacrograph of UN Specimen Destroyed During Expulsion of Vfo Camphor Lubricant. Specimen subsequently sintered at 2300°C in 1 atm N2.
carefully controlling the initial heat treatment. Such problems empha-
size the need for careful powder characterization, -which will require an
expansion of our facility.
In view of the foregoing and because of the increasing interest
in nitride fuels, we have installed a second synthesis rig in which we
can prepare powders for characterization. The new apparatus is equipped
for atmospheres of N2, H2, Ar, and vacuum. The charge capacity will be
about 1 kg.
Characterization of UN (V. J. Tennery)
Effort has been directed toward characterizing the UN powder
produced by the hydride-dehydride-nitride process by determining the
phases present in concentrations of about 3% or greater and the shape
and size of the nitride powder particles. The procedure being devel-
oped for phase identification involves x-ray diffractometry and consists
of preparing a dispersion of the nitride powder in a solution of
10% parlodian and 90% amyl acetate under an inert atmosphere in a glove
36
box and then spreading the dispersion onto a glass slide suitable for
use in the x-ray diffractometer. Experiments conducted to date indicate
that the nitride powder is adequately protected from oxidation to
permit handling the nitride-parlodian film in air and that the nitride
powders contain about 20 to 30 wt <f> of the higher nitrides UN 1.5+x'
where x varies from 0 to about 0.5 depending upon certain processing
conditions. The major phase is UN. The concentrations of the higher
nitride phases and their relation to the final nitride reduction temper-
ature used in producing the powder are being determined. The asymmetry
of the (220) x-ray line group, and possibly others of the higher nitride,
is being examined as a possible simple indicator of the general distri-
bution of the higher nitrides in the nitride powder. These measurements
are relatively simple and require little time when diffractometer
methods are used.
A technique has been developed for suspending the nitride powder
particles in a parlodian film that protects the particles from oxidation
well enough that the film can be placed on grids and examined in an
electron microscope. The particles as produced are agglomerated. Note
in the typical particles shown in Fig. 2.2 that many of the ultimate
particles are smaller than 1 pm in diameter. We do not know if the
apparent roughness of the surface is an artifact due to agglomeration.
We are developing a dispersion technique to disrupt the agglomerates so
that the shapes and sizes of the ultimate particles of the nitride
powders can be determined routinely. The correlation of the results
with the processing parameters used in producing the nitride powders
and the pressing and sintering characteristics of these powders should
permit a rational approach to the manufacture and production of the
advanced fuel, UN.
The gas-analysis system developed for the Interim Plutonium
Facility was attached to our conventional UN glove boxes to determine
contamination levels in this facility. Results showed, by volume,
100 ppm 02 and 50 ppm moisture. Since these levels are considerably
higher than those we have achieved in the plutonium laboratory, an
inert-gas purifier has been ordered and will be installed on the glove
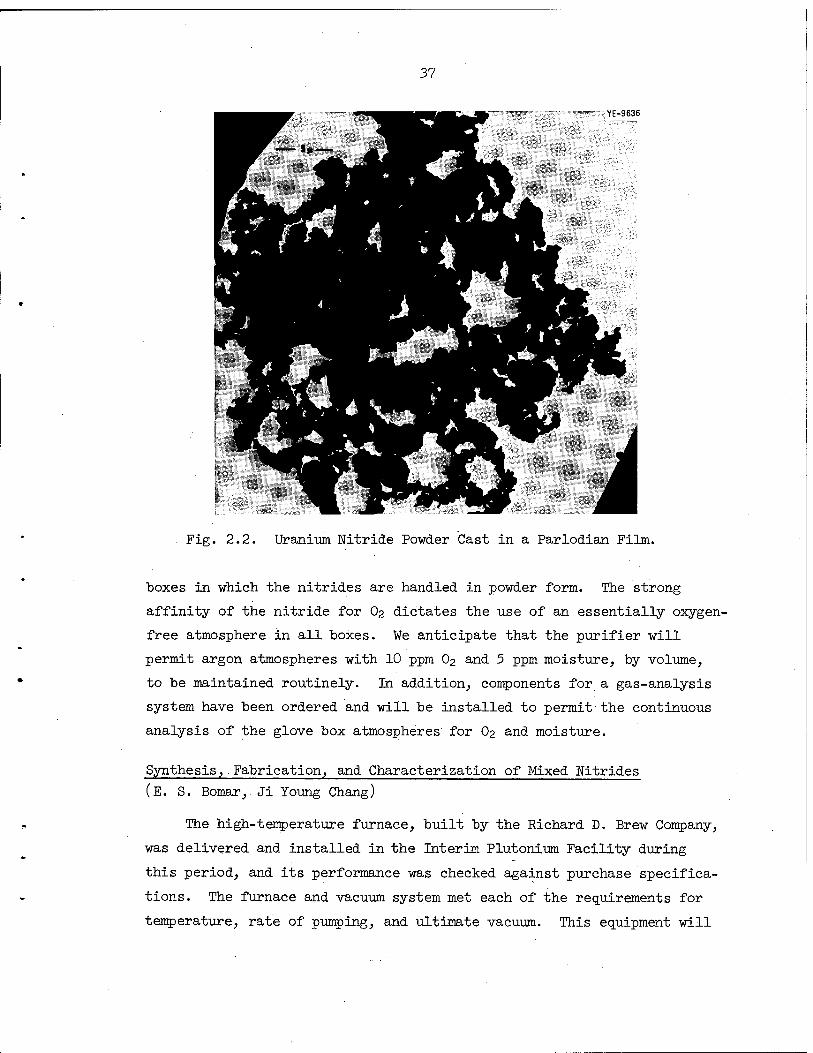
37
YE-9636
Fig. 2.2. Uranium Nitride Powder Cast in a Parlodian Film.
boxes in which the nitrides are handled in powder form. The strong
affinity of the nitride for O2 dictates the use of an essentially oxygen-
free atmosphere in all boxes. We anticipate that the purifier will
permit argon atmospheres with 10 ppm O2 and 5 ppm moisture, by volume,
to be maintained routinely. In addition, components for a gas-analysis
system have been ordered and will be installed to permit the continuous
analysis of the glove box atmospheres for O2 and moisture.
Synthesis, Fabrication, and Characterization of Mixed Nitrides
(E. S. Bomar, Ji Young Chang)
The high-temperature furnace, built by the Richard D. Brew Company,
was delivered and installed in the Interim Plutonium Facility during
this period, and its performance was checked against purchase specifica-
tions. The furnace and vacuum system met each of the requirements for
temperature, rate of pumping, and ultimate vacuum. This equipment will
38
let us experiment at temperatures to 3000°C in vacuum or to 2200°C in
Ar and to 2400°C in N2, each at 1 atm of pressure. The glove box to
enclose the furnace for work with Pu is being built, but the furnace
will be used in the interim for work with UN.
Work on the hot press in the Interim Plutonium Facility has
progressed to the point of cold check-out. The first sample of UN was
compacted in the hot press to a density of 99$ of theoretical at 1400°C
and 3 tsi for 1 hr. The press was also used to prepare high-density
specimens of beryllium boride.
Several problems have been encountered in the facility for
synthesizing mixed nitrides. Alterations in the seal where the vacuum
lines from the tube furnace penetrate their glove box reduced the
leakage of air into the box. We still find, however, an undesirably
high impurity content, especially moisture, in the argon atmosphere of
the box. While locating the source of the impurities, we have started
the nitride synthesis. A mixture of Ar-4 vol <jo H2 was used in the
first hydriding experiment, but the rate of conversion of uranium metal
to uranium hydride was too slow to be practical. Obviously, use of H2
diluted with Ar is of interest for glove-box work since it eliminates
any possibility of fire. We next passed undiluted H2 into the tube
furnace, which was vented to the box atmosphere, and adjusted the flow
of Ar through the box to dilute the H2 to at least 4 vol % We con-
verted the resulting hydride to metallic uranium powder by heating
under vacuum at 400°C and then converted that to the nitride by slowly
introducing N2 at a pressure of 2 to 4 in. Hg. We raised the tempera-
ture in steps to 800°C and the nitrogen pressure to 1 atm. The
resulting nitride was reduced to a nominal composition of UN by heating
to 1300°C under vacuum.
Engineering drawings of the glove box for the equipment for
measuring vapor pressure were completed, bids were requested for its
construction, and a contract was let.
The hot-stage microscope was used to observe the behavior of three 238Pu02 microspheres in individual heat treatments at 1200°C in an argon
atmosphere. The particles were photographed at intervals as the

39
temperature was raised. The photographic film showed no dimensional
change for the particles.
A piping system was designed for continuous sampling of the atmo-
sphere from six locations. Any one of these samples can in turn be
monitored quantitatively for O2 and moisture and qualitatively for
other impurities such as N2• The console that contains the instruments
for these analyses was described previously.1 Experience to date shows
that the oxygen content in the box atmospheres can be reduced to less
than 10 ppm and moisture to less than 20 ppm at argon flow rates that
change the atmosphere in the box five times per hour. Our argon supply
contains, on the average, 5 ppm 02 and 10 ppm moisture by volume.
Studies on Synthesis, Fabrication, and Thermodynamic Properties of Carbonitride Fuels
Manufacture of UC, UN, and U(C,N) from U02 (T. B. Lindemer, J. M. Leitnaker)
The kinetics of the conversion of sol-gel UO2 to uranium carbides,
nitrides, and carbonitrides is being studied to determine the rate-
controlling mechanisms of the conversion processes. This information is
fundamental to the design of the fuel cycle that will be used to manu-
facture the desired reactor fuels of this type.
Kinetics of the UC2-N2 Reaction. - We are studying the UC2-N2
reaction. (The UC2 represents nominal uranium dicarbide; it is always
substoichiometric with respect to c). The time-dependent conversion of
500-\Jia UC2 microspheres to U(C,N) was fitted to a model based on rate
control at the UC"2-U(C,N) interface.2 This fit is demonstrated in
Fig. 2.3; the metallographic determination of r (the diameter of the
unreacted UC2 core) and rQ (the original diameter of the microsphere)
J.D.L. Harrison, Fuels and Materials Development Program Quart. Progr. Rept. June 30, 1968, QRNL-4330, pp. 40-^-1.
2T. B. Lindemer, Fuels and Materials Development Program Quart. Progr. Rept. June 30, 1968, OKNL-4330, pp. 32-39.
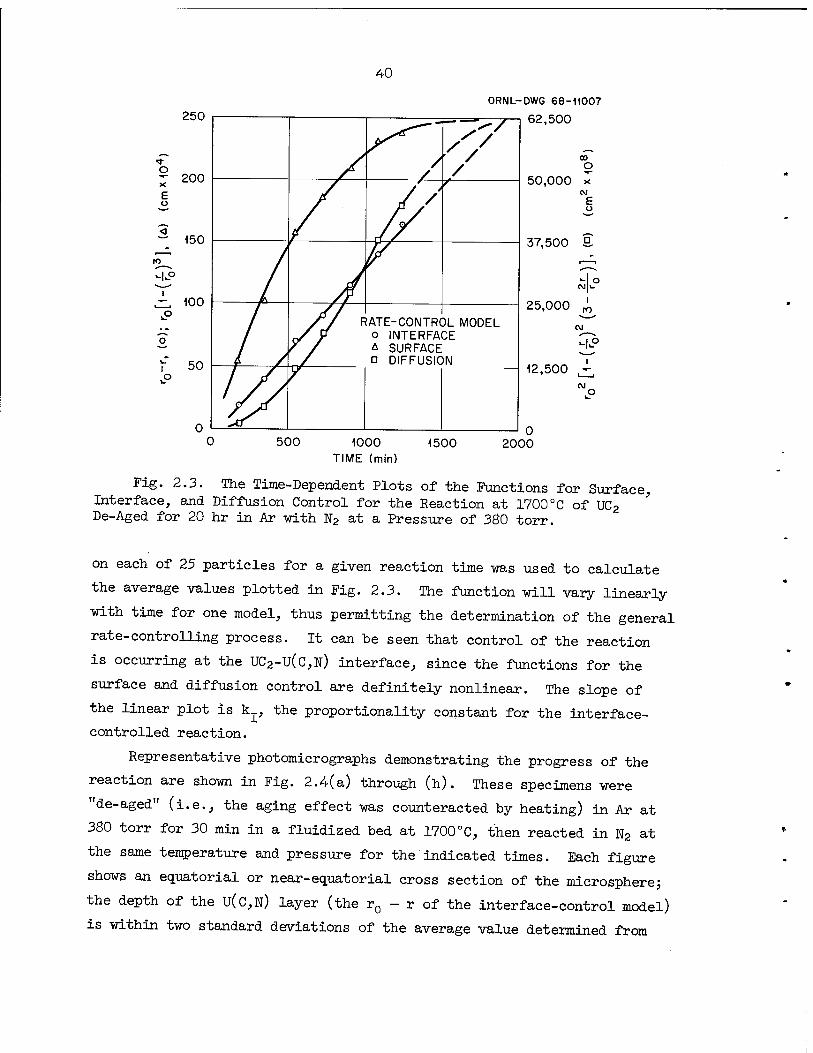
40
250 ORNL-DWG 68-11007
- ■ ^ y | 62,500
500 1000 TIME (min)
1500 2000
Fig. 2.3. The Time-Dependent Plots of the Functions for Surface, Interface, and Diffusion Control for the Reaction at 1700°C of UC2 De-Aged for 20 hr in Ar with N2 at a Pressure of 380 torr.
on each of 25 particles for a given reaction time was used to calculate
the average values plotted in Fig. 2.3. The function will vary linearly
with time for one model, thus permitting the determination of the general
rate-controlling process. It can be seen that control of the reaction
is occurring at the UC2-U(c,N) interface, since the functions for the
surface and diffusion control are definitely nonlinear. The slope of
the linear plot is k;[, the proportionality constant for the interface-
controlled reaction.
Representative photomicrographs demonstrating the progress of the
reaction are shown in Fig. 2.4(a) through (h). These specimens were
"de-aged" (i.e., the aging effect was counteracted by heating) in Ar at
380 torr for 30 min in a fluidized bed at 1700°C, then reacted in N2 at
the same temperature and pressure for the indicated times. Each figure
shows an equatorial or near-equatorial cross section of the microsphere;
the depth of the U(c,N) layer (the r0 - r of the interface-control model)
is within two standard deviations of the average value determined from

9626 [Y-89625
19623
Y-89624
Y-89620
(g)B
;acted with W2 at 1700°C for the Indicated Times. 150x. (a) 180 min; ) 124-5 min; (h) 14-40 min. The depth of the intermediate U(C,N) layer iftchant: HAc-HN03-H20.
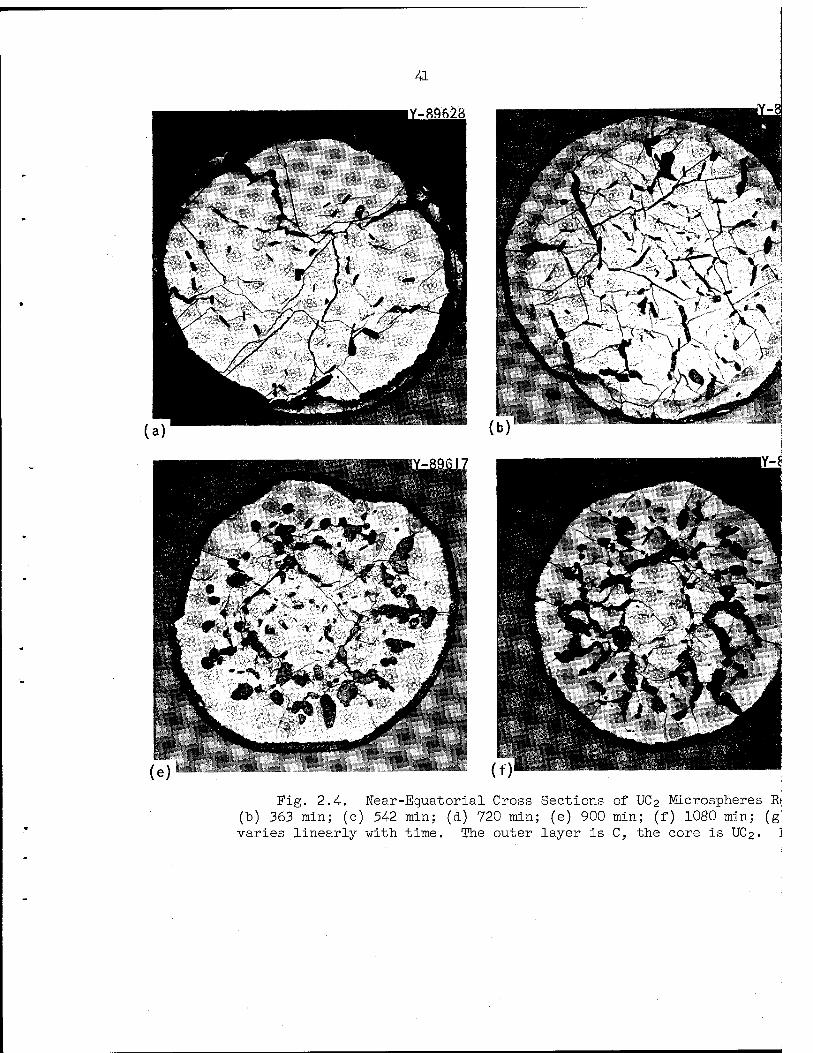
Fig. 2.4. Near-Equatorial Cross Sections of UC2 Microspheres Ri (b) 363 min; (c) 542 min; (d) 720 min; (e) 900 min; (f) 1080 min; (g varies linearly with time. The outer layer is C, the core is UC2. J
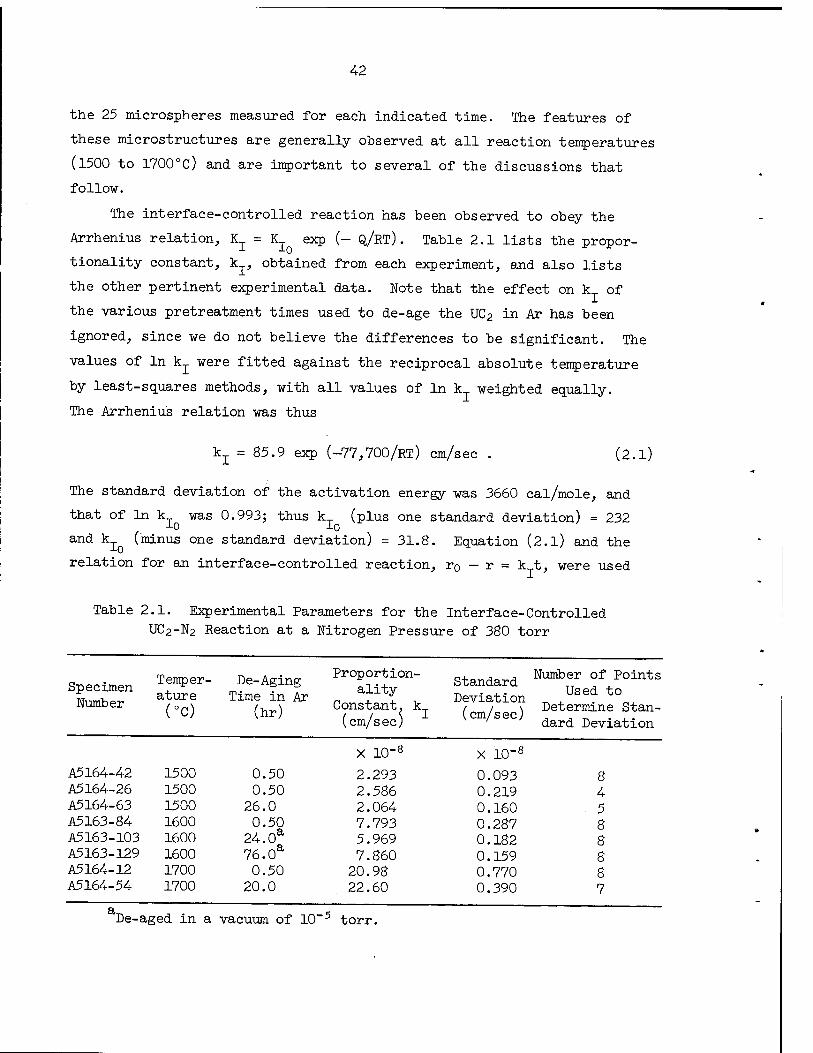
42
the 25 microspheres measured for each indicated time. The features of
these microstructures are generally observed at all reaction temperatures
(1500 to 1700°C) and are important to several of the discussions that
follow.
The interface-controlled reaction has been observed to obey the
Arrhenius relation, Kj. = K.J. exp (- Q/RT). Table 2.1 lists the propor-
tionality constant, k , obtained from each experiment, and also lists
the other pertinent experimental data. Note that the effect on k of
the various pretreatment times used to de-age the UC2 in Ar has been
ignored, since we do not believe the differences to be significant. The
values of In k were fitted against the reciprocal absolute temperature
by least-squares methods, with all values of In k weighted equally.
The Arrhenius relation was thus
k = 85.9 exp (-77,700/RT) cm/sec (2.1)
The standard deviation of the activation energy was 3660 cal/mole, and
that of In kj was 0.993; thus k (plus one standard deviation) = 232
and kj (minus one standard deviation) = 31.8. Equation (2.l) and the
relation for an interface-controlled reaction, r0 - r = k t, were used
Table 2.1. Experimental Parameters for the Interface-Controlled UC2-N2 Reaction at a Nitrogen Pressure of 380 torr
Specimen Number
Temper- ature (°0
De-Aging Time in Ar
(hr)
Proportion- ality
Constant, k (cm/sec)
Standard Deviation (cm/sec)
X 10"8
Number Us
Deter dard
of Points ed to mine Stan- Deviation
X 10"8
A5164-42 1500 0.50 2.293 0.093 8 A5164--26 1500 0.50 2.586 0.219 4 A5164-63 1500 26.0 2.064 0.160 . 5 A5163-84 1600 0.50 7.793 0.287 8 A5163-103 1600 24.0a 5.969 0.182 8 A5163-129 1600 76.0a 7.860 0.159 8 A5164-12 1700 0.50 20.98 0.770 8 A5164-54 1700 20.0 22.60 0.390 7
De-aged in a vacuum of 10"5 torr

43
to calculate the times necessary for complete conversion of UC2 micro-
spheres having a radius of 250 |_im; this time was 307 hr at 1500°C,
95 hr at 1600"C, and 33 hr at 1700°C.
Another important result is shown in Fig. 2.5; this particle is
from the same sample as that shown in Fig. 2.4(a). About i/o of the
microspheres in the original UC2 material contain an interconnecting
network of free C. These particles react very rapidly: the particle
in Fig. 2.5 is about 98/o U(C,N) and was converted in about one-tenth
of the time required to convert the particles shown in Fig. 2.4(a)
through (h). They were converted rapidly because the carbon network
has the twofold function of providing a short-circuit diffusion path
for the N2 and dividing the UC2 into small subparticles that can be
completely converted in a shorter time. This observation substantiates
the assumed mode of reaction in the conversion of U02-carbon sol-gel
shards to U(C,N) by reaction with N2•
BY-39627 ■■ ■■'■ \ 1 lw—ii*'A1 i--A--™™
^^^^^^^^^^^^^^^^^^^^^^^^^^^^^^^^^^^h w^f jM| ^m^ My. Jb^^^F ''ifaKvfck^H
^km w!L^*\mL i^B^T •_ ^L 'J^^RPHn IL/^^^^I
r^ju2 [W •JEAJK*
^th\Jtt^^pwL'^t j JL" ** MM
f^JH Hi
w^l^^ll^HHH^I^^MilV:'; >]■
Fig. 2.5. A Microsphere from the Same Sample as that Shown in Fig. 2.4(a). The particle has been completely converted to u(C,N). 150X. Etchant: HAc-HN03-H20.
We also continued to study the effect of H2 on this reaction; from
this study we inferred additional information about the distribution of
C. Our objective here was the removal of C from the completely converted

44
particle. Particles of UC2 were converted in the fluidized bed to
U(C,N) at 1700°C at a nitrogen pressure of 380 torr and then reacted in
a N2-4.33$ H2 mixture at the same pressure and temperature. Within 2
or 3 min, more than 80% of the volume of C originally in the particle
was removed, as can be seen from a comparison of Figs. 2.4(h) and 2.6.
Hydrogen stripping is apparently a very efficient method for removing
the C precipitated by this reaction and may be just as useful for
removing excess free C from the u(C,N) produced by the reaction of N2
with the UO2-C sol-gel material.
£^-£9629
Fig. 2.6. A U(C,N) Microsphere that Has Been Reacted for 2 min in N2-4.33$ H2 at 1700°C to Remove 80/0 of the C Produced by the UC2-N2 Reaction. 150x. Etchant: HAc-HN03-H20.
These results also indicate that the C that deposited in the parti-
cles shown in Figs. 2.4(a) through (h) and 2.6 becomes interconnected.
This C thus apparently provides a short-circuit path from the particle
surface to the vicinity of the UC2-U(C,N) interface. Since the reaction
was controlled in the vicinity of this interface, the diffusion of N2
through the C is not the rate-limiting step in the conversion process.
Because of this short-circuiting behavior, however, all of the other
45
rate-Controlling steps that are postulated for this reaction occur in
the vicinity of the interface:
1. N2 -* 2 My^ N)(Ref. 3) at U(C,N)-C interface,
2. [N] diffusion to UC2-U(C,N) interface,
3. y [N] - UC2 - U(Ci _,N„) - (l+y) [C]^c ^ at UC2-U(c,N) interface,
4. [Cjy^ N) diffusion to u(C,N)-C interface,
5- [C]U(C,W) "C(free) "
Thus it is not possible to determine the rate-limiting mechanism from
these experiments alone. On the other hand, we reported4' that the
reaction of carbon-free UC2 did not exhibit these internal precipitates;
instead, all the C precipitated on the surface of the sphere. We have
ordered material of this type for a new series of experiments that will
help us to better differentiate the rate-controlling mechanisms.
We also determined the carbon distribution in the U(C,N) and UC2
phases typified by those in Fig. 2.4(a) through (h) by quantitative
metallography on ten particles at each reaction time for a series
(specimen set A5163-84) that was reacted at 1600°C at a nitrogen pres-
sure of 380 torr. The results are given in Table 2.2 and Fig. 2.7 in
terms of the volume percent of C in each phase. The statistical analy-
sis follows that of Hilliard and Cahn.5 The carbon content can be seen
to increase in both phases as the reaction progresses. This is especially
interesting in the case of the UC2 phase; the C in solid solution
produced by the reaction at the U(C,N)-UC2 interface apparently estab-
lishes a carbon gradient in the UC2 that leads to diffusion of C from
the interface to the free-carbon sites within the UC2.
3Brackets indicate a species in solid solution.
*T. B. Lindemer, Fuels and Materials Development Program Quart. Progr. Rept. June 30, 1968, ORNL-4330, pp. 32-39.
5J. E. Hilliard and J. W. Cahn, Trans. Met. Soc. AIME 221, 344-352 (1961).

46
Table 2.2. Free Carbon in UC2 and U(c,N) Phases as Functions of Extent of Reaction of UC2 in N2 at 1600°C
Reaction U(C,N) Phase uc2 : Phase
Extent Time Free Carbon Standard Free Carbon Standard
(*) (min) Content (vol <f>)
Deviation (vol <f>)
Content (vol <f>)
Deviation (vol <f>)
0 0 1.0a
28.8 485 7.45 2.2 5.1 1.0 45.4 966 15.9 2.5 12.5 1.8 64.1 1440 19.4 2.3 16.3 2.6 74.9 1920 22.9 2.3 20.2 3.1 83.8 2400 24.4 2.0 22.1 3.5 93.5 2880 27.5 2.0 21.3 3.3 96.1 3313 28.4 2.0 21.2 3.7
a Based on chemical analysis and verified qualitatively by
metallography.
ORNL-DWG 68-10290
40 60
CONVERSION (%) 100
Fig. 2.7. The Volume Percent Free Carbon in the U(C,N) and UC2 Phases as a Function of the Percent Reaction of UC2 Microspheres in N2 at 1600°C.

47
Effect of Nitrogen Exposure on UC2 Lattice Parameter. - Another
study involved the change of the lattice parameter of UC2 during the
initial stages of the reaction, since we noticed that metallographically
prepared, as-received UC2 microspheres responded differently to etching
than did UC2 that was exposed to N2. We ran an experiment at 1600°C on
UC2 that was first de-aged 0.5 hr in Ar at 380 torr and then reacted in
N2 at the same temperature and pressure. We sampled the UC2 after every
hour of exposure to N2 up to a total of 6 hr; this time is just suffi-
cient for a measurable U(C,N) layer to form on the surface of the micro-
sphere. We then analyzed the six samples to determine the UC2 lattice
parameter as shown in Table 2.3. These data demonstrate that the a0
lattice parameter definitely decreases with longer exposure to N2 and
suggest that this effect is caused by the solution of N in UC2. Limited
additional work is planned to determine whether UC2 is actually
dissolving N.
Table 2.3. Effect of Nitrogen Exposure on UC2 Lattice Parameter at 1600°C and ä Nitrogen Pressure of 380 Torra
Exposure Lattice Parameter ao, A Lattice Parameter CQ, A Time Value Standard Value Standard (min) Deviation Deviation
X 10"5 X 10"5
0b 3.519 100 5.979 200 67 3.51705 45 5.98239 227
123 3.51734 60 5.97636 312 184 3.51676 54 5.97474 315 255 3.51550 105 5.97185 485 300 3.51411 77 5.98006 344 361 3.51317 54 5.97360 291
Vm A5164- 24. Lattice parameter from Edmund K. Storms, The Refractory
Carbides, P- van ;, Academic Press, New York, 1967.
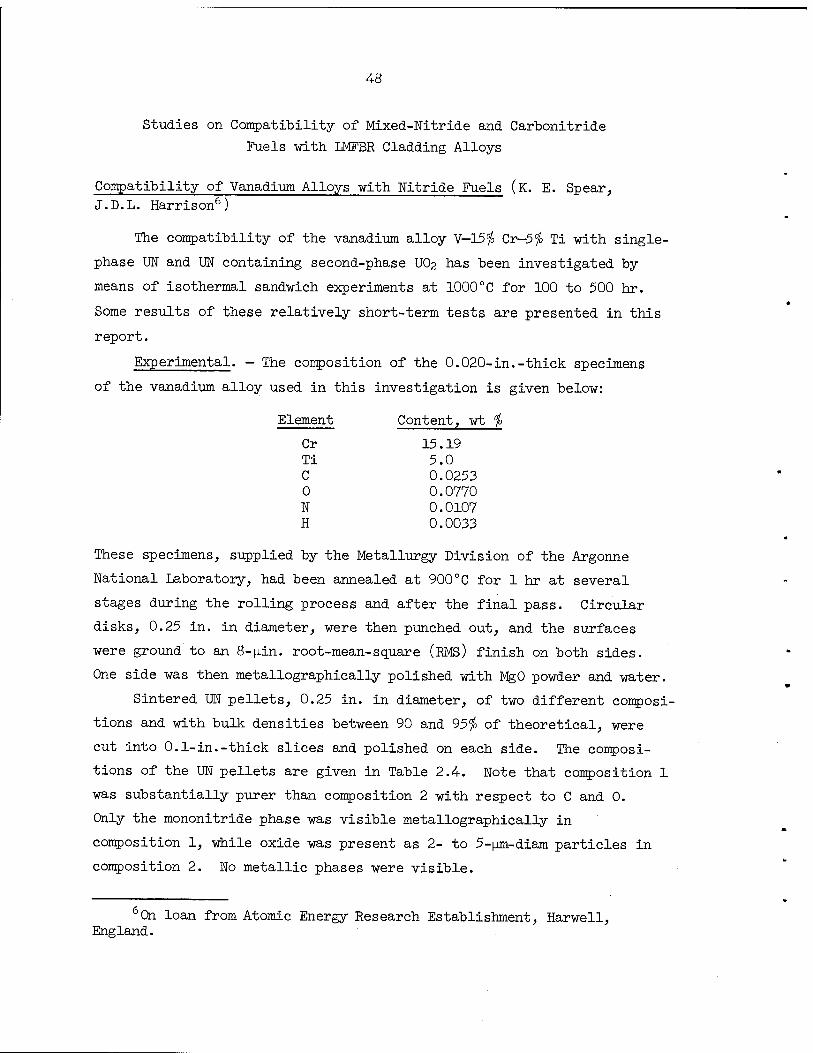
48
Studies on Compatibility of Mixed-Nitride and Carbonitride
Fuels with LMFBR Cladding Alloys
Compatibility of Vanadium Alloys with Nitride Fuels (K. E. Spear, J.D.L. Harrison6)
The compatibility of the vanadium alloy V-15/o Cr—5$ Ti with single-
phase UN and UN containing second-phase UO2 has been investigated by
means of isothermal sandwich experiments at 1000°C for 100 to 500 hr.
Some results of these relatively short-term tests are presented in this
report.
Experimental. - The composition of the 0.020-in.-thick specimens
of the vanadium alloy used in this investigation is given below:
Element Content, wt Jo
Cr 15.19 Ti 5.0 C 0.0253 0 0.0770 N 0.0107 H 0.0033
These specimens, supplied by the Metallurgy Division of the Argonne
National Laboratory, had been annealed at 900°C for 1 hr at several
stages during the rolling process and after the final pass. Circular
disks, 0.25 in. in diameter, were then punched out, and the surfaces
were ground to an 8-(j.in. root-mean-square (RMS) finish on both sides.
One side was then metallographically polished with MgO powder and water.
Sintered UN pellets, 0.25 in. in diameter, of two different composi-
tions and with bulk densities between 90 and 95/o of theoretical, were
cut into 0.1-in.-thick slices and polished on each side. The composi-
tions of the UN pellets are given in Table 2.4. Note that composition 1
was substantially purer than composition 2 with respect to C and 0.
Only the mononitride phase was visible metallographically in
composition 1, while oxide was present as 2- to 5-pm-diam particles in
composition 2. No metallic phases were visible.
England.
60n loan from Atomic Energy Research Establishment, Harwell,
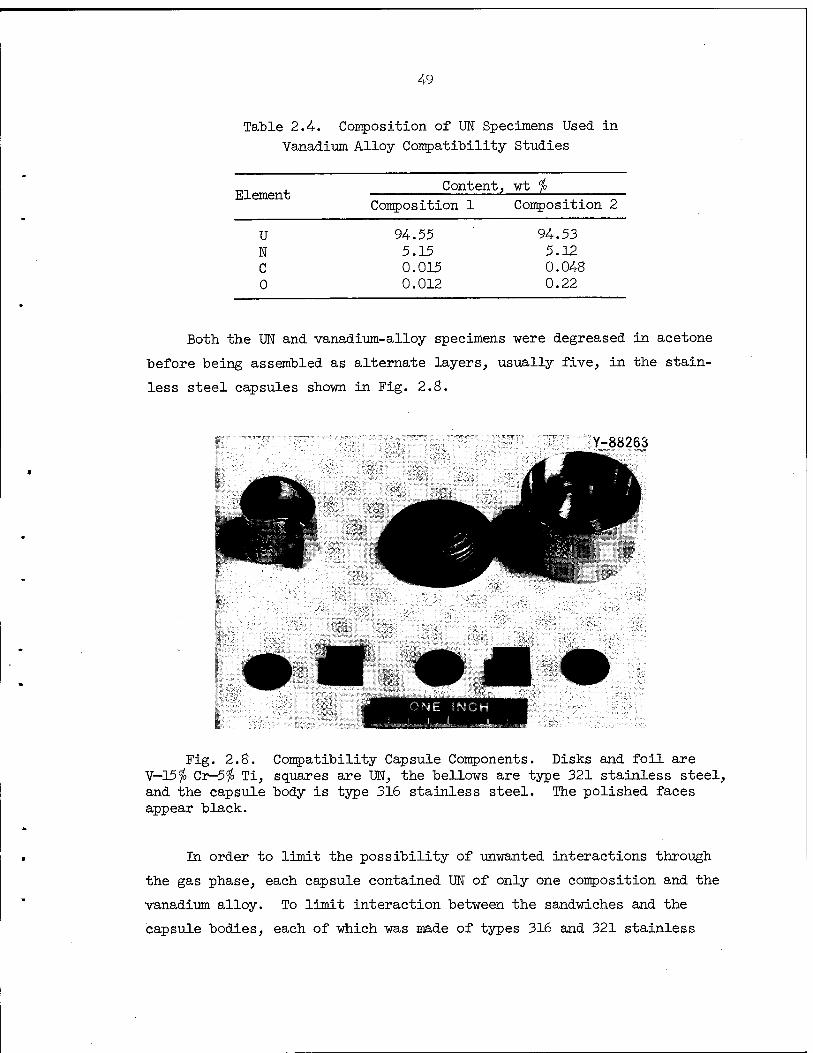
49
Table 2.4-. Composition of UN Specimens Used in
Vanadium Alloy Compatibility Studies
Element Content, wt *
Composition 1 Composition 2
U 94. 55 94.53 N 5.15 5.12 C 0.015 0.048 0 0.012 0.22
Both the UN and vanadium-alloy specimens were degreased in acetone
before being assembled as alternate layers, usually five, in the stain-
less steel capsules shown in Fig. 2.8.
'Y-88263
INCH
Fig. 2.8. Compatibility Capsule Components. Disks and foil are V—15/o Cr-5$ Ti, squares are UN, the bellows are type 321 stainless steel, and the capsule body is type 316 stainless steel. The polished faces appear black.
In order to limit the possibility of unwanted interactions through
the gas phase, each capsule contained UN of only one composition and the
vanadium alloy. To limit interaction between the sandwiches and the
capsule bodies, each of which was made of types 316 and 321 stainless

50
steel, each sandwich was surrounded by a 0.005-in. annular wrap of the
same alloy used in the sandwich.
Contact was maintained between the layers of the sandwiches in
each capsule by an axial compressive load of about 20 lb. This load
was sufficient to deform the bellows so that the load was properly
transferred to the contents of the capsule. Several capsules were
stacked together with the use of spacers, as shown in Fig. 2.9, and
were placed inside a loosely fitting Inconel tube, as shown in Fig. 2.10.
This tube served the dual purpose of enclosing the capsules in an atmo-
sphere of pure, flowing Ar and of acting as the tension member that
applied the compressive load through an internal spring and push rods
to the stack of capsules.
Two capsules of each combination of metal and nitride were assem-
bled and welded in a vacuum of 5 x 10"5 torr, as measured in the welding
chamber. One capsule was heated for 100 hr and the other for 500 hr at
1000°C.
After the heating period, the capsules were slit with an abrasive
wheel, vacuum impregnated with epoxy resin, sectioned transversely, and
polished and etched. The surfaces were then examined metallographically
and with an electron microprobe analyzer. Microhardness indentations
at a 50-g load were made on the layers of vanadium alloy in some sand-
wiches to see if this technique yielded any indication of changes in
the character of the layer that could not be detected by the other two
methods.
Results. — Reaction with both UN compositions was observed at the
UN-vanadium alloy interface after 100 and 500 hr. While all of the
results have not been critically analyzed, the reactions appear to be
independent of the second-phase oxide present in UN of composition 2.
Accordingly, only the results of the couples involving UN of
composition 1 are presented and discussed below.
Metallographic examination. Reaction at the interface was observed
after 100 and 500 hr. As shown in Fig. 2.11, this reaction took the
form of a metallic layer next to the nitride that was partially separated'
from the vanadium alloy by a broken layer of a blue-purple phase. The
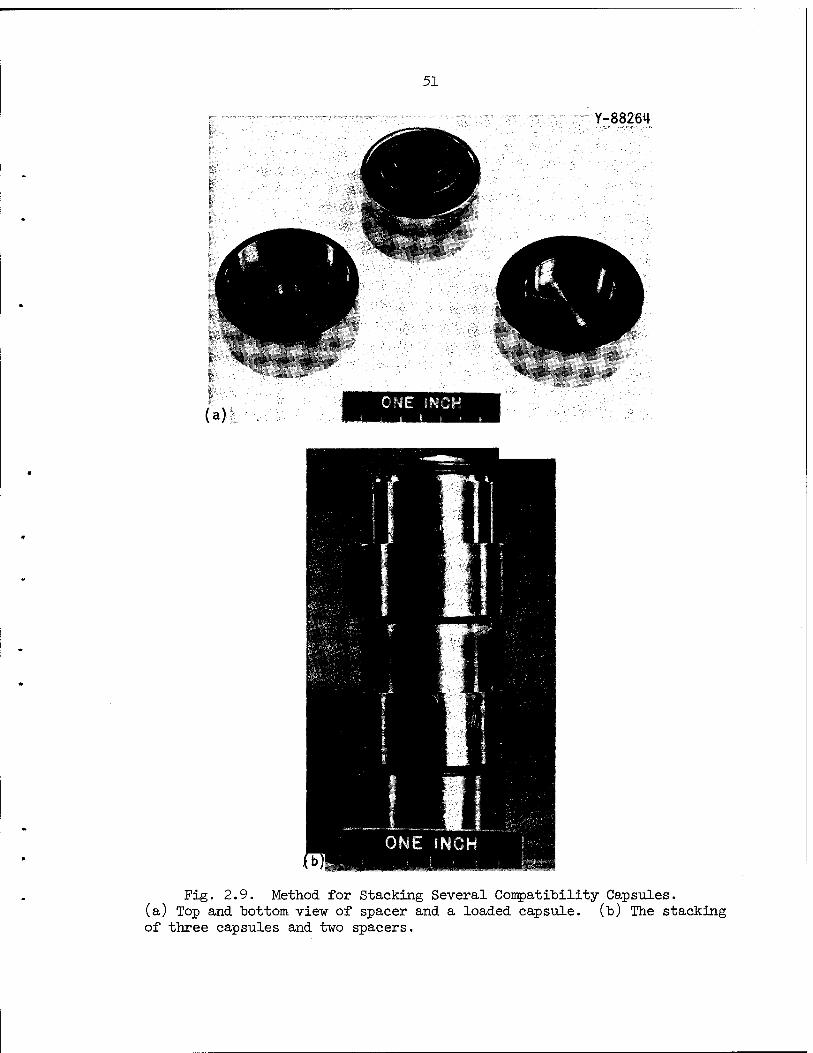
51
Y-88264
(a) ONE INCH
**-'^j
Fig. 2.9. Method for Stacking Several Compatibility Capsules, (a) Top and bottom view of spacer and a loaded capsule, (b) The stacking of three capsules and two spacers.
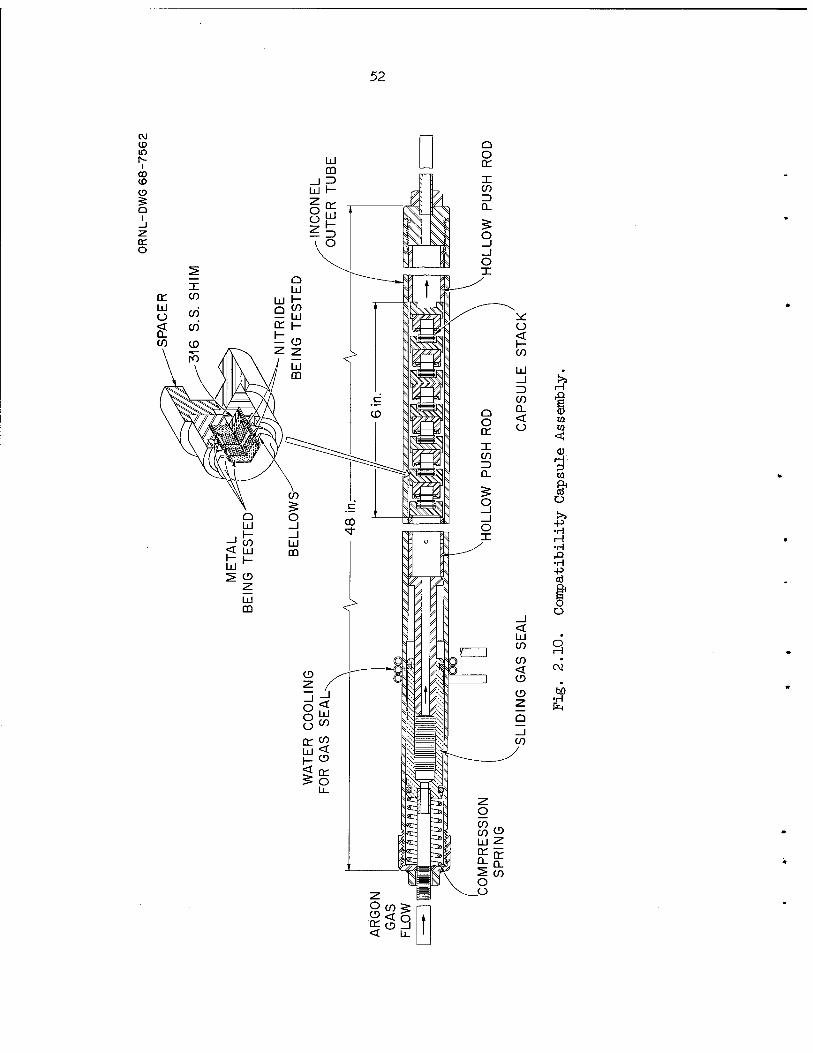
52
CD IT)
I oo to
Q I
CT O
^ o < h- C/)
III . 1 >? ~» H
CO "i D_ 53 < 03 C ) W
<ü <D
1 W Pi CO O
!>» -P •H H •H £> •H +3 erf
a- o o
_l < III • CO 9 CO • < CM CD
CD 2
W

53
Y-S926S
• ' •
• .
(ap
P its
Y-89271
\
Ami
^
• 1 # «
o • -_
° O
(b)l
Fig. 2.11. Vanadium Alloy (V-15$ Cr-5# Ti)-Uranium Nitride (Composition 1) After 500 hr at 1000°G. (a) Unetched. 500x. (b) Etched with Lactic, HN03, HF.acid solution. 750x.

54
blue-purple phase extended 60 |_im into the alloy as isolated grains
about 2 um in diameter. The metallic layer showed some signs of pene-
trating the nitride more deeply at the grain boundaries, as shown in
Fig. 2.12. A colorless platelet phase was also visible in the vanadium
alloy after etching. This phase extended into the alloy for some 150 |om
from the interface and had a platelet size of about 1 |jm in diameter and
probably about 0.1 urn thick. In isolated instances it appeared that
this phase had merged into certain grains of the blue-purple phase.
An extensive reaction zone was observed between the vanadium alloy
and the capsule and spacers of type 316 stainless steel, as shown in
Fig. 2.13. After 500 hr the total width of the zone was about 120 |_im,
extending 100 |om into the steel and 20 pm into the vanadium alloy. The
material in this zone appeared to be brittle, as judged by its exten-
sive cracking, and very hard (DPH at 50-g load of 1000 ± 100 kg/mm2).
Electron microprobe analysis. Microprobe analysis' showed that the
metal layer next to the nitride was generally low in U and high in Cr
and V. In some cases, there was uranium metal in small pockets next to
the nitride with the layer rich in Cr and V outside it. The composition
of the blue-purple phase was high in U and Ti and low in Cr and V.
Uranium had diffused into the vanadium alloy for a distance corresponding
to the extent of the colorless platelet phase (about 150 urn). It was
not possible to identify positively the platelets as having high uranium
content, but over the 150-|jm region where the platelets were observed in
uniform concentration the uranium concentration was almost constant; it
dropped sharply in the center of the metal disk where the platelets were
absent.
Microhardness measurements. Microhardness measurements showed an
increase in hardness of the vanadium alloy from 230 ± 20 kg/mm2 in
areas where the platelet phase was absent to 310 ± 20 kg/mm2 where it
was present.

55
5"^I:-V-89269
PP Fig. 2.12. Vanadium Alloy (v-15# Cr-5$ Ti)-Uranium Nitride
(Composition l) Interface after 500 hr at 1000°C. Etched with lactic, HN03, HF acid solution. 500x.
Y-89266
Fig. 2.13. Vanadium Alloy (V-15# Cr-5# Ti)-Type 316 Stainless Steel Reaction Zone. From bottom to top are uranium nitride, vanadium alloy, and the stainless-steel capsule shim. Etched with lactic, HNO3, HF acid solution. 200x.

56
Discussion. - The results have not yet been critically evaluated
in the light of available equilibrium phase diagrams and diffusion rates.
However, titanium metal can reduce UN to form TiN and uranium metal
according to available thermodynamic data, while UN is stable in the
presence of either V or Cr. Therefore, the observed reaction of UN
with the V-15# Cr-5$ Ti alloy is interpreted as having been caused by
the Ti in the alloy.
One explanation of the observed results is that reaction of Ti in
the alloy first releases free U at the nitride interface and precipi-
tates a titanium-uranium nitride (the blue-purple phase). Some of the
U then diffuses rapidly into the alloy and reacts, probably with Ti, to
give the platelet phase containing Ti and U. Nitrogen diffuses more
slowly and is "fixed" as (Ti U )N particles. The ratio x:y may vary,
with a nitride being formed only when the ratio is large.
Fuel-Cladding Thermal Conductance (D. L. McElroy, R. K. Williams, T. E. Banks)
Cur objective is to improve the ratings for permissible power
generation in fuel elements by finding ways to decrease the thermal con-
tact resistance associated with the fuel-cladding interface. Study of
the thermal contact resistance is particularly applicable to carbide
and nitride fuels that have relatively high thermal conductivities. In
these materials, the interfacial temperature drop represents a very
significant portion of the total center-to-edge temperature drop and
thus governs the center temperature obtained at a given rate of power
generation. This is illustrated by the calculations shown in Table 2.5.
The thermal contact resistance is defined as the temperature drop
produced at the interface by unit heat flux:
Rc = AP±/q , (2.2)
where
R = thermal contact resistance in deg«cm2/w,
zaii = interfacial temperature drop in °C, and
q = heat flux in w/cm2 .
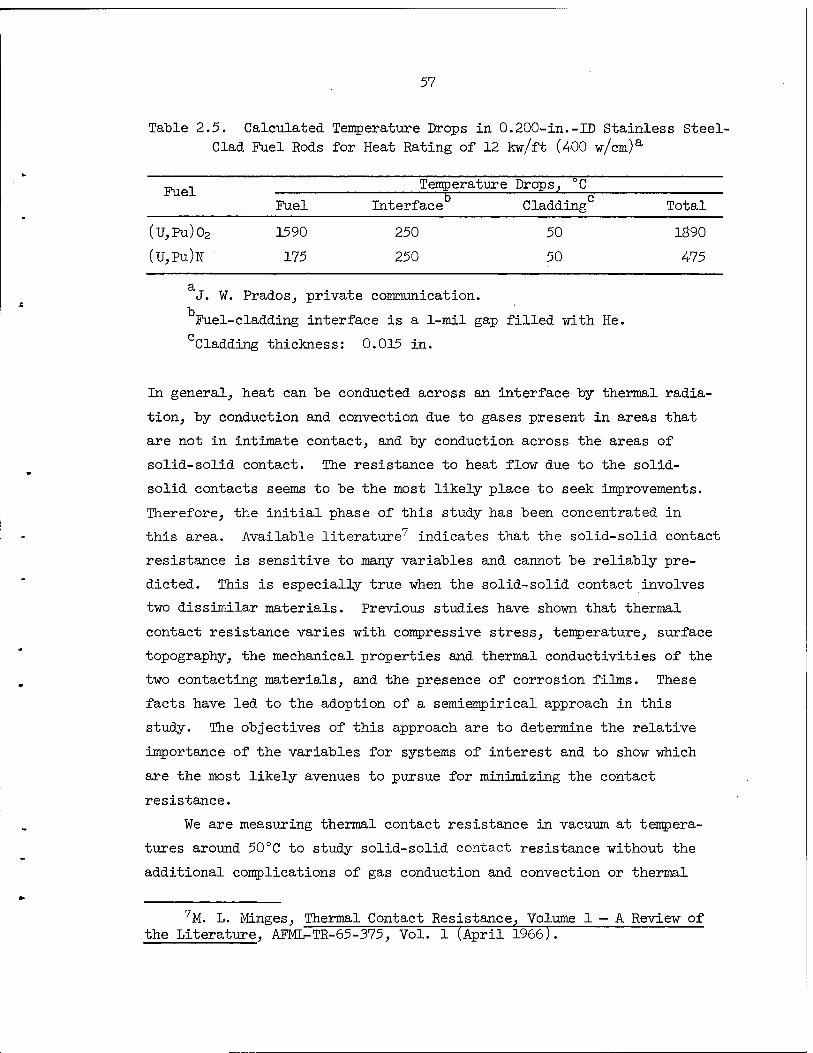
57
Table 2.5. Calculated Temperature Drops in 0.200-in.-ID Stainless Steel- Glad Fuel Rods for Heat Rating of 12 kw/ft (400 w/cm)a
Fuel Temperature Drops, °C
Fuel Interface Cladding Total
(U,Pu)02
(U,Pu)N
1590
175
250
250
50
50
1890
475
a J. W. Prados, private communication.
Fuel-cladding interface is a 1-mil gap filled with He.
Cladding thickness: 0.015 in.
In general, heat can be conducted across an interface by thermal radia-
tion, by conduction and convection due to gases present in areas that
are not in intimate contact, and by conduction across the areas of
solid-solid contact. The resistance to heat flow due to the solid-
solid contacts seems to be the most likely place to seek improvements.
Therefore, the initial phase of this study has been concentrated in
this area. Available literature7 indicates that the solid-solid contact
resistance is sensitive to many variables and cannot be reliably pre-
dicted. This is especially true when the solid-solid contact involves
two dissimilar materials. Previous studies have shown that thermal
contact resistance varies with compressive stress, temperature, surface
topography, the mechanical properties and thermal conductivities of the
two contacting materials, and the presence of corrosion films. These
facts have led to the adoption of a semiempirical approach in this
study. The objectives of this approach are to determine the relative
importance of the variables for systems of interest and to show which
are the most likely avenues to pursue for minimizing the contact
resistance.
We are measuring thermal contact resistance in vacuum at tempera-
tures around 50°C to study solid-solid contact resistance without the
additional complications of gas conduction and convection or thermal
7M. L. Minges, Thermal Contact Resistance, Volume 1 — A Review of the Literature, AFML-TR-65-375, Vol. 1 (April 1966),
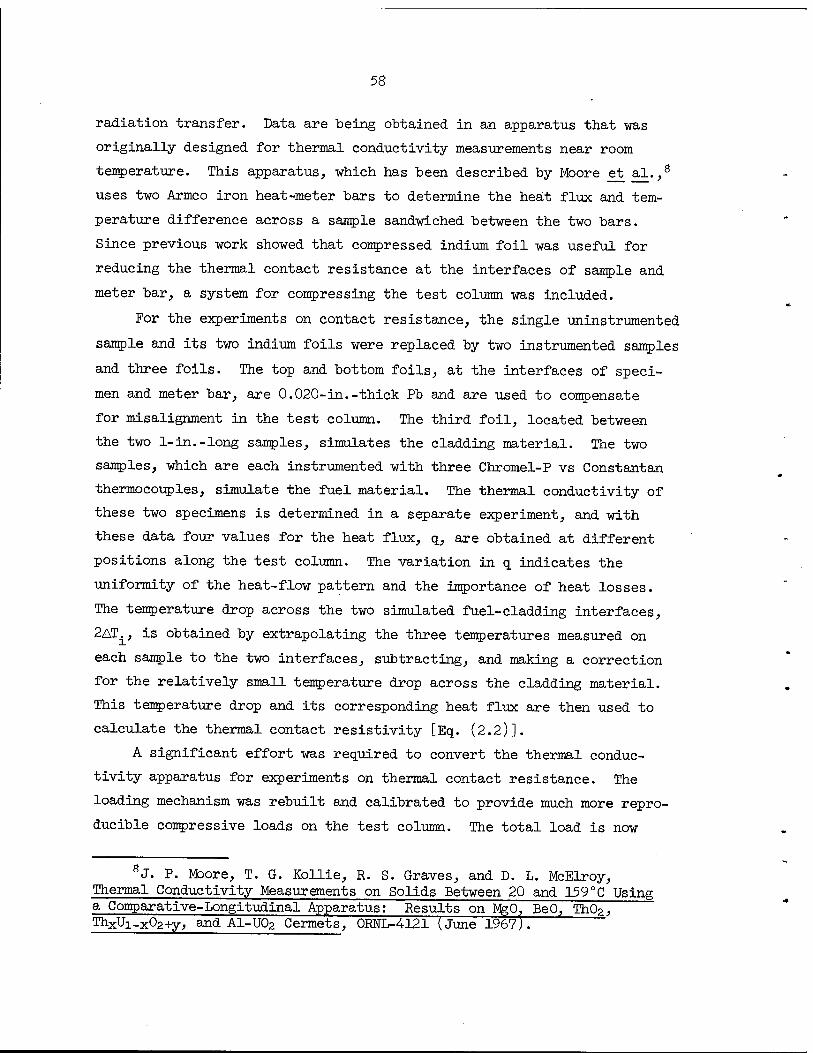
58
radiation transfer. Data are being obtained in an apparatus that was
originally designed for thermal conductivity measurements near room
temperature. This apparatus, which has been described by Moore et al.,8
uses two Armco iron heat-meter bars to determine the heat flux and tem-
perature difference across a sample sandwiched between the two bars.
Since previous work showed that compressed indium foil was useful for
reducing the thermal contact resistance at the interfaces of sample and
meter bar, a system for compressing the test column was included.
For the experiments on contact resistance, the single uninstrumented
sample and its two indium foils were replaced by two instrumented samples
and three foils. The top and bottom foils, at the interfaces of speci-
men and meter bar, are 0.020-in.-thick Pb and are used to compensate
for misalignment in the test column. The third foil, located between
the two 1-in.-long samples, simulates the cladding material. The two
samples, which are each instrumented with three Chromel-P vs Constantan
thermocouples, simulate the fuel material. The thermal conductivity of
these two specimens is determined in a separate experiment, and with
these data four values for the heat flux, q, are obtained at different
positions along the test column. The variation in q indicates the
uniformity of the heat-flow pattern and the importance of heat losses.
The temperature drop across the two simulated fuel-cladding interfaces,
2ATi, is obtained by extrapolating the three temperatures measured on
each sample to the two interfaces, subtracting, and making a correction
for the relatively small temperature drop across the cladding material.
This temperature drop and its corresponding heat flux are then used to
calculate the thermal contact resistivity [Eq. (2.2)].
A significant effort was required to convert the thermal conduc-
tivity apparatus for experiments on thermal contact resistance. The
loading mechanism was rebuilt and calibrated to provide much more repro-
ducible compressive loads on the test column. The total load is now
8J. P. Moore, T. G. Kollie, R. S. Graves, and D. L. McElroy, Thermal Conductivity Measurements on Solids Between 20 and 159°C Using a Comparative-Longitudinal Apparatus: Results on MgO, BeO, Th02, ThxUi-xO-2+y, and A1-U02 Cermets, ORWL-4121 (June 1967j.

59
obtained from readings on a Baldwin load cell, and the calibration was
obtained by replacing the test column with a second load cell. The
results of several calibrations indicate that the compressive load is
known to within ±10 psi.
Several runs were made to determine the best axial positions for
the specimen thermocouples. These experiments indicated that uniform
contact pressures are not easily obtained and showed the importance of
having multiple temperature sensors for detecting these difficulties.
Further modification of the experimental setup to minimize these diffi-
culties and increase the accuracy of the measurements is now being
planned.
Some characteristics of the materials obtained for these tests are
shown in Table 2.6. The hardened, high-speed tool-steel samples were
obtained because the hardness and thermal conductivity of this material
Table 2.6. Characteristics of Materials for Study of Thermal Contact Resistance
Material Condition DPH
Hardness (kg/cm2)
RMS Surface
Roughness (l-iin.)
Thermal Conductivity
at 25°C (w cm-2 deg"1
0.005-in. copper foil
Annealed 2 hr, 250°C in H2
58 (50-g load)
14-15 4.01
0.005-in. type 302 stain- less steel foil
"Half hard" 368 (50-g load)
10-12 0.12
T-l tool steel Quenched and drawn
836 (1-kg load)
3-4 0.157
T-n,Tb UN Pressed and sintered
525 C 6-8 0.137
Carpenter Steel Company startenith grade.
Material was 95$ of theoretical density with some oxide inclusions. CE. Speidel and D. L. Keller, Fabrication and Properties of Hot-
Pressed Uranium Mononitride, BMI-1633 (1963).
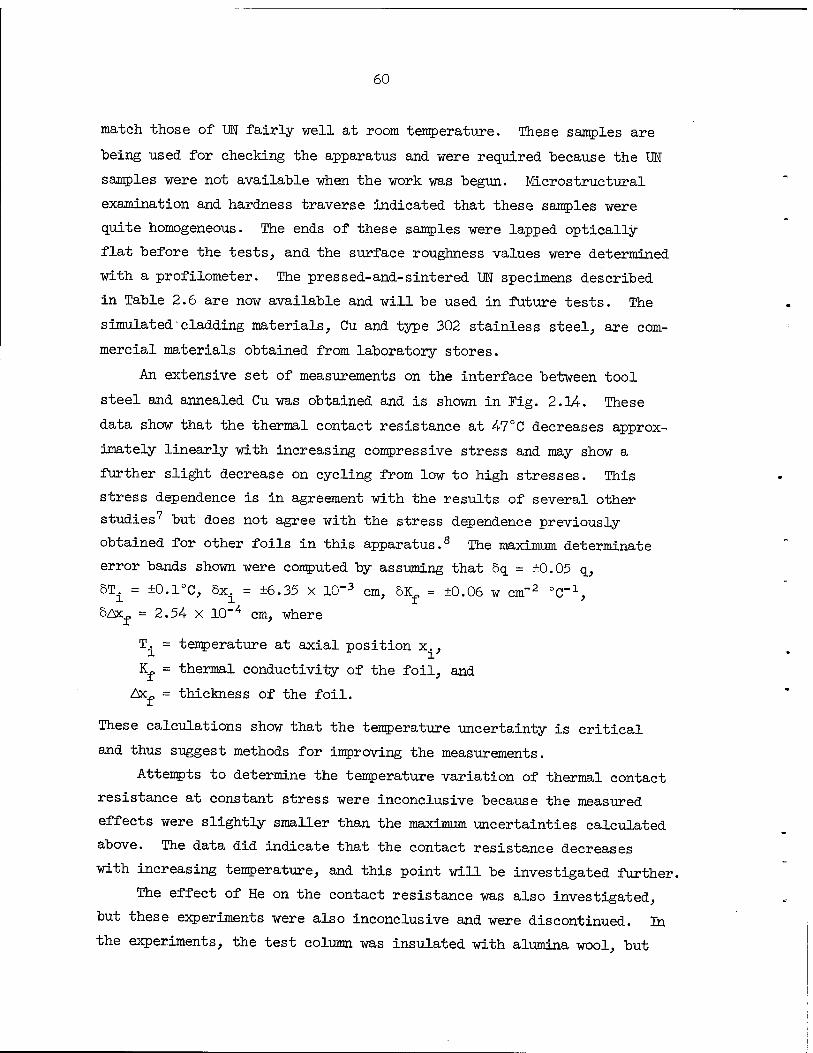
60
match those of UN fairly well at room temperature. These samples are
being used for checking the apparatus and were required because the UN
samples were not available when the work was begun. MLcrostructural
examination and hardness traverse indicated that these samples were
quite homogeneous. The ends of these samples were lapped optically-
flat before the tests, and the surface roughness values were determined
with a profilometer. The pressed-and-sintered UN specimens described
in Table 2.6 are now available and will be used in future tests. The
simulated cladding materials, Cu and type 302 stainless steel, are com-
mercial materials obtained from laboratory stores.
An extensive set of measurements on the interface between tool
steel and annealed Cu was obtained and is shown in Fig. 2.14. These
data show that the thermal contact resistance at 47°C decreases approx-
imately linearly with increasing compressive stress and may show a
further slight decrease on cycling from low to high stresses. This
stress dependence is in agreement with the results of several other
studies7 but does not agree with the stress dependence previously
obtained for other foils in this apparatus.8 The maximum determinate
error bands shown were computed by assuming that 5q = ±0.05 q,
5T± - ±0.1°C, bx± = ±6.35 x 10"3 cm, 5Kf = ±0.06 w cm"2 0C_1,
5£xf = 2.54 x 10⁻⁴ cm, where
T. = temperature at axial position x.,
Kf = thermal conductivity of the foil, and
£x„ = thickness of the foil.
These calculations show that the temperature uncertainty is critical
and thus suggest methods for improving the measurements.
Attempts to determine the temperature variation of thermal contact
resistance at constant stress were inconclusive because the measured
effects were slightly smaller than the maximum uncertainties calculated
above. The data did indicate that the contact resistance decreases
with increasing temperature, and this point will be investigated further.
The effect of He on the contact resistance was also investigated,
but these experiments were also inconclusive and were discontinued. In
the experiments, the test column was insulated with alumina wool, but

61
£ u Ü
H CO
10 UJ o:
o < H O o
UJ
2.0
1.0
0.5
0.2
0.1
0.05
0.02
0.01 101
OR NL- DWG 68-1538
>
... p \ 1
-^ -T
* : 5 _ —4>-Rc = 547 er-1- 68 \1 a.
XT' 1 *
_
•
• \
•
10' 10- 10'
a, C0MPRESSIVE STRESS (psi)
Fig. 2.14. Effect of Compressive Stress on the Thermal Contact Resistivity of the Interface Between Tool Steel and Copper. Interface temperatures vary from 43.8 to 47.5°C.
the insulation would not eliminate heat losses from the test column by
gas conduction and convection. These losses could probably be reduced
to acceptable levels by installing guard heaters, but the considerable
effort required to produce effective thermal guarding would not be
justified at this stage of the investigation.
The properties of the annealed copper foil were determined before
and after the test of contact resistance, and no changes could be
detected. Microhardness tests (DPH at 50-g load) showed no change in
the foil and uniformity across the contact area. Surface roughness
tests gave an indication that the root-mean-square (RMS) roughness of
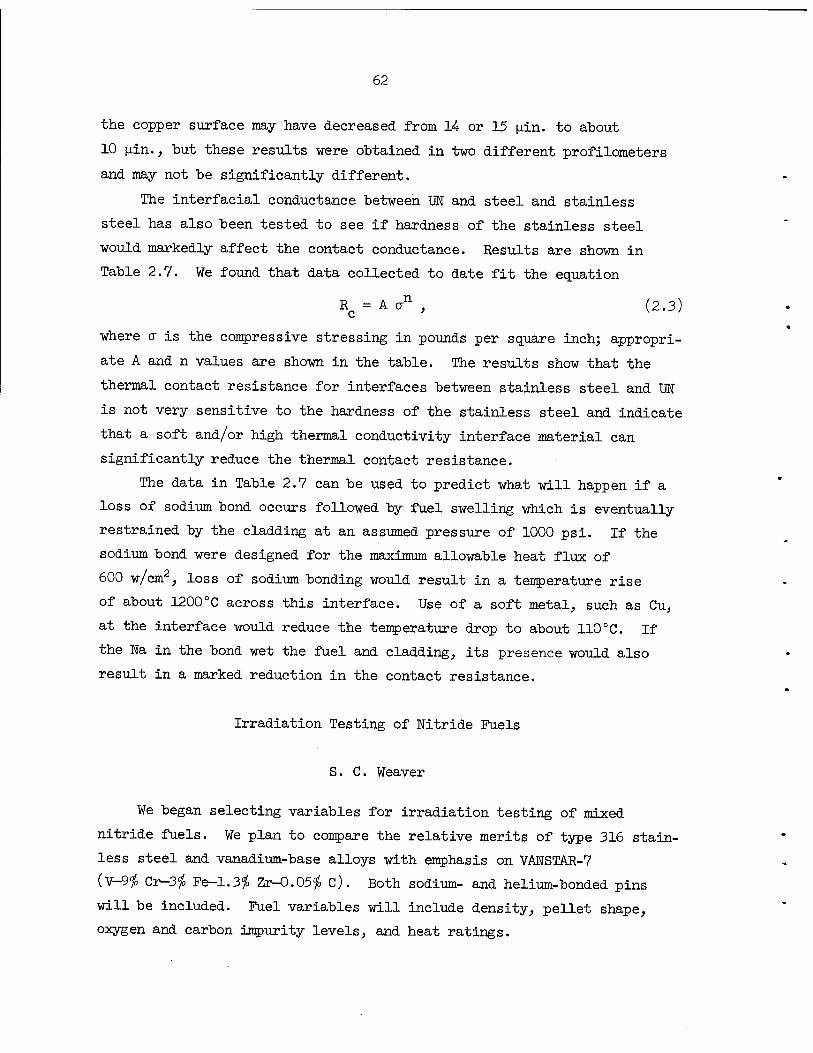
62
the copper surface may have decreased from 14 or 15 pin. to about
10 n±n., but these results were obtained in two different profilometers
and may not be significantly different.
The interfacial conductance between UN and steel and stainless
steel has also been tested to see if hardness of the stainless steel
would markedly affect the contact conductance. Results are shown in
Table 2.7. We found that data collected to date fit the equation
\ = A crn , (2.3)
where cr is the compressive stressing in pounds per square inch; appropri-
ate A and n values are shown in the table. The results show that the
thermal contact resistance for interfaces between stainless steel and UN
is not very sensitive to the hardness of the stainless steel and indicate
that a soft and/or high thermal conductivity interface material can
significantly reduce the thermal contact resistance.
The data in Table 2.7 can be used to predict what will happen if a
loss of sodium bond occurs followed by fuel swelling which is eventually
restrained by the cladding at an assumed pressure of 1000 psi. If the
sodium bond were designed for the maximum allowable heat flux of
600 w/cm2, loss of sodium bonding would result in a temperature rise
of about 1200°C across this interface. Use of a soft metal, such as Cu,
at the interface would reduce the temperature drop to about 110°C. If
the Na in the bond wet the fuel and cladding, its presence would also
result in a marked reduction in the contact resistance.
Irradiation Testing of Nitride Fuels
S. C. Weaver
We began selecting variables for irradiation testing of mixed
nitride fuels. We plan to compare the relative merits of type 316 stain-
less steel and vanadium-base alloys with emphasis on VANSTAR-7
(V-9$ Cr-3# Fe-1.3$ Zr-0.05$ c). Both sodium- and helium-bonded pins
will be included. Fuel variables will include density, pellet shape,
oxygen and carbon impurity levels, and heat ratings.

o o m -p CO
3 o
Ö •H
CO P
Q) S CD
to cö d)
CD CJ Ü cö
+3 CO
■H CO 0)
+3 ü CO -p Ö O o
u tu
o CO -p H Pi CO CD « ■d
CO
CO
o •H -P •H -d Ö o o
CM
(Ü H
■3
CO -p Ö CO -p CO Ö o o
CO •H
to +3
CD •H CO ft
Ö t> CO -H O -P CO O CO CO O ^^ •H « rl ^
CO ^ "^ 1^-
£8^ "a H • O Ü o
-POO • CJ CO Ü CO -P CO o P cö tu a u O Ü-P O PH CQ
CO co^^ to M Ö CM
■d P ^^ cö W
cö •H
tu -p
I bß Ö
•rl -P O CO -P Ö o o
NtO oo o o o o o o
11 11 ^ 1«? ^
oin o m m in o in vo m to en to Nt in en in Hin
d 0) CD
+3 CO
CO CQ tu H a
•H CO -P
CO
H tu a> p CO
CO CO tu H fi •H CO •p CO
ä tu s
•H Ü
•CD ft CO
CO
I d Ö o o CD CO
CO •H
CD -p
-p CO u
•H
Ü Ö •H
tD
I CO
tu Pi
CO
O P.
Ö •H
ft o •H Ö a Ö <+H rc () () O
CO •H •H •H u Ö -p -p -P C) () crt crt cri
<H •H Ö Ö O •P Wl t>l) bll
T) crt •H •H •H crt H CO CO CO O a> 0) cu (D H fc ■d d -d
hfl Fi H H H l o H H H
o m
u jgj ä •H
3 o d CD «H
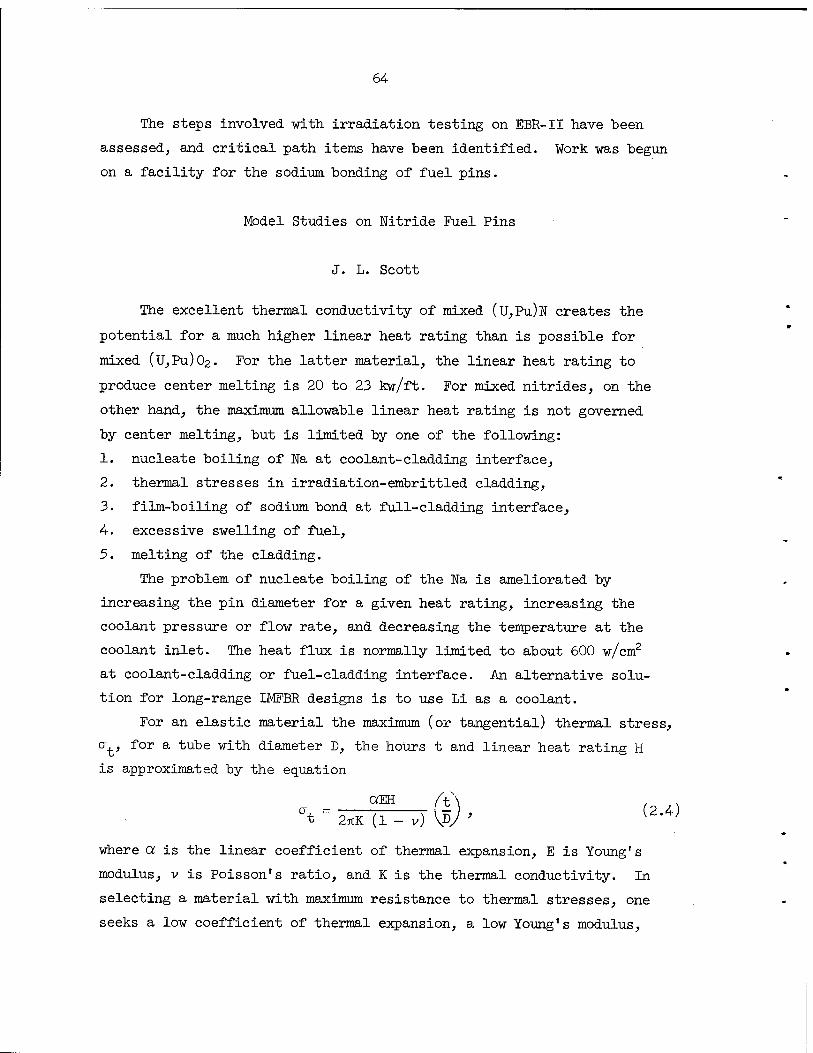
64
The steps involved with irradiation testing on EBR-II have been
assessed, and critical path items have been identified. Work was begun
on a facility for the sodium bonding of fuel pins.
Model Studies on Nitride Fuel Pins
J. L. Scott
The excellent thermal conductivity of mixed (U,Pu)N creates the
potential for a much higher linear heat rating than is possible for
mixed (u,Pu)02. For the latter material, the linear heat rating to
produce center melting is 20 to 23 kw/ft. For mixed nitrides, on the
other hand, the maximum allowable linear heat rating is not governed
by center melting, but is limited by one of the following:
1. nucleate boiling of Na at coolant-cladding interface,
2. thermal stresses in irradiation-embrittled cladding,
3. film-boiling of sodium bond at full-cladding interface,
4. excessive swelling of fuel,
5. melting of the cladding.
The problem of nucleate boiling of the Na is ameliorated by
increasing the pin diameter for a given heat rating, increasing the
coolant pressure or flow rate, and decreasing the temperature at the
coolant inlet. The heat flux is normally limited to about 600 w/cm2
at coolant-cladding or fuel-cladding interface. An alternative solu-
tion for long-range LMFBR designs is to use Li as a coolant.
For an elastic material the maximum (or tangential) thermal stress,
crt, for a tube with diameter D, the hours t and linear heat rating H
is approximated by the equation
«EH /V\
where a is the linear coefficient of thermal expansion, E is Young's
modulus, v is Poisson's ratio, and K is the thermal conductivity. In
selecting a material with maximum resistance to thermal stresses, one
seeks a low coefficient of thermal expansion, a low Young's modulus,

65
a high yield or creep strength, and a high thermal conductivity. We
can define a factor of merit, F, as
2*K (1 - v) . , F = a , {2.5)
CCE c '
where cr is the stress to produce 1$ second-stage creep strain in
10,000 hr. We can use this to compare various cladding materials on
a relative basis. Table 2.8 shows such a comparison. A high factor of
merit corresponds to improved resistance to damage from thermal stress.
Table 2.8. Relative Resistance to Thermal Stress Damage at 700°C
Material Thermal
Conductivity (w cm-1 0C"1)
Coefficient of Thermal Expansion
(cm cm-1 °C_1)
Young's Modulus (psi)
10,000 hr Creep Stress (psi)
Factor of
Merit
x 10" 6 X 106 x 103
Type 304 stain- 0.23 18 21 6 16 less steel
Type 316 stain- 0.22 18 21 7 18 less steel
Hastelloy X 0.20 15 23 13 33
Wo-Vjo Zr 0.54 7.7 14 30 660
VAWSTAR-7a 0.37 11.5 18 9 71
V-9/o Cr-3/o Fe-1.3/o Zr-0.05$ C.
In the calculations in Table 2.8, Poisson's ratio was assumed to
be 0.3 for all materials. The results are not very sensitive to changes
in Poisson's ratio.
Table 2.8 demonstrates the decisive improvement in resistance to
thermal stress in vanadium-base alloys typified by VANSTAR-7
(V-9$ Cr-3$ Fe-1.3$ Zr-O.05$ C). A heat rating of 42 kw/ft will
produce the same effect in this material as 10 kw/ft in stainless steel.
Hastelloy X also is better than stainless steel because of its higher
creep strength but is not as good as vanadium-base alloys. Niobium-base
alloys are markedly superior to vanadium-base alloys, but neutron
66
absorption effects preclude their use. They do offer the potential of
service at extremely high heat ratings if a better coolant such as Li
is used. Comparing the properties of Nb-1# Zr with type 304 stainless
steel, one begins to see why a number of carbide pins with 1Tb—1$ Zr
cladding survived irradiation to burnups beyond 10$, whereas sister
pins clad with stainless steel failed.9
Returning to our list of factors that might limit the allowable
heat rating for sodium-cooled pins, we see that the next factor listed
is film-boiling of sodium bond. As stated earlier, this factor sets a
design limit of 600 w/cm2 at the fuel-cladding interface. Since the
pressure within a fuel pin will increase with increasing burnups, this
process becomes less likely with increasing burnup. Against the reduced
chance of boiling there exists a corresponding hazard that a pinhole
will develop in the bottom of a pin and that gas pressure will blow the
Na out of the capsule. This process could lead to overheating of the
fuel and rapid swelling until the fuel-cladding gap closes. At this
point the fuel will cool somewhat, but the contact resistance to heat
conduction will result in a higher temperature drop across the interface
than will exist with sodium bonding.
Excessive swelling of the fuel is the next factor to be considered
to establish the maximum allowable heat rating. This limit will be
reached earlier for gas-bonded pins than for sodium-bonded pins. The
effect may be lessened by use of low density fuel, dished pellets, or
annular pellets, but there are insufficient data at this time to
assess this problem. This will receive major attention in our program.
The last item, melting of the cladding, will occur before carbide
or nitride fuels will melt. It will probably be caused by loss of
coolant either due to sodium boiling or to flow constriction. Because
of their high thermal conductivities, carbide or nitride fuels will
probably be much more forgiving than oxide fuel. Transient tests in
TREAT will be required to demonstrate this design advantage.
9A. Strasser et al., "Uranium-Plutonium Carbide Fuels for Fast Breeder Reactors," paper presented at the American Nuclear Society National Topical Meeting, "Fast Reactor Technology," Detroit, Michigan, April 26-28, 1965.

67
3. FISSION-GAS RELEASE AND PHYSICAL PROPERTIES OF FUEL MATERIALS DURING IRRADIATION
0. Sisman
The purpose of this work is to measure the parameters that control
the release of fission gas from highly characterized nuclear fuels.
These parameters are evaluated in terms of a generalized model to pre-
dict release from operating fuel materials. Thermal diffusivity is
measured in-reactor in analogous experiments.
Effect of Fission Density on Release of Fission Gas from Enriched Single-Crystal UO2 Spheres
R. M. Carroll R. B. Perez
Irradiation and evaluation have been completed.1
Determination of Amount of Nonfission Heating Required for In-Reactor Thermal Diffusivity Measurements
R. M. Carroll R. B. Perez
The total amount of heat generated in a fuel specimen during
irradiation is the sum of the fission heating plus the heating caused by
beta, gamma, and neutron scattering and absorption. To determine the
thermal diffusivity of fuels during irradiation, it is necessary to
know the heat generation from all sources.
We made an experimental determination of the nonfission heating in
the C-l position of the ORR reactor. The apparatus (see Fig. 3.1) and
experimental methods used have been reported.2 The time-temperature
response for the copper slug and the brass holder have been fed into a
computer program, and we have found that a curve of the form
T(t) = A — Ai e"~ = time rate of temperature rise , (3.1)
1R. M. Carroll, 0. Sisman, and R. B. Perez, Nucl. Sei. Eng. 32(3), 430-431 (1968).
2R. M. Carroll et al., Fuels and Materials Development Program Quart. Progr. Rept. June 30, 1968, 0RNL-4330, pp. 57-58.

68
gives a good fit. We found that transients produced by sudden movement
or change in cooling rate would obscure the results unless the computer
analysis was started from 20 to 100 sec after the capsule was perturbed.
Each test produced transients of different time durations. For each test,
ORNL-DWG 68-2205R
SWEEP GAS IN
THERMOCOUPLE LEADS
AIR OUT
SWEEP GAS OUT
POSITIONING TUBE
THERMOCOUPLES
SPRING LOADED NEEDLE SUPPORT BRASS HOLDER
COPPER SPECIMEN
NEEDLE SUPPORT
SPECIMEN CAPSULE
Fig. 3.1. Capsule for Measurements of Nonfission Heating
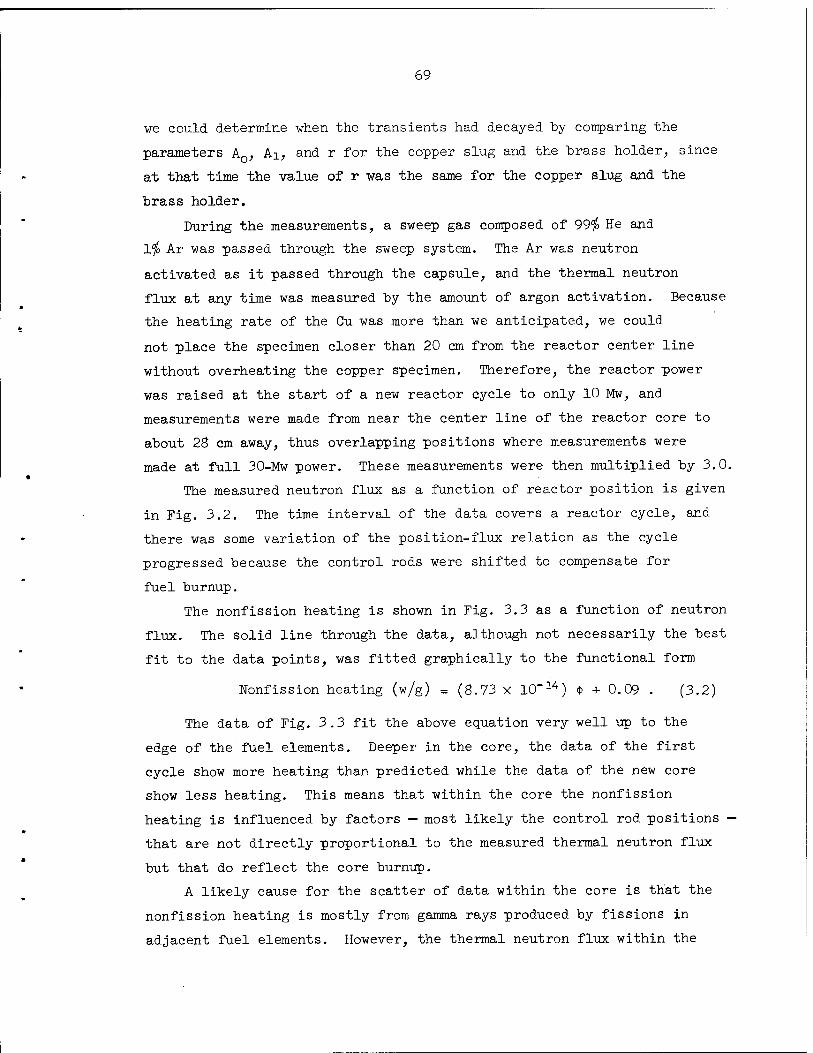
69
we could determine when the transients had decayed by comparing the
parameters AQ, Ai, and r for the copper slug and the brass holder, since
at that time the value of r was the same for the copper slug and the
brass holder.
During the measurements, a sweep gas composed of 99$ He and
1$ Ar was passed through the sweep system. The Ar was neutron
activated as it passed through the capsule, and the thermal neutron
flux at any time was measured by the amount of argon activation. Because
the heating rate of the Cu was more than we anticipated, we could
not place the specimen closer than 20 cm from the reactor center line
without overheating the copper specimen. Therefore, the reactor power
was raised at the start of a new reactor cycle to only 10 Mw, and
measurements were made from near the center line of the reactor core to
about 28 cm away, thus overlapping positions where measurements were
made at full 30-Mw power. These measurements were then multiplied by 3.0.
The measured neutron flux as a function of reactor position is given
in Fig. 3.2. The time interval of the data covers a reactor cycle, and
there was some variation of the position-flux relation as the cycle
progressed because the control rods were shifted to compensate for
fuel burnup.
The nonfission heating is shown in Fig. 3.3 as a function of neutron
flux. The solid line through the data, although not necessarily the best
fit to the data points, was fitted graphically to the functional form
Nonfission heating (w/g) = (8.73 X 10"1A) 4> + 0.09 . (3.2)
The data of Fig. 3.3 fit the above equation very well up to the
edge of the fuel elements. Deeper in the core, the data of the first
cycle show more heating than predicted while the data of the new core
show less heating. This means that within the core the nonfission
heating is influenced by factors — most likely the control rod positions -
that are not directly proportional to the measured thermal neutron flux
but that do reflect the core burnup.
A likely cause for the scatter of data within the core is that the
nonfission heating is mostly from gamma rays produced by fissions in
adjacent fuel elements. However, the thermal neutron flux within the
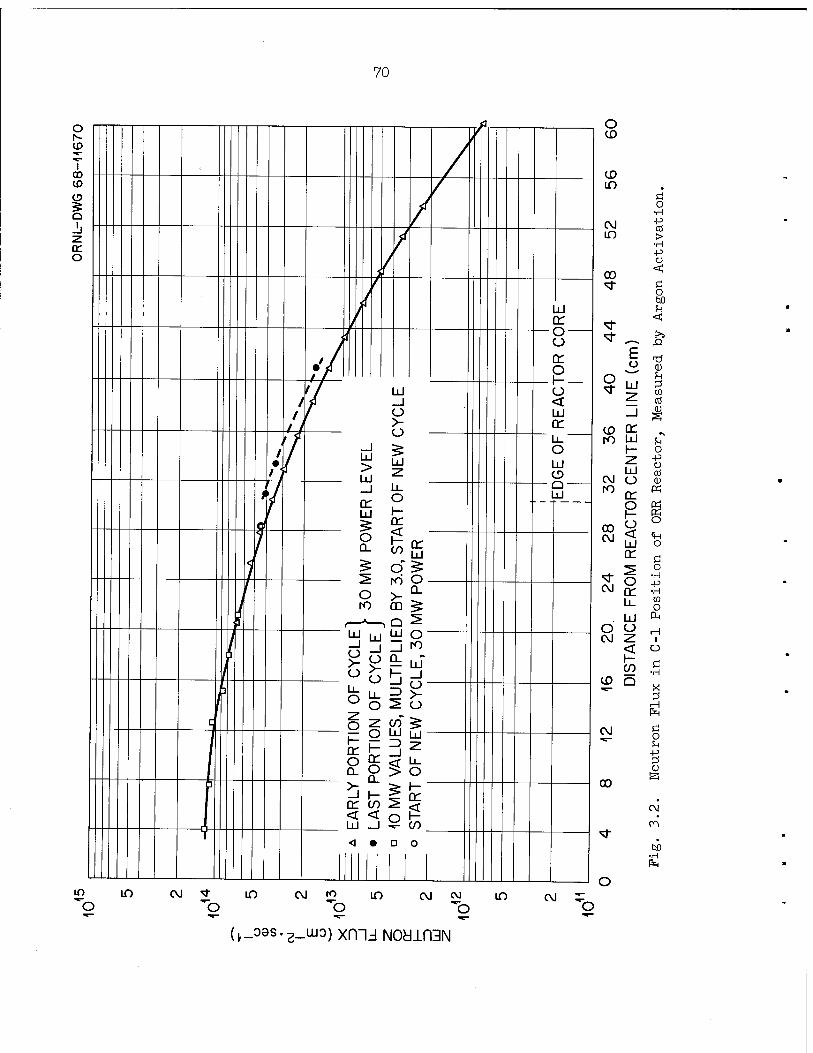
70
o —
T CO — ID
% Q
1. -J ■z. cc o
•7 / /
— O CJ
or: o f-
< LU or
I i
(J ÜJ _l CJ >- o
_l li- ar £ £ fe
°- Eg £ o£ ^ to o- o >- °- ro QQ ^
LU W O-
^ i >■ o 2 CJ z w$ O LU [j-
i= 3 z
£ < LJ-
/ • /J
' /
(
D jj
t
1 3 jj
ÜJ _l CJ >- o
Cj
U. o -z. o 1-
O 0_
< ÜJ LA
ST 1
10
MW
h- or
CO
.
T
.
< • c D o
o CD
CD in
CD Or to UJ
H
CM (J ro ^
P CJ < UJ QT
CO CM
CM
O CO
CD
CJ
CO
O or u. UJ CJ
CO O
o
CM % U) >
•H ■P O
00 <
*- Ö O W) IH
^1- sl- ^_, ^3
E o 11
o <*- Ul
2
u w CO
_l M u o -p o CO
«
o s o
•H -P •H w o
H I
o Ö
•H
X
Ö o
CM
bo •H
lO If) CM *■ m CM K) m CM pj
"b ~b Ij in CM ^_
(J_09S.Z_UJO) Xfll3 NOUlfBN

71
r-
i CO CO
CD
o I
tr o
CD O Ö +
5" 5 'o X
UJ _i o
Ixl _1 o
ÜJ
00
II
o or o t-
>- O
or o
a: o o a: o h- o < ÜJ or u_ o
L±J CD Q UJ
CO
a 1 R
EA
C
RE
AC
T
:YC
LE
CD z: h- *R
LY
IN
\1E
IN
NE
W (
c
D 1
C I
< LÜ X
CD
ÜJ _l ( D CQ
■b LÜ UJ LÜ 1
1-3 -z. LÜ CO LÜ
CO
OLI
NG
ITIO
N
CH
AN
G
CO
OLI
NG
ITIO
N
CH
AN
G
CO
OLI
NG
, STö
rfW
MU
LTIP
LI
A' or a. LÜ 0T
\
o
v Ixl z. _l
* o E o * o < a. < a. < 2
1J
\
{ "*J
4
a lu
\ o
^O
lO
lO
"b lO CO lO C\J ro in CM CM
o lO
o o _ (t_o8s -2_uuo) xnu NOUIPGN IVI/\IU3H± ' <£
^~ (!) XI -p
4H
ro u Ü o
•H -P
CM •H
O a. H
1 ■^r- a> o ^~ \
in CD XI
H— -p o O s. S
-— •H
or X 3
UJ H n fe Ü) n
o i-1
c_) -P
z 2 00
(D
(1) E3
2 4-1 O
1- r- <
UJ O ■H
X -P C)
CO z o en to cd
lx W CO
lO ^ 3 o <_) z
•H
si- Ö
•H •P CO o
ro ö o
•H CQ
CM CO ■H 4H Ü O 0
CM =L
en en
bO k •H O fe -P
O CO CD K

72
capsule may not be proportional to the fission rate that is occurring
in the nearest fuel elements, which is several centimeters away. At a
distance from the core, the thermal neutron flux within the capsule
represents an average over a bigger portion of the core.
We can conclude that the nonfission heating above the reactor core
is well represented by Eq. (3.2). Even within the core, the measured
nonfission heating in Cu is given by Eg. (3.2) to within 25$ accuracy
if the reactor has been at power for at least one day.
Effect of Temperature, Fission Density, and Burnup on the Thermal Diffusivity and Fission-Gas Release of UN
R. M. Carroll J. G. Morgan
Three UN bushings (2.28 cm long, 0.649 cm in outer diameter, and
with a 0.252-cm-0D axial hole) were stacked in an A1203 holder and
irradiated at various temperatures and fission rates. At 200 to 1500°C
a total burnup of 0.31$ U and 9.8 X 10¹⁹ fissions/cm3 was attained.
The irradiation was begun at low temperatures and fission rates to
determine the surface release activated by recoil, since this is a
sensitive indication of surface area. Early in the irradiation, after
only A- x 1018 fissions/cm3 burnup at temperatures less than 600°C, we
detected a step increase of gas release that could only be caused by
cracking of the specimen. This was unexpected because of the low thermal
stresses, low temperatures, and low burnup.
When the UN specimen was irradiated at higher temperatures, we
found that the gas release behaved more like classical diffusion than
the trapping process that we usually observe in U02. The gas release
was proportional to the production rate and was an exponential function
of temperature with a 35 kcal/mole activation energy.
As irradiation progressed there were more and more step increases
of gas release, showing that cracking was occurring. At about 1300°C,
however, the gas release decreased with time, showing that some of the
cracks were healing. One would not expect cracks to heal at 1300°C
during irradiation unless the cracks were almost microscopic.
Each time the UN specimen was heated or cooled, there were large
bursts of gas release. Such a burst, when the specimen was cooled from
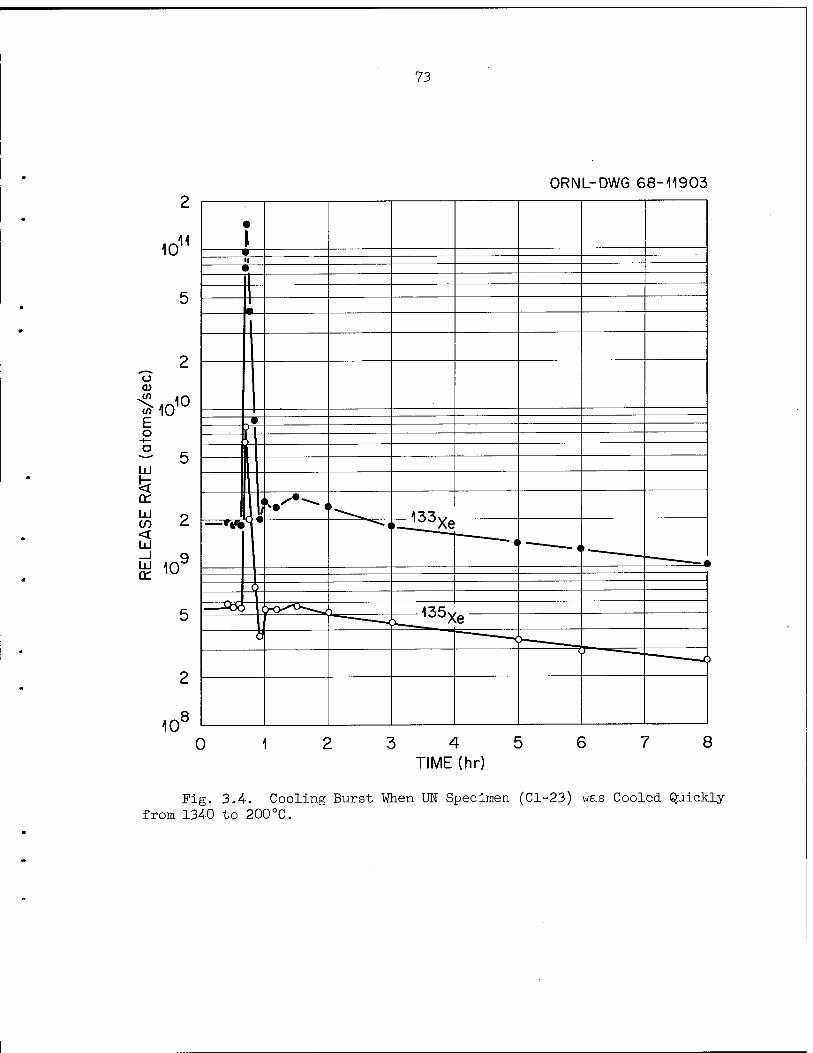
73
ORNL-DWG 68-11903
10 11
10
o
«MO E o
S 5
LÜ en <
2 =
£ 1Cr
10 8
0 3 4 5 TIME (hr)
7 8
Fig. 3.4. Cooling Burst When UN Specimen (Cl-23) was Cooled Quickly from 1340 to 200°C.
74
1340 to 200°C by withdrawing the specimen from the neutron flux, is shown
in Fig. 3.4. Just before withdrawal, the ratio of 133Xe to 135Xe was
about 3.5, the proper ratio for a diffusion process. During the cooling
burst, this ratio was about 17, indicating that trapped gas was suddenly
released. Thereafter, the gas release varied similarly for several
hours. One can conclude from this that the UN cracked during cooling
and that the liberated gas slowly escaped from the cracks for several
hours. The slow escape implies that many of the cracks were very small.
A sweep gas containing 0.5$ N2, 3$ H2, and 96.5$ He was used when
the specimen was at 1400.to 1500°C. We found, however, no significant
change in the gas-release characteristics whether or not the sweep gas
contained N2.
The irradiation has been terminated and the capsule opened in the
hot cells. The physical appearance of the UN was just as we predicted:
the pellets were nearly intact, but a fine network of cracks covered the
surface (see Fig. 3.5). We suspect that most of the gross breaking
occurred during the process of sawing the capsule open and removing the
pellets from their container. Metallographic examinations are in
progress that we hope will show whether there was a chemical cause for
the cracking of the UN pellets.
Thermal diffusivity data were taken at intervals but have not yet
been processed. In view of the cracking that occurred in the pellets,
it is doubtful if such data will have any real significance.
Effect of Temperature, Fission Density, and Burnup on the Fission-Gas Release from Sol-Gel (U0#80Fu0.20)02 Microspheres
R. M. Carroll H. E. Robertson
About 100 microspheres produced by the Chemical Technology Division
(batch PUM-4) were selected individually by microscopic examination.
After these were annealed at 1450°C in an atmosphere of Ar and 4$ He,
we selected 51 particles and placed them in a tungsten holder. The
particle diameters were determined by x-ray techniques to be 546 ± 17 \i.
This fuel is being held for future irradiation.

75
R-45300
»■r R-45501
(b)
Fig. 3.5. UN Pellets after Irradiation (Cl-23). capsule. (b) Center pellet of capsule.
(a) Top pellet of

76
Effect of Temperature, Fission Density, and Low Burnup on Fission-Gas Release from (U0.75PU0.25)02
R. M. Carroll H. E. Robertson J. G. Morgan
High-density (97$ of theoretical density) pellets of (U0.75PU0.25)02
were obtained from Pacific Northwest Laboratory. These pellets were
made to Fast Flux Test Facility specifications, but they have slightly
higher density. Two 0.54-cm-OD x 0.58-cm-long pellets with 0.127-cm-diam
axial holes were loaded into a tungsten holder and installed into a
capsule as described below. The irradiation has just begun, and the
initial data have not yet been evaluated.
A Technique for Handling PuQ2 Specimens Outside Glove Boxes (R. M. Carroll, H. E. Robertson)
We had the problem of loading a (u,Pu)02 specimen into a capsule
for an in-reactor experiment. The assembly techniques for the 20-ft-long
insert used in the experiment were developed over a period of years and
involve delicate hand operations on a bench assembly located in a
noncontamination area. We did not wish to attempt to assemble a
20-ft-long rig in a glove box or to change our successful assembly
techniques.
An alternative method was to apply a temporary coating on the
(U,Pu)02 specimen so that it could be handled without spreading plutonium.
Naphthalene was selected for the coating material because it has a low
melting point (80°C), forms a hard coating, is relatively nontoxic, and
yet can be vaporized without leaving a residue.
The (u,Pu)02 specimen consisted of two pellets described above. The
pellets were placed in a glove box and slid into a tungsten holder that
had been machined into a hollow cylinder 0.60 cm in inner diameter and
about 2.2 cm long with one end open and the other closed. A drill rod
was placed into the axial hole of the pellets so as to leave a hollow
space so that a thermocouple could later be inserted. Molten naphthalene
was then poured into the tungsten holder, covering the specimen and
77
filling the holder. The filled holder was then removed from the glove
box by the usual plastic-bagging method.
The contaminated glove box had contributed some activity to the
naphthalene coating, so the specimen was removed from the bags in a
relatively clean toxic hood and redipped in a series of four baths of
clean naphthalene. This resulted in a very slightly contaminated outer
coating with the contamination firmly fixed. The dipped specimen was
stored in a closed bottle containing naphthalene crystals to prevent the
coating from evaporating before installation in the capsule.
The specimen was loaded into the capsule by the usual techniques.
A portable hood and constant monitoring were used, but only surgical
gloves and laboratory coats were used to protect personnel. The central
rod was extracted from the capsule by twisting it until the naphthalene
bond was broken. Surprisingly, this released no contamination.
After the capsule was assembled, a weld was made within 1 in.
of the coated specimen. We kept the naphthalene from melting by cooling
the capsule between short welding periods. The welding required a
continuous purge of Ar over the interior of the assembly, and there
was some concern that this might cause loose contamination to be carried
out into the room. There was no detectable release, however.
After the welding was completed, the assembly was evacuated, and
the capsule was warmed to about 80°C. The warming and pumping was
continued overnight. Bench tests had shown this to be more than
sufficient time to ensure evaporation of the naphthalene. A filter was
placed in the pump line to see if any Pu was released during the
evaporation of the naphthalene.
Through the entire operation, no contamination was detected on any
of the equipment, the handling gloves, or the tools. Air monitors
placed very close to all operations detected no activity. All smears
and filter readings had zero count level.
The ease of applying and removing naphthalene suggests that it
might serve as a protective coating for many types of specimens,
especially those of a friable nature, during handling and storing.
78
Fission-Gas Release Studies on Fine-Grained High-Density Spheres of (U,Pu)C>2
Specimens have been obtained from Battelle-Northwest.
79
4. ZIRCONIUM METALLURGY
P. L. Rittenhouse
The object of this program is to optimize the properties of zirconium
alloy tubing used in nuclear reactors by study of fabrication procedures
and their interaction with crystallographic deformation modes. Rather
than following the usual practice of designing fuel element cladding on
the basis of minimum strength values, we are attempting to control the
crystallographic texture in the tubing to permit the strongest direction
in the tubing to be matched against the highest service stress. This
technique can also be used to control the orientation of potentially
embrittling hydride platelets that form from absorption of H2 that is
released by corrosion. Success in this program can reduce the cost of
producing nuclear power by making possible longer core life, higher
operating temperature, and the use of tubing with thinner walls.
Fabrication and Texture Control of Zirconium Tubing
T. M. Nilsson
We have now planned in detail a total of twelve schedules for the
manufacture of Zircaloy tubing. Four schedules in which the reduction to
final size (0.59-in. outside diameter X 0.52-in. inside diameter) occurs
by tube reducing alone have been finished and are being examined and
evaluated. Grain sizes in some of the finished tubes are shown in
Table 4-.1. In addition, grain sizes for two of the intermediate sizes
of tubes (3-3a and 5-3a) are given. The table also shows parameters
that might influence the grain size. Clearly, the only important param-
eter is the amount of cold work. The reduction in area before annealing
must be > 20$, but < 54/o, to obtain fine-grained tubing. Neither reversing
the lead ends of tubing in successive passes nor varying the Q-number
(i.e., ratio of wall reduction to diameter reduction) seems important.

80
Table 4.1. Grain Size of Tube-Reduced and Annealed Zircaloy-4 Tubing
Tube Out s ide Diameter (in.)
Last Pass Direction
ASTM Grain Size
Schedule Reduction Number Number in Area Q-Number Sequence
I 2-402a 0.591 54 0.91 F-F-F 9
6-16 0.591 54 0.91 F-F-R 9 1/2
6-3 0.591 54 0.91 R-R-R 9 1/2
II 3-3a 0.635 73 1.49 F-F 10
3-4a 0.591 20 2.06 F-F-F 7 1/2
5-3a 0.635 73 1.49 F-F 9 1/2
5 -4a 0.591 20 2.06 F-F-F 5 1/2
6-2 0.591 20 2.06 F-F-R 7
6-4 0.591 20 2.06 R-R-R 7
III 4-40la 0.587 65 1.44 F-R-F 9
4-40lb 0.587 65 1.44 F-R-R 9
4-3 0.587 65 1.44 F-F-F 9
IV 7-101 0.592 18 1.81 F-F-F 7 1/2
7-102 0.592 18 1.81 F-R-R 7 1/2
7-103 0.592 18 1.81 F-R-F 7 1/2
a Q = wall reduction/diameter reduction.
F indicates that the front end of the extrusion the tube reduction. R indicates that the rear of the lead end.
was the lead end in extrusion was the
In addition to the four tube-reduced materials, three other schedules
have been completed. These schedules started with tube-reduced tubing of
intermediate size (0.636-in. outside diameter X 0.540-in. inside diameter)
and were processed to final size (0.59-in. outside diameter x 0.52 inside
diameter) by either swaging, planetary swaging, or cold drawing. The
reduction in area, about 40$, was accomplished in four equal steps with
intermediate anneals at 730°C for 2 hr. In the drawing schedule we also
reversed lead ends between passes. In each case, most of the reduction
is by wall thinning.
81
Three of the five remaining schedules will be cold drawn
from tube-reduced material of the following sizes:
0.886-in. outside diameter X 0.786-in. inside diameter, 0.886-in.
outside diameter X 0.736-in. inside diameter, and 0.886-in. outside
diameter X 0.576-in. inside diameter. The other two schedules will
reduce material to final size from 0.886-in. outside diameter X 0.786-in.
inside diameter by swaging and planetary swaging. The deformation in
these last five schedules will be primarily sinking (i.e., little wall
thinning). The schedules are planned so that the tubes are annealed for
2 hr at 730°C after every 20$ reduction (two passes).
Texture Effects', Texture Development, and Anisotropy of Properties
D. 0. Hob son E. Tenckhoff
Circumferential Texture Variations in Zircaloy Tubing (D. 0. Hobson)
Efforts continue in the examination of fabricated tubing to deter-
mine the causes of texture variations. We have examined tubing fabri-
cated by the special procedures described by Nilsson and Rittenhouse,1
and have obtained concise texture and texture variation data on this
material from the forged billet to the finished tubing. We have found
several instances of large variations in the fabricated tubing. These
variations could be ascribed to a number of incidents in the history of
the tubing including improperly shaped dies, the ratio of tube feed to
tube rotation during reduction, and the amount of wall reduction relative
to diameter reduction. Changes of 400$ in radial basal pole intensity,
based on values of random intensity, have been found at some stages of
the tubing reduction schedule and were directly attributable to the bad
dies, the markings on the tube surfaces corresponding closely to the
observed intensity maxima. These large variations are of interest since
we have found that a variation of 100$, again based on random intensity,
produced large diametral strain variations around the circumference of
a tube tested in tension.
■""T. M. Nilsson and P. L. Rittenhouse, Fuels and Materials Develop- ment Program Quart. Progr. Rept. June 30, 1968, 0RNL-4330, pp. 59-60.
82
Although individual texture variations existing in the forging
from which the extrusion billets were machined and variations found in
the tube shells after extrusion could not be followed during further
fabrication steps, it is unquestionable that they affected the textures
formed during the final steps of tube reduction. We found, though, that
the major part of the variation was directly attributable to the pro-
cedures used for tube reduction.
Texture Gradients in Thin-Walled Zircaloy Tubing (E. Tenckhoff)
These examinations have been continued in greater detail for
several especially interesting tubes. Basal (0002) and prism {1010}
pole figures for Zircaloy-2 tubing were determined after extrusion and
after final reduction (ball swaging and tube reduction) on different
layers of the tube wall. In tubing fabricated to the same size from
extrusion billets of identical dimensions, different processing condi-
tions (predominant reduction in diameter, R^, or in wall thickness, R^)
cause markedly different final textures. Figures 4.1 and <4.2 show, respec-
tively, the influence of predominant R^ and predominant R^ on the develop-
ment of texture and the texture gradients across the wall thickness.
The angle between the radial and tangential directions on a (0002) pole
figure, $, is shown on the abscissa. The ordinate gives the ratio of
measured intensity, ^/QOOPV to the randoTn intensity of a powder sample,
I/QQQ21« The third axis gives the position in the wall of the tube.
The results of these studies can be summarized as follows.
1. Predominant R^ leads to a split of basal poles with a tilt
angle, \|/, (the angle, measured from the radial toward the tangential
direction, at which the maximum basal pole intensity occurs) of about
±60°. Heavy R^ centers the basal poles with the \|r between 0 and
30 to 40°. In practical tube reduction these effects are in competition.
2. Predominant R^ also leads to a texture gradient across the wall
thickness. This does not appear after predominant R^.
3. Essentially similar textures are formed by tube reducing and
ball swaging with high R^.

83
4. Because of possible texture gradients, a single texture
measurement — regardless of the layer it is taken from — does not
necessarily give a representative texture.
ORNL-DWG 6B-J082BR
Inner Surface
<p (deg.)
Fig. 4.1. Basal Plane Intensity Distribution Over the Wall Thickness of Tube 11W. Tube reduced to 58$ reduction in area, R^ = 40$,
ORNL-DWG 68-I08Z6R
GO 90 Inner Surface
<f) (deg.)
Fig. 4.2. Basal Plane Intensity Distribution Over the Wall Thickness of Tube 10W. Tube reduced to 58^0 reduction in area, R^ = 25$,
PART II
COOLANTS
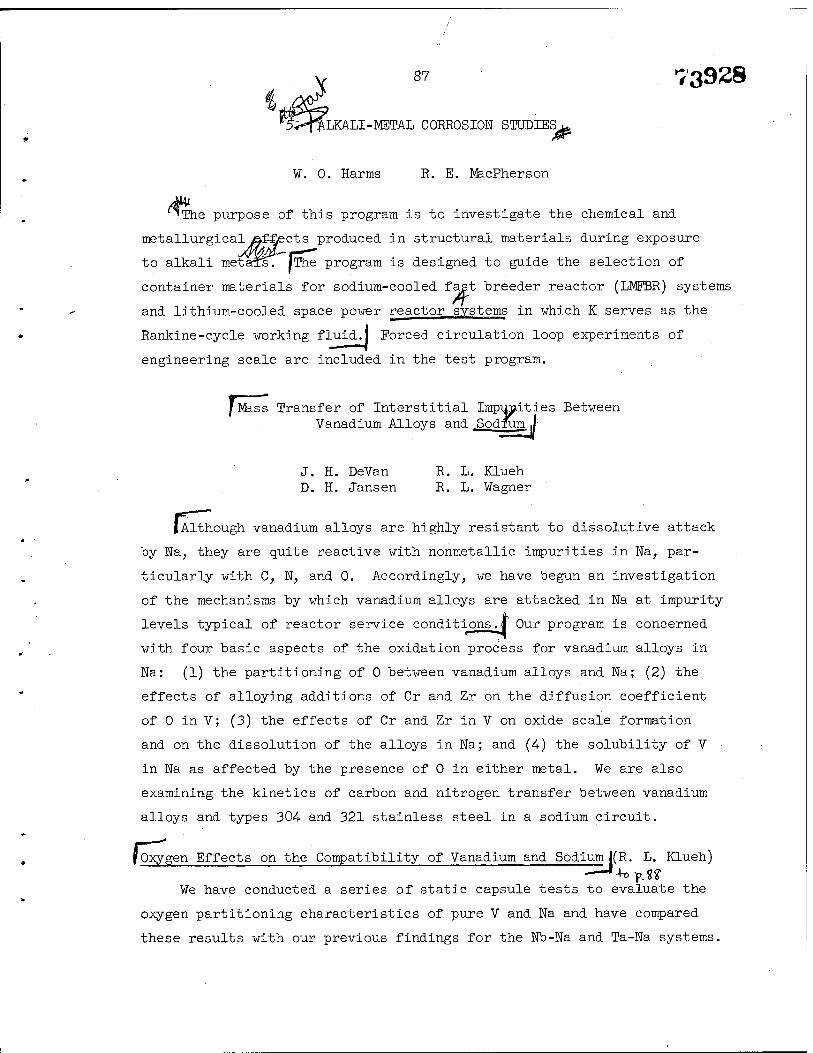
87 73928
LKALI-METAL CORROSION STUDIES
W. 0. Harms R. E. IVkcPherson
The purpose of this program is to investigate the chemical and
metallurgical /effects produced in structural materials during exposure
to alkali metail. iThe program is designed to guide the selection of
container materials for sodium-cooled faßt breeder reactor (LMPBR) systems
and lithium-cooled space power reactor systems in which K serves as the
Rankine-cycle working fluid.] Forced circulation loop experiments of
engineering scale are included in the test program.
'jfess Transfer of Interstitial Implicities Between Vanadium Alloys and Sodium .1
J. H. DeVan R. L. Klueh D. H. Jansen R. L. Wagner
lAlthough vanadium alloys are highly resistant to dissolutive attack
by Na, they are quite reactive with nonmetallic impurities in Na, par-
ticularly with C, N, and 0. Accordingly, we have begun an investigation
of the mechanisms by which vanadium alloys are attacked in Na at impurity
levels typical of reactor service conditions.J Our program is concerned
with four basic aspects of the oxidation process for vanadium alloys in
Na: (1) the partitioning of 0 between vanadium alloys and Na; (2) the
effects of alloying additions of Cr and Zr on the diffusion coefficient
of 0 in V; (3) the effects of Cr and Zr in V on oxide scale formation
and on the dissolution of the alloys in Na; and (4-) the solubility of V
in Na as affected by the presence of 0 in either metal. We are also
examining the kinetics of carbon and nitrogen transfer between vanadium
alloys and types 304 and 321 stainless steel in a sodium circuit.
foxyj gen Effects on the Compatibility of Vanadium and Sodium j(R. L. Klueh)
We have conducted a series of static capsule tests to evaluate the
oxygen partitioning characteristics of pure V and Na and have compared
these results with our previous findings for the Nb-Na and Ta-Na systems.

88
This comparison was of interest because of the much greater solid
solubility of 0 in V than in Ta or Nb.
[The experimental system used for these studies consisted of a
vanadium specimen in contact with Na in a vanadium containerf The cap-
sule, pictured in Fig. 5.1, was made from 0.75-in.-0D x 0.63-i£-ID
seamless tubing, and the end caps and specimens were made from 0.060-in.-
thick sheet. The results of chemical analysis of the vanadium components
are presented in Table 5.1.
ORNL-DWG 64-7H5RA
0.065-in. WALL TYPE 304 STAINLESS STEEL PROTECTIVE CONTAINER
0.049-in. WALL VANADIUM CAPSULE
0.004-in. TANTALUM FOIL LINER
ARGON
SODIUM
VANADIUM SPECIMEN (0.50 x 1.0 x 0.04 in.)
Fig. 5.1. Schematic Drawing of Corrosion Test Capsule Used to Study Oxygen Effects in Vanadium-Sodium Systems.
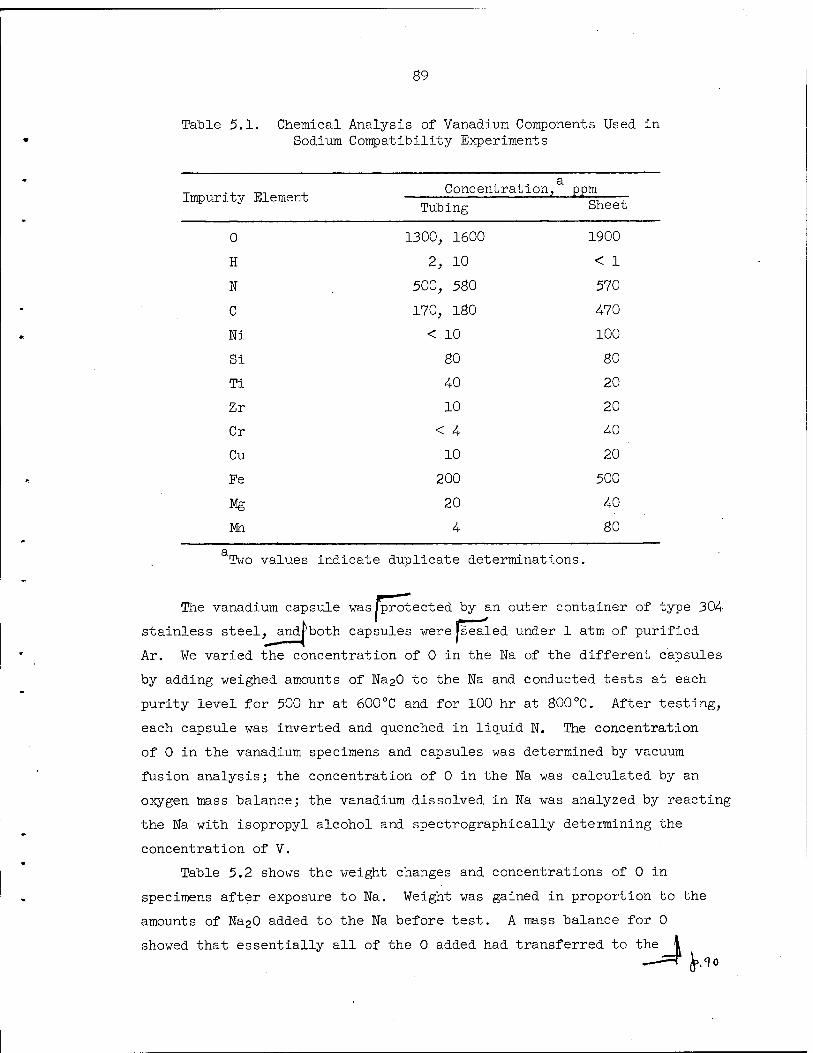
Table 5.1. Chemical Analysis of Vanadium Components Used in Sodium Compatibility Experiments
.,,,-, j_ Concentration, ppm Impurity Element z— 0,—r
Thihinff Sheet Tubing
0 1300, 1600 1900
H 2, 10 < 1
N 500, 580 570
C 170, 180 470
Ni < 10 100
Si 80 80
Ti 40 20
Zr 10 20
Cr < 4 40
Cu 10 20
Fe 200 500
Mg 20 40
Mi 4 80
Two values indicate duplicate determinations.
The vanadium capsule was/protected by an outer container of type 304
stainless steel, andrboth capsules were[sealed under 1 atm of purified
Ar. We varied the concentration of 0 in the Na of the different capsules
by adding weighed amounts of Na20 to the Na and conducted tests at each
purity level for 500 hr at 600°C and for 100 hr at 800°C. After testing,
each capsule was inverted and quenched in liquid W. The concentration
of 0 in the vanadium specimens and capsules was determined by vacuum
fusion analysis; the concentration of 0 in the Na was calculated by an
oxygen mass balance; the vanadium dissolved in Na was analyzed by reacting
the Na with isopropyl alcohol and spectrographically determining the
concentration of V.
Table 5.2 shows the weight changes and concentrations of 0 in
specimens after exposure to Na. Weight was gained in proportion to the
amounts of Na20 added to the Na before test. A mass balance for 0
showed that essentially all of the 0 added had transferred to the 4 fr.io
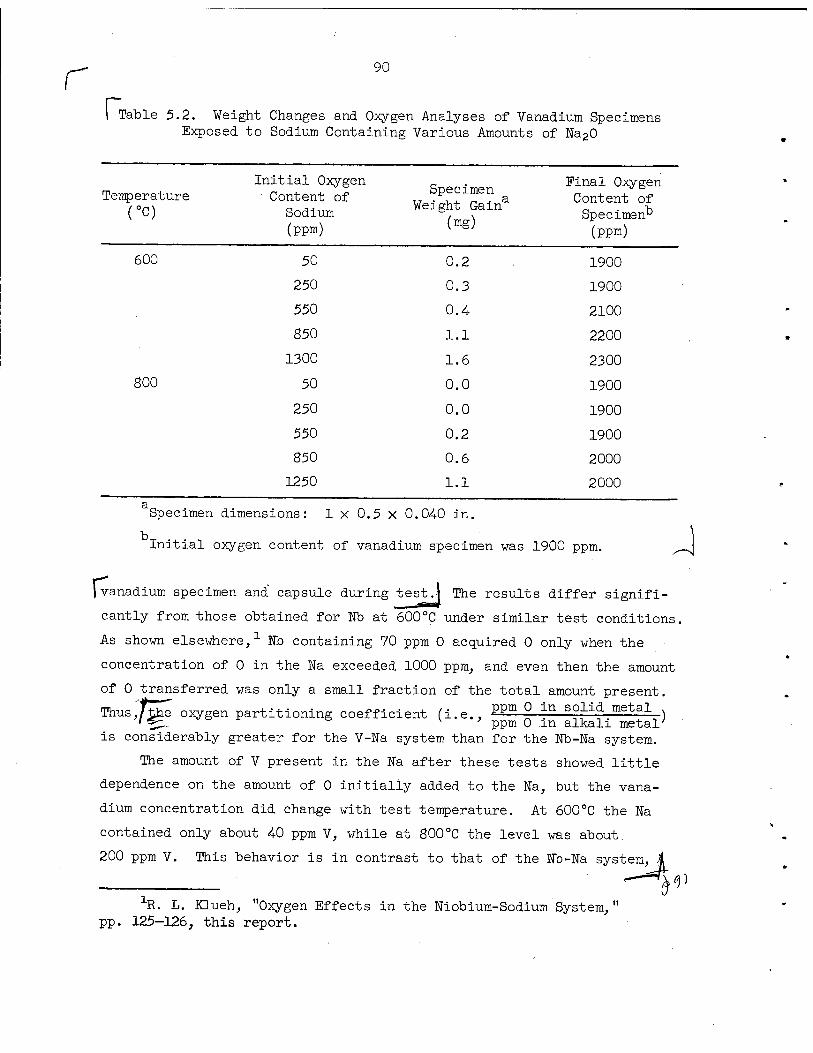
r 90
n Table 5.2. Weight Changes and Oxygen Analyses of Vanadium Specimens Exposed to Sodium Containing Various Amounts of Na20
Temperature (°C)
Initial Oxygen Content of Sodium (ppm)
Specimen Weight Gain
(mg)
Final Oxygen Content of Specimen*3
(ppm)
600
800
50
250
550
850
1300
50
250
550
850
1250
0.2
0.3
0.4
1.1
1.6
0.0
0.0
0.2
0.6
1.1
1900
1900
2100
2200
2300
1900
1900
1900
2000
2000
Specimen dimensions: 1 x 0.5 X 0.04-0 in.
Initial oxygen content of vanadium specimen was 1900 ppm.
fr- vanadium specimen and capsule during test.) The results differ signifi-
cantly from those obtained for Nb at 600°C under similar test conditions.
As shown elsewhere,1 Nb containing 70 ppm 0 acquired 0 only when the
concentration of 0 in the Na exceeded 1000 ppm, and even then the amount
of 0 transferred was only a small fraction of the total amount present.
Thus,/the oxygen partitioning coefficient (i.e., PPm 0 lri solid metal , ' ^. v ' ppm 0 .in alkali metal'
is considerably greater for the V-Na system than for the Nb-Na system.
The amount of V present in the Na after these tests showed little
dependence on the amount of 0 initially added to the Na, but the vana-
dium concentration did change with test temperature. At 600°C the Na
contained only about 4-0 ppm V, while at 800 °C the level was about
200 ppm V. This behavior is in contrast to that of the Nb-Na system, )
1R. L. KLueh, "Oxygen Effects in the Niobium-Sodium System, " pp. 125-126, this report.

91
I in which metal concentrations in the Na increase sharply with additions
of 0 to Na (ref. 1). This further indicates that the 0 added to Na was
rapidly gettered by the vanadium capsule and specimen.
One further distinction between Nb and V concerns the effect of the
initial concentration of 0 in the refractory metal on its attack by Na.
At concentrations as high as those initially present in our vanadium
samples (1600 to 1900 ppm 0), Nb and Ta at 600°C undergo rapid intergran-
ular attack by Na. Vanadium samples in these tests, however, showed no
evidence of attack by Na. We believe this difference in behavior reflects
the difference in the solid solubility of 0 in the two materials. At
600°C, 1900 ppm 0 in Nb is above the solubility limit, whereas this level
is only about 20$ of the solubility limit of V. j i
Interstitial Mass Transport Between Type 300 Series Stainless Steels and Vanadium Alloys (J. H. DeVan, D. H. Jansen)
Shown in Fig. 5.2 is the design we have adopted for a thermal con-
vection loop to evaluate the transport rates of N and C between vanadium
alloys and stainless steels in a sodium circuit. Heated portions of the
loops are being constructed of V or its alloys, and the isothermal and
cooled portions are of either type 304- or 321 stainless steel.
Brazed bimetallic joints are used to couple the dissimilar loop sections.
Figure 5.3 shows the joint design, which is patterned after that used
for earlier Nb—1$ Zr—stainless steel bimetallic loop studies. Several
joints fabricated by this technique have been examined metallographically,
one after four thermal cycles between room temperature and 800°C. All
of the joints appeared sound, and all passed a leak check with a helium
mass spectrometer.
Lfess transfer rates and interstitial effects on mechanical proper-
ties will be monitored in these loop systems by means of insert specimens
placed in both the heated and cooled sections of the loop. The inserts,
shown in Fig. 5.4-, are small, round tensile specimens (l/8-in.-diam gage
section) that are joined end-to-end to form a continuous, concentrically
positioned rod running the entire length of each vertical loop section.
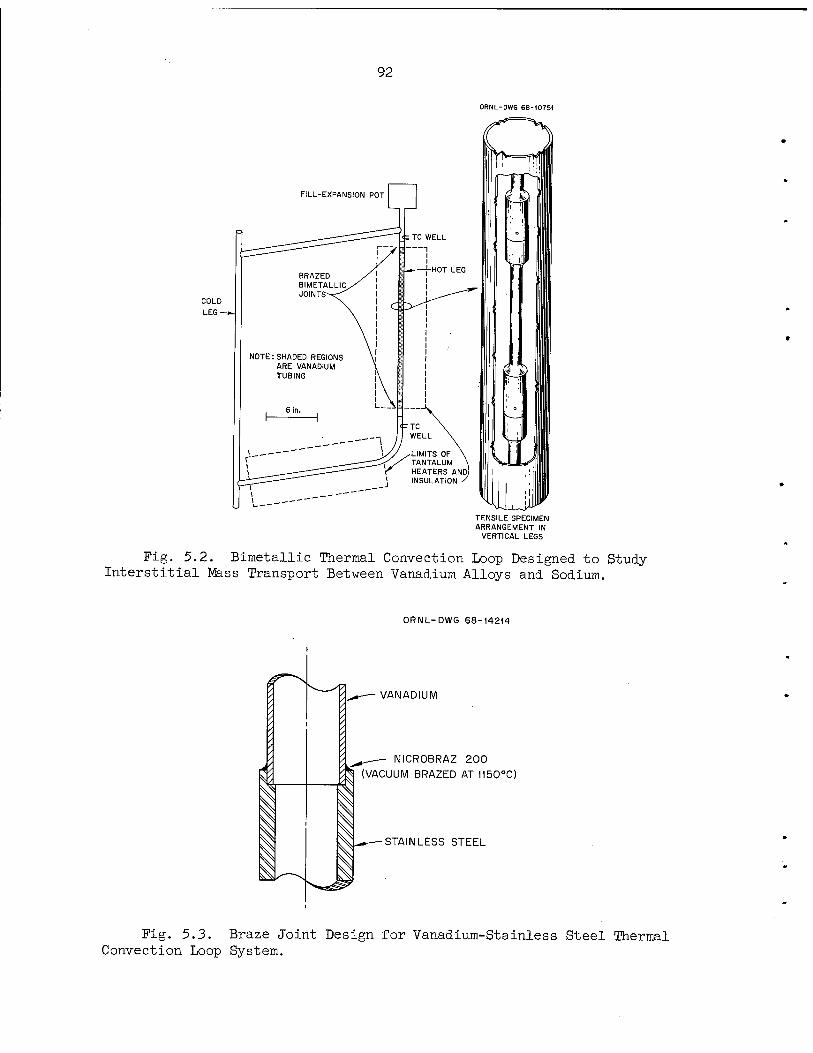
92
ORNL-DWG 66-10751
COLD LEG-
TENSILE SPECIMEN ARRANGEMENT IN VERTICAL LEGS
Fig. 5.2. Bimetallic Thermal Convection Loop Designed to Study Interstitial Mass Transport Between Vanadium Alloys and Sodium.
ORNL-DWG 68-14214
VANADIUM
NICROBRAZ 200 (VACUUM BRAZED AT 1150°C)
STAINLESS STEEL
Fig. 5.3. Braze Joint Design for Vanadium-Stainless Steel Thermal Convection Loop System.

93
Y-89772
Fig. 5.A-. Insert Specimen Designed for Bimetallic Thermal Convec- tion Loop Studies.
We have completed the fabrication of three loops with hot-leg
sections of pure V and cold-leg sections of type 304- stainless steel.
Two similar loops with type 321 stainless steel cold legs are also being
constructed. Operation of these loops is awaiting the fabrication at
ORNL of developmental V-Cr alloys and the delivery of Westinghouse
Vanstar alloys. Both types of materials will be used as insert specimens.
Interstitial Effects on Mechanical Properties of Vanadium Alloys (R. L. Wagner)
As discussed above, the pickup of interstitial impurities from Na
is a critical consideration in the development and use of vanadium
alloys for LMFBR cladding. Of special concern are the effects this con-
tamination may have on creep properties and the ductile-to-brittle
transition temperature of candidate alloys. For this reason, mechanical
properties rank very high in the list of effects to be evaluated in our
analysis of corrosion specimens.' To supplement this effort, we are also

94
planning investigations of the mechanical properties of specimens to
which contaminants have been added from a low-pressure (< 10~9 torr) gas.
This possibility was suggested in conjunction with absorption studies
that are under way to provide oxygen-doped vanadium samples for corrosion
testing. We plan to correlate the creep properties of alloys contaminated
with single impurities from a gaseous atmosphere with the effects on
creep brought about by corrosion exposures.
Data recently published by Hörz2 show that above 900°C engassing
kinetics for pure V in rarified 02 are controlled by the rate at which
02 arrives at the vanadium surface and that the reaction rate is there-
fore directly proportional to pressure. We are extending these findings
to temperatures of interest for our creep studies, 500 to 900°C.
Compatibility of Stainless Steel and Insulation in LMPBR Systems
A. P. Litman
This new task is a two-year effort designed to guide the selection
of containment piping and thermal insulation for LMPBR systems and is in
direct support of the Fast Flux Test Facility (FFTF). The structural
materials for the FFTF closed sodium loops, while not yet fixed, will
probably be types 304-, 316, or 321 stainless steel operating at 370 to
760°C. A question not yet factored into the criteria for selection of
materials for these loops is the extent to which the long-term oxidation
resistance of these stainless steels will be affected by interaction with
thermal insulating materials or a sodium leak. This task includes a
comprehensive study of the literature and tests of the compatibility of
stainless steels and thermal insulation in air and inert gas, with and
without the presence of Ha.
2G. Hörz, Z. Metallk. 59, 180 (1968).

95
Effect of Insulation on Oxidation of Stainless Steel (C. D. Bopp)
Years of experience have led to reliable insulation practices for
dynamic sodium systems constructed of stainless steels; but most of
this is highly empirical, and information is lacking in the areas of
long-term, cyclic, and transient effects.
Table 5.3 shows some of the typical insulation materials used at
ORNL and their chemical compositions, basically silica and alumina. The
insulations are generally manufactured by jet blasting a molten mixture
of minerals to produce relatively short ceramic fibers. Spinning pro-
duces longer fibers. By combining different lengths of fibers with or
without a binder by various techniques, manufacturers can produce papers,
blankets, felts, ropes, braids, boards, blocks, textiles, tubes, and
cast shapes. In addition to the materials detailed in Table 5.3, a wide
variety of more expensive insulations are available, suitable for LMPBR
service to 760°C. These include almost pure oxides [i.e., SiC>2 (Glas-
rock, MLn-K 1301, Refrasil, Astroquartz)], porous A1203, and porous
Zr02.
Oxidation and Catastrophic Oxidation of Stainless Steel. - The
resistance of stainless steels to mildly oxidizing conditions is well
known and is attributed to the protective nature of chromium-rich oxides
that form on the surface of the metal. Experience and examination of
available thermodynamic data indicate that in the temperature range of
interest, to 760°C, no reaction should occur between the oxides of Fe,
Cr, or Wi on stainless steel and pure alumina or silica. However, the
presence of low-melting and volatile oxides, S, and the halogens,
combined or in elemental form, can lead to catastrophic oxidation at
the interface between base metal and oxide. One of the possible causes
is believed to be the formation of liquid or semiliquid phases that
destroy the protective oxides. The result is the onset of extremely
rapid corrosion accompanied by the formation of voluminous corrosion
products. Numerous studies have demonstrated that oxidation occurs at
normal, often parabolic, rates up to the melting point of binary or
ternary eutectic mixtures (including the foreign substance). Above
these definite temperatures, oxidation occurs at a linear or accelerating

96
<D <D P co
CQ
03 <D H Ö
•H cd
-P CQ
o
0 to D
-p d (U CQ
CD U
CO •H u CD P
•H P
CO H
CO
in
0) H ^2
CO EH
■^1
w ■H
CQ
cd ö
cd ö
•H S o
*
o CM
CO
CM O •H EH
C1 O
<M
O C\! 0)
CM O
CQ
O CM
w
o a) o eg
cd cd O P .. .. cd o is;
•H . P H ti CO Ö 0) Ö
•H Ü H cd
CJ
CD p cd o •H H •H CD CQ
B <D 3 ^ •d fr
EH
cd
CD
cd
EH
<D Ü cd
EH
H
O
O
IT\
CV
O
CM vO H
O
H
d
H in
H O H m m to
m CM Nf NT
vo
><! CD in CD
CQ
-Ö
X cd &
CD
•rH
O o o
x CD H <H
s (D
cd
o o
I o
■e cd o
!»
CD U
P o cd
Ö
$
d ll
o I? -o Ö CO
o cd
CJ
O CM
<u
H cd P o
EH
cd
O o
x o o r-\ •H 13=
08
o o o
■3 PQ
TH <D
pi •p Ü cd
CH
g
P o
o
ft
cd
o o
CD H H •H
I CQ
a o
•H H
O CQ

97
rate and is catastrophic. There are several other mechanisms by which
oxidation may be accelerated by impurities. A common one is an increase
in the semiconductivity of the oxide film, which may enhance reactions
at the interface of oxide and gas.3 Another possibility is an increase
in the number of cation vacancies, although it has been shown that a
number of thermodynamic variables must be considered in this case.4
Though several postulates have been proposed to explain the actual
details of the corrosion mechanism(s), much disagreement still exists.
This is not surprising, since even the normal oxidation behavior of
stainless steels still has not been described by a unified mechanism.
Numerous examples of catastrophic oxidation have been reported,
including the corrosion of boiler tubes because of the presence of V or
Na in low-grade fuels and Na or S in the atmosphere. Water vapor in the
air has been found to aggravate this type of corrosion.5 Furnace manu-
facturers have long been plagued with extensive corrosion of heater
elements due to the presence of impurities such as PbO, M0O3, ¥03, V205,
Na20, Na2SO^, and NaCI in the furnace insulation. At ORNL, certain types
of Sauereisen cements containing Na2Si03 have produced catastrophic
oxidation of type 316 stainless steel at 760°C (Fig. 5.5).
Oxidation resistant alloys that are particularly susceptible to
catastrophic oxidation include types 316 and 317 stainless steel, 19-9 DL,
N-155, Refractaloy B, and 16-25-6 alloy. All of these alloys contain
Mo, and the 19-9 DL and N-155 alloys also contain 1 to 2$ W. Both Mo
and W form highly volatile, mobile oxides. It is believed that the
molybdenum oxide vapors that evolve on heating accumulate in stagnant
atmospheres cause catastrophic attack.
Experimental Approach. - Because of the short time allowed for this
portion of the program, our experimental approach for determining the
effect of insulation on the oxidation of stainless steel is reduced to
an investigation of whether various commercial thermal insulations will
3J. H. Eriken and K. Hauffe, Z. Physik. Chem. 59, 332 (1968). 4K. Hauffe, Oxidation of Metals, p. 304-, Plenum Press, New York,
1965. 5H. L. Logan, Corrosion 17, l85t (1961).
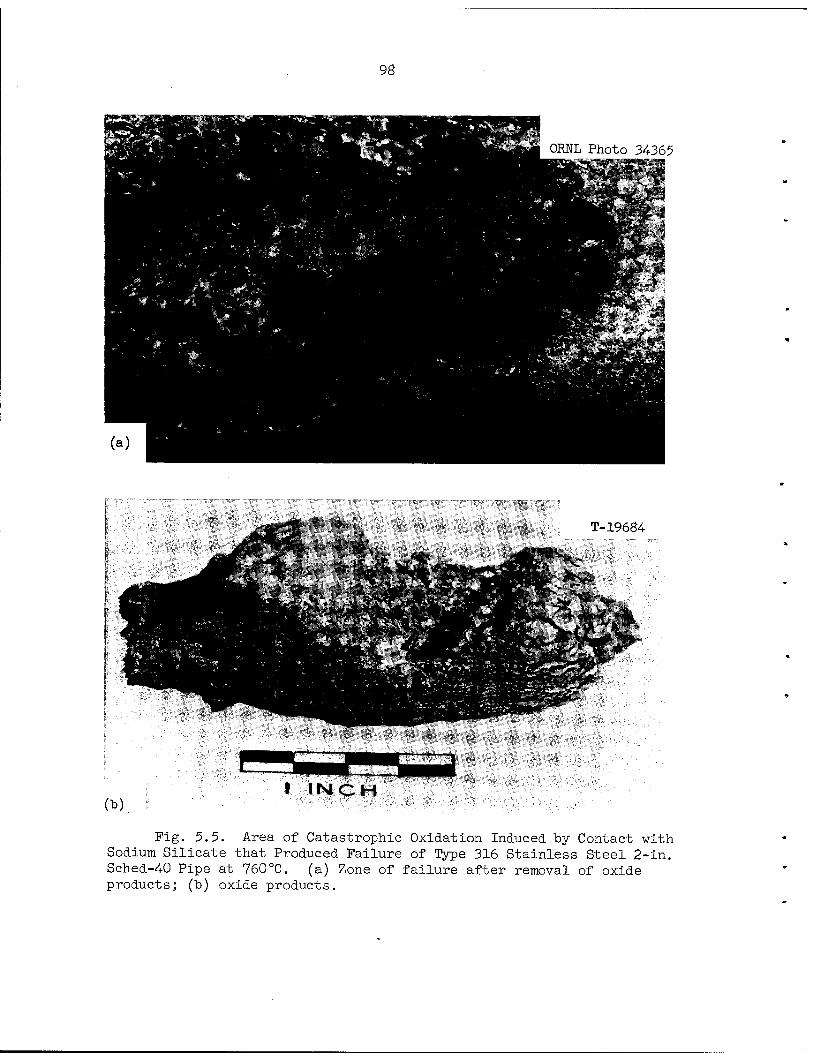
98
ORNL Photo 3-4365
19684
00 t INCH
Fig. 5.5. Area of Catastrophic Oxidation Induced by Contact with Sodium Silicate that Produced Failure of Type 316 Stainless Steel 2-in. Sched-4-0 Pipe at 760°C. (a) Zone of failure after removal of oxide products; (b) oxide products.
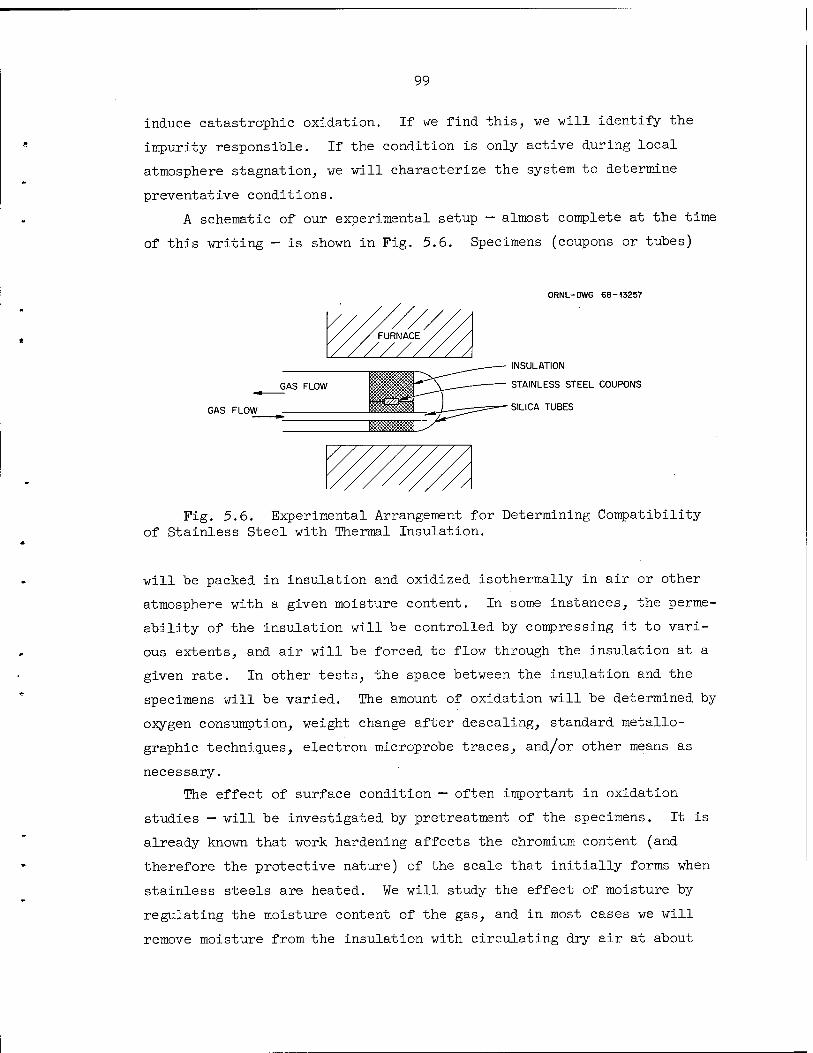
99
induce catastrophic oxidation. If we find this, we will identify the
impurity responsible. If the condition is only active during local
atmosphere stagnation, we will characterize the system to determine
preventative conditions.
A schematic of our experimental setup — almost complete at the time
of this writing — is shown in Fig. 5.6. Specimens (coupons or tubes)
ORNL-DWG 68-13257
GAS FLOW
INSULATION
STAINLESS STEEL COUPONS
SILICA TUBES
Fig. 5.6. Experimental Arrangement for Determining Compatibility of Stainless Steel with Thermal Insulation.
will be packed in insulation and oxidized isothermally in air or other
atmosphere with a given moisture content. In some instances, the perme-
ability of the insulation will be controlled by compressing it to vari-
ous extents, and air will be forced to flow through the insulation at a
given rate. In other tests, the space between the insulation and the
specimens will be varied. The amount of oxidation will be determined by
oxygen consumption, weight change after descaling, standard metallo-
graphic techniques, electron microprobe traces, and/or other means as
necessary.
The effect of surface condition — often important in oxidation
studies — will be investigated by pretreatment of the specimens. It is
already known that work hardening affects the chromium content (and
therefore the protective nature) of the scale that initially forms when
stainless steels are heated. We will study the effect of moisture by
regulating the moisture content of the gas, and in most cases we will
remove moisture from the insulation with circulating dry air at about
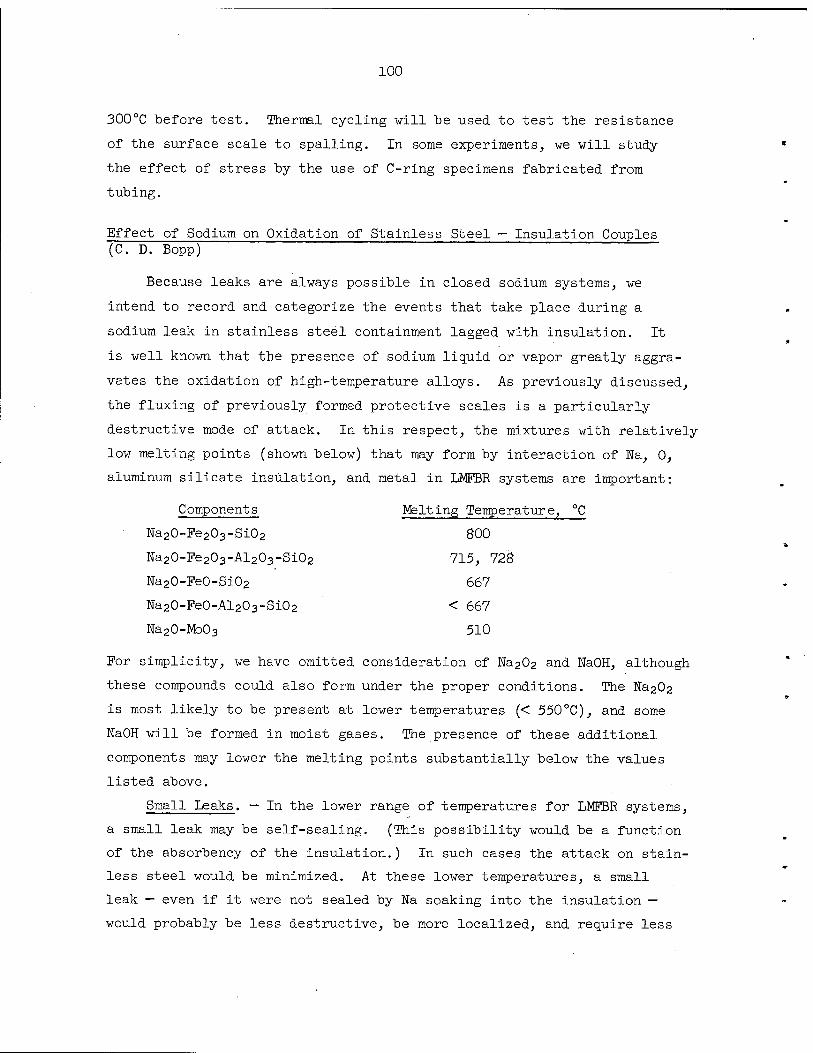
100
300°C before test. Thermal cycling will be used to test the resistance
of the surface scale to spalling. In some experiments, we will study
the effect of stress by the use of C-ring specimens fabricated from
tubing.
Effect of Sodium on Oxidation of Stainless Steel — Insulation Couples (C. D. Bopp)
Because leaks are always possible in closed sodium systems, we
intend to record and categorize the events that take place during a
sodium leak in stainless steel containment lagged with insulation. It
is well known that the presence of sodium liquid or vapor greatly aggra-
vates the oxidation of high-temperature alloys. As previously discussed,
the fluxing of previously formed protective scales is a particularly
destructive mode of attack. In this respect, the mixtures with relatively
low melting points (shown below) that may form by interaction of Na, 0,
aluminum silicate insulation, and metal in LMFBR systems are important:
Components Melting Temperature, °C
Na20-Fe203-Si02 800
Na20-Fe203-Al203-Si02 715, 728
Na20-Fe0-Si02 667
Na20-Fe0-Al203-Si02 < 667
Na20-Mo03 510
For simplicity, we have omitted consideration of Na202 and NaOH", although
these compounds could also form under the proper conditions. The Na202
is most likely to be present at lower temperatures (< 550°C), and some
NaOH will be formed in moist gases. The presence of these additional
components may lower the melting points substantially below the values
listed above.
Small Leaks. — In the lower range of temperatures for LMFBR systems,
a small leak may be self-sealing. (This possibility would be a function
of the absorbency of the insulation.) In such cases the attack on stain-
less steel would be minimized. At these lower temperatures, a small
leak — even if it were not sealed by Na soaking into the insulation —
would probably be less destructive, be more localized, and require less

101
extensive repair to the affected areas. In any event, corrosion will
be minimized if the leak is detected at the earliest possible moment
and the affected insulation is replaced.
We will examine the problem of small leaks with the test device
shown in Fig. 5.7. The leak is simulated by unplugging a small hole in
a stainless steel capsule containing Na. After a given time, the amount
of corrosion of the capsule is determined. Leakage will be studied in
Ar as well as in air, since the data for Ar will be applicable to instal-
lations where an inert cover gas is used. It is possible that in Ar the
Na may react with the insulation to produce products that corrode stain-
less steel, although in air it is likely that most of the corrosion will
be produced by NagO and Na2C>2.
ORNL-DWG 68-13256
SODIUM
STAINLESS STEEL CAPSULE
GAS FLOW
SMALL LEAK
INSULATION STAINLESS STEEL TUBES
Pig. 5.7. Experimental Setup for Evaluating the Effects of Small Sodium Leaks in Stainless Steel-Thermal Insulation Systems.
Large Leaks. — It is probable at higher temperatures in LMFBRs that
any leak will soon become a large leak. In order to test this and the
influence of various insulations in proximity to the leak, we are con-
structing the test device shown in Pig. 5.8. In order to simulate as
closely as possible LMFBR and FPTF conditions, we will heat the test pot
with an immersion heater. This will induce temperature gradients simi-
lar to LMFBR conditions. The sodium pressure against the leak (and the
sodium flow) will be maintained by inert gas pressure.
Leak Detection. — Early detection of leaks is important in LMFBR
systems, and continuous sampling of the air confined by the insulation

102
INERT PRESSURE
ORNL-DWG 68-13255 STAINLESS STEEL CLAD IMMERSION HEATER
SODIUM
STAINLESS STEEL TUBE
LARGE LEAK
INSULATION
Fig. 5.8. Schematic of Pot Test for Determining Effect of a Large Sodium Leak in Stainless Steel Containment Lagged with Thermal Insulation.
may accomplish this. There are several possibilities for the sensing
device for such a system, but perhaps a standard coulometric instrument6
sensitive to oxidizing vapors will prove satisfactory. We will investi-
gate the sensitivity of this method by using it to monitor the Na20
aerosol produced in some of the experiments already described.
Corrosion of Refractory Alloys in Lithium, Potassium, and Sodium
J. H. DeVan A. P. Litman ¥. R. Huntley
Auxiliary electrical or ion-propulsion requirements for space
vehicles necessitate power plants of high efficiency that will operate
at high temperatures. For these applications, nuclear power systems
have been proposed in which alkali metals are used to transfer heat,
drive a turbogenerator, and lubricate rotating components. Accordingly,
we are investigating the corrosion properties of candidate alkali metals,
DR. L. Chapman, Instr. Control Systems 41, 79 (1968)

103
primarily Li and K, -under conditions of interest for space applications.
Because of the relatively high temperatures (> 1000°C), the investigation
is concerned largely with refractory metal container materials.
ft/ {Compatibility of Boiling Potassium with Refractory Alloys ij -
Refluxing Capsule Experiments (J. R. DiStefano). — We have reached
a logical termination point in our study of the effects of refluxing
K on refractory metals. Accordingly, although two tests in operation
will be continued to 5000 hr, we plan no additional tests. A topical
report has been written7 covering all but the most recent tests, some
of which are discussed below. >
iwe have examined two W—26$ Re refluxing capsules which, as reported
last quarter,8 operated for 5000 hr at a boiler-condenser temperature
of 1250°C. The two capsules were of similar dimensions (0.86 in. outside
diameter X 0.040 in. wall thickness X 12 in. long), but one was fabri-
cated from a powder metallurgy product and the other from an arc-melted
ingot. Both were tested in the as-extruded condition.
Our examination of the powder-product capsule showed no measurable
corrosion effects in either the condenser or boiler sections. However,
the capsule fabricated from arc-melted materialjf as shown, in Fig. 5.9,
pTohtained a ring of crystalline deposit in the condenser section about
l/2 in. below the top end capjf Figure 5.10 shows the metallographic
appearance of the wall of this capsule at several positions along its
length. The deposit is clearly visible in the upper-left photomicro-
graph and is seen to be integral with the qondenser wall. The boiler
wall has undergone subsurface attack, the depth increasing with distance
down the boiler. [An electron-probe microanalysis of the deposit showed
it to consist of almost pure W.fl Results of the microprobe scan are shown
IP 101 7J. R. DiStefano, Refluxing Capsule Experiments with Refractory
Metals and Boiling Alkali Metals, ORNL-4-323, in preparation. 8J. R. DiStefano, Fuels and Materials Development Program Quart.
Progr. Rept. June 30, 1968, 0RNL-4-330, p. 82.

104
Y-87773
Fig. 5.9. Tungsten Ifess Transfer Deposit in Condenser Section of Arc- Melted ¥-26fo Re Capsule Containing Boiling Potassium for 5000 hr at 1250°C,
V, K \ f -fe>~—-V } .$...: >. 1
^Ä--tj. v- ><- tÄftl t>^r •*V'"V
■'-, ^ ,'•' 5".-_ riy i"
iX-. -^ . '.;■• - " :''•■■■
..—'N ,.**
.*L \ TOP OF CONDENSER MIDDLE OF CONDENSER
^! •-'':;:;!:^ VT-; ~^\!*'!t^?.C ? ~\ *"_, ^"'^J"-1'- ** " "\ -^ 'f" iPÖfe %SsJ$&"'' ■ %,' ''"i™. ;**v~*' ^lMi>>-' •'■•'•'■~- *^* * ^"4 '■*" 'v& iS'"-"•'-"?'
^^S^l^kf* li^fe*^ v ""V ■
■ -*■ ■ " ' S^^S^4l; IS ^
"- v^" ■. *Z Säfs \ -•c
LIQUID-VAPOR INTERFACE
MIDDLE OF BOILER LOWER BOILER BOTTOM OF BOILER
Fig. 5.10. Metallographie Appearance of W-26$ Re Refluxing Capsule that Operated with Boiling Potassium for 5000 hr at 1250°C. (Capsule was made from an arc-cast extrusion.)

105
in Fig. 5.11. This result correlated with analysis of the boiler wall,
which, as shown in Fig. 5.12/ was depleted of ¥ and enriched in Re in
the attack zone.
In speculating as to the cause of the preferential tungsten mass
transfer in this capsule, we must account not only for the inverse nature
of the deposition (i.e., in the condenser rather than the boiler), but
also for its occurrence in only one of the two W—26$ Re capsules tested.
We believe that none of the classical solution-deposition modes put forth
for refluxing potassium systems is compatible with our observations and
that some other mechanism must be operating. Results observed in our
pure niobium capsules, reported last time,9 may give a clue to this
other mechanism. We noted in the case of pure Nb that, as a consequence
of depletion of 0 from the condenser regions, we acquired a small amount
of 0 in the K in the boiler region. Based on Nb-K static capsule tests,
the level of 0 in the K was still far below that which should have led
to migration of 0 into the Nb or to serious oxidative corrosion. Never-
theless, we have observed both effects in refluxing systems. This
strongly suggests that, because of the boiling process, the activity of
0 at the boiler surface locally exceeds that associated with the "mixed-
mean" concentration of 0. Such an effect could also explain the deposits
of W at the top of the capsule. Free energy considerations suggest that,
at 1200CC, the oxygen activity needed to form WO2 is considerably below
the activity reached in a saturated solution of 0 in K. If the local
oxygen activity were sufficient to form WO2, it is not unreasonable, in
view of the relatively high vapor pressure of this oxide, that WO2 mole-
cules could be swept along with potassium vapor to the condenser.10
Once outside the region of locally high oxygen activity, any WO2 mole-
cules would encounter strongly reducing conditions. So long as they
9J. R. DiStefano, Fuels and Materials Development Program Quart. Progr. Rept. June 30, 1968, OML-4-330, pp. 75-84.
10A similar conclusion could be drawn for thermally stable compounds of the type Kx Wy 0Z. [See H. Kessler, A. Hatterer, and A. Herald, "Action of Alkali Metal Vapours on the Trioxides of Molybdenum and Tungsten," pp. 4-65-473 in The Alkali Metals, Chem. Soc. (London) Spec. Publ. 22. The Chemical Society, London, 1967.]

106
to CO
CO (0
p 6
p p Jl z or o
n D c or
3 <i
D 0
D
—0
c
\ \
D c
D\
1 "^ *
0
v ',''■*#»■.,?*..«.* , .... O
- Ä*
D
cyo °^f .»*"« M-
1° S5906-AM Mil
o\
o o o
CD O 00
o o CD
O in
O o ro o
CV1 o
(%)1N31N03
1^ to CU *7 CO ID
n
[1 >
o _1J z o
3rc
a O
3 o a O
□ o $ 0
D
J I D/^
i.. ^ ■ ■ - 1 •O.
£A^
D=s 1 °- T
1 a
i i 1 1
o o o
en o CO
o o CD
O in O O O
o C\J
U LO H rf
•H Ü O -H
pq u o <H Ä IT) O o c o
cö o
CQ
_,.,_ a> <u := ^3 -P b O CH
o u <; o LÜ PH ■*- O 1 0)
<L Ö H |- O pi <n !-< tfl
h Q -P & ü cd CD O • H a
o K O in IT\
O •T^-CM CM v£> H H C\i
• 1 -P in IA ^ CO
O
Fig.
n of
sium
O
Regio
Potas
CO
CO
Ö 0)
r^- f
Cond
hr in
CD
Scan o
r 5000
in CD , (D -p — rQ CH b o <;
!H
<*• O PM 0) 1 H
< C 3 V- O CQ (/> ?H P< Q -P CO
CM
o
Fig. 5.11. El
ec
ection of W-26$ R
e C
otassium a
t 1250°C.
(%)1N31N0D CQ PM
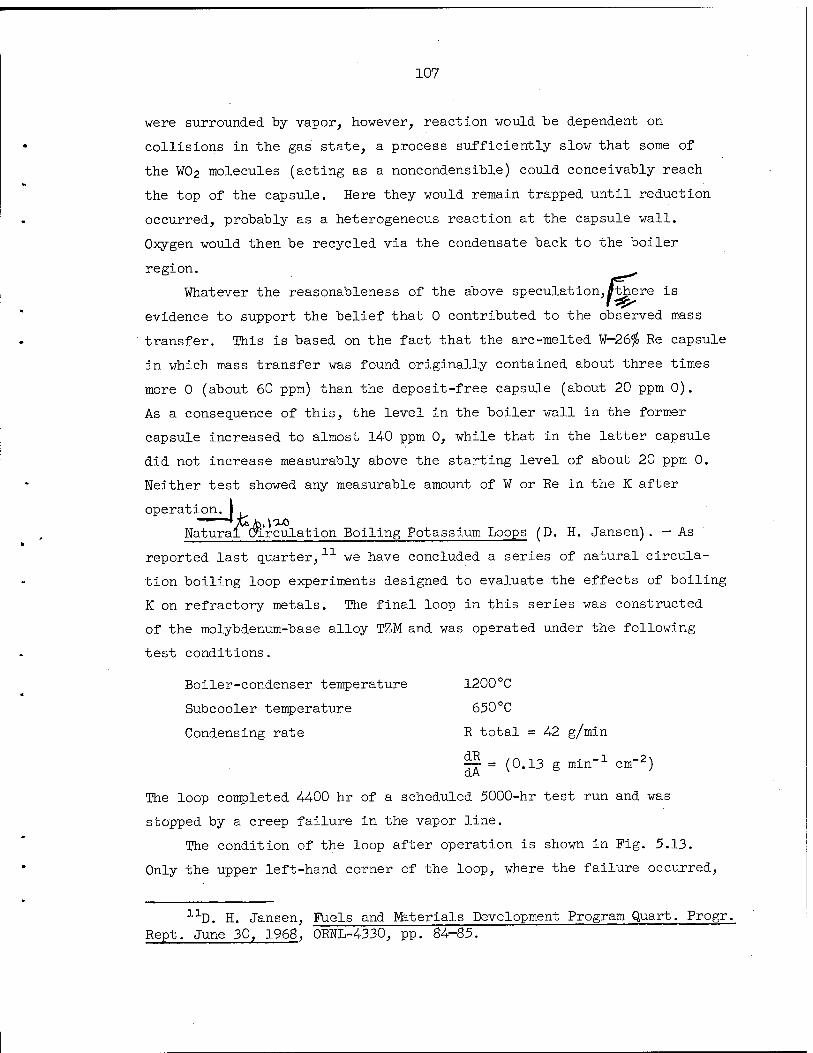
107
were surrounded by vapor, however, reaction would be dependent on
collisions in the gas state, a process sufficiently slow that some of
the ¥02 molecules (acting as a noncondensible) could conceivably reach
the top of the capsule. Here they would remain trapped until reduction
occurred, probably as a heterogeneous reaction at the capsule wall.
Oxygen would then be recycled via the condensate back to the boiler
region.
l.lthej 7^ Whatever the reasonableness of the above speculation,ffthere is
evidence to support the belief that 0 contributed to the observed mass
transfer. This is based on the fact that the arc-melted W—26$ Re capsule
in which mass transfer was found originally contained about three times
more 0 (about 60 ppm) than the deposit-free capsule (about 20 ppm 0).
As a consequence of this, the level in the boiler wall in the former
capsule increased to almost 14-0 ppm 0, while that in the latter capsule
did not increase measurably above the starting level of about 20 ppm 0.
Neither test showed any measurable amount of W or Re in the K after
operation. I
Natural (Circulation Boiling Potassium Loops (D. H. Jansen). — As
reported last quarter,11 we have concluded a series of natural circula-
tion boiling loop experiments designed to evaluate the effects of boiling
K on refractory metals. The final loop in this series was constructed
of the molybdenum-base alloy TZM and was operated under the following
test conditions.
Boiler-condenser temperature 1200°C
Subcooler temperature 650°C
Condensing rate R total = 4-2 g/min
H = (0.13 g min"1 cm"2)
The loop completed 4-400 hr of a scheduled 5000-hr test run and was
stopped by a creep failure in the vapor line.
The condition of the loop after operation is shown in Fig. 5.13.
Only the upper left-hand corner of the loop, where the failure occurred,
1:LD. H. Jansen, Fuels and Materials Development Program Quart. Progr. Rept. June 30, 1968, 0RNL-4-330, pp. 8A--85.

108
Y-89130
Fig. 5.13. Alloy TZM-Boiling Potassium Loop Showing Configuration of Mitered Corners. Rupture is at upper left-hand corner.
showed any change in macroscopic appearance. As shown at a higher magni-
fication in Fig. 5.14-, the failure occurred in a short section of tubing
that joined the horizontal dryer section to the vertical condenser leg.
This short tubing section was part of an original dryer segment that had
to be replaced after 1300 hr of operation because of a similar creep
failure under the dryer heater upstream of the later failure. The short
section was left in place because (1) it was located well away from the

109
Y-89129
Fig. 5.14. Failure Area of TZM Loop Showing Deformation of Tubing Comprising the Vapor Carryover Line. Vertical leg is top of condenser area.
dryer heater, (2) it had shown no deformation in 1300 hr, and (3) the new
dryer section was more easily attached by not running it all the way to
the miter joint (Fig. 5.14). However, this short section of the original
dryer did constitute a weak link, since it had less wall thickness than
either the new dryer line or the adjoining condenser leg. Although long-
term creep data on TZM are limited, the available data suggest that the
failure of this section can be explained by time-temperature-stress
conditions without recourse to a weakening effect of the K.
Weight changes of insert specimens contained in the condenser and
subcooler sections of this loop were discussed last quarter.11 Specimens
from the condenser showed little weight change, while subcooler specimens
gained an average of 10 mg/cm2. The metallographic appearance of repre-
sentative inserts from these respective loop sections is compared in
Fig. 5.15. Note that recrystallization took place in both regions with

110
Y-90554
Fig. 5.15. Views Showing Inside Surface of (a) Boiler at Approximate Liquid-Vapor Interface, About 1250°C, and (b) Horizontal Vapor Line, About 1200°C. The material in (b) was from a more recent and purer heat. Etchant: H2O-H2O2-H2SO4.
the exception of a narrow zone bordering the exposed surface. We are
examining this region to determine what chemical changes may have occurred
to cause the apparent grain stabilization.
Specimens from the boiler and dryer regions showed no changes from
before-test specimens other than recrystallization and grain growth
(Fig. 5.16). Specimen temperatures in the lower subcooler region were
apparently below the recrystallization threshold, and these specimens
were entirely similar in appearance to before-test specimens.
Forced Circulation Boiling Potassium Loop Tests (FCL-8) (B. Fleischer,
C. W. Cunningham). — For several years we have been evaluating the cor-
rosion and erosion properties of refractory alloys in K using forced
convection loop systems. A D-43 alloy loop with D-4-3 test section (FCL-8)
was the third in a series of loops designed to evaluate the effects of
boiling potassium liquid and high velocity potassium vapor on niobium-
base alloys and on TZM. Operating conditions of this loop were discussed
last quarter.12 During this reporting period the loop was removed from
12T "B. Fleischer and C. W. Cunningham, Fuels and Materials Development Program Quart. Progr. Rept. June 30, 1968, ORNL-4330, pp. 85-^37.
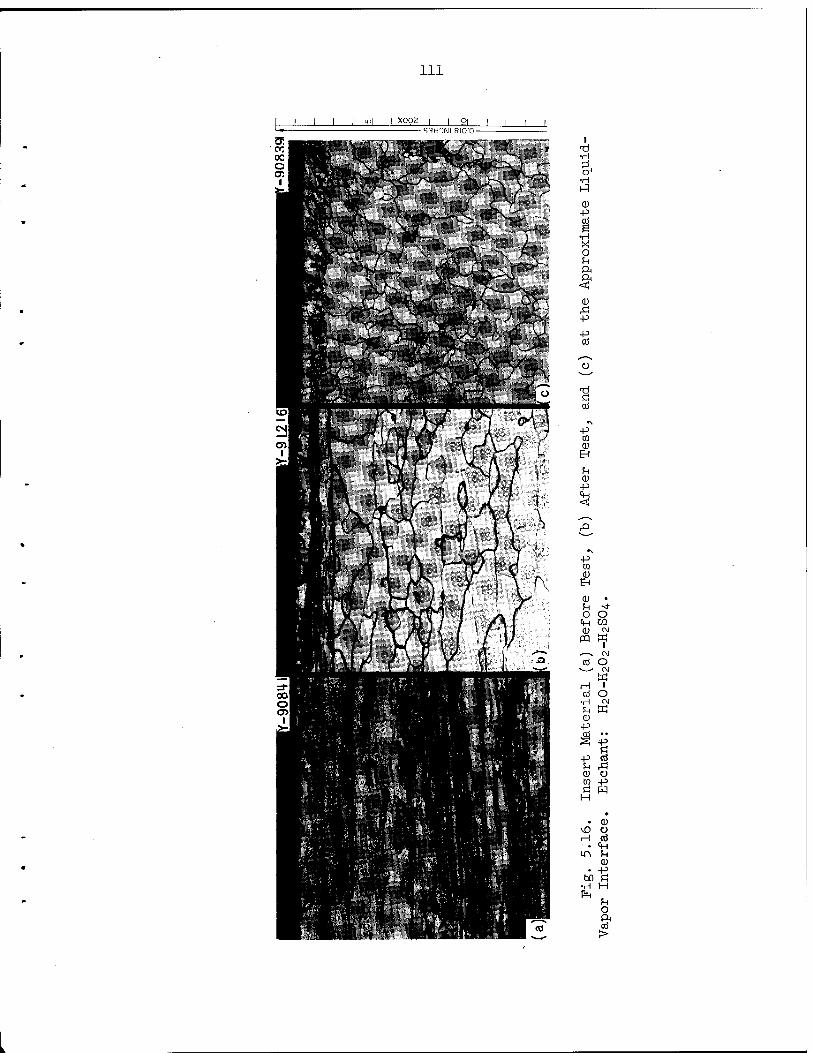
Ill
_£l I X°P2 I I 91 I I I I S^HDNI RIO'O-
I ti •H
•H 1-3
<D P
g •H X o ft < 0)
-p p cd
ö cö
P to 0)
EH
U <D P
<
P CQ
CD EH
CD •
O O CH CO CD <M
PQ M
cd O CM
W H l cd O
■H <M
<U P
CO
■p
P fn CD CO
Ö hH
• CD
H CO • «in
CD • +2
•H H P4
O
>

112
the vacuum chamber in which it was operated and sectioned for metallur-
gical examination. We are now modifying the vacuum system in preparation
for the next test loop.
Liquid metal removal. The potassium inventory was drained into an
evacuated tank at the end of the 10,000-hr operating period. Just before
draining, the loop operating conditions were adjusted to ensure a maxi-
mum removal of the K to the dump tank:
1. The boiling conditions were adjusted to 871°C and 38.2 psia.
2. The vapor in the dryer was superheated to 996°C to supply heat
to the test section.
3. The rate of heat removal to the NaK circuit was reduced to hold
the condenser inlet conditions at 732°C and 12 psia.
•4. The drain valve was opened to allow passage of the liquid K,
driven by the combined forces of gravity and vapor pressure.
5. The potassium pump was then reversed to improve removal of
liquid trapped in the helical flow passages of the pump.
6. The high temperature and the stored heat in the boiler leg,
crossover line, and condenser leg dried residual pockets of K.
7. The drain valve was closed, and the loop was allowed to cool
to ambient temperature to leave the loop under vacuum with only traces
of condensed K.
8. The NaK economizer circuit was drained by gravity and left
filled with Ar at atmospheric pressure.
We originally planned to remove any residual traces of K by
distillation, but we could not do so because of a leak discovered in the
NaK coolant system when the vacuum bell jar was removed. However, sub-
sequent sectioning of the boiler and condenser revealed them to be free
of K so that the distillation step was not essential.
Visual examination of boiler and condenser legs. The loop was
initially sectioned into three parts as shown in Fig. 5.17. The dryer
wall with its thermocouple well and heater support tabs is shown in
Figs. 5.18 and 5.19. While we were trying to stabilize the loop flow,
the temperature of this section reached 1370°C for a brief period.
Dispite this, we saw no dimensional changes, and the only external
effect noted was a general brightening of the outer surfaces.

113
•p w <ü
EH
<H O
U
o o o o
U
-p
to I
l-H o
PA o
o
I p
<L) H
■§ co w CO w
£ -P fn Cd
IT\
bO ■H

114
THERMOCOUPLE WELLS
LINE TO PRESSURE
MEASURING DEVICE
Fig. 5.18. Dryer and Test Sections of D-43 Alloy Loop (FCL-8) After Test.
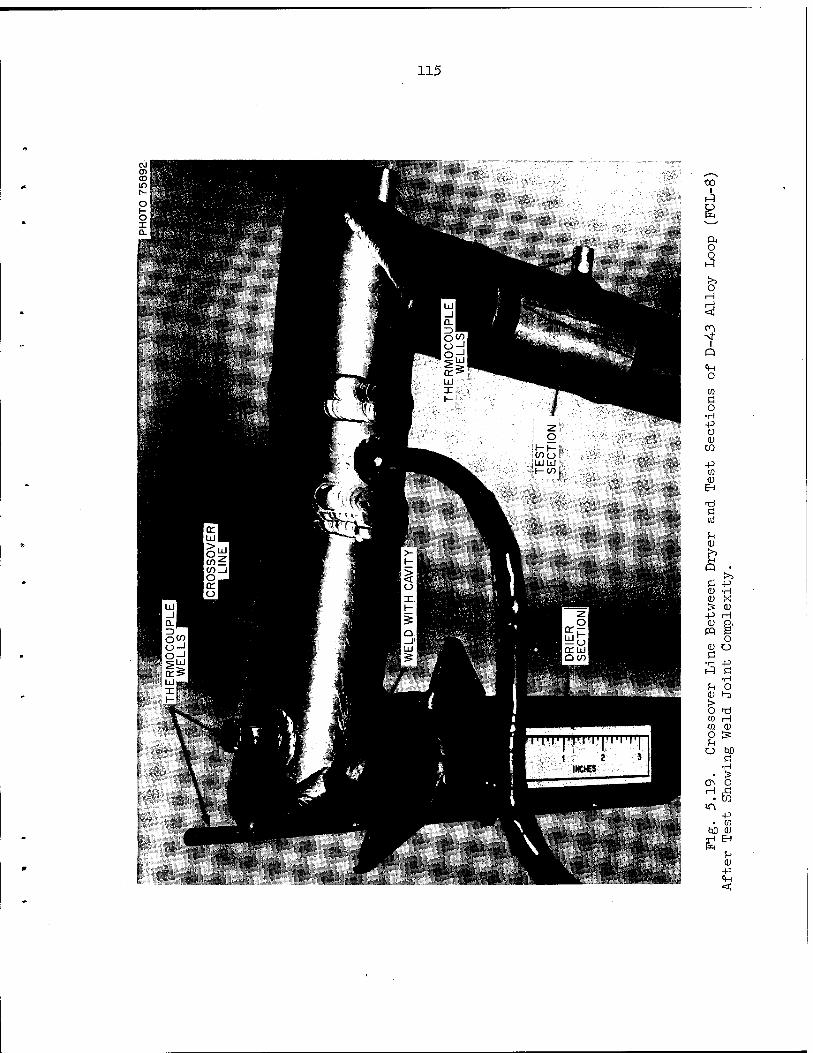
115
to i
h3
ft o o
1-3
>> o H H < en
I o tin O
CQ
Ö o
•H
o (L)
CQ
+3 CQ
(1) EH
Tl Ö cd
CD
p • Ö p <ü -H (D X > CD
-P H CD ft
pq e o
CD O Ö •H -p 1-3 Ö
CD
o CQ
CQ
o u o
H
O h>
xl H CD
£5
bo Ö
•H
o
m -p
• CQ
bD CD EH
pq u CD -P

116
A groove apparent in one of the miter welds was made before test
to eliminate a dye penetrant indication found after preoperational
annealing.
Evaluation of pump. During the 10,000-hr operating period of this
loop, it was necessary to increase the voltage to the potassium pump
gradually to maintain a constant rate of flow in the loop. Our exami-
nation after the test disclosed decreased pump efficiency. The
diameter of the exterior shell of the pump cell had increased in
some areas as much as l/32 in. X rays of the pump cell confirmed that
a radial clearance of about 0.015 in. had developed between the wall and
an internal helical core. The growth of the outer shell allowed bypass
flows within the helical pump cell and gradually decreased the pump
performance. The pressure stress on the outer shell of the pump cell
would appear to have been too low to cause this extreme amount of creep.
Our study of the cause of this phenomenon is still in progress.
Analysis of NaK leakage. As reported last quarter,13 a NaK leak was
detected when the vacuum chamber was opened. Visual inspection showed
that the leak was very small. After we removed the protective tantalum
foil wrap from the outlet line of the NaK economizer, it appeared that
NaK might have leaked from the extruded Nb—1$ Zr—stainless steel transi-
tion joint shown in Fig. 5.20. Dye penetrant inspection of this piece
revealed a small defect on the outer surface at the interface between
the Nb—1$ Zr and stainless steel. X-ray inspection also showed a
delamination type of defect on the interior surface. The joint was
removed from the piping system, thoroughly washed in alcohol and boiling
water, and then checked for leakage on a helium leak detector. No leak
was indicated, but we cut the joint longitudinally and found that the
interior surface was indeed delaminated at several areas where the
Nb—1% Zr tapered into the stainless steel. Hence we would conclude that
the leakage of NaK occurred because of this defective area in the transi-
tion joint. The rate of leakage was probably quite small, and therefore
it is conceivable that NaK had been leaking into the vacuum vessel long
before the end of the test.
13B. Fleischer and C. ¥. Cunningham, Fuels and Materials Development Program Quart. Progr. Rept. June 30, 1968, ORNL-4-330, pp. 85-^7.
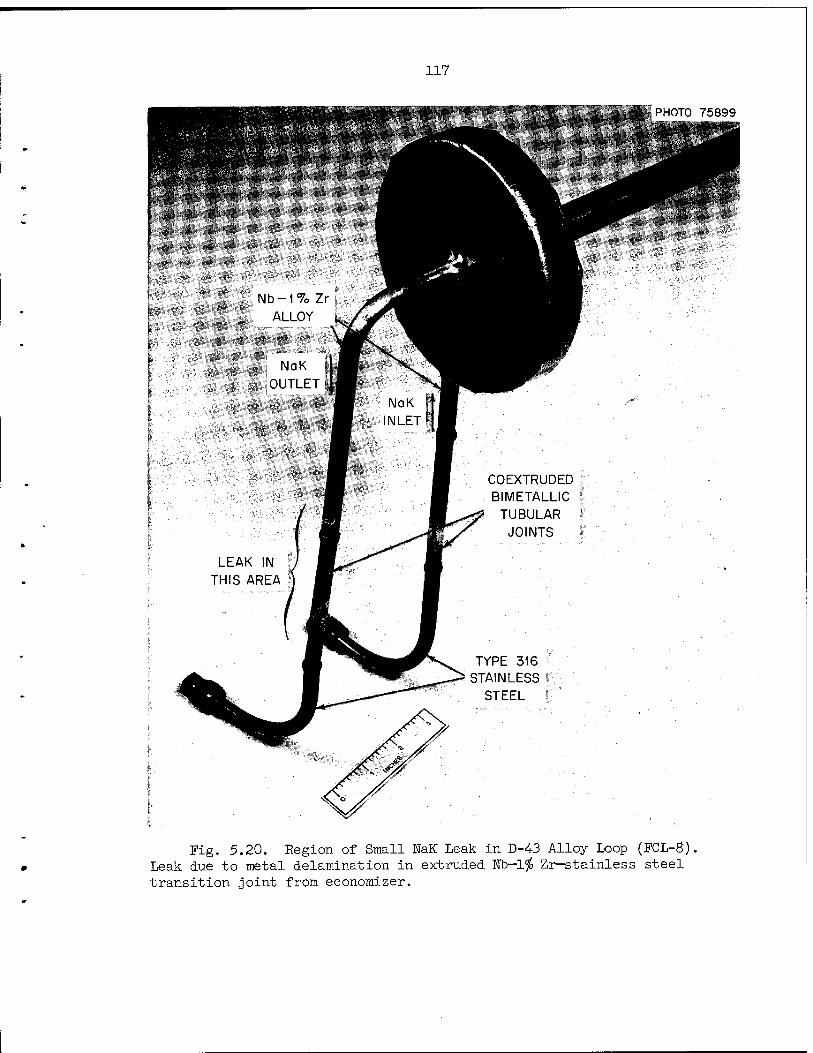
117
L"vjg"r" PHOTO 75899
Nb-17o Zr ALLOY
j NaK jOUTLET
COEXTRUDED BIMETALLIC
TUBULAR JOINTS
TYPE 316 STAINLESS
STEEL
Fig. 5.20. Region of Small NaK Leak in D-43 Alloy Loop (FCL-8) Leak due to metal delamination in extruded Nb-1$ Zr-stainless steel transition joint from economizer.

118
Inspection of vacuum chamber. During the test, we found an air
leak in the area where the ion pump wells were welded to the vacuum
chamber wall. However, the ion pumping capacity was sufficient to hold
the chamber in the low (10"° torr) range. A dye penetrant examination
after test revealed a defect extending completely across this weld.
A second defect was found in another weld. Both welds are being repaired
and strengthened by overlaying weld metal around the entire joint. The
nitrogen component observed in the residual gas during loop operation
can be explained by this leak. The oxygen component was missing; we
believe it was effectively consumed by the leaking NaK. The argon com-
ponent can be explained in part by the air leak and in part by a possible
leak from an argon-filled thermocouple assembly.
Refurbishing of triode ion pumps. The triode ion pumps were recon-
ditioned at the vendor's plant, where the cathode construction was
changed. The titanium wire and the supporting stainless steel of the
cathode were replaced by an all-titanium expanded-metal-screen cathode
construction. The vendor has found that the elimination of sputterable
stainless steel is advantageous.
Interim vacuum test. Preparations are being made for a vacuum test
before installing the next test loop into the chamber. This test will
serve to verify the leak-tightness of the chamber, to determine the per-
formance of the reconditioned ion pumps, and to evaluate the integrity
of both new and old penetrations that are required for the next test.
Posttest examination. The main loop was sectioned as shown in the
diagram in Fig. 5.21. Each section was cleaned with butyl, methyl, and
ethyl alcohols to ensure safe removal of all unreacted K. No residual
potassium metal was found during this cleaning. All parts were then
rinsed 30 min with hot flowing water, dried with an alcohol rinse, and
capped to await further examination.
All auxiliary piping lines were examined for residual K. Any K
found was removed by melting under kerosene. These lines and the pump
cell, valve, and economizer were then cleaned as previously described
for the main loop.
Visual inspection of all pieces before and after cleaning showed
no evidence of mass transfer. When the test pieces were removed, a

119
DRIER
BOILER
HOT FINGER-
H
PRE-HEATER
7
^
^
7
7
ORNL-DWG 68-12939
NOZZLE/BLADE TEST SPECIMEN REGION
CONDENSER
HOT WELL
LETTERED POSITIONS INDICATE LOCATION WHERE LOOP WAS SECTIONED
6 _l_
12 I
18 24 _J
INCHES
Fig. 5.21. Sketch of D-43 Alloy Loop (FCL-8) Showing Loop Sectioning Plan for Posttest Inspection.
120
small discolored area was noted on blade 2 at the vapor stream impinge
ment point.
(R^ L. KLueh) en on Compatibility of Refractory Metals and Alkali Metals 1
(Oxygen Effects in the Tantalum-potassi^-rp System. - We have completed
our evaluation of the Ta-0-K system at 800 and 1000°C (ref. 14). The
studies supplement those completed earlier on the Nb-0-K system.15 In
addition to providing data on equilibrium states, the tests were designed
to yield data on the kinetics of weight changes of the tantalum speci-
mens resulting from oxygen diffusion and tantalum dissolution. However,
because of the rapid dissolution and because the specimens in some cases
were penetrated by the K, the kinetics data are, at best, qualitative.
Table 5.4 shows the temperature, time, and oxygen conditions inves-
tigated in this test series. Potassium penetrated all but one of the
tantalum specimens to which 0 had been added before testing (i.e., speci-
mens containing > 650 ppm 0).| Figures 5.22, 5.23, and 5.24 show the
appearance of/jantalum specimens containing 680, 1200, and 1800 ppm 0^
after exposure to K at 800°C fjfeach of the specimens'fexhibits attack pre-
ferentially along grain boundaries.\ Figure 5.24 is especially interesting
because of the unusual grain structure of the Ta (i.e., the elongated
grains parallel to the "flat" edge of the specimen). Compare the rela-
tively deep penetration in the longitudinal direction with the shallower
penetration in the transverse direction. Attack in the latter direction
was confined to a band of small, equiaxed grains near the surface and
was halted by grains elongated in the direction of^rolling — confirmation
that only grain-boundary attack is occurring. [We believe that attack
proceeds with the formation of a ternary oxide which then dissolves in
K as the system tends toward equilibrium. This, as well as loss during
metallographic preparation, could explain the apparent absence of cor-
rosion products in the after-test microstructure
—■* ■" (s,^1 Ö
X*R. L. KLueh, Fuels and Materials Development Program Quart. Progr. Rept. June 30, 1968, 0RNL-4330, pp. 142-146
15A. P. Litman, The Effect of Oxyg Liquid Potassium, ORNL-3751 (July 1965)
15A. P. Litman, The Effect of Oxygen on the Corrosion of Hiobium by

121
-5" ^5
B •H [Q W CO -P O CM
Ö CO
3 CO
cd EH
<H O
!>» -P •H H •H
p CO
!• o o Ö o
CO bO
O
P Ü CD
<iH
H
in <D rH ,Q cd
EH
•H 1 H •H *> v. !H 3 CO 0 (D H CO P. P cri cri P< 4H P P <! Ö O cri CM H
p
bO C •H cd 0) Ä is o
CO CM bO 0
n •H 0
-S .«—> Ö H 0 aj cri P bO p P
& Ö cri
^^ O H
Ö 0 •H 2
•H •—■s
a CO 0 (i) CO P< bO cri PH
5? P O
o PM
g6
(D 5H
P cd
<D o
oooooooo G\ONONf-t)OC\i!>-in tOCACMvONJ-rHiPitO HCMrMCMC\2cnL>\0
o o o o o o o o o o o O \D nw MtOtO Htnst !> to o to to ^o H \o a> H to vD O t> vU ntnst ^cn sf la^oo ->!> •\
>t m O H H CM
m -st- H o ^ ^ ^ «OiNttMOOOO miA!>LnLnto-^iri OOOHC^tOCNivD
o m m vO N!" "vl" CM „ \f \o>o Hvo\otor\HDno OOOCMOtOOCVOtOCM T\
???????? ????TTffVT ?T
staicvHtntnnn
oooooooo ir\iAir\intoir\00
vO vD CM to H rH
otootooovocnocnc^cn H CM
oooooooooooo ininiTimoooocMvDOO
vOvOvDI>vDvDO ON i—I i—I i—I i—I i—I i I
CO EH
OOOOOOOO ootooc^^'nto ON O ft) O St 0M?(^ H CM H C\! H H iH
oooooooooooo CMC^CMrHOOOOmtOl>C^ 0(?OOHrlrlHNfCM?(? CM H CM CM H rH H
cn T» O O O O O O O O O O H rH H H rH
O* H CM O O IT\
CM O O O O O IT\ ITi IT\ ITi IT\
O O to
O O O H

122
&:£s*5DD^
■ m ^txJ >-^ m
<csT\ "'.. .-Q
«O O
80725
2
*. I. V\X: ■
Fig. 5.22. Tantalum, Which Initially Contained 680 ppm 0, After Exposure to Potassium for 100 hr at 800°C. Etched in a solution of H20, HN03, and NH4HF.
i
Fig. 5.23. Tantalum, Which Initially Contained 1200 ppm 0, After Exposure to Potassium for 100 hr at 800°C. Etched in a solution of H2O, HNO3, and NH4HF.
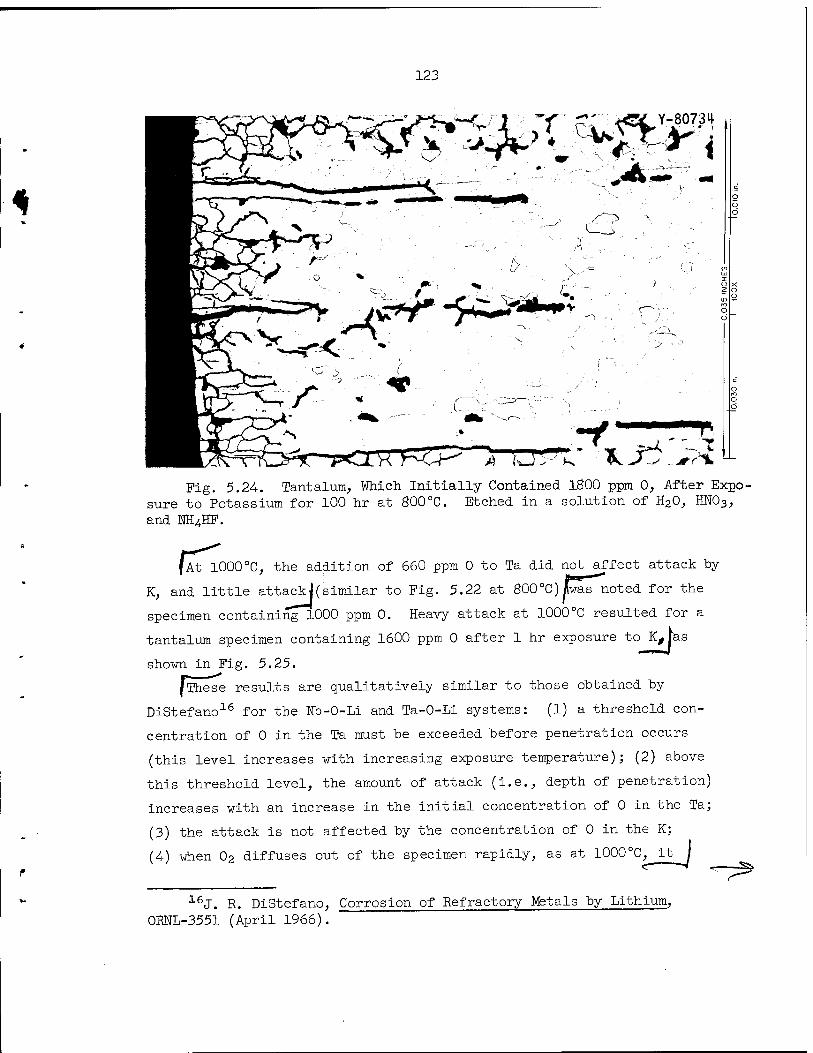
123
Fig. 5.24. Tantalum, Which Initially Contained 1Ö00 ppm 0, After Expo- sure to Potassium for 100 hr at 800°C. Etched in a solution of H20, HN03, and NH4HF.
/At 1000°C, the addition of 660 ppm 0 to Ta did not affect attack by
K, and little attack|(similar to Fig. 5.22 at 800°C)pas noted for the
specimen containing 1000 ppm 0. Heavy attack at 1000°C resulted for a
tantalum specimen containing 1600 ppm 0 after 1 hr exposure to K, has
shown in Fig. 5.25.
{These results are qualitatively similar to those obtained by
DiStefano16 for the Hb-0-Li and Ta-0-Li systems: (1) a threshold con-
centration of 0 in the Ta must be exceeded before penetration occurs
(this level increases with increasing exposure temperature); (2) above
this threshold level, the amount of attack (i.e., depth of penetration)
increases with an increase in the initial concentration of 0 in the Ta;
(3) the attack is not affected by the concentration of 0 in the K;
(4) when O2 diffuses out of the specimen rapidly, as at 1000°C, it -Sfc
16J. R. DiStefano, Corrosion of Refractory tfetals by Lithium, 0RNL-3551 (April 1966).

124
Y-81987
Fig. 5.25. Tantalum, Which Initially Contained 1600 ppm 0, After Exposure to Potassium for 0.5 hr at 1000°C. As polished.
|limi" |limits the depth of penetration. The chief difference between the present
studies and DiStefano's studies of Li is that the latter showed attack to
occur in Ta at 815°C with as little as 300 ppm 0^(ref. 16). (This would
indicate that the threshold concentration is higher for penetration by K
than by Li.j
As shown in Table 5.A-, the concentration of Ta in the K increased
as the level of 0 in the K increased. (The final concentration of 0 in
the K is somewhat larger than that shown in Table 5.4- because of 0 donated
by the Ta of the container and specimen.) Since we believe penetration
involves the formation of a compound containing 0, the final concentration
of 0 in the penetrated specimens may include 0 in the form of a corrosion
product as well as 0 dissolved in the Ta.
(The specimens exposed to K with a high concentration of 0 contained
a dark scale. When we tried to identify the scale by x-ray diffraction,
we detected only tantalum metal. Furthermore, within experimental error,
removal of the scale from the specimen did not change the oxygen content
of the specimen.
& W^
125
-—tb a P nwo-pn Effects in the Niobium-jaodiufl. Svstemf - The results of the
Ta-O-K system discussed above, together with previous studies > at
ORNL, indicate that there is a marked difference in the effect of 0
on the compatibility of refractory metals and alkali metals depending
upon whether 0 is present in the refractory metal or the alkali metal.
We are attempting to categorize these different effects in the Nb-O-K,
Ta-O-K, Nb-O-Na, Ta-O-Na, Nb-O-Li, and Ta-O-Li systems. For these
studies we are using static capsules of the configuration previously
described for studies of Ta-O-K (ref. 10). All tests are being conducted
at 600°C, since this temperature is of direct interest in sodium-cooled
fast breeder reactor applications.
Our first tests in this series were conducted on the Nb-0-Na system.
Four capsules containing unoxidized niobium specimens were exposed to
Na with several oxygen levels, and two capsules containing niobium speci-
mens with 950 and 1600 ppm 0, respectively, were exposed to Na with
about 50 ppm 0.
|All tests were conducted for 500 hr. Results are shown in Table 5.5.
Although the specimens appeared dull after test, none of them appeared to
have a scale. All specimens showed weight losses. The two oxidized
specimens showed considerable oxygen loss, while the unoxidized specimens
showed little oxygen change. Diffusion calculations and microhardness
profiles of the unpenetrated specimens indicated that the oxygen concen-
tration was near equilibrium after 500 hr at 600°C.
Metallographic examination of the two oxidized specimens indicated
that they had been penetrated by the Na. The penetration was much less
severe than for similarly oxidized tantalum specimens exposed to K at
600°C (ref. 19). As in the case of these Ta-0-K tests, the final oxygen
concentration in the Nb-0-Na tests may include 0 present as an internal
corrosion product as well as 0 in solid solution. J /. .— _
17A. P. Litman, The Effect of Oxygen on the Corrosion of Niobium by Liquid Potassium, ORNL-3751 (July 1965).
18R. L. Klueh, Fuels and Materials Development Program Quart. Progr. Rept. June 30, 1968, ORNL-4330, p. 142.
19R. L. Klueh, "Oxygen Effects in the Tantalum-Potassium System," pp. 120-124, this report.

126
r Table 5.5. Effect of Oxygen on Compatibi lity of Niobium and Sodium at 600 °C
Oxygen in Sodiuma
(ppm) Before
Oxygen in Niobium (ppm)
Weight Change0
(mg)
Niobium in Sodium (ppm) After
Before D After0
50 70 59 -0.1 400
300 70 62 -0.5 800
700 70 64 -2.0 1400
1000 70 83 -1.7 2200
50 950 540d -1.7 500
50 1600 440d -6.2 1000
Oxygen added as Na20 to Na containing about 50 ppm 0.
Determined by vacuum-fusion analysis.
"All specimens were 1 x 0.5 X 0.04 in. 1 Microstructures show that Na penetrated these specimens.
'^ ,1 Partitioning of Oxygen Between Potassium and Zirconium and Sodium
and Zirconium. — As noted in the previous report20 we have re-examined
the value originally assigned to the equilibrium distribution coefficient
for the distribution of 0 between Zr and K (i.e.,
). Below we will demonstrate why we believe K atom fraction of 0 in Zr atom fraction of 0 in K
that the equilibrium distribution coefficient at 815°C is much larger
than originally thought and then show how this new coefficient affects
the gettering-vacuum-fusion (GVF) method for determining oxygen con-
centrations in K (and Na).
Zirconium containing 1 wt % 0, when exposed at 815°C to triple-
gettered K (< 10 ppm 0), gained a small amount of weight and increased
in 0 (ref. 21). This result can be used to set limits on the distribu-
tion coefficient, K , at 815°C. Taking 10 ppm 0 as the upper limit for
i'
20R. L. Klueh, Fuels and Lfeterials Development Program Quart. Progr. Rept. June 30, 1968, ORNL-4330, p. 146.
21 A. P. Litman, private communication.
4
127
the after-test concentration of 0 in the K, it follows that o > 2 x 10³. But since the concentration was probably closer to
^815°C 1 ppm 0 after test, K? 0_, more reasonably approaches 104 or higher.
Using the oxidation data of Mackay22 for Zr in Na along with recent
solubility data for 0 in Na (ref. 23) and following the same argument
as above, we find that K° for Na at 635°C must be greater than 5 X 10⁴.
This is in accord with Mackay's results, which showed that Zr could be
oxidized at 635°C in Na that had an oxygen concentration determined by
a cold trap operating at 160°C. Theoretical calculations of K° suggest
that the coefficient should not change by more than an order of magni-
tude at 800°C, the temperature of the GVF anneal.
Once K° has been established as being very much larger than unity,
it follows, under the conditions of our GVF analysis technique, that
when pure Zr is exposed to K or Na containing 0, essentially all of the
0 is gettered by the Zr. Therefore, the amount of 0 originally present (A)
in the liquid, C^ ', is given by
C(A) = z^Zr) Ü2E (5 1)
(Zr} where Z£^. ' is the 0 gettered by the Zr and W_ and W. are the weights
of the Zr and alkali metal, respectively. The distribution coefficient,
being effectively infinite, does not enter into the calculation.
We are now conducting recovery tests designed to verify Eq. (5.1).
*—— TA^ I Corrosion of Refractory Alloys by Jiithium
Thermal Convection Loop Testsi(J. H. DeVan). —/The sixth in a series
of lithium thermal convection loop tests designed to study mass transfer
of refractory metals was terminated after completing a 3000-hr test run.
This loop, TCL-6R, was fabricated of the tantalum-base alloy Jl=222_and
operated at a maximum hot-leg temperature of 1350oC;J Compositions of the
21T. L. Mackay, Oxidation of Zirconium and Zirconium Alloys in Liquid Sodium, NAA-SR-6674- (February 1962).
22V. J. Rutkauskas, Determination of the Solubility of Oxygen in Sodium by Vacuum Distillation, LA-3879, Los Alamos Scientific Laboratory (September 17, 1968).

128
loop tubing and insert specimens are given in Table 5.6, and flow rate
and temperature conditions for the test are shown below:
Maximum hot-leg temperature, °C 1350
Minimum cold-leg temperature, °C 114-0
Lithium flow rate, g/min 24-0
Lithium velocity, cm/sec 2.5
Test duration, hr 3000
[After operation, the loop was drained^to collect a sample of Li Jandj
was then/flushed with liquid ammonia)to remove residual Li. /Eighty-two
sheet specimens were then removed and tested for weight change, chemistry,
and metallographic condition.|
The weight-change results are shown in Fig. 5.26. JThe weight change
around the loop was analogous to that observed for Nb—1$ Zr and D-4-3 at
1200°C, where about two-thirds of the loop surface lost weight and one-
third gained weight. Also, as in the niobium alloy loops, specimens
from the weight gain region of this loop were covered by a thin, gold-
colored film. As would be expected from the small magnitude of the
weight changes for the T-222 specimens, no dimensional changes could be
detected on any of the specimens.
Chemical analyses of the insert specimens, although not complete,
have shown a significant transport of Hf from the hotter to the cooler
loop surfaces.I X-ray fluorescence was used to evaluate the concentration
of Hf near the surface of the insert specimens; the results are shown in
, (t^he |pr< Fig. 5.27. Note that|£hejprofile of the hafnium surface concentration
around the loop mirrors the weight-change profilettehown in Fig. 5.26:
Table 5.6. Compositions of T-222 Components Used in Loop TCL-6R
Loop Component a Chemical Composition, wt %
W Hf 0 N C Ta
Insert Specimens 10.2 2.3 0.005 0.004- 0.014- Bal (0.030 x 1 x 0.8 in.)
Loop Tubing 10.3 2.2 0.003' 0.002 0.013 Bal (1 in. outside diameter X 0.065 in. wall thickness)
Loop annealed after assembly for 2 hr at 1300°C.

129
-0.8
-0.4
N~~ 0
J^+0.4 UJ o z +0.8 < x o h- + 1.2 I C2 ÜJ 5 +1.6
+ 2.0
+ 2.4
0RNL-0WG 68-13887
• .« • • •• V •
m m
•
• • .." •••
i
-.. • • •
•
• • •-
• •
« • •
•
» • • • k-HE/ MED L ENGT+
« ^COOLED LENGTH^I
1 1 1 10 15 20 25 30 35 40 45 50 55 60 65
DISTANCE FROM HEATER ENTRANCE (in.)
Fig. 5.26. Weight Change of T-222 Thermal Convection Loop After Operating with Lithium for 3000 hr at 1350°C.
100
50
20
10
0RNL-DWG 68-13888
< h-
< I
0.5
0.2
0.1
.*• • ..* •
1 • • •
•> •
«
•
•i f *• »'., %., f'V ,.»«! m»i
*>* **
HtAItK i UULtK 'A VM i
10 20 30 40 50 60 DISTANCE FROM HEATER ENTRANCE (in.)
70
Fig. 5.27. Hafnium Concentration Near Surfaces of T-222 Insert Specimen After Operation with Lithium. Analyzed by x-ray fluorescence.
130
I regions of weight loss reflect hafnium depletion while regions of weight
gain reflect hafnium enrichment. \f\ )
Additional metallographic ana-eWemical analyses of loop.sections
and insert specimens are in progress.
T-lll Forced Circulation Loop (FCLLL-1). — Loop equipment and
design. (D. L. Clark) All design work has been completed, and drawings
have been issued for construction. Work has continued on the T-lll alloy
test-bed loop for studying new refractory alloys at very high temperatures
in high-velocity liquid Li. Installation of component parts and assem-
blies is being delayed until completion of the preliminary check-out of
the reworked triode ion pumps. All available vacuum penetrations are
being installed for check-out during this period. Included will be the
3000-amp electrical feedthrough, the flange penetration for the fill and
drain, and sampling systems, the part for the optical pyrometer, and the
can and flange for the helical induction pump.
Fabrication of T-lll assemblies. (B. Fleischer) We completed
welding of the radiator, heater section, economizer, and pump lines.
We fabricated the radiator coil by butt welding straight pieces of tubing
together and then bending them. All welds were inspected after bending
and found to be free of cracks. The ends of the coil were then cut off
and prepared as subassemblies to facilitate welding of thermocouple wells,
end caps, and inlet and outlet tubing. The subassemblies were then butt
welded to the main coil.
The economizer, heater section, and pump lines were constructed by
welding of component parts previously bent and machined in accordance
with detail drawings. We experienced considerable difficulty in
attempting to achieve dimensional tolerances and proper alignment. To
check for proper mating of the economizer, radiator, and heater sections,
we placed the parts on the test stand and aligned them with respect to
the copper bus assembly. Additional bending of portions of the economizer
and heater sections was required to properly mate the parts.
Annealing of T-lll welds. (B. Fleischer) Welds of T-lll severely
contaminated with 0 will fail rapidly when exposed to Li. This problem
can be alleviated by annealing the welds for several hours at 1315°C
before exposing them to Li. Even though the welds we made in assembling
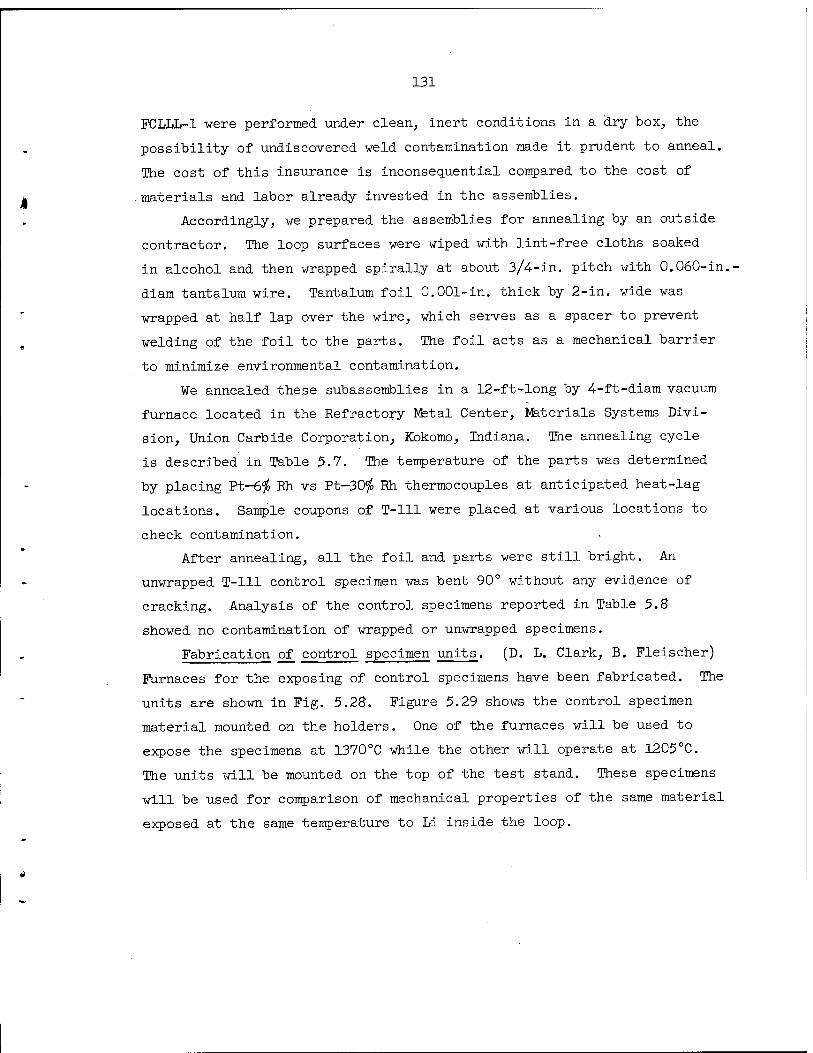
131
FCLLL-1 were performed under clean, inert conditions in a dry box, the
possibility of undiscovered weld contamination made it prudent to anneal.
The cost of this insurance is inconsequential compared to the cost of
materials and labor already invested in the assemblies.
Accordingly, we prepared the assemblies for annealing by an outside
contractor. The loop surfaces were wiped with lint-free cloths soaked
in alcohol and then wrapped spirally at about 3/4-in. pitch with 0.060-in.
diam tantalum wire. Tantalum foil 0.001-in. thick by 2-in. wide was
wrapped at half lap over the wire, which serves as a spacer to prevent
welding of the foil to the parts. The foil acts as a mechanical barrier
to minimize environmental contamination.
We annealed these subassemblies in a 12-ft-long by 4-ft-diam vacuum
furnace located in the Refractory Metal Center, Materials Systems Divi-
sion, Union Carbide Corporation, Kokomo, Indiana. The annealing cycle
is described in Table 5.7. The temperature of the parts was determined
by placing Pt-6$ Rh vs Pt-30$ Rh thermocouples at anticipated heat-lag
locations. Sample coupons of T-lll were placed at various locations to
check contamination.
After annealing, all the foil and parts were still bright. An
unwrapped T-lll control specimen was bent 90° without any evidence of
cracking. Analysis of the control specimens reported in Table 5.8
showed no contamination of wrapped or unwrapped specimens.
Fabrication of control specimen units. (D. L. Clark, B. Fleischer)
Furnaces for the exposing of control specimens have been fabricated. The
units are shown in Fig. 5.2$. Figure 5.29 shows the control specimen
material mounted on the holders. One of the furnaces will be used to
expose the specimens at 1370°C while the other will operate at 1205°C.
The units will be mounted on the top of the test stand. These specimens
will be used for comparison of mechanical properties of the same material
exposed at the same temperature to Li inside the loop.
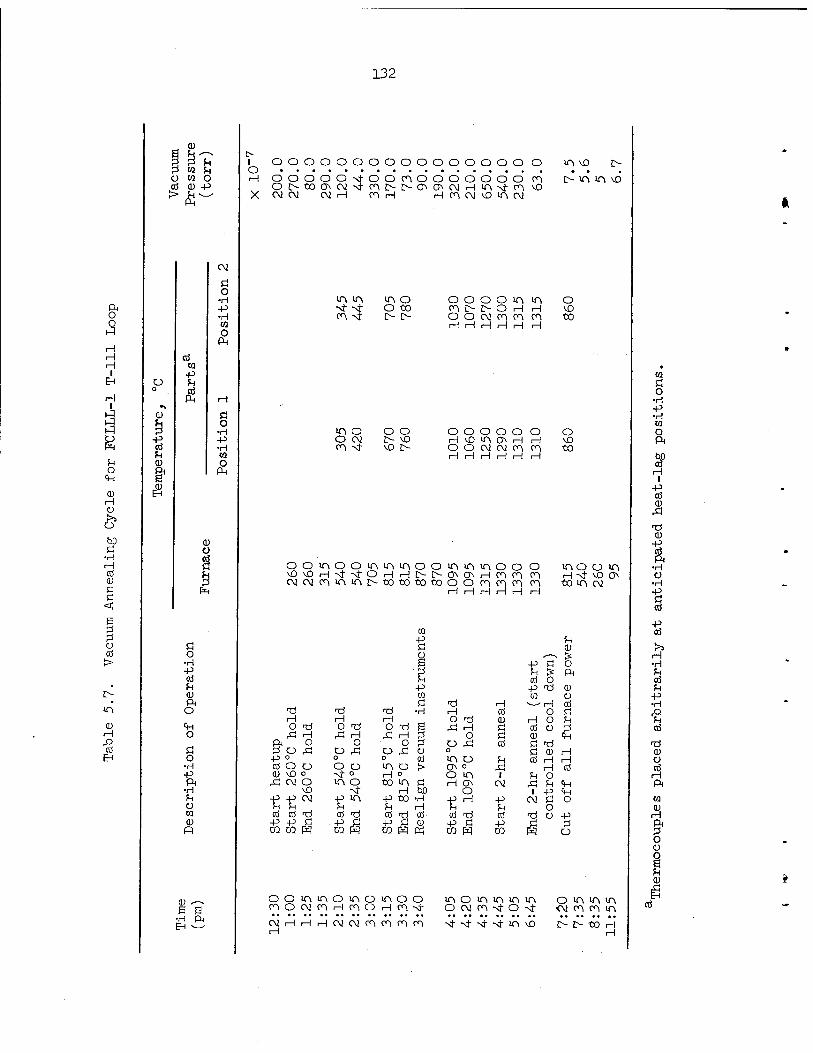
132
a>
ft o
H H H l
EH
3 E O
<P
0) H o !>:> O
hD Ö
•H H
CO <U d c <
B CO >
!>
H
■s EH
p w U U
ü w O cd 0) -P
ü
-P CO
cö CO
CM
Ö O
•H -P •H 00 o
Ö O
•H -P •H CO o
Pn
a) o
pH
Ö o •H -P CO ^ ft O
<+H O
S3 o •H -P ft •H *H O CO CO R
0 E •H ft EH ~-^
i O oooooooooooooooo o ooooost-oocnooooooo n Ot>tOOCM-\f-cn!>-t>OCACMi-im^cn \0 CM CM CM H cn H H Cn CM vD in CM
»A vD
i> m m \o
m in in o o o o o in in o sf st- o to cn L> l> O H H vO cn NT L> L> O O c\J cn en
H H H H H en H
«0
m o o o O O O O O O O O CM !> vD H vD m O H H vO en -ci- ^D L> o o CM c\i cn
H H H H H en rH
to
ooinooinininooinininooo inoom vD\OHNfNtOrHHi>!>ONa\Hrnrnm H N!- \£> ON cM(Mcninint>totx>totooocncncncn to in CM
H H H H H H
CO -P u Ö 0) 92 ,.—s is E P Ö o g cd
is o
ft P P d a>
CQ CQ o S3 d H N ^ H cd
d d d •H H cd o ö H H H o d 0) H o U O d o -d o d S Xi H Ö cd o p
43 H 43 H 43 H g o ' Ö CD <P ft o O o P O 43 cd S3 d 3 O 43 O 43 o 43 Ü o S3 0) H if ?-, 0 0 cd in o U cd H H cö O O O O m o !> ON 0 XI H cd CD vO ° ■sf o H 0 o m i SH o 43 CM O m o «3 m ö H CN CM 43 fn cp
vD Ni- H W o 1 -p <p P-PN p m -p to •H P H p CM Ö o ?H ?H u U H fH SH O cd cd TS cd d cd "3 cd cd d cd d Ü p P -p ö ■P ö p s <u P S3 p C p ram w m Pq CO pq P3 co pq CQ pq o
o o cn o
mmomomoo cMcnHmoHcnNf m o o CM
o m m m CM cn cn m
cMrHHHCMCMcncncncn -si- Nf- ^ Ni- in vo >>(OH
in in in in
CO Ö O
•H -P ■H CO O ft
SP H l
-P cö CU
43
-d CD
•P CO ft •H Ü •H
■s CO
cd
S» H •H ?H CO
•H
CO
-d cu o
A ft w
P4
O ü
CU
CO
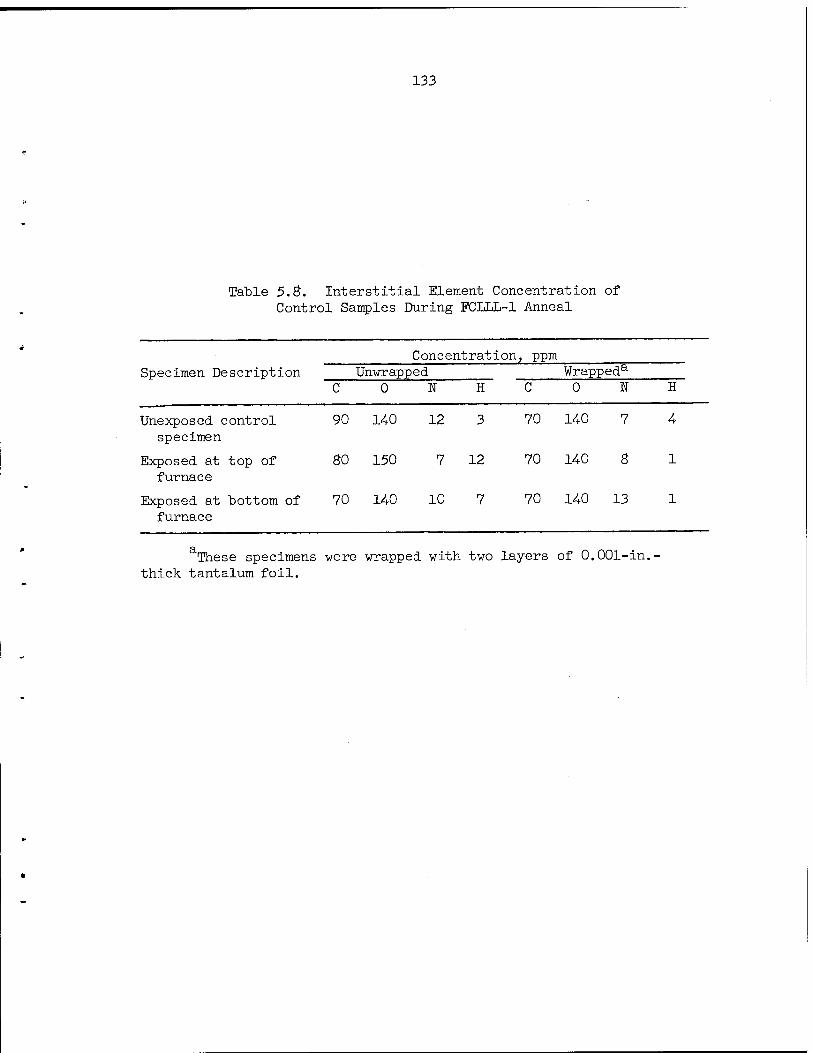
133
Table 5.8. Interstitial Element Concentration of Control Samples During FCLLL-1 Anneal
Concentration, ppm Specimen Description Unwrapped Wrapped5
CONHCONH
Unexposed control 90 14-0 12 3 70 140 7 4 specimen
Exposed at top of 80 150 7 12 70 14-0 8 1 furnace
Exposed at bottom of 70 140 10 7 70 140 13 1 furnace
These specimens were wrapped with two layers of 0.001-in.- thick tantalum foil.
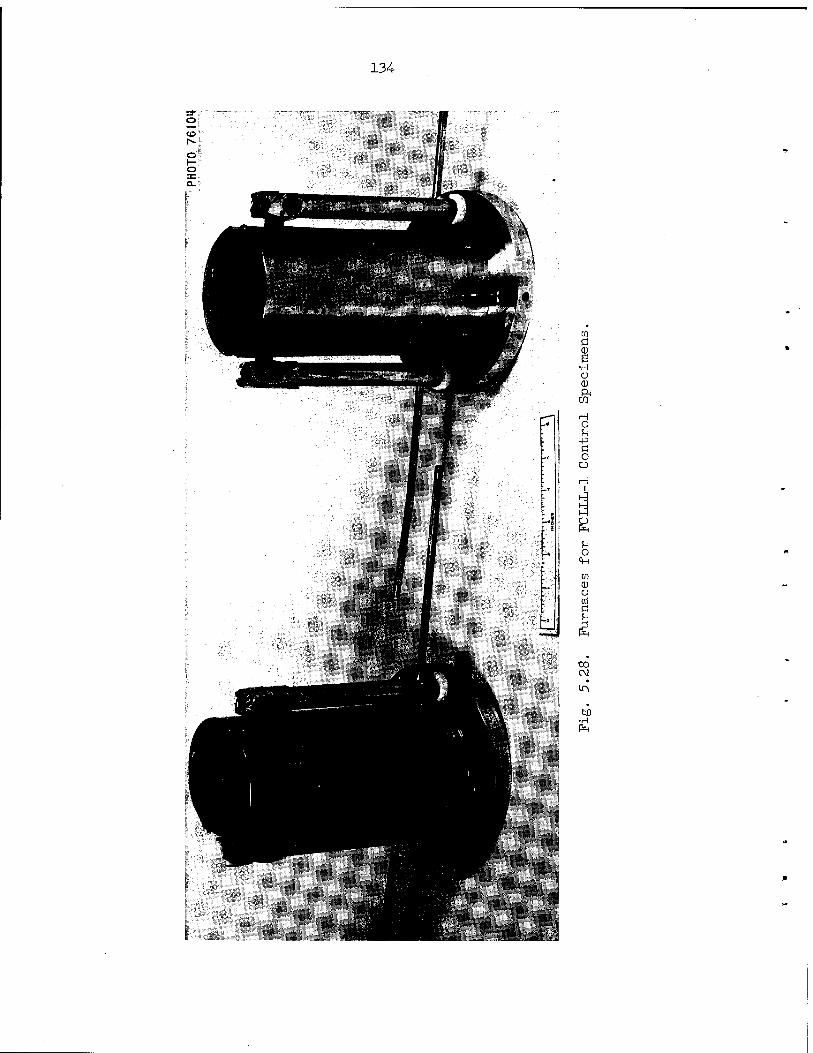
o CO'
©I (-; o*
134
fc» r-, , - ,
w ö
e ■H O (U ft
CQ
H O ?H -P Ö O o H
JH
O CH
w 0) o CO Ö u
a £ to
m
ho •H
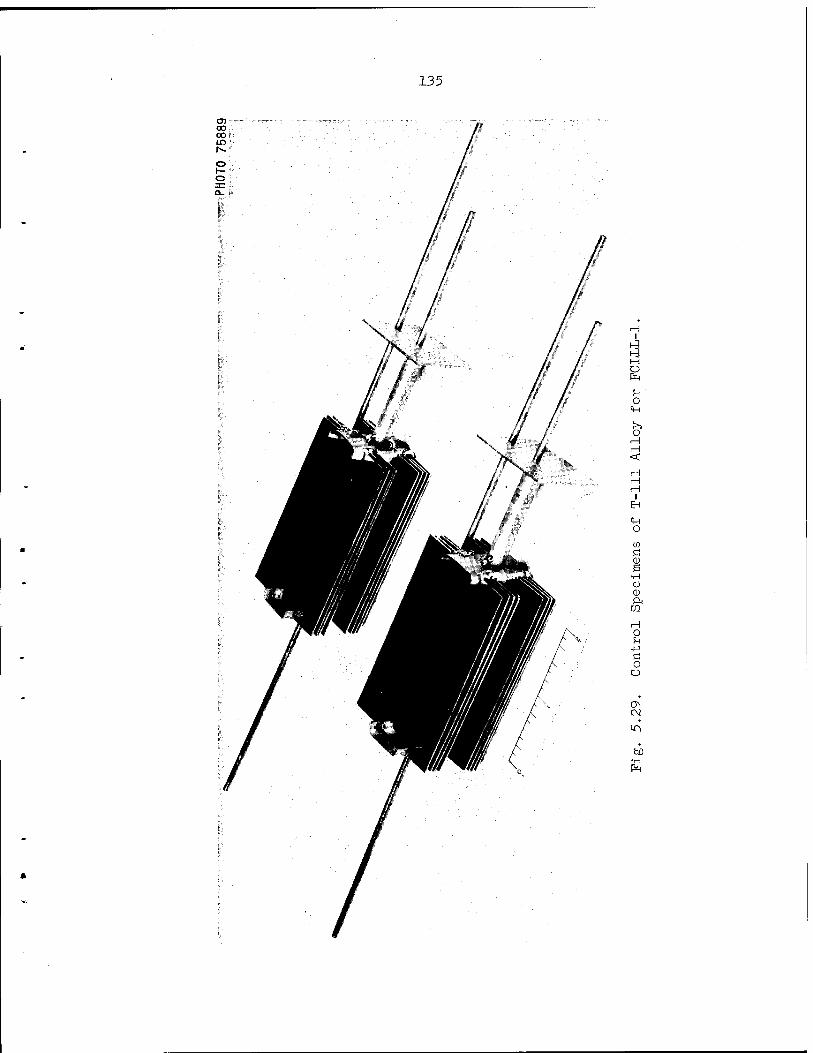
135
03 00 00 in
o a:
H
o
o
o rH
I Bi
<H O
CD S D
•H O <D ft
CO
iH O u -p Ö o o
ON CM
w •H
PAET III.
RADIATION DAMAGE TO STRUCTURAL MATERIALS
139
6. BEHAVIOR OF REFRACTORY MATERIALS UNDER IRRADIATION
G. W. Keilholtz R. E. Moore D. A. Dyslin1
The purpose of this program is to evaluate the effects of high fast-
neutron fluences at temperatures from 150 to 1100°C on the properties of
refractory nuclear materials for both space and civilian power reactors.
While we emphasize nonfissionable ceramic materials such as the carbides,
nitrides, and silicides of refractory metals, we have extended the scope
of the work to include irradiation of fuels of interest to fast breeder
reactors.
Irradiation Damage to Nonfissionable Refractory Materials
Refractory Metal Carbides
Irradiation of Explosion-Pressed Carbides at 1000 to 1100°C. — An
in-reactor thermal annealing effect on gross damage and volume expansion
had been previously observed2 in irradiations of hot-pressed and slip-
cast carbides at 1000 to 1100°C. Recent results from another high-
temperature assembly indicate that thermal annealing also reduces damage
to explosion-pressed carbides during irradiation at 1000 to 1100°C. The
assembly, which was irradiated in the ETR, consisted of seven temperature-
controlled capsules, each of which contained a pair of specimens of the
same material, as shown in Table 6.1.
The pair of specimens of WC that received fast-neutron fluences of
1.6 X 10²¹ neutrons/cm2 and the two pairs of specimens of NbC were found
to be inseparably bonded together after irradiation. We also observed
this phenomenon in some hot-pressed and slip-cast carbides irradiated at
high temperature. It may result from a combined effect of atomic cas-
cades produced by fast neutrons at contact areas and thermal
■•■General Engineering Division. 2G. W. Keilholtz, R. E. Moore, and D. A. Dyslin, Fuels and Materials
Development Program Quart. Progr. Rept., June 30, 1968, ORNL-4330, pp. 151-158.
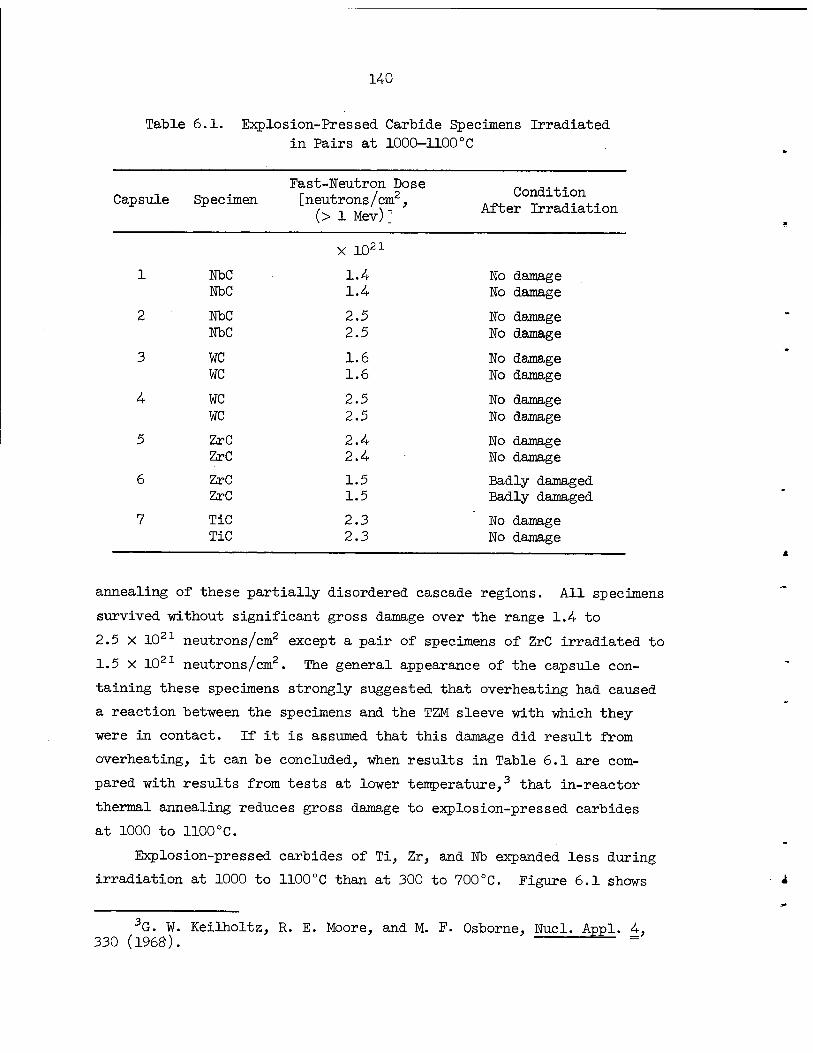
140
Table 6.1. Explosion-Pressed Carbide Specimens Irradiated in Pairs at 1000-1100°C
Capsule Specimen Fast-Neutron Dose [neutrons/cm2,
(> 1 Mev)]
Condition After Irradiation
X 1021
1 NbC NbC
1.4 1.4
No No
damage damage
2 NbC NbC
2.5 2.5
No No
damage damage
3 WC WC
1.6 1.6
No No
damage damage
4 WC WC
2.5 2.5
No No
damage damage
5 ZrC ZrC
2.4 2.4
No No
damage damage
6 ZrC ZrC
1.5 1.5
Badly damaged Badly damaged
7 TiC TiC
2.3 2.3
No No
damage damage
annealing of these partially disordered cascade regions. All specimens
survived without significant gross damage over the range 1.4 to
2.5 x 10²¹ neutrons/cm2 except a pair of specimens of ZrC irradiated to
1.5 x 10²¹ neutrons/cm2. The general appearance of the capsule con-
taining these specimens strongly suggested that overheating had caused
a reaction between the specimens and the TZM sleeve with which they
were in contact. If it is assumed that this damage did result from
overheating, it can be concluded, when results in Table 6.1 are com-
pared with results from tests at lower temperature,3 that in-reactor
thermal annealing reduces gross damage to explosion-pressed carbides
at 1000 to 1100°C.
Explosion-pressed carbides of Ti, Zr, and Nb expanded less during
irradiation at 1000 to 1100°C than at 300 to 700°C. Figure 6.1 shows
3G. W. Keilholtz, R. E. Moore, and M. F. Osborne, Nucl. Appl. 4, 330 (1968). ^" =
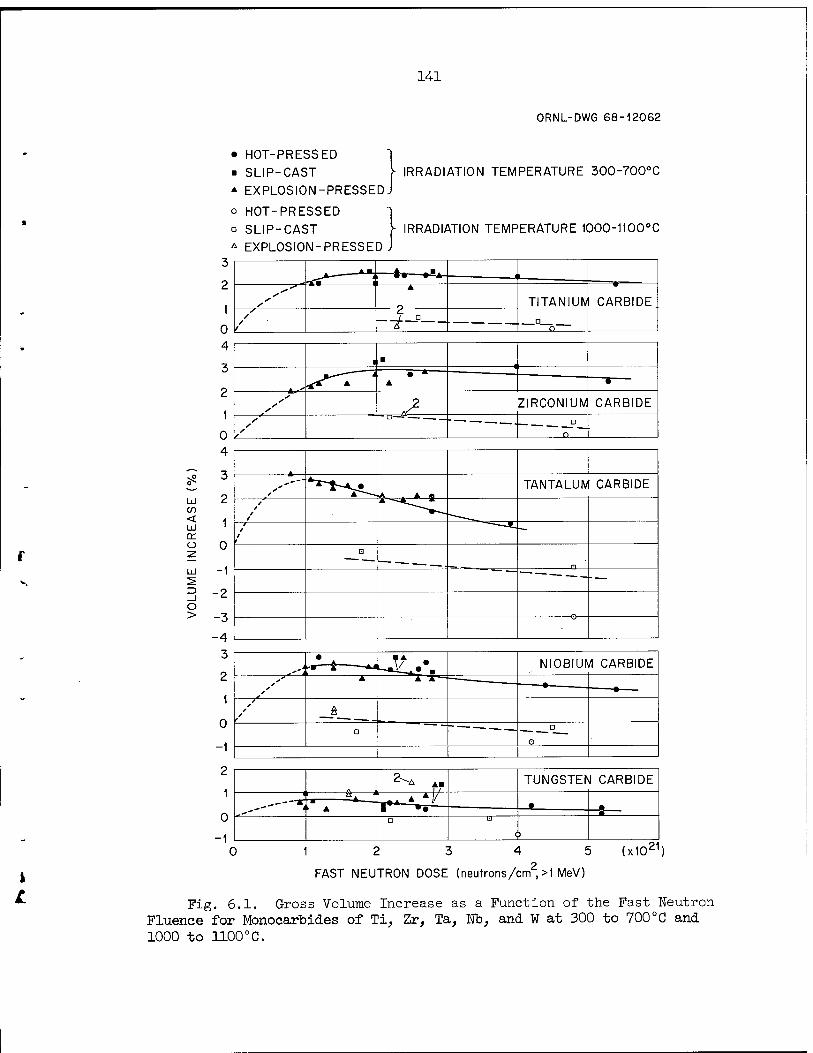
141
ORNL-DWG 68-12062
t L
* HOT-PRESSED ] ■ SLIP-CAST \ IRRADIATION TEMPERATURE 300-700°C
* EXPLOSION-PRESSEDJ
o HOT-PRESSED "| ° SLIP-CAST V IRRADIATION TEMPERATURE 1000-1I00°C
* EXPLOSION - PRESSED J 3
2
1
0 4
3
2
1
0 4
i 3 UJ 2 < 1
o 0 }■ z LÜ
3 "2 o > -3
M, *-"j; *• • "A- II Ä ii j
TITANIUM
•
CARBIDE / / /
c
o
1 ■ ( i
■tf*^ A
A • * A —«—
s s ^2 —n—^
ZIRCONIUM CARBIDE
• s o
-4 3
2
1
0
-1
2
1
0
-1
A . A « TANTALUM CARBIDE
4* / / / ir-*^.^^ *
/ / / r
a . i_
—
-
• 1* 1 1 j?..*. MinpiiiM rARRinr rB 1 —-Ai
* A ▲ A—
•
* / t
£
a ~— — —_ D
o
2-A Am TUNGSTEN CARBIDE 1 ß J "■ ■ ■ A
' -. A Vl/ • .
D U
>
•
1 (x1021)
FAST NEUTRON DOSE (neutrons/cm ,>1 MeV)
Fig. 6.1. Gross Volume Increase as a Function of the Fast Neutron Fluence for Monocarbides of Ti, Zr, Ta, Nb, and W at 300 to 700°C and 1000 to 1100°C.

142
that high-temperature data for explosion-pressed carbides of Ti, Zr, and
Nb agree with data for hot-pressed and slip-cast specimens. Uhexplain-
ably, explosion-pressed WC expanded more during irradiation at 1000 to
1100°C than specimens of WC made by the other two processes. The irra-
diated carbides are being examined by metallography, x-ray diffraction,
and replication electron microscopy to establish the mechanisms of damage.
Effects of Fast Neutrons on Carbides at Low Temperature. — Dimen-
sional measurements of refractory metal carbides irradiated at low tem-
perature (300 to 700°C) showed2'3 an initial expansion that reaches a
maximum between 1 and 2 X 10²¹ neutrons/cm2 (> 1 Mev). Higher fluences
produced shrinkage that appears to approach a constant net expansion
value in each case (see Fig. 6.l). We proposed a simple model to
explain the swelling-shrinkage phenomenon. We assumed that fast neutrons
produce atomic cascades that leave regions of low density within the
specimens and that fast-neutron strikes on atomic nuclei in or near these
regions will anneal them to produce new regions of higher density. The
simplest equation for volume expansion derived from this model is
AV/V = (K2 - 1) - (K2 - 1) e"^d(*t) + (Ki _ Ks) - (n) e"<r8Na(*t) S CL
(6.1)
where
AV/v = fractional volume increase,
<t>t = fast-neutron fluence,
Ki = density of original crystalline material per density of
primary disordered regions,
K2 = density of original crystalline material per density of
secondary disordered region,
cr = average scattering cross section for atoms of the carbides s for fast neutrons of the neutron energy spectrum,
N^ = average number of displaced atoms per collision of a
fast neutron with an atomic nucleus.
t
1
143
It can be shown that this equation fits the low-temperature data for
carbides with physically realistic constants if the volume expansion
between 0 and 1 x 10²¹ neutrons/cm2(d>t) is assumed to follow the dashed
lines in Fig. 6.1. However, it is necessary to obtain low-dose data
as one of the tests of the damage model and, assuming the data do not
contradict the model, to obtain information helpful for evaluating the
constants of the equation. If the equation for volume expansion is
differentiated, the expression for the change in AV/v with change in
(<Dt) is
^M/Il = (Kl - 1) ä N„ e-*s%(*t) _ (Kl - K2)(ä N.)2 (0t) e-^d^t).
d(<t>t) s d s a
(6.2)
If we let (*t) approach 0, the initial slope change is
a(Av/v) = (Kl -i)äL. (6.3) d(O)t) s d
This value can be used for evaluating constants in the equation for
volume expansion for the various carbides.
We are planning a short (one ETR cycle) irradiation of explosion-
pressed and slip-cast carbides at low temperature to obtain the informa-
tion discussed above and a low-temperature irradiation in the EBR-II to
separate the effects of absorptions of slow neutrons on the carbides.
The EBR-II neutron energy spectrum consists almost entirely of fast
neutrons.
Refractory Metal Nitrides
Commercial nitrides of Zr, Ti, Ta, and Nb have been irradiated as
1/2- x 1/2-in. solid cylinders at 1000 to 1100°C in the ETR. The fast-
neutron fluence ranged from 0.4 to 2.3 X 10²¹ neutrons/cm2 (> 1 Mev).
There was not as much gross damage to ZrW at 1000 to 1100°C as in
previous irradiations4 at about 150°C. Four of five specimens irra-
diated to fluences ranging from 0.4 to 2.3 X 10²¹ neutrons/cm2 survived ■
4G. W. Keilholtz and R. E. Moore, Reactor Chem. Div. Ann. Progr. Rept. December 31, 1967, 0RNL-4229, p. 143.
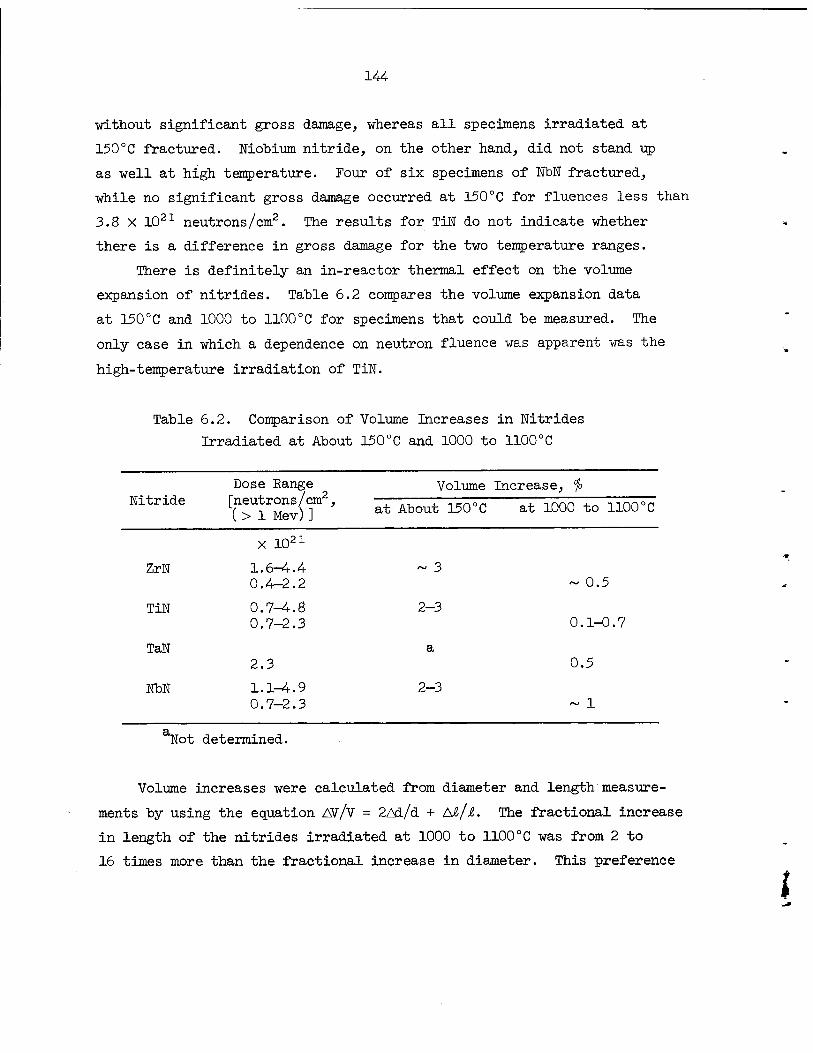
144
without significant gross damage, whereas all specimens irradiated at
150°C fractured. Niobium nitride, on the other hand, did not stand up
as well at high temperature. Four of six specimens of NbN fractured,
while no significant gross damage occurred at 150CC for fluences less than
3.8 X 10²¹ neutrons/cm2. The results for TiN do not indicate whether
there is a difference in gross damage for the two temperature ranges.
There is definitely an in-reactor thermal effect on the volume
expansion of nitrides. Table 6.2 compares the volume expansion data
at 150°C and 1000 to 1100°C for specimens that could be measured. The
only case in which a dependence on neutron fluence was apparent was the
high-temperature irradiation of TiN.
Table 6.2. Comparison of Volume Increases in Nitrides
Irradiated at About 150°C and 1000 to 1100°C
Nitride Dose Range [neutrons/cm2, ( > 1 Mev)]
Volume Increase, fo
at About 150°C at 1000 to 1100°C
X 10 21
ZrN 1.6—4.4 0.4-2.2
TiN 0.7-4.8 0.7-2.3
TaN 2.3
NbN 1.1-4.9 0.7-2.3
~ 3
2-3
2-3
0.5
0.1-0.7
0.5
n^fot determined.
Volume increases were calculated from diameter and length measure-
ments by using the equation AV/v = 2Ad/d + A#/i. The fractional increase
in length of the nitrides irradiated at 1000 to 1100°C was from 2 to
16 times more than the fractional increase in diameter. This preference
i

145
for axial expansion, which did not occur at 150°C, can be explained by
the constraint on radial expansion imposed by the TZM sleeves in which
the specimens were enclosed and the absence of constraint on axial
expansion. This phenomenon can be most easily understood if gas genera-
tion within the specimens is responsible for the observed expansion.
Helium gas, produced randomly in nitrides through the (n,a) reaction,
would, of course, diffuse in the direction of least resistance. Any
helium gas in excess of that which can diffuse out of the specimen or
into voids within grains must align itself to expand the entire specimen
in the direction of least constraint. The greater mobility of atoms at
high temperatures would facilitate preferential alignment.
The nitride irradiations were initiated as a preliminary survey,
for their technology, unlike that of the carbides which we had begun
investigating earlier, was relatively undeveloped. The specimens, bought
from commercial sources, show a generally poor microstructure and stoi-
chiometry, but the results provide hope that nitrides may prove useful
as high-temperature nuclear materials. Several questions pertinent to
the use of nitrides for the LMFBR program, however, have been raised
from this work. Improvements in nitride technology may make it possible
to prepare nitrides of higher quality with which experiments can be
specifically designed to answer such questions as the role of the (n,a)
reaction in producing damage and whether an improved microstructure will
reduce fracturing.
Effects of Irradiation on LMFBR Fuels
Irradiations of Depleted UN, UC, and U(C,N) Fuels
These experiments are aimed at determining the effect of the
generation of He through the (n,a) reaction on nitride fuels. The first
irradiation assembly is being fabricated, and the specimens of depleted
fuel are being prepared.
146
7. FAST-NEUTRON IRRADIATION EFFECTS ON ELECTRICAL INSULATORS
G. W. Keilholtz R. E. Moore D. A. Dyslin1
The purpose of this program is to establish the effects of fast
neutrons on materials suitable for use as electrical insulators in
thermionic converters and to evaluate mechanisms of neutron damage in
these materials from 150 to 1100°C.
General Survey of Fast-Neutron Effects on Electrical Insulators
This task is aimed at determining fast-neutron effects on a variety
of materials with properties that are required for thermionic insulators.
A low-temperature (l50°c) assembly containing l/2- x l/2-in. cylindrical
specimens of large-grain (25 pm) translucent A1203, sintered MgO, and
Si20N2 is being irradiated2 in the ETR. This assembly will be removed
from the ETR on December 2, 1968. A high-temperature (600, 800, 1100°C)
assembly containing the same types of specimens as well as other mate-
rials of thermionic interest will be irradiated starting in the last
half of FY 1969.
Irradiation of High-Density Commercial A1203 Products Considered for Thermionic Insulators
Irradiations in ETR
A short-term assembly and a long-term assembly containing three
commercial types of A1203 in the form of both solid cylinders and thin-
walled cylindrical shells were irradiated2 in the ETR at 600, 800, and
1100°C. The short-term irradiation has been completed, and the speci-
mens will soon be examined. The fast-neutron fluence ranges from 0.3 to
1.8 x 10²¹ neutrons/cm2 (> 1 Mev). The long-term assembly will be
removed from the ETR late in FY 1969.
-■■General Engineering Division. 2G. W. Keilholtz, R. E. Moore, and D. A. Dyslin, Fuels and Materials
Development Program Quart. Progr. Rept., June 30, 1968, CRNL-4330, . pp. 160-164.

147
Irradiations in EBR-II
The same types of specimens of A1203 irradiated in the ETR will be
irradiated in the EBR-II to test the effect of neutron energy on damage.
Three columns of specimens will be irradiated simultaneously with
different capsule parameters for each column determined in such a way
that when gamma-heating rate uncertainties are considered the tempera-
tures of the three columns will bracket 800°C. The specimens are being
prepared, and the irradiation assemblies are being designed.
Irradiations of Metal-Clad AI2O3 Specimens
Units consisting of cylindrical shells of metal-clad A1203, fabri-
cated at other installations, are now undergoing irradiation in the ETR.
This assembly will be removed from the ETR for postirradiation examina-
tions in March 1969. The fast-neutron fluence will range from about 0.4-
to 2 x 10²¹ neutrons/cm2 (> 1 Mev).

73929 14-8
8. MECHANICAL PROPERTIES RESEARCH AND LMFBR CLADDING AND STRUCTURAL MATERIALS DEVELOPMENT
C. J. McHargue J. R. Weir, Jr.
I Work in this program includes studies of the high-temperature
irradiation 6mhritt]jnngnt_anrl other technologically important aspects
of radiation damage to fuel cladding materials at high neutron fluence.
The work centers around types 304 and 316 stainless steel, Incoloy 800,
and Hastelloy N and the effects of titanium concentration in these alloys
on radiation damage, with emphasis on LMFBR applications. Associated
with the program are studies of the effects of tubing fabrication
variables on the properties of types 304 and 316 stainless steel and
related compositions. /
Development of Titanium-Modified Type 304 Stainless Steel
G. A. Reimann T. M. Nilsson
Tubing of titanium-modified types 304 and 304L stainless steel has a
been drawn to final size (0.250-in. outside diameter x 0.218-in. inside
diameter) from several tube shells and two heats of material. This
tubing has been submitted for nondestructive testing".
Recovery of usable material from extruded' tube shells has averaged
75.5$ for the modified type 304 stainless steel. About 65% of the
finish-machined tube shells have been converted to l/4-in.-diam tubing.
Final recovery rates of tubing that will meet specifications for the
Fast Flux Test Facility will not be known until the completion of
nondestructive testing.
About 240 ft of tubing was examined with the borescope after drawing.
Although'this technique gives qualitative results only, it appears that
about half the tubing may be acceptable.
The planetary swager was placed in operation, and we used it for J
the final pass on part of the tubing. This technique appears to have M
certain advantages over conventional methods of tube drawing, and we
will investigate it further.

149 ' '■
Several problem areas are apparent in the fabrication schedule:
(1) large grain size, (2) duplex grain structures, (3) eccentricity,
(4) straightness, and (5) scratches. Possible solutions that will
increase the yield of acceptable tubing are being evaluated in further
drawing tests.
We are also examining the influence of processing variables on grain
size, since it is essential to have a uniformly fine-grained microstruc-
ture. The grain sizes of the tubing (0.250-in. outside diameter X 0.016-in.
wall thickness) we first examined are shown in Table 8.1. The first batch
was mandrel drawn in 26 passes, each of about 15$ reduction, with a
20-min anneal at 1200°C between each pass. The annealing schedule for
the last four passes (27 to 30) varied. One-third of the tubing was
annealed after the first two passes, one-third was annealed after the
first three passes, and the remaining third was not annealed at all
(43$ reduction). The processing of both the first and second batches
has been reported earlier.1 Table 8.1 shows that the grain sizes range
from ASTM Nos. 5 through 8. Grain size decreases with increasing cold
work and decreasing annealing temperatures, which is in agreement with
the general recrystallization behavior of metals. Larger amounts of
cold work also tend to eliminate variations in grain size through the
tube wall.
Development of Titanium-Modified Types 316 and 316L Stainless Steel
E. E. Bloom
We are investigating the effects of small titanium additions on the
mechanical properties of types 316 and 316L stainless steel. The alloys
included in this investigation are from 50-lb heats melted by vacuum
induction and have the compositions listed in Table 8.2. Baseline or
reference data have been obtained from two commercial heats, melted in
air, of types 316 and 316L stainless steel.2
1G. A. Reimann, Fuels and Materials Development Program Quart. Progr. Rept. June 30, 1968, 0RNL-4330, pp. 175-176.
2E. E. Bloom, "Radiation Effects in Type 316 and Titanium-Modified Type 316 Stainless Steel," pp. 152-155, this report.
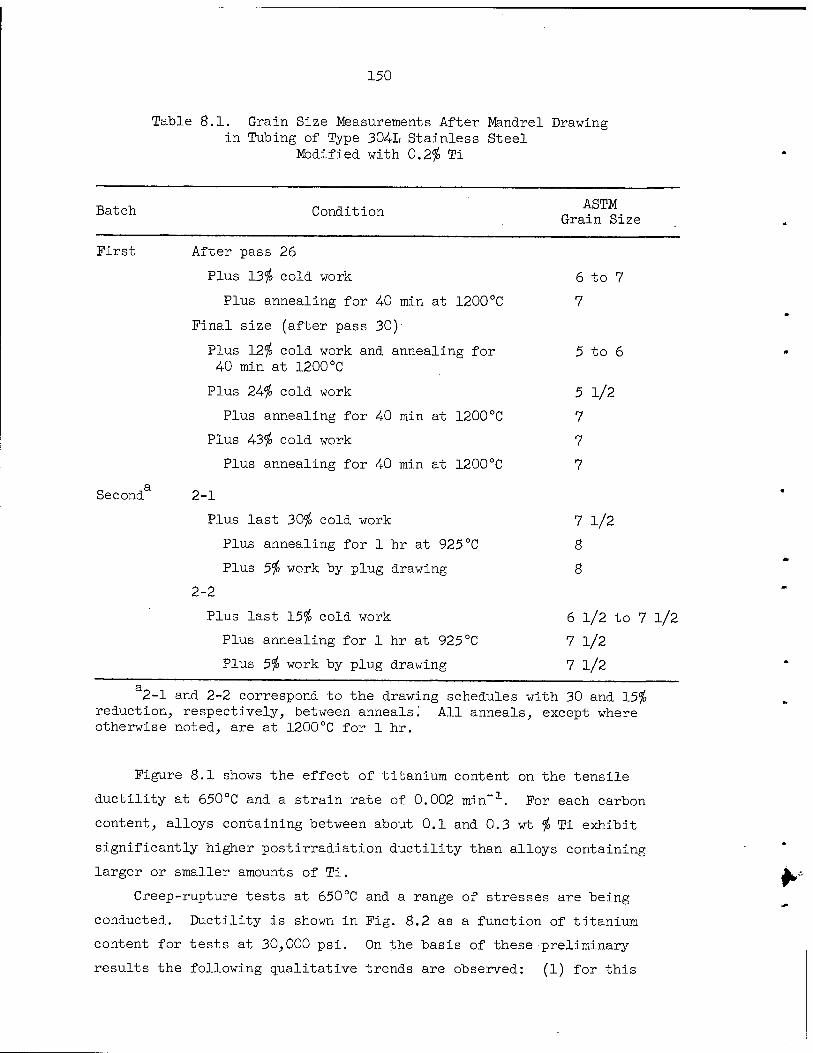
150
Table 8.1. Grain Size Measurements After Mandrel Drawing in Tubing of Type 304L Stainless Steel
Modified with 0.2$ Ti
Batch Condition ASTM Grain Size
First After pass 26
Plus 13$ cold work
Plus annealing for 4-0 min at 1200 °C
Final size (after pass 30)
Plus 12$ cold work and annealing for 40 min at 1200°C
Plus 24$ cold work
Plus annealing for 40 min at 1200°C
Plus 43$ cold work
Plus annealing for 40 min at 1200°C
Seconda 2-1
Plus last 30$ cold work
Plus annealing for 1 hr at 925°C
Plus 5$ work by plug drawing
2-2
Plus last 15$ cold work
Plus annealing for 1 hr at 925°C
Plus 5$ work by plug drawing
6 to 7
7
5 to 6
5 1/2
7
7
7
7 1/2
8
8
6 1/2 to 7 1/2
7 1/2
7 1/2
2-1 and 2-2 correspond to the drawing schedules with 30 and 15$ reduction, respectively, between anneals.' All anneals, except where otherwise noted, are at 1200°C for 1 hr.
Figure 8.1 shows the effect of titanium content on the tensile
ductility at 650°C and a strain rate of 0.002 min"1. For each carbon
content, alloys containing between about 0.1 and 0.3 wt $ Ti exhibit
significantly higher postirradiation ductility than alloys containing
larger or smaller amounts of Ti.
Creep-rupture tests at 650°C and a range of stresses are being
conducted. Ductility is shown in Fig. 8.2 as a function of titanium
content for tests at 30,000 psi. On the basis of these preliminary
results the following qualitative trends are observed: (1) for this
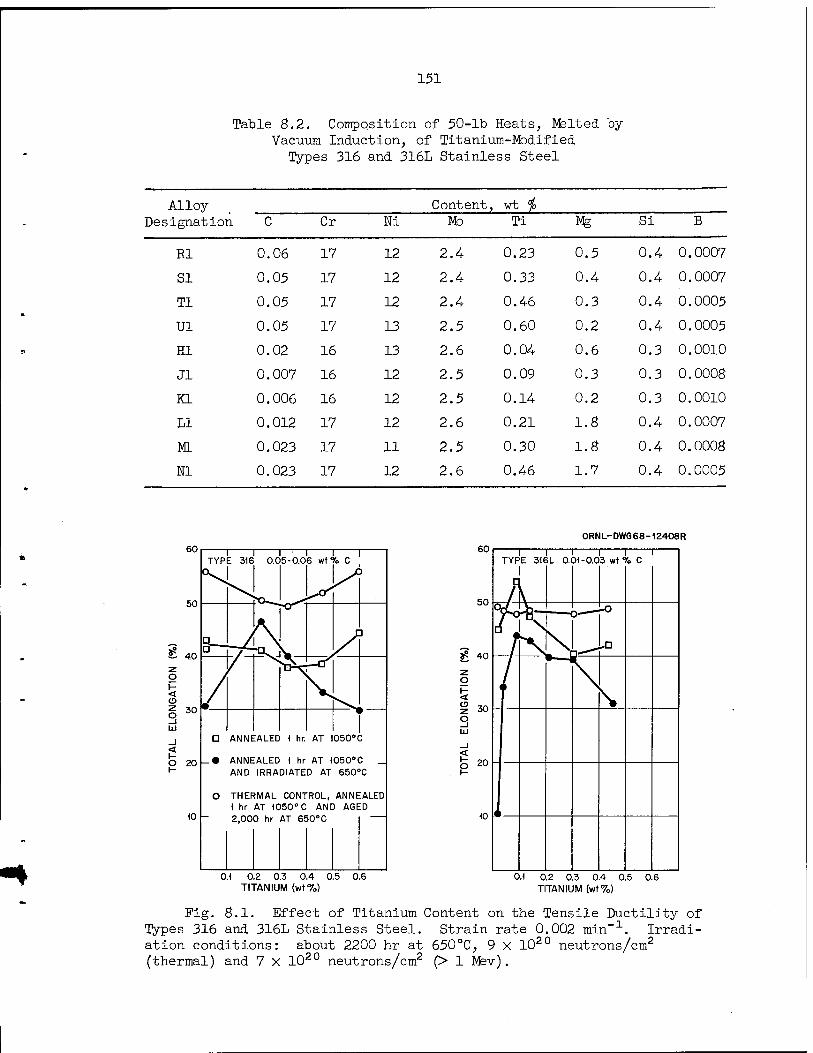
151
Table 8.2. Composition of 50-lb Heats, Melted by Vacuum Induction, of Titanium-Modified
Types 316 and 316L Stainless Steel
Alloy Content, wt io Designation C Cr Ni Mb Ti Mg Si B
Rl 0.06 17 12 2.4 0.23 0.5 0.4 0.0007
SI 0.05 17 12 2.4 0.33 0.4 0.4 0.0007
Tl 0.05 17 12 2.4 0.46 0.3 0.4 ,0.0005
Ul 0.05 17 13 2.5 0.60 0.2 0.4 0.0005
HI 0.02 16 13 2.6 0.04 0.6 0.3 0.0010
Jl 0.007 16 12 2.5 0.09 0.3 0.3 0.0008
EL 0.006 16 12 2.5 0.14 0.2 0.3 0.0010
LI 0.012 17 12 2.6 0.21 1.8 0.4 0.0007
ML 0.023 17 11 2.5 0.30 1.8 0.4 0.0008
Nl 0.023 17 12 2.6 0.46 1.7 0.4 0.0005
ORNL-DWG68-12408R 60
50
4.0
< 30
< I- O 20
10
D ANNEALED 1 hr. AT I050°C
_• ANNEALED I hr AT )050°C _ AND IRRADIATED AT 650°C
O THERMAL CONTROL, ANNEALED I hr AT 1050° C AND AGED 2,000 hr AT 650°C
0.) 0.2 0.3 0.4 0.5 0.6 TITANIUM (wt%)
60 1 1 1 1 I TYPE 316L 0.01-0.03 wt % C
0.1 0.2 0.3 0.4 0.5 0.6 TITANIUM (wt%)
Fig. 8.1. Effect of Titanium Content on the Tensile Ductility of Types 316 and 316L Stainless Steel. Strain rate 0.002 min-1. Irradi- ation conditions: about 2200 hr at 650°C, 9 X 10²⁰ neutrons/cm2
(thermal) and 7 X 10²⁰ neutrons/cm2 (> 1 Mev).

152
100
90
80
S 70
6 60
< g 50
w 40
30
20
10
0
0 .05 -C .08 w1 %CA RBON
n
/ \ k
/ V \
^ I "^ *A •
/ As *^
•
0RNL-DWG68-12712
0.1 0.2 0.3 0.4 0.5 0.6
TITANIUM (wt%)
0.7 0.1 0.2 0.3 0.4 0.5 0.6 0.7
TITANIUM ( wt%)
A-ANNEALED 1 HOUR AT 1050°C. O-ANNEALED 1 HOUR AT 1050°C AND AGED 2000 HOURS AT 650°C. • -ANNEALED 1 HOUR AT 1050°C AND IRRADIATED APPROXIMATELY
2200 HOURS AT 650°C, 9 x 10²⁰neutrons/cm2 (THERMAL) AND 7 x 10zoneutrons/cm2 ( E>1 Mev).
Fig. 8.2. Ductility as a Function of Titanium Content in Type 316 Stainless Steel Tested at 650°C at a Stress of 30,000 psi.
test condition, the ductility in the annealed condition appears to
decrease with increasing titanium content; (2) aging the titanium-
modified alloys results in an increased ductility; (3) for the series
with 0.05 to 0.08 wt % C, maximum postirradiation ductility occurred in
the alloy containing 0.23 wt $ Ti; (4-) in the series with 0.-01 to
0.03 wt % C, the postirradiation ductility was significantly improved
and essentially constant for alloys containing between 0.1 and
0.46 wt i Ti.
Radiation Effects in Type 316 and Titanium-lVbdified Type 316 Stainless Steel
E. E. Bloom
Our investigation of the effects of neutron irradiation on the
mechanical properties of type 316 stainless steel and titanium-modified

153
type 316 stainless steel involves tensile and creep-rupture tests on
specimens in three conditions: (1) annealed, (2) annealed and irradiated,
and (3) annealed and aged at the irradiation temperature for the irradia-
tion time. Variables under investigation include: (1) preirradiation
heat treatment, (2) irradiation temperature, and (3) postirradiation test
conditions, such as test temperature and strain rate.
The chemical compositions of the two heats of material now being
investigated are listed in Table 8.3. Specimens of type 316 stainless
steel have been annealed 1 hr at 1050°C and irradiated for about 2200 hr
at temperatures of 550, 650, and 750°C. The neutron fluences in this
experiment were about 9 x 10²⁰ neutrons/cm2 (thermal) and
7 X 10²⁰ neutrons/cm2 (> 1 Msv). Postirradiation tensile properties
were determined at test temperatures of 550, 650, and 750°C. Results
have indicated that irradiation at these conditions caused a significant
decrease in both uniform and total elongation. The decrease in tensile
ductility parameters was, however, independent of irradiation tempera-
ture over the range investigated. Postirradiation creep-rupture prop-
erties were dependent on irradiation temperature. As the irradiation
temperature was increased in the range of 550 to 750°C, the creep rate
and ductility increased as measured by postirradiation creep-rupture
tests at 650°C.
Postirradiation testing of types 316 and 316L stainless steel
irradiated at 650°C is continuing. Tensile properties of specimens
tested in the unirradiated and irradiated conditions are shown in
Figs. 8.3 and 8.4-. The yield strength of the irradiated specimens of
Table 8.3. Chemical Composition of Types 316 and 316L Stainless Steel
Content, wt $ C Cr Ni Mo Mg Si P S B
Type 316 0.068 17.2 12.5 2.06 1.9 0.5 0.039 0.004 0.0005 Stainless Steel
Type 316L 0.02 16.9 12.7 2.7 2.3 0.58 0.013 0.015 0.0002 Stainless Steel

154
ORNL- DWG 68-12524
3 30
■\ . A \
7 0
IRRADIATED »
550 650 750 850 550 650 750 85
TEST TEMPERATURE CC) TEST TEMPERATURE (°C) O-ANNEALED ONE HOUR AT (050°C. »-ANNEALED ONE HOUR AT (050 "C AND IRRADIATED AT 650 °C: O-ANNEALED ONE HOUR AT <050°C AND AGED 2000 HOURS
AT 650°C
Fig. 8.3. Elevated Temperature Tensile Properties of Type 316 Stainless Steel in the Unirradiated Condition and After Irradiation at 650°C to About 9 X 10²⁰ neutrons/cm2 (Thermal) and 7 X 10²⁰ neutrons/cm2
(> 1 Mev). Strain rate: 0.002 min"1.
550 650 750 850
ORNL-DWG68-I2525
UNIRI ADIATED
■/
C
1 Y
IRR ADIATED
^~~~-~i \~.
550 650 750
TEST TEMPERATURE CO TEST TEMPERATURE (°C) O-ANNEALED ONE HOUR AT (050'C. •-ANNEALED ONE HOUR AT 1050 "C AND IRRADIATED AT 650 "C. ©-ANNEALED ONE HOUR AT (050 °C AND AGED 2000 HOURS
AT 650 "C.
Fig. 8.4-. Elevated Temperature Tensile Properties of Type 316L Stainless Steel in the Unirradiated Condition and After Irradiation at 650°C to About 9 X 10²⁰ neutrons/cm2 (Thermal) and 7 X 10²⁰ neutrons/cm2
(> 1 Mev). Strain rate: 0.002 min-1.

155
both alloys was higher than that of annealed specimens. This increase
appears to result from thermal aging rather than the irradiation, since
specimens aged 2000 hr at 650°C also exhibit increased yield strength.
There also appears to be a trend for both irradiated and thermal control
specimens to have slightly lower ultimate tensile strengths than the
as-annealed specimens. Over the range of test temperatures between 550
and 750°C, there is a significant reduction in total elongation that is
greater for the low-carbon alloy than for the high-carbon alloy, even
though the low-carbon alloy had a somewhat lower boron content and
finer grain size. This suggests that differences in microstructure,
such as the distribution of carbide precipitate, are important.
A comparison of the creep-rupture properties of these two alloys
at 650°C is shown in Fig. 8.5. The life to rupture of both alloys is
reduced by neutron irradiation. Irradiated specimens of type 316 stain-
less steel exhibited both reduced ductility and an increased minimum
creep rate as compared to specimens in the as-annealed condition. The
thermal control tests completed to date indicate that the increased
creep rate is a result of thermal aging and that the reduced ductility
is a result of neutron irradiation. For type 316L stainless steel
irradiated under the same conditions, the minimum creep rates of annealed,
irradiated, and thermal control specimens were comparable for the stresses
investigated, and the reduced life to rupture results from a large
reduction in ductility. Figure 8.6 compares the ductility of these two
alloys as a function of strain rate for tests at 650°C. At high strain
rates, the postirradiation ductility of type 316 stainless steel is
significantly higher than that of type 316L stainless steel, while at
lower strain rates, the ductilities of the two alloys are comparable.
Effects of Titanium and Carbon Variations in Incoloy 800
D. G. Harman
We determined the tensile properties of specimens from several experi-
mental heats at 20 to 900°C and a strain rate of 0.02 min"1. We heat
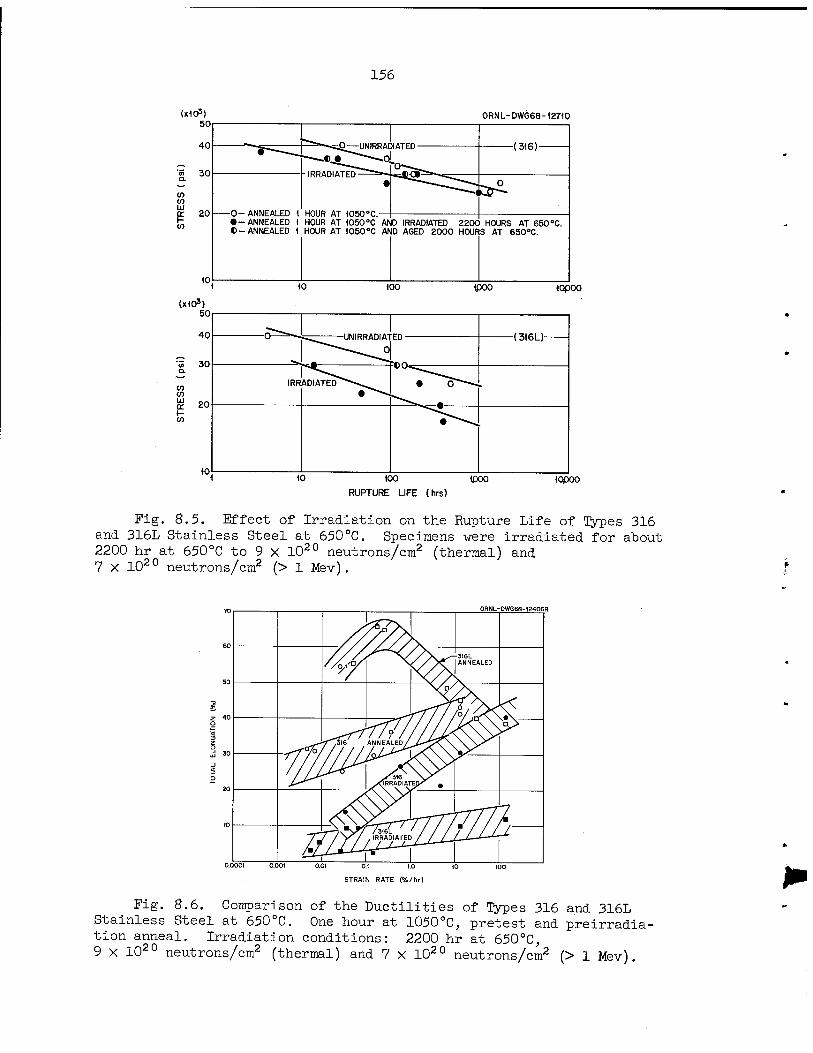
156
(xio5) 50
40
'S 30
0RNL-DWG68-12710
to </) Ui a: i- tn
20
10
-O- ANNEALED 1 HOUR AT 1050°C • -ANNEALED I HOUR AT 1050°C AND IRRADIATED 2200 HOURS AT 650°C. «-ANNEALED 1 HOUR AT 1050°C AND AGED 2000 HOURS AT 650°C.
10 100 ipoo 10P00
10 100
RUPTURE LIFE (hrs) ipoo ICpOO
Fig. 8.5. Effect of Irradiation on the Rupture Life of Types 316 and 316L Stainless Steel at 650°C. Specimens were irradiated for about 2200 hr at 650°C to 9 X 10²⁰ neutrons/cm2 (thermal) and 7 X 10²⁰ neutrons/cm2 (> 1 Mev).
0RNL-DWG68-12406R
STRAIN RATE (%/hr)
Fig. 8.6. Comparison of the Ductilities of Types 316 and 316L Stainless Steel at 650°C. One hour at 1050°C, pretest and preirradia- tion anneal. Irradiation conditions: 2200 hr at 650°C, 9 X 10²⁰ neutrons/cm2 (thermal) and 7 X 10²⁰ neutrons/cm2 (> 1 Mev).

157
treated the specimens to produce the mill-annealed condition. The heats
containing 0.03 wt $> C were held at 982°C for 30 min and those containing
0.12 wt % C were held at 1038°C for 30 min. Figures 8.7 through 8.9
show, respectively, the ultimate tensile strength, the 0.2$ yield
strength, and the total elongation plotted against the test temperature.
In each case, the property curve from International Nickel Company's
commercial Incoloy 800 is shown for comparison.
The yield strength values shown in Fig. 8.8 are particularly impor-
tant, since design stresses based on the ASME Boiler and Pressure Vessel
Code utilize yield strength values at temperatures below about 650°C for
this alloy. Figure 8.8 shows the significantly higher yield strength of
the high-carbon alloys as compared to the alloys of the low-carbon
content typical of current commercial Incoloy 800. Although solution
annealed material will, in general, have a lower yield strength, we
expect the high-carbon alloy to show a strength advantage.
(xlO3) ORNL-DWG68-I2523R
100
a. _^— HIGH CARBON
WfTrrnrd
is 8° z UJ en f- 03
NTvi\\\\\ ^■;
■^y\\™Vu LOW CARBON-^'^WwA,
y 60 1 1 \w\vA DATA FROM
z INTERNATIONAL
1- NICKEL COMPANY
r 40 2 b o
20
200 400 600
TEMPERATURE (°C)
Fig. 8.7. Tensile Strength of Several Heats of Incoloy 800 Versus Test Temperature. Specimens were held at 982°C [low carbon) or 1038°C (high carbon) for 30 min and tested at 0.02 min . Data from the International Nickel Company on mill-annealed (982°C) hot-rolled rod are shown for comparison. [Ref. Engineering Properties of Incoloy Alloy 800, Technical Bulletin T-40, The International Nickel Company (1964).J
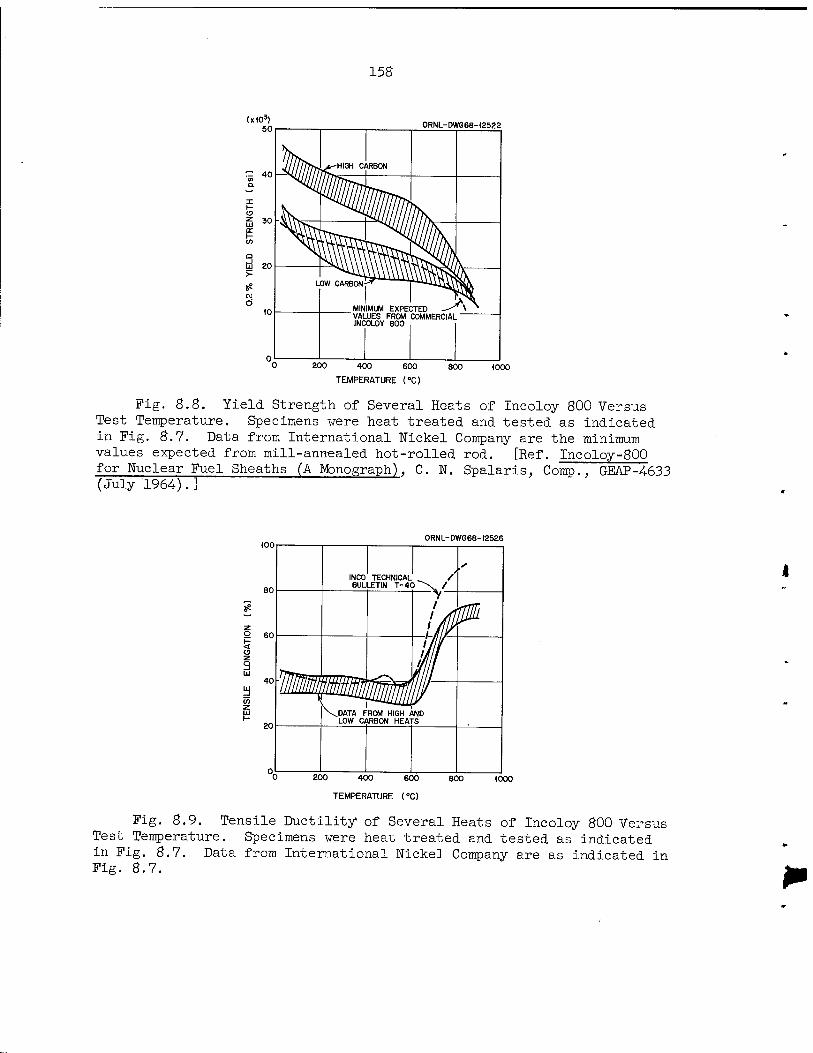
158
(xiO3) 50
40
X H O
ÜJ 20
0RNL-DWG68-12522
MINIMUM EXPECTED -^A VALUES FROM COMMERCIAL — INCOLOY 800
200 400 600
TEMPERATURE CO
800 1000
Fig. 8.8. Yield Strength of Several Heats of Incoloy 800 Versus Test Temperature. Specimens were heat treated and tested as indicated in Fig. 8.7. Data from International Nickel Company are the minimum values expected from mill-annealed hot-rolled rod. [Ref. Incoloy-800 for Nuclear Fuel Sheaths (A Monograph), C. N. Spalaris, Comp., GEAP-4-633 (July 1964.) . ]
0RNL-DWG68-t2526
< a z 9
200 400 600
TEMPERATURE (°C)
800 (000
Fig. 8.9. Tensile Ductility of Several Heats of Incoloy 800 Versus Test Temperature. Specimens were heat treated and tested as indicated in Fig. 8.7. Data from International Nickel Company are as indicated in Fig. 8.7.
159
However, yield strength values should not affect design stresses
for strictly creep situations. Further efforts will be directed toward
evaluating unirradiated Incoloy 800 as a high-temperature structural
material.
Radiation Damage in Incoloy 800
D. G. Harman
We are continuing our evaluation of the irradiation experiment
comparing four heats of Incoloy 800 over a range of grain sizes. Samples
containing 0.03 and 0.12$ C and 0.1 and 0.3$ Ti were irradiated at 700°C
after being heat treated to provide the desired grain sizes.
We reported3 tensile data for both the irradiated and control
specimens and creep-rupture data for the irradiated specimens only.
Several of the control creep tests have been completed, and Table 8.4
shows the current status.
As expected, the irradiated specimens showed about the same minimum
creep rate as did the control specimens. In general, the creep rate
decreased with increasing grain size. For the low-carbon heats, in
which the spread in grain size was larger, this amounted to a difference
of an order of magnitude.
Figure 8.10 shows the minimum creep rate versus the approximate
grain diameter for the tests at 12,000 psi. Both the low-carbon alloys
showed the same relationship of creep rate with grain size, but the
heat with 0.1$ Ti consistently showed twice the creep rate of that with
0.3$ Ti. This was also true to some extent for the two high-carbon
heat s.
The low-carbon heats showed lower creep rates than did the high-
carbon heats with the smaller grain sizes, but this was not true for the
larger grain sizes. An extrapolation of the data to larger grain sizes
(higher solution temperature) would indicate the high-carbon material to
3D. G. Harman, Fuels and flkterials Development Program Quart. Progr. Rept. June 30, 1968, ORNL-4330, pp. 188-195.
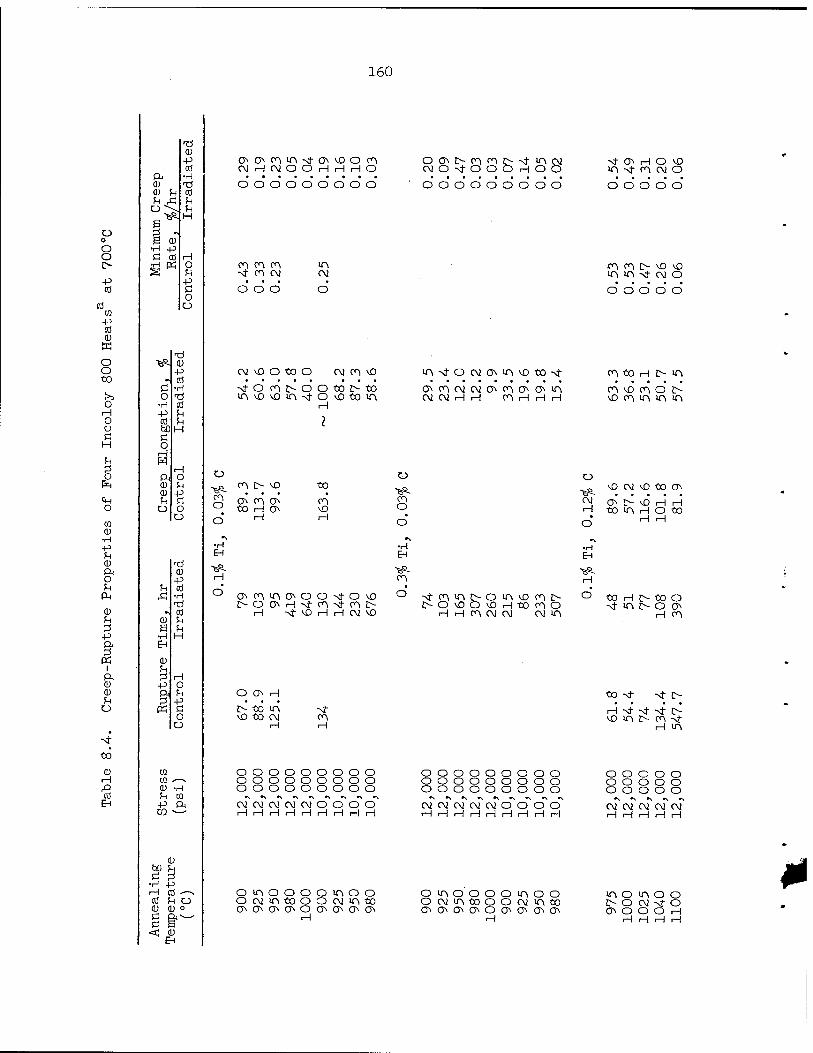
160
o o O o I> -p CO
03 P cd CD K
O O to
% H O O Ö
o
O
03 CD •H -P U <D ft O U
PH
0) fn
-P
I ft 0 CD fn O
to
ft (I) 0) ^ !H ä
C 3 —„ >K
H 3 •> id 0)
•H +5 c 01 r! m ^
•^- CD -P
" cd
o •H p cd bJD Ö o H H
ft (1) 0)
o
0) u
p
Ti CD P cd
•H
cd in £H H
CD 03 H 03 .—^ £> CD -H cd U 03
EH P ft CQ ^—
CD b(i U ö 3
•H P H cd --> cd U o <l) <D o
ft^ <; CD
EH
(noMniANto*»Don CMHCMOOHHi-HO
O O O O O O O O O
OON[>cn<ni>--\t-incM C\)ONt-OOOHOO o o o d d d d d d
NtOHOvD m Nf m CM O d d d d d
Nf en CM
d d d CM
.en en I> NO ^0 T\ in Nl" (A! O d d d d d
CM v£> O tO O CM en NO -<f o en !> o IT\ \0 \D "T\ >J-
O to !> to o vo to in H
I
insj-ocMONi-n^otONt- ONencMCMaNcno'om CM CM H H enHHH
en to H £> in en NO en o i> vo en in in in
cn o
EH
~&.
en !>- NO ON <n ON to H ON H
o to en NO
o
o\eninoooNfOvo £>ooH-sfen-<(-ent>
>FL CM H
d
NO
ON to
CM vO tO O
en o
d I> NO H H m H o to
H H
•H EH
•H EH
en H
o si- en £> o
H
in NO H
t> o O NO en CM
in NO H to CM
en !> en O CM m
O to si-
H O to O m I> O O
H en
O ON H
!> tö in vO to CM
H
to ->* Nf t>
m
ooooooooo ooooooooo ooooooooo CMCMCMCMCMOOOO HHHHHiHHHH
OOOOOOOOO OOOOOOOOO OOOOOOOOO
•\ *s *\ »\ CMCMCMCMCMOOOO HHHHHHHHH
H NT Nf- Nf !> v£) in !> en Nt
H in
o o o o o o o o o o o o o o o
*\ *\ «N *\ *\ CM CM CM CM CM r-\ H r-i H H
omoooomoo ocvmtooocMmto ONONONONOONONONON
H
omoooomoo ocMmtooocMmto ONONONONOONONONON
H
m o m o o £> O CM Ni" O ON O O O H
r-{ r-i r-{ r-i
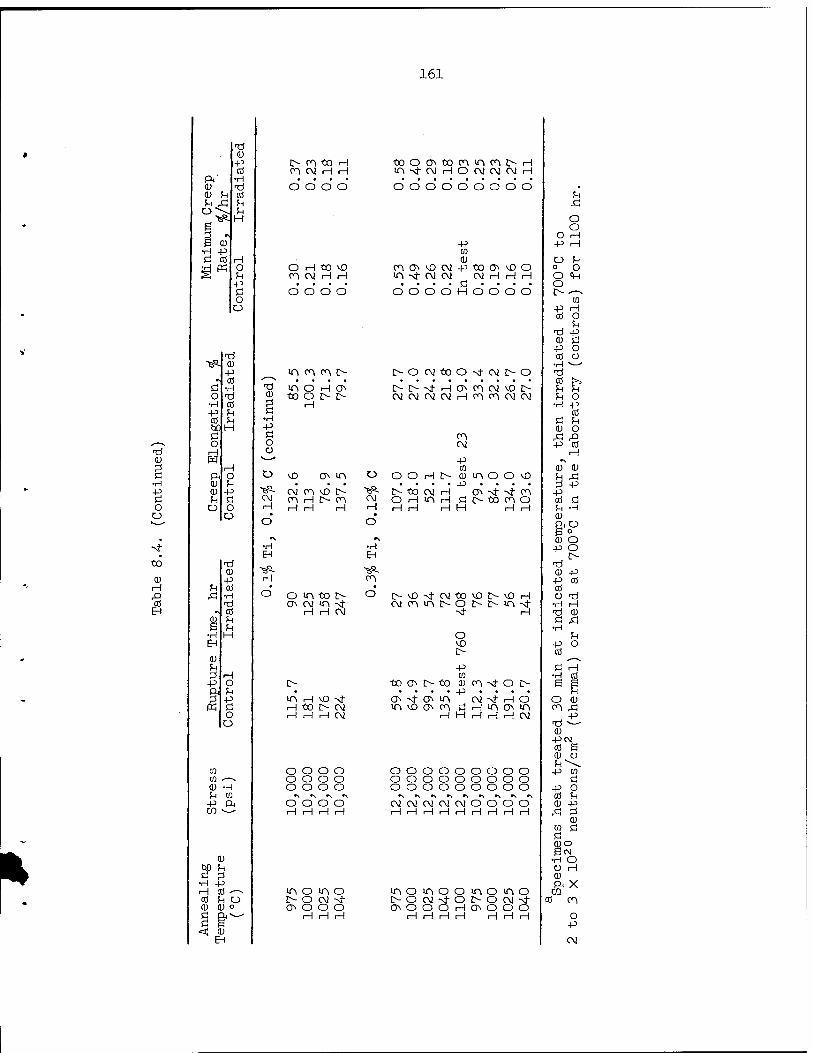
161
cu
g •H
o o
to
0) H
'S EH
%
ö o
•H -P
CÖ taDi Ö o & ft CU <D U ü
Cü u
•H -Cf CÖ fH *H H
H O
-P Ö o o
<D +5
CÖ •H ■rf cö
H
CO CO -—". <ü -H U CD •P ft CQ ^
Cü t>n U ü 2
•H -P H CÖ -— 01 ^ o (!) Cü ° ö &v-' ö H
«1 CÜ EH
I> n to H ClNrlH
O O O O
OHttvD cn C\i H H
o o o o
-d cu
g •H -P Ö o o
CM H
•H EH
H
m cn n c- in o H" ON" to O £> !>
H
vD ON m
C\! cn vO t>
H r~] H
O m 150 L> ON CM ir\ NT
H H CM
m H vD -sf H to C- CM HHHN
o o o o o o o o o o o o •\ *\ »\ *\ o o o o H r-\ H H
tOOOtOC~\mcni>rH ITINJ-CMHOCMCMCMH
d d d d d d d d d
-p Cd 0
fnoNvocNj-pMo^voo m-NfCVCM CVHHH
d d d d H d d d d
"eR- CM H
•H EH
d
L>OCMtOONi-CML>-0
t>f>Nr-HONC^CMvO!>- CMCMCMCMHC^c^CMCM
cn CM
-p CQ cu -p
U O O H L>
L> tO CM H O H m H H H H
T\ O O vD
ON Nj- -vf n !> tO C^ O
H rH
L>\DNtCNjtOvO!>vOH CMr^ir\l>Oc>t>ir\-st-
sf H
o vD L>
-P CQ
to o l> to <ur^Nrot> .... _p ... .
ON->tONlT\ NstHO
<-i i-l H r-i H <M
ooooooooo ooooooooo ooooooooo CMNNCMCMOOOO HHrHHiHHHiHH
m o m o l> O CM Nf ON o o o
H r-\ H
inomooiTiomo LNOCMNfOOOCMNi- ONOOOHONOOO
H H H H H H H
o o
O H P> rH
O fc o O O cp O £> ^
CQ •P H
CÖ O
TH -P Cü -P o CÖ o
•H '
H ?-) ^H O
•H -p CÖ
Ö fH CU O
•^ -9 -P CÖ H
CU
•P
Cü
-p cd c
Cü ft o e o
O O
cu p> CÖ
•H H
-P CÖ
CU
u o
•B •H
-P CÖ
Ö H •H CÖ
5 O CU cn Ä
cu 4JCNJ cö S CU ü
P> CQ ö
-p o CÖ U CD -P Ä ^3
CD CO C Ö (DO H CNl
•H C > C) H fl) ft X 0)
CÖ CN->
o +3
C\!
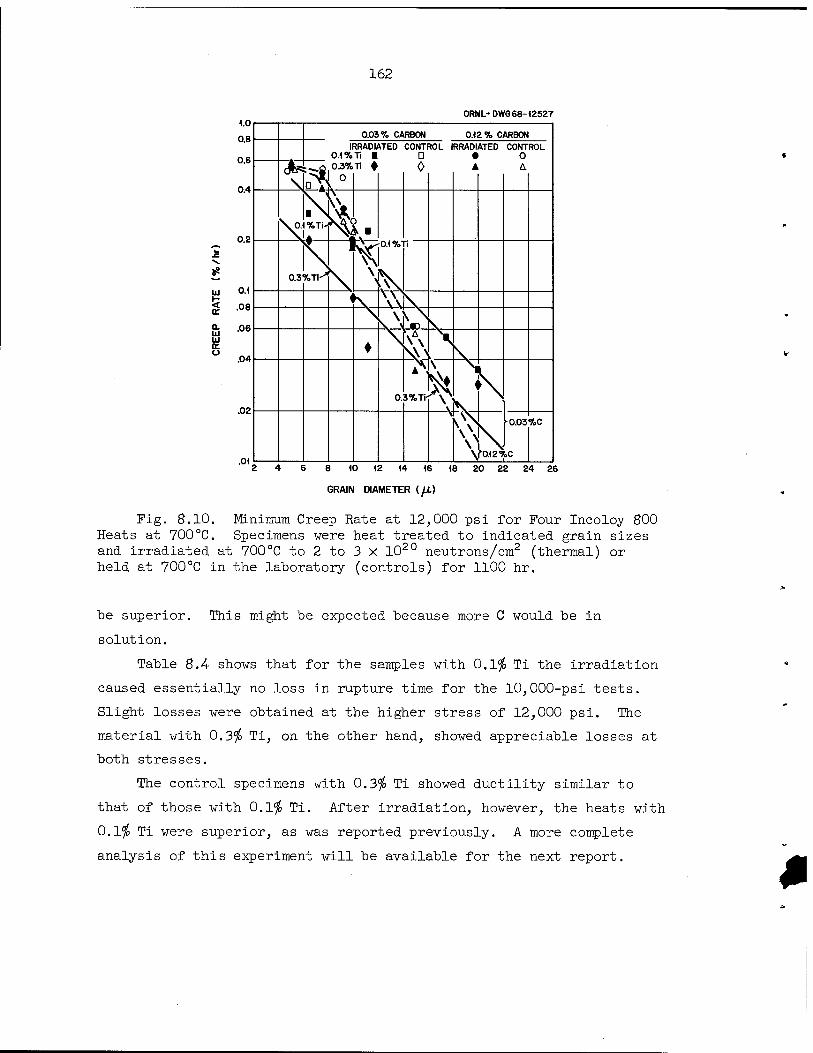
162
s K
a. ui LÜ o: o
1.0
0.8
0.6
0.4
0.2
0.1
.08
.06
.04
.02
.01
0RNL- DWG68-12527
1 0.1%
0.03% CARBON 0.12% CARBON RRADIATED CONTROL IRRADIATED CONTROL Ti ■ 0 • 0
\a V 0.3%Ti ♦
0 0 A A.
0.1%
0.3 CoTi^
1 -i
r w N
♦ foA 0. 5%Ti .N \
^ V\ ^0.03%C
vN 1 Y0.12%C |
2 4 6 8 10 12 14 16 18 20 22 24 26
GRAIN DIAMETER (/£)
Fig. 8.10. Minimum Creep Rate at 12,000 psi for Four Incoloy 800 Heats at 700°C. Specimens were heat treated to indicated grain sizes and irradiated at 700°C to 2 to 3 X 10²⁰ neutrons/cm2 (thermal) or held at 700°C in the laboratory (controls) for 1100 hr.
be superior. This might be expected because more C would be in
solution.
Table 8.4- shows that for the samples with 0.1$ Ti the irradiation
caused essentially no loss in rupture time for the 10,000-psi tests.
Slight losses were obtained at the higher stress of 12,000 psi. The
material with 0.3$ Ti, on the other hand, showed appreciable losses at
both stresses.
The control specimens with 0.3$ Ti showed ductility similar to
that of those with 0.1$ Ti. After irradiation, however, the heats with
0.1$ Ti were superior, as was reported previously. A more complete
analysis of this experiment will be available for the next report.

163
Mechanical Properties of Hastelloy N and Related Compositions
C. E. Sessions H. E. McCoy R. E. Gehlbach
The aim of our current program is the development of a titanium-
modified Hastelloy N with improved resistance to radiation damage. We
have reported on the progress of our scaleup to 100-Ib commercial melts,*
in which both the irradiated and unirradiated mechanical behavior is
superior to that of standard Hastelloy N. We are evaluating
the thermal stability of the modified alloy since the addition of Ti
to this Ni-Mo-Cr system could well influence the aging tendency of the
alloy. We here report studies on aging, irradiation damage, and electron
microscopy that relate to the metallurgical stability of the titanium-
modified compositions at elevated temperatures.
Aging of Titanium-Modified Hastelloy N
Since the presence of Ti may affect the aging tendency of the alloy
system, we are conducting an aging study on four commercial heats. Each
alloy nominally contains Ni-12$ Mo-7$ Cr-0.2$ Mi-0.06$ C, with titanium
concentration (0.15, 0.27, 0.4-5, and 1.2$) being the only significant
variable. We are using the change in the tensile properties at 650°C
and a strain rate of 0.002 min-1 to measure aging. Aging temperatures
of 760 and 650°C are examined for three heat treatments before aging:
1 hr at 1177°C, 1 hr at 1260°C, and 1 hr at 1177°C plus 10$ prestrain
at room temperature. We shall eventually have data for aging times of
1500, 3000, and 10,000 hr; at present, however, only the results for
3000-hr aging are complete.
The changes in the yield strength and the total elongation due to
aging following our standard solution anneal of 1 hr at 1177°C are
shown in Fig. 8.11. The yield strength increases after aging at 650
and 760°C, the increase being greater for the 650°C aging treatment.
*H. E. McCoy and J. R. Weir, Quarterly Progress Report: Irradiation Effects on Reactor Structural Materials, August, September, October, 1967, BNL-678, pp. 11.14-11.19.
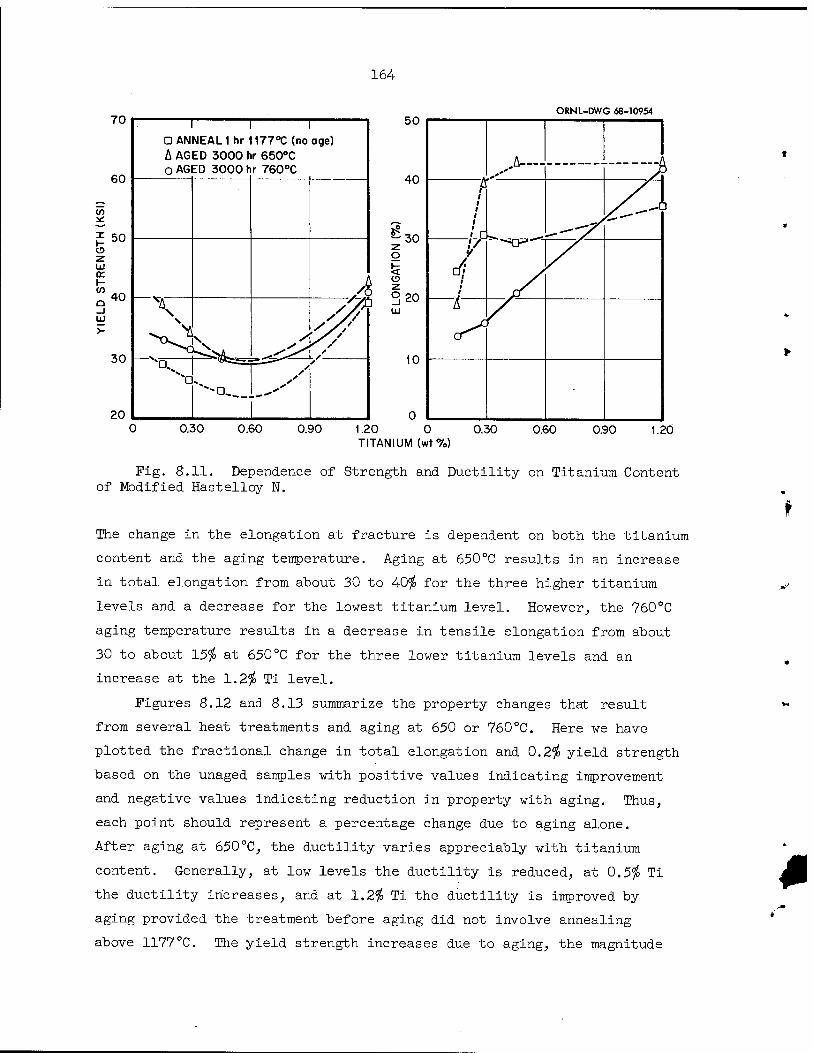
164
70
60
V)
i H O z Lü K I- co a _i LÜ
>-
50
40
30
20
I 1 1 Q ANNEAL 1 hr 1177°C (no age) A AGED 3000 hr 650°C O AGED 3000 hr 760°C
50 ORNL-DWG 68-10954
A 1
yx II 1
1 1
1 1
1 1
.„-/
/ t * 1
*^o-^
&
0.30 0.60 0.90 1.20 0 0.30 TITANIUM (wt%)
0.60 0.90 1.20
Pig. 8.11. Dependence of Strength and Ductility on Titanium Content of Modified Hastelloy W.
The change in the elongation at fracture is dependent on both the titanium
content and the aging temperature. Aging at 650°C results in an increase
in total elongation from about 30 to 40$ for the three higher titanium
levels and a decrease for the lowest titanium level. However, the 760°C
aging temperature results in a decrease in tensile elongation from about
30 to about 15$ at 650°C for the three lower titanium levels and an
increase at the 1.2$ Ti level.
Figures 8.12 and 8.13 summarize the property changes that result
from several heat treatments and aging at 650 or 760°C. Here we have
plotted the fractional change in total elongation and 0.2$ yield strength
based on the unaged samples with positive values indicating improvement
and negative values indicating reduction in property with aging. Thus,
each point should represent a percentage change due to aging alone.
After aging at 650°C, the ductility varies appreciably with titanium
content. Generally, at low levels the ductility is reduced, at 0.5$ Ti
the ductility increases, and at 1.2$ Ti the ductility is improved by
aging provided the treatment before aging did not involve annealing
above 1177°C. The yield strength increases due to aging, the magnitude
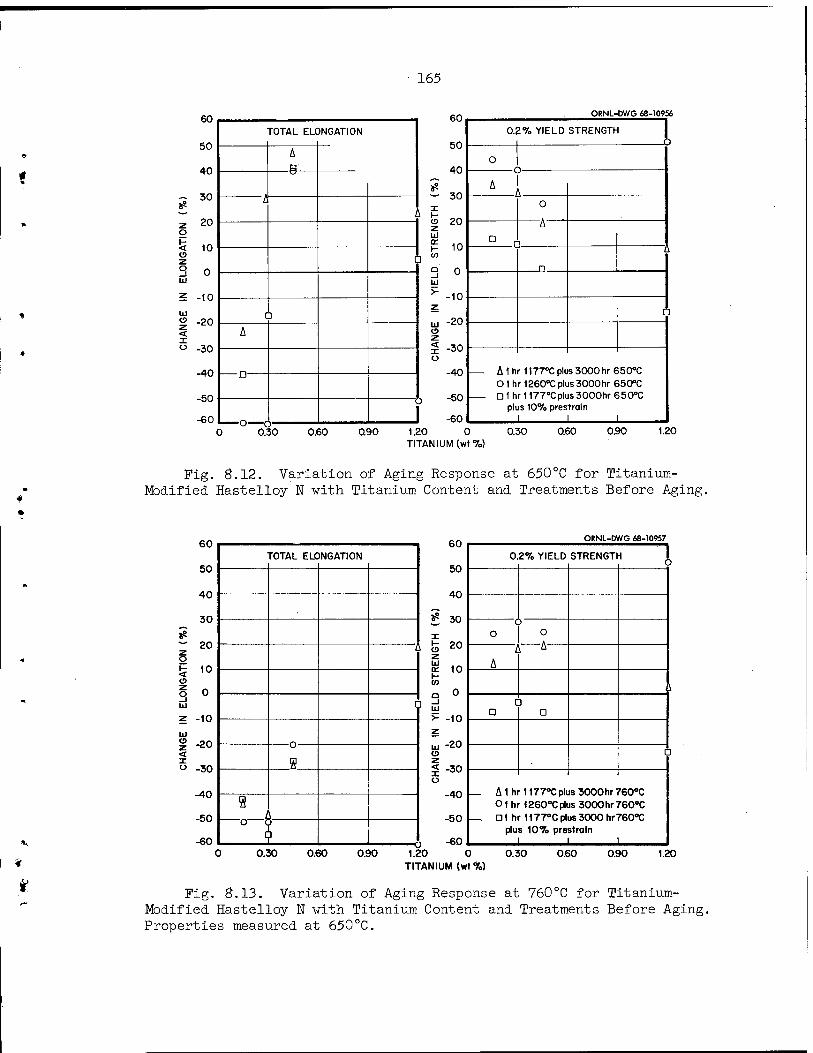
165
60
50
40
S 30
7 20 o h- < 10 «0 7
M 0 Ul
z -10
Ul -20
< I o -30
ORNL-DWG 68-10956
-40
-50
-60
TOTAL ELC )NGATION
A R
A A
[]
a A
D
O
1 0.30 0.60 0.90
50
40
- 30 X
o 20 z Ul
f 10 (n
3 o Ul
>- -10 z
uj -20 o z x -30 o
-40
-50
-60
0.2% YIELD STRENGTH j
O
» i O
a n
n
A
1
— A 1 hr 1177°C plus 3000 hr 650°C 01 hr 1260°C plus3000hr 650°C
Dlhr1177oCplus3000hr650°C plus 10% prestrain
l 1 l
1.20 0 TITANIUM (wt7o)
0.30 0.60 0.90 1.20
Fig. 8.12. Variation of Aging Response at 650°C for Titanium- Modified Hastelloy N with Titanium Content and Treatments Before Aging
£ z o I- < o z 3 Ul
60
50
40
30
20
10
0
-10 Ul i -20 < " -30
-40
-50
-60
TOTAL ELC »NGATI0N
A
i
a
a
o 0.30 0.60 0.90
60
50
40
? 30
fe 20 z Ul o: 10 CO
~ 0
ORNL-DWG 68-10957
0 2% YIELD STRENGT! < l
c o
> O
A i A
A
Ul >- -10 z
ui -20 o
< -30 o
-40
-50
-60
c D D
O
_ Alh Olh
—. Dt h plu 1
r1177°Cpli ' l260°Cpti r 1177°Cpl s 107o pre I I
s3000hr" is 3000hr" JS 3000 hr" strain
r60°c r60°c r60°c
1.20 0 TITANIUM (wt%)
0.30 0.60 0.90 1.20
Fig. 8.13. Variation of Aging Response at 760DC for Titanium- Modified Hastelloy N with Titanium Content and Treatments Before Aging Properties measured at 650°C.

166
of the increase diminishing with increasing titanium content. Using
either a higher temperature for solution annealing (1260°C) or room-
temperature prestraining before aging generally results in higher
strengths and lower ductilities for samples both before and after aging.
As shown in Fig. 8.13, the aging at 760°C has resulted in a large
(30 to 60$) loss in ductility for each heat treatment except at the
1.2$ Ti level. The yield strengths increase on aging at 760°C except
for the sample prestrained 10$ before aging.
The microstructures of the three lower titanium levels appear
similar, and the properties of each were also equivalent. However, the
sample with 1.2$ Ti exhibits precipitation, primarily along bands that
probably resulted from fabrication. The large variation in properties
of this heat with heat treatments (Figs. 8.12 and 8.13) may be partly
attributable to local inhomogeneities within the original ingot that
are evident as localized stringers of precipitate particles.
The magnitude of the observed aging effect at 760°C after 3000 hr
is cause for some concern because we expect creep conditions and neutron
irradiation to further reduce the fracture ductility. The role of Ti
in the aging process is somewhat confusing, and it appears that Ti may
actually be inhibiting rather than causing the aging.
Effects of Irradiation Temperature
Our first tests of mechanical properties of the titanium-modified
Hastelloy N used samples that had been irradiated at 650°C. We found
the properties excellent at test temperatures of 760 and 650°C. In
additional experiments, we have irradiated samples over a broad tempera-
ture range for 1000 hr to a thermal fluence of 3 x 10²⁰ neutrons/cm2 and
run postirradiation creep tests at 650 and 760°C. The stress-rupture
properties of these samples at 650°C are shown in Fig. 8.14. Three
heats of material were involved, each having the nominal composition
Ni-12$ Mo-7$ Cr-0.2$ Ma-0.05$ C-0.5$ Ti. Heat 104 is a 2-lb laboratory
melt made by arc melting virgin stock, and heats 215-45 and 66-548 are
100-lb melts from two different commercial vendors. All three materials *
have better stress-rupture properties than irradiated standard Hastelloy N
at 650°C as long as the irradiation temperature is 660°C or lower. The
t
>
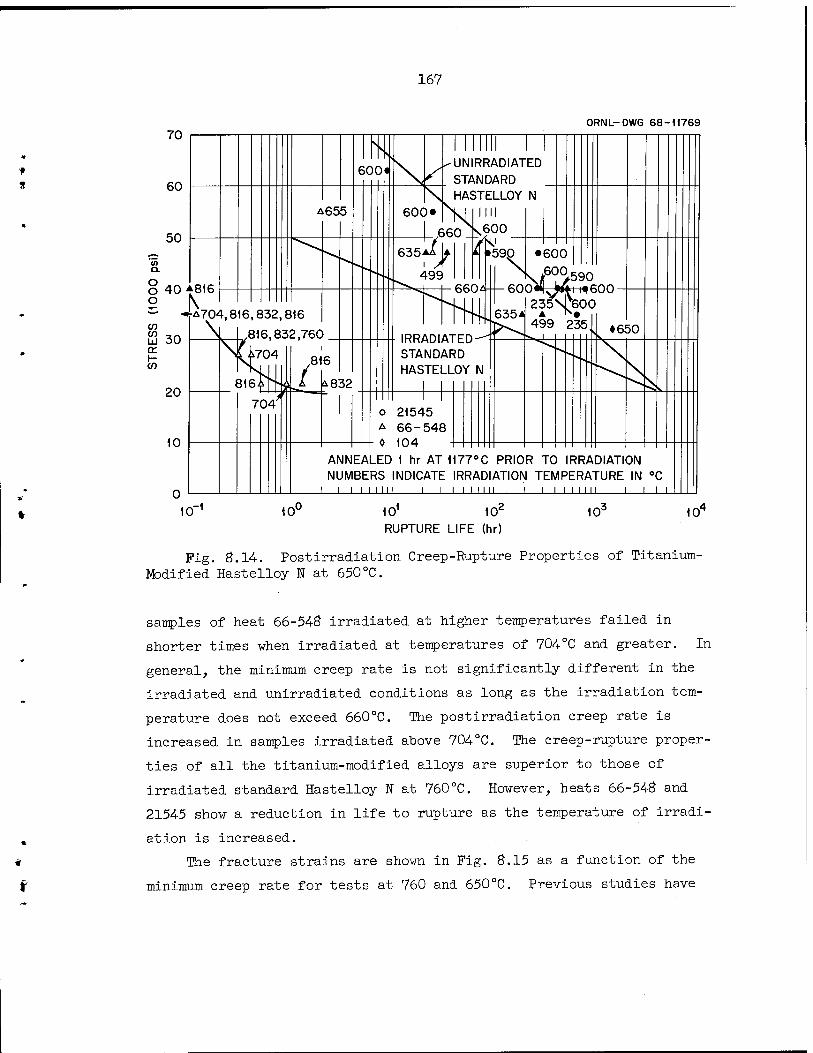
167
ORNL-DWG 68-11769
ANNEALED 1 hr AT 1177°C PRIOR TO IRRADIATION NUMBERS INDICATE IRRADIATION TEMPERATURE IN °C
i i i i i 11 n i i i i i 11 ii i i i i i 11 n i ill
10 10"- 101 102
RUPTURE LIFE (hr) 10J 10"
Fig. 8.14. Postirradiation Creep-Rupture Properties of Titanium- Modified Hastelloy N at 650°C.
samples of heat 66-548 irradiated at higher temperatures failed in
shorter times when irradiated at temperatures of 704°C and greater. In
general, the minimum creep rate is not significantly different in the
irradiated and unirradiated conditions as long as the irradiation tem-
perature does not exceed 660°C. The postirradiation creep rate is
increased in samples irradiated above 704°C. The creep-rupture proper-
ties of all the titanium-modified alloys are superior to those of
irradiated standard Hastelloy N at 760°C. However, heats 66-548 and
21545 show a reduction in life to rupture as the temperature of irradi-
ation is increased.
The fracture strains are shown in Fig. 8.15 as a function of the
minimum creep rate for tests at 760 and 650°C. Previous studies have

168
20
18
16
14
ORNL-DWG 68-1(770
»600-
9600
•600
o 21545 a 66-548 0 104
ANNEALED Ihr AT 1177°C PRIOR TO IRRADIATION NUMBERS INDICATE IRRADIATION TEMPERATURE IN °C
OPEN POINTS-TESTED AT 650°C
CLOSED POINTS - TESTED AT 760°C
10' 10"n 10" MINIMUM CREEP RATE (7o/hr)
10'
Fig. 8.15. Effect of Strain Rate on the Fracture Strain of Titanium- Modified Hastelloy N.
shown5 that the scatterband in Fig. 8.14- holds for air- and vacuum-
melted standard Hastelloy N when irradiated and tested at common tempera-
tures of 650 or 760°C. Note the grouping of points for tests at 650°C
on samples irradiated at 660°C or less and for tests at 760°C on samples
irradiated at 760°C or less. All these samples show an improvement in
fracture strain over that of irradiated standard Hastelloy N. The
samples irradiated at 704°C and above and tested at 650°C fall below
the scatterband for standard Hastelloy N. (These tests also show shorter
rupture lives in Fig. 8.15 and higher creep rates.)
One further observation is that a heat of modified Hastelloy N
(Ni-12$ Mo-7$ Cr-0.2/o lfa.-0.05# C) without the titanium addition also
5H. E. McCoy, M3R Program Semiann. Progr. Rept. Feb. 29, 1968, ORNL-4-254, pp. 198-2ÖT ~

169
showed a marked deterioration of postirradiation properties at 650°C
when irradiated above 700°C. A significant difference in the behavior
of the modified alloys with and without Ti is that the alloy without Ti
(heat 2154-6) recovers its strength as the stress level is decreased.
The samples of heat 2154-6 irradiated above 700 °C that showed reduced
rupture lives also had higher creep rates and lower fracture strains
than samples irradiated at 650°C or lower.
Those observations have shown that the creep properties at 650°C
of at least one 100-lb melt of titanium-modified Hastelloy N deteriorate
when the irradiation temperature is above 700°C. This is of utmost
concern since we want to use this alloy at 700°C. We have also found
that a similar alloy without Ti shows similar behavior. This led us
to question whether such effects are universal for Hastelloy N. We
have never performed an experiment directed at evaluating the effects
of irradiation temperature on the creep-rupture properties of Hastelloy W.
We have found that the properties at 650 and 760°C are not affected
markedly by irradiation temperature between 4-3 and 650°C, but we have
never tested at 650°C a sample irradiated at 760°C. Such an experiment
is now being carried out.
Electron Microscopy Studies
Hastelloy N. — We have found that the types and behavior of pre-
cipitated phases in Hastelloy N are closely related to the concentration
of Si in the alloy.6 The presence of more than about 0.2$ Si in the
melt causes increasing enrichment of the Si in the MgC-type precipitates.
The role of Si appears to be that of substituting for metal in the precipi-
tates, resulting in a silicon-rich JMgC that is stable at temperatures
higher than the true MgC (ref. 7). However, the silicon-rich MgC phase
transforms to the Mo2Ni3Si intermetallic at temperatures above 1300°C. We
* 6R. E. Gehlbach, 1VBR Program Semiann. Progr. Rept. Feb. 29, 1968, „ ORNL-4-254-, pp. 206-213.
t 7R. E. Gehlbach and H. E. iVfcCoy, "Phase Instability in Hastelloy N, " paper presented at the International Symposium on Structural Stability in Superalloys, Seven Springs, Pennsylvania, September 4—6, 1968. To be published in the proceedings.
170
have not evaluated the kinetics of the transformation or the subsequent
decomposition on exposure to lower temperatures. Preliminary investiga-
tions indicate that decomposition occurs with the formation of at least MQC
and M02C. The high-temperature Mo2Ni3Si intermetallic has been identified
both by x-ray diffraction and electron-probe microanalysis from extracted
particles.
In alloys containing about 0.2$ Si some true M6C is formed, which
can be put into solid solution at high annealing temperatures. The
high-temperature suicide phase is not formed. We have found that
decreasing either the Si or Mo causes the precipitation of M02C as well
as the M6C type. Alloys with trace levels of Si have only Mo2C after
extended exposure at elevated temperatures.
Titanium-Modified Hastelloy N. — The microstructure of the titanium-
modified alloy is quite different from that of the standard material.
Two of the major compositional changes that affect the microstructure
and precipitates that form are a decrease in Mo from 16 to 12$ and a
decrease in Si from 0.6 to 0.02$ or less. As a result, precipitates
of the M6C type, which compromise the stringer and grain-boundary
phases in the original version of the alloy, are absent.
Unlike what happens in the standard alloy, precipitates in the
modified Hastelloy N are put into solid solution at normal annealing
temperatures. Exposure at temperatures similar to those expected in
service results in precipitation both at the grain boundary and in the
matrix. Figure 8.16(a) shows the typical mode of precipitation in and
adjacent to the grain boundaries after aging at 650°C for 1500 hr.
Preliminary indications suggest that the precipitates are of the Mo2C
type. We observed [Fig. 8.16(b)] fewer precipitates of slightly dif-
ferent morphology after exposure at 760°C. The tensile ductility
corresponding to this structure was lower than that of the unaged
specimen.
The differences in precipitate morphology and amounts formed at
650 and 760°C are evident in Fig. 8.16. We know, from the results of
tensile tests of aged specimens and from the postirradiation creep-
rupture tests discussed above, that the loss of strength and ductility
coincides with the higher temperatures where fewer precipitates are
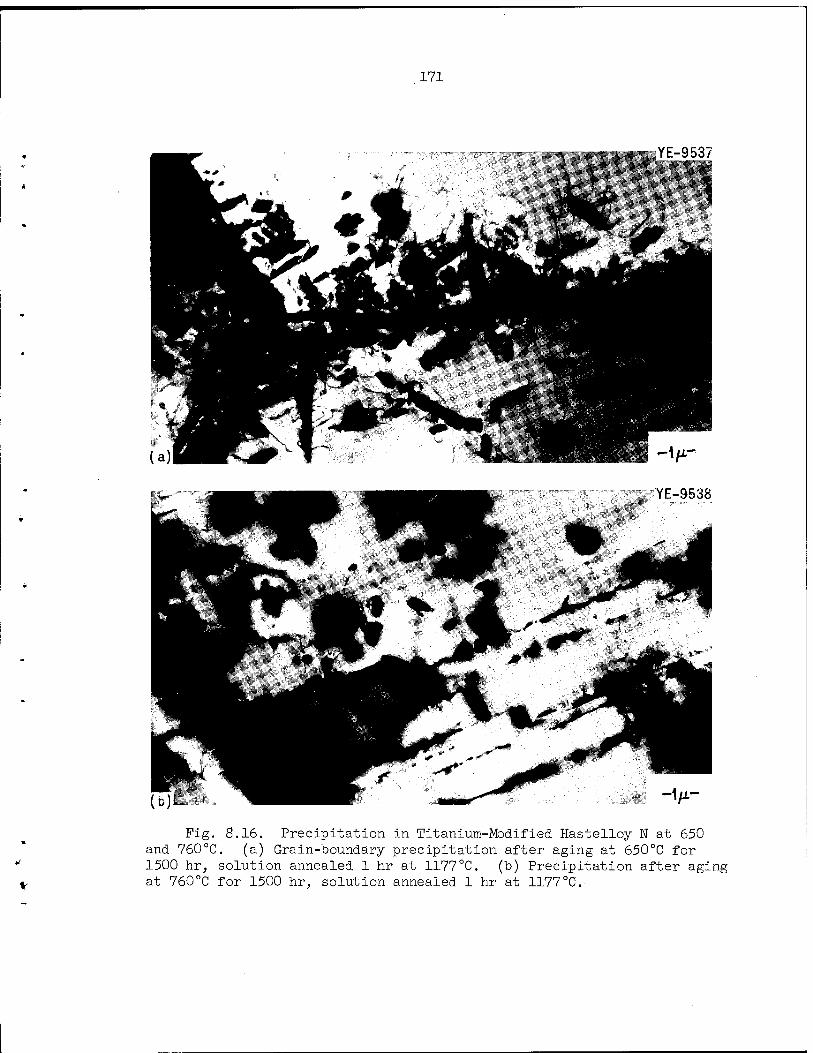
171
YE-9537
YE-9538
Fig. 8.16. Precipitation in Titanium-Modified Hastelloy N at 650 and 760°C. (a) Grain-boundary precipitation after aging at 650°C for 1500 hr, solution annealed 1 hr at 1177°C. (b) Precipitation after aging at 760°C for 1500 hr, solution annealed 1 hr at 1177°C-
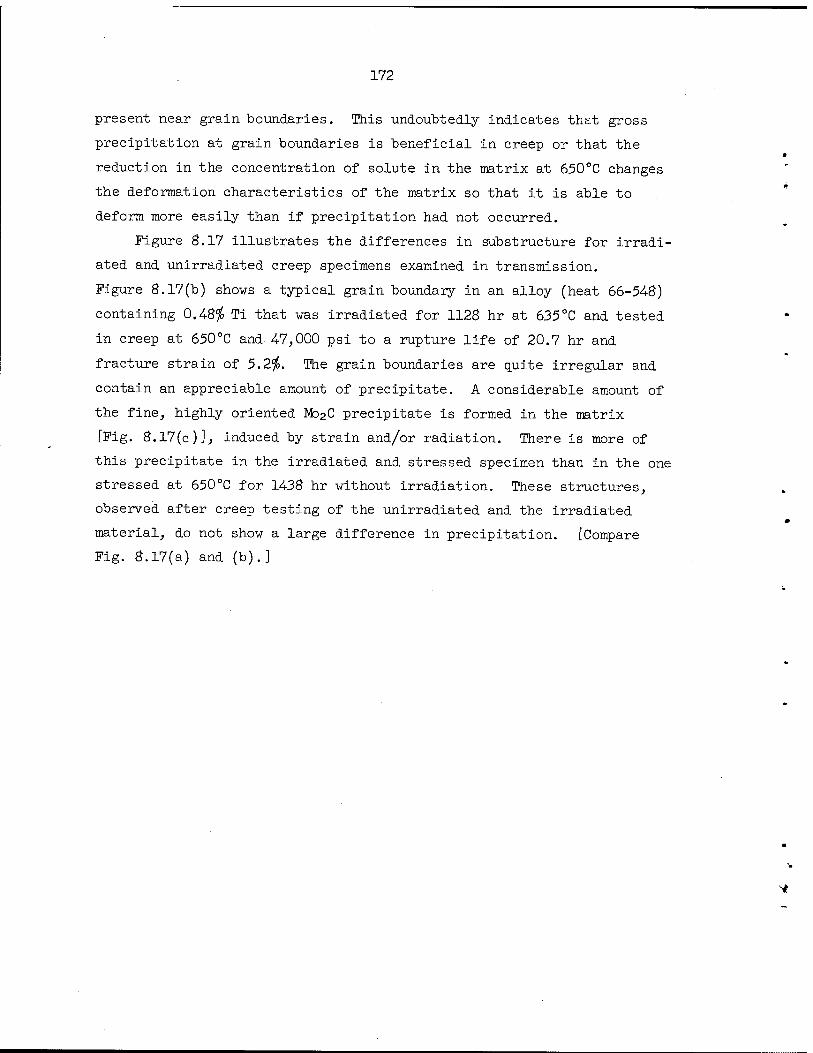
172
present near grain boundaries. This undoubtedly indicates that gross
precipitation at grain boundaries is beneficial in creep or that the
reduction in the concentration of solute in the matrix at 650°C changes
the deformation characteristics of the matrix so that it is able to
deform more easily than if precipitation had not occurred.
Figure 8.17 illustrates the differences in substructure for irradi-
ated and unirradiated creep specimens examined in transmission.
Figure 8.17(b) shows a typical grain boundary in an alloy (heat 66-54-8)
containing 0.48$ Ti that was irradiated for 1128 hr at 635°C and tested
in creep at 650°C and 47,000 psi to a rupture life of 20.7 hr and
fracture strain of 5.2$. The grain boundaries are quite irregular and
contain an appreciable amount of precipitate. A considerable amount of
the fine, highly oriented Mo2C precipitate is formed in the matrix
[Fig. 8.17(c)], induced by strain and/or radiation. There is more of
this precipitate in the irradiated and stressed specimen than in the one
stressed at 650°C for 1438 hr without irradiation. These structures,
observed after creep testing of the unirradiated and the irradiated
material, do not show a large difference in precipitation. [Compare
Fig. 8.17(a) and (b).]
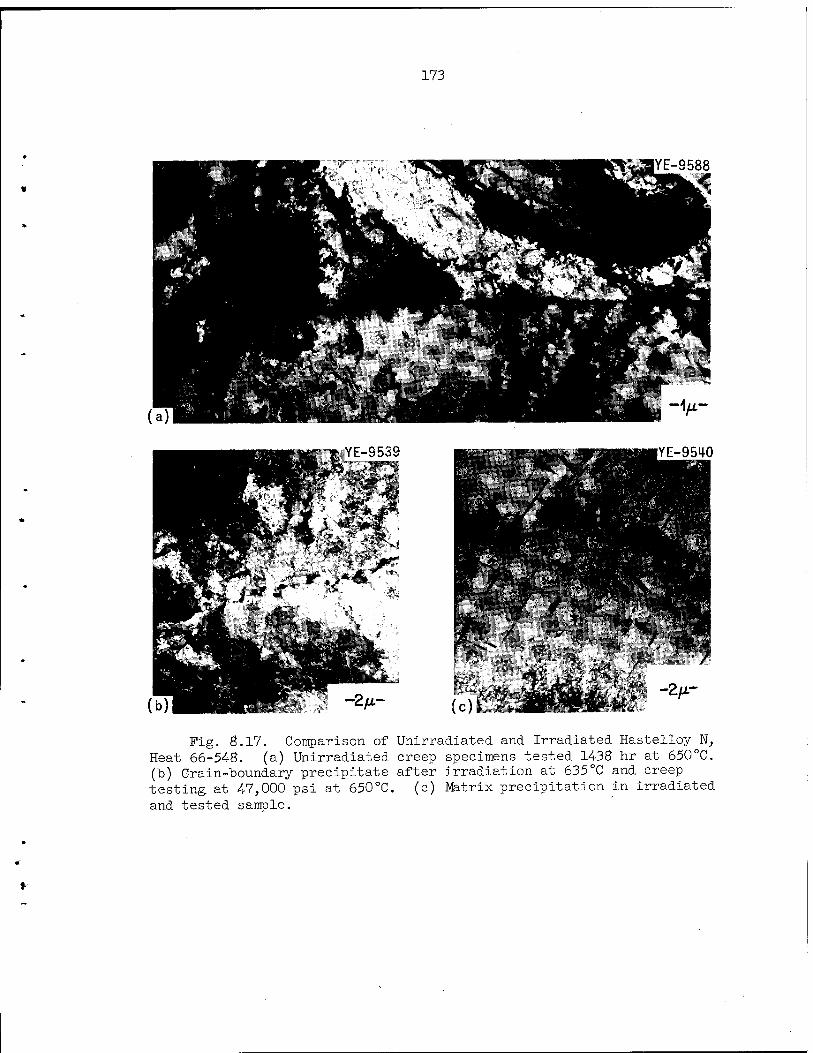
173
MSgy *r Fig. 8.17. Comparison of Unirradiated and Irradiated Hastelloy N,
Heat 66-54-8. (a) Unirradiated creep specimens tested 1438 hr at 650°C. (b) Grain-boundary precipitate after irradiation at 635°C and creep testing, at 47,000 psi at 650°C. (c) Matrix precipitation in irradiated and tested sample.

73930 174
9. RADIATION EFFECTS IN ALLOYS AND STRUCTURAL MATERIALS
M. S. Wechsler
|The object of this program is to investigate the underlying causes
of the embrittlement of metals and structural alloys by radiation.
Because of the critical importance of reactor pressure vessels, the
program is particularly concerned with reactor irradiation effects in
Fe and pressure-vessel steels.
The materials under study are base metal, heat-affected zones, and
the weld metal in the commercial ASTM pressure-vessel alloys such as £3 £•£ ߣ ■ &S.
A 302-B, A 533-B, and A 54-3. The variables being investigated A 2L£,B,
are material history, composition, the irradiation neutron flux and
spectrum, and the irradiation temperature.
To enlarge the understanding of the effects produced by the interac-
tion of the irradiation-induced defects and impurities in the commercial
steels, we include studies of the effects of irradiation on Fe and V.
Radiation Effects on Pressure-Vessel Steels
Radiation Hardening and Embrittlement in ASTM A 212-B Steel (N. E. Hinkle, R. G. Berggren. W. J. Stelzman, T. N. Jones, M. S. Wechsler, and C. R. Case II1)
In a previous report2 we described an attempt to relate radiation
hardening, as determined by measurements of tensile yield and fracture
stress, to radiation embrittlement exhibited by Charpy notch-impact
specimens of ASTM A 212-B pressure-vessel steel. Through the use of an
estimated correction of strain rate, a calculated triaxiality factor,3
1Summer Trainee from University of Wisconsin, Oshkosh, Wisconsin, sponsored by Oak Ridge Associated Universities.
2M. S. Wechsler, N. E. Hinkle, R. G. Berggren, and W. J. Stelzman, Radiation Metallurgy Section Solid State Division Progress Report for Period Ending January 1968, ORNL-4246, pp. 6-27.
3T. R. Wilshaw and P. L. Pratt, "The Effect of Temperature and Strain Rate on the Deformation and Fracture of Mild-Steel Charpy Samples," pp. 973-991 in Proceedings First International Conference on Fracture, Vol. 2, The Japanese Society for Strength and Fracture of Materials, Japan, 1966.
175
and the assumption of a cleavage fracture load independent of tempera-
ture and strain rate, we found that the radiation hardening was more
than sufficient to cause the observed shift in ductile-to-brittle transi-
tion temperature (DBTT). In order to define this relationship more
precisely, we have extended our investigation of the effect of strain
rate on yielding and fracture in the notched specimens. To do this, it
was necessary to obtain quantitative measurements of the load applied
to Charpy notched-bar specimens as a function of strain rate and temper-
ature. Two approaches were taken to measure the loads applied to the
notched-bar samples. First, the strikers of the impact machines were
fitted with strain sensors whose outputs were calibrated to yield the
loads applied to the samples during the impact test. Second, slow-bend
tests were performed at a low strain rate on the notched-bar samples
loaded in three-point bending. The loads were measured in an Instron
machine in tests conducted as a function of temperature in a test
chamber cooled by liquid N. To elucidate the strain pattern near the
root of the notch, we attempted to reveal yield zones by etching.
Although most of our earlier work has been devoted to the
ASTM A 212-B steel, our studies have now been extended to include
ASTM A 533-B pressure-vessel steel. This is described in another section
of this report.4'
The information that can be determined from a standard impact test
includes the total energy to fracture, fracture appearance, and lateral
expansion and contraction; but no details of the deformation during the
test are provided. Wilshaw and Pratt,3 Fearnehough and Hoy,5 and
Tetelman and McEvily6 have shown that the load and energy absorbed by
a Charpy notch-impact specimen can be determined at any time during the
test with an impact machine instrumented with strain sensors. We believe
^R. G. Berggren et al., "Radiation Hardening and Embrittlement in ASTM A 533-B Steel," pp. 189-194, this report.
5G. D. Fearnehough and C. J. Hoy, J. Iron Steel Inst. (London) 202, 912-920 (November 1964).
6A. S. Tetelman and A. J. McEvily, Jr., Fracture of Structural Materials, pp. 322-325, Wiley, New York, 1967.
176
that the instrumented Charpy impact test provides a favorable tool for
studying the relationship between radiation hardening and embrittlement.
We have completed the instrumentation of two impact machines, one
for use in a hot cell and one for use in the laboratory. The laboratory
machine was equipped with a strain-gage bridge network consisting of a
pair of Baldwin-Lima-Hamilton foil strain gages (type FAE-50-35S6,
0.5-in. gage length). These were placed in recesses on the sides of
the Charpy striker along the center of the impact to serve as the
active bridge element. A pair of identical gages for temperature com-
pensation, located on the striker flange, served as the inactive bridge
elements.
The impact machine used in the hot cell has a pair of
Budd He-121-R2TC strain gages placed in recesses on the sides of the
striker. These are high-elongation, rosette foil gages with a two-
element 90° rectangular grid of l/8-in. gage length. They are oriented
to provide strain measurements parallel and normal to the direction of
impact. All four sensor elements are active in this bridge network.
A Tektronix Model 54-3 oscilloscope, equipped with a Type Q plug-in
module, provides the alternating-current excitation voltage for the
strain-gage bridge. The output voltage of the bridge network is dis-
played on the oscilloscope screen. The oscilloscope has a single-sweep
internal triggering mode that is armed manually as the pendulum descends
at the start of a test. The oscilloscope traces are photographed with
a Polaroid camera (see Fig. ?.l).
Both systems were calibrated statically for load on an Instron
tensile machine. The load was applied to the striker via a standard
Charpy notch-impact specimen properly positioned at the point of contact
at the leading edge of the striker. The strain in the striker, as
detected by the strain gages and traced on the oscilloscope screen, is
directly proportional to the applied load, which is detected by the
load cell of the tensile machine and graphically displayed on a strip-
chart recorder. As an indication of the reliability of the oscilloscope
traces and the load calibration, the fracture energies of a series of
tests have been derived from the traces. These are compared in Fig. 9.2
with the fracture energies obtained from the scale on the impact machine.

177
<M
CM CO o>
O O x: D- en
& H
1 ■P
no
II
O
O CM
II
EH
H^^K?9I
to
1 -p
CM ON
II
W
pq o O CM H
II
E-l
•H fH
+5 CO
<D
-P
Ö o
Q) +3
ä CD ÖD CO o Ö
•H Co in -P CO
(U
-P <+H O
t? P<
o
-p
o CO
cu o CO
0 ft o Ü w o H . H 0) •H a
o o
H -P • Ü
CT* CO
.§« tiOH
•H Pq a)
+5
o

178
70
Q 60 er o ü ÜJ er Lj 50 D_ o o 10 O
40 ü <n o
o
> tr ÜJ
UJ
ü <
30
20
10
0
ORNL-DWG 68-11393
>
3f
y£
/A
> o SSD ITEM 15€
a SSD ITEM 157 >
/ft
0 10 20 30 40 50 60 70 FRACTURE ENERGY FROM IMPACT TEST MACHINE SCALE (ft-lb)
Fig. 9.2. Comparison of the Fracture Energy Measured by the Impact Machine with the Fracture Energy Calculated from the Oscilloscope Traces.
Charpy notch-impact specimens were also bend tested at low strain rate
in a three-point-bend test apparatus mounted on an Instron tensile
machine. The sample holder for the bend tests has the same shape as
the anvil and striker of the impact machine.
The general yield load and fracture load for the impact tests on
the A 212-B steel (Solid State Division Item 156) as measured with the
strain-gage instrumentation are shown as a function of temperature in
Fig. 9.3 (open and closed squares, respectively). The corresponding
quantities for the slow-bend tests as measured on the tensile machine
are also shown (open and closed circles, respectively). We see that
the curves for impact tests are shifted about 150°C upward on the tem-
perature scale with respect to the curves for slow-bend tests. The
fracture load curves for impact and slow-bend tests have a similar shape,
but the general yield curve for slow-bend tests appears to decrease
more rapidly with increasing temperature than that for the impact tests.
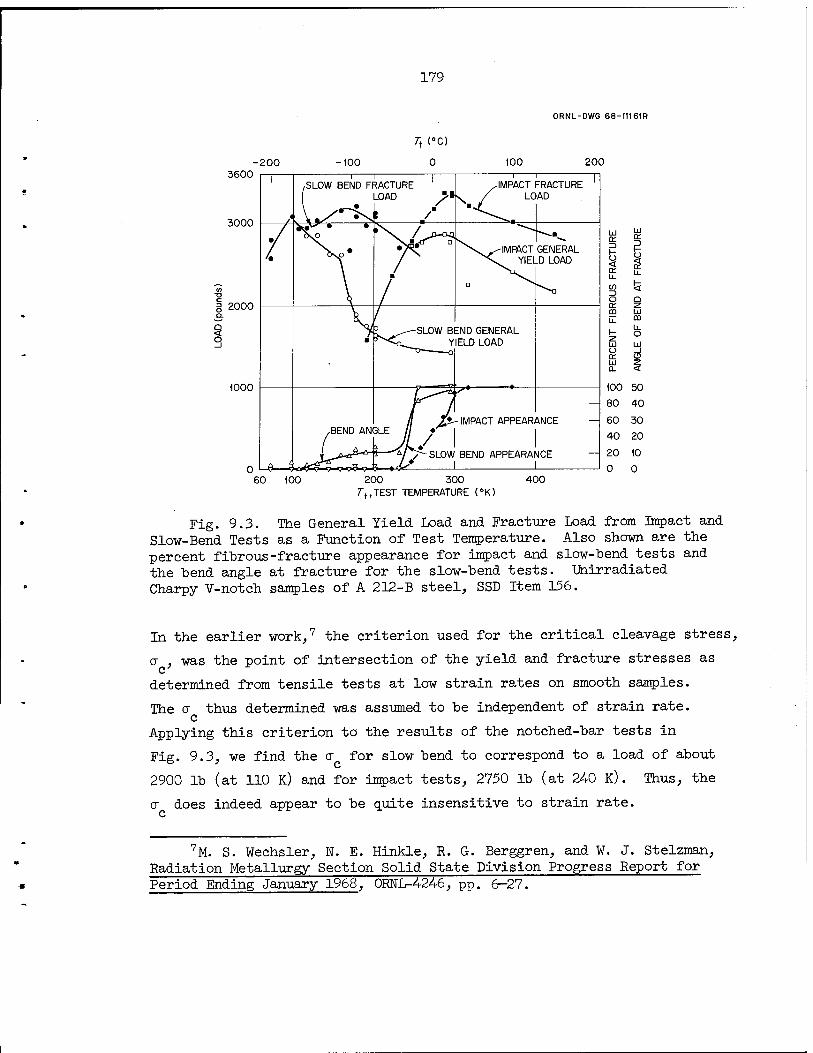
179
ORNL-DWG 68-11161R
3600
3000
3 2000
< o
1000
60 100 200 300 7",,TEST TEMPERATURE (°K)
400
Fig. 9.3. The General Yield Load and Fracture Load from Impact and Slow-Bend Tests as a Function of Test Temperature. Also shown are the percent fibrous-fracture appearance for impact and slow-bend tests and the bend angle at fracture for the slow-bend tests. Unirradiated Charpy V-notch samples of A 212-B steel, SSD Item 156.
In the earlier work,7 the criterion used for the critical cleavage stress,
cr , was the point of intersection of the yield and fracture stresses as
determined from tensile tests at low strain rates on smooth samples.
The cr thus determined was assumed to be independent of strain rate. c
Applying this criterion to the results of the notched-bar tests in
Fig. 9.3, we find the cr for slow bend to correspond to a load of about
2900 lb (at 110 K) and for impact tests, 2750 lb (at 240 K). Thus, the
cr does indeed appear to be quite insensitive to strain rate.
7M. S. Wechsler, N. E. Hinkle, R. G. Berggren, and W. J. Stelzman, Radiation Metallurgy Section Solid State Division Progress Report for Period Ending January 1968, ORNL-4246, pp. 6-27.
180
The fracture surfaces of the impact and slow-bend specimens
appeared somewhat different, probably due to the differences in strain
rate and temperature. At temperatures just above the DBTT, the
fracture surface of the impact specimen has the usual crystalline
appearance (indicative of cleavage fracture) at the center, surrounded
by a border of fibrous appearance (indicative of shear fracture) at
the edges of the fracture surface. The slow-bend specimens, on the
other hand, show fibrous-fracture appearance only near the root of the
notch, with the crystalline appearance extending completely to the
other three edges of the fracture surface.
As shown in Fig. 9.3, the change in the appearance of the fracture
surface of impact specimens from 100$ fibrous to 100$ crystalline occurs
in the temperature range where the impact fracture load reaches a
maximum and the impact general yield load intersects the fracture load
[i.e., from 295 K (22°c) to 250 K (-23°C)]. The DBTT determined by the
impact energy criterion occurs in the same temperature range as that
determined by the change in fracture appearance. Thus, the percent of
fibrous-fracture appearance correlates with both the impact energy
transition and the intersection of the curves of yield and fracture
loads. However, the fracture-appearance transition of the slow-bend
specimens, which occurs between 230 K (-43°C) and 255 K (-18°C), does
not match the DBTT indicated by the intersection of the curves for slow-
bend general yield and fracture load at 110 K (-163°C). These results
indicate that the fracture appearance is not a positive indicator of
the DBTT for tests of Charpy notch-impact specimens at low strain rates.
Figure 9.3 also shows the bend angles of the slow-bend specimens
at fracture. The bend angle increases slowly from 0° near 110 K (-163°C),
where the curves for general yield and fracture load intersect, to
about 10° at the fracture-appearance transition temperature, 230 K
(-<43CC). The energy of deformation during slow bend has been calculated,
and, as with the bend angle, it also increases gradually from near 110 K
to about 230 K, where gross shear deformation becomes the controlling
mechanism.

181
In summary, if the DBTT is defined as that temperature at which
the fibrous-fracture appearance is essentially zero,7'8 this is seen to
be the temperature at which curves for the impact general yield and
fracture loads intersect. For the slow-bend tests, however, this
criterion is not applicable. We find instead that the DBTT of slow-
bend tests is better defined by a bend angle of 0° at fracture.
In our previous work on the relationship between radiation
hardening and embrittlement,7'8 we also found that the DBTT of the irra-
diated impact specimens could be predicted from the tensile results if
it were assumed that the maximum triaxiality correction factor,9 used
to obtain reasonably good agreement for unirradiated specimens, was
reduced as a result of the irradiation. A decrease in the maximum tri-
axiality correction factor implies that the plastic zone, developed at
the root of the notch before cleavage fracture is initiated, has been
decreased. Using notch-impact specimens of A 212-B (Solid State
Division Item 156) and the slow-bend technique, we attempted to study
the development of the plastic zone at the root of the notch. Specimens
were subjected to various loads up to the fracture or general yield
loads near the DBTT and then etched to reveal the plastic zone and the
development of the plastic hinges. We found it relatively easy to see
the plastic hinges at the general yield load without etching, but at
the lower stresses we were unable to observe the development of the
plastic zone at the root of the notch even after using variations of
Fry's reagent with or without thermal aging. Apparently the A 212-B
steel is insensitive to this reagent because there is insufficient
free N and C to decorate the dislocation lines. Because of this negative
result, a similar study of irradiated specimens has not been undertaken.
8M. S. Wechsler, R. G. Berggren, N. E. Hinkle, and W. J. Stelzman, "Radiation Hardening and Embrittlement in a Low-Carbon Pressure Vessel Steel," paper presented at the Symposium on the Effects of Radiation on Structural Metals, June 26-28, 1968, San Francisco, California. To be published in the proceedings.
9T. R. Wilshaw and P. L. Pratt, "The Effect of Temperature and Strain Rate on the Deformation and Fracture of Mild-Steel Charpy Samples," pp. 973-991 in Proceedings First International Conference on Fracture, Vol. 2, The Japanese Society for Strength and Fracture of Materials, Japan, 1966.
182
The new techniques described above, along with recent improvements
in older equipment, are being used to study the properties of irradiated
A 212-B and A 533-B pressure-vessel steels. A major goal of these
studies is to determine whether the principal effect of irradiation is
to cause a change in the initiation or the propagation of cleavage
fracture. The broader approach that is now available to us should make
it possible to gain a deeper understanding of the effect of neutron irra-
diation on the phenomenon of brittle fracture.
Electron Fractography of Irradiated A 212-B Pressure-Vessel Steel
(C. R. Brooks,10 J. L. Miller, M. S. Wechsler)
The hardening and embrittlement of A 212-B pressure-vessel steel
upon neutron irradiation have been reported previously.7^8 Tensile
and impact properties were determined as a function of temperature for
the unirradiated and irradiated base-plate material. These results
show a radiation-induced increase in both the tensile yield stress and
the DBTT of the steel as shown in Figs. 9.4 and 9.5. From the analysis
of results, we concluded that the steel is embrittled because the irra-
diation has increased the yield strength without appreciably changing
the fracture stress; that is, in the irradiated condition the steel
begins to deform plastically at a higher stress level, but fracture
occurs at the same stress for both conditions. Such behavior can be
interpreted to mean that the irradiation has induced lattice defects
that impede dislocation movement, but that the basic mechanism of the
initiation and propagation of cracks is unaffected by the irradiation.
If this is true, the morphology of the fracture surfaces should be
identical for both conditions.
The morphology of brittle-fracture surfaces of ferritic steels is
quite complex, consisting of a very fine structure of features (scale
about 100 A) created by the complicated process of rapid propagation
of cracks in a brittle, two-phase structure. Therefore, it is difficult
10Department of Chemical and Metallurgical Engineering, the University of Tennessee.
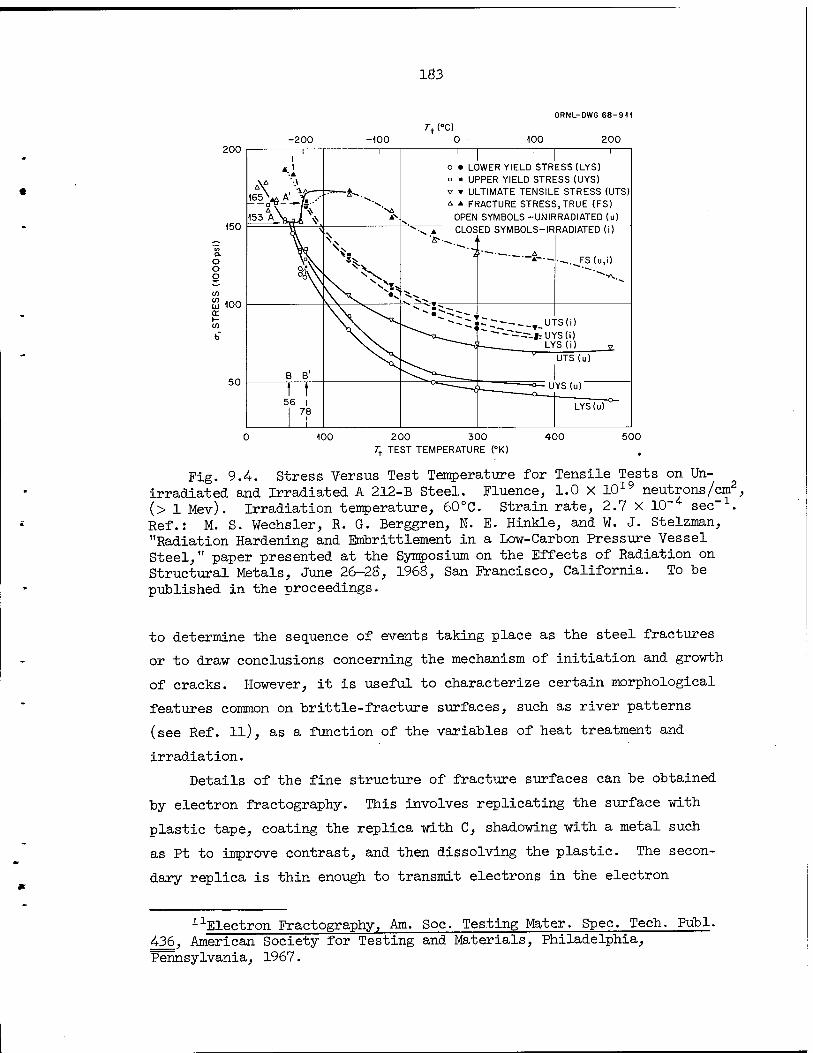
183
rt (°c) -200 -100 100
ORNL-DWG 68-9H
200 200
100 200 300 7"t TEST TEMPERATURE (°K)
400 500
Fig. 9.4. Stress Versus Test Temperature for Tensile Tests on Un- irradiated and Irradiated A 212-B Steel. Fluence, 1.0 x 10¹⁹ neutrons/cm2, (> 1 Mev). Irradiation temperature, 60°C. Strain rate, 2.7 X 10~4 sec-1. Ref.: M. S. Wechsler, R. G. Berggren, N. E. Hinkle, and W. J. Stelzman, "Radiation Hardening and Enibrittlement in a Low-Carbon Pressure Vessel Steel," paper presented at the Symposium on the Effects of Radiation on Structural Metals, June 26-28, 1968, San Francisco, California. To be published in the proceedings.
to determine the sequence of events taking place as the steel fractures
or to draw conclusions concerning the mechanism of initiation and growth
of cracks. However, it is useful to characterize certain morphological
features common on brittle-fracture surfaces, such as river patterns
(see Ref. ll), as a function of the variables of heat treatment and
irradiation.
Details of the fine structure of fracture surfaces can be obtained
by electron fractography. This involves replicating the surface with
plastic tape, coating the replica with C, shadowing with a metal such
as Pt to improve contrast, and then dissolving the plastic. The secon-
dary replica is thin enough to transmit electrons in the electron
1Electron Fractography, Am. Soc. Testing Mater. Spec. Tech. Publ. 436, American Society for Testing and Materials, Philadelphia, Pennsylvania, 1967.
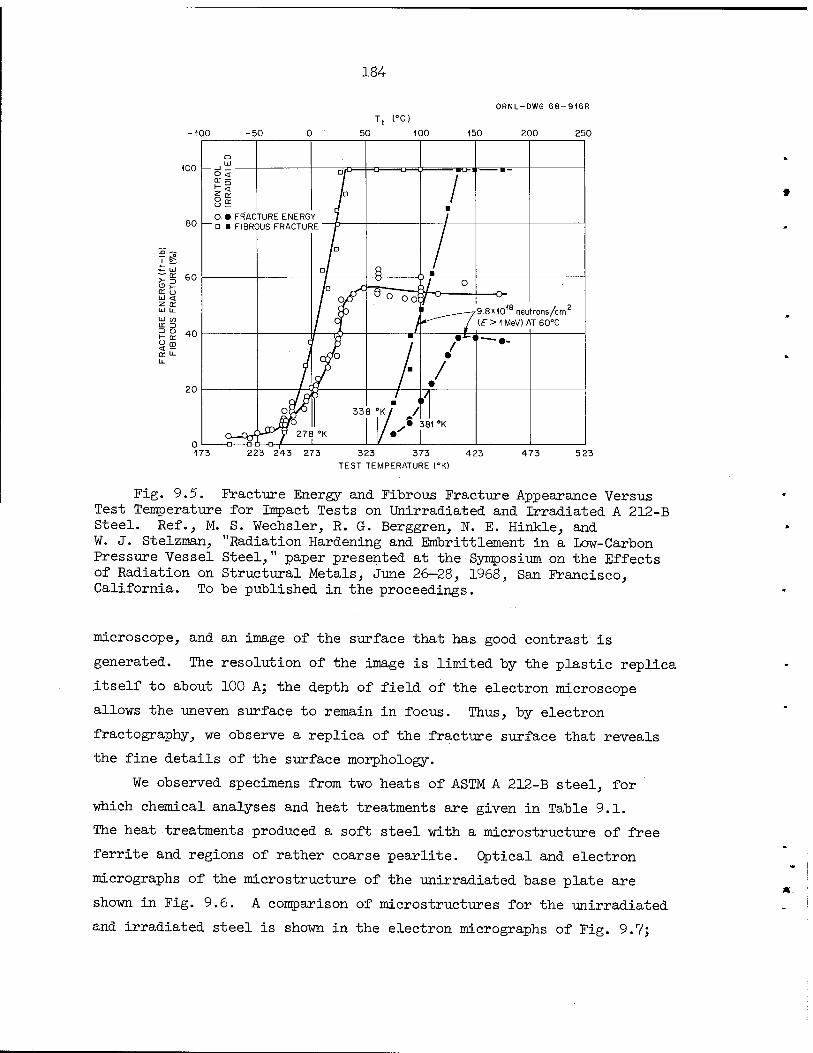
184
-100 -50
ORNL-DWG 68-916R
200 250
173 223 243 273 323 373 423 TEST TEMPERATURE (°K)
473 523
Fig. 9.5. Fracture Energy and Fibrous Fracture Appearance Versus Test Temperature for Impact Tests on Unirradiated and Irradiated A 212-B Steel. Ref., M. S. Wechsler, R. G. Berggren, N. E. Hinkle, and W. J. Stelzman, "Radiation Hardening and Embrittlement in a Low-Carbon Pressure Vessel Steel," paper presented at the Symposium on the Effects of Radiation on Structural Metals, June 26-28, 1968, San Francisco, California. To be published in the proceedings.
microscope, and an image of the surface that has good contrast is
generated. The resolution of the image is limited by the plastic replica
itself to about 100 A; the depth of field of the electron microscope
allows the uneven surface to remain in focus. Thus, by electron
fractography, we observe a replica of the fracture surface that reveals
the fine details of the surface morphology.
We observed specimens from two heats of ASTM A 212-B steel, for
which chemical analyses and heat treatments are given in Table 9.1.
The heat treatments produced a soft steel with a microstructure of free
ferrite and regions of rather coarse pearlite. Optical and electron
micrographs of the microstructure of the unirradiated base plate are
shown in Fig. 9.6. A comparison of microstructures for the unirradiated
and irradiated steel is shown in the electron micrographs of Fig. 9.7;

185
Table 9.1. ASTM A 212-B Pressure-Vessel Steel a
Chemical Composition, wt °lo Heat C Mh Ph S Si
Item 157
Item 147
0.36
0.25
0.62
0.74
0.012
0.013
0.033
0.025
0.18
0.20
^Heat treatment: 2 3/4-in.-thick plate was normalized at about 900°C, cooled by water spray to 260°C, and stress relieved at 650 to 680°C; all specimens for impact and tensile tests were taken from quarter thickness.
;-..<•;- ■ .... ■:■.■'
Y-90007
Si
#!^«n
(b)l
Fig. 9.6. Microstructure of Uhirradiated ASTM A 212-B Pressure- Vessel Steel, (a) Optical micrograph showing edge of fracture surface of Charpy V-notch specimen, (b) Electron micrograph of replica of etched microstructure.
these were obtained by replicating polished and etched longitudinal
sections near the fracture surfaces of tensile samples tested at low
temperatures. No gross features distinguish the irradiated microstructure
from the unirradiated one, except possibly for slight difference in the
etching behavior that give rise to small pockmarks within ferrite grains
in the irradiated steel.

186
R-4280I
A .. .
Fig. 9.7. Electron Micrographs of a Polished and Etched Section near the Fracture of Unirradiated and Irradiated Tensile Specimens of A 212-B Steel, (a) Unirradiated., T, = 50 K. (b) Irradiated, T, = 34 K, * = 1.0 x 10¹⁹ neutrons/cm2 at 60°C: t
Electron fractographs were obtained on tensile and impact specimens
irradiated near 60°C to a fluence of 1 x 10¹⁹ neutrons/cm2 (> 1 Mev).
The irradiation produced an increase in DBTT of 95°C (Fig. 9.5). The
fractographs of the unirradiated tensile specimen tested at 77 K (-196°C)
and the irradiated tensile specimen tested at 34 K (-239°c) are shown
in Fig. 9.8; both specimens fractured brittlely (i.e., before a lower
yield stress was reached). The pearlite platelets are clearly revealed
in both cases, and no obvious differences are apparent in the morpholo-
gies of the unirradiated and irradiated fracture surfaces. Electron
fractographs for impact specimens from Item 147 (Table 9.l) are shown
in Figs. 9.9 and 9.10. The irradiations in this case were carried to
8 X 10l8 neutrons/cm2 (> 1 Mev) at 340°C, and despite the high irradia-
tion temperature, the DBTT was increased about 30°C. All specimens were
tested at temperatures below the DBTT. Figure 9.9 compares the unetched
fracture surfaces of unirradiated and irradiated specimens; the fracture
surfaces look quite similar. Figure 9.10 shows the surfaces in the
etched condition. The microstructure is more clearly revealed in this

187
-2M- ■2M-
''■\^te*^tim$T-r\ £'• '.fops*,**' ' ; *. * *.," '
: '"■'°* ;'•*•'" -'"O.-"*y.
V; ">-,
Fig. 9.8. Electron Fractographs of Unirradiated and Irradiated Tensile Specimens of A 212-B Steel, (a) Unirradiated, T = 77 K. (b) Irradiated, T, = 34 K. 0 = 1.0 x 10¹⁹ neutrons/cm2 at 60°C.
"0
Fig. 9.9. Electron Micrographs of Replicas of Unetched Fracture Surface of Charpy V-Notch Impact Specimens of Unirradiated and Irradiated A 212-B Steel (item 147). (a) Unirradiated, fractured at -60°C, 3 ft-lb. (b) Irradiated, 8.3 X 10l8 neutrons/cm2 at 340°C for 45 days, fractured at -40°C, 2 ft-lb.

188
lii Y-90069
Fig. 9.10. Electron Micrographs of Replicas of Etched Fracture Surface of Charpy V-Notch Impact Specimens of Unirradiated and Irradiated A 212-B Steel (item 147). (a) Unirradiated, fractured at -60°C, 3 ft-lb. (b) Irradiated, 8.3 x 10¹⁸ neutrons/cm2 at 340°C for 45 days, fractured at -40°C, 2 ft-lb. Etched.
case, but again no gross difference is visible in the fracture morphology
upon irradiation.
Transmission electron microscopy is another technique we have
applied to the irradiated pressure-vessel steels. Figure 9.11 shows
electron transmission micrographs for unirradiated and irradiated
[8 x 10l8 neutrons/cm2, (> 1 Mev) at 70°C] foils from Item 147
(Table 9.l) taken with a Hitachi 200 kev electron microscope. The foils
were deformed about 5$ by rolling before chemical thinning. The micro-
graph (Fig. 9.1l) for the irradiated foil does not indicate any defect
clusters or spot contrast, as has been observed for many other irradiated
metals. In a similar attempt, Birkle and Rail12 were also unable to
observe defect clusters produced by irradiation of A 212-B steel. Some
differences in the dislocation configurations for the unirradiated and
irradiated foils are apparent, however, in Fig. 9.11. The dislocations
12
(1964) A. J. Birkle and W. Rail, Trans. Met. Soc. AIME 230, 156-163

189
Photo 93213
Pig. 9.11. Transmission Electron Micrographs of Unirradiated and Irradiated A 212-B Steel Strained about 5$. (a) Unirradiated. (b) Irradiated, 8 X 10¹⁸ neutrons/cm2, 70°C.
generated by the rolling treatment appear somewhat clustered and tangled
for the unirradiated foil, whereas for the irradiated one they lie in
long strands along crystallographic directions. This is probably due to
a type of dislocation channeling, such as that observed by Mastel et al.
for Mo or Tucker et al.l4 for Nb, but the absence of visible defect
clusters in the transmission electron micrographs makes a study of the
phenomenon considerably more difficult in ferritic steels.
Radiation Hardening and Embrittlement in ASTM A 533-B Steel (R. G. Berggren, W. J. Stelzman, T. N. Jones, M. S. Wechsler)
Specimens for tensile and Charpy V-notch impact tests were taken
from the surface, quarter-thickness, and midthickness locations of HSST
(Heavy Section Steel Technology) Plate 01, a 32-in.-thick ASTM A 533-B
Class 1 manganese-molybdenum-nickel steel plate. All specimens were of
longitudinal orientation; that is, the tension axis of each specimen
13
13B. Mastel, H. E. Kissinger, J. A. Laidler, and T. K. Bierlein, J. Appl. Phys. 34, 3637-3638 (1963).
UR. P. Tucker, M. S. Wechsler, and S. M. Ohr, "Dislocation Channeling in Neutron-Irradiated Niobium," to be published in Journal of Applied Physics.

p|in: }(■
190
Table 9.2. Tensile Properties of Irradiated 12-in.-Thick A 533-B ,a Steela from Heat A-1008-1. HSST Plate 01
Specimen Number
Fluence Irradiation Strength Properties, psi . . [neutrons/cm2 Temperature l^per Lower Ultimate0 Elongation, f,
(> 1 Mev)] (°C) wli* v^-i* m_„_.-n_ Uniform Totalc Yield Yield Tensile
6000 6001 6036 6037 6054 6055 6064 6065
Average
6061 6033 6060 6032 6034
6077 6078 6112 6113
Average
6086 6092 6079 6085 6093 6099
X 10 18 X 103 X 103 X 103
7.2 7.7 8.6 8.9
11.8
6.9 7.6 7.7 8.$
10.3 11.6
Quarter-Thickness Specimens
70.7 68.5 90.2 69.9 69.1 90.8 69.8 68.6 90.3 69.4 68.6 89.7 69.7 68.1 89.2 69.2 67.9 89.8 69.1 67.5 89.2 68.4 67.8 89.3
• " 69.5 68.3 89.8
63 104.0 101.1 102.2 65 107.0 102.4 103.6
232 94.8 92.8 107.7 232 96.1 94.7 108.8 288 90.2 87.6 106.5
.dthick ness Specimens
69.6 68.2 90.1 69.1 68.1 89.9
68.1 89.8 68.2 67.8 90.1
69.0 68.0 90.0
65 106.6 102.4 103.2 65 108.4 104.2 105.3
232 95.2 94.6 108.9 232 96.6 95.9 110.7 288 87.8 86.7 106.5 288 88.5 86.1 105.6
8.9 17.6 10.0 18.3 10.0 18.8 9.6 19.2
10.7 22.1 9.5 19.4
10.2 21.4 9.6 18.9
9.8 19.5
5.2 13.6 4.2 13.0 9.0 16.2 8.7 15.5 9.5 16.8
9.4 18.0 9.6 18.0 8.3 17.4 9.9 18.8
9.3 18.0
4.5 12.3 4.9 11.8 7.8 14.5 7.5 14.1 9.1 15.8 7.8 14.7
All specimens are of longitudinal orientation, tested at 27°C.
Ultimate tensile strength is here defined as the maximum load after the yield point divided by original area of cross section.
Length-to-diameter ratio: 7.

191
was parallel to the rolling direction. These specimens were irradiated
to fast-neutron fluences of 5 to 11 X 1018 neutrons/cm2 (> 1 Mev) at
temperatures of 66, 232, 288, and 343°C.
Results of tensile tests on specimens from quarter-thickness and
midthickness, irradiated at 66, 232, and 288°C and tested at room tem-
perature, are presented in Table 9.2. Results from impact tests of
Charpy V-notch quarter-thickness specimens, irradiated at 68, 232, and
293°C, are presented in Fig. 9.12.
The purpose of these tensile and impact tests was to determine the
effect of varying the irradiation temperature over the range cited
above. However, because of flux variations in the irradiation capsules
and differences in core loading from one experiment to the other, it
was necessary to accept the differences in fluences noted in Table 9.2
and Fig. 9.12. To correct for the differences in fluence, we assumed
that the increase in yield stress and the increase in DBTT are propor-
tional to the square root of the fluence. On this basis, the increase
in yield stress upon irradiation.at 232 and 288°C are about 74 and 42$,
respectively, of the increase in yield stress for the 68°C irradiation.
The effect of irradiation temperature, analyzed in this way, was about
the same for quarter-thickness and midthickness specimens, although the
increases in yield stress normalized to a given fluence were slightly
greater for midthickness specimens.
For impact results (Fig. 9.12) it is difficult to make a similar
comparison because the impact curves are not parallel and because the
comparison would depend on the fracture energy at which the transition
temperature were fixed. It turns out that for a 25 ft-lb criterion the
increases in DBTT upon irradiation at 232 and 288°C are about 87 and 43$,
respectively, of the increase in DBTT for the 68°C irradiation. These
percentages are roughly in agreement with those for the tensile tests,
but the agreement is somewhat fortuitous for the reason mentioned above.
It was stated earlier in this report15 that the cleavage fracture
stress under impact conditions may be determined by the intersection of
15N. E. Hinkle et al., "Radiation Hardening and Embrittlement in ASTM A 212-B Steel," pp. 174-182, this report.

180
(60
(40
•= (20
o (00
S 80
192
ORNL-DWG 68H2455R FRACTURE TEMPERATURE (°F)
-200 -(00 0 (00 200 300 400
60
40
20
~T Tl , "n n IT , ASTM A-533-B(
HSST PLATE 01;LUKENS HEAT A-1008-( - </4 THICK LONGITUDINAL DIRECTION SPECIMENS
o UNIRRADIATED CONTROL
. D 6.7-5.8 x (0,s neu(rons/cm2*AT 68°C A 7.7-6.8 x (018 neutrons/cm2*AT 232°C
« (0.2-8.9 x (018 neu(rons/cm2*AT 293°C
*(£">(MeV)
-(00 0 (00 FRACTURE TEMPERATURE (°C)
200
Fig. 9.12. Effect of Neutron Irradiation at Three Temperatures on the Notch-Impact Properties of Quarter-Thickness Specimens from a 12-in. Thick Plate of Manganese-Molybdenum-Nickel Steel (ASTM A 533-B Class 1, HSST Plate Ol).
general yield load and maximum (or fracture) load curves. Furthermore,
one criterion for the DBTT is that temperature at which the yield stress
reaches the cleavage-fracture stress. Hence, the DBTT is given by the
temperature where the curves for general yield load and maximum load
intersect. To determine this DBTT, oscilloscope records of load versus
time during impact were obtained for most of the impact tests presented
above. General yield loads and maximum loads obtained from these
records are presented in Fig. 9.13. Zero-ductility transition tempera-
tures may be determined by extrapolating to zero energy the steep portion
of the curves for fracture energy in Fig. 9.12. These transition tem-
peratures may be compared with those obtained from the intersection of
the plots of the maximum load and general yield load recorded by the
oscilloscope during notch-impact testing. Such results are given in
Table 9.3. The data now available show that the transition temperatures

-100
193
0RNL-DWG68-12456R
FRACTURE TEMPERATURE (°F) 0 100 200 300 400
5000
4000
Q 3000 < O
2000
1000
ASTM A-533-B1
HSST PLATE 01; LUKENS HEAT A-1008-1 1/4 THICK LONGITUDINAL DIRECTION SPECIMENS
o • UNIRRADIATED CONTROL
A A 6.7-5.8x10,s neutrons/cm2 at 68°C 0 ♦ 7.7-6.8X10¹⁸neutrons/cm2* at 232°C
° ■ 10.2-8.9X10¹⁸ neutrons/cm2" at 293°C
(OPEN SYMBOLS DENOTE GENERAL YIELD; SOLID SYMBOLS DENOTE MAXIMUM LOAD)
*(f>1MeV) | | | | |
-100 0 100 FRACTURE TEMPERATURE (°C)
200
Fig. 9.13. General Yield and Maximum Loads During Notch-Impact Testing of Quarter-Thickness Specimens from a 12-in.-Thick Plate of Manganese-Molybdenum-Nickel Steel (ASTM A 533-B Class 1, HSST Plate 01)
Table 9.3. Comparison of Transition Temperatures of Irradiated ASTM A 533-B Class 1 Steel (Quarter-Thickness Charpy
V-Notch Impact Specimens from HSST Plate 01)
Specimen Condition
Temperature, °C
At Zero Fracture Energy Intercept
Unirradiated
Irradiated to 6 X 10l8 neutrons/cm2
(> 1 Mev) at 68°C
Irradiated to 1 x 10¹⁹ neutrons/cm2
at 293°C
-44
58
Intersection of General Yield Load and Maximum
Load Curves
-51
49
4

194-
obtained by these two methods agree within the probable accuracy of the
analysis. The present results indicate that the relationship between
radiation hardening and embrittlement developed16'17 for a different
steel (ASTM A 212-B) will probably also apply to this ASTM A 533-B
Class 1 steel.
Properties of 12-in.-Thick ASTM A 533-B Class 1 and Class 2 Steels
(R. G. Berggren, T. N. Jones)
Characterization tests continue on unirradiated 12-in.-thick plates
of ASTM A 533-B (Manganese-Molybdenum-Nickel Steel Plate, Quenched and
Tempered for Pressure Vessels). A portion of this material is included
in several studies of radiation effects.
The first three plates (HSST plates 01, 02, and 03) were produced
by Lukens Steel Company and heat treated to Class 1 specifications:
The first two were heat treated by Combustion Engineering, Inc., and the
third was heat treated by Lukens Steel Company. The HSST plates 01 and
02 were heat treated as identically as possible: both plates were dip
quenched, edge down, in agitated water. The HSST plate 03 was flat
quenched in agitated water so that possible effects of steam binding
during quenching could be determined.
Test results for the central region of HSST plate 01 have been
reported previously,18'19 and those for the central region of HSST
plate 02 have now been obtained. Tensile test results (ASTM standard
0.505-in.-diam specimens) for HSST plate 02 are presented in Table 9.4.
16M. S. Wechsler, N. E. Hinkle, R. G. Berggren, and W. J. Stelzman, Radiation Metallurgy Section Solid State Division Progress Report for Period Ending January 1968, ORNL-4246, pp. 6-27.
17M. S. Wechsler, R. G. Berggren, N. E. Hinkle, and W. J. Stelzman, "Radiation Hardening and Embrittlement in a Low-Carbon Pressure Vessel Steel," paper presented at the Symposium on the Effects of Radiation on Structural Metals, June 26-28, 1968, San Francisco, California. To be published in the proceedings.
i0R. G. Berggren and T. N. Jones, Radiation Metallurgy Section Solid State Division Progress Report for Period Ending January 1968, ORNL-4246, pp. 38-41. "
19F. J. Witt, Heavy Section Steel Technology Program Semiann. Progr. Rept. Feb. 29, 1968, ORNL-4315, pp. 19-28.
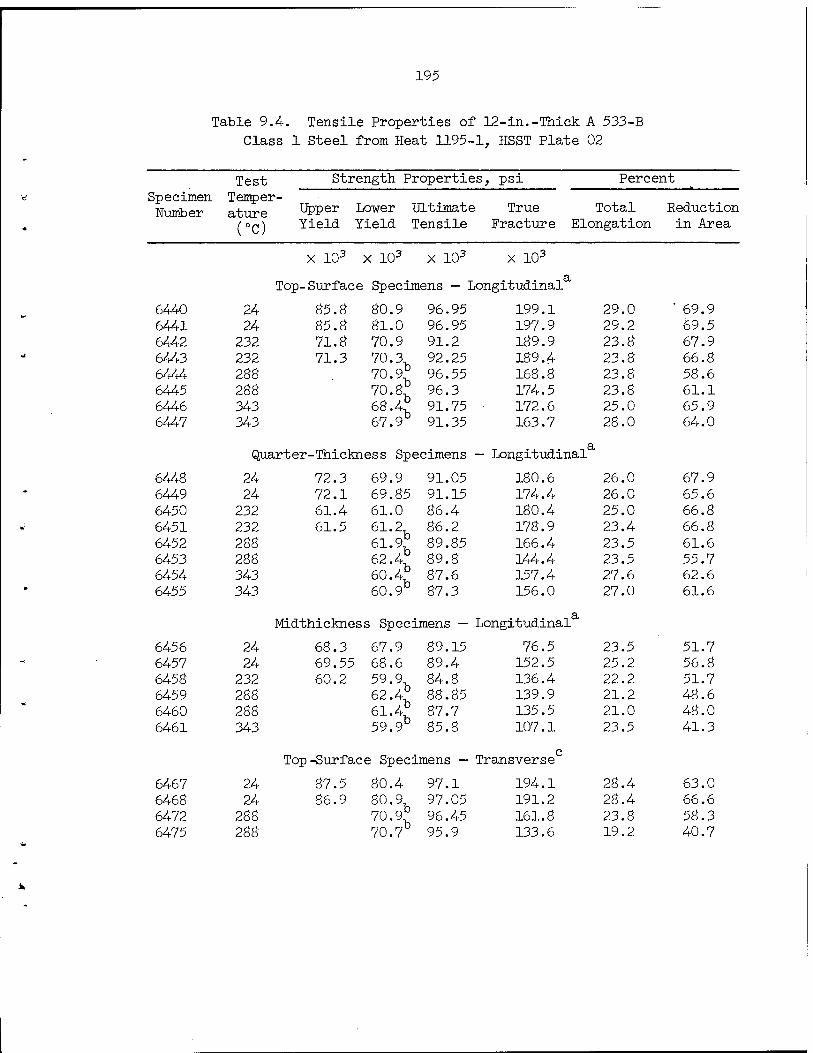
195
Table 9 4. Tensile Properties of ' 12-in.-Thick A 533-B
•
Class 1 Steel from Heat 1195- 1, HSST Plate 02
Test Specimen Tempel Number ature
(°0
Strength Properties, psi Percent
Upper Lower Ultimate Yield Yield Tensile
True Total Fracture Elongation
Reduction in Area
X 103 x 103 x 103 X 103
Top-Surface Specimens — Longitudinal
6440 24 85.8 80.9 96.95 199.1 29.0 ' 69.9 6441 24 85.8 81.0 96.95 197.9 29.2 69.5 6442 232 71.8 70.9 91.2 189.9 23.8 67.9
tf 6443 232 71.3 70.3 92.25 70.9b 96.55 70.8b 96.3 68.4? 91.75 67.9 91.35
189.4 23.8 66.8 6444 288 168.8 23.8 58.6 6445 288 174.5 23.8 61.1 6446 343 172.6 25.0 65.9 6447 343 163.7 28.0 64.0
Quarter-Thickness Specimens — Longitudinal
6448 24 72.3 69.9 91.05 180.6 26.0 67.9 - 6449 24 72.1 69.85 91.15 174.4 26.0 65.6
6450 232 61.4 61.0 86.4 180.4 25.0 66.8 ■•■ 6451 232 61.5 61.2 86.2
61.9b 89.85 62.4.T 89.8 60.4? 87.6 60.9b 87.3
178.9 23.4 66.8 6452 288 166.4 23.5 61.6 6453 288 144.4 23.5 55.7 6454 343 157.4 27.6 62.6
" 6455 343 156.0 27.0 61.6
Midthickness Specimens — Longitudinal
6456 24 68.3 67.9 89.15 76.5 23.5 51.7 - 6457 24 69.55 68.6 89.4 152.5 25.2 56.8
6458 232 60.2 59.9 84.8 62.4^ 88.85 61.4? 87.7 59.9b 85.8
136.4 22.2 51.7 6459 288 139.9 21.2 48.6 6460 288 135.5 21.0 48.0 6461 343 107.1 23.5 41.3
Top-Surface Specimens — Transverse
6467 24 87.5 80.4 97.1 194.1 28.4 63.0 6468 24 86.9 80.9 97.05
70.9b 96.45 70.7 95.9
191.2 28.4 66.6 6472 288 161.8 23.8 58.3
V
6475 288 133.6 19.2 40.7

196
Table 9.4 (continued)
Test Specimen Temper- Number ature
(°0
Strength Properties, psi
upper Yield
Lower Yield
Ultimate Tensile
True Fracture
Percent
Total Elongation
X 103 x 103 x 103 X 103
Reduction in Area
Quarter-Thickness Specimens — Transverse
6464 24 71.85 69.1 91.0 170.2 26.5 63.0 6465 24 71.4 69.2 91.35
62.4.T 89.9 62.4 90.4
160.7 24.6 60.8 6473 288 131.9 19.2 42.5 6476 288 159.6 23.0 56.5
Mdthickness Specimens - Transverse
6466 24 68.75 67.75 88.5 65.6 13.6 25.8 6469 24 70.2V 91.3
62.4* 87.7 61.9b 84.2
64.3 19.8 38,1 6474 288 130.5 19.8 43.4 6477 288 73.9 9.2 21.6
Quarter-Thickness Specimens — Perpendicular
6470 24 71.1 69.0 91.05 136.7 23.8 57.3 6478 24 70.4 69.0 91.0
62.9° 88.9 63.15b 89.65
136.6 23.2 50.5 6471 288 139.9 19.0 45.7 6479 288 152.1 21.0 51.6
Longitudinal specimen: tension axis parallel to rolling direction.
Lower yield stress reported is 0.2$ offset yield strength, c Transverse specimen: tension axis transverse to the rolling direc-
tion and in the rolling plane.
Perpendicular specimen: tension axis perpendicular to the rolling plane (plate surface).

197
The yield and ultimate strengths were found to be insensitive to speci-
men orientation. True fracture stress, elongation, and reduction of
area were dependent on specimen orientation, the greatest orientation
effect being at the half-thickness level due to the higher concentration
of inclusions in the center of the plate thickness.
Charpy V-notch impact tests were conducted on HSST plate 02; the
results are shown in Table 9.5 and Figs. 9.14 and 9.15. The major effect
of specimen orientation was to lower fracture energies in the ductile
portion of the energy-temperature curve (ductile shelf) for the trans-
verse and perpendicular orientations. This is shown in Table 9.5 and
Fig. 9.14. As observed for HSST plate 01, the energy-temperature
curves for quarter-thickness and midthickness specimens were identical
(Fig. 9.15), and a lower transition temperature was observed for surface
specimens. The lower transition temperature of surface specimens is a
result of the higher cooling rates near the surface of the plate during
quenching.
Table 9.5. Drop Weight and Charpy-V Impact Properties of 12-in.-Thick ASTM A 533-B Class 1 Steel from
Heat No. 1105-1, HSST Plate 02
Level in Plate
Orienta- tiona
Temperature, °C
Drop-Weight Nil- b
Ductility
Charpy-V Transition
Energy, ft-lb Nil-
Ductile Ductility Shelf Transition
Correlation
Surface
Quarter- thickness
Half- thickness
L T
L T P
L T
-68
-15
-12
-84 -73
-7 -1 10
-7 16
105 85
115 95 80
95 90
50 35
25 25 18
25 15
a L: long axis of specimen longitudinal (parallel to plate surface). T: Long axis of specimen transverse to rolling direction and parallel
to plate surface. P: long axis of specimen perpendicular to plate surface.
P-3 drop-weight specimens.
'Transition temperature for 32 ft-lb fracture energy.
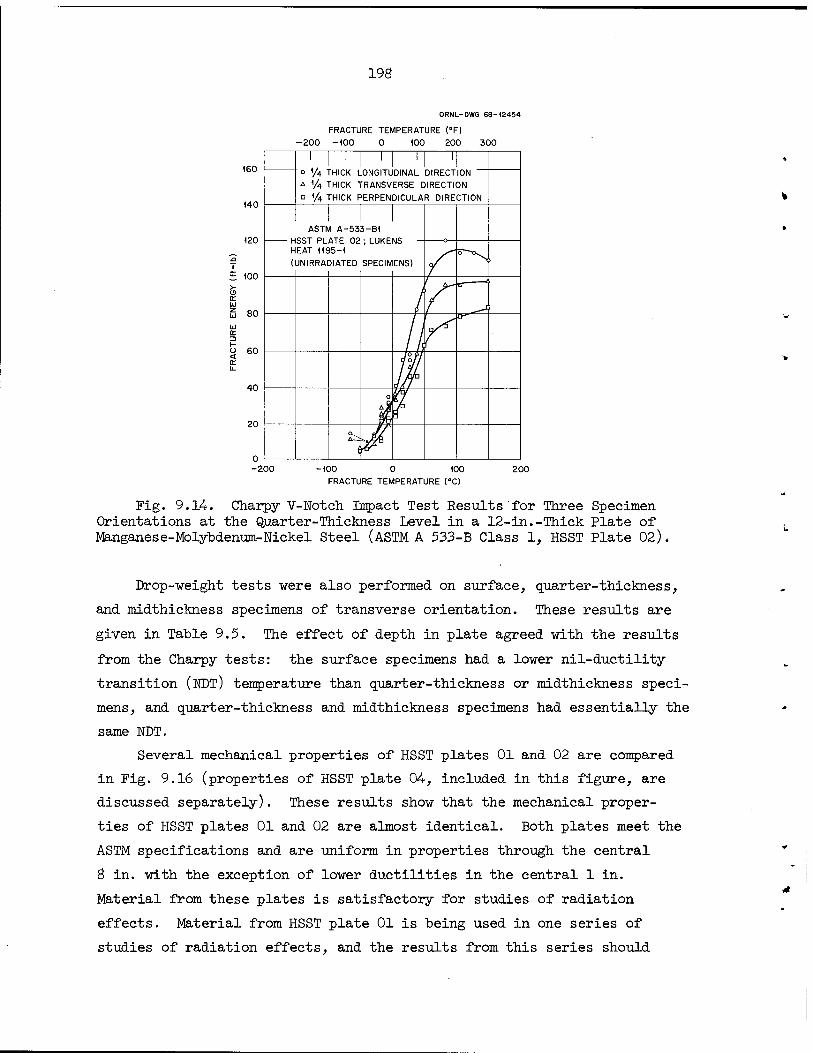
198
-200
ORNL-DWG 68-12454
FRACTURE TEMPERATURE (°F) -200 -100 0 100 200 300
160 1 1 1 l i
o y4 THICK LONGITUDINAL DIRECTION a 1/4 THICK TRANSVERSE DIRECTION
140 a 1/4 THICK PERPENDICULAR DIRECTION
ASTM A-533-B1 120 HSST PLATE 02 ; LUKE
HEAT 1195-1 /" Ö—o. .o (UNIRRADIATED SPECIMENS) /
>^ > £ loo / / a. LÜ
S 80 V tr '
FRA
CTU
RE
o
jf
1° 91 do//
40 o
AS
20
fc ̂ •/9'a
-100 0 100 FRACTURE TEMPERATURE CC)
200
Fig. 9.14. Charpy V-Notch Impact Test Results for Three Specimen Orientations at the Quarter-Thickness Level in a 12-in.-Thick Plate of Manganese-Molybdenum-Nickel Steel (ASTM A 533-B Class 1, HSST Plate 02)
Drop-weight tests were also performed on surface, quarter-thickness,
and midthickness specimens of transverse orientation. These results are
given in Table 9.5. The effect of depth in plate agreed with the results
from the Charpy tests: the surface specimens had a lower nil-ductility
transition (NOT) temperature than quarter-thickness or midthickness speci-
mens, and quarter-thickness and midthickness specimens had essentially the
same NDT.
Several mechanical properties of HSST plates 01 and 02 are compared
in Fig. 9.16 (properties of HSST plate 04-, included in this figure, are
discussed separately). These results show that the mechanical proper-
ties of HSST plates 01 and 02 are almost identical. Both plates meet the
ASTM specifications and are uniform in properties through the central
8 in. with the exception of lower ductilities in the central 1 in.
Material from these plates is satisfactory for studies of radiation
effects. Material from HSST plate 01 is being used in one series of
studies of radiation effects, and the results from this series should
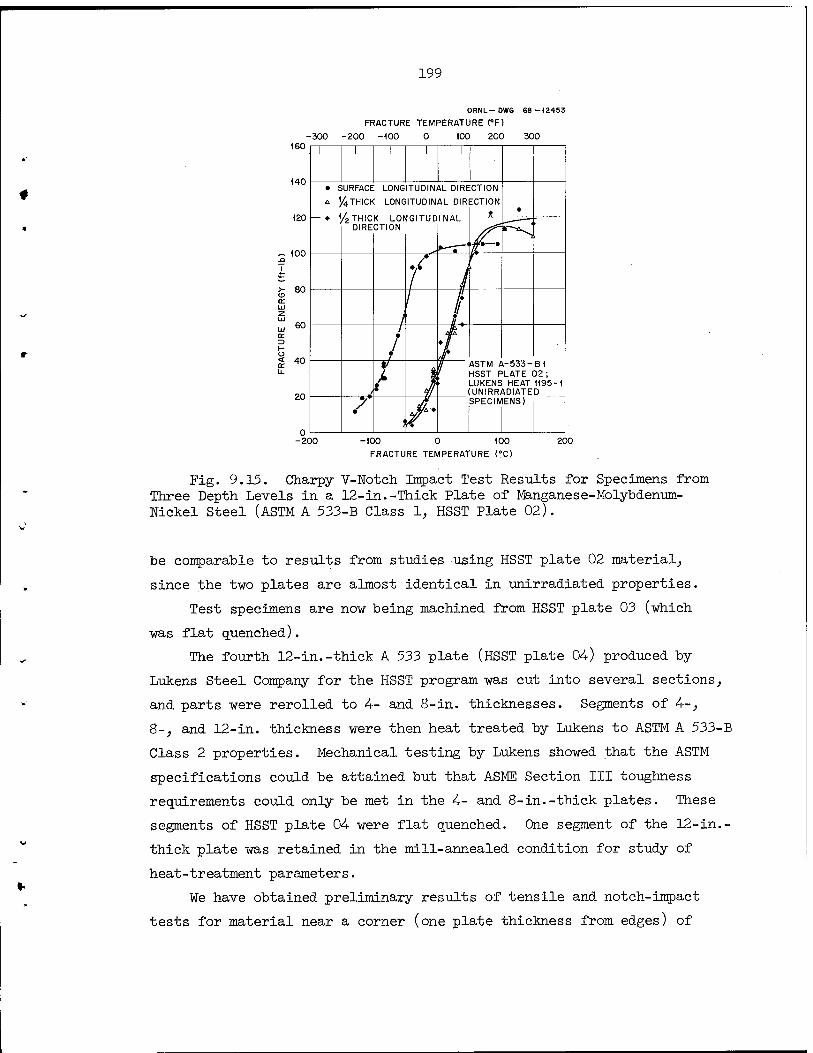
199
ORNL-DWG 68-12453
FRACTURE TEMPERATURE (°F)
-300 -200 -100 0 100 200 300 160 I-, 1—i 1—i—i I~T n f
140
120
~ 100
>- 80
60
< 40
20
• SURFACE LONGITUDINAL DIRECTION
A '/4THICK LONGITUDINAL DIRECTION
♦ V2 THICK LONGITUDINAL DIRECTION
T
ASTM A-533-B1 HSST PLATE 02; LUKENS HEAT 1195-t (UNIRRADIATED SPECIMENS
-200 -100 0 100 FRACTURE TEMPERATURE CO
200
Fig. 9.15. Charpy V-Notch Impact Test Results for Specimens from Three Depth Levels in a 12-in.-Thick Plate of Manganese-Molybdenum- Nickel Steel (ASTM A 533-B Class 1, HSST Plate 02).
be comparable to results from studies using HSST plate 02 material,
since the two plates are almost identical in unirradiated properties.
Test specimens are now being machined from HSST plate 03 (which
was flat quenched).
The fourth 12-in.-thick A 533 plate (HSST plate 04-) produced by
Lukens Steel Company for the HSST program was cut into several sections,
and parts were rerolled to A- and 8-in. thicknesses. Segments of A-,
$-, and 12-in. thickness were then heat treated by Lukens to ASTM A 533-B
Class 2 properties. Mechanical testing by Lukens showed that the ASTM
specifications could be attained but that ASME Section III toughness
requirements could only be met in the A- and 8-in.-thick plates. These
segments of HSST plate 04- were flat quenched. One segment of the 12-in.-
thick plate was retained in the mill-annealed condition for study of
heat-treatment parameters.
We have obtained preliminary results of tensile and notch-impact
tests for material near a corner (one plate thickness from edges) of

200
g t cow — ZIEH
(_< -
< X o
100
50
0
-50
-100
ORNL-DWG 68-12452
^H 1— f^ f • PLATE 0< o PLATE 02
( 1
A PLATE 04
< CNJ O C
ÜJ
2 2 ,2
L/ A. /2 A 2 A 6
A ' EC^r * r * i
^ u u
^ - A
30
20
10
0 SURFACE 74 7" V2T ZUT
DISTANCE FROM TOP SURFACE
BACK SURFACE
Fig. 9.16. Comparison of Mechanical Properties of Several Levels in Three 12-in.-Thick Plates of Manganese-Molybdenum-Nickel Steel (ASTM A 533-B Classes 1 and 2, HSST Plates 01, 02, and 04).
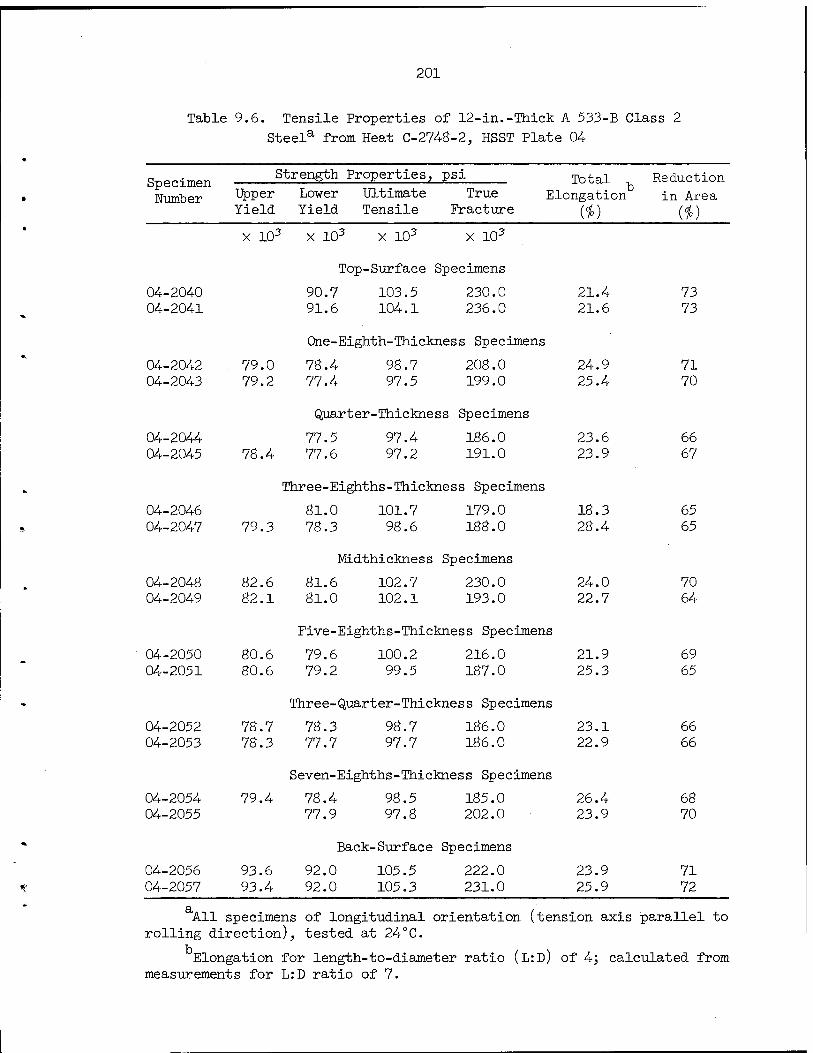
201
Table 9.6. Tensile Properties of 12-in.-Thick A 533-B Class 2
Steela from Heat C-2748-2., HSST Plate 04
Specimen Number
Strength Properties, psi Upper Yield
Lower Yield
Ultimate Tensile
True Fracture
Total , c Elongation
Reduction in Area
(*)
X 103 X 103 X 103 X 10-
Top-Surface Specimens
04-2040 90.7 103.5 230.0 21.4 73 04-2041 91.6 104.1 236.0
One-Eighth-Thickness Specimens
21.6 73
04-2042 79.0 78.4 98.7 208.0 24.9 71 04-2043 79.2 77.4 97.5 199.0
Quarter-Thickness Specimens
25.4 70
04-2044 77.5 97.4 186.0 23.6 66 04-2045 78.4 77.6 97.2 191.0
Three-Eighths-Thickness Specimens
23.9 67
04-2046 81.0 101.7 179.0 18.3 65 04-2047 79.3 78.3 98.6 188.0
Midthickness Specimens
28.4 65
04-2048 82.6 81.6 102.7 230.0 24.0 70 04-2049 82.1 81.0 102.1 193.0
Five-Eighths-Thickness Specimens
22.7 64
04-2050 80.6 79.6 100.2 216.0 21.9 69 04-2051 80.6 79.2 99.5 187.0
Three-Quarter-Thickness Specimens
25.3 65
04-2052 78.7 78.3 98.7 186.0 23.1 66 04-2053 78.3 77.7 97.7 186.0
Seven-Eighths-Thickness Specimens
22.9 66
04-2054 79.4 78.4 98.5 185.0 26.4 68 04-2055 77.9 97.8 202.0
Back-Surface Specimens
23.9 70
04-2056 93.6 92.0 105.5 222.0 23.9 71 04-2057 93.4 92.0 105.3 231.0 25.9 72
All specimens of longitudinal orientation (tension axis parallel to rolling direction), tested at 24°C.
Elongation for length-to-diameter ratio (L:D) of 4; calculated from measurements for L:D ratio of 7.

202
the heat-treated 12-in.-thick segment of HSST plate 04. The tensile
properties are presented in Table 9.6 and Fig. 9.16. Results of
Charpy V-notch impact tests are also presented in Fig. 9.16. The
mechanical properties are symmetric about the midthickness even though
the plate was flat quenched.
Mill test reports, heat-treatment details, and detailed mechanical
properties of HSST materials have been reported20'21 and will be
reported in the Heavy Section Steel Technology Program Semiannual
Progress Report series.
Radiation Effects in Iron
Radiation Hardening in Iron (s. M. Ohr, N. E. Hinkle, M. S. Wechsler)
Temperature Dependence. - The change in the temperature dependence
of the yield stress in Fe following neutron irradiation is of consider-
able interest because it is a manifestation of the nature of the defects
responsible for radiation hardening and because it reflects the relative
importance of the defects produced by radiation as barriers to disloca-
tion motion compared to the preirradiation barriers. We have investi-
gated22'23 the temperature and strain rate dependencies of yield stress
in Fe irradiated to a relatively low fluence of 1.2 x 10¹⁶ neutrons/cm2
(> 1 Mev). We observed that the overall effect of neutron irradiation
was an upward shift of the curve for yield stress versus test tempera-
ture without an appreciable change in its shape. We have now extended
the study to a fluence of 2.7 x 10¹⁹ neutrons/cm2 (> 1 Mev).
20F. J. Witt, Heavy Section Steel Technology Program Semiann. Progr. Rept. Feb. 29, 1968, 0RNL-43l5^
21F. J. Witt, Heavy Section Steel Technology Program Semiann. Progr. Rept. Aug. 31, 1967, 0RNL-4176.
22S. M. Ohr and E. D. Boiling, Radiation Metallurgy Section Solid State Division Progress Report for Period Ending January 1967, ORNL-4097, pp. 13-24.
23S. M. Ohr, R. P. Tucker, and M. S. Wechsler, "Radiation Hardening in bcc Metals Niobium and Iron," pp. 187-192 in Proceedings of the Inter- national Conference on the Strength of Metals and Alloys, Tokyo, September 4-8, 1967, Vol. 9, Supplement to the Transactions of the Japan Institute of Metals, 1968.
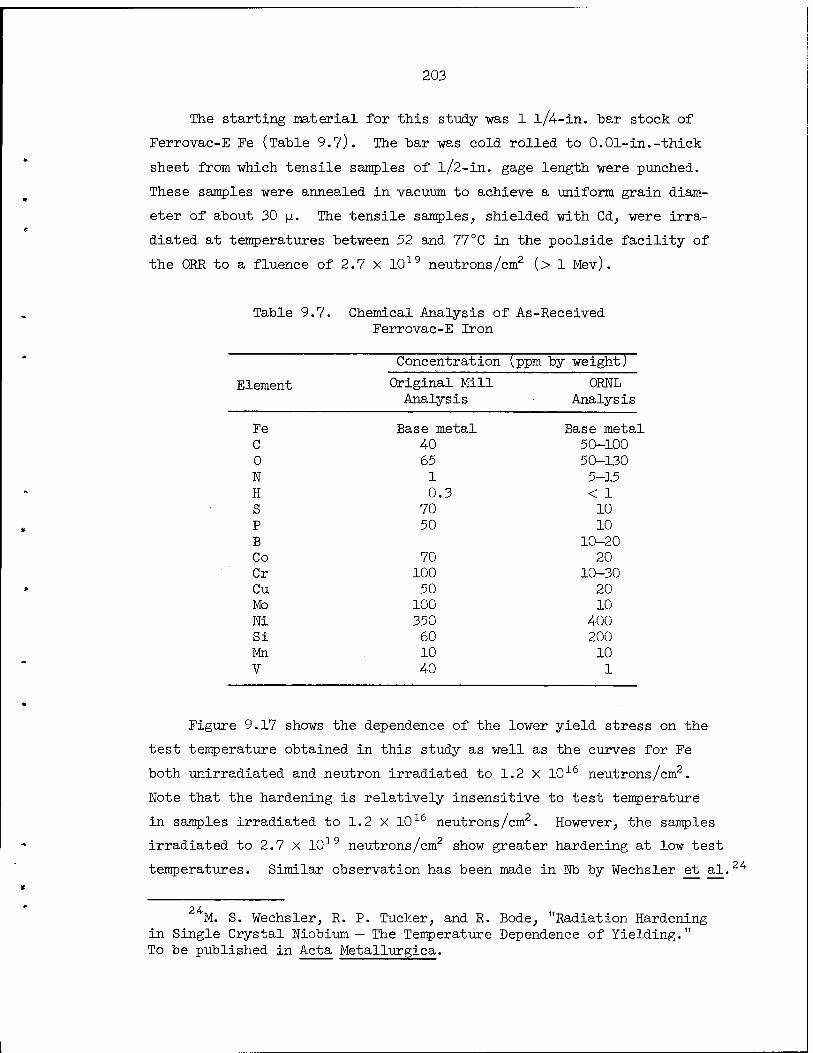
203
The starting material for this study was 1 l/4-in. bar stock of
Ferrovac-E Fe (Table 9.7). The bar was cold rolled to 0.01-in.-thick
sheet from which tensile samples of l/2-in. gage length were punched.
These samples were annealed in vacuum to achieve a uniform grain diam-
eter of about 30 |i. The tensile samples, shielded with Cd, were irra-
diated at temperatures between 52 and 77°C in the poolside facility of
the ORE to a fluence of 2.7 X 10¹⁹ neutrons/cm2 (> 1 Mev).
Table 9.7. Chemical Analysis of As-Received Ferrovac-E Iron
Concentration (ppm by weight)
Element
Fe C 0 N H S P B Co Cr Cu Mo Ni Si Mn V
Original Mill 0RNL Analysis Analysis
Base metal Base metal 4-0 50-100 65 50-130 1 5-15 0.3 < 1
70 10 50 10
10-20 70 20 100 10-30 50 20
100 10 350 400 60 200 10 10 40 1
Figure 9.17 shows the dependence of the lower yield stress on the
test temperature obtained in this study as well as the curves for Fe
both unirradiated and neutron irradiated to 1.2 X 10¹⁶ neutrons/cm2.
Note that the hardening is relatively insensitive to test temperature
in samples irradiated to 1.2 X 10¹⁶ neutrons/cm2. However, the samples
irradiated to 2.7 x 10¹⁹ neutrons/cm2 show greater hardening at low test
temperatures. Similar observation has been made in Nb by Wechsler et al.
M. S. Wechsler, R. P. Tucker, and R. Bode, "Radiation Hardening in Single Crystal Niobium — The Temperature Dependence of Yielding." To be published in Acta Metallurgica.
24
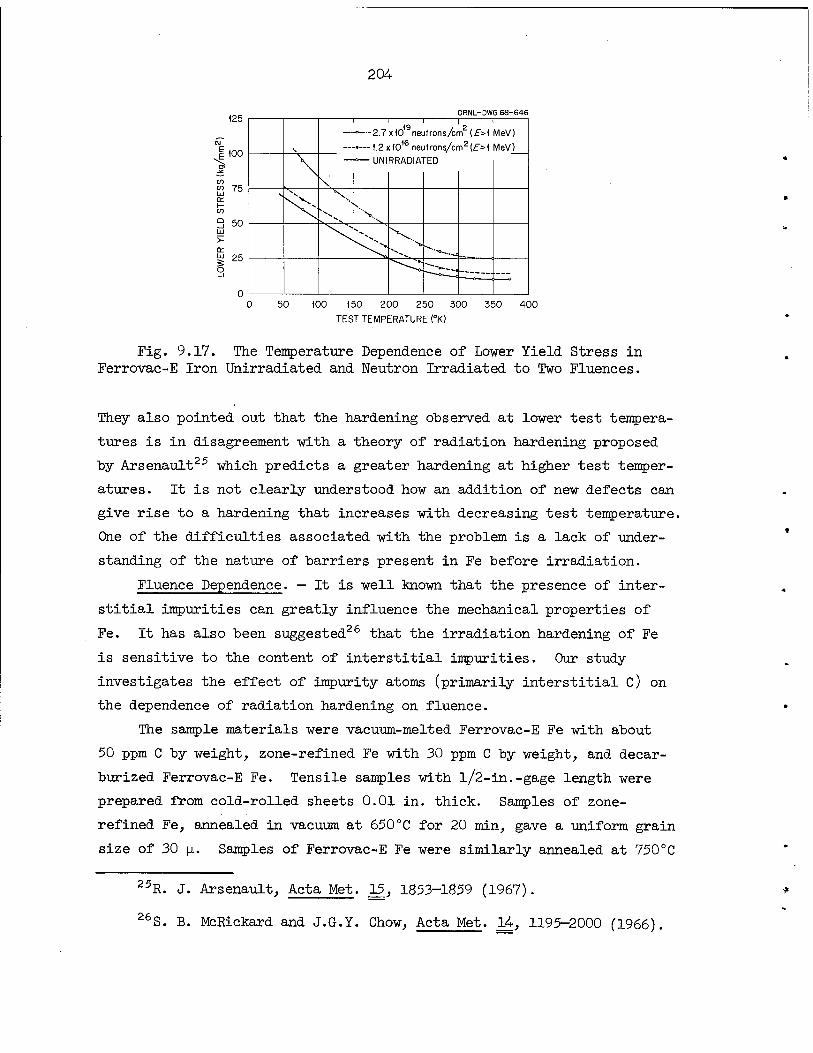
125
100
<o 75
50 UJ >- a. LU g o
25
204
ORNL-DWG 68-646
-—2.7
—1.2)
I 1 i 19 / 2
x10 neutrons/cm (£>1 MeV)
1016 neutrons/cm2 (F>1 MeV)
\ \
-— UNIRRADIATED
0\ \ ''V
\v ^*
\^
""""•—«.-
~~2lZ!~*
50 100 150 200 250 300
TEST TEMPERATURE (°K)
350 400
Fig. 9.17. The Temperature Dependence of Lower Yield Stress in Ferrovac-E Iron Unirradiated and Neutron Irradiated to Two Fluences.
They also pointed out that the hardening observed at lower test tempera-
tures is in disagreement with a theory of radiation hardening proposed
by Arsenault25 which predicts a greater hardening at higher test temper-
atures. It is not clearly understood how an addition of new defects can
give rise to a hardening that increases with decreasing test temperature.
One of the difficulties associated with the problem is a lack of under-
standing of the nature of barriers present in Fe before irradiation.
Fluence Dependence. — It is well known that the presence of inter-
stitial impurities can greatly influence the mechanical properties of
Fe. It has also been suggested26 that the irradiation hardening of Fe
is sensitive to the content of interstitial impurities. Our study
investigates the effect of impurity atoms (primarily interstitial c) on
the dependence of radiation hardening on fluence.
The sample materials were vacuum-melted Ferrovac-E Fe with about
50 ppm C by weight, zone-refined Fe with 30 ppm C by weight, and decar-
burized Ferrovac-E Fe. Tensile samples with l/2-in.-gage length were
prepared from cold-rolled sheets 0.01 in. thick. Samples of zone-
refined Fe, annealed in vacuum, at 650°C for 20 min, gave a uniform grain
size of 30 (j.. Samples of Ferrovac-E Fe were similarly annealed at 750°C
25 R. J. Arsenault, Acta Met. 15, 1853-1859 (1967).
26 S. B. McRickard and J.G.Y. Chow, Acta Met. 14, 1195-2000 (1966).
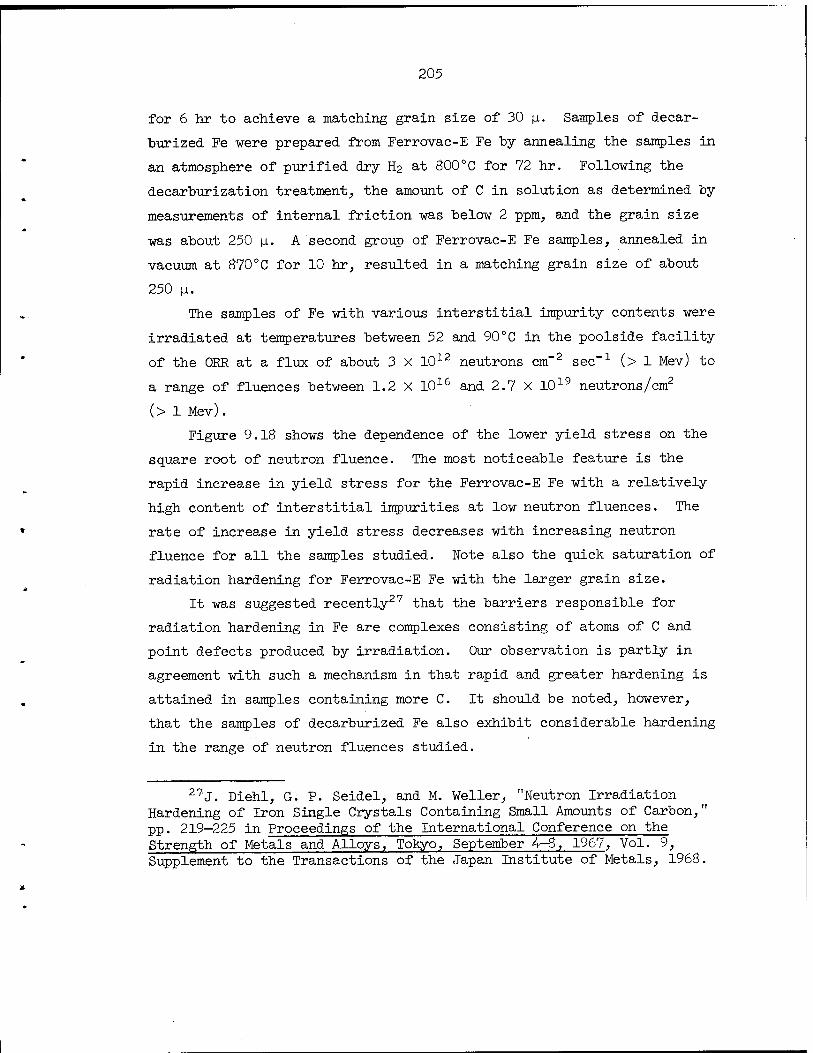
205
for 6 hr to achieve a matching grain size of 30 p.. Samples of decar-
burized Fe were prepared from Ferrovac-E Fe by annealing the samples in
an atmosphere of purified dry H2 at 800°C for 72 hr. Following the
decarburization treatment, the amount of C in solution as determined by
measurements of internal friction was below 2 ppm, and the grain size
was about 250 |_i. A second group of Ferrovac-E Fe samples, annealed in
vacuum at 870°C for 10 hr, resulted in a matching grain size of about
250 |i.
The samples of Fe with various interstitial impurity contents were
irradiated at temperatures between 52 and 90°C in the poolside facility
of the 0KR at a flux of about 3 X 10¹² neutrons cm-2 sec"1 (> 1 Mev) to
a range of fluences between 1.2 X 10¹⁶ and 2.7 X 10¹⁹ neutrons/cm2
(> 1 Mev).
Figure 9.18 shows the dependence of the lower yield stress on the
square root of neutron fluence. The most noticeable feature is the
rapid increase in yield stress for the Ferrovac-E Fe with a relatively
high content of interstitial impurities at low neutron fluences. The
rate of increase in yield stress decreases with increasing neutron
fluence for all the samples studied. Note also the quick saturation of
radiation hardening for Ferrovac-E Fe with the larger grain size.
It was suggested recently27 that the barriers responsible for
radiation hardening in Fe are complexes consisting of atoms of C and
point defects produced by irradiation. Our observation is partly in
agreement with such a mechanism in that rapid and greater hardening is
attained in samples containing more C. It should be noted, however,
that the samples of decarburized Fe also exhibit considerable hardening
in the range of neutron fluences studied.
27J. Diehl, G. P. Seidel, and M. Weiler, "Neutron Irradiation Hardening of Iron Single Crystals Containing Small Amounts of Carbon," pp. 219-225 in Proceedings of the International Conference on the Strength of Metals and Alloys, Tokyo, September 4-8, 1967, Vol. 9, Supplement to the Transactions of the Japan Institute of Metals, 1968.

206
ORNL-DWG 68-11162
*, NEUTRON FLUENCE (neutrons /cm2 ; £>1 MeV)
(2.5x1047)
(1.2x10 (2.7x10¹⁹)
N E
^E
CO CO ÜJ cc I- co
UJ
>- EC 111 3 o _l
o FERROVAC E IRON (30^)^
—•— FERROVAC E IRON (250/A)
a ZONE REFINED IRON (30/i)
—A—DECARBURIZED IRON(250^)
10 20 30 40 50 60
*",( NEUTRON FLUENCE)
[lO8 (neutrons/cm2 /2; E > ^ Mev]
Fig. 9.18. The Lower Yield Stress Plotted Versus the Square Root of the Neutron Fluence for Ferrovac-E Iron of Two Grain Sizes, Zone- Refined Iron, and Decarburized Iron.
Effect of Interstitial Solutes. — Measurements of the mechanical
properties of irradiated Fe (ref. 28), Nb (ref. 29), Mo (ref. 30), and
W and Mo (ref. 3l) have shown that there is an additional hardening of
these metals as a result of postirradiation annealing at about 15$ of
the absolute melting temperature (0.15 T ), when the irradiation temper-
ature is below this value. It has been suggested that interstitial
28N. E. Hinkle and N. K. Smith, Radiation Metallurgy Section Solid State Division Progress Report for Period Ending January 1967, ORNL-4097, pp. 7-13.
2 9, *M. J. Makin and F. J. Minter, Acta Met. 7, 361-366 (1959) 30 A. S. Wronski and A. A. Johnson, Phil. Mag. 8, 1067-1070 (1963).
J. Moteff, "Radiation Damage in Body-Centered Cubic Metals and Alloys," p. 727 in Radiation Effects, Gordon and Breach, New York, 1967.
31

207
impurities may be contributing to this "radiation-anneal hardening" by
interacting with the defects induced by irradiation to produce stronger
barriers to dislocation motion. However, none of these measurements
were made in studies that used supplemental techniques to determine
which interstitial element was involved. Therefore, a detailed investi-
gation32 was begun to determine by suitable techniques which interstitial
element contributes to the radiation-anneal hardening in Fe and to
obtain an understanding of the mechanism of the interaction between
interstitial atoms and defects induced by irradiation. Information
gained from this study should be of great value in understanding the
radiation hardening and embrittlement of steel.
Barton, Harries, and Mogford33 observed differences in the magnitude
of the radiation effect in steels produced by different methods. They
suggested that the variability of the radiation hardening might be asso-
ciated with the differences in the concentration of interstitial N,
which is dependent on the method of steelmaking used (i.e., on the chem-
istry of the final product). As a result of their work and the fact
that the effect of interstitial C on the radiation effect has been
extensively studied,3*-36 we decided to study the effect of interstitial
N on radiation effects in Fe.
The starting material for this study was Ferrovac-E Fe (Table 9.7)
swaged from 1 l/4-in.-diam bar to l/l6 in. in diameter and decarburized
and denitrogenized in dry H2 at 800°C for about 96 hr. This material
was further swaged and drawn to 0.050 in. in diameter, and pieces were
32H. E. Hinkle, J. M. Williams, W. E. Brundage, and J. T. Stanley, Radiation Metallurgy Section Solid State Division Progress Report for Period Ending July 1967, 0RNL-4195, pp. 15-21.
33P. J. Barton, D. R. Harries, and I. L. Mogford, J. Iron Steel Inst. (London) 203, 507-510 (1965).
34H. Wagenblast and A. C. Damask, Phys. Chem. Solids 23, 221-227 (1962). —
35F. E. Fujita and A. C. Damask, Acta Met. ^L2, 331-339 (1964). 36J.G.Y. Chow and S. B. McRickard, "Low-Temperature Embrittlement
of Iron, Iron Alloys, and Steels by Neutron Irradiations," pp. 120-130 in Flow and Fracture of Metals and Alloys in Nuclear Environments, Am. Soc. Testing Mater. Spec. Tech. Publ. 380, American Society for Testing and Materials, Philadelphia, Pennsylvania, 1965.

208
cut for resistivity, internal-friction, and tensile specimens. The
shoulders of the tensile specimens were fabricated by cold-upsetting
the ends of 1 l/2-in.-long wire blanks in a double-ended, hydraulically
operated die.
The specimens were heat treated 4 hr in dry H2 at 700 and 800CC
and then cooled in the furnace to establish grain sizes of 30 and 130 \i.
Specimens of each grain size were further heat treated at 590°C for
10 hr, quenched in water, and stored in liquid N. In this heat treat-
ment, one group of specimens of each grain size had about 20 ppm W by
weight added by treatment in a hydrogen-ammonia atmosphere; a second
control group was treated in an atmosphere of pure H2. These materials
are identified as Fe-20N and Fe, respectively. The concentration of N
in solid solution was verified by measurements of internal friction.
Less than 1 ppm N by weight was detected in the Fe material. The C
in solution was below 2 ppm by weight as determined by measurements of
internal friction and confirmed by measurements of the magnetic after-
effect. However, chemical methods indicated a concentration of 50 to
100 ppm C by weight. Therefore, the C in the Fe and Fe-20W materials
is believed to be present in the form of carbides or segregated at
grain boundaries, where it makes little contribution to the yield or
flow stresses.
As previously reported,32 the neutron irradiations were performed
at temperatures between —50 and —100°C in a liquid-nitrogen-cooled
cryostat positioned against one side of the 0RNL Bulk Shielding Reactor.
The neutron flux in this facility was about 3 X 10¹² neutrons cm"2 sec-1
(> 1 Mev). For the results reported below, the specimens were irra-
diated to a fluence of 4- X 1017 neutrons/cm2 (> 1 Mev).
After the irradiation, the assemblies were removed from the irradia-
tion facility without exceeding the irradiation temperature and stored
in liquid N for a period of radioactivity decay. Then the assemblies
were taken apart in a bath of liquid N and stored in liquid N until
testing began. The unirradiated specimens were also stored in liquid
W while they awaited testing.

209
The irradiated specimens were annealed 15 min at temperatures from
—36 to 250 °C and quenched in liquid N. After this postirradiation
anneal, the specimens were tested at —36 °C at a strain rate of 0.02 min-1
to a strain of 0.04. At given amounts of strain in this range, the
strain rate was momentarily changed to 0.002 min-1. Next, the samples
were aged for 20 hr at 40°C to permit the complete precipitation of
any free nitrogen and carbon interstitials and tensile tested an addi-
tional A-io at —36°C according to the same pattern of strain rates. We
expected the aging response to be a quantitative measure of the inter-
stitial atoms remaining in solid solution following the postirradiation
anneal. In Figs. 9.19 and 9.20 we show typical stress-strain curves
for the Fe and Fe-20N materials. In these figures, we can observe the
ORNL-DWG 68-11899
K103)
40
30
CO CO Ld
£ 20 to
10
—»| |«— e = 0.002 min"'
DECARBURIZED FERROVAC-E IRON, Fe AVERAGE GRAIN SIZE ~ 30/L
TEST TEMPERATURE = - 36°C STRAIN RATE = 0.02 min-' ANNEALING TIME=15min AT INDICATED
ANNEALING TEMPERATURE, TA
STRAIN AGED AT 40°CF0R 20 hr
0.02 0.04 0.06 0.08
ENGINEERING STRAIN (in./in.)
0.10
Fig. 9.19. Stress-Strain Curves at -36°C for Material Fe Shiwing the Effect of Irradiation, Postirradiation Annealing, and Strain Aging.
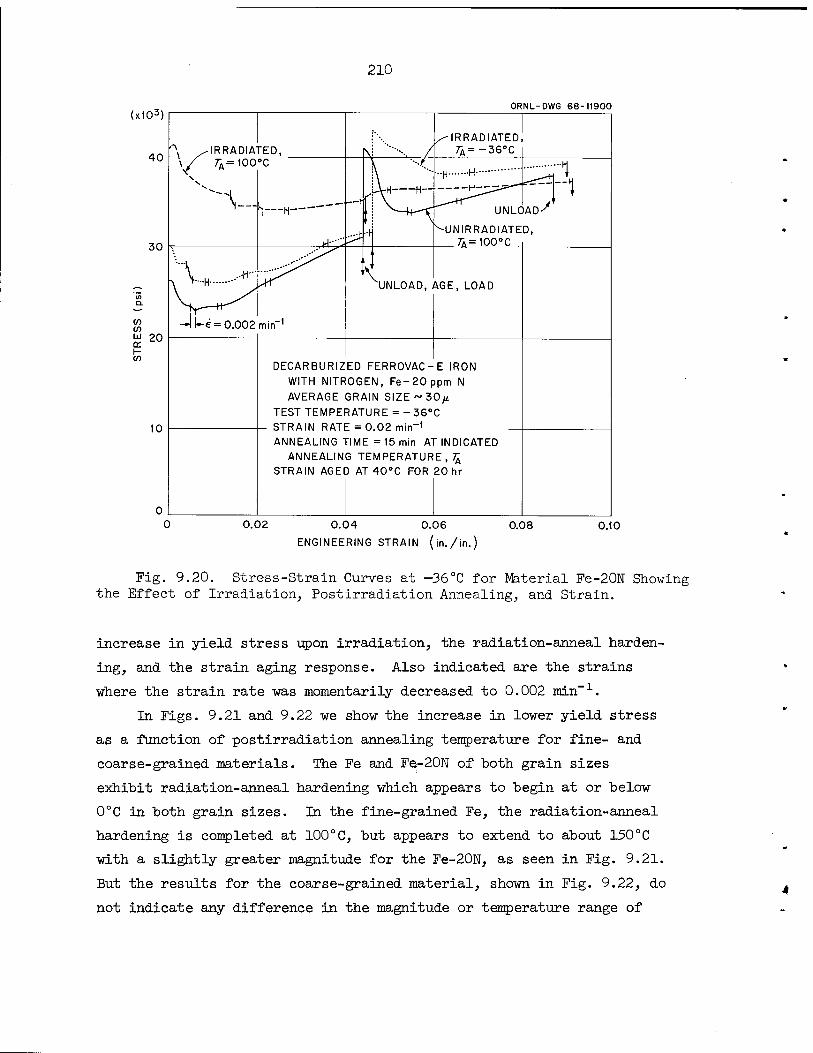
210
(xlO3)
40
ORNL-DWG 68-11900
30
to CO
£ 20 h- co
DECARBURIZED FERROVAC-E IRON WITH NITROGEN, Fe-20ppm N AVERAGE GRAIN SIZE ~ 30^
TEST TEMPERATURE = -36°C STRAIN RATE = 0.02 min-1
ANNEALING TIME =15 min AT INDICATED ANNEALING TEMPERATURE , £
STRAIN AGED AT 40°C FOR 20 hr
0.02 0.04 0.06 ENGINEERING STRAIN (in./in.)
0.08 0.10
Fig. 9.20. Stress-Strain Curves at -36°C for Material Fe-20N Showing the Effect of Irradiation, Postirradiation Annealing, and Strain.
increase in yield stress upon irradiation, the radiation-anneal harden-
ing, and the strain aging response. Also indicated are the strains
where the strain rate was momentarily decreased to 0.002 min-1.
In Figs. 9.21 and 9.22 we show the increase in lower yield stress
as a function of postirradiation annealing temperature for fine- and
coarse-grained materials. The Fe and Fe-20N of both grain sizes
exhibit radiation-anneal hardening which appears to begin at or below
0°C in both grain sizes. In the fine-grained Fe, the radiation-anneal
hardening is completed at 100°C, but appears to extend to about 150°C
with a slightly greater magnitude for the Fe-20N, as seen in Fig. 9.21.
But the results for the coarse-grained material, shown in Fig. 9.22, do
not indicate any difference in the magnitude or temperature range of

211
ORNL-DWG 68-W59R (X104)
40
5 o 20
10
"1 I TEST TEMPERATURE =-36° C STRAIN RATE = 0.02 min-1
ANNEALING TIME=15min DECARBURIZED FERROVAC-E IRON
AVERAGE GRAIN SIZE:~30/x
IRRADIATED ■ 4>=4x10,7neutron/cm2 (£">1 MeV)
IRRADIATION TEMPERATURE? -50° C
100 200 300
rA , POST - IRRADIATION ANNEALING TEMPERATURE (°C)
Fig. 9.21. Effect of Postirradiation Annealing on Separate Tensile Specimens.
the radiation-anneal hardening. There is an indication that softening
is beginning at an annealing temperature of 200 to 250°C.
The increase in flow stress -upon aging 20 hr at 40°C is shown in
Fig. 9.23 as a function of the postirradiation annealing temperature
before aging. The heights of curves in Fig. 9.23 are a measure of the
amounts of interstitial impurities present in solid solution (and
therefore able to participate in the strain aging) after the 15-min
anneals at temperatures indicated on the abscissa. The most prominent
feature in Fig. 9.23 is the decrease in the aging response of Fe-20N
between 0 and 100°C, which reaches a minimum near zero aging response
at about 100°C, whereas no minimum is seen for the Fe. The minimum for
Fe-20N but not for Fe is also illustrated in Fig. 9.24, where we show
the yield drop after aging the fine-grained materials. Since the
magnitude of the yield drop is associated with the concentration of
interstitial atoms in solution available to pin dislocation sources,

212
(xlO3) ORNL-DWG 68-11898
UJ >-
40
30
20
10
DECARBURIZED FERROVAC-E IRON AVERAGE GRAIN SIZE~130/i TEST TEMPERATURE = - 36°C STRAIN RATE =0.02 min-1
ANNEALING TIME = 15 min
■ Fe - 20 ppm N • Fe
IRRADIATED
$ = 4x10 neutrons/cm (£">1 meV)
IRRADIATION TEMPERATUREN50°C
a Fe - 20 ppm N o Fe
UNIRRADIATED
-40 0 100 200 300
TA, POST-IRRADIATION ANNEALING TEMPERATURE (°C) 400
Fig. 9.22. Specimens.
Effect of Postirradiation Annealing on Separate Tensile
the minimum in the aging response in Fig. 9.23 is evidence again that
the N in solution is decreased during the postirradiation anneal at
100°C in Fe-20N. These results are in accord with our previous studies
of resistivity and internal friction,37 which indicated an annealing
stage of 0 to 100°C in irradiated Fe-20N but no such stage for Fe.
Upon postirradiation annealing above 100°C, the aging response
returns in Fe-20N, as shown in Fig. 9.23 for the flow stress increase
upon aging and in Fig. 9.24 for the yield drop. The previous resistivity
measurements37 showed that the resistivity of Fe-20N decreased less than
that of Fe in the postirradiation annealing temperature range 100 to
200°C, indicating some return of N to solid solution at these temperatures.
37T 'N. E. Hinkle, J. M. Williams, W. E. Brundage, and J. T. Stanley, Radiation Metallurgy Section Solid State Division Progress Report for Period Ending July 1967, ORNL-4-195, pp. 15-21.
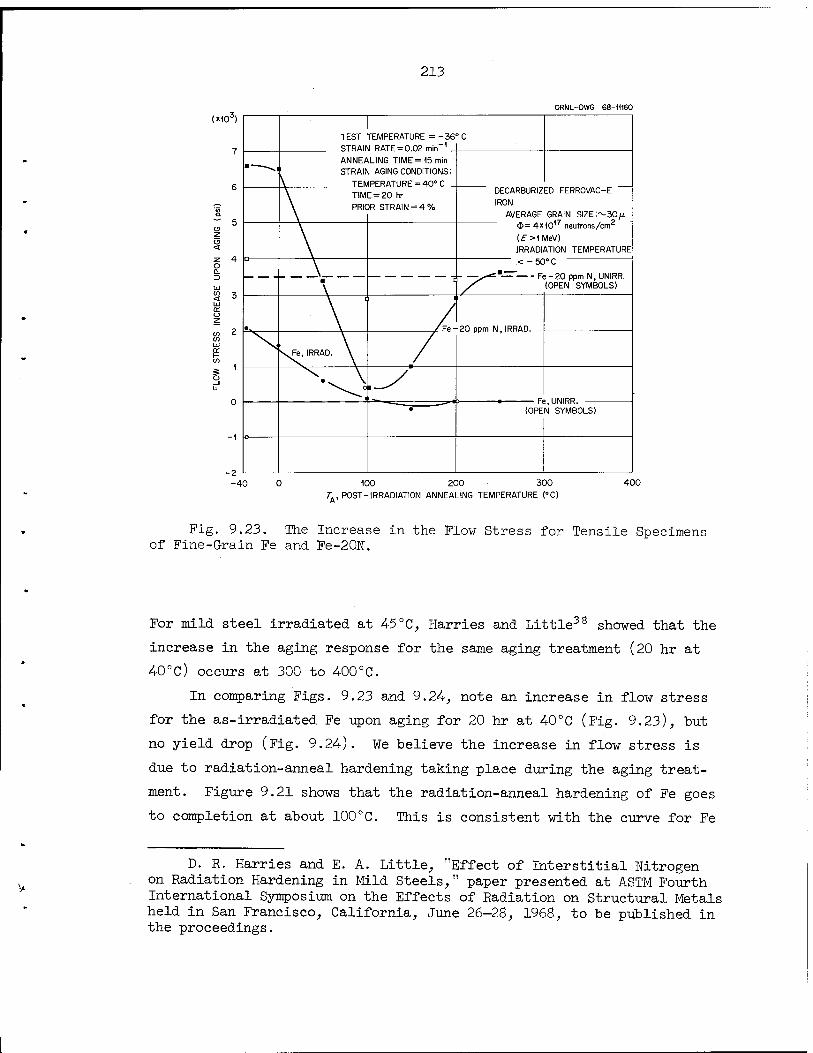
213
ORNL-DWG 68-H160
TEST TEMPERATURE = -36' STRAIN RATE = 0.02 min-1 . ANNEALING TIME = 15 min STRAIN AGING CONDITIONS:
TEMPERATURE = 40° C . TIME = 20 hr PRIOR STRAIN = 4%
DECARBURIZED FERROVAC-E IRON
AVERAGE GRAIN SIZE:~30^ <£>= 4X10¹⁷ neutrons/cm2
(£><MeV) IRRADIATION TEMPERATURE <-50°C '
400 r, POST-IRRADIATION ANNEALING TEMPERATURE PC) A'
Fig. 9.23. The Increase in the Flow Stress for Tensile Specimens of Fine-Grain Fe and Fe-20N.
For mild steel irradiated at 45 °C, Harries and Little38 showed that the
increase in the aging response for the same aging treatment (20 hr at
40°c) occurs at 300 to 400°C.
In comparing Figs. 9.23 and 9.24, note an increase in flow stress
for the as-irradiated Fe upon aging for 20 hr at 4-0°C (Fig. 9.23), but
no yield drop (Fig. 9.24). We believe the increase in flow stress is
due to radiation-anneal hardening taking place during the aging treat-
ment. Figure 9.21 shows that the radiation-anneal hardening of Fe goes
to completion at about 100°C. This is consistent with the curve for Fe
D. R. Harries and E. A. Little, "Effect of Interstitial Nitrogen on Radiation Hardening in Mild Steels," paper presented at ASTM Fourth International Symposium on the Effects of Radiation on Structural Metals held in San Francisco, California, June 26-28, 1968, to be published in the proceedings.

214
(xlO3)
z
<
UJ
Q. o tr Q
O _i LÜ
-40
ORNL-DWG 68-12356
0 100
TA, POST-IRRADIATION ANNEALING TEMPERATURE CO
300
Fig. 9.24. The Yield Drop Observed for Fine-Grain Fe and Fe-20N after an Aging Treatment of 40°C for 20 hr.
in Fig. 9.23 in that the flow stress increase upon aging goes to zero
for specimens annealed at about 100°C.
The observation that the Fe material exhibits radiation-anneal
hardening to only a slightly lesser degree than the Fe-20N material
(Fig. 9.21) suggests that N is not a major contributing factor to the
radiation-anneal hardening. On the other hand, the strain aging results
(Figs. 9.23 and 9.24), supported by earlier studies of resistivity and
internal friction,37 show that N is indeed removed from solid solution,
presumably at defects produced by the irradiation. Thus, we conclude
that the nitrogen-defect complexes do not have a hardening effect. This
is further indicated by the recovery to the unirradiated strain aging
response for flow stress (Fig. 9.23) and yield drop (Fig. 9.24) after
annealing to 250°C, whereas the yield stress still exhibits the radiation-
anneal-hardened value after annealing to this temperature.
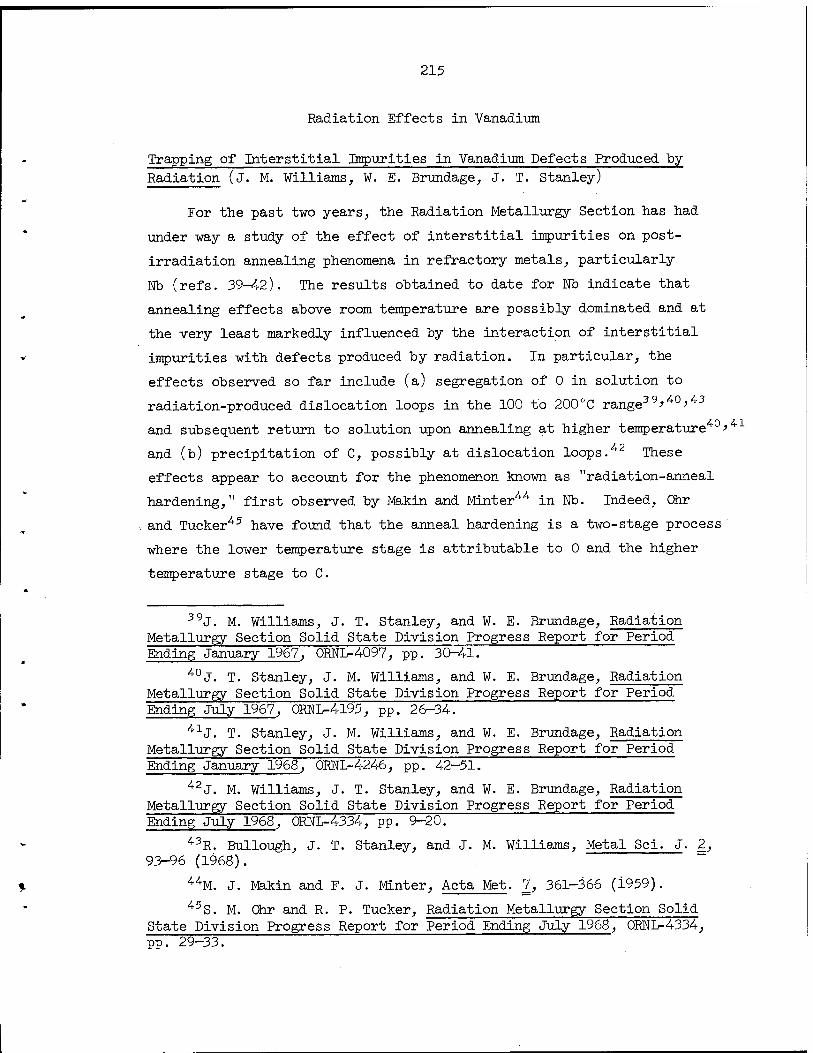
215
Radiation Effects in Vanadium
Trapping of Interstitial Impurities in Vanadium Defects Produced "by- Radiation (j. M. Williams, W. E. Brundage, J. T. Stanley)
For the past two years, the Radiation Metallurgy Section has had
under way a study of the effect of interstitial impurities on post-
irradiation annealing phenomena in refractory metals, particularly
Nb (refs. 39^42). The results obtained to date for Nb indicate that
annealing effects above room temperature are possibly dominated and at
the very least markedly influenced by the interaction of interstitial
impurities with defects produced by radiation. In particular, the
effects observed so far include (a) segregation of 0 in solution to
radiation-produced dislocation loops in the 100 to 200°C range39>M>^3
and subsequent return to solution upon annealing at higher temperature'40>41
and (b) precipitation of C, possibly at dislocation loops.42 These
effects appear to account for the phenomenon known as "radiation-anneal
hardening," first observed by Makin and Minter44 in Nb. Indeed, Ohr
and Tucker45 have found that the anneal hardening is a two-stage process
where the lower temperature stage is attributable to 0 and the higher
temperature stage to C.
39J. M. Williams, J. T. Stanley, and W. E. Brundage, Radiation Metallurgy Section Solid State Division Progress Report for Period Ending January 1967, 0RNL-4097, pp. 30-41.
40J. T. Stanley, J. M. Williams, and W. E. Brundage, Radiation Metallurgy Section Solid State Division Progress Report for Period Ending July 1967, 0RNL-4195, pp. 26-34.
41J. T. Stanley, J. M. Williams, and W. E. Brundage, Radiation Metallurgy Section Solid State Division Progress Report for Period Ending January 1968, 0RNL-4246, pp. 42-51.
42J. M. Williams, J. T. Stanley, and W. E. Brundage, Radiation Metallurgy Section Solid State Division Progress Report for Period Ending July 1968, 0RNL-4334, pp. 9-20.
43R. Bullough, J. T. Stanley, and J. M. Williams, Metal Sei. J. 2, 93-96 (1968).
44M. J. Makin and F. J. Minter, Acta Met. 7, 361-366 (i959). 45S. M. Ohr and R. P. Tucker, Radiation Metallurgy Section Solid
State Division Progress Report for Period Ending July 1968, 0RNL-4334, pp. 29-33.

216
In view of the fact that V and its alloys are receiving more con-
sideration as potential reactor materials than is Nb, we decided to
undertake studies in V to ascertain the extent to which the effects in V
parallel those in Kb. Vanadium, like Nb, is a Group VA metal in which
the impurities 0 and N are highly soluble. The solubility of C is
quite low. Vanadium, however, has a considerably lower melting point
than Nb and is therefore more difficult to purify. Furthermore, C and
0 move in the same temperature range with nearly the same activation
energies.^6
Sample Preparation. — Two materials labeled VC and VD were used in
this study. The starting material for each was 0.032-in.-diam wire
obtained from the Materials Research Corporation. The final preparation
procedure for each of the materials was an annealing and outgassing
treatment by resistive heating of the wires in a high-vacuum bell jar.
Material VC was annealed at about 1400°C for about 2.5 hr, and the final
vacuum achieved was 6 x 10"9 torr. Material VD was annealed at about
1200CC for about 1 hr, and the final vacuum achieved was 3 X 10"8 torr.
Thus, we expected VC to be the purer material. We cut the resulting
wires into a number of resistivity and internal-friction samples. The
internal-friction samples were 4 in. long, and the resistivity samples
were 2 in. long with gage lengths of about 1 in.
Measurement Techniques. — The internal friction was measured using
an inverted-torsion pendulum at 1.12 Hz. The resistivity was measured
with a thermo-free microvolt potentiometer with the samples immersed in
liquid He inside a superconducting solenoid set at 5 kilogauss. The
direction of current in the sample was parallel to the magnetic field.
Potential contacts to the resistivity samples were made by spot welding
0.005-in.-diam Fe wires to the samples. These contacts were used for
the preirradiation measurements but were replaced with platinum contacts
before the postirradiation measurements were made. Thus the gage lengths
were not precisely constant between the preirradiation and postirradiation
measurements. However, the gage lengths were measured as accurately as
46R. W. Powers and M. V. Doyle, J. Appl. Phys. 30, 514-524 (1949).

217
was possible without abusing the samples (±1$) for both sets of
potential contacts.
Irradiation Procedures. — The materials VC and VD were irradiated
simultaneously in a helium atmosphere in position CP-15 of the OKNL
Bulk Shielding Reactor. The temperature of irradiation (60°c) was
measured with a thermocouple spot-welded to a dummy sample in the
assembly. The neutron fluence was 7 X 10¹⁷ neutrons/cm2 (>1.0 Mev).
Annealing Procedures. — Internal-friction samples were annealed in
place in the torsion pendulum. Resistivity samples were postirradiation
annealed by immersing the sample holder in a silicone oil bath, tempera-
ture controlled to ±0.2°C. Following each anneal, the samples were
cooled rather rapidly to room temperature, and the oil was removed
simultaneously by immersing them in Freon 11. Then, for the measurement
at liquid-helium temperature, the samples were cooled slowly to near
liquid-nitrogen temperature by passing cooled nitrogen gas over them
and were inserted slowly into the liquid-helium-cooled magnet. This
slow-cooling procedure was followed because we found that rapid cooling
to liquid-nitrogen temperature seemed to introduce scatter into the
data. Westlake4'7 has found resistivity anomalies between measurements
at room temperature and at liquid-nitrogen temperature that he attrib-
utes to precipitation of H. If H had been introduced into our materials
during irradiation, such a phenomenon could possibly account for the
sensitivity of our data to the procedural details in this experiment.
It should be emphasized, however, that only the apparent scatter in the
data and not the main effects reported in our results were affected by
the procedures.
Figure 9.25 shows results from preirradiation measurements of
internal friction between 100 and 34-0°C. The oxygen and nitrogen peaks
are identified on the basis of the data of Powers and Doyle.4"6
Table 9.8 shows the corresponding oxygen and nitrogen concentrations
calculated from the data of Powers and Doyle, together with the
residual resistivity values for the two materials. The resistivity
4-7 D. G. Westlake, Phil. Mag. 16, 905-90Ö (1967).

218
wo"*)
70
z60
0RNL-DWG66-562A
NITROGEN
OXYGEN
SAMPLE VD — (HIGH OXYGEN
'SAMPLE VC LOW OXYGEN '-V' )
180 220 260 TEMPERATURE (°C)
Fig. 9.25. Internal Friction of Unirradiated Vanadium Materials as a Function of Temperature. Frequency = 1.12 Hz.
Table 9.8. Characteristics of Vanadium Materials
Material Concentrat ion, at. ppm Resistivity Oxygen Nitrogen (|jX2-cm)
VC
VD
83
257
1770
1940
1.32 ± 0.02
1.59 ± 0.02
values represent the average of measurements on three samples of each
material, and the error limits shown probably arise from inconsistencies
in the geometrical measurements. We have been unable to locate litera-
ture giving the resistivity contributions of interstitial impurities in
V, but the resistivity values given in Table 9.8 are reasonable if it
is assumed that the resistivity contributions for 0 and N are in the
range 5 to 10 |j.fl-cm/at. j>. This range of values is typical of inter-
stitial impurities in body-centered cubic metals. If the resistivity
difference of 0.27 (ifl-cm between the two samples is attributed to the
interstitial impurity difference of 344 ppm (atomic), we get a resis-
tivity of 7.8 M-fi-cm/at./0 interstitial impurities, making no distinction
between 0 and N as to effect on resistivity.
After irradiation, an internal-friction sample from material VD
was annealed first at the oxygen-peak temperature (l85°C) and then at
the nitrogen-peak temperature (275°C), and internal friction was
measured as a function of time at the two temperatures. Figure 9.26
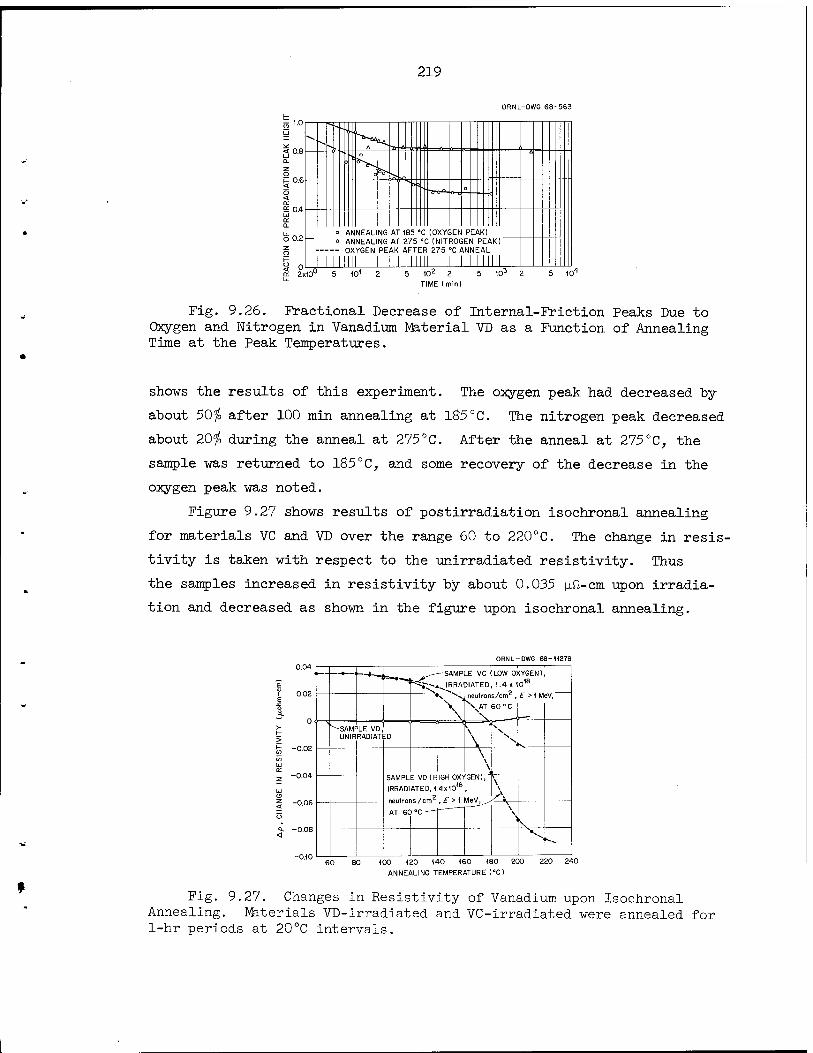
219
ORNL-DWG 68-563
£ 0.4
O0.2
*v.
"--- o"-üi ^
Tr A-ir f-i rt-
0 Ss-
J~-Tro^. o
0 ANNEALING AT 185 °C (OXYGEN PEAK) " ANNEALING AT 275 °C (NITROGEN PEAK)
■— OXYGEN PEAK AFTER 275 "C ANNEAL
HI 10'
Fig. 9.26. Fractional Decrease of Internal-Friction Peaks Due to Oxygen and Nitrogen in Vanadium Material VD as a Function of Annealing Time at the Peak Temperatures.
shows the results of this experiment. The oxygen peak had decreased by
about 50fo after 100 min annealing at 185 °C. The nitrogen peak decreased
about 20$ during the anneal at 275°C. After the anneal at 275°C, the
sample was returned to 185°C, and some recovery of the decrease in the
oxygen peak was noted.
Figure 9.27 shows results of postirradiation isochronal annealing
for materials VC and VD over the range 60 to 220°C. The change in resis-
tivity is taken with respect to the unirradiated resistivity. Thus
the samples increased in resistivity by about 0.035 pD-cm upon irradia-
tion and decreased as shown in the figure upon isochronal annealing.
ORNL-DWG 68-11278
E
E o
60 80 100 120 140 160 180 200 220 240
ANNEALING TEMPERATURE (°C)
Fig. 9.27. Changes in Resistivity of Vanadium upon Isochronal Annealing. Materials VD-irradiated and VC-irradiated were annealed for 1-hr periods at 20°C intervals.

220
However, since the gage lengths were not precisely the same for the pre-
irradiation and postirradiation measurements, an explanation of the way
in which we arrived at the increase of 0.035 |_ift-cm is needed. For four
samples (two each of VC and VD) the resistivity increase upon irradiation
was found to range from 0.025 to 0.049 jj.fi-cm with an average of
0.035 ^fi-cm, and these measurements included the error associated with
changing and remeasuring the gage length. Thus, for purposes of
presenting the magnitudes of the effects in these samples on some
absolute basis, we assumed the resistivity increased by 0.035 |j.fl-cm
upon irradiation in all the samples. The principal feature illustrated
in Fig. 9.27 is that both materials exhibit a large decrease in resis-
tivity between 100 and 200°C, but the decrease is much smaller in
material VC (low oxygen content) than in VD (high oxygen content).
Furthermore, the resistivity goes below the preirradiation value. In
view of the problem of gage length, we would not argue that the appear-
ance of going below the preirradiation value is necessarily real in
material VC, but it decidedly is real in VD. Uhirradiated material VD
exhibits a slight decrease in resistivity up to 140°C and thereafter
increases slightly. This increase appears to be reversible. The resis-
tivity decreases again when we return the sample to 140°C after
annealing it at 200°C. However, the magnitudes of the effects in unirra-
diated VD are much smaller than in the irradiated material.
The data represented as 1-hr isochronal annealing data in Fig. 9.27
are in fact the end points of a series of 1-hr isothermal anneals on
one sample at successively increasing temperatures, where measurements
were made as a function of time during the 1-hr period. From this type
of measurement, the activation energy of the process can be determined
from the change in slope attendant upon changing the temperature abruptly
from Ti to T2. Figure 9.28 shows the series of isothermal anneals
obtained on VC. The activation energies that were calculated from the
changes in slope are tabulated in Table 9.9. It is difficult to estimate
the error in this method of determining activation energy, but by
drawing various curves through the data in Fig. 9.28, we estimate that
the scatter in the data warrants assignment of an error band no greater

221
(.34 ORNL-DWG 68-12413
20 40 60 0 0 20 40 60
/, ANNEALING TIME (min)
Fig. 9.28. Resistivity as a Function of Annealing Time at Succes- sively Increasing Temperatures in an Irradiated Sample of Vanadium Material VC.
Table 9.9. Activation Energies Obtained from Ratio-of-Slopes Method
Annealing Temperatures, °C
Ti T2
Em Activation Energy
(ev)
100
120
140
160
180
120
140
160
180
200
1.23
1.24
1.14
1.32
1.02
than ±0.12 ev to any one determination, assuming all the apparent scatter
is indeed random. The values are in reasonably good agreement except
for the value 1.02 ev obtained for the last temperature transition from
180 to 200°C. In Wo, it has been found that the apparent activation
energy for Stage III falls off as the measurements are made at higher
222
temperatures.48'49 This is attributed to the concept that the satura-
tion value is strongly temperature dependent, a circumstance that would
invalidate most methods of determining activation energy as saturation
is approached.
We shall first discuss the annealing effects between 100 and 220°C,
but before proceeding, perhaps some background information on previous
annealing studies in this temperature region in body-centered cubic
metals will help facilitate discussion. Pronounced resistivity annealing
stages in this temperature region have been observed in both neutron-
irradiated and deformed body-centered cubic metals,50-53 and because
irradiation is known to produce point defects, these stages were first
attributed to annealing of point defects and called Stage III annealing.
Now, however, there is mounting evidence that in the Group VA metals
these resistivity decreases are caused by the migration of interstitial
impurities to defect structures produced by irradiation or deformation.
The evidence that this is the case in Kb and Ta appears quite
conclusive.^8,49,54,55 EarlleT} mthe and Sc:hiät56 observed that the
J. M. Williams, J. T. Stanley, and W. E. Brundage, Metal Sei. J 2, 100-104 (1968).
49A. Köthe, Acta Met. 16, 357-367 (1968). 50D. E. Peacock and A. A. Johnson, Phil. Mas. 8, 563-577 (1963). 51J. Moteff and J. P. Smith, "Recovery of Defects in Neutron-
Irradiated Tungsten," pp. 171-187 in Flow and Fracture of Metals and Alloys in Nuclear Environments, Am. Soc. Testing Mater. Spec. TechT~ Publ. 380, American Society for Testing and Materials, Philadelphia Pennsylvania, 1965. '
52D. G. Martin, Acta Met. 5, 371-376 (1957).
L. Stals and J. Nihoul, Phys. Status Solidi 8, 785-793 (1965). 54R. Bullough, J. T. Stanley, and J. M. Williams, Metal Sei J 2
93-^6 (1968). ' =' 55Z. C. Szkopiak and B. Pouzet, "Effect of Oxygen on 'Stage III«
Recovery in Cold-Worked Niobium," pp. 709-723 in International Conference on Vacancies and Interstitials in Metals. Vol. II Jill inh Germany, September 1968. ' '
56A. Köthe and F. Schlät, J. Mater. Sei. 2, 201-205 (1967).

223
magnitude of the annealing effects in deformed V decreased with decreas-
ing oxygen content and concluded that effects in V are analogous to those
in 5Tb and Ta. This interpretation has recently been questioned by
Perepezko et al.57 on the basis of an activation energy determination.
These workers observed annealing effects between 100 and 200°C in both
deformed and neutron-irradiated V that closely resemble those of Kothe and
Schlät in deformed material and those of the present work in irradiated
material. Perepezko et al.57 measured activation energies of 0.87 ± 0.07 ev
and 0.79 ± 0.09 ev for the annealing stage in deformed and irradiated mate-
rials, respectively. Since these activation energies are lower than the
diffusion activation energies of either C, 0, or N and greater than the
diffusion activation energy of H, they conclude that the annealing stage
should be attributed to annealing of lattice vacancies, possibly to
impurity traps. It would appear that the activation energies of about
0.8 ev are somewhat lower than is usually measured for an annealing
process in this temperature region; as the authors point out,57 an
enormous number of jumps (about 108) of the migrating species is implied.
In view of the considerably larger activation energy measured in
the present experiment, we submit that the mechanism of migration of
interstitial impurities to radiation-produced defects, probably disloca-
tion loops, still provides a simple and satisfactory explanation of
events in this temperature region. First of all, the effect takes place
in the temperature region where internal-friction measurements indicate
0 first becomes highly mobile, whether it migrates to radiation-produced
defects or not. Thus, we prefer to attribute the internal-friction
decrease at the oxygen-peak temperature to migration of 0 to some site
where it is effectively removed from interstitial solid solution. This
interpretation and the notion that the resistivity decrease is connected
with the internal-friction decrease are supported by the fact that the
activation energy for the resistivity decrease measured in this experi-
ment (Table 9.9) agrees with the diffusion activation energy of 0
(1.25 ev) (ref. 58).
57J. H. Perepezko, R. F. Murphy, and A. A. Johnson, "Point Defects in Vanadium." To be published in The Philosophical Magazine.
58R. W. Powers and M. V. Doyle, J. Appl. Phys. 30, 514-524 (1949).

224
The magnitude of the resistivity decrease and the fact that the
resistivity drops below the preirradiation value are readily accounted
for on the basis of this mechanism. The internal-friction decrease
(Fig. 9.26) indicates that about 50$ of the 0 or 130 ppm (atomic) is
removed from solution in material VD. The magnitude of the resistivity
decrease for this material, 0.125 [ifi-cm, divided by the above-mentioned
figure, 7.8 [iü-cm at. $, would suggest removal of about 160 ppm (atomic),
which is basically in good agreement considering that the figure
7.8 jift-cm at. # represents about an average of the resistivity contribu-
tions of 0 and N rather than the contribution of 0 specifically. Since
most of the residual resistivity is caused by interstitial impurities,
any effect involving a sizable fraction of these impurities is likely to
override the relatively small increase in resistivity caused by irradia-
tion. It is to be expected that material containing less 0 will exhibit
a smaller resistivity decrease, as was the case in this experiment
(Fig. 9.27).
Resistivity annealing studies were not made above 220°C, but the
fact that the nitrogen peak decreases with time at the nitrogen-peak tem-
perature (275°C) indicates that the behavior of N is similar to that of
0 and that a large resistivity decrease should be expected in this tem-
perature region as well. Köthe and Schla't observed such a resistivity
decrease centered at 265°C in deformed V containing 1000 ppm N (ref. 56).
In the discussion so far we have ignored possible effects due to C,
but because the diffusion activation energy for C (1.18 ev) is only
slightly lower than that for 0 (1.26 ev), involvement of C in the anneal-
ing effect below 200°C cannot be ruled out. The width of the 100 to
200°C annealing stage in V is somewhat greater than the corresponding
stage in Nb (ref. 59), and this suggests that the effect might involve
the migration of both 0 and C. However, the solubility of C in equilib-
rium solid solution in V is thought to be quite low, and the absence of
59 J. T. Stanley, J. M. Williams, and W. E. Brundage, Radiation
Metallurgy Section Solid State Division Progress Report for Period Ending July 1967, 0RNL-4195, pp. 26-34.
225
any major resistivity decrease upon annealing in the unirradiated V
(Fig. 9.27) shows that almost all the C is in equilibrium before irra-
diation. Furthermore, the 182°C internal-friction peak (Fig. 9.25) is
stable and fairly narrow, suggesting a single relaxation due to 0 alone.
PART IV.
TECHNIQUES OF FABRICATION AND TESTING
73931 229
10. {"'TUNGSTEN METALLURGY!
W. 0. Harms
("The object of this program is to develop economical methods for
producing high-quality tungsten and tungsten-alloy tubing.with good
creep-rupture properties at high temperatures, good microstructural
stability, good ductility at low temperatures, and good weldability.
We fabricate tubing both by modification of conventional techniques
based on extrusion, tube reduction, and warm drawing and by direct
chemical vapor deposition (CVD) through the hydrogen reduction of heavy-
metal halides.J Our program includes complete physical and metallurgical
evaluation of both fabrication processes. «^ « gj.,)--«•
Primary and Secondary Working of Tungsten Alloys
W. R. Martin
Extrusion of Tungsten (R. E. McDonald)
Four duplex billets have been fabricated from a primary tungsten
tube shell and molybdenum bar stock. . Using these billets, we are
studying the effects of prior work and extrusion preheat temperature on
the structure of the final extruded tube. Because of temperature
variations during extrusion, a primary tungsten tube shell extruded
above 1700°C usually has three different microstructures: the nose of
the tube shell is fully recrystallized, the tail is a wrought structure,
and the center is a mixture of the two.
We machined a ring sample from each of four primary tungsten tube-
shell sleeves before assembling the duplex billets. The ring has been
sectioned: one section will be heat treated to duplicate the time and
temperature treatment of the extruded duplex billet, and the other
section will represent the condition of the primary extrusion billet.
The billets will be extruded at a constant extrusion ratio of 3 between
1200 and 1700°C.
230
Installation of New Tube Reducer (R.. E. McDonald)
The Materials Processing group has received the new tube reducer.
It is being installed and is expected to be operational by mid-November.
The Aetna-Standard Company, Pittsburgh, designed and built the machine
to our specifications. Figure 10.1 is an overall view from the exit
table towards the feed end of the tube reducer. The roll carriage is
powered by a 400-rpm 150-hp direct-current motor that will allow the stroke
speed to be varied from 10 to 30 strokes/min. The feed can be adjusted
from 0 to 1/2 in. per stroke, and the tube can be rotated from 0 to 180°
per stroke. This flexibility will allow us to reduce a variety of ^~ ^
materials on a single machine and study the effects'of feed, speed, and
rotation on the finished tube. The designed parting force is 4-50,000 lb,
and the 4-hi design will allow us to reduce a tube shell 2 in. in outside
diameter and 1/4 in. in wall thickness in a single operation to a tube
1 in. in outside diameter and 0.100 in. in wall thickness.
Chemical Vapor Deposition of Tungsten and Vanadium Alloys
¥. R. Martin
Deposition of Tungsten-Rhenium Alloys (J. I. Federer)
»The object of current tungsten-rhenium codeposition experiments is
to prepare sheet stock nominally containing 5$ Re,' The alloy is being
deposited on resistance-heated sheet substrates^] After deposition, the ___,
deposit is sectioned, and the substrate (Mo-0.5$ Ti) is dissolved in
acid, leaving the deposit unattacked. Electrical connections are made
to the substrate by means of water-cooled copper electrodes that impose
a temperature gradient along the length of the substrate, the highest
temperature being in the center. As a result, previous deposits have
usually had a higher rhenium content on the ends, while the thickest
deposit was always in the center. We minimized this temperature gradient
by reducing the width of the substrate at both ends, resulting in
increased heat generation and decreased heat flow into the electrodes.
The most satisfactory substrate, which was obtained by trial and error,
PVS4-
r
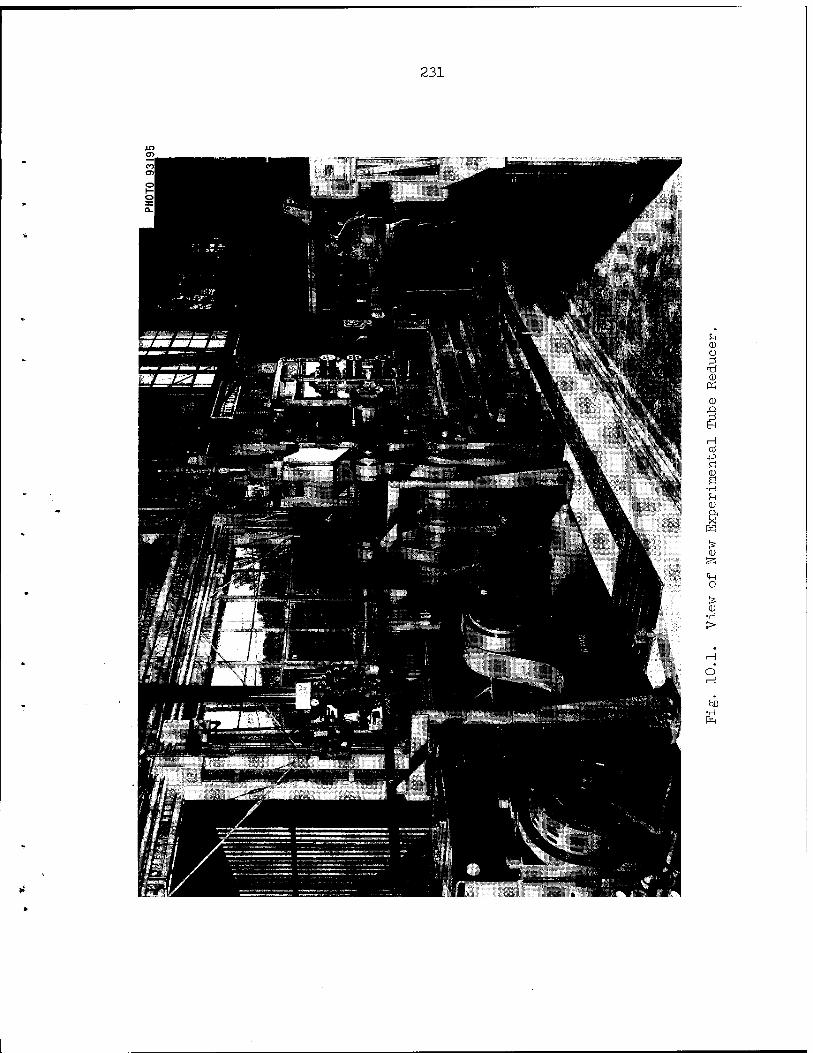
231
u 0) ü
<D K 0)
CO -P Ö
s •H u cu R4 X
CD
o is cu
o H
bO •H
232
measures 3.25 X 0.025 X 14 in. with 1.5-in.-long end sections that
are 2 in. wide. This provides about 100 in.2 of deposit. With the
substrate mounted in a Pyrex glass chamber rather than the usual metal
chamber, we measured the temperature distribution along the length of
the substrate with an optical pyrometer. In a typical case, the tem-
perature was 750 ± 5°C over about 12 in. of the 14-in.-long section
but was hotter on the ends. Hydrogen flow rates up to 3000 cm3/min at
10 torr did not impose a temperature gradient along the substrate.
Several attempts to deposit W-5$ Re sheet stock ended prematurely
due to equipment failure before a successful deposit was obtained. The
alloy was successfully deposited at 750°C, 10 torr, and a H2/(WF6+ReF6)
ratio of 12. The direction of gas flow was reversed every 30 min during
the 16 hr deposition in an effort to improve thickness uniformity. The
average thickness on both sides of the substrate and the rhenium content
along the length of the deposit were as follows:
Location, in. 0 3 6 9 12 14
Rhenium, $ 5.1 3.8 4.0 4.1 3.8 5.9
Thickness, in. 0.049 0.041 0.034 0.033 0.040 0.062
Although the substrate was hotter on the ends, the rhenium content
was unexpectedly high in those positions. The rhenium content was more
uniform over the bulk of the deposit. We attribute the greater thickness
on the ends partly to the higher temperature but mostly to gas depletion.
This phenomenon might be overcome by using higher flow rates, but that
would lower efficiency. In this experiment, 89$ of the metal content of
the metered fluorides was recovered in the deposit.
The deposit was cut into pieces about 3x3 in., and the substrate
was dissolved in an acid solution that was 45$ HNO3, 45$ H2O, and
10$ H2SO4.. The deposit from one side of the substrate was stress-relieved
for 2 hr at 1100°C and 1 X 10"6 torr. Specimens for bend tests are being
prepared from both the as-deposited and stress-relieved portions of the
substrate.
233
Deposition of Vanadium Alloys (W. C. Robinson, Jr.)
We have begun an investigation of the feasibility of depositing
vanadium metal. Vanadium is considered a candidate for cladding
advanced fast reactor fuels.
Efforts to deposit V from the pentafluoride (VF5) resulted
in the formation of a stable intermediate, VF3, which precipitated as a
green solid in the reaction zone. Thermodynamic considerations indicated
a borderline chance that the metal might be produced by hydrogen reaction
with the vanadium chlorides. The reaction becomes more feasible at
elevated temperatures, with the free energy of reaction of H2 with
UCI3 being zero at about 1350°C and negative beyond that. This is not
usually a desirable indication, since most reactions in CVD have a —20
or —30 kcal AF° at the deposition temperature. In spite of this, we
considered it worthwhile at least to attempt deposition under these
conditions.
Two types of chloride were obtained: VCI4 and VC13. The tetra-
chloride is a fuming, dark-brown liquid that is stored under Cl2
and reacts violently with air or water. The difficulty of transferring
this material into a container adaptable to one of our deposition rigs
discouraged us from viewing it as a primary source of vanadium metal.
Furthermore, it evidently decomposes spontaneously to VCI3 when the
chlorine atmosphere is reduced above it, and this solid VCI3 clogs the
transfer line. As a result, in a deposition attempt at 950°C only about
2 g of material was transferred, leaving a very thin, unidentifiable
film on the stainless steel mandrel. Therefore the VCI3, a purple solid,
was loaded into one of our containers and transferred by argon entrain-
ment. Twelve grams of material was moved into the 950°C reaction zone
along with H2, and a somewhat thicker deposit was made on the
stainless steel mandrel. This deposit was identified as principally VCI2,
which is evidently a stable intermediate for which no thermodynamic data
are available. Higher temperatures are obviously required, but 950°C
was the limit of the resistance-heated surface being used. Therefore,
we are now installing a high-temperature induction-heated deposition rig
that will allow us to deposit V at higher temperatures.

234
Metallurgical Properties of Tungsten Alloys •
A. C. Schaffhauser
iRecrystallization of Wrought CVD TungstenJ
We are continuing our studies to determine the recrystallization
behavior of wrought CVD tungsten. Previously we showed that recrys-
tallization of material containing 25 ppm F is retarded by small gas
bubbles and/or unprecipitated fluorine impurities.1 (if the material
is preannealed before rolling to precipitate impurities in the form of
large gas bubbles, recrystallization occurs at much lower temperatures.'
This behavior is observed in the hardness data shown in Fig. 10.2. The
material with no preanneal shows a gradual softening at 1800°C due to
slow recrystallization and precipitation of fluorine impurities. The
material that was preannealed at 2500°C before rolling exhibits a very
rapid drop in hardness in the first few hours of annealing at 1200°C due
to rapid recrystallization.^J >.f«'35
We determined the kinetics of recrystallization from measurements
by a point-counting analysis of the volume fraction of recrystallized
material. The point-counting array, defined by line intersections on
a square grid, was superimposed on a minimum of nine photomicrographs
from each sample, and the volume fraction of recrystallized material
was taken as equal to the fraction of points falling within the recrys-
tallized regions. Hilliard2 has shown that the maximum reliability and
efficiency of this technique is achieved when the average number of
points falling in any one recrystallized region does not greatly exceed
unity. This condition was difficult to meet in samples that had a large
fraction of recrystallized area because of the heterogeneous nature of
recrystallization in this material (Fig. 10.3). Therefore, data from
1A. C. Schaffhauser and K. Farrell, Fuels and Materials Development Program Quart. Progr. Rept. June 30, 1968. ORNL-4330, pp. 286-294.
2J. E. Hilliard, "Applications of Quantitative Metallography in Recrystallization Studies," p. 267 in Recrystallization, Grain Growth, and Textures. American Society for Metals, Metals Park, Ohio, 1966.

235
r 420
400
o 380
O K 360
340
320
ORNL-DWG 68-12617
»
\
\ < \. S~ ISOCC (No Preanneal)
*-^ ■ i-
-i
1200°C (250O°C Preanneal) L , /
20 40 60 80 100 ANNEALING TIME (hr)
Fig. 10.2. Effect of Annealing Time on the Hardness of Wrought I „ (z?-s/, CVD Tungsten.
Y-85328 n-
Fig. 10.3. Wrought CVD Tungsten Annealed 1 hr at 1200°C (Pre- annealed 1 hr at 2500°C Before Rolling).

236
two different point arrays were compared, and the data shown in Fig. 10.4
indicate that with less than 50$ recrystallized area the 80-point grid
gives more consistent results.
■~*• iFigure 10.4 shows that the fraction of recrystallized material
increases logarithmically with increasing annealing time. The rate
constant at 1800°C for the material not preannealed before rolling is
8.8 log hr-1 compared to 49 log hr-1 at 1200°C for the preannealed
material. The large difference in the recrystallization rates-of
material that was preannealed and material that was not preannealed
clearly shows that the large bubbles (> 1000 A) produced by preannealing
are not effective in retarding recrystallization in this material. This
observation could account for the conflicting results on the effect of
gas bubbles on recrystallization in irradiated materials.3
3B. Russell, J. Australian Inst. Metals 11, 18 (1966).]
ORNL-DWG 68-12618
400
Q UJ N
CO >- CE O UJ (E
LÜ Ü a:
80
60
40
20
( f /
•—\ >00 'C (2 5C 0°C ; Preannea 1) 3*~ 4
/
) /
J t f i -\ 800°C(N 3 Pre jnne al)
1 f
1 1 X A-80 POINT GRID
/ I k^-^*
( J • O-20 POINT GRID
0.5 10 2.0 5.0 10 20 50 400
ANNEALING TIME (hr)
200 500 1000
Fig. 10.4. Rate of Recrystallization of Wrought CVD Tungsten. J ' i° 2 3 -}

237 pi fit)*) ino r,, W(/rW Wot W'-jH'V '""■ I
The Properties of CVD Tungsten Deposited from WC]_6J /,/
¥e have observed great differences in the grain structure and effects
of annealing in CVD tungsten deposited from WF6 (fluoride tungsten) and
material deposited from WC1 (chloride tungsten).4'5 A significant
increase in the efficiency of thermionic emitters made from chloride
tungsten rather than fluoride tungsten has also been shown.5 Thus, the
determination of the metallurgical properties of chloride tungsten is of
great importance for thermionic applications. This study was initiated
to determine the properties of chloride tungsten, as we have done for
fluoride tungsten, and to elucidate the mechanisms responsible for the
differences in behavior.
The preliminary results given in this report were obtained from a
small quantity of material produced by San Fernando Laboratories and
given to us by Dr. Ling Yang of Gulf General Atomic. Future studies
will be conducted on materials from a variety of sources.
Previously, we showed that two very important properties for high-
temperature applications, the grain stability and bubble formation, are
directly related to fluorine impurities in fluoride tungsten. An example
of this behavior is shown in Fig. 10.5 in material containing 6 ppm F.
Very few bubbles are observed by electron microscopy on the grain
boundaries of this material after annealing at 1800°C, and some grain
growth has occurred. At higher annealing temperatures extensive grain
growth takes place, and bubbles with an average diameter of 1.7 |i cover
about 18$ of the grain boundary area at 2500°C. No grain growth is
4A. C. Schaffhauser and R. L. Heestand, "Effect of Fluorine Impurities on the Grain Stability of Thermochemically Deposited Tungsten," p. 222 in 1966 IEEE Conference Record of the Thermionic Conversion Specialist Conference, Institute of Electrical and Electronic Engineers, New York, 1966.
5L. Yang and R. G. Hudson, "Evaluation of Chemically Vapor Deposited Tungsten as Electron Emitters for Nuclear Thermionic Application," p. 329 in Proceedings of the Conference on Chemical Vapor Deposition of Refractory Metals, Alloys, and Compounds, Gatlinburg, Tennessee, September 12—1-4, 1967, ed. by A. C. Schaffhauser, American Nuclear Society, Hinsdale, Illinois.
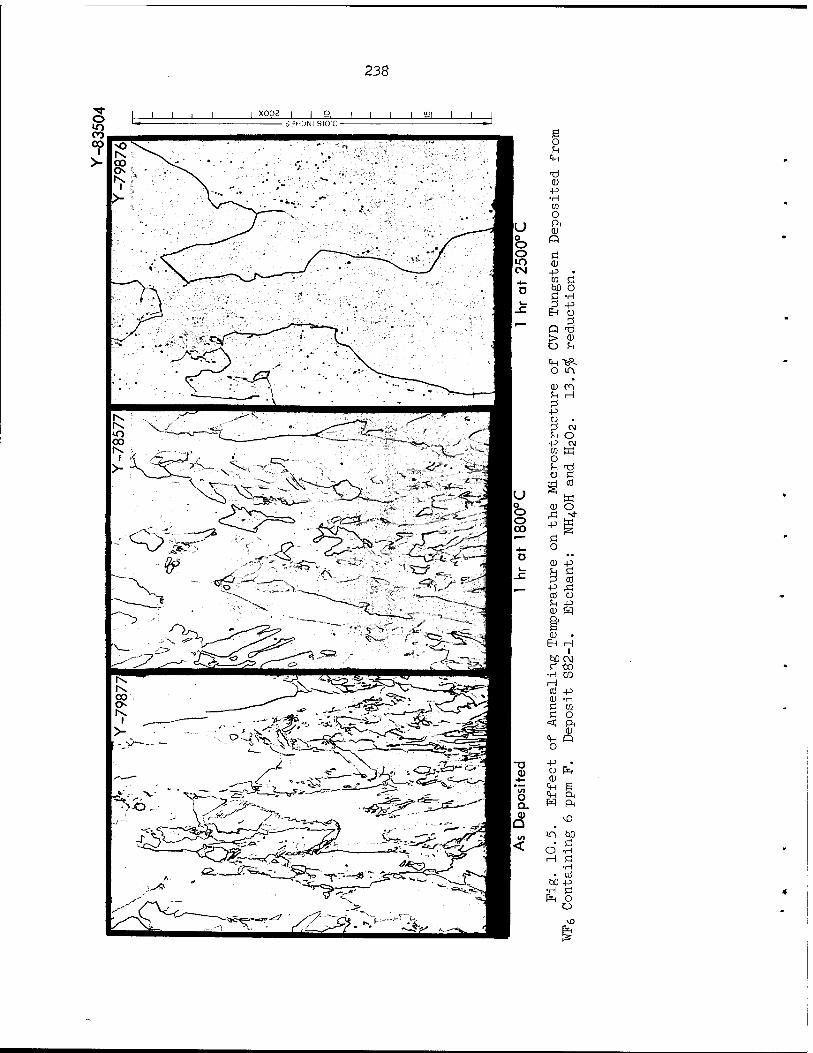
238
s o !H
CH
TJ CD -P •H
CO O
u CD 0 P o o ö in <u CN -p •
co G o bO O
C -H 1-
P -Ö •— > CD O h
<p-e£- O m
CD en U H 2 -p o • 2 CM fH O •p c\! 00 M O U t) ü Ö
u g CO
<J. CD o o Ä ■* o 00
43 § ^>- Ö ^_ o n ••
CD -p 1_
p*S _ +2 Ä cd o
<D i*J & S (D •
EH H
M CM c to
■H ra H
CO pi CD -H C CO s o «! P<
(D CH R o
-o 0)
p> •
CD •— CH e o Q.
JH ft H ft
r^ vD
iA bO <!* • Ö
O -H H Ö
•H • cd
bo P> •H Ö P"4 O
o
239
observed at 2500°C in fluoride tungsten containing 30 ppm F, in which
bubbles with an average diameter of 2.3 |j. cover about 38$ of the
boundary area.6
High-purity chloride tungsten, obtained by chlorinating fluoride
tungsten scrap, also contains residual fluorine impurities. Upon
annealing, however, much greater grain growth occurs in the chloride
material, apparently independent of the fluorine content, and little or
no bubble formation is observed by electron microscopy. The extensive
grain growth in the chloride material we have tested, which contains
7 ppm F, is shown in Fig. 10.6. The reasons for this anomalous behavior
are not known, but they may result from a difference in the nature of
the fluorine impurities in the chloride material due to the difference
in deposition conditions. Chloride tungsten is usually deposited between
900 and 1100°C, whereas fluoride tungsten is normally deposited between
500 and 700°C. The reaction product of the fluoride deposit is HF and
that of chloride deposits is HC1. The trace impurities in the deposi-
tion system are very likely different, too.
The increased performance of thermionic emitters made from chloride-
tungsten is due to the higher bare-work function of the (110) preferred
orientation that, as shown in Table 10.1, can be obtained under special
deposition conditions in this material.5 Fluoride tungsten normally has a
(100) preferred orientation that approaches a more random structure for
those deposition conditions that produce a lower fluorine content, as
is also shown in Table 10.1. We expect that a detailed study of the
effects of deposition temperature and composition of the gaseous phase
at the deposition surface on the surface energy and growth morphology
of deposits will be necessary to understand the differences in orienta-
tion of these materials.
6K. Farrell, J. T. Houston, and A. C. Schaffhauser, "The Growth of Grain Boundary Gas Bubbles in Chemically Vapor Deposited Tungsten," p. 363 in Proceedings of the Conference on Chemical Vapor Deposition of Refractory Metals, Alloys, and Compounds, Gatlinburg, Tennessee, September 12-14, 1967, ed. by A. C. Schaffhauser, American Nuclear Society, Hinsdale, Illinois.

240
o u CH
-Ö 0) -P •H TO o ft 0) o Ö (D • -P Ö
CQ O bO-H
£^ > ^ °^ <H n O H
0) U Pi
-P o pi
P> CO O
ü K
CM
O CM
W
■r! ö cö
O
0)
-p
Ö o <D U pi -P H CO fn (U • ftH
0) O
Ö CO •H H
CO (D Ö C
<S
-P •H W O ft 0 o
O
P Pq o 0) s
tH ft <W ft W
L>
a bn vO ö O Ö H vH
CO • -P
bO ö •H O (x< O
\D H O

241
Table 10.1. Preferred Orientation of CVD Tungsten Deposits
Sample Feed Gas
Fluorine Content (ppm)
Relat ive Diffractior L Intensity, IH/Ir Number (110) (200) (211) (310) (222) -(321)
SFL-GA1 WC16 7 84 1 0 0 0 2
S90-I WF6 30-31 0 73 0 0 0 0
S90-0 WF6 17-20 0 90 0 0 0 0
S82-0 WF6 4-5 0.5 15 0.5 1 0 0.5
S83-0 WF6 < 1 2 6 1 2 0 1

73932 242
11. NONDESTRUCTIVE TEST DEVELOPMENT
/ m R. W. McClung
/ The purpose of this program is to improve the present methods,
techniques, and apparatus for nondestructive evaluation of nuclear
reactor materials and components or to develop new ones. Mechanical
and electronic devices for nondestructive testing, precise calibration
procedures, and reference standards are being developed./'
r~ A)) J Electromagnetic Inspection Methods (Eddy Currents)
C. V. Dodd, J. W. Luquire,, W. E. Deeds, and ¥. G. SpoeriJ
We continued research and development on both analytical and
empirical bases.
Analytical Studies ~\\
In our analytical research we are continuing to derive integral
equations for problems of interest and are using our computer programs
to generate numerical solutions directly applicable to actual eddy-
current tests. A paper1 with the following abstract was presented at
the 8th Symposium on Physics and Nondestructive Testing:
We have obtained integral representations for the - vector potential produced by a circular coil for a number of different geometrical configurations. From the vector potential we can calculate any observable electromagnetic induction phenomena. Our present solutions are limited to cases with axial symmetry and linear media. The solutions are in the form of multiple integrals of ordinary and modified Bessel functions.
XC. V. Dodd, W. E. Deeds and J. W. Luquire, "integral Solutions to Some Eddy Current Problems," paper presented at the 8th Symposium on \ Physics and Nondestructive Testing, Schiller Park, Illinois, < September 24—26, 1968. To be published in proceedings of the meeting. *

243
The configurations which we have already so] include coils with rectangular cross section&_-in the following locations; above or on each side of a two- conductor sheet bounded by parallel planes, between two parallel plane conductors, encircling a tube or a rod consisting of one metal clad on another, and inside a tube. The electromagnetic phenomena which we have calculated include the coil impedance, the phase and amplitude of the voltage induced in pickup coils, the effects of small spheroidal defects on the impedance and phase, and the forces generated in a metal by the eddy currents. The agreement between calculated and measured phenomena is excellent in most cases and within experimental error in all cases.
We have calculated and measured the voltage induced in a pickup
coil by an electromagnetic wave transmitted through a conducting plate.
Figure 11.1 shows variations in the calculated and measured values of
the magnitude of the voltage as the plate thickness is increased. The
agreement is good within the limits of experimental error.
We have modified existing OKNL computer programs to plot contours
of the defect sensitivity factor2 for various configurations of eddy-
current coil and conductor. These plots are made on the cathode ray
tube plotter. Figure 11.2 shows how-the sensitivity to defects varies
with position in a conductor for a coil above a conducting plate.
Probe Development | \
We have constructed/several high-temperature reflection coils for
use with the phase-sensitive eddy-current instrument. These probes
[were constructed to measure.the level of liquid sodium in a stainless
steel tube.J The coils were wound from Teflon-coated wire, the probe
was potted with high-temperature epoxy, and all joints were made with
high-temperature solder. [When a constant driving current is used on
the portable phase-sensitive eddy-current instrument, the probe will
operate from room temperature to 175°C with only minor thermal drift.
2C. V. Dodd, Fuels and Materials Development Program Quart. Progr. Rept., June 30, 1968, ORN1-4330, pp. 302-305.

24<4
ORNL-DWG 68-9862 (X10"°)
0.5 THICKNESS^
Fig. 11.1. Calculated and Measured Value of Induced Voltage in the Through-Transmission Mode as Plate Thickness Varies.
ORNL-DWG 6B-73I7
tu» ANGULAR FREQUENCY
ji- PERMEABILITY O-H CONDUCTIVITY T = MEAN COIL RADIUS w/i<r7Z = 77.05
MAGNITUDE CONTOURS PHASE CONTOURS
Fig. 11.2. Contours of the Defect Sensitivity Factor in a Conducting Plate.

245
<W Ultrasonic Inspection Methods 1
| &—■—! / —-J
K. V. Cook and H. L. Whaley
Optical Visualization of Ultrasound
lAläi wfSt We made/a brief series of observations .with the recently constructed
mirror schlieren system/(diagrammed schematically in Fig. 11.3))to
evaluate its sensitivity, stability, and ease of operational We observed
(l) interaction of pulses and continuous beams of ultrasound with metal
specimens of various shapes; (2) ultrasound transmitted through the wall
and into the bore of both plexiglas and metal tubing; and (3) ultrasound
inside a compression-molded polystyrene block. [These observations con-
firmed expected improvements in sensitivity, stability, resolution of
detail, and ease of operation. \ Because of the greater sensitivity, the
slight outward bowing of the glass walls of the water tank when filled
(which was acceptable with the lens system) cannot be tolerated with the
mirror system. A new, improved tank with 3/8-in.-thick sides of Pyrex
plate glass is being fabricated to eliminate this problem.
We formulated long-range plans for applying the schlieren system to
the ultrasonic inspection of welds, a nondestructive testing problem for
which it has unique potential. A schlieren study of this problem will
ORNL-DWG 68-10675
OPTICAL BENCH LENS •S'l MK
COLLIMATED LIGHT FIELD
AREA IN WHICH ULTRASOUND DIFFRACTS LIGHT BEAM
SUSZ - NARROW HORIZONTAL SLITS •PLANE FIRST SURFACE MIRRORS -6-in.-diam PARABOLIC MIRRORS
Fig. 11.3. Diagram of the Parabolic-Mirror Schlieren System for Viewing Ultrasonic Energy.

246
increase our knowledge of conventional testing techniques and possibly
contribute to the development of new ones.
\ Frequency Analysis
\ The frequency-analysis system has been applied to investigate the
spatial amplitude and frequency dependence of the energy patterns
radiated from various types of ultrasonic transducers. The transducer
was moved with respect to a small, fixed, spherical reflector so as to
receive a reflection from the desired spot in its radiation pattern.]
This was equivalent to moving a point sensor from location to location
in the beam pattern. When possible, small air bubbles generated on the
end of hypodermic tubing were used as reflectors since they provided
extremely sharp pulses for analysis. Three main types of analysis were
made: (l) analysis of the spectrum at points along a line intersecting
and perpendicular to the transducer axis (i.e., plots of frequency versus
amplitude at discrete points); (2) scans in the same direction as in (l)
but at single, fixed frequencies that produce plots of amplitude versus
distance from the axis; and (3) scans along the transducer axis at single,
fixed frequencies to produce curves of amplitude versus distance from
the transducer. In analyses (2) and (3), the fixed frequency was chosen
by inspection of the total frequency spectrum of a pulse reflected from
a large, flat block. We examined the beam structures of focused and
collimated as well as of flat transducers. Where a comparison could be
made, the experimental results agreed quite well with the Fresnel-zone
theory. Knowledge of the beam structure as a function of both frequency
and intensity can tell us such things as optimum water column (transducer
to specimen distance), the location of the focal point of a focused
transducer, the effective size of the transducer element, the degree of
symmetry of the radiation pattern, and the effective width of the
ultrasound beam at any distance from the transducer. Furthermore, beam
analysis can serve as a "fingerprint" of a transducer, providing a
dynamic, quantitative description by which any changes can be immediately
detected.

247
We have also used the system to study frequency effects caused by
some of the important variables in ultrasonic tests. One of these is
orientation of the transducer axis with respect to a reflecting surface.
Figure 11.4 shows the drastic loss of higher frequencies resulting from
a slight transducer misalignment. (The curves have been normalized).
Figure 11.5 shows the effect of length of water column on the frequency
spectrum of a pulse reflected from the surface of a large, flat plate
(again, all curves have been normalized). Another variable, the effects
of which we can now see and measure directly, is "tuning" or impedance
matching between the transducer and the output of the ultrasonic pulser.
For example, if we wish to use 5 Mhz as the test frequency, we can
observe the frequency spectrum of the transducer and tune the impedance-
matching network until we get the maximum response at 5 Mhz. We have
also observed changes in the frequency spectrum of a pulse reflected
in turn from various sizes of artificial discontinuities in a metal
plate (flat-bottomed drilled holes), but background noise must be reduced
to obtain better reproducibility.
UJ _i < ü
3 U-
ü_ o z o )- a: o Q. o or CL
ÜJ Q =>
_i Q.
<
ORNL Dwg 68-10456
1.0
0.9
0.8
0.7
0.6
0.5
0.4
0.3
0.2
0.1
0
/\ TRANSDUCER NORMAL TO REFLECTING SURFACE
/ \ TRANSDUCER 1° OFF NORMAL TO REFLECTING SURFACE
NOMINAL \ TRANSDUCER \ FREQUENCY-5Mhz\
^ar^T—
Fig. 11.4 Ultrasonic Beam 1
0 I 2 3 4 5 6 7 8 S
FREQUENCY (Mhz)
Frequency Spectra Changes Due to Misalignment of from Normal.

248
ORNL Dwg 68-10454
1.0
UJ 0.9
< Ü CO 0.8 _l _J 3 0.7 li_ o
0.6 ^ o 1- tr 0.5 o OL o Q. 0.4
IM Q 0.3 ID H _l
0.2 ^ <
0.1
0
T T
2.0 WATER COLUMN
= 4.0 WATER COLUMN
6.0 WATER COLUMN
= 10,0" WATER COLUMN
ALL CURVES ARE CONTINUOUS
0
FREQUENCY (Mhz)
Fig. 11.5. Frequency Spectra Changes Due to Increasing Water Column Between Ultrasonic Transducer and Specimen.

73933 249
12. JOINING RESEARCH ON NUCLEAR MATERIALS
G. M. Slaughter
The purpose of this program is to gather fundamental and applied
data needed for a better understanding of the weldability of materials
that are either being considered or currently used for nuclear appli-
cations. The fundamental aspects of the program are concerned with the
effects of minor variations in amount and type of alloying elements and
impurities on the behavior of weldments. Specific alloys of interest
include the austenitic stainless steels and the nickel-rich alloys
such as IncoloySOO and Inconel 600.1 Our applied studies emphasize the
application of stainless steels in the Fast Flux Test Facility (FFTF).
These pro.ject-oriented investigations will help define the influence of
welding process, parameters, and postweld treatments on the microstructure
and mechanical properties of irradiated and unirradiated weldments. A
modest program concerned with the influence of weld defects will provide
base-line results in this much-talked-about but little-investigated *
field.
We hope this broad-based program will develop the modifications in
both chemical analysis and procedures necessary to produce the high-
quality weldments needed for the various programs of the Commission.
These data will be immediately and directly applicable to such com-
ponents as the Fast Test Reactor vessel by providing the capability to
predict the effects of chemical composition and welding procedure on
overall welding behavior.
The Effect of Minor Variations in Chemical Composition on Weldability
In our continuing investigation of the effect of small variations
in the minor elements usually present in structural materials, we have
emphasized Al, Ti, S, and P in Incoloy 800, and S in Inconel 600. This
work has been reported previously and is continuing.

250
Subcontract work at Rensselaer Polytechnic Institute has investi-
gated the effects of minor elements on the hot cracking of Inconel 600.
At ORNL, we have begun work on the effect of minor variations of chemi-
cal composition on the weldability of austenitic stainless steels.
The Effect of Minor Elements on the Hnt-Cracking Tendencies of
Inconel 600 |(G. M. Goodwin, W. F. Savage1)
/This investigation was undertaken to determine the effect of six
minor elements (S, P, Si, Mn, Ti, and Al) on the hot-cracking propensity
of Inconel, a solid-solution-strengthened nickel-base allov_J
In order to determine the effects of these six elements, we developed
a new test for evaluating weldability, the "TIGAMAJIG" test. An out-
growth of the VÄRESTRAINT test, the TIGAMAJIG test combines the advan-
tages of its predecessor with reduced specimen size and ease of specimen
preparation. A technique was developed that allows preparing a large
number of specimens of systematically varied composition by incorporating
compacted and sintered powder inserts that contain the desired "impurity"
additions.
We performed a full factorial experiment, using all of the 64-
possible combinations of the six elements. The entire testing program
was replicated at two levels of augmented strain, thereby providing an
accurate estimate of error.
Using the method of Yates2 and the analysis of variance, we deter-
mined the significant effects of the six minor elements for three
cracking parameters: the total, maximum, and average crack length.
[We also found that some of the minor elements had significant
effects on the cross-sectional area and depth of penetration into the
weld pads into which the powder inserts had been incorporated. We
postulated that this resulted from the effect of these elements on the
XW. F. Savage, Dept. of Materials Engineering, Rensselaer Polytechnic Institute, Troy, New York; G. M. Goodwin, formerly of Rensselaer, now a member of the staff of OREL.
2F. Yates, Design and Analysis of Factorial Experiments, Imperial Bureau of Soil Science, London, 1937.

251
/potential drop, E , at the anode.) In general, it appeared that those __js
elements that have a low value of the work function, ♦, on a high ratio
of secondary electron emission, 0, could increase E due to a change in
the size of the negative space charge near the anode. The subsequent
increase in kinetic energy of the incident electrons would then result
in increased penetration and a greater cross-sectional area.
Cross sections of each of the weld pads are shown in Fig. 12.1.
The welds were prepared under identical welding conditions (current,
voltage, travel speed, etc.), and as may he seen from the figure, wide
variations in depth of penetration and cross-sectional area result. Note
that none of the intentional "impurity" additions exceeded the commercial
specifications for Inconel 600. The advantage of using a precise mathe-
matical analysis of the data, such as the method of Yates, and the
STASIS Fig. 12.1. Weld Penetration Studies in Inconel Welds. Only minor
variations in base-metal analysis produced widely varying weld-zone geometries and depths. (Rensselaer Polytechnic Institute figure).
252
analysis of variance is also obvious from Fig. 12.1: lit ass extremely
difficult to draw reasonable conclusions about the effects and inter-
action effects of the various elements merely from visual observation
of the cross sections. A statistical analysis of the data shows that
Si, Ti, and P increase the cross-sectional area and depth of penetration,
while Al decreases both these parameters. Strong interaction effects
exist between S and Si and between Ti and Al.
We found S and P to be highly detrimental to all three of the
cracking parameters. We attribute this to a high degree of segregation
and the subsequent reduction in the effective solidus and liquidus,
coupled with a decrease in the solid-liquid interfacial energy that
permits wetting of the grain and subgrain boundaries and the subsequent
formation of grain-boundary films.
We found that both Mn and Si reduced the detrimental effect of S,
due in part at least to an increase in the solid-liquid interfacial
energy. However, a significant Si-Mn interaction effect indicated that
these two elements, when present together, were not as effective in
reducing the effect of S as was either one alone.
We also found that Ti and Al reduced the hot-cracking propensity
of Inconel. We believe that the effect of Ti and Al and, in part, the
effect of Mn and Si was due to the excellent deoxidizing capabilities of
these four elements.
We showed that such large-scale factorial experiments could be used
■ successfully to identify the significant effects of minor elements on
the hot-cracking propensity of Inconel and therefore proposed that this
technique be applied to study other minor elements and other alloy
systemsj
} Welrlab-ni+.y nf 1 ftft C.r-tä Ni Class Stainless SteelsJ(W. J. Werner, ^__^
D. A. Canonico)
We have expanded the program on the weldability of nickel-base alloys
to include the effects of minor variations in composition on the weld-
ability of the 18$ Cr-S/o Ni class of steels. As a general rule, alloys
of this class are welded with a type 308 or 308L stainless steel filler
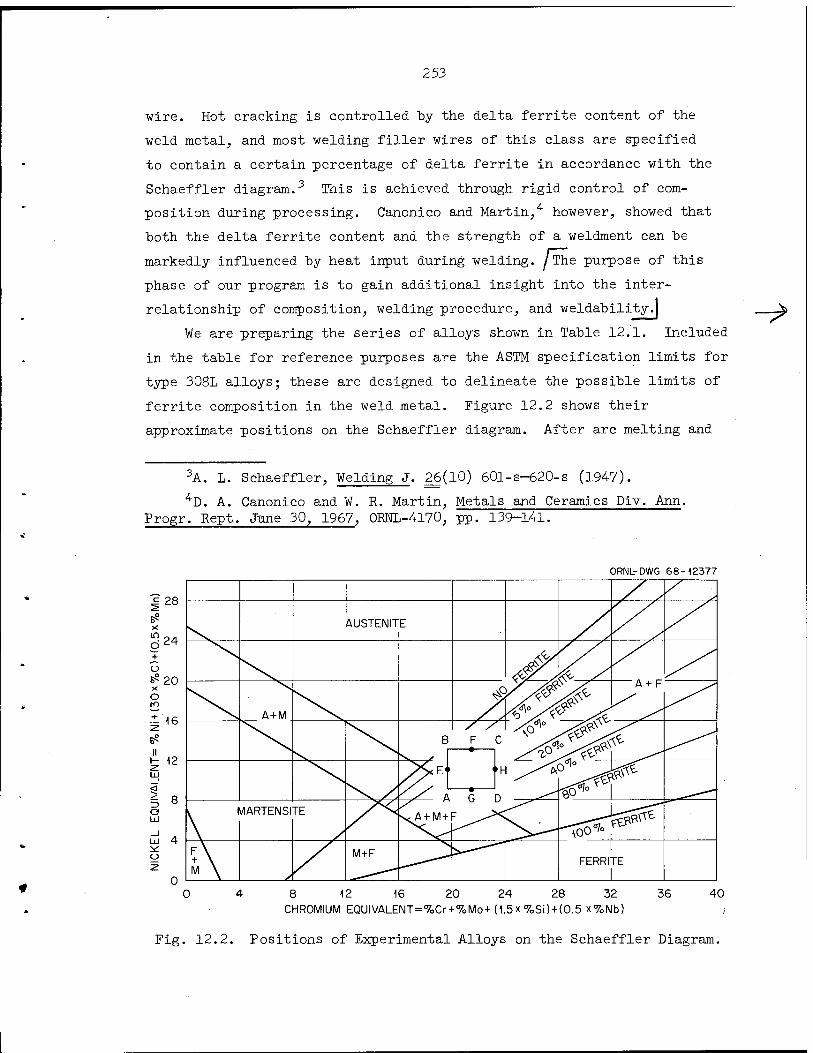
253
wire. Hot cracking is controlled by the delta ferrite content of the
weld metal, and most welding filler wires of this class are specified
to contain a certain percentage of delta ferrite in accordance with the
Schaeffler diagram.3 This is achieved through rigid control of com-
position during processing. Canonico and Martin, however, showed that
both the delta ferrite content and the strength of a weldment can be
markedly influenced by heat input during welding. / The purpose of this
phase of our program is to gain additional insight into the inter-
relationship of composition, welding procedure, and weldability.)
We are preparing the series of alloys shown in Table 12.1. Included
in the table for reference purposes are the ASTM specification limits for
type 308L alloys; these are designed to delineate the possible limits of
ferrite composition in the weld metal. Figure 12.2 shows their
approximate positions on the Schaeffler diagram. After arc melting and
-^
3A. L. Schaeffler, Welding J. 26(l0) 60l-s-620-s (19<47).
^D. A. Canonico and W. R. Martin, Metals and Ceramics Div. Ann. Frogr. Rept. June 30, 1967, ORNL-4170, pp. 139-141.
ORNL-DWG 68-12377
| 28
g ^ ~+
ü 6« 20 X O ro
i 16
H12 LLI
o ÜJ
uj 4
y
AUSTENIT E
<£ / //
A+M ß
A + F
B F c tf-
i
^1>> s>f<&r 1 ^
S/iE " »H ^s^ti
r / /\ n n
\ '
MARTENSI TE s^A + WH- r^^x
5\ M \
M+F FERRITE
1 8 12 16 20 24 28 32
CHROMIUM EQUIVALENT=%Cr+7oMo+(1.5x%Si) + (0.5 x%Nb)
36 40
Fig. 12.2. Positions of Experimental Alloys on the Schaeffler Diagram.
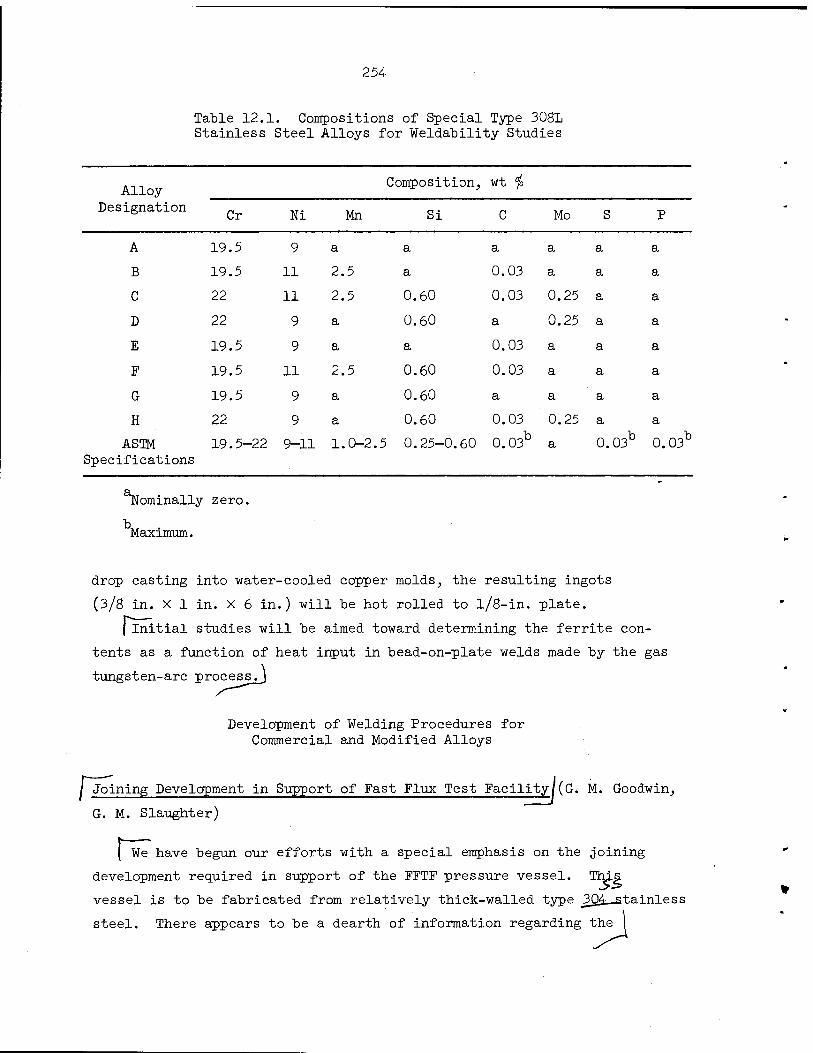
254
Table 12.1. Compositions of Special Type 308L Stainless Steel Alloys for Weldability Studies
Alloy Composition, Wt fo
Designation Cr Ni Mn Si C Mo S P
A 19.5 9 a a a a a a
B 19.5 11 2.5 a 0.03 a a a
C 22 11 2.5 0.60 0.03 0.25 a a
D 22 9 a 0.60 a 0.25 a a
E 19.5 9 a a 0.03 a a a
F 19.5 11 2.5 0.60 0.03 a a a
G 19.5 9 a 0.60 a a a a
H 22 9 a 0.60 0.03 0.25 a a
ASTM 19.5-22 9-11 1.0-2 5 0.25-0 60 0.03b a 0. 03b 0.03b
Specifications
nominally zero.
Maximum.
drop casting into water-cooled copper molds, the resulting ingots
(3/8 in. X 1 in. X 6 in.) will be hot rolled to l/8-in. plate.
I Initial studies will be aimed toward determining the ferrite con-
tents as a function of heat input in bead-on-plate welds made by the gas
tungsten-arc process.j
Development of Welding Procedures for Commercial and Modified Alloys
Joining Development in Support of Fast Flux Test Facility/(G. M. Goodwin,
G. M. Slaughter)
[ We We have begun our efforts with a special emphasis on the joining
development required in support of the FFTF pressure vessel. This
vessel is to be fabricated from relatively thick-walled type _304__atainless
steel. There appears to be a dearth of information regarding the
255
(properties of stainless steel weldments at elevated temperatures both in
the irradiated and unirradiated condition, and the optimum welding process
for joining the vessel components remains unknownJ We are supplying PNL
with machined specimens of welds for their irradiation studies of the
effects of welding process and composition of filler metal on stainless
steel weldments. We are also questioning vendors to determine industrial
experience in the welding of large stainless steel vessels and have under
way a program to fill in weldability data in those particular areas where
basic information is most needed.
The 1500-amp Linde submerged-arc welder has been put into operation,
and its range of welding parameters has been determined. The unit has
been set up to produce a 4-ft butt weld in the 1-in.-thick plate of type
304 stainless steel to be supplied by PNL. We are also installing equip-
ment to deposit butt welds by the gas-shielded arc processes. Production
will begin as soon as the process/filler wire combinations to be used are
determined. To this end, a meeting of representatives from OENL, PNL,
and KDT has been arranged for October 1 and 2.
We have discussed with Combustion Engineering, Inc., and with
Babcock and Wilcox Company the welding procedures that might typically
be used by potential fabricators of FFTF vessels.
At Combustion Engineering, we discussed in detail several specific
processes — including submerged-arc, gas-metal arc, gas-tungsten arc, and
manual-metal arc — with regard to their applicability to several com-
binations of base metal and filler wire. The bulk of their experience
in welding stainless steel has been with submerged-arc overlays on
carbon and low-alloy steels. For this and other reasons, they would
prefer to use the submerged-arc process for fabricating heavy-walled
stainless steel vessels.
Combustion Engineering noted that they have had little experience
with the 16 wt $ Cr-8 wt $ Ni-2 wt fo Mo filler wire that has been
proposed as a filler material for the FFTF vessel except in instances
when the customer specifically requested it. Personnel at their
Research and Development Laboratory were especially concerned that so
little is known about the mechanical properties of austenitic weld metal
in the creep range (480°C and above). This is particularly important

256
since some suppliers of wire begin with rod stock in which trace elements
vary widely and in which there is often poor control of residuals and
deoxidizers.
On the other hand, there has been considerable experience at Babcock
and Wilcox with the 16 wt $ Cr-8 wt # Ni-2 wt # Mo filler material. They
developed it and have used it on a variety of stainless steels. They
indicated that the creep-rupture properties of this material are superior
to those of other stainless steel weld metals. Although the submerged-
arc process would probably be their first choice for fabricating the
FFTF vessel, they noted that the electroslag welding process has been
qualified for austenitic stainless steels. Thus, they would not eliminate
it as a possibility for use.
I The Effects of Defects on Mechanical Properties of Weldments
C. D. Lunden5
| This task wasA&ise~begunjthis quarter. It is established that
discontinuities exist in weldments, and some cursory work has been done
to characterize both the discontinuities and their effects. For example,
the ASME Boiler Code, Sections 3 and 9, permits a maximum size indication
in the base metal and weld metal. Furthermore, the tools for determining
the presence of indications are such that, through their own limitations,
they permit the acceptance of discontinuities of a given size. Since a
2$ resolution is considered acceptable in radiography, one of the most
commonly used nondestructive inspection tools, a discontinuity of some-
thing less than this could be present in all welded structures examined
by radiography and yet be undetected.
j We want to determine when a discontinuity becomes a flaw. We intend
to characterize various discontinuities and establish their effects on
Consultant from the University of Tennessee Department of Chemical and Metallurgical Engineering.

257
et/^—
[the mechanical properties of the materials being joined.J From a fracture-
mechanics point of view, we know that a discontinuity size that is
acceptable in a low-alloy steel can lead to a catastrophic failure in
an ultra high-strength steel. Hence, not only must one consider the
discontinuity size per se, but he must relate this to the material and
to the service conditions to which that material will be exposed.
The initial stages of our investigation have been aimed at producing
discontinuities typical of those found in actual weldments. These must
be capable of being reproduced with a reasonable certainty and must be
detectable by nondestructive testing methods. Also, the defect orien-
tation or shape must be capable of being altered with regard to the
specimen geometry. Last, the mechanical testing method for evaluating
the effects of the discontinuities must be considered with regard to the
expected service conditions.
We successfully produced discontinuities in Inconel 600 by the
electron-beam welding process and an overlapping weld pass technique.
Sixteen overlapping full-penetration weld passes have been made with
the electron beam at right angles to the sheet surface. The resultant
fused zone is about l/4 in. long, and the discontinuities lie with their
long axis in the plane of the sheet in the fusion and heat-affected zones.
Figure 12.3, a photomicrograph of a cross section of such a weld in
Inconel 600, shows some typical discontinuities. Specimens that will
; 1
jY-89758
IP ""1 " -v
Fig. 12.3. Inconel-600 Weld with Discontinuities Having Long Axes in Plane of Sheet. Etchant: glyceria regia. 26x.

258
be machined from these welds will be ultrasonically tested to locate
accurately the discontinuities and then mechanically tested to determine
the effects of the discontinuities. The orientation of the discontinuities
with respect to the sheet surface can be altered by changing the angle of
impingement of the electron beam^ A cross section of a weld made with
the electron beam oriented at 45° to the sheet surface is shown in
Fig. 12.4; the discontinuity is oriented at an angle of 4-5° to the sheet
surface. Thus, by varying the beam angle, we can, it appears, vary the
defect orientation to suit the testing procedure.
Further studies have been undertaken with a scanning electron
microscope to characterize discontinuities by direct observation of the
surface of the discontinuity. This procedure promises to define more
clearly the type of discontinuities being produced. A scanning electron
micrograph of the surface of a hot crack (discontinuity) in nickel is
shown in Fig. 12.5. It is evident by the appearance of the cellular
dendritic structure that a liquid film existed at the time the discon-
tinuity was formed; note the rounded, featureless surface of the fractured
cellular dendrites.
ltt-.Ä-\ -■■■.■.■'■.■./ 'Si -/:••" - - ' ' .:" Y".," Y-89759 ^.: •o>:>/."--s*W"-:1
;■ •'">.<.'■•'■• ".';'-■ '' :"'•'.;.-... Vi-■"■.>':"-•■<■ ^:.-;"■>■■ -iÄtö^ J>'/■ *-■ ■'■".':■■ .V." •■'•■." , ■■■■'■■: ■ •■*. _ -. ., r :■.- -..;,.; -2y ■ ,■ ■■ ..-X —-W"*'i -^ ■.. ■ , -- r ^"!, /
l«*"i
Fig. 12.<4. Inconel-600 Weld with Discontinuities Oriented at 45c
to the Sheet Surface. Etchant: glyceria regia. 26x.

259
Y-90W5
Fig. 12.5. Scanning Electron Micrograph of the Surface of a Hot Crack in Nickel. The cellular dendritic structure indicates that a liquid film existed at the time the crack was formed. Etchant: glyceria regia. 100CK.
260
13. FUEL ELEMENT FABRICATION DEVELOPMENT
G. M. Adamson, Jr.
The purpose of this program is to devise new combinations of
materials or new fabrication techniques to advance the technology for
fabricating fuel elements for research reactors. We are attempting to
improve the performance of advanced research reactors, such as HFIR and
ATR, by developing fuel elements with lower production costs, longer
lives, increased safety or reliability, or all three. The studies
include factors affecting both fabrication and irradiation performance..
We must also develop sufficient knowledge of the processes used for fab-
ricating aluminum-based dispersion fuel elements so that we can ade-
quately assist commercial fabricators, purchasers, specification writers,
and technical inspectors. Other studies are aimed at improving the
reliability and reducing the cost of the required nondestructive inspec-
tion techniques. Because of the overlapping nature of the programs,
this section includes some work supported by the AEC Technical Assistance
Program.
Irradiation Studies of Dispersion Plates
M. M. Martin, J. H. Erwin, A. E. Rieht W. R. Martin K. V. Cook
We have finished fabricating both sample and instrumented miniature
fuel plates1 for the G-12 loop experiment in ETR cycles 99 and 100. The
effect of powder fines on the performance of burned and hi-fired U3O8
fuels will be investigated in this two-cycle experiment. The plates for
irradiation, as well as the standby plates, are described in Table 13.1.
Two levels of fuel loading are given: 0-67 and 0-68 compositions. The
lower U3O8 concentration compares to that of HFIR, while the upper
represents a 25°jo increase.
1M. M. Martin, W. J. Werner, and C. F. Leitten, Jr., Fabrication of Aluminum-Base Irradiation Test Plates, ORNL-TM-1377 (February 1966).

261
Table 13.1. Miniature Test Plates for ETR G-12 Loop Irradiations in Cycles 99 and 100
Plate Fuel Dispersoid Location in
G-12 Loop
Reference Number
Powder Blend
Core Loading Concentration of 235U Tier Slot
Designation (wt <$>) (g)
Burned U30g Test Plates
0-68-1622 PB5 49.28 2.448 3 lb
0-68-997 PB4 49.28 2.456 3 2 0-68-1605 PB5 49.28 2.451 3 3. 0-68-1607 PB6 49.28 2.462 3 4
Hi -Fired U303 Test Plates
0-67-1617 PB2 40.21 1.944 4 lb
0-67-974 PB1 40.21 1.947 4 2 0-67-982 PB2 40.21 1.957 4 3 0-67-986 PB3 40.21 1.949 4 4
Burned U30g Standby Plates
0-68-1621 PB5 49.28 2.450 3 lb
0-68-1600 PB4 49.28 2.456 3 2 0-68-1602 PB5 49.28 2.454 3 3 0-68-1608 PB6 49.28 2.463 3 4
Hi-Fired U30g Standby Plates
0-67-1616 PB2 40.21 1.947 4 lb
0-67-976 PB1 40.21 1.944 4 2 0-67-979 PB2 40.21 1.957 4 3 0-67-984 PB3 40.21 1.948 4 4
Alcoa 101 aluminum matrix.
Instrumented plate.
Characteristics of the two grades of U30g used in fabricating the
plates are tabulated in Table 13.2. The hi-fired and burned oxides are
comparable to the previously irradiated fuels that contained 3 wt $
powder fines of -325 mesh. The levels of fines in the various powder
fuel blends (PB1-PB6) are 10, 25, and 50 wt % The lower limit corre-
sponds to the present maximum permissible content for HFIR, while the
upper represents the normal yield in manufacturing the oxides.
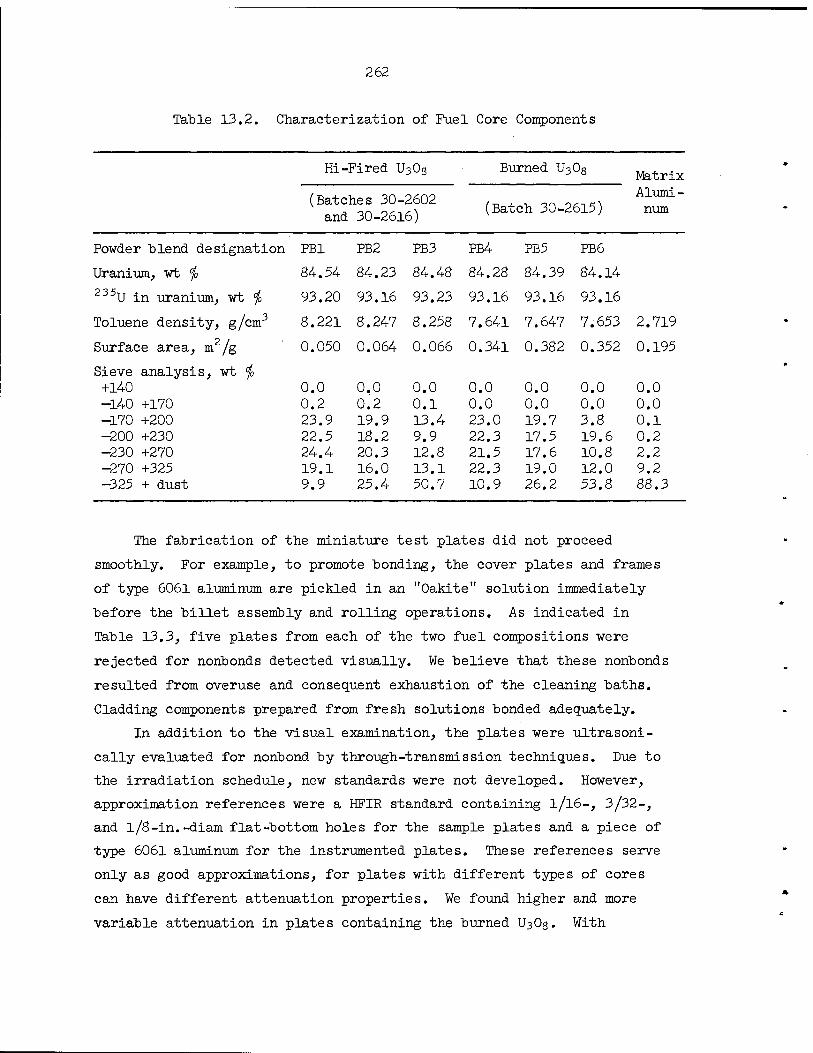
262
Table 13.2. Characterization of Fuel Core Components
Hi-Fired U308
(Batches 30-2602 and 30-2616)
Burned t^Og
(Batch 30-2615)
Matrix Alumi- num
Powder blend designation
Uranium, wt $ 235U in uranium, wt $
Toluene density, g/cm3
Surface area, m2/g
Sieve analysis, wt $ +140 -140 +170 -170 +200 -200 +230 -230 +270 -270 +325 -325 + dust
PB1 PB2 PB3 PB4 PB5 PB6
84.54 84.23 84.48 84.28 84.39 84.14
93.20 93.16 93.23 93.16 93.16 93.16
8.221 8.247 8.258 7.641 7.647 7.653 2.719
0.050 0.064 0.066 0.341 0.382 0.352 0.195
0.0 0.0 0.0 0.0 0.0 0.0 0.0 0.2 0.2 0.1 0.0 0.0 0.0 0.0 23.9 19.9 13.4 23.0 19.7 3.8 0.1 22.5 18.2 9.9 22.3 17.5 19.6 0.2 24.4 20.3 12.8 21.5 17.6 10.8 2.2 19.1 16.0 13.1 22.3 19.0 12.0 9.2 9.9 25.4 50.7 10.9 26.2 53.8 88.3
The fabrication of the miniature test plates did not proceed
smoothly. For example, to promote bonding, the cover plates and frames
of type 6061 aluminum are pickled in an "Oakite" solution immediately
before the billet assembly and rolling operations. As indicated in
Table 13.3, five plates from each of the two fuel compositions were
rejected for nonbonds detected visually. We believe that these nonbonds
resulted from overuse and consequent exhaustion of the cleaning baths.
Cladding components prepared from fresh solutions bonded adequately.
In addition to the visual examination, the plates were ultrasoni-
cally evaluated for noribond by through-transmission techniques. Due to
the irradiation schedule, new standards were not developed. However,
approximation references were a HFIR standard containing l/l6-, 3/32-,
and l/8-in.-diam flat-bottom holes for the sample plates and a piece of
type 6061 aluminum for the instrumented plates. These references serve
only as good approximations, for plates with different types of cores
can have different attenuation properties. We found higher and more
variable attenuation in plates containing the burned U3O8. With
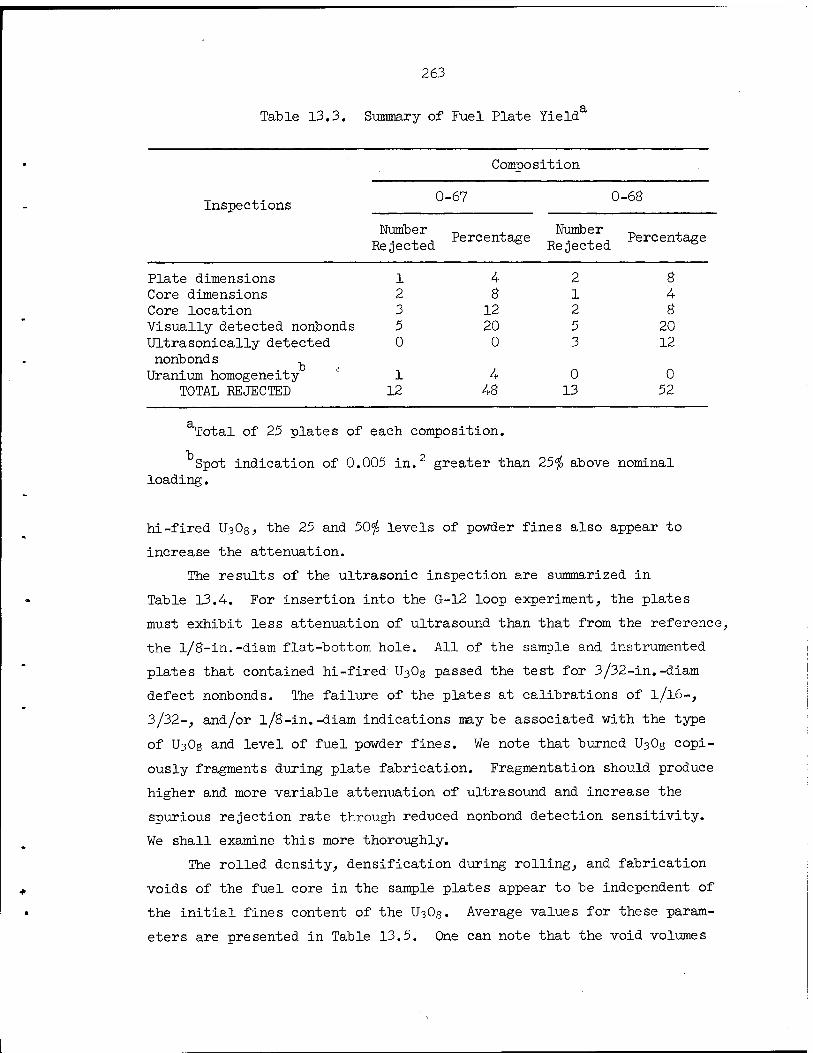
263
Table 13.3. Summary of Fuel Plate Yield' a
Inspections
Composition
0-67 0-68
Number _ , Number _. , _ . , , Percentage _. . , , Percentage Rejected e Rejected &
Plate dimensions Core dimensions Core location Visually detected nonbonds Ultrasonically detected
noribonds , Uranium homogeneity
TOTAL REJECTED
1 4 2 8 2 8 1 4 3 12 2 8 5 20 5 20 0 0 3 12
1 4 0 0 12 48 13 52
Total of 25 plates of each composition.
Spot indication of 0.005 in.2 greater than 25$ above nominal loading.
hi-fired U3O8, the 25 and 50$ levels of powder fines also appear to
increase the attenuation.
The results of the ultrasonic inspection are summarized in
Table 13.4. For insertion into the G-12 loop experiment, the plates
must exhibit less attenuation of ultrasound than that from the reference,
the l/8-in.-diam flat-bottom hole. All of the sample and instrumented
plates that contained hi-fired U3O8 passed the test for 3/32-in.-diam
defect noribonds. The failure of the plates at calibrations of I/I6-,
3/32-, and/or l/8-in.-diam indications may be associated with the type
of U3O8 and level of fuel powder fines. We note that burned U3O8 copi-
ously fragments during plate fabrication. Fragmentation should produce
higher and more variable attenuation of ultrasound and increase the
spurious rejection rate through reduced noribond detection sensitivity.
We shall examine this more thoroughly.
The rolled density, densification during rolling, and fabrication
voids of the fuel core in the sample plates appear to be independent of
the initial fines content of the U3O8. Average values for these param-
eters are presented in Table 13.5. One can note that the void volumes
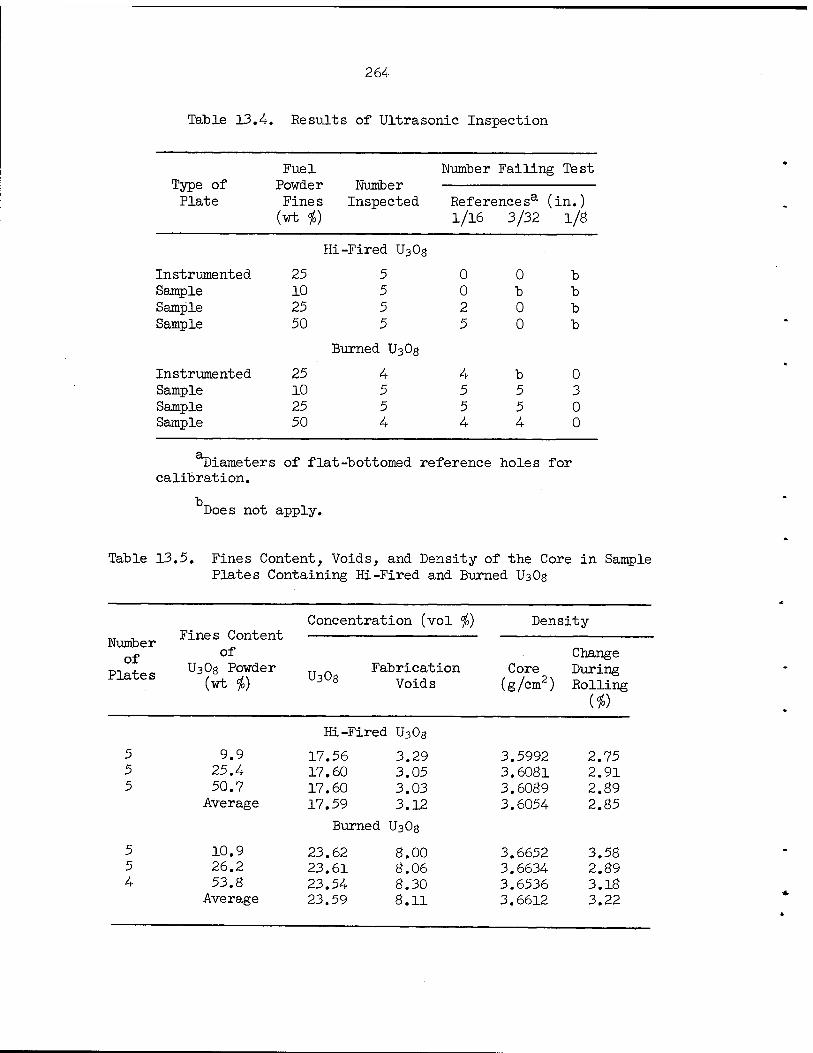
264
Table 13.4 Re suit 3 of Ultrasonic Inspection
Type of Plate
Fuel Powder Fines
(wt <f>)
Number Inspected
Number Failing Test
Referencesa ( 1/16 3/32
Ln.) 1/8
Hi -Fired-U30g
Instrximented Sample Sample Sample
25 10 25 50
5 5 5 5
0 0 2 5
0 b 0 0
b b b b
Burned t^Og
Instrumented Sample Sample Sample
25 10 25 50
4 5 5 4
4 5 5 4
b 5 5 4
0 3 0 0
jDiameters of flat-bottomed reference holes for calibration.
Does not apply.
Table 13 .5. Fines ( Plates
Content, Voids, and Density of the Core in Sample Containing Hi-Fired and Burned U30g
Fines Content of
U30g Powder (wt io)
Concentration (vol *) Density
Number of
Plates TT . Fabrication U3°8 Voids
Core (g/cm2)
Change During Rolling
(*)
Hi-Fired U30g
5 5 5
9.9 25.4 50.7
Average
17.56 3.29 17.60 3.05 17.60 3.03 17.59 3.12
Burned U3Üg
3.5992 3.6081 3.6089 3.6054
2.75 2.91 2.89 2.85
5 5 4
10.9 26.2 53.8
Average
23.62 8.00 23.61 8.06 23.54 8.30 23.59 8.11
3.6652 3.6634 3.6536 3.6612
3.58 2.89 3.18 3.22

265
of plates containing burned U^Og are considerably higher than those of
the hi-fired L^Og. We conclude, considering void volume alone, that
the plates containing burned t^Og should exhibit superior irradiation
performance.
We shipped the test and standby plates for ETR cycles 99 and 100
in early September. As in previous G-12 irradiation experiments, the
loop for these irradiations will be shared with Idaho Nuclear
Corporation. The personnel there will also supervise the running of
the loop, insertion and removal of the plates, and return of the plates
to ORNL for postirradiation examination.
The test plates irradiated in ETR cycles 93, 94, and 96 arrived at
ORNL September 27. These plates are scheduled for immediate postirradi-
ation examination.
Fabrication of Fuel Plates
W. R. Martin
Investigations of Nonuniform Deformation in Simulated Fuel Plates (J. H. Erwin, W. R. Martin)
We are studying models of why nonuniform deformation (dogboning)
occurs in fuel plates. We think the basic causes are the differences
in compressive strengths of the fuel core, frame, and cladding material,
and the force distribution along the deformation zone while the core-
frame interface is being deformed. It is this force distribution that
we now believe can explain dogboning on the leading and trailing edges
of composite fuel plates and that predicts the variations in shape noted
for the frame, coverplate, and core. We are attempting to install numer-
ous microstrain gages within simulated fuel plates to determine the
force distribution during the rolling of composite plates.
Study of the Fit of Fuel Compact to Frame Cavity (j. H. Erwin M. M. Martin) " '
Aluminum-base fuel plates for research reactors are usually pro-
duced by the roll bonding of cored and clad picture frames. Before
rolling the compacts, our practice is to vacuum degas the fuel compacts

266
to remove adsorbed gases and pressing lubricants. If inconsistent
dimensional changes occur during heat treatment, the fit between the
compact and frame cavity may be altered unless tailored parts are used.
We are investigating the effects of various dimensional misfits on
final plate quality and fabrication parameters.
In the investigation, we fabricated 68 dispersion fuel plates,
using the fuel compact dimensions for the HFIR outer annulus. No fuel
gradient was used, however. Thirty-four compacts of hi-fired U3O8 dis-
persed in Al and an equal number of arc-cast hypostoichiometric UAI3
in Al were clad with alloy 6061. Each compact contained 37 g U depleted
in 235U. Average attributes of the degassed compacts are recorded in
Table 13.6.
Table 13.6. Record of Compacts Fabricated for Study of Fit of Compact to Frame Cavity
Average Attributes of Compacts
Materials Dispersoid Hi-fired U308 Hypostoichiometric UAI3 Matrix aluminum 101 101
Degassed composition Dispersoid, $ By weight 45.99 52.48 By volume 20.7 27.9
Voids, vol i Estimate of standard 0.158 0.279 deviation
Degassed physical properties Weight, g 93.788 94.271 Density, g/cm3 3.7254 3.7061 Dimensions, in. Width 2.6467 2.6587 Length 2.1691 2.1799 Thickness 0.2676 0.2678
Changes from degassing operation Dimensions, mils Width +2.0 +14.6 Length +1.1 +11.4 Thickness +1.3 +4.5
Weight, mg -30 +2 Density, $ -0.631 ±2.719
Estimate of standard 0.112 0.218 deviation
aCompacts degassed for 1 hr at 500°C, pressed at 30 tsi.

267
The dimensions of the rectangular parallelepiped compacts are given
in Table 13.6. The frames were machined to the following differential
differences between the cavity and the degassed dispersions: (l) length
differences of +1, -0.5, and -4%; (2) width differences of +1, -0.5, and
and -4%; and (3) thickness differences of +5, 0, and —5%. When we
changed one of the three dimensional variables, the other two matched
the standard dimensions of the frame cavity. All cover plates were
0.108 in. thick, and all frames were 0.265 in. thick except those used
for the differential thickness variables.
After being rolled to a total reduction in thickness of 89.60%, the
fuel plates were inspected for (l) visual and ultrasonic indications of
noribonds, (2) fuel-core dimensions, and (3) x-ray attenuation indica-
tions of excessive fuel concentrations near the core ends. We interpret
the latter inspection as an indication of dogboning.
Surprisingly, no plate exhibited a blister or ultrasonic noribond
that could be attributed to the misfit between the frame cavity and com-
pact. In fact, only one blister developed, and it was located at the
core end in a UA13-bearing plate in which the experimental variables
matched the dimensions of the frame cavity and fuel compact. We con-
clude that within the range investigated blistering in these plates is
independent of the degree of fit between the frame cavity and fuel
compact.
The x-ray attenuation measurements indicated little fuel-core
thickening (dogboning) near the ends of the rolled dispersions. As
shown in Table 13.7, the values for plates containing IbOg were con-
sistently less than 15%; one UAl3-bearing plate exhibited dogboning
greater than 30%. The degree of core thickening, however, does appear
to decrease with decreasing fit ratio of compact to cavity. In com-
parison to ATR plate 19, which usually shows severe dogboning, perhaps
the relatively thin cover plates (0.011 in.) over our cores may account
for the limited amount of thickening indicated. We are studying the
effect of the ratio of cover-plate thickness to frame thickness on
special ATR fuel plates.

268
Table 13.7. Effect of Fit of Compact to Cavity Upon the Degree of Core Thickening in t^Og- and
UA1 -Bearing Fuel Plates
Variable Degree of Core Thickening,a $
Changed Fit Ratio, 45 wt $ 52 wt $ Dimension Compact/Cavity U3O8-AI Cores UAl -Al Cores
22 18 15
25 18 0
35 <15
0
Based on x-ray attenuation measurements.
Dogboning was always less than 10 to 15$, and exact numbers were not determined.
The spread of the fuel core during rolling did depend on the
degree of fit between the fuel compact and frame cavity:
Thickness 1.050 0 0.000 b 0.950 b
Length 1.010 15 0.995 b 0.960 b
Width 1.010 b 0.995 b 0.960 b
W2 — W.i
w2 100 , (13.1)
where
S = spread, $,
W = width of fuel compact, in.
Subscripts 1 and 2 indicate the degassed and rolled values, respectively.
The elongation of the core during rolling is defined similarly.
Table 13.8 shows typical values for spread and elongation as a function
of the various fit variables. Decreases in core thickness result in a
decrease in plate width and little change in length; a decrease in core
width and core length has little effect on the opposite dimension; but
the spread increases with decreasing width, while the elongation shows
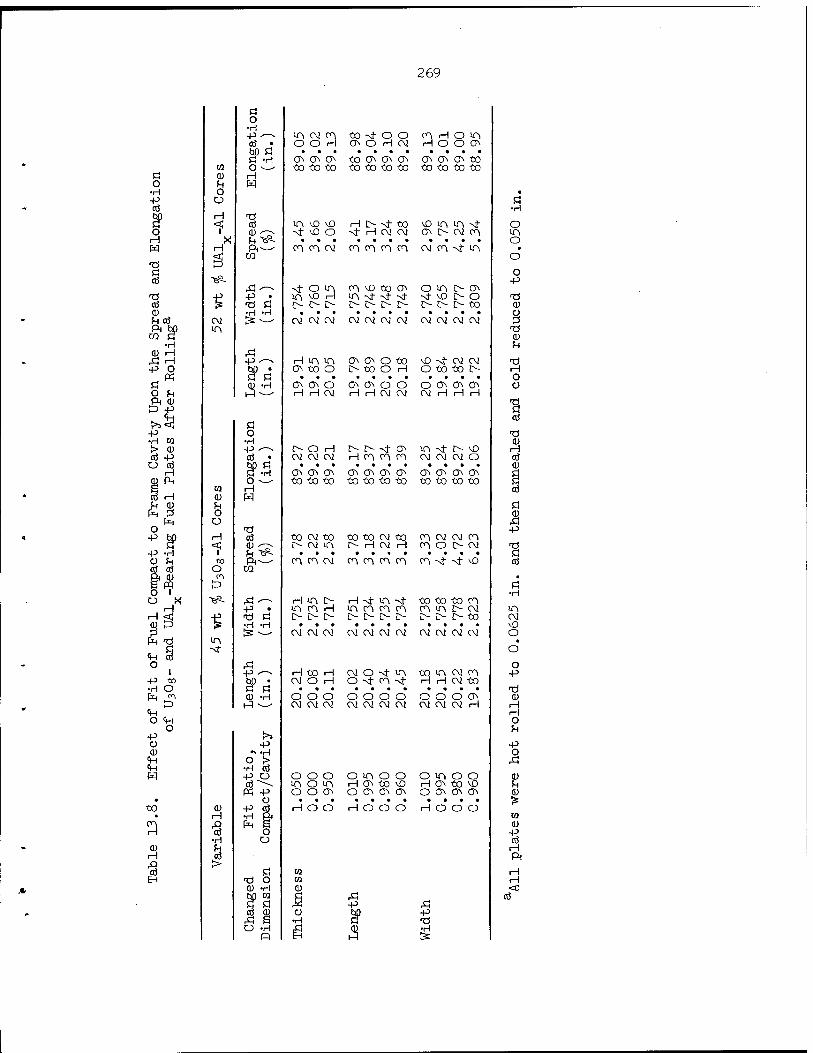
269
G O
•H +3 ^ in CM en tOstOO en H o >n 0 ^ o O H ON O H CM H o O ON
a» 5 • • • • • • • • « • • woo (OOOO ON ON ON tO
co o ^ to to to to to to to to to to to G CD H o u W •H o • +o Ü G 03 •H
G° H CO iTi \D \0 H D- -4- to NO in in st- O
o 1 CD ^~-- sfvOO -st H CM CM ON o CM en n H X h"^- • • • • • • • • • • • o PH1 H
CQ en en CM en en en m CM en -st- >n
o >d !=> G o oj ■*£- p
Ä^ -st o m en M3 to ON o in !> ON -Ö S +^ _: in NO H ■n "St NT "St ■st ND !> o -tf CO -Ö G I> t> t> O O L> £> [> !> i> to CD CD •H -H • • • • • • • » • ■ • CJ U 03 CM 13 — CM CM CM CM CM CM CM CM CM CM CM Pi ft öp
CO G m
CD •H fn
Q) H ,G ,G H P'—■ H in in OOOM \£) Nt CM CM -Ö P O Stf) • ON to o L> to O H O tO to !> H _ « a G O G (L) -H ON ON o ON ON O O O ON ON ON Ü O fc 1-3^ H H CM H H CM CM CM rl rl rl ft CD -Ö
E> -P G <H CO
>J<; G -p O t5 •H to •H CD l> CD P s~- D- O H !> !> -st ON in -st D- NO H OS -P CO • CM CM CM H en en en CM CM CM O CO O Oi a» 5 CD
H ON ON ON ON ON ON ON ON ON ON ON pi CD PH o •—• to to to to to to to to to to to Q S CO H CO cö H Q) M U CD ?-l G
PH 3 o CD PH o ,G
O "Ö P P gp H CO to CM to ■CO to CM to en CM CM en <; <D -~- !> CM m D- H CM H en o t> CM -ri P -H i ^ -eR G V U to ft--- en m CM en en en en en -st -st MO CO CO 05 O CQ ft CD PN. • S pq £> G O 1 •H o « "e£. A—- H m i> H Nt- in -st to to to en
H P • mnH m en en en en m !> CM in H ■<
■s <d G !>[>!> D- !> t> !> L> f> i> to CM
CD D •H -H • • • • • • • • • • • NO 2 [3^- CM CM CM CM CM CM CM CM CM CM CM o
PH TJ m ft G NT o
«H CO o ,G o
1 P ^ H to H CM o -4- in to in CM en p -p «3 bu • CM O H o -4- en st H H CM to •H O G G • • • • • • • • • ft • -Ö PH jp CD -H o o o o o o o O O O ON CD
t> Hi •— CM CM CM CM CM CM CM CM CM CM H H <H H O CH o
O lH P !» ü p> P (L) ^•H o
<H O f> ■G <H •H CO P3 P O O O O o in o o o m o o CD
cd^- m O in H ON to vD H ON to NO fH PH P O O ON O ON O ON O ON ON ON CD • Ü ft ft ft • • • • • • • • ^
to CD P cd H O O H O O O r-\ O O O H •H ft CO
a •H
PH S O o
CD p cd
CD fn H H ^ ft ,£5 > cd G CO H
EH <ü o CD -H
CO CD
H
2 3 5 ,G P ,G
cd
CO CD CJ bO P A a •H G •Ö O -H £ CD •H
o i-q :s

270
little effect from core length variations. As expected from considera-
tion of the volume of matrix available for deformation, the U3O8-AI
compacts widen and elongate slightly more than the UAI3-AI dispersions
of similar uranium content. Flaking of fuel particles beyond the core
ends, which were essentially square, was not observed in radiographs of
the plates. Two of the t^Og-bearing plates, however, showed flash or
fuel tapering about 0.19 in. long at the core ends. The flash in the
remainder of the U30g and all of the UA1 fuel plates was less than
0.06 in. long.
This study did not show the blister problem to be singularly
dependent upon the misfit between compact and frame. Misfit did affect
the degree of core spreading during rolling. Dogboning was less for
plates containing U3O8 than for plates containing UA1 and appeared to
depend somewhat upon the misfit. But the magnitude of dogboning in
both types of plate was low and may have been due to the relative thin-
ness of the cladding compared to the thickness of the core.
Grinding and Crushing of UA1 Fuel (G. L. Copeland, M. M. Martin)
A major problem in the preparation of UA1 particles is the
crushing of the arc-melted buttons to particles of usable size without
excessive production of particles below the 325 mesh size. Present ATE
specifications require —100 mesh particles with a maximum of 25 wt $>
being —325 mesh. While plates may be satisfactorily fabricated with
larger amounts of fines, the irradiation behavior of plates with such
particle distributions is unknown.
We prepared hypostoichiometric (75 wt $ U) and hyperstoichiometrie
(68 wt <jo U) UAI3 for fabrication studies. Crushing devices such as jaw
crushers, rod mills, hammer mills, disk crushers, mullers, and diamond
mortar and pestles generally yield about 50$ fines (-325 mesh) in the
—100 mesh product. We investigated several alternate methods of
crushing in an attempt to improve the yield of material in the usable
size range. The arc-cast material was rough crushed to about 10 mesh
for the following experiments. A sample of each composition was
annealed to improve the homogeneity.
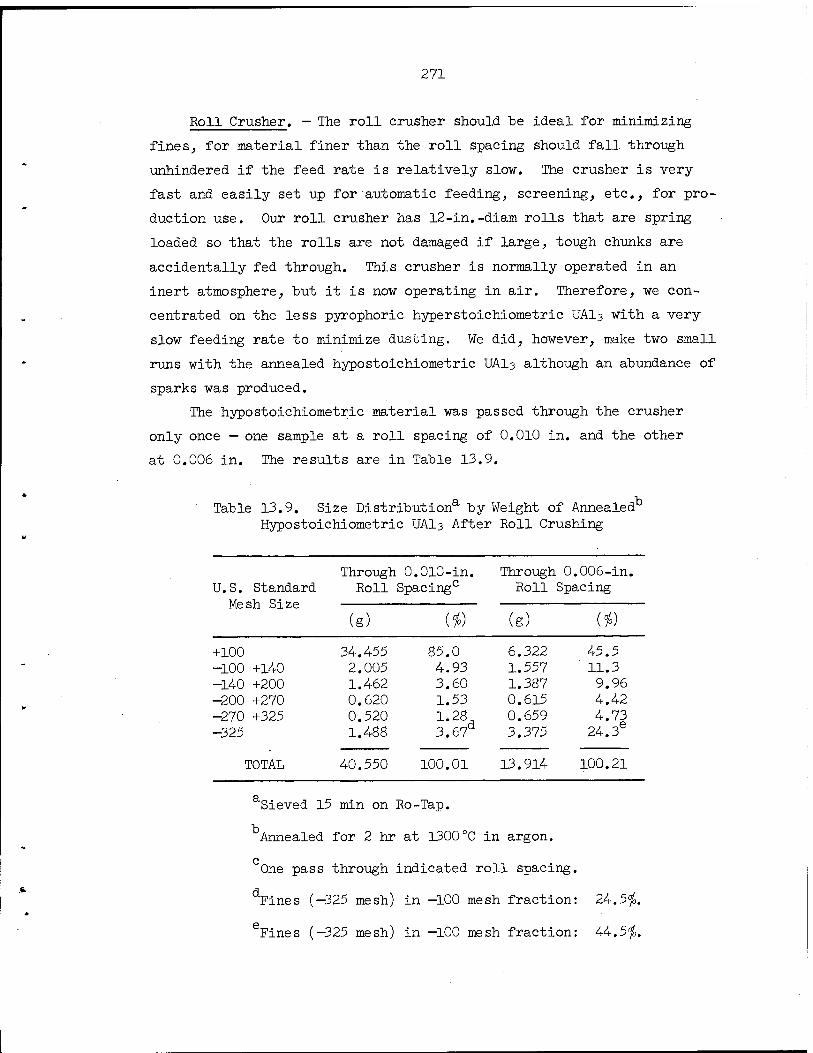
271
Roll Crusher. — The roll crusher should he ideal for minimizing
fines, for material finer than the roll spacing should fall through
unhindered if the feed rate is relatively slow. The crusher is very-
fast and easily set up for automatic feeding, screening, etc., for pro-
duction use. Our roll crusher has 12-in.-diam rolls that are spring
loaded so that the rolls are not damaged if large, tough chunks are
accidentally fed through. This crusher is normally operated in an
inert atmosphere, but it is now operating in air. Therefore, we con-
centrated on the less pyrophoric hyperstoichiometric UAI3 with a very
slow feeding rate to minimize dusting. We did, however, make two small
runs with the annealed hypostoichiometric UAI3 although an abundance of
sparks was produced.
The hypostoichiometric material was passed through the crusher
only once — one sample at a roll spacing of 0.010 in. and the other
at 0.006 in. The results are in Table 13.9.
Table 13.9. Size Distribution3, by Weight of Annealed13
Hypostoichiometric UAI3 After Roll Crushing
Through 0.010-in. Through 0.006-in. U.S. Standard Mesh Size
Roll Spacing0 Roll Spacing
(g) (*) (g) (*)
+100 34.455 85.0 6.322 45.5 -100 +140 2.005 4.93 1.557 11.3 -140 +200 1.462 3.60 1.387 9.96 -200 +270 0.620 1.53 0.615 4.42 -270 +325 0.520 1.28 0.659 4.73 -325 1.488 3.67a 3.375 24.3e
TOTAL 40.550 100.01 13.914 100.21
a, Sieved 15 min on Ro-Tap.
Annealed for 2 hr at 1300°C in argon.
'One pass through indicated roll spacing.
Fines (—325 mesh) in —100 mesh fraction: 24.5^
'Fines (—325 mesh) in —100 mesh fraction: 44.5^
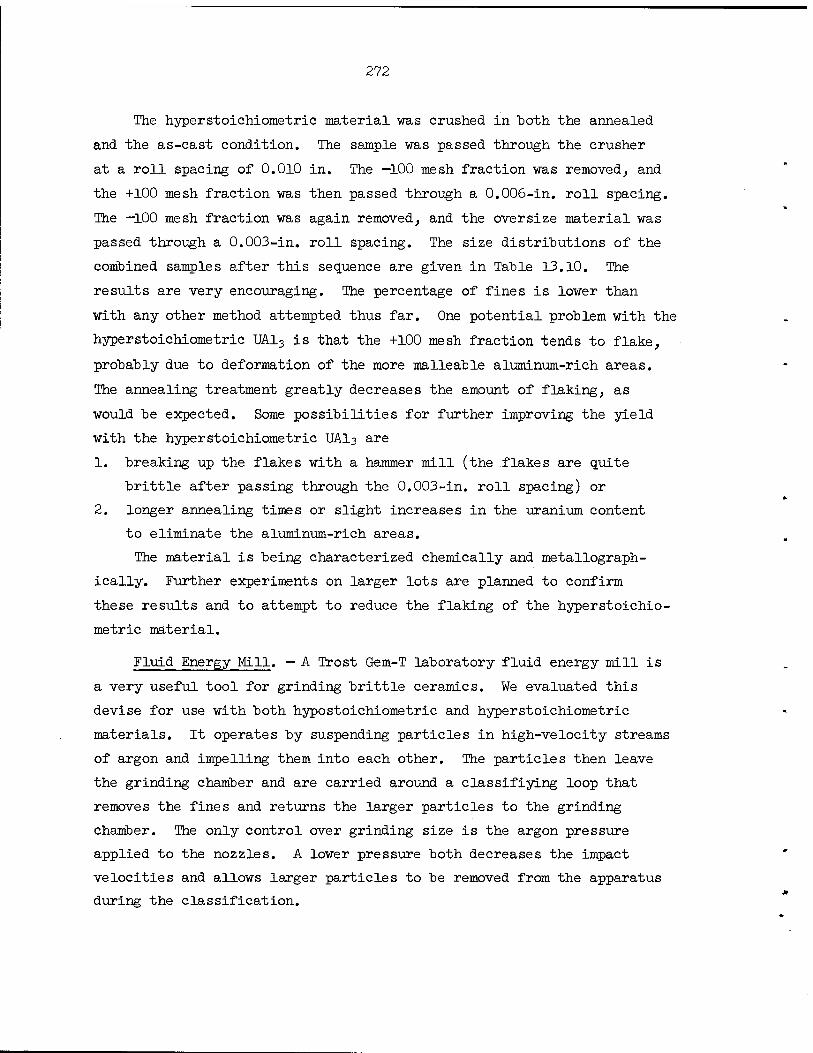
272
The hyperstoichiometric material was crushed in both the annealed
and the as-cast condition. The sample was passed through the crusher
at a roll spacing of 0.010 in. The —100 mesh fraction was removed, and
the +100 mesh fraction was then passed through a 0.006-in. roll spacing.
The —100 mesh fraction was again removed, and the oversize material was
passed through a 0.003-in. roll spacing. The size distributions of the
combined samples after this sequence are given in Table 13.10. The
results are very encouraging. The percentage of fines is lower than
with any other method attempted thus far. One potential problem with the
hyperstoichiometric UA13 is that the +100 mesh fraction tends to flake,
probably due to deformation of the more malleable aluminum-rich areas.
The annealing treatment greatly decreases the amount of flaking, as
would be expected. Some possibilities for further improving the yield
with the hyperstoichiometric UAI3 are
1. breaking up the flakes with a hammer mill (the flakes are quite
brittle after passing through the 0.003-in. roll spacing) or
2. longer annealing times or slight increases in the uranium content
to eliminate the aluminum-rich areas.
The material is being characterized chemically and metallograph-
ically. Further experiments on larger lots are planned to confirm
these results and to attempt to reduce the flaking of the hyperstoichio-
metric material.
Fluid Energy Mill. — A Trost Gem-T laboratory fluid energy mill is
a very useful tool for grinding brittle ceramics. We evaluated this
devise for use with both hypostoichiometric and hyperstoichiometric
materials. It operates by suspending particles in high-velocity streams
of argon and impelling them into each other. The particles then leave
the grinding chamber and are carried around a classifiying loop that
removes the fines and returns the larger particles to the grinding
chamber. The only control over grinding size is the argon pressure
applied to the nozzles. A lower pressure both decreases the impact
velocities and allows larger particles to be removed from the apparatus
during the classification.
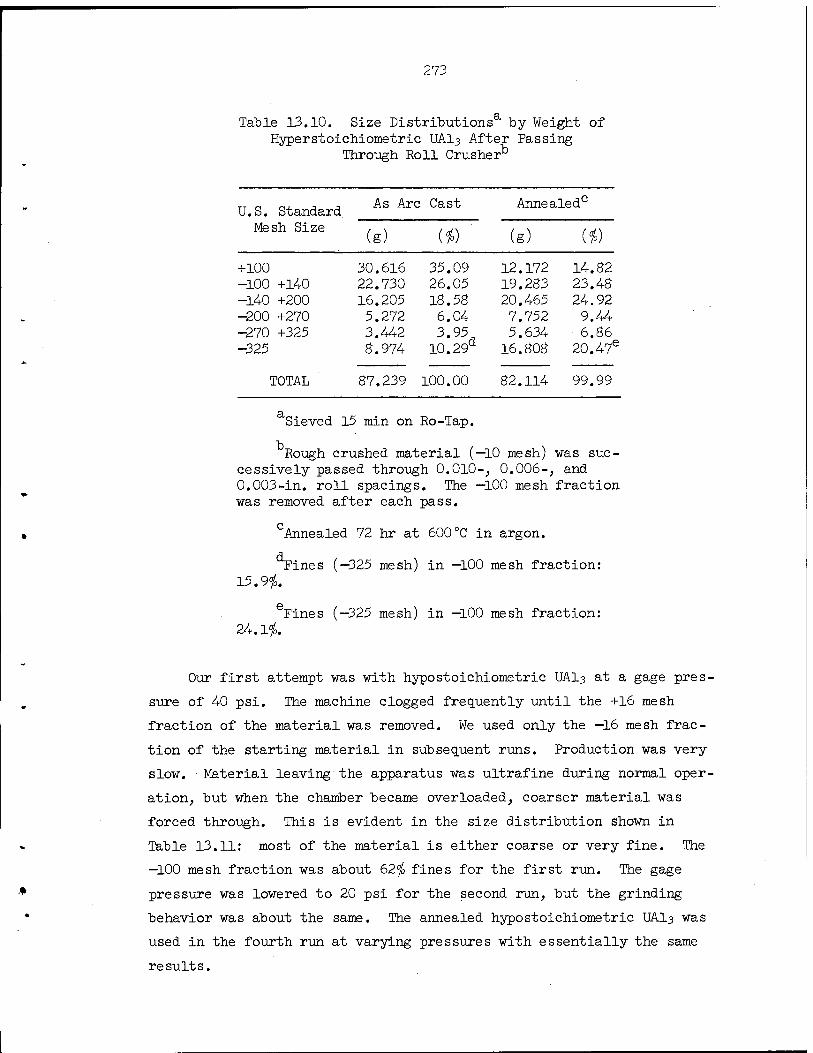
273
Table 13.10. Size Distributions3, by Weight of Hyperstoichiometric UAI3 After Passing
Through Roll Crusher'3
U.S. Standard As Arc Cast Annealed0
Mesh Size (g) (*) (g) (*)
+100 -100 +140 -140 +200 -200 +270 -270 +325 -325
30.616 22.730 16.205 5.272 3.442 8.974
35.09 26.05 18.58 6.04 3.95 I0.29d
12.172 19.283 20.465 7.752 5.634 16.808
14.82 23.48 24.92 9.44 6.86
20.47e
TOTAL 87.239 100.00 82.114 99.99
Sieved 15 min on Ro-Tap.
Rough crushed material (—10 mesh) was suc- cessively passed through O.OlO-, 0.006-, and 0.003-in. roll spacings. The —100 mesh fraction was removed after each pass.
Annealed 72 hr at 600°C in argon.
Fines (—325 mesh) in —100 mesh fraction: 15.9$.
Fines (—325 mesh) in —100 mesh fraction: 24.1$.
Our first attempt was with hypostoichiometric UAI3 at a gage pres-
sure of 40 psi. The machine clogged frequently until the +16 mesh
fraction of the material was removed. We used only the —16 mesh frac-
tion of the starting material in subsequent runs. Production was very
slow. Material leaving the apparatus was ultrafine during normal oper-
ation, but when the chamber became overloaded, coarser material was
forced through. This is evident in the size distribution shown in
Table 13.11: most of the material is either coarse or very fine. The
—100 mesh fraction was about 62$ fines for the first run. The gage
pressure was lowered to 20 psi for the second run, but the grinding
behavior was about the same. The annealed hypostoichiometric UA.I3 was
used in the fourth run at varying pressures with essentially the same
results.

274
Table 13.11. Size Distributions8, by Weight of Hypöstoichiometric UAI3 Ground in Fluid Energy Mill
U.S. Standard Run lb Run 2* Run 4C
Mesh Size (g) (*) (g) (*) (g) (*)
+60 33.263 47.88 4.890 42.52 18.365 71.5 -60 +100 15.400 22.16 1.840 16.00 2.481 9.62 -100 +140 3.945 5.68 0.400 3.48 0.616 2.40 -140 +200 2.270 3.27 0.340 2.96 0.576 2.24 -200 +270 0.910 1.31 0.190 1.65 0.343 1.34 -270 +325 0.835 1.20. 0.225 1.87 0.308 1.20 -325 12.855 I8.50d 3.625 3l.52e 2.985 11.65d
TOTAL 69.478 100.00 11.500 100.00 25.674 100.00
Sieved 15 min on Ro-Tap.
As-cast hypöstoichiometric UAI3.
Annealed hypöstoichiometric UAI3.
Fines (—325 mesh) in —100 mesh fraction:
Fines (—325 mesh) in —100 mesh fraction: 76$.
The hyperstoichiometric UAI3 was used in the third run and the
annealed hyperstoichiometric in the fifth run. We varied the pressures
in an attempt to increase production. The gage pressure was maintained
at 20 psi until the chamber began to overload, increased to about
60 psi to promote grinding, and then lowered to 10 psi or lower to pro-
mote removal of the material through the classifier. The size distribu-
tions are shown in Table 13.12. The results are the same as for the
hypöstoichiometric material. Part of the material becomes ultrafine,
and part remains coarse; only a minor portion of the material is in the
desired range of -100 +325 mesh. This type of distribution could be
due to several factors:
1. The corners or small fragments could be knocked from the large
particles.
2. The impact might be such that each particle crushed shatters
into several small fragments.

275
Table 13.12. Size Distributions51 by Weight of Hyperstoichiometric UA13 Ground in the
Fluid Energy Mill
Run 3b Run 5C U. S. Standard Mesh Size
(g) (*) (g) (*)
+60 16.116 68.77 13.937 57.1 -60 +100 3.244 13.85 2.044 8.4 -100 +140 0.956 4.08 0.740 3.03 -140 +200 0.643 2.74 0.629 2.57 -200 +270 0.332 1.42 0.366 1.50 -270 +325 0.286 1.22 0.328 1.34 -325 1.857 7.9ld 6.395 26.2e
TOTAL 23.434 99.99 24.439 100.14
Sieved 15 min on Ro-Tap.
As-cast hyperstoichiometric UAI3.
Annealed hyperstoichiometric UAI3.
Fines (-325 mesh) in -100 mesh fraction: 45.6$.
eFines (-325 mesh) in -100 mesh fraction: 75.61
3. The classification may be such that only the ultrafine par-
ticles are normally removed and overloading then sweeps the large
particles through with very little attrition.
The third possibility is most likely. In this case, a machine such
as the Majac Jet Pulverizer, with its independently controlled grinding
chamber and classifier, would give improved performance. However, the
grinding action of this type mill appears to be rather inefficient for
UAI3.
The Trost Gem-T fluid energy mill was not a good device for
grinding UAI3. Its poor particle distributions, excessive usage of
Ar as the fluid medium, and long grinding times are significant disadvan-
tages.

276
Mechanisms of Swelling in the UA1 -Al Compacts (A. K. Chakraborty)
We are studying the swelling behavior of UA1 dispersed in Al.
The stability of the UA1 fuel at elevated temperatures depends on the
interaction of UA13 and Al to form UAI4.. Fuel particle size, fuel com-
position, temperature, storage history of the powders, and type of sur-
face on the aluminum powders are factors that influence the swelling
behavior.
Voids have been observed in the reaction zone between UAI3 and Al.
To determine the cause of this void formation, we constructed a diffu-
sion couple between UA13 and Al and heat treated it for 1 hr at 600°C.
After this heat treatment, we found a large interfacial area of UAI4.
between the UA13 and Al. Within the UA14 layer that was formerly UA13,
many voids were found due to a Kirkendall effect. A similar diffusion
couple was made using Al and an UAl Zr fuel containing 14 wt $ Zr. x y Even after an exposure of 20 hr at 600°C we found no voids and a very
thin interfacial reaction zone in this diffusion couple. The latter
shows that doping elements can very effectively retard the transforma-
tion of UA13 to UAI4.
A report describing all aspects of our experiments on fuel
swelling has been drafted.
Characterization of Sol-Gel U30a (M. M. Martin)
The performance of aluminum-based dispersion-type fuel plates in
reactors may depend upon the amount and location of voids within the
core that could provide a place to accommodate particle swelling and
fission gases. The particular fuel and its method of manufacture and
concentration in the fuel core establishes the quantity of voids that
are retained and/or open to the matrix in a roll-bonded and annealed
fuel plate.2 In our search for an improved fuel for HFIR, we have
found that U30g prepared by the sol-gel process3 offers the additional
2M. M. Martin, J. H. Erwin, and W. R. Martin, Trans. Am. Nucl. Soc. 11(1), 107 (June i960).
3R. G. Wymer, Laboratory and Engineering Studies of Sol-Gel Processes at Oak Ridge National Laboratory, ORNL-TM-2205 (May 1968).
277
desirable property of a larger and perhaps a controllable amount of
closed porosity within the fuel particles.
Figure 13.1 shows the as-polished structure of U3O8 particles from
three methods of preparation. Hi-fired U30g is comparable to that being
used successfully in HFIR. The burned U30g is from an earlier stage of
the hi-fired process and is made simply by burning uranium machining
chips.
The photographs in Fig. 13.1 for burned (A,D) and hi-fired (B,E)
oxides show materials that are depleted as well as enriched in 235U.
In comparing these, one sees differences of (l) pore size in the hi-fired
and (2) agglomeration of fines in the burned oxides. These differences
result primarily from a loosening of process control and metal purity
requirements with the depleted materials. The sol-gel U3O8 shown in
ORNL-DWG 68-11043
(A) ENRICHED BURNED OXIDE
(D)DEPLETED BURNED OXIDE
(C)NORMAL SOL-GEL OXIDE
0 50 100 . t 1 1
(B) ENRICHED HI-FIRED OXIDE
.(f i) DEPLETED HI-FIRED OXIDE
Fig. 13.1. As-Polished Structure of U3O8 Particles from Three Methods of Preparation.
278
(C) contains normal U. In contrast to the pores and cracks in hi-fired
and burned materials, the sol-gel U30s particles have an abundance of
minute voids distributed uniformly throughout the as-polished structure.
The diameter of most of the voids is less than 1 urn.
The sol-gel U^Og that was characterized came from the Chemical
Technology Division at ORNL. Lines from a Debye-Scherrer powder camera
sample were indexed to be the orthorhombic form of U3O8; two extra
lines, however, indicated the presence of minor amounts of hexagonal
U3O8. Spectrographic analysis revealed impurities of Al, B, Fe, Na,
and Ni that exceeded the HFIR specification.4 Closer control of
starting materials should reduce these contaminants to an acceptable
level. The results of other analyses are given in Table 13.13 which
includes for comparison data for hi-fired and burned U30g.
Note in Table 13.13 the excellent agreement between the values for
toluene density and mercury density determined at 15,000 psi for the
sol-gel material. The amount of closed porosity calculated from the
toluene and x-ray densities is 12.4- vol f0. The mercury and toluene
densities for both burned and hi-fired materials, however, differ sig-
nificantly. In fact, the toluene values for hi-fired particles are
always near that for theoretically dense U30g. We conclude that most
of the pores and cracks depicted in Fig. 13.1 for the burned and
hi-fired materials are open to the surface of the particles. The minute
and finely distributed voids in sol-gel U30g, however, are closed.
All of the above information gives a reasonably clear picture of
sol-gel U30g. The distribution of a relatively large volume of closed
porosity appears to be its principal asset, since the material may be
able to hold a significant quantity of fission gases. If the pores can
be retained during plate fabrication and irradiation, sol-gel U30g
should be an extremely attractive fuel for research reactors. The
decision on whether or not it will perform adequately on HFIR fuel must
be based on results from plate fabrication and irradiation experiments
now being planned.
4R. W. Knight, J. Binns, and G. M. Adamson, Jr., Fabrication Procedures for Manufacturing High Flux Isotope Reactor Fuel Elements, ORNL-4242 (June 1968).
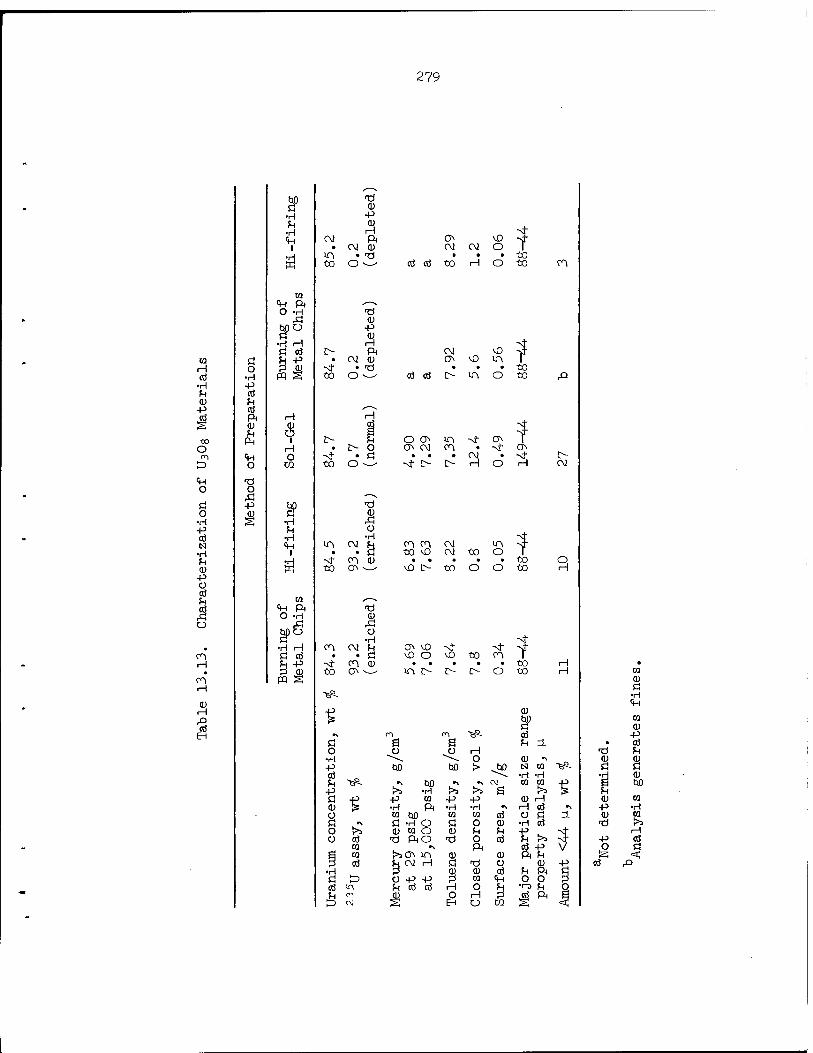
279
•H
•H
CO -p 0) H st
CM ft ON vO ^ • CM CO CM CM O 1 1
0 >A • "Ö • • • tO to o ^-- cd cd to H o to en
CO <M ft .—-* O >H TJ
Ö cd
co •p
CD
!> ft CM vO st co Ü
P xu • CM CO ON vD iTi r
H O st • X) • • • to CO •H pq S tO O cd cd £> lA O to ,Q •H -P U cd 0) U
-P cd -* ■*
cd ft H H 2 CO 0) 1 + ^ ^ «0 ft 1 C- U O ON lA st CJ\ 1 o H • l>0 CT* CM en • st CT*
CN <H O st • Ö . . . CM • st L> !3 o to tOO st I> !> H O H CM
<H TJ O o
■ Ä ■ ^
o -p
CO a 93 •H s •H ,G -p S4 o cd CO •H fn CO
-P O cd In
i
•H
•H K
CO <H ft O -H
3H
•H st lACMJH m en CM lAst
. . a to vD CM to O 1 st en CO to O ■COON \D 1> to O O to H
O •rl St
en CM is OvDNt stsj- • Ö vO O vO to en r en Ö cd . H P. +* P £>
st en co .....to H . • to G\— iA!>!>-L>OtO H CO
en pq s <D H
>£- •H CD <4H
-P (D
* g> •\ CN en "^- cd
ö ö a , fc i O ü O H •H ~^ ^^ O CO * „ ■P M bO > bD <si w "e£- cd 0 ^-- -H -H
-P >> »H >> >» Ö >» P
CO
CO CO
-P cd
0) bO
H Ö -P -p CQ-P40 co H CO p -H ft -H -rl ^ H cd »>
CO CO -p •H
o cotio co co cd O ö i co CO G L^ Ö -H O G O CO -H cd -Ö >3
0>5 HMO D h h-PL Nf H CJ cd tJ ftO >ö O cd U !>i st +3 cd
*" co «> ft cd -P V Ö CO >iON 1A CO CO ft ?H pcd fc CM H Ö *Ü O CO -P
•H P co co cd M ft ü cd
<;
Ö l=> O-P-PPWCHOOP (Ö m (HCdcdHOfH*n)^Q U r\ m OHpdftS -m IbcM S EHUC/iS <1
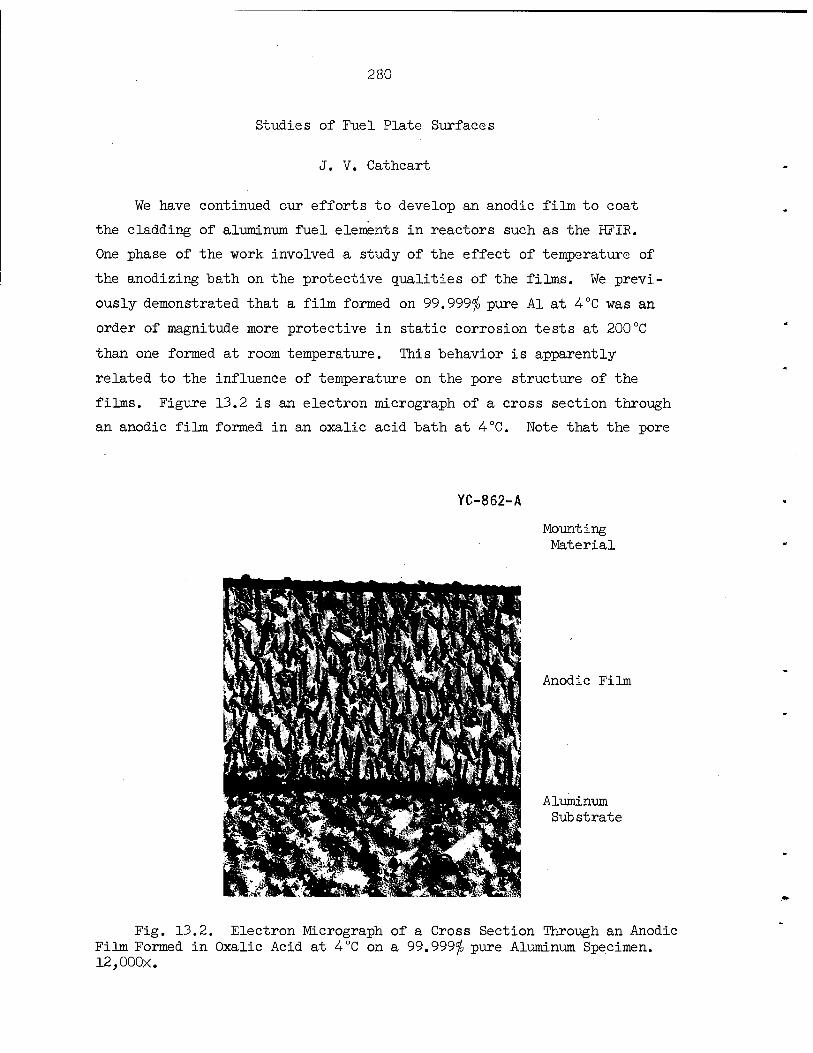
280
Studies of Fuel Plate Surfaces
J. V. Cathcart
We have continued our efforts to develop an anodic film to coat
the cladding of aluminum fuel elements in reactors such as the HFIR.
One phase of the work involved a study of the effect of temperature of
the anodizing bath on the protective qualities of the films. We previ-
ously demonstrated that a film formed on 99.999</o pure Al at <4°C was an
order of magnitude more protective in static corrosion tests at 200CC
than one formed at room temperature. This behavior is apparently
related to the influence of temperature on the pore structure of the
films. Figure 13.2 is an electron micrograph of a cross section through
an anodic film formed in an oxalic acid bath at 4°C. Note that the pore
YC-862-A
Mounting Material
Anodic Film
Aluminum Substrate
Fig. 13.2. Electron Micrograph of a Cross Section Through an Anodic Film Formed in Oxalic Acid at 4°C on a 99.999$ pure Aluminum Specimen. I2,000x.

281
structure is still evident; however, the pore size has been considerably
reduced, and the pore density and length and the degree to which the
pores are interconnected are all less than the corresponding parameters
for room-temperature films. We are also investigating the relationship
between the initial thickness of these anodic films and the time in
water at 200°C required for their breakdown.
We have studied the properties of anodic films formed in an anod-
izing bath containing 38 g TiO(KC202)2, 1.2 g citric acid, and 1.0 g
oxalic acid per liter of water. It is believed that films formed in
this bath are tougher and more elastic than those formed in oxalic
acid; hence, it is possible that they will better withstand the strain
gradients that develop in tests where a high heat flux exists across
the specimen-water interface.
The initial results of static^ isothermal tests of these films on
99.999$ pure Al at 200°C showed them to be at least as protective as
low-temperature films formed in oxalic acid. Again, this behavior
appears to be tied to the pore structure of the films, the pore spacing
being wider than that for the room-temperature oxalic acid films.
In the last test, carried out by John Griess in a flowing loop rig,
the test section of the loop was coated with an anodic film formed in
oxalic acid at 16°C and exposed for 168 hr at an interface temperature
of about 200°C. The thermal data from the loop indicated a reduction
in the corrosion rate over the total time of the test; however, metal-
lographic examination of the specimen after test failed to reveal any
remnant of the original anodic film. It is clear that we need to
improve further the protective qualitites of the anodic films in order
to counteract the much more stringent corrosion conditions encountered
in the flowing loop tests.
Two new test sections have been completed for the flowing loop.
In light of the results described above, we plan to coat the first of
these with an anodic film formed in the TiO(KC202)2 bath.
282
Vapor Fabrication of Fuels and Reactor Materials
W. R. Martin
Vapor Fabrication of Pu02 Powder from PuF6 (W. C. Robinson, Jr.)
The following is the abstract of a report5 issued this quarter:
A program was undertaken to establish the feasibility of converting PuF6 to Pu02 in a one-step process by chemi- cal vapor deposition techniques. The process is analogous to the UFö conversion process and involves the reaction of PuF6 vapor, hydrogen, and H20. A remote apparatus with facilities for fluorination of PUF4 to PUFö and subsequent conversion of PuF6 to PuÜ2 was designed, constructed, and the feasibility experiments were completed. X-ray analy- ses of the powder product confirmed the presence of PuC>2 only.
Work was begun to extend the investigation to the simultaneous con-
version of PuF6-UF6 mixtures to the mixed oxide. This required appara-
tus modification to accommodate the concurrent metering of both fluoride
gases. The fluorination system used for conversion of PUF4 to PuF6 will
also be redesigned. This new design has been completed, and construction
has begun.
Flame-Produced Material (J. I. Federer)
Preparation of UO2. — In past experiments, UO2 was usually prepared
with large excesses of both H2 and O2 compared to the amount of UF6 in
the gas mixture.6 These elements form water in excess of that required
for reaction. In a commercial application of the process, gaseous HF,
also formed in the reaction, would be recovered as salable hydrofluoric
acid. The commercial composition of this acid is about 50 wt ^ HF and
would be obtained by adding or extracting water. A mole ratio of
H2:02:UF6 = 3:1:1 is needed for stoichiometric reaction; a ratio of
5W« C. Robinson, Jr., and W. R. Martin, A Feasibility Study of the Conversion of PuF6 to Pu02 by Chemical Vapor Deposition, 0RNL-TM-2306 (August 1968). '
6J. I. Federer, W. C. Robinson, Jr., and F. H. Patterson, Conver- sion of UF6 to U02 in a Flame Reactor, 0RNL-TM-2327 (October 1968).
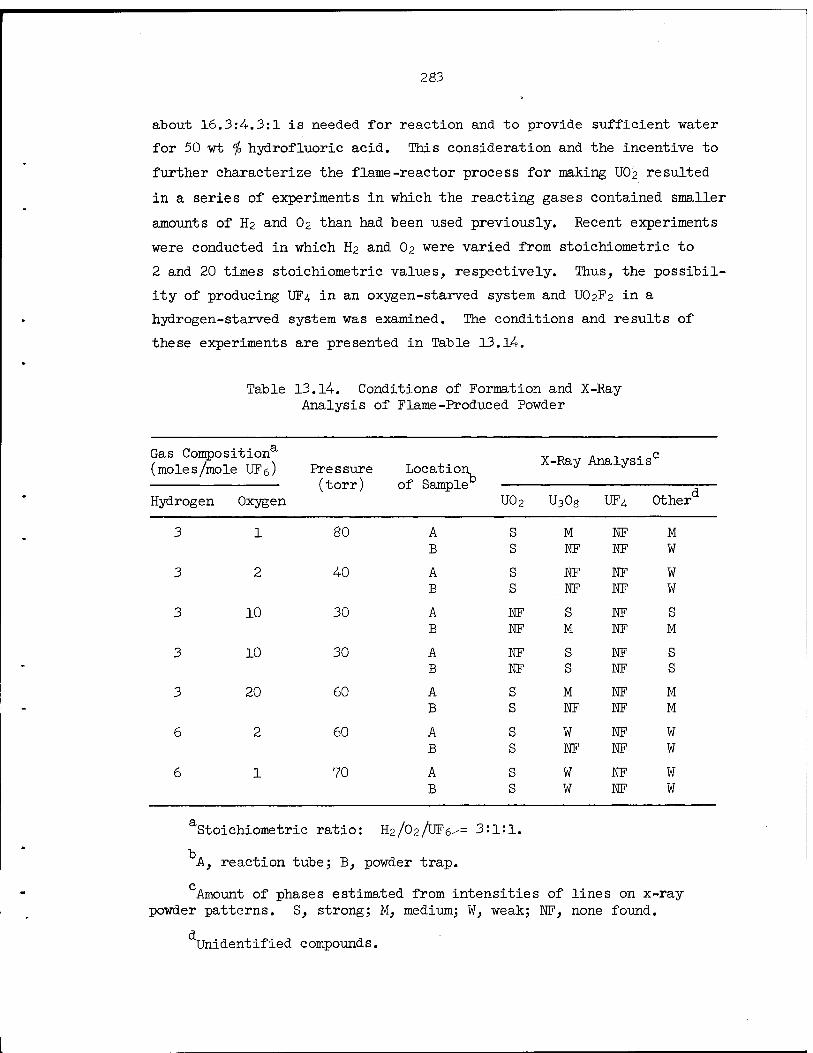
283
about 16.3:4.3:1 is needed for reaction and to provide stifficient water
for 50 wt $ hydrofluoric acid. This consideration and the incentive to
further characterize the flame-reactor process for making UO'2 resulted
in a series of experiments in which the reacting gases contained smaller
amounts of H2 and O2 than had been used previously. Recent experiments
were conducted in which H2 and O2 were varied from stoichiometric to
2 and 20 times stoichiometric values, respectively. Thus, the possibil-
ity of producing UF4 in an oxygen-starved system and UO2F2 in a
hydrogen-starved system was examined. The conditions and results of
these experiments are presented in Table 13.14.
Table 13.14. Conditions of Formation and X-Ray Analysis of Flame-Produced Powder
Gas Composition8,
(moles/mole UFö) Pressure Location X-Ray Analysis0
(torr) of Sample 0therd Hydro gen Oxygen U02 U308 UF4
3 1 80 A S M NF M B S NF NF W
3 2 40 A S NF NF W B S . NF NF W
3 10 30 A NF S NF S B NF M NF M
3 10 30 A NF S NF S B NF S NF S
3 20 60 A S M NF M B S NF NF M
6 2 60 A S W NF W B S NF NF W
6 1 70 A S W NF W B S W NF W
Stoichiometric ratio: H.2/02/UF6--= 3:1:1.
A, reaction tube; B, powder trap.
Amount of phases estimated from intensities of lines on x-ray powder patterns. S, strong; M, medium; W, weak; NF, none found.
Unidentified compounds.

284
Table 13.14 shows that pressure, which was intended to be constant,
varied from 30 to 80 torr. The pressure listed for any given experiment
was necessary to maintain a stable flame. The pressure actually was con-
stant except during the period at the beginning of the experiment when
we were forced to seek by trial and error for that pressure necessary to
keep the flame burning. In the first four experiments, O2 was increased
from the stoichiometric values to 20 times that value. Uranium dioxide
was a principal product of each of these experiments except for an oxy-
gen value of 10 times stoichiometric. In this experiment, and in
another performed under similar conditions as a check, l^Og formed
instead of UO2. Uranium dioxide was the principal product formed in the
last two experiments for which the hydrogen content of the gases was two
times stoichiometric. Neither UF4 nor UO2F2 has been identified in the
product from these experiments; however, either compound may be present
in the other (unidentified) compounds present in every case. Attempts
to index the weak and diffuse lines caused by these compounds on x-ray
powder patterns have been unsuccessful. Tentative identification of
UO3, UO2F2, and UF^'l l/2 H2O was made in some cases. The results show
that UO2 can be prepared with a stoichiometric mixture of gases and mix-
tures containing small excesses of H2 and O2. These results and those
from previous experiments6 imply that a mixture can be used that would
result in hydrofluoric acid of near commercial composition to be sold
rather than discarded as waste. This will help solve a problem of waste
disposal and will improve the economics of UF6 conversion.
Characterization of Flame-Produced U02. — In a continuing effort
to increase the particle size of flame-produced U02, we heat treated
samples at 1100 and 1200°C in wet H2 for 16 hr. Sieve analysis of as-
prepared and heat-treated powders are shown in Table 13.15. These
results show that heat-treated powder contains a larger fraction of —325
mesh material than does as-prepared powder. Similar results have been
obtained after heat treatment at 1000°C and after conversion to U30g
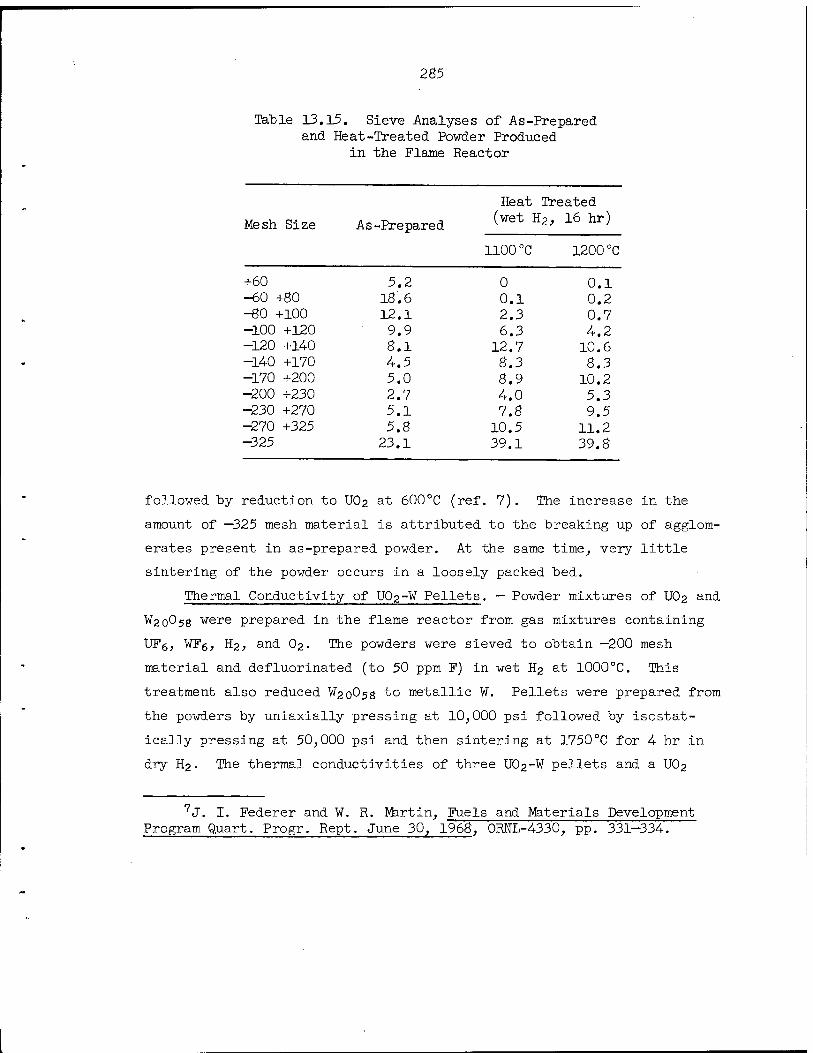
285
Table 13.15. Sieve Analyses of As-Prepared and Heat-Treated Powder Produced
in the Flame Reactor
Heat Treated
Mesh Size As-Prepared (wet H2, 16 nr)
1100 °C 1200 °C
+60 5.2 0 0.1 -60 +80 18.6 0.1 0.2 -80 +100 12.1 2.3 0.7 -100 +120 9.9 6.3 4.2 -120 +14-0 8.1 12.7 10.6 -140 +170 4.5 8.3 8.3 -170 +200 5.0 8.9 10.2 -200 +230 2.7 4.0 5.3 -230 +270 5.1 7.8 9.5 -270 +325 5.8 10.5 11.2 -325 23.1 39.1 39.8
followed by reduction to UO2 at 600°C (ref. 7). The increase in the
amount of —325 mesh material is attributed to the breaking up of agglom-
erates present in as-prepared powder. At the same time, very little
sintering of the powder occurs in a loosely packed bed.
Thermal Conductivity of UO2-W Pellets. — Powder mixtures of UO2 and
W20O58 were prepared in the flame reactor from gas mixtures containing
UFg, wFg, H2, and O2. The powders were sieved to obtain —200 mesh
material and defluorinated (to 50 ppm F) in wet H2 at 1000°C. This
treatment also reduced W20O58 to metallic ¥. Pellets were prepared from
the powders by uniaxially pressing at 10,000 psi followed by isostat-
ically pressing at 50,000 psi and then sintering at 1750°C for 4 hr in
dry H2. The thermal conductivities of three UO2-W" pellets and a UO2
7J. I. Federer and W. R. Martin, Fuels and Materials Development Program Quart. Progr. Rept. June 30, 1968, ORNL-4330, pp. 331-334.
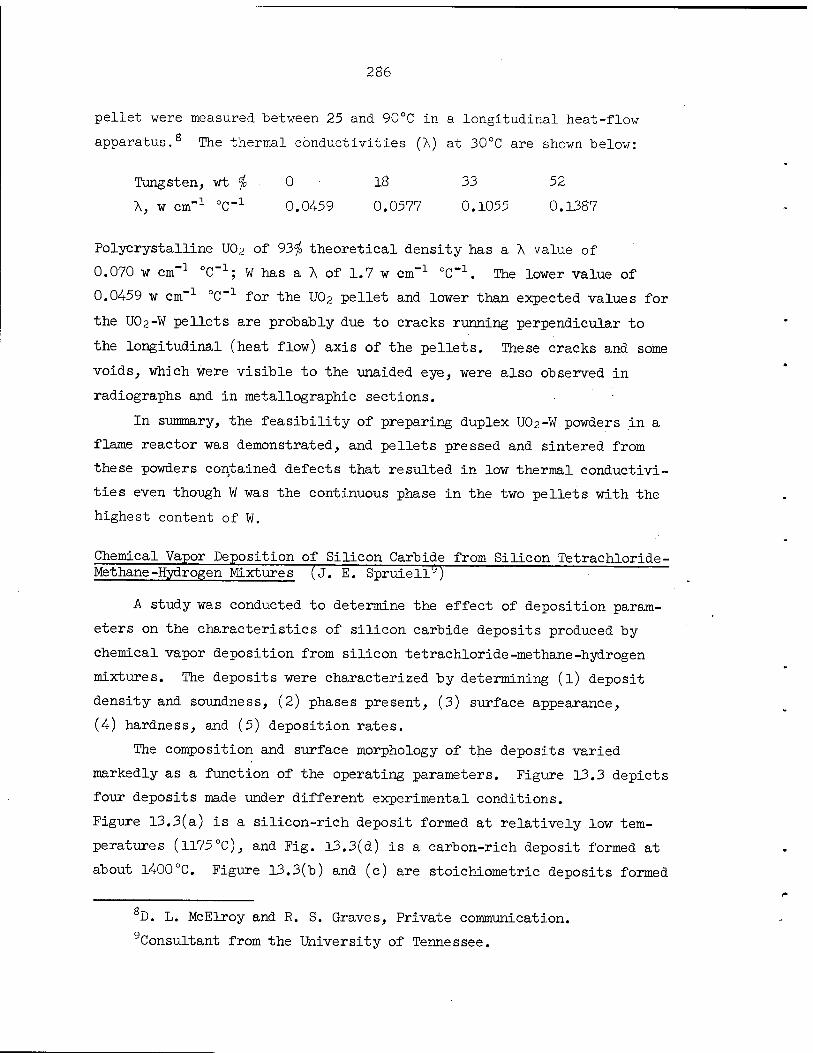
286
pellet were measured between 25 and 90°C in a longitudinal heat-flow
apparatus.0 The thermal conductivities (A) at 30°C are shown below:
Tungsten, wt $ 0 18 33 52
A, w cm-1 °C-X 0.0459 0.0577 0.1055 0.1387
Polycrystalline U02 of 93$ theoretical density has a A value of
0.070 w cm"1 °C"1; W has a A of 1.7 w cm'1 0C_1. The lower value of
0.04-59 w cm-1 °C~1 for the U02 pellet and lower than expected values for
the UO2-W pellets are probably due to cracks running perpendicular to
the longitudinal (heat flow) axis of the pellets. These cracks and some
voids, which were visible to the unaided eye, were also observed in
radiographs and in metallographic sections.
In summary, the feasibility of preparing duplex UO2-W powders in a
flame reactor was demonstrated, and pellets pressed and sintered from
these powders contained defects that resulted in low thermal conductivi-
ties even though W was the continuous phase in the two pellets with the
highest content of W.
Chemical Vapor Deposition of Silicon Carbide from Silicon Tetrachloride- Methane-Hydrogen Mixture's" (J. E. Spruielly)
A study was conducted to determine the effect of deposition param-
eters on the characteristics of silicon carbide deposits produced by
chemical vapor deposition from silicon tetrachloride-methane-hydrogen
mixtures. The deposits were characterized by determining (l) deposit
density and soundness, (2) phases present, (3) surface appearance,
(4) hardness, and (5) deposition rates.
The composition and surface morphology of the deposits varied
markedly as a function of the operating parameters. Figure 13.3 depicts
four deposits made under different experimental conditions.
Figure 13.3(a) is a silicon-rich deposit formed at relatively low tem-
peratures (1175°C), and Fig. 13.3(d) is a carbon-rich deposit formed at
about 1400°C. Figure 13.3(b) and (c) are stoichiometric deposits formed
8D. L. McElroy and R. S. Graves, Private communication.
Consultant from the University of Tennessee.

287
Y-86968
Fig. 13.3. Representative SiC Deposits, (a) Silicon-rich deposit formed at 1175°C; (b) and (c) pure SiC deposited at 1350°C; and (d) graphite-rich deposit formed at 1400°C.
at 1350°C. The primary parameter for this process is temperature. In
general, the higher the deposition temperature, the more carbon-rich
the deposit stoichiometry and the rougher the deposit morphology. The
characteristics of the deposits over a range of deposition parameters
and optimization of parameters for producing particular deposit proper-
ties were discussed previously.10 This work on SiC has now been
discontinued.
Development of Nondestructive Inspection Techniques
B. E. Foster S. D. Snyder
Work this quarter has involved scanner calibration and studies of
radiographic densitometry for determination of fuel-plate homogeneity.
10- J. E. Spruiell, Chemical Vapor Deposition of Silicon Carbide from Silicon-Tetrachloride-Methane-Hydrogen Mixtures, 0RNL-4326 (in press).
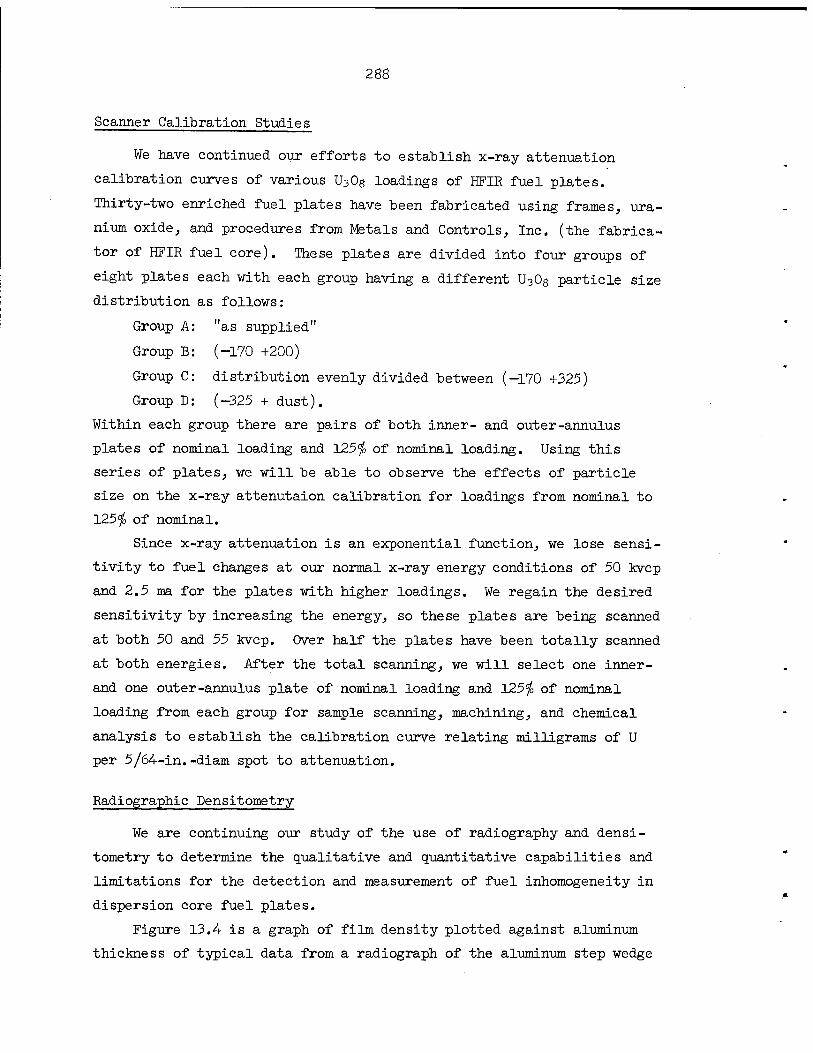
288
Scanner Calibration Studies
We have continued our efforts to establish x-ray attenuation
calibration curves of various U30g loadings of HFIR fuel plates.
Thirty-two enriched fuel plates have been fabricated using frames, ura-
nium oxide, and procedures from Metals and Controls, Inc. (the fabrica-
tor of HFIR fuel core). These plates are divided into four groups of
eight plates each with each group having a different U30g particle size
distribution as follows:
Group A: "as supplied"
Group B: (-170 +200)
Group C: distribution evenly divided between (-170 +325)
Group D: (-325 + dust).
Within each group there are pairs of both inner- and outer-annulus
plates of nominal loading and 125$ of nominal loading. Using this
series of plates, we will be able to observe the effects of particle
size on the x-ray attenutaion calibration for loadings from nominal to
125$ of nominal.
Since x-ray attenuation is an exponential function, we lose sensi-
tivity to fuel changes at our normal x-ray energy conditions of 50 kvcp
and 2.5 ma for the plates with higher loadings. We regain the desired
sensitivity by increasing the energy, so these plates are being scanned
at both 50 and 55 kvcp. Over half the plates have been totally scanned
at both energies. After the total scanning, we will select one inner-
and one outer-annulus plate of nominal loading and 125$ of nominal
loading from each group for sample scanning, machining, and chemical
analysis to establish the calibration curve relating milligrams of U
per 5/64—in.-diam spot to attenuation.
Radiographic Densitometry
We are continuing our study of the use of radiography and densi-
tometry to determine the qualitative and quantitative capabilities and
limitations for the detection and measurement of fuel inhomogeneity in
dispersion core fuel plates.
Figure 13.4 is a graph of film density plotted against aluminum
thickness of typical data from a radiograph of the aluminum step wedge

289
0.600
<o 0.500 ÜJ x o
$ 0.400 Lü Z
o
0.300
0.200
0.100
ORNL Dwg 68-10449
• 0.500-in. -DIAM SPECIMEN
SO D A 0.250-in.-DIAM SPECIMEN
m> O O.I25-in.-DIAM SPECIMEN
D 0.078-in. -DIAM SPECIMEN
0.70 0.80 0.90 1.00 1.10 1.20
FILM DENSITY
1.30 1.40 1.50 1.60
Fig. 13.4. Radiographic Density Curve for Aluminum Step Wedge and Simulated Excess Fuel in a Fuel Plate.
and small-diameter aluminum disks (representing excess fuel) when
superimposed on a fuel plate. The aperture of the densitometer was
0.078 in. The graph clearly shows the bias in film density (and inter-
pretation of fuel content) resulting when 0.078- and 0.125-in.-diam
disks are measured. The error has been as much as 33/0. This bias is
not evident when measuring the film density for the l/4- and l/2-in.-
diam specimens.
Computer programs have been developed to achieve the best least-
squares-curve fit for the data from the film densitometry studies.
Similar programs were also developed for curve fitting the data for the
calibration curves from the x-ray attenuation scanning.
Additional work in the Nondestructive Testing Laboratory has been
in conjunction with studies of fuel plate fabrication. Problems in
ultrasonic scanning of plates are reported above.11
1:LM. M. Martin et al., "irradiation Studies of Dispersion Plates/ pp. 260-265, this report.

PART V.
ENGINEERING PROPERTIES OF REACTOR MATERIALS

73934 293
fH 14. f PHYSICAL AMD MECHANICAL METALLURGY OF REFRACTORY ALLOYSj^
¥. 0. Harms
The purpose of this program is to provide a broad, "base-technology
evaluation of high-temperature alloys for use in high-performance nuclear
reactors and isotopic heat sources for advanced space, terrestrial, and
civilian power applications. Principal emphasis is placed on materials
problems involving tantalum-, niobium-, molybdenum-, and vanadium-base
alloys for systems that use alkali metals as thermodynamic working
fluids and heat-transfer media. Some work on superalloys is included '
because of the more immediate need for these materials in thermoelectric
power devices.
Basic Physical Metallurgy StudiesJ
H. Inouye
Solubility, Diffusivity, and Permeability of Interstitials in Refractory
Metals (R. L. Wagner) /
Our task is to measure the permeability of N through W to assess
its ability to contain nitride fuels. We are measuring the rate at
which N degasses from a tungsten wire. From this, we determine the
solubility and diffusivity of N in W. The permeability in units of
torr liter cm torr 2 is calculated from the relationship
K = DS , (14.1)
where
K = permeability,
D = diffusivity,
S = solubility constant.

294
The following equation allows one to calculate the flux, J, of gas through
the cladding walls:
_ _ K£#
where
AP = the pressure differential from inside to outside of the cladding wall,
d = the thickness of the cladding wall. r 1 The literature values for the solubility, diffusivity, and permea-
K^lTäs tw, AV, &.»,/"T>0 KM UOPC .f bility of IT "in refractory metals and our results to date are presented . :
in Table 14.1 along with the values for Mo and Ta. At the two tempera- / _ _f
tures presented, our values for diffusion of N in W are lower than the
literature values by an order of magnitude, and our values for solu-
bility are an order of magnitude higher. This results in our values
for permeation and flux being slightly lower.
' The permeability and flux values for Mo are about two to three
orders of magnitude higher than those for ¥. The high solubility of
Ta — six orders of magnitude higher than that of the others — results
in its high values for permeability and flux in comparison with W.
The disagreement between our tungsten data and the published values
is unresolved.! Further experiments are being carried out to determine
the diffusivity and solubility as a function of temperature.
Interaction of Stress and Vacuum on Properties of Superalloys at p pvnt.pri
TftTrrofyra.tin-RR .CD. T. Bourgette)
The tworöbjectivesjof this investigationlare to determine the effects
of evaporation losses on creep behavior and the effect of stress on the
evaporation kinetics of superalloys. Haynes alloy No. 25 was selected
for the initial tests. \ A,v $ zqc
Preliminary results showed that evaporation losses increased with — ö
stress at 785°C and 10 torr. Measurements of the BET surface area
show that the higher stresses increased the evaporation area. Therefore,
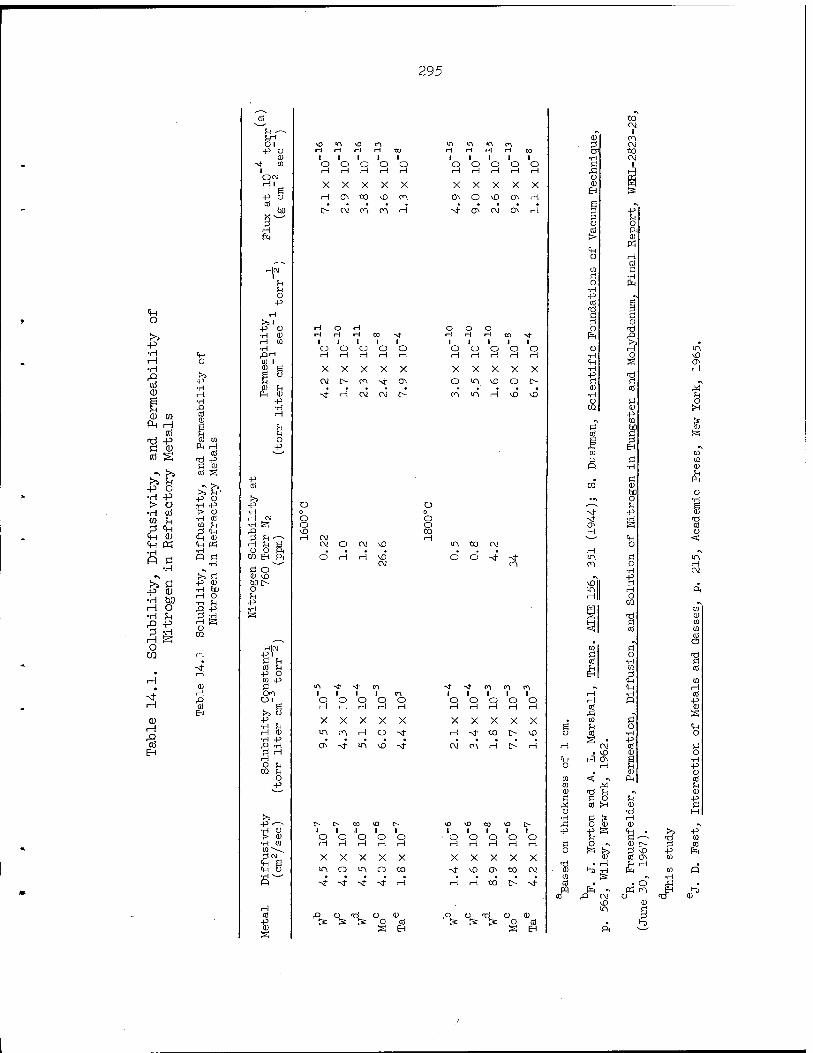
295
<H K
t>> Ö
Nt H
(D H
■3 EH
o
-P
•ri
(1)
co m ft H
cd d -P a a) Cd a
£&■ p o •ri P
O •H CO
CQ JH Si <H
<H CD <H K •H P Ö
•H
■H M rH O •H fc £> P
O ra
Nt
■3 EH
u
H ^ f-jH Ol P V
CD Nf CO
I
-P Ü cd
ho
Ü,
>>i -P o •H CD H co ■H
01 I a o
01 H PH CD
-P •H
-P CO
>> -P •H H M •H fe
rH h a O O ft ra EH ft
Ö o^ CD v£> Mr- o ^1 p •ri
H|C\J P« a u cd fn -P O CO -p
Ol a
■H U H 0)
O H CQ fn
O -P
P^ •H Ü > CD •H CO CQ^-~. SiCM ft S ft O
cfl p
CD a
H rH H rH to
o H
o rH
o H
o rH
O H
X X X X X
H a\ 00 vO CO
I> CM co co H
H O H
rH H CO ••*
o rH
o H
O H
O H
o
X X X X X CM !> co Nt O
Nt rH CM CM 1>
CM CM
vD CM
o H
st
o rH
St 1 o H
en
O H
O H
X X X X X m CO rH o Nt
o Nt IPl vO Nt
o H
o H
o H
o H
o
X X X X X ITl o m o to
Nt Nt Nt Nt H
^ o % Ü o a
CD cfl
EH
o o 00
to CM
1 CD co
ir\ in ir\ en Si CM H rH H rH CO
1 1 1 1 1 •H to CM
o o o o o Ü 1 H H H rH H rC l-H
X X X X X Ü CD
EH 0 >
O O vO ON H
■St Ov CM O H si o
lg o
CO
C O •ri
■P cd
a 3
o ft CD K
H cd a
•H
a CD
o o o o ■d H H H to -4-
1 1 I 1 1 Ix, ^ o o o o o o H m
H rH H rH H ■ri o vO 1H a CJv
X X X X X ■ri ■P -d
rH
O in vO O t> Ö a «^ CD cd M
CO IT\ H vO vO •ri u O a o
Ü2 CD >H p ^ en ii
g> CD
Si EH ^
CO CO
a a •ri CQ
CD
a Ä CQ CD
bD O • •\ o •ri *—^ ^H a Nt P CD Nt El ■d OV 0 cd rH o CH <
in oo CM O • ■ ■ rH ^
O O Nt Nt in a m CO en o
■ri p
rH CM
vojl Si • m H ft rH o
CQ p£j CQ 2>j d CD
3 a cd
CQ
CQ
. ^ S CO a Ö o ■Ö cd •ri a
EH CQ
Si cd
CH CD -* -d- m tn en •s CH H
1 1 1 1 1 H •ri cd o o o o o H P p H H H H H cd CD
Xi -s a X X X X X • CQ a a fH o CH H st to t> vO 8 cd •ri o
■ • • ■ • a • p CM CO H C- rH H CM cd a
• vO CD o ft l-H OS Ö •H O H fj P
■ CD Ü CO << -< ft Cfl CO M M CD <d ?H »v CD a a o ^1 P M cd >H CD a t) d H
•H a ^ rH VD VO to vo r> A O CD CD ■s
1 1 1 1 1 -P -p & <H >> p o o o o o ^ a -—- d CQ rH H H H H Ö p - CD L> si cd
O s s Si vO P fii X X X X X CD cfl OS co
Nt vO O to CM <d
CD £ rH CQ P
CO & •N -ri H H 00 l> st cd • O Ä
«f P CM VO m
^ ^ CD^
CD
a A o__ "Ö O CD Si
& & Js o cd • l-D g EH ft

296
calculations of weight loss based on the original geometric area would
show an increase in evaporation losses with an increase in stress. Since
specimens stressed at 2000 to 2500 psi contracted about 0.08$ in 1000 hr,
creep strain does not appear to be responsible for increasing the surface
area.
^Specimens with nominal thicknesses of 0.007, 0.012, and 0.030 in.
were creep tested in high vacuum at 785°0 and stress levels of 2100 to
15,000 psi. At a given stress, the thinner specimens were weaker because
a larger volume fraction of the alloy was influenced by the evaporation
losses. 1 This behavior is illustrated in Table 14-.2.
Table 14.2. Effect of Specimen Thickness on the Time to Produce Vfo Plastic Strain in Haynes Alloy No. 25
at 785°C and Various Stresses in High Vacuum
Specimen Time (hr) to 1$> Strain at Given Stress (psi):
Thickness, in. 15,000 10,000 5,000
40 460
53 600
200 4500a
Extrapolat ed.
(Development of Age-Hardening Refractory Alloys I(C. T. Liu)
'The purpose of this task is to develop age-hardening refractory
alloys containing a uniform dispersion of fine particles throughout the
matrix.] We are studying the binary alloys listed below:
^Fb-^O wt io Hf Mb-53 wt $ Hf Nb-70 wt $ Hf Ta-29.5 wt $ Hf Ta-50.3 wt $ Hf Ta-35 wt $ Hf Ta-19.6 wt $ Zr Ta-24.6 wt ^ Zr |
0.007 10
0.012 14
0.030 24
Uf ^

297
The aging characteristics of the Wo-53 wt <fo Hf, Ta-50.3 wt $ Hf, and
Ta—65 wt $> Hf alloys after oil quenching were reported previously.
In the literature, two types of Mb—Hf phase diagrams are reported:
one contains the miscihility gap,2 and the other does not.3 Our work
supports the miscihility gap. In order to further confirm the existence
of two high-temperature phases, we heat treated several specimens of the
Nb—Hf alloys listed in Table 14.3. We found that the rate of precipitation
1C. T. Liu, Fuels and Materials Development Program Quart. Progr. Rept. June 30, 1968, ORNL-4330, pp. 345-349.
2M. A. Tylkina, I. A. Tsyganona, and E. M. Savitskii, Russ. J. Inorg. Chem. 9, 893 (1964).
3A. Taylor and N. J. Doyle, J. Less-Common Metals 7, 37-53, (1964).
Tahle 14.3. The Effect of Cooling Rate on the Precipitation of Kb-Hf Alloys
Specimen Number
Composition, wt $>
Wo Hf Heat Treatment Microstructure
47 53 Oil quenched from 1820°C, aged 3 hr at 1000°C
Uniform precipitation of fine particles
47 53
47 53
Cooled from 1820 to 1000°C in 40 sec, aged 6 hr at 1000°C
96 hr at 1700°C, heated to 1850°C for 30 min, cooled to 1000°C in 5 min, aged 120 hr at 1000°C
Partial precipitation, mixture of fine and coarse star-shaped precipitates
Essentially single phase with very small amount of coarse precipitates within and on the grain boundaries.
4 60 40 Oil quenched from 1820°C, aged 6 hr at 1000°C
Same as Specimen 1
60 40 Same as specimen 3 Same as specimen 3

298
as well as the morphology were extremely sensitive to the rate at which
the specimens were quenched (Fig. 14-.l). This is due to the enormous
number of extra vacancies, produced in quenching the samples to room
temperature rather than allowing them to cool slowly, that govern the
precipitation process.4' Since the extra vacancies produced by quenching
are not expected to change the features of the phase diagram, we believe
that the simple phase diagram reported by Taylor and Doyle3 may be a
result of an aging time insufficient to introduce the two high-
temperature phases.
A competitive mechanism of precipitation is observed in the
Ta-29.5 wt $ Hf alloy. As aging treatment proceeds, the uniformly dis-
persed phase produced by the mechanism of continuous- precipitation is
progressively replaced by the growth of the discontinuous precipitation
at the grain boundaries, as is shown in Fig. 14.2.
Thetmacrohardness data for Nb-Hf, Ta-Hf, and Ta-Zr binary alloys
are shown as a function of aging temperaturejin Fig. 14.3. The Rockwell
hardness values increase from about 20 to 60 as aging temperature
decreases from 1100 to 600°C.J The valleys between 1000 and 1200°C in
the hardness plots correspond to the temperature of the highest rate
of coarsening.
'Preliminary tensile tests of the Nb—53 wt $ Hf alloy show that the
yield strengths vary from 65,000 to 100,000 psi, corresponding to dif-
ferent heat treatments. As a comparison,5 the yield strength of un-
alloyed Kb is about 23,500 psi.j ^ 5 •?*?.,.
Thermodynamics of Spinodally Decomposed Alloys (C. T. Liu and B. T. Loh)
The existence of a miscibility gap in a phase diagram provides the
necessary condition required for spinodal decomposition. The kinetic .
parameters associated with the spinodal decomposition, however, are closely
4 A. Kelly and R. B. Nicolson, Progr. Mat. Sei. 10(3), 160-178 (1963). "~~
5H. R. Babitzke, G. Asai, and H. Kato, Bureau of Mines, Report of Investigation No. 6101, (1962).

*s:*" Y-S99I0 ^^^ . . ..__ ... . ,««*>•- ■ > .s -la»*!"-- '^W-'"
Vfl
' * "TZ . "....;■.,. _- ...._ .. . >... * . -r.. .'Ä-. .jr.. ,«u*r A > .
*■' ,-5-*'' - . A ; . • •"* ■> '
7-.' *..--".. ■ ,:
(b) H*T *"v-,; *■'■-■.■ +- •; *" * . - *i
.* <* "'• " * # Y-899II £>*.. ... . '. '.. / "4" ■
i**
;' / ^ •*
IjÄBiitiSsStiP^lilia«
^ -* ^. -^
*
*' ^ u
Fig. 14.1. The Effect of Cooling Rate on the Microstructure of Nb-53 wt $> Hf. (a) Oil Quenched from 1820°C; aged 3 hr at 1000°C. 750x. (h) Cooled from 1820°C to 1000°C in 40 sec, aged 6 hr at 1000°C. 500x. (c) 96 hr at 1700°C; 1820°C for l/2 hr; cool from 1850 to 1000°C 5 min; aged 120 hr at 1000°C. 500x. Etchant: 100 parts HN03, 50 parts H20, 10 parts HF acid.

300
Fig. 14.2, 1200°C. 750 X,
Photomicrograph of Ta-29.5 wt # Hf Alloy Aged 4- hr at Etchant: 50 parts 30$ H202, 10 parts HN03, 3 parts HF.
ORNL-DWG 68-12619
600 800 1000 1200
TEMPERATURE (°C)
1400 1600 1800 2000
Fig. 14-.3. A Plot of Rockwell Hardness Against Aging Temperature, for Nb-Hf, Ta-Hf, and Ta-Zr Alloys at Constant Time.
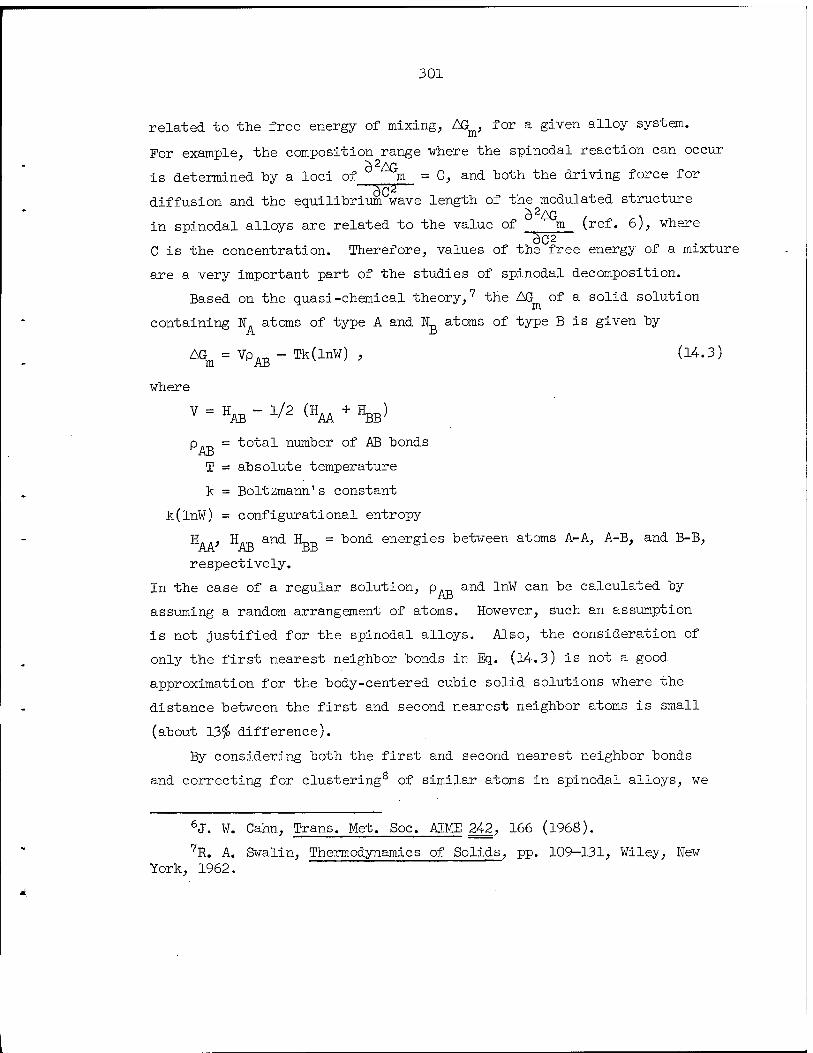
301
related to the free energy of mixing, AGm, for a given alloy system.
For example, the composition range where the spinodal reaction can occur ö^AG
is determined by a loci of m = 0, and hoth the driving force for —5c2— diffusion and the equilibrium wave length of the modulated structure
in spinodal alloys are related to the value of m (ref. 6), where ~5C2
C is the concentration. Therefore, values of the free energy of a mixture
are a very important part of the studies of spinodal decomposition.
Based on the quasi-chemical theory,7 the AG of a solid solution
containing N. atoms of type A and N atoms of type B is given by
AG = VpATI - Tk(lnW) , (14.3) m ^AB
where
V = HAB " ^ (HAA + V p = total number of AB bonds AB T = absolute temperature
k = Boltzmann's constant
k(lnW) = configurational entropy
H.., H. and H_ = bond energies between atoms A-A, A-B, and B-B,
respectively.
In the case of a regular solution, p._ and InW can be calculated by
assuming a random arrangement of atoms. However, such an assumption
is not justified for the spinodal alloys. Also, the consideration of
only the first nearest neighbor bonds in Eq. (14.3) is not a good
approximation for the body-centered cubic solid solutions where the
distance between the first and second nearest neighbor atoms is small
(about 13$ difference).
By considering both the first and second nearest neighbor bonds
and correcting for clustering8 of similar atoms in spinodal alloys, we
6J. ¥. Cahn, Trans. Met. Soc. AIME g4J, 166 (i960). 7R. A. Swalin, Thermodynamics of Solids, pp. 109—131, Wiley, New
York, 1962.

302
can derive a general equation for the free energy of mixing from the
statistical and thermodynamical calculations. The result is
AG -EHk m (ZI + Z2-l) {C(lnC) + (1-C) ln(l-C)}
Z
z2
/ c 2C(1-C) \
\ Jti + l) + (1-C)In 11-0
(> Jt
+ (1-C)In 11-0-
(■ v^
?S)} i"S)}] (14.4)
where
Z = coordination number
N=NA + NB 9./M1
f±= 1 + 4C (l-C)(e2vi/kT- 1).
The subscript i here refers to the first and second nearest neighbor
bonds (l or 2), respectively. When Vi and V2 are given, Eq. (14.4) can
be used to calculate the free energy of mixing as a function of tem-
perature and composition. The free energy of mixing, in turn, determines
the solubility of the miscibility gap for a given alloy system. Or,
alternatively, the energy terms Vi and V2 can be determined from the
critical condition of composition and temperature and solubility of
miscibility gap in the phase diagram.
We are making calculations to apply Eq. (14.4) to the decomposition
behavior of the experimental alloys of interest.
r U/ß TAJV» IWelding and Brazing Development 'IS
G. M. Slaughter
Brazing Alloy Development (D. A. Canonico, N. C. Cole)
I We have continued our efforts to develop high-temperature brazing
alloys for joining refractory metals, ceramics, and graphite to themselves
5Y. Takagi, Eroc. Phys.-Math. Soc. Japan. 23, 44 (1941).

303
and to each other.I An integral phase of the alloy development is the
determination of the mechanical properties of the alloys that have
proven acceptable in wetting and flowing experiments. We have chosen
to use the Miller-Peaslee shear test.9 Tests at "both ambient and elevated
temperatures have been completed on Ta-10$¥ and TZM (Mo-0.5$ Ti-0.1$ Zr)
hase metals in the as-brazed condition. / During the past quarter, we
have also investigated the effect of prolonged exposures at elevated
temperatures on the shear strengths of Ta—10$ W joints. 'The Miller-
Peaslee specimens were aged for 50 hr at a temperature representative of
that at which these alloys may be employed in service. Table 14.4- shows
the shear strengths obtained for the alloys investigated^ iM^ß T '4-, 4 v«. t,A\-.
As expected, the results showed a definite relationship between the
shear strength and the base metal. For instance, a given brazing alloy (?■
such as No. <4A at room temperature yielded shear strengths of 18,500 and
30,000 psi, respectively, for TZM and Ta—10$ W base metals. Brazements
on Ta—10$ W base metal were stronger at room temperature with all the
experimental brazing alloys. At elevated temperatures, the strength
advantage of the Ta—10$ ¥ base metal brazed with alloys from the Ti-V
systems (Nos. 11, 12, and 13) was not as impressive, and the brazes made
with the Ti-Zr systems showed that the TZM joints were stronger than
the Ta—10$ ¥ joints. We attribute this dependence of brazement strength
on temperature and base metal to alloying effects. Note that, on the
whole, strengths are good, even to temperatures within a couple of hundred
degrees of the melting points of the brazing alloys.
The results of the high-temperature aging studies show that the
brazes made with the alloys from the Ti-Zr systems (los. 4, 5, 6, 8,
and 9) did not weaken noticeably due to the aging treatment. In fact,
most of the brazements were stronger after aging. However, this was
not the case for the Ti-V systems (Nos. 11, 12, and 13). These alloys
all had lower shear strengths after aging. Note that although the deterio-
ration was significant, the strengths are still actually quite high. In
general, the mechanical properties of all of these brazed joints are very
attractive.'
h>M
9F. M. Miller and R. L. Peaslee, ¥elding J. (N.Y. ) 37(4), 144-S-150-S (1958).

304
v 'S;
■vi
p CÖ
CQ
t •H O *S
T) CD Isl CÖ U pq
ö o CQ
CQ CD CD
•H •d -P 3 p CQ CD
ft CQ S CD CD
•H El
CD CD ft P O CÖ
ffi CD H
H H cö ü Tj
•H Ö Ö CÖ CÖ Ä -P O Ö CD CD
<4H g O "5 CQ
-P H CQ
CD K
"st
CÖ EH
s.}
H ts cd „ -P
te£- CD Q S
-P ÖD Ö CD U P CO
?H CÖ CD
3
O in
CD <d CQ CD cö pq #
H CÖ "Ö -p CD
CD isl S cö
CD pq CQ CÖ CQ
PQ <
H cö p (D
EH CD CQ
bO i ö S
•H CD ^EH
I
Ei
O
r
-p u P cö o CQ U "-' 0 CD
EH ft
b0 Ö -P ^
•H Ö O P -H o H O ~—- 0 PH
>5 O Ö H O H -H < +s ^
•H 1^- UO CQ ö S if •H ft P N S ' CÖ O u o pq
!>» o O -H H P H CÖ <; ü
•H bD<H Ö -H ,j-
•H P fe N Ö CÖ CD IM -C) pq H
CD
O
X
O H
X
o cn
CM
m o CM
in o "st
!>
r^ N!- st ^o m m Nf H
to cn
in
CM n n m co
Ni" m t> o m c\! N}- n ON C\i O H
m Nf \0 >n
O ,a H O
CM X
• o H
CN,
in in vo CM CM
vO O vO H to O vO ON ON H H m H CM -vf- cn H H
O O O o o o o o o o o r> m m m m C ) C i m in C ) o CT o CM CM CM CM C J C ) CM CM C1 o o O H H H H H H H H H H H H
cö O O O EH m EH m EH o fi N w N ft; g
H i—l i—I
o o o o o o H H
O O O O O Ö^iJSiJOE^OEHm PHCMCEJOWOWOKCM
H H H H H
O m m
CÖ EH o H
tsl m
m CM m H
cö EH in
1 u
tsl m CM
o o o o o m m m in m m !> CM in CM o CM m H H H H H H
t t •H EH
•H EH
•H CQ O <^ ^ /, L N N ON O
f t •H •H H H
CD
IS] vD
t •H EH
O
l tsl iPi
T •H EH
pq
1 ON
t •H EH
O
t T •H EH
■st pq <; < pq o pq pq
in vD to ON o H
H H
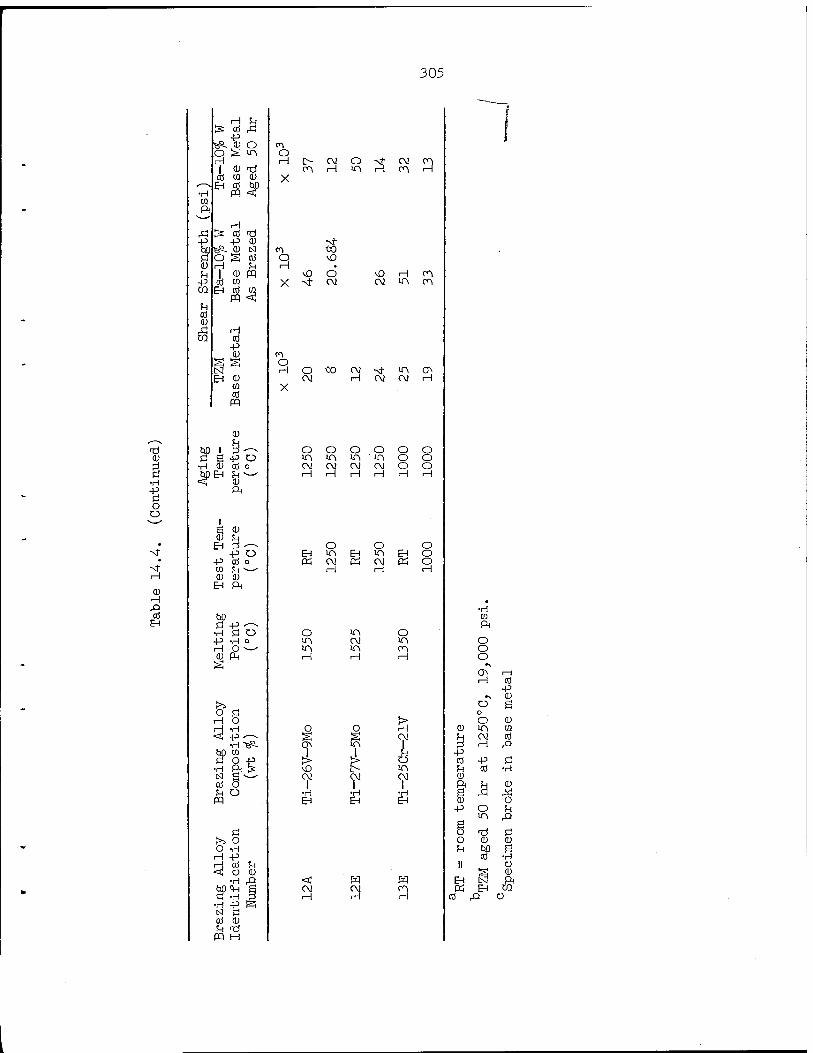
305
-d (D
g •H
■s O o
Ni-"
■s EH
tP- a; o o S m H
I <u -d cö ra a>
bQh£-
H CO <d
(U CD N S cö
5H
H cd -p (Ü
CU to CO
fin i ^-^ s S -P Ü H CD cri 0
# bH 5-i
CD Pi
1 SFi (D CD R u
-p o •P crt o CQ 5H — 0! CD
EH PI
M ö -P ^-^
•H Ö O -P •H o H () *- ' 0) (-M S
>> o Ö H () 5! •H
-P •H-«*.
•H
01 O 12
N H III o 5H c)
P-)
Ö i>> Ü O •H H -P
s! CO o •H ^
bo <P a •H 3
•H -P fe IS! Ö cri (1) 5-1 T-J W H
O
X
<*1 o H
X
o
X
cn CV O
in 3 CM 0^ s
NT d CM
\Q H cv in
en 0~>
o co cv
o in
o
•H
CM H
3
CV Nf m ON H CV CV H
O O O O O O in in in m o o cv cv cv cv o o
H H H H
O D O H in H m H C > K cv « CV W C )
H H H
m o cv in m H 3
CV
5 CM
o m
•H CQ Pi
r> o o
•N
ON H H cd
■P «\ <U O a o O 0)
(!) m CO
& cv cri H r"
•P cri -P Ö U cri •H (1) PH 5H CD Fi Ä ^1 (1) C)
•P C) u m £>
Ö -d 0 CJ (IJ (IJ 5H bo ß
cri •H II *?
o (1)
H LN! PH « H (JJ
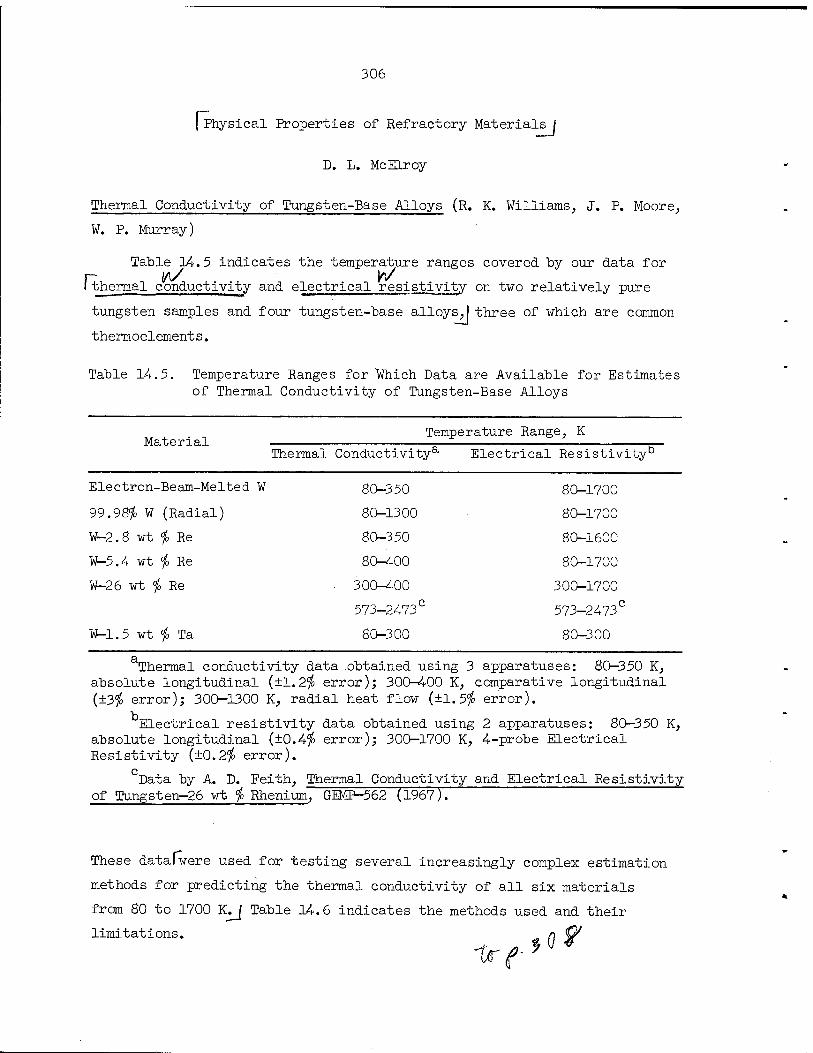
306
( Physical Properties of Refractory Materials i
D. L. McELroy
Thermal Conductivity of Tungsten-Base Alloys (R. K. Williams, J. P. Moore,
W. P. Murray)
Table 14.5 indicates the temperature ranges covered by our data for
I thermal conductivity and electrical resistivity on two relatively pure
tungsten samples and four tungsten-base alloysJ three of which are common
thermoelements.
Table 14.5. Temperature Ranges for Which Data are Available for Estimates of Thermal Conductivity of Tungsten-Base Alloys
Temperature Range, K Material - r—
Thermal Conductivity8, Electrical Resistivity0
Electron-Beam-Melted W 80—350 80—1700
99.98$ W (Radial) 80-1300 80-1700
W-2.8 wt $ Re 80-350 80-1600
W-5.4 wt $ Re 80-400 80-1700
W-26 wt $ Re ■ 300-400 300-1700
573-2473° 573-2473°
W-1.5 wt $ Ta 80-300 80-300
^Thermal conductivity data obtained using 3 apparatuses: 80—350 K, absolute longitudinal (±1.2$ error); 300-400 K, comparative longitudinal (±3$ error); 300-1300 K, radial heat flow (±1.5$ error).
Electrical resistivity data obtained using 2 apparatuses: 80—350 K, absolute longitudinal (±0.4$ error); 300—1700 K, 4-probe Electrical Resistivity (±0.2$ error).
Data by A. D. Feith, Thermal Conductivity and Electrical Resistivity of Tungsten-26 wt $ Rhenium, GEMP-562 (1967).
These datafwere used for testing several increasingly complex estimation
methods for predicting the thermal conductivity of all six materials
from 80 to 1700 K^J Table 14.6 indicates the methods used and their
limitations.
■Urf . ?"

307
CQ
0 -P
CO g
•H -P CQ
>> +3
+3 ü
Ö o o H CO
0
EH
?H o
d 0 CO
E> CQ CO H 3
o
vO
sl- H
■3 EH
Ö O •H -P cd •p •H a
•H l-H
0 -P CQ (U
EH
o
JH 0
8=3
ft CQ
Ö CO
-P
Ö o Ö o ft d ö CO
o -p
is a
<t:
.0) rd ,£> 0
o a) ö H >3 CD
lö
^3
H I
a EH
o
J2
o +3
H H cd cd
a< a1
0 (D
0
<! a
EH
CM
0 I Ä
Ö -P •H
<H Ö O
0 +3 -P ?H |S
o d ft SH 0 CQ O o a cd cd
,Q +3
o CQ
Ö O Ö
•N O CQ & £ 0
ft H SH O 0
-p o
l-H CQ 0
0 -P •P tdÄ
S CQ H -H cd -P Ä H !Q Ü 01 0 -H 0 Xi
>? > -P H O -P » Ö Ü CQ
0 >: U U O O
CQ •H
H Cd
n >> •H o -p H ?H H o cd ft -P 0 3 o r" •H
-P •\ ■P •—s cd
|3H <)
T) II G
cd <
Q. i-l
Ä a •P 0 O ^ P is
JH |S 0
-P fH H u cd
CH -d
-P H •H 3 <+H <>
Ä -P 0) Ö 0 +3 H a H 0 0 •p O n £ o
o
d 0 fH 0
s cd
0
o
ö o
•H -p U O ft 0 O
•H +3 -P cd H
d
cd
hH bo Ö
CQ -H
£ £? o o H H' 5 cd
n Nt"
>, o EH H H IS 12 cd Q.
0 (1) Is B Ä << R CM -P ft w •»V
CH & <»H C\! C) o > ■eP-
>> m !>;, to -P «0 -P
1 •H H • -H O H
> > ON vH
H-> o •P X CQ fn CQ
■H <q o -H en CQ r< CH CQ •>t 0 0 -tf ^ U O !H • •H •H CM H •P -P H
cri cd cd cd *\ o ?H fn ü +5 •H • vH •H ?H ISl N M
M S -P Ö fi +> •H o rrt cd ü
•M-H. 0 U ^^ 0 H PH
9S CD 1 i 0 a ö
-p 0 Ti a ö d cd <H 0 cd cd 0 SH U 0 0 & g e ^ ft g CQ <rl >d CQ 6 B cri •H •H cd 0 o 0 <l> 0 0
EH 03 S & IS S
II II II II II II
O EH i-H Q. i-H ^c?
-p cd
ü ö 0
g

308
uifX f**-
¥e found formula 5 (Table 14.6) to be the most satisfactory of those
listed. 'Calculated and experimental thermal conductivity data are com-
pared in|Table 14.7 and'Fig. 14.4. The estimation technique] which 4"
was developed from two different approaches to separate the phonon and
electronic thermal conductivity components,l0"gives reasonably good values
for the tungsten-base alloys, but further efforts may be justified. /
The two main areas for further study are (l) optimizing the parameters „1,
for better calculations at low temperatures and (2) obtaining high- """""~~
temperature thermal conductivity data. Attempts to accomplish this are
described below.
10r JR. K. Williams and W. Fulkerson, "Separation of the Electronic and Lattice Contributions to the Thermal Conductivity of Metals and Alloys," submitted to the Canadian Journal of Physics September 1968.
Table 14.7. Comparison of Estimated and Experimental Thermal Conductivity Values
Temperature (°K)
Percent Differenc a
EBMb ¥ 99.98$ W ¥-2.8$ Re ¥-5. 4$ Re ¥-26$ Re ¥-1.5$ Ta
100 +2. 99 +0.06 +14.8 +5 .1 +17.4
300 -2 2 -0.08 + 3.0 +3 .2 +3.4 + 2.9
500 -0.16
700 -0.28 -10.3
900 -0.10 -4.9
1100 +0.06 -0.8
1300 +0.26 +1.5
1500 +3.5
1700 +5.1
I calc — ̂ ^Iv inn A expt 7
Electron-beam-melted

[/vU- ■AMJ t M ~ ^
309
DWG 68-12015
2.5
2.4
2.3
2.2
2.1
2.0
1.9
1.8
To> 1.7 <o
'E 1.6 U
>- 1.4
o
Q Z o o
ÜJ X H
1.3
1.2
1.1
1.0
0.9
0.8
0.7
0.6
0.5
0.4
0.3
0.2
0.1
1 I 1
DATA
ESTIMATE FROM ELECTRICAL RESISTIVITY
\
\v \ V \ ' \\
-E.B. MELTED TUNGSTEN <"" L*—
X" 99.98% TUNGSTEIS
"^v ■^
N ^A
s "V >^ s >.
/ ^v -~w. 98.5^1.5
X^ ^
•—** "te^^
"■■*-- —-- —W972 Re z 8 """"■*- -^ -- .
-
„--; —T — -
-W946Re5.4
/ -—r= -_-- ;
GE -NM DO- -- --" —■"**■
^ w74 Re 26
< V -•OF :NL
200 400 600 800 1000 1200 1400
TEMPERATURE (°K)
1600 1800 2000
Fig. 14.4. Thermal Conductivity Measurements and Estimates of Tungsten and Several Tungsten-Base Alloys.
310
Development of a Thermal Conductivity Method Using Electrical Heating
(K.-H. Bode, R. K. Williams)
Our vacuum radial heat flow apparatus is being altered to develop
a method to determine thermal conductivity from an electrically heated
wire. We hope this will yield needed electrical resistivity and ther-
mal conductivity data to 1700 K on electrically conducting samples that
are small relative to radial heat flow specimens.
The following is the abstract of a paper11 presented this quarter:
When the ends of an electrically heated wire, placed in vacuo and surrounded by walls at uniform temperature, T_, are held at the same temperature, T (T < T ), then a certain current can be found such that the temperature distribution is isothermal over the total length. Starting from these conditions, the thermal conductivity can be determined by variations of either currents or temperatures. Using the one-dimensional heat conduction equation for a current carry- ing wire, twelve exact relations for the thermal conduc- tivity have been obtained in terms of measurable quantities. The thermal conductivity, the electrical resistivity, the thermal expansion, and the heat losses from the free sample surface, are assumed to be arbitrary functions of tempera- ture only.
When used with a single experimental arrangement ther- mal conductivity values can be determined in different ways. In addition, this arrangement allows thermal conductivity measurements using solutions derived by others, thus af- fording a comparison of different methods.
K.-H. Bode, "Possibilities to Determine Thermal Conductivity using New Solution for Current-Carrying Electrical Conductors," paper presented at Eighth Conference on Thermal Conductivity, Purdue University, Lafayette, Indiana, October 7-10, 1968.

311
Previous reports in this series:
ORKL 4330 Period Ending June 30, 1968
L
313
ORNL-4350 UC-25 — Metals, Ceramics, and Materials
INTERNAL DISTRIBUTION
1-3. Central Research Library 62 J. R. DiStefano 4-5. ORNL - Y-12 Technical Library 63 C V. Dodd
Document Reference Section 64 R. G. Donnelly -20. Labor atory Records Department 65 D. A. Dyslin 21. Laboratory Records, ORNL R.C. 66 w. s. Ernst 22. ORNL Patent Office 67 J. H. Erwin 23. G. M. Adamson, Jr. 68 K. Farrell 24. T. E. Banks 69 J. s. Faulkner 25. J. H. Barrett 70 J. I. Federer 26. S. E. Beall 71. D. E. Ferguson 27. R. L. Beatty 72. R. B. Fitts 28. R. J. Beaver 73. B. Fleischer 29. M. Bender 74 B. E. Foster 30. R. G. Berggren 75. A. P. Fraas 31. D. S. Bi Hingt on 76. J. H Frye, Jr. 32. E. E. Bloom 77 W. Fulkerson 33. A. L. Boch 78. L. C. Fuller 34. E. s. Bomar 79. T. G. Godfrey, Jr. 35. B. S. Borie 80 J. M. Googan (Y-12) 36. D. T. Bourgette 81 R. J. Gray 37. G. E. Boyd 82. W. R. Grime s 38. R. A. Bradley 83. A. G. Grinde11 39. R. J. Breeding 84 H. D. Guberman 40. R. B. Briggs 85. D. G. Barman 41. R. E. Brooksbank 86 W. 0. Harms 42. W. E. Brundage 87-89. M. R. Hill 43. D. A. Canonico 90 N. E. Hinkle 44. R. M. Carroll 91 D. 0. Hobson 45. J. V. Catheart 92 H. W. Hoffman 46. A. K. Chakraborty 93 R. W. Hort on 47. Ji Young Chang 94. W. R. Huntley 48. D. L. Clark 95 H. Inouye 49. G. w. Clark 96. D. H. Jansen 50. N. c. Cole 97 J. D. Jenkins 51. K. V. Cook 98 W. H. Jordan 52. w. H. Cook 99 G. w. Keilholtz 53. G. L. Copeland 100 R. T. King 54. W. B. Cottrell 101 R. L. Klueh 55. C. M. Cox 102 J. Komatsu 56. F. L. Culler 103 . J. A. Lane 57. C w. Cunningham 104 . J. M. Leitnaker 5$. J. E. Cunningham 105 . B. C. Leslie 59. H. L. Davis 106 . T. B. Lindemer 60. V. A. DeCarlo 107 . A. P. Litman 61. J. H. DeVan 108 . C. T. Liu
314
109. H. R. Livesey 154. 110. A. L. Lotts 155. 111. R. N. Lyon 156. 112. H. G. MacPherson 157. 113. R. E. MacPherson 158. 114. M. M. Martin 159. 115. W. R. Martin 160. 116. R. w. Mc Clung 161. 117. H. E. McCoy, Jr. 162. 118. H. C Mc Curdy 163. 119. R. E. McDonald 164. 120. W. T. McDuffie 165. 121. D. L. McElroy 166. 122. C J. McHargue 167. 123. F. R. McQuilkin 168. 124. A. J. Miller 169. 125. E. C Miller 170. 126. J. P. Moore 171. 127. R. E. Moore 172. 128. W. L. Moore 173. 129. C. S. Morgan 174. 130. J. G. Morgan 175. 131. F. H. Neill 176. 132. G. T. Newman 177. 133. T. M. Nilsson 178. 134. T. A. Nolan (K-25) 179. 135. K. Notz 180. 136. S. M. Ohr l8l. 137. A. R. Olsen 182. 138. M. F. Osborne 183. 139. P. Patriarca 184. 140. w. H. Pechin 185. 141. A. M. Perry 186. 142. S. Peterson 187. 143. R. A. Potter 188. 144. R. B. Pratt 189. 145. M. K. Pre ston 190. 146. R. E. Reed 191. 147. C R. Reese 192. 148. D. K. Reimann 193. 149. G. A. Reimann 194. 150. A. E. Rieht 195. 151. P. L. Rittenhouse 196. 152. W. C. Robinson 197. 153. M. W. Rosenthal
D. J. Rueker C. F. Sanders G. Samuels A. W. Savolainen J. E. Savolainen A. C. Schaffhauser J. L. Scott J. D. Sease C. E. Sessions 0. Sisman G. M. Slaughter S. D. Snyder K. E. Spear 1. Spiewak P. Spindler J. E. Spruiell W. J. Stelzman R. L. Stephenson J. 0. Stiegler D. A. Sundberg E. J. Tenckhoff D. B. Trauger R. P. Tucker G. M. Watson S. C. Weaver M. S. Wechsler A. M. Weinberg J. R. Weir, Jr. W. J. Werner H. L. Whaley G. D. Whitman F. W. Wiffen J. M. Williams R. K. Williams R. 0. Williams J. C. Wilson R. G. Wymer F. W. Young, Jr. C. S. Yust A. F. Zulliger C. M. Adams, Jr. (Consultant) Leo Brewer (Consultant) L. S. Darken (Consultant) J. A. Krumhansl (Consultant)

315
EXTERNAL DISTRIBTUION
AIR FORCE MATERIALS LABORATORY, Wright-Patterson Air Force Base
198. C. H. Armbruster 199. H. M. Burte 200. G. Glenn 201. Technical Director
AIR FORCE WEAPONS LABORATORY, Kirtland Air Force Base
202. D. Brooks
AMES LABORATORY
203. 0. N. Carlson 204. W. L. Larsen 205. M. Smutz 206. F. H. Spedding
ARGONNE NATIONAL LABORATORY
207. L. Baker 208. J. H. Kittel 209. M. V. Nevitt 210. P. G. Shewmon 211. R. C. Vogel
LMFBR PROGRAM OFFICE, Argonne National Laboratory
212. A. Amorosi 213. L. Burris 214. L. Kelman 215. J. M. McKee
AEC-RDT SITE REPRESENTATIVES
216. M. E. Jackson, Argonne National Laboratory 217. D. J. Wille, Atomic Power Development Associates 218. R. L. Morgan, Atomics International 219. J. V. Levy, General Electric, Cincinnati 220. J. F. Weissenberg, General Electric, Cincinnati 221. R. H. Ball, Gulf General Atomic 222. J. E. Hebert, Idaho 223. D. A. Moss, Idaho 224. K. A. Trickett, Idaho 225. D. F. Cope, Oak Ridge National Laboratory 226. C. L. Matthews, Oak Ridge National Laboratory 227. P. G. Hoisted, Pacific Northwest Laboratory 228. J. Sako, Pacific Northwest Laboratory 229. Atomic Energy Commission Library, Washington
DIVISION OF NAVAL REACTORS, AEC, Washington
230. R. H. Steele

316
DIVISION OF REACTOR DEVELOPMENT AND TECHNOLOGY, AEC, Washington
231. J. C. Crawford, Jr. 232. G. W. Cunningham 233. A. Giambusso 234. H. G. Hembree 235. J. R. Hunter 236. E. E. Kintner 237. W. H. Layman 238. W. H. McVey 239. J. J. Morabito '240. R. E, Pahler 241. A. J. Pressesky 242. M. A. Rosen 243. J. M. Simmons 244. E. E. Sinclair 245. A. Taboada 246. A. N. Tardiff 247. A. Van Echo 248. C. E. Weber 249. M. J. Whitman
DIVISION OF RESEARCH, AEC, Washington
250. P. W. McDaniel 251. D. K. Stevens
DIVISION OF SPACE NUCLEAR SYSTEMS, AEC, Washington
252. R. E. Anderson 253. D. Beard 254. J. F. Griffo 255. C. E. Johnson 256. J. A. Powers 257. F. C. Schwenk
OAK RIDGE OPERATIONS OFFICE
258. W. J. Larkin 259. Laboratory and University Division
ATOMIC POWER DEVELOPMENT ASSOCIATES
260. E. C. Kovacic 261. A. A. Shoudy
ATOMICS INTERNATIONAL
262. H. Pearlman
BABCOCK AND WILCOX COMPANY, Lynchburg, Virginia 24505
263. C. Baroch 264. S. P. Grant 265. . C. Johnson 266. L. Weissert
317
BATTELLE MEMORIAL INSTITUTE, Columbus, Ohio
267. W. Berry 268. D. Keller 269. S. J. Paprocki 270. Defense Materials Information Center
BATTELLE MEMORIAL INSTITUTE, PNL, Richland, Washington
271. A. L. Bement 272. J. J. Cadwell 273. T. T. Claudson 274. D. L. Condotta 275. E. Evans 276. B. R. Hayward 277. W. E. Roake 278. J. C. Tobin 279. R. G. Wheeler 280. Technical Information File
FAST FLUX TEST FACILITY, Battelle-Northwest
281. E. R. Astley
BR00KHAVEN NATIONAL LABORATORY
282. D. H. Gurinsky 283. C. Klamut
BUREAU OF MINES
284. Haruo Kato, Albany Metallurgy Research Center, P. 0. Box 70, Albany, Oregon 97321
285. T. Sullivan, Bureau of Mines, Boulder City, Nevada 89005
COMBUSTION ENGINEERING
286. W. P. Chernock 287. S. S. Christopher
GENERAL ELECTRIC, Cincinnati
288. D. H. Ahmann 289. H. C. Brassfield 290. V. P. Calkins 291. E. Hoffman 292. J. McGurty 293. J. Moteff
GENERAL ELECTRIC, Nuclear Systems Programs, Cincinnati
294. E. E. Hoffman
GENERAL ELECTRIC, San Jose
295. R. Duncan 296. H. Klepfer

318
GENERAL ELECTRIC, Pleasanton
297. H. W. Alter
GENERAL ELECTRIC, Sunnyvale
298. K. P. Cohen 299. F. Comprelli 300. R. Skavdahl 301. C. Spalaris 302. E. L. Zebroski
GULF GENERAL ATOMIC
303. D. B. Coburn 304. A. J. Goodjohn 305. J. P. Howe 306. S. Jaye 307. J. F. Watson
IDAHO NUCLEAR CORPORATION
308. W. C. Francis
ILLINOIS INSTITUTE OF TECHNOLOGY RESEARCH INSTITUTE
309. D. J. McPherson
JET PROPULSION LABORATORY (NASA)
310. J. Davis
KNOLLS ATOMIC POWER LABORATORY
311. R. F. Wojciescak 312. Document Library
LOS ALAMOS SCIENTIFIC LABORATORY
313. R. D. Baker 314. D. B. Hall 315. J. A. Leary 316. R. Perkins 317. R. E. Peterson 318. Reports Library
MOUND LABORATORY
319. R. G. Grove
NASA, LEWIS RESEARCH CENTER
320. M. Ault 321. J.W.R. Creagh 322. J. J. Lombardo 323. T. P. Moffitt 324. T. A. Moss 325. F. E. Rom 326. L. Roseriblum 327. N. D. Sanders 328. N. Saunders 329. H. Schwartz
319
NAVAL RESEARCH LABORATORY
330. J. R. Hawthorne 331. C. Serpan 332. L. E. Steele
NORTH CAROLINA UNIVERSITY, Raleigh, North Carolina 27607
333. J. Beeler 334- R. E. Dahl
NUCLEAR MATERIALS AND EQUIPMENT CORPORATION
335. C. Caldwell 336. K. Puechl
OHIO STATE UNIVERSITY, Columbus, Ohio 43212
337. M. G. Fontana 338. R. W. Staehle
RENSSELAER POLYTECHNIC INSTITUTE
339. C. B. Willingham, Jr.
SANDIA CORPORATION
340. J. Read Holland 341. J. Jacobs 342. D. R. Johnson
SAVANNAH RIVER LABORATORY
34-3. P. H. Permar 344. S. P. Rideout
TRW SYSTEMS (NASA), Redondo Beach, California 90278
345. H. Lurie
UNION CARBIDE CORPORATION, New York
346. J. A. Swartout
UNION CARBIDE CORPORATION, Materials Systems Division, Indianapolis
347. C. F. Leitten, Jr.
UNITED NUCLEAR CORPORATION
348. A. Strasser
320
UNIVERSITY OF CALIFORNIA, Lawrence Radiation Laboratory, Livermore
349. W. R. Holman 350. J. S. Kane 351. L. W. Roberts 352. A. J. Rothman 353. B. Rubin
U.S. NAVAL AIR SYSTEM COMMAND (AIR-52031B)
354. T. Kearns 355. I. Machlin
USAEC Scientific Representative, American Embassy, Box 40 FPO, N. Y. 09510
356. W.L.R. Rice
WESTINGHOUSE, Advanced Reactor Division, Waltz Mill Site
357. E. C. Bishop 358. J.C.R. Kelly 359. P. J. Levine 360. P. Murray 361. W. E. Ray 362. G. A. Whitlow
WESTINGHOUSE, Astronuclear Laboratory
363. R. T. Begley 364. D. C. Goldberg
WESTINGHOUSE, Atomic Power Division
365. T. Stern
WESTINGHOUSE, Bettis
366. R. H. Fillnow 367. P. N. Gustafson 368. Westinghouse Bettis Laboratory Library
369—590. Given distribution as shown in TID-4500 under Metals, Ceramics, and Materials category (25 copies — CFSTI)