-EIEIIEEIIEEE - DTIC
200
AADOB 530 ADVISORY GROUP FOR AEROSPACE RESEARCH AND DEVELOPMENT--ETC F/6 1/3 AY.' " 0 AIRCRAFT ASSESSMENT AND ACCEPTANCE TESTING. (U3 UIllllAlYlll UNCLASSIFIED AGAR-LS-10 N III IIIIIII -IIEEEIIEEEEE -EIEIIEEIIEEE
-
Upload
khangminh22 -
Category
Documents
-
view
1 -
download
0
Transcript of -EIEIIEEIIEEE - DTIC

AADOB 530 ADVISORY GROUP FOR AEROSPACE RESEARCH AND DEVELOPMENT--ETC F/6 1/3AY.' " 0 AIRCRAFT ASSESSMENT AND ACCEPTANCE TESTING. (U3
UIllllAlYlllUNCLASSIFIED AGAR-LS-10 N
III IIIIIII-IIEEEIIEEEEE-EIEIIEEIIEEE

I AGARD-LS108~
6A
0
o AGARD LECTURE SERIES No. 108
Aircraft Assessment andAcceptance Testing
I03
DISTRIBUTION AND AVAILABILITYON BACK COVER

AGARD-LS-108 /
NORTH ATLANTIC TREATY ORGANIZATION
ADVISORY GROUP FOR AEROSPACE RESEARCH AND DEVELOPMENT
(ORGANISATION DU TRITE DE L'ATLANTIQUE NORD)
K-- ---
AGARD Lecture Serieso. 108
AIRCRAFTASSESSMENT AND ACCEPTANCE TESTING,
I-'I
OT1
IThis document hc ex aPProefor public rekC'cs =nd $Wez: its,is uni /7t.&
The material in this publication was assembled to support a Lecture Series under the sponsorshipof the Flight Mechanic- Panel and the Consultant and Exchange Programme of AGARD, presented
on 5-6 Jujic 1980 at G 1, Norway; 9-10 June 1980 Athens, Greece and12-13 June.1980 Ankara, Turkey.

THE MISSION OF AGARD
The mission of AGARD is to bring together the leading personalities of the NATO nations in the fields of scienceand technology relating to aerospace for the following purposes:
- Exchanging of scientific and technical information;
- Continuously stimulating advances in the aerospace sciences relevant to strengthening the common defenceposture;
- Improving the co-operation among member nations in aerospace research and development;
- Providing scientific and technical advice and assistance to the North Atlantic Military Committee in the fieldof aerospace research and development;
- Rendering scientific and technical assistance, as requested, to other NATO bodies and to member nations inconnection with research and development problems in the aerospace field;
- Providing assistance to member nations for the purpose of increasing their scientific and technical potential;
- Recommending effective ways for the member nations to use their research and development capabilities forthe common benefit of the NATO community.
The highest authority within AGARD is the National Delegates Board consisting of officially appointed seniorrepresentatives from each member nation. The mission of AGARD is carried out through the Panels which arecomposed of experts appointed by the National Delegates, the Consultant and Exchange Programme and the AerospaceApplications Studies Programme. The results of AGARD work are reported to the member nations and the NATOAuthorities through the AGARD series of publications of which this is one.
Participation in AGARD activities is by invitation only and is normally limited to citizens of the NATO nations.
The content of this publication has been reproduceddirectly from material supplied by AGARD or the authors.
Published May 1980
Copyright © AGARD 1980All Rights Reserved
ISBN 92-835-0266-3
Printed by Technical Editing and Reproduction LtdHarford House, 7-9 Charlotte St, London, WJP 1HD
FOREWORD
This AGARD Lecture Series No.108 on the subject of Aircraft Assessment and AcceptanceTesting is sponsored by the Flight Mechanics Panel and organised by the Consultant and ExchangeProgramme.
The Lecture Series reviews the present state of the art of aircraft assessment and acceptancetesting of production aircraft. This particular kind of testing is needed to select, from a variety ofoffers, the best aircraft type for a mission and to check that any aircraft on the production lineis identical to the type, with acceptable tolerances.
Emphasis is placed on the practical aspects of this technique in order to help the flightcrews and organisations dealing with this activity. Flight test instrumentation methods are setforth that do not require the use of sophisticated ground and airborne instrumentation fordata acquisition or large computers for data processing. Flight test techniques describedillustrate ways to acquire acceptable results utilizing a minimum of instrumentation or noinstrumentation.
J.RENAUDIELecture Series Director
ZI
NmIG GIU&I
Avail and/or4Dist special

LIST OF SPEAKERS
Lecture Series Director: M. I'lngenieur J.F.RenaudieCentre d'Essais en Vol - SDT/CD.P. No.291220 Bretigny-sur-OrgeFrance
SPEAKERS
Mr L.P.Colburn Mr H.MaidmentAFFTC/TEEES Radio/Navigation DivisionMail Stop 239 Aeroplane and ArmamentEdwards Air Force Base Experimental EstablishmentCalifornia 93523 Boscombe DownUSA Salisbury, Wiltshire
UKMr R.Crane65 10 TESTW/TEEEP Mr D. ReedMail Stop 239 NASA Dryden Flight Research CenterEdwards Air Force Base Projects Office, Box 273California 93523 Edwards Air Force BaseUSA California 93523
USAMr K.HurrassDFVLR Monsieur C. RobertPoatfach 3267 S.F.I.M.D3300 Braunschweig - Flughafen 13 Avenue Marcel-Ramolfo-GarnierGermany 91301 Massy
France
Mr R.Poole- Flight Test Services
British Aerospace - Aircraft GroupDunsfold AerodromeGodahmng, SurreyUK

CONTENTS
Page
FOREWORD iii
LIST OF SPEAKERS iv
Reference
QUELQUES CONSIDERATIONS SUR LES PROBLEMES QUE POSENTLES ESSAIS D'EVALUATION ET DE RECEPTIONSOME COMMENTS ON THE PROBLEMS INVOLVED IN AIRCRAFT ASSESSMENTAND ACCEPTANCE TESTING
by J.F.Renaudie I
USAF DEVELOPMENT TEST AND EVALUATIONby LP.Colburn 2
SOME EXAMPLES OF PROCEDURES USED IN U.K. FOR ACCEPTANCE TESTINGOF AIRCRAFT PRODUCED BY THE AIRCRAFT INDUSTRY UNDER GOVERNMENTCONTRACT
by R.J.Poole 3
A REVIEW OF FLIGHT TEST INSTRUMENTATION SYSTEMS FORACCEPTANCE TESTING OF THE PRODUCTION AIRCRAFTEXAMEN DES INSTALLATIONS D'ESSAIS UTILISEES POUR LES VOLSD'EVALUATION ET DE RECEPTION D'AVIONS DE SERIE
par C.Robert 4
PERFORMANCE TESTING PRODUCTION AIRPLANESby R.C. Crane
EVALUATION OF LONGITUDINAL CHARACTERISTICS INCLUDING STABILITYHANDLING AND CG RANGE
by R.J.Poole 6
EVALUATION OF LATERAL AND DIRECTIONAL CHARACTERISTICS ANDSPINNING BEHAVIOUR
by R.J.Poole 7
FLIGHT RESEARCH TECHNIQUES UTILIZING REMOTELY PILOTED RESEARCHVEHICLES
by R.D.Reed 8
QUALITATIVE ARMAMENT SUBSYSTEM ASSESSMENTby L.P.Colburn 9
ELECTRO-MAGNETIC COMPATIBILITYby H.Maidment 10
CHECKING OF COMMUNICATIONS AND RADIO NAVIGATION SYSTEMSby H.Maidment I I
PERFORMANCE OF NAVIGATION SYSTEMS
by K.Hurrs 12
BIBLIOGRAPHY B

QUELQUES CONSIDERATIONS
SUR LES PROBLEMES QUE POSENT
LES ESSAIS D'EVALUATION ET DE RECEPTION
Par J.F. RENAUDIE
Centre d'Essais en Vol de BRETICNY
FRANCE
:

0 - INTRODUCTION
Mon but eat d'introduire Cotte odrie do confdrencoa conaacrdom aux
Eamais d'Evaluation et d'Admiaaion
J'ai choimi pour co faire de souligner, et commenter lea probibmem qu'il faut rdmoudre pour ac-complir cc genre d'esaai.
Me. connaismances concernant cco ujet proviennent principalement de mon expdrience do. avionsfranc~aismde tous types ; main je pence que lea questions technique. qui me poaent mont lea memoes donetoum lee paya.
Sur cea aujeta jo vain prdaenter dea iWas peraonnelles.
Copendant je dois dire, concornant lea esaaj de reception, qu'elles doivent boaucoup aux aviaquo m'a fourni Ie Groupe do Rdception, Service du CEV charg6 de cc type d'easaim.
V'al personneilement participA au program d'aasais en vol d'avionm bien connus -lea CONICORDEde adrne, mortant de Isa chains de fabrication. 11 faut dire que J'ai cii Ia charge de diriger 1'dquipedu CEV, pilotes, ingdnicurm, mdcaniciena qui a participd depuia le ddbut du programe, aux eamaimofficials d'Cvaluation dem aviona prototypeseat de prdadrie, at procddd au" anaia an vol adcessaireapour ddlivrer le certificat de navigabilitd.
J'aborderai auccoamivemont lea aujeta muivant.
- lea objectif. dea esaaj d'6valuation et do rdception- lea crithrea d16valuation- lea moyea, l'organisation~lea programmes de vol
~j. - lea eamaio do riception considdrdm commo un cam particulier des ommaim d'6valuation- lea technique. propremont dite. d'eaaaim en vol
1 -LES OBJECTIFS DES ESSAIS D'E VALUATION ET DE RECEPTION
Ce. objoctife no mont pas lee meme a pour be conatructeur d'aviona et le client qui veut en acheter.
Qualm mont la objectifa do la soci~t6 qui conatruit et vend un avian ?
-Pour le Directeur do. Ventem le but 6vident dam vol. dommsaim eat do prdbenter l'avion au clientde manilbre IL monter on 6pingle mom meilleurem qualit~s.
Do tel. vol. d'eaaaia mont do prdf~ronco ontropria I partir do la Base d'Emaaim du Vendeur, maimaummi assez mouvont b, partir do Basos A46riennes du Client. Ce sont cam vol. qui mont appelda "'vola d'd-valuation" dana ce texte.
-Pour be service du controle do qualit6 du conatructaur.
Lea yolu d'essaj qui mont important. mont ceux deatinda A atteindre lea objectifa muivanta
-vdrifier qua toum lee avions qui sortent en s~rie ont lea memo. performances, et bin meme.quabitdm qua lavion de "typo" avoc des toldrancem acceptable.
-v~grifier quo lea ddfauta ddcelda mont mineura, peuvent 8tro aiadmont 61imin~s, et be mont fina-baent.
Dana cc texte do Cola vol. mont appel~s voim d'admiaaion
-Pour be client lea objectifa ne mozit pam tout X fait lea memos.
La premilire question & aborder eat cello de mavoir de quob client il a'agit.
11 y a ume diff~rence fondamnentale entre celui quo J'appeblerai Ie "Principal Client" at leaautran.
La "Principal Client" oat gdralenent Ie Miniatira de la Ddfenae do Ia Nation du Conatnuc-tour, qui *at potontiellomont l'acheteur d'un grand nowbra d'avionm a'il. matiafont aux obligation. damopfcifications (performances at missions), Queiquefoim Is conatructour prend Is risque de construire atmettre au point un avion sur ma fonda proprem ; plum mouvent une aide partiolla eat fournie A Cotta"laventure privie" par Ia Nation ; pour 'in certain ncmabre de projeta uzne aide totals eat donnde auconstructour dopuim I* d~but abee d. Ia conception at de Isa mime mu point, on un pan plum Card, mur de.contrflts pasE. avec 1U Hinistbre do Is Woene.
Dana cc dorniar cam Ie "Principal Client" eat le maul qub pout jouer un r~be actif dana chacune de.multiples phases du programme, dopuis Is Icr vol Jusqu'& I& Uvraimon du lor avian do s~rie;

1-3
Sduftaleuent, quelquo vote d'ivaluationBout ef fectuda & chaque phase du program* par la pilotesdemmaim du lMiniethre do 10 Difense (en France ceux du CEV), de manibro I re:.dre coupto des progrbmrialisda et du bon oumploi dos denier. de Il'Etat.
Do toe vol. d'!valuation ne mont pas meuloment demandi. par le "Client Principal" patronnantet mubventionnant un programme, maim aummi par 1. constructeur lui-meme, do manibre I virifior quela mime au point eat conduite do manibre I parvenir ausmi prbm quo posmible des exigences du client.Quand plumieurs concurrents sont our to mimne programmei do toe vole mont easentels pour eux pour"rester dans Ia course" Jusqukl l'!tape finale, quand 1e choix du typo qui sera command!6 eat fait.
Lee clients autrem quo 1s "Client Principal" par example lee pays 6trangers.lormqu'il slagit d'avionm militaires, ne sont pas done tine situation lour permettant d'obtenir do. infor-mation. comp~tem mur la mime au point ot lin progrbm rgalixs mon direction do. performances op~ra-tionneleu.
Pour com "autrom client." lem bemoins mont lee muivantm
- Evaluer plumiourm typos d'avionm do manibre X choisir parmi ewc celui ou ceux qui matimfont lemioux leur. exigencem. Puim n~gocior tin contrat avec le conmtructeur pour acqudrir 1. nombre .ouhai-ti d'appareilm.
- Accepter chaqu c appar oil livr6 au. titre du contrat ; ceci veut dire :faire ex~cut or e m vote
2 - LES CPJTERES D'EVALUATION
Co. critibres diffbrent muivant lea mismions quo doit accomnplir l'avion ;la liate suivante donnetine idde do. variation. pommiblem des type. d'appareilu muivant lem mimsionm
- avian Idger pour utilisateur priv6- avion "exdcutif"- avian do transport civil
- va ecombat, haute altitude-bombardier
- avion do p~n~tration, basse altitude- avian de reconnaissanice- avion embarqud- appareil. I voilurem tournantem- VSTOL
Il n'emt pa. n~ccssaire do s'dtendre our lee diffdrencc. entre chacune do. missions pr~sent~esci-dosmum.
Une fain choisie Ia cat~gorie d'avion corrempondant k la mission, un certain nornbre do criaremdoivont etrc prim en compte. Pour lacheteur dont le budget est limit46 (et tous lcm budgets, merme lee
plus 6elvis mont limitds) 1cm premierm points N consid~rer mont d'ordre financier:
- codt do chaque unit! I l'achat- codt corrempondant I ha durdo do vie do chaque unit6- cadt do maintien on dtat op~rationnel.
L'incidcnce our coo crit~rom do Is mimplicit6 technique eat 6vidente ; parmi lee 3 critbrem ci-dom-mum Ie dernior no pout 8tro 6valvd sans quelquos esmaim on vol, mais tons mont reli!. aux considdra-tions muivantem qu'ih faut gardor k l'omprit pour bitir tin programme dlessais en vol d'46valuation
- typo d'opdration envisagE vol I vue, vol toutes condition. rn~tdorologiques, vol do jour ou donuit.
- confort do 1'Equipago compte tonu do Is durde et des caractdristiques do la mimsion.I- confort dos pammagerm (4ventuellement) et bruit.niveau do mcuritd IL amurer en relation avoc lem rbglomentm de navigabilit6 applicable.
- limitem du domaine do vol (I haute et basso altitude).- qualitdo do vol.- maniabiliti.- complexit46 do hlavion, do som wyethmes fonctionnem et opdrationnels.
et, dernilbre considdration, maim non Is moindre
- oo performances correspondent IL la mission.

1-4
3 - COMPLEXITE CROISSANTE DES AERONEFS
Cleat un des probl~lmes rnajeurs I surmonter pour 6tablir un programme d'essais en vol d'6valua-tion et de rokeption tenant compte de tous les critbres , sans pour autant gaspiller lea heures de vol,qui doivent etre strictement limit~es pour des raisons 6conomiques.
Tout en permettant le nombre maximal d'observations ou meaures chaque vol doit etre construitde manjbre b, utiliser le moins de temps possible. Une charge de travail 6quipage trbs 6levie eat carac-t6ristique de ce type de vol dlessai.
Une bonne image de la complexit6 croissante des aviona d'aujourd'hui est donnde par la figure Iqui donne le nombre de paramn'tres enregistr~s pendant la phase de misc au point de divers avions pro-totypesa.
L'emploi de tels syst~mes dlenregistrement I capacit6 6lev6e West pas envisageable pour lea es-sais dl6valuation ou de r6ception ;f on n peut utiliser que des systbmes plus modestes ;une des conf6-rences de cette adgrie sera conaacrde hL ce sujet. De toutes fagons on doit rdaliaer que Ilinformation pri-maire eat celle que peut ramener l'd6quipage lui-meme. Ce aystbme d'enregistrement ne peut etrequ'une aide pour Ildquipage ; en outre il va sans dire que dana de nombreux cas les 6valuationa en volmont faites sans laide d'aucun matdriel sp46cialis46 d'easai ou d'enregiatrement, en utilisant lea instru-ments de bord standards.
4 - MOYENS. ORGANISATION, et PROGRAMME des VOLS d'EVALUATION
B~tir un programme de vols d'4valuation couvrant tous lea points importants aussi efficacementque possible dans le temps de vol minimum nWest pas line tache facile.
Momns on dispose de temps de vol, plus ii en faut pour prdparer le programme de ces vols.
Pour accomplir cette tdche de prdparation puis d'ex6cution des vols, il existe de nombreux typesdorganisation ; presque toutes reposent sur la ddsignation d'une 46quipe d'essai responsable de chaquetype particulier d'avion.
Cette dquipe de pilotes et inglinieura eat ddsignde par le client ;il lui correspond une 4quipe si-milaire ddsignde par Is conatructeur ;lea deux dquipes travaillent en Atroite coopigration.
Aux U.S.A. cette 6quipe eat appelde "Joint Test Team".
Chacune des deux 6quipes comprend
- des pilotes et 6quipages d'essais ; il eat avantageux d'associer hL un pilote d'essai spdcialistede la navigabilitg un pilote ayant une exp~rience opdrationnelle des missions ddvolues hk lavion. 11 exia-te parfois des pilotes exp46rimentda compldtents dana ces deux domaines.
- des ingdnieurs navigants d'esaais et spdcialistes des essais.
- des experts de la conception, de la maintenance, des opdrations ; si de tels experts nlexistentpam dana l'6quipe du client, il faut assurer une liaison 6troite avec lea divers spdcialistea du construc-teur, par l'intermd~diaire d'un reprdsentant du bureau d'6tudea.
Pour 6tablir le programme des vain, deux aspects doivent etre pris en considdration
- cclix relatifa X 'avion- ceux relatifa A Ilenvironnement opdrationnel de la mission et aux moyens d'essai hL employer.
(a) points relatifs l l'avion lui m6me
Lee taches suivantes doivent etre accomplies
- une analyse des exigences de la mission afin d'identifier lea plus difficiles I matisfaire.- une analyse de toutes lea tachem opgrationnellea ddvolues k llavion afin de choisir lea plus utiles
et lea plus difficiles.
-une comparaison deg; points critiques trouvda avec ceux identiftis sur dlautres types dlavionaayant la m~ine mission, ou des missions similaires.
-un examen critique des rapports d'easais en vol qui ont pu etre obtenus du constructeur et/ou du"Client Principal". Cle at line pratique courante de tranamettre certainm de ces rapports au client lora-qu'ils ont trait A une caractldrimtique particulibre ou originals de lavion de type.
-un examen critique de toutes lea autres sources d'information, telles que rapports d'autresclients m'ila mont d'accord pour lee fournir.

(b) points relatifa X l'environnement op6rationnel de la mission et aux moyena d'essais associds.
Ce sont lea suivants:
- lea conditions climatiques spdcifigea dictent lee lieux gdographiques ob. lea vol. prendront placequand lea conditiona extr~mes doivent pouvoir etre support6es par 1'avion, (par exemple climat tropicalsec ou climat polaire) i1 sera gdndralement ndceaaaire de r~partir lea vol. entre pluffiours a4drodr~meset eapaces adriena, ceux o4 existent X la foin lea conditiona mdttdorologiques recherchas et lea moyensd'essai ad~quata (le besoin de moyena de trajectographie eat un exemple des difficult~a de ce genre Iaurmonter. )
Lea vols pouvent devoir etre r~partia entre l'adrodr~me du constructeur, une base a6rienne repr6-sentative des conditions mdt6orologiques. et quciquefois uno baae d'esa importante dotde do moyenspuissants et sophistiqu6a qui feront gagner du temps.
- la n46cessit6 d'esaayer 1. systme d'armes dicte l'emploi d'un champ de tine o& lea armes pour-rant etre mims. X feu, avec tous lee moyena associ6s de trajectographie on de s6curitg. Par exemple,en France, tous cea easais sont exicut6a au Centre d'Easais en Vol de CAZAUX, otL plusieura champsde tir jouxtent Iladrodr8me ; en outre CAZAUX me trouve b. c8t6 de la grande baae d'essais do missilesair-air n~cessitant un grand eapace adrien o'exidcutent avec loe moyena conjuguds du CEV de C.AZAUXet dui CEL de BISCAROSSE.
II eat utile de faciliter le travail de 1'46quipage pour chaque vol par un moyen d'enregistrementpar exemple un enregistreur vocal.
- dana certains cas il eat n~cessaire de disposer de mat46riel d'enregiatrement de prime de vue ci-ni6matographique ki grande vitesse, pour perrnettre l'observation diff~r~e de ph6nomlnes trop rapidespour 1' observation visuelle directe.
- ii faut ddcouper le programme en un nombre raisonnable de vol. compte tenu de la durde totalede l'6valuation.
5 - EPREMVS D'A1MSS!ON
Par dp~reuves d'admission on ddsigne une adrie de vols d'essais ayont un but particuliercontr~ler lee qualitda, ddfauts, ddficiences dtun avion particulier d1e adie compard A leavi on derdfdrence, appeld "avion de type".
Pour executer ces essais, il eat possible d'utiliser lea memea nioyens et Ia meme organisationquo ceux ddcrita ci-dessus.
Dana cc can particulier, la. tAche n'est pa. aussi vaste et lea crit~tres sent momns nocibreuxpuisqu'il s'sgit seulenont d'une comparaison entre
- l'avion de typo et- un avian particulier de Ia chaine de fabrication.
La connaissance do Ilavion do type a'aquiert progressivement I partir du moment ott Pon a common-c6 X faire l'6valuation prdliminaire au choix do Ilavion ; ici encore le "Client Principal" a uno meilleureconnaissance do Ilavion.
Cette connaissance permot d16tablir une liate compl~tt des points critiques I vdnifier ; une s~lec-tion doit ftre faite dane cette hiate pour optimiser 1'efficacitg des vol. do rdcoption, ce qui aignifie
- effoctuer Is plus grand nombre possible des vdrifications lea plus importantos.- rdiire 10 temps de vol autant quo possible pour minimiser le cofit.
* Lorsqu'il y a un grand nombre a'avions commandds Ia rdponse k co problbme difficile conaiste kutiliser deux types de programme do vol.
-un programme trb a complet qui sera appliqu6 seulement Acertains avions choisia sur Ia chainedo fabrication ; par certains exemples, si 100 avian@ ont 6td command6s, ces essais seront faits sur leeavian* 10, 20, 30 etc... et demnanderont 5 k 6 vols par avion (en FRANCE ces avions s'appellent "lavionsdo lot".)
- n programme rddult, d'un ou deux vols, pour chacun des autres avians.
Pour dtablir carn doux programmes une connaissance aussi approfondie quo possible de 1'avion dotype ost nicossalre. C'est-pourquoi lea services d'Essais en Vol du "Client Principal" sent I& encoredan. une situation beaucoup plus confortable pour faire ce travail, puisqu'ils ont eu pour titcho d'obser-von et souvent surveiller I. Edroulement du programme d'essais en vol depuis Is prototype jusqu'au pre-mier aviani do pr~s~rie on sirie ; Ils sent bion informis des ddfauts particuliers k lavion, des remlidos

1-6
1 ces ddfauts, et des caractdristiques lea plus "marginales" de l'avion de type.
Cleat en particulier le cas du "Groupe RMception' frangais dont le travail particulier au Centred'Essais en Vol eat d'exd6cuter lee vols inscrits au programme des 6preuves d'admission.
Un certain nombre de clients 6trangers des avions construits en France, conscients de leurs pos-sibilit~s limitd6es dans le domaine des easais en vol ant d46cidE- d'exiger que Ia RMception des avions qulii. ont achet~s sait faite par le 'Groups R~ception" ce qui apporte une sorts de label de qualit6, auxavions acceptqs par cette 6quipe trbs exp~riment~ge.
Pour un type nouveau d'avian, Cette exp~rience slaccumule au fur et L mesure du -j6roulement duprogramme de mise au. point du prototype. L'6quipe participe aux principales phases du programme,schdmatis~ges comme suit
Phase I :Pr~paration duler vol du prototypeMise au point et Evaluation de chaque syst me fonctionnel et op4drationnel syst~me de
navigation nouveaux moteurs, armement ; tous ces essais sont g~n~ralement effectuds Sur des avionsbanc: d'essais.
Phase 2 :Essais en vol de mise au point du prototype et des avions de pr~s~rie "'ddverminage"initial, extension du domaine de vol, easais des systZ~mes ; lIa fin de cette phase l'avion de type eatbien ddfini et a aubi toutes lea modifications n~cessaires pour subir lexamen final de Ia phase suivante.
Phase 3 :Essais en vol de qualification; pendant cette phase, il n'y a, en principe, aucune modi-fication L Ia d~finition du type, sauf exception mineure, ou sans influence (comme Ia couleur des sibg a)sur lea essais de qualification; lea sujets de ces essais sont:
- Ia navigabilitd v~rification du niveau de sdcurit6 de l'avion compte tenu des rbglements appli-cablesa.
- lea performances de l'avion et de sea systbmes fonctionnels :v~rifier qu'ils satisfont lea exi-gences de la mission.
- lea performances et lea limitations des systZ~mes op~rationnels en particulier lea syatz~mesd'armes, et leur compatibilitd avec lea exigences de s~curit46.
Phase 4 :Vols exp~rimentaux :d'habitude ces vols sont ex46cut~s avec le premier avion de sorie,afin de permettre de relever touts d~ficience pouvant LCtre r~v~l~e dana lenvironnement r~el de Ia mnis-sian qui peut diff~rer fortement de celui des vals pr~c~dents :pour les avions de combat, des escadril-les exp~grimentales sont parfois utilis~es dana ce but et aussi pour pr~parer lea consignes d'emploi apE6-rationnel par lea Arm~es de l'Air (cc fut en particulier le cas du HARRIER Britannique) Ces vols expE6-rimentaux peuvent avoir plusieurs buts diffdrents ; cc peuvent etre
-des vols d'endurance, pour d~celer en volant N un rythme acc~l~rE lea problbmes de maintenanceou d'op~rations que lea vols d'esaais en pouvaient r~v~ler.
-des vals op~rationnels. pour d~celer les d~fauts pouvant compromettre laccomplissement dequelques unes des missions pr~vues, et limiter ainsi les possibilit~s d'emploi.
-des essais climatiques pour v~rifier que lavion peut etre utilis6 partout dana le monde, ou aumains, dana lea conditions pr~vues.
Cette phase est donc consacr~e L lex~cution dune s~rie de vols d'Evaluation particuliers qu'onappelle parfois "'vols d' Evaluation initials".
D'aprbs Ia description ci-dessus on peut comprendre qu'une Equips de r~ception qui a participE Lceo quatre phases, ou au mains a Et6 constamnment inform~e des r~sultats obtenus, 6, tous les El6mentspour ddfinir le programme d'essais de r~ception le plus efficace.
On voit Ilh encore qu'un Equipage de r~ception Etranger eat dana une position plus difficile pourEtablir cc programme, puiaqu'il le construit d'aprbs des informations indirectes, qu'il ne peut v~rifier,et qui mont parfois s~lectives. Pour surmonter ce problbme, il lui faut au mains deux sources d'infor-mation
- des informations fournies par le constructeur- des informations fournies par un autre utilisateur du m~me avion, et de pr~f~rence par le
"client principal", si celui-ci accepte de lem donner.
6 - PROGRAMMES TECHNIQUES D'EVALUATION ET DE RECEPTION
Comnme on vient de I'expliquer ci-dessus, lea programmes techniques doivent inclure tous lea es-sail qui peuvent r~v~ler lea faiblesses de lavion. Uns revue gdn~rale des principales caract~riatiques

1-7
doit aummi etre faite. C'est pourquoi un certain nombre dlesmais "Standard" sont inclus dans de telsprogrammes, lea confirences de cette adrie parleront de certains de ceo essais. D'une m-ani~re gdn6-rale, on peut lea diviner en plusiours catdgories.
Al - La vdrification des limites du domaine de vol, ddcrochage ou vitesse mimale, rdsistancek. la vrille, facteur de charge maximal et nombre de mach maximal en virage.
A2 - Ina vdrification des performances, avec ou sans charges externes (s'il y a lieu) ; il taut sou-ligner que le but de tels essais n'est pas de rdpdter le procesaus long et dificile qui permet au construc-tour d'dtablir le "manuel de performances" de l'avion.
Le but eat seulement de vdrifier que les quelques mesures particulires faites en petit nombre nemont pas en contradiction avec le "'manuel de performances". Parmi cern essais souvent faits lee exem-plea suivants peuvent Lttre citds
- vitesse horizontale meaurde pour quelquea masses, altitudes, rdgime moteur de rdf6rence.
- vitesses verticales dana des conditions bien ddfinies, ou temps pour atteindre une altitude de r6-idrence, .k partir du ddcollage.
- vitesses verticales avec un moteur en panne
- ddbit de carburant et distances parcourues par unit6 de masse de carburant.
- toutes ces mesures peuveat etre compardes avec lea donndes du manuel de vol dana la mesureo ' lon tient compte des donn~es m6tdorologiques, surtout Ia tempdrature.
A3 - La v~rification des oualitds de vol dana lea conditions lea plus critiques de vitesse, nombrede mach, altitude ;lea vitesses tranasoniques sont gdndralement parmi lea vitesses critiques.
A4 - La v~rification des svstmes fonctionnels telaque le pilote automatique, et lautomnanette,lee syst.-mes de stabilit6 artificielle etc..
A5 - La v~rification des dispositifs de odcuritd
B - Essais relatifa au systames opdrationnels.
Une liste complZhte ne peut en etre donnde compte tenu de la grande varidt6 des missions cepen-dant lea exemples suivants peuvent etre donn~s
-syst~mes de Navigation- ystl~mea "'d'avionique" comme lea radars de suivi de terrain-radar de poursuite
-systhtmes d'armea.
7 - TECHNIQUES D'ESSAIS EN VOL
Gette revue des essais d'Evaluation et de R~ception ne serait pas compl~lte sans quelques mots Ipropos de l'entrafriement des iquipages &. ces vole tr~ts particuliera et quelquea remarques concernantla diffirence entre con vols d'essai et lee autrem sortes de vols.
La densit6 des informations qui doivent etre rapportdes par lea pilotes et 6quipages durant lee vol.d'Evaluation eat tr~s forte ; ils doivent Ie faire par des moyes tr~ts simples, usuellement lea instru-ments de vol disponibles I bord. Ils no peuvent se faire aider par un sysame de recueil de donndes so-phistiqu6 et complex. leur permettant de me concentrer seulement our Ie pilotage proprement dit. Ils doi-vent en meme temps piloter avec prifcision et faire lee observations et rnesures demanddes.
Ce Wnt pas une tAche de ddbutants. C'eat pourquoi lea piloteg d'esaaia do RMception montgdudraleient choimis parmi la pilotes lee plus expiriuentds.
Quand il y a I bord un eymtame de mesure, c'eat lorsqu'il eat impossible k l'hornme do recueillirlea mesurem ndcessaires, par exemple parce quo le param).tre & observer varie trop rapidement.
11 va sans dire qu'une qualification 4Elev~e, acquise dana une Ecole d'Essais en Vol eat essentiellepour qu'un pilots puismo fairs cc travail. Dana le monde occidental quatre de cem Ecoles sont bien con-nues ; slos regoivent des 6tudlanto de toutes nationalitds. Ce sont :1
- P'US AIR FORCE Test Pilot School d'EDWARDS APB -CALIFORNIE, aux USA.
- lUS NAVAL TEST PILOT SCHOOL, au NAVAL AIR TEST CENTER (PATUXENT River)
- 'Empire Test Pilot School Britannique b. BOSCOMBE DOWNS

1-8
- 'Ecole Francaise , EPNER (Ecole du Personnel Navigant d'Essaiv et de Rdception) I ISTRES.
Toutes cee 6coles enseignent k des pilotes expdrimentgs X devenir pilotee d'essaie ; lea EcolesFrangaises et des Etats Unie forment des dquipages d'essais complete incluant lingdnieur navigantd'e asaisa.
Lee confdrenciers de cette "adrie" d~criront en d6tail lea rlgles de l'art des vols, d'essais pourchaque type d'essai concernd. Cependant ii existe des rbgles gdndrales applicables k tous ces vols. Jene lea di6crirai pas toutes, ce eerait trap long. Cependant je veux dormer quelques exemples.
Pr6cieion des stabilisations de vitessBee ii n'est g6n~ralement pas possible de faire de bonnes me-sures de performances sans garder la vitesse constante ; la prdcieion n~cessaire eet trbs souvent mail-leure que celle fournie par le pilote automnatique. Ceci est pourtant faieable manuellement en air calmeen utilisant lindicateur d'assiette comme instrument de base plut~t que l'indicateur andnom6trique lui-maine. Pour obtenir un bon r6sultat il faut un indicateur d'assiette de haute sensibilit6. La vitesse eatmicux stabilis6e en coneervant l'altitude constante car cela impose un angle d'incidence ; k incidenceconstante la vitesee ne pout changer pendant une stabilisation de quelques minutes en air caline. Quandl'indicateur dassiette n'est pas assez pr~cis, la simple observation de l'horizon peut suffir, pourvuqu'il existe sur le parebrise une rdf~rence quelconque, par example une marque au crayon gras, quipermet de maintenir le nez de l'avion k une "hauteur" (angulaire) constante au desaus de I'horizon. EnFrance, nous utilisione autrefois un 'gadget' appel 6 collimateur pour obtenir une telle rdfdrence rdgla-ble ;cet appareil 6tait l'ancatre des systbrnes de "pilotage tete haute" dlaujourd'hui.
Echanjes d'6nergie cin6ticiue et potentielle gravifigue sur lea aviona de combat k rdaction.
Sur tous lea avions de combat hL reaction urle 146gbre r6duction de viteese k r6gime moteur constantproduit ian changement d'altitude. Au "deuxibme r6gime de vol" une r6duction de vite sac fait perdre del'altitude. Loraquon meaure un taux de mont46e ian petit 6cart de viteese pendant la etabilisation peutengendrer une grosse erreur dans la mesure, lorsque celle-ci eat obtenue en divisant la dif~rence d'al-titude par le temp. n~cessaire pour l'obtenir.
Une m6thode de correction sera donn~e daiia l'une des confdrences elle repoee eur la notion de"hauteur totale".
Nombre de parambtres physiqiues influents sur Isa mesure-
Quand une mesure telle que celle de la stabilit6 longitudinale d'un avion doit atre faite, Ie r~sul-tat est fonction d'un certain nombre de parambtres, certain. peuvent etre maitrias.s tels
La masse, la position du centre de gravit6, la position des volets hype rsustentateura, Ie ro6glagedes moteurs ;d'autres ne sont que partiellement contr8l~s, comme la densitg de l'air qui vanie en pre-mier lieu avec laltitude. Mais puisque personne, aauf Dieu, ne peut r46gler la tempdrature qui rbgne Iune certaine altitude. il est impossible de controler complbtement ce parambtre.
On peut citer un certain nombre d'exemples semblabies. Pour tenir compte de cc problbme, ilil eat gdn~ralement n6cessaire de stabiliser la viteese et laltitude correctement avant toute manoeuvred'essai, de manibre It disposer d'un moment pour meaurer lee valeurs des parambtres exergant une in-fluence our Ie r6oultat, et d6finissant aussi des conditions kL l'origine servant de rdfdrence.
Quand ian certain nombre d'essais doivent etre entrepris dans lea memes conditions de vol. afinpar exemple de faire des comparaisons. cette pratique eat trbs utile parce qu'il est ainsi plus facile dev~rifier, entre lee manoeuvree, tout changement involontaire des conditions de vol. par exemple le rd-glage des compensateurs. qui peut induire une erreur.
Prdciaion des mesures diffdrentiellee
Faire des mesures diffdrentielles, cela consiste IL mesurer Ia diffdrencc entre le param~jtre in-connu et une rogfirence bien ddfinie, plut~t que de tenter une mesure directe de l'inconnu.
Un bon example cat la mdthode d'4talonnage de la prise de preasion atatique qu'alimente l'altim):-tre (et l'indicateur de vitesac) :Cette m6thode eat ancienne, maim si simple qu'elle cut encore emplo-yde. avec quelques raffinements. On l'appelle la m6thode des "Passages I Ia. Tour"
On peut Ia dicrire ainsi
L'avion survole ladroport en ligne droite N trbs basic altitude au dessus du sol, assez pr~ts de Is.Tour de Contr8le pour pouvoir stabiliser cette altitude au niveau du toit de Is. Tour de Contr~le. Plu-sieure passage. mont faits pour couvrir Ia gamme de vitesses souhaitde, et & chaquc passage prbs de latour, l'altitude lue eat comparde X l'altitude vraic du sominet de Ia tour.
De rnanR~re A sassurer que l'cffet de sol n'altbre pas lea risultats, Ilavion dolt voler au main.k une hauteur au-dessu. du aol 6gale & son envergure ; la hauteur optimale eat de 1. 5 fols lenvergure.

1-9
Le caractbre diffdrentiel de cc type de meaurca apparaft dans la fa~on de comparer indirecternentI& hauteur de la tour et la lecture de l'altimlitre.
Dana 1e but de faire cette comparaison une "rdfdrence"l eat utilisde ; avant et apr~jo la *46rie depassages de l'avion, celui-ci eat immobilia6 au aol, 1 proximit6 de Is. Tour de ContrOle. et l'altitudepreacion eat lue, en affichant 1013 mb dana la fenetre de Vl'atimltre ; cc rdglage eat conserv6 pendant.tout le vol.
Exprimde-en termes d'altitude preacion, l'erreur de atatique eat donnde par la diffdrence entrela hauteur de Ia tour et la hauteur obtenue par la diffdrence entre I'altitude lue b, chaque passage et ccl-le lue au aol aur Vl'atimbtre.
Un des "raffinementa" appliquda aujourd'hui X cette vieille mdthode conejate I disposer tin appa-rail photo rigidement fix6 aur le toit de la Tour de Contrale.A chaquepassage un opdrateur prend tinephoto de l'avion passant devant la tour ; ceci fournit un moyen de corriger toute diffdrence pouvant exia-ter entre le niveau de chaque passage et celui du tojt de la Tour.
8 - DEUX EXEMPLES
J'ai choiai deux exemplea do programmes d'esaiaj de rdception.
CONCORDE
Lea vola de rdception de l'avion n* 13 aortant de la chaine de fabrication ont 46td entrepria en aep-tembre 1978 en suivant le meine programme que pour tous lea autres aviona de cc type conatruita enGrande Bretagne et en France.
Pour couvrir cc programme, il a fallu 6 vol., et un nombre total d'heurea de vol de 17 heureincluant 7 heuree X viteaaea aupersonniques, et 10 atterrionage.
Ce programme do vol comportait 78 easais individuels d6taillda ci-dessoua
Qualitds de vol 5 esaaisEntrde d'air 8 esaajSystitme aninomdtrique 4 eamaisPropulsion 3 essaisSysahe de carburant 4 eaaaiaGdndration 6loctrique 5 caaai.Systhtme hydraulique 11 eacaimConditionnement d'air 11 eaaaia
Ddgivrage 2 eacaisPilots automatique 10 easais
Systlimo de radiocommunication. 3 eacaisRadars mdtdorologiquea 1 eaaaiSyatime. commerciaux 4 eaaaiaSystbme enregiatreur d'accidont. 1 eaaai
MIRAGE III E
Le programme de rdception comporte 4 vol. do. types A, B,C et D -le profil do cc I vol. eat don-ad stur lea figure. 13 & 16.
On pout voir d'apr'6s cee figures, qu'k lexception du vol D, consacr6 au ayatbme de navigationaucun de. troia autre. vol. n'eat spicialis6 dane un domaine spicifique. Ce@ trois vol. aont organisado manibro I couvrir autant de point. & vdrifier qu'il eat possible.
9 -CONCLUSION
L'exdcution d'un vol d'Evaluation ou d'Admission demando baucoup do travail I l'dquipage,polaque Ia grand. densit6 des observations h fairo eat 1s caractdristiquo gdndral. des prograino. do vol.
Co. *oasis no sont pas de. osaie en vol "do deuxiAuo ordre". Ile dionandent lhabitude d'dquipageaoxpdriinontds.
Pour faciliter lour prdparation et leur programsation uno connaiasanc. an proftondour do l'avionat do son program. do ddvoloppement oat utile.
J'oapbro quo I a dna de confdrencae qu'ouvro cot expood aere utile & tous ceux qui auront&accomplir cc travail.
LES PLANCHES SE TR OUVE SUR PAGE 1-20.

SOME COMMENTS ON
THE PROBLEMS INVOLVED
IN AIRCRAFT ASSESSMENT AND ACCEPTANCE TESTING
by J.F. RENAUDIE
Centre d'Essajs en Vol de BRETIGNy
FRANCE
jog"*

1-12
0 - INTRODUCTION
My purpose is to introduce this lecture series devoted to
Assessment and Acceptance Testing.
I havechosen to point out, and comment on some of the many problems which have to be solvedwhen such testing has to be made.
My personal knowledge of the subject comes mainly from my experience on French aircraft ofany kind ; but I think that the technical questions raised are the same in any Country.
The views that I will present are personal, but they were strongly influenced by the advicewhich I was given by our French official team dealing with acceptance testing, named the "GroupeReception", which is a service of the French Flight Test Center (C.E.V.).
theI have been personally involved in/flight testing programme of a well known aircraft
CONCORDE, since I am the leader, on the official side, of the team which has dealt with the entireprograme, from the preparation of the first flight, in 1965 (completed in 1969) to the first landingat KENNEDY Airport USA (19 oct. 1977).
My presentation will adress the following subjects
- objectives of Assessment and Acceptance Tests- criteria for assessment- means, organisation and programnes of flying- acceptance testing as a particular case of assessment- the technique of flight testing.
I - OBJECTIVES OF ASSESSHENT AND ACCEPTANCE TESTS
These objectives are not the same for the aircraft manufacturer and the customer who wants to
purchase it.
What are such objectives for the company manufacturing and selling the aircraft ?
+ For the sales manager the obvious purpose of flight testing is to present the aircraft to thecustomer emphasizing its best qualities.
Such flight testing will preferably be carried out at the vendor's facilities but sometimesalso at the customer's Air Force base. In this paper such flight tests are called "assessment tests" orin a shorter way "ASST".
+ For the manufacturer's qualitZ control services, the flight testing which is important is
that needed to meet the following objectives
- check that any aircraft from the production line has the same performance and qualitiesas the "type aircraft", with acceptable tolerance
- check that the defects are minor and can be easily cured by proper adjustments.
In this paper such flight tests will be called "acceptance tests" or in a shorter way "ACCT".
+ For the customer the purposes are not exactly the same.
The first question to raise is : what customer ?
There is a major difference between the '"ain customer" and the other ones.which is
The "Main customer" is generally the Ministry of Defence of the Nation of the Manufacturer,potentially a. buyer of a large number of aircraft if they meet the specifications adequately (performanceand missions). Sometimes the manufacturer takes the risk of building and developing an aircraft on hisown funds ; more often some assistance to this private venture is given by the Nation ; for a number ofprojects full assistance is given to the manufacturer from the very beginning of the development,sometimes later on, with contracts funded from the budget of the Ministry of Defence.
In the latter case the '"ain customer" is the only one who can play on active role in thecompletion of the various phases of the prograume from the first flights to the delivery of the firstoperational aircraft ; in particular some flight tests are carried out at each step of the programme bythe flight test pilots committed by the Ministry of Defence in order to report on the progress made, andto check the expenses incurred.
Such flights are not only requested by the "Main customer" sponsoring and financing a prograe,but also by the contractor himself, in order to check that the development is directed toward a targetas close as possible to the needs of the customer. When several competitors are on the same programme,sucb flights are essential for each of them to stay in the competition up to the final stage, when thechoice of the type ordered is made.

1-13
Customers other than the "Main customer" as described above, for example theforeign countries, when the aircraft requested is military, are unable to get all the information about the
development of the aircraft and the progress made toward the operational performance.
For these "other customers" the needs are the following :
- assess various types of aircraft in order to choose those which are closest to theirrequests, and negotiate a contract with the manufacturer to get the required number of aircraft
- accept each individual aircraft delivered on the basis of the contract ; this meansundertake all the flight testing needed to check that each of them is identical to the type aircraft,with no defects.
2 - CRITERIA FOR ASSESSMENT
These criteria differ with the mission to be fulfilled by the aircraft.
- light aircraft for private users
- executive aircraft- airline transport
- Air Force transport- Fighter , high altitude attack- bombar- low level penetration aircraft- observation aircraft- carrier aircraft- rotorcraft- VSTOL.
The differences between each of the above missions do not need to be expanded.
Once the category of aircraft is selected and the mission requirement defined, a number ofcriteria have to be taken into consideration. For the buyer with a limited budget (all the budgets,even the highest ones are limited) the primary consideration is a financial one
- cost of each unit- life cycle cost- operating cost.
The impact of technical simplicity on these criteria is obvious ; among the three abovecriteria, the last one implies some kind of assessment flight testing ; all of them are clearly related
to the following considerations which must be kept in mind for any assessment flying :
- type of operation which is intended : visual flight conditions, or all weather operations,
by night or by day
- crew qualification and number ; minimum crew
- crew comfort according to the duration and characteristics of the mission
- passengers comfort (if applicable) and noise
- level of safety to be provided in conformity with the relevant airworthiness regulations
- flight boundaries (at low and high speeds)
- flying qualities
- handling capabilities
- complexity of the aircraft, its functional systems, its operational systems
and, last but not least
- performance for the mission
3 - INCREASING COMPLEXITY OF AIRCRAFT
This is one of the major problems to tackle in order to build up a programme of flight testing4 for assessment and acceptance purposes taking into consideration all the criteria, without wasting the
number of flying hours, which for economical reasons must be strictly limited.
In order to cover the maximum number of observations therefore each flight must be plannedwithin the minimum time. A very high crew workload is the characteristics of such flying.
A good picture of the increasing complexity of aircrafts of to day is given by fig. I whichshown the number of recorded parameters for the development phase of various prototype aircraft.
Such high capacity data recording systems is not feasible for acceptance and evaluation testingonly simpler test equipment can be used ; one paper of this series will be devoted to this subject ; onemust realize anyway that the primary information is that collected by the crew itself. The data recording
* system is only a back up of the crew ;it gceswithout saying that very often assessments are made withoutthe help of any test equipment or recording system, using only the standard cockpit instrumentation.

1-14
4 - MEANS, ORGANISATION AND PROGRAMS OF ASSESSMENT FLYING
Drawing up a programme of assessment flying covering all the major questions as efficientlyas possible within the minimum flying time is not an easy task.
The less flying is allowed, the more time is needed to prepare it.
To achieve this task of flying preparation, and fiying itself, many types of organisation canbe used, but one of the most efficient is the following :
A flight test tesm in charge of each particular type of aircraft to be assessed.
This team and its leader is selected by the customer, who request that similar team of pilotsand experts be selected by the manufacturer ; the teams will work in close cooperation with each other.
Sometimes the name of "joint test team" is given to this association.
Each team must include the following members
- test pilots, and crews ; preferably one of the test pilots should be specialised in theairworthiness problems while the other should have the relevant operational experience of similarmissions. Experienced pilot are very often familiar with both fields of expertise.
- flight test observers and specialists.
- design, engineering, maintenance and operation specialists ; if these are not availablein the customers team, then close liaison must be arranged with the corresponding manufacturer'sspecialists preferably through a design office representative.
To draw up the flight programme two aspects have to be taken into consideration
- those related to the aircraft
- those related to the operational environment of the mission and thetesting means to be used.
(a) items related to the aircraft itself
The following tasks have to be performed
- an analysis of the mission requirements in order to identify the most difficult to meet
- an analysis of all the operational tasks involved in order to select the most usefuland the most difficult
- a comparison of the critical items found with those identified on the other types ofaircraft with the same mission or similar missions
- a critical examination of the flight test reports released by the manufacturer and/orthe main customer. It is a normal practice to give some of these reports to the customer when theydeal with some particular characteristics of the type aircraft (here the word "typa" strasse thedifference between the aircraft under development and the "product" which is sold)
- a critical examination of all the other sources of information, such as reports from othercustomers if they agree to release them.
(b) items related to the operational environment of the mission and the associated test means
These are the following
- the specified climatic conditions dictate the location, where the flying will take placewhen extreme conditions have to be met (for example dry tropical climate, or polar climate) it willgenerally be necessary to distribute the flights among different airspaces and airfield, these wherethe right climatic conditions prevail and those where the test means are adequate (for example need ofexternal tracking systems). The flights may have to be distributed among the manufacturer's airfield arepresentative air base chosen by the customer and sometimes a major flight test center with sophisti-cated equipment.
- the need to test the weapon system dictates the location of the testing range, whereweapons can be fired, with all the associated tracking and safety means. For example in France allthese tests are carried out at the Flight Test center at CAZAUX, where there is a firing range ; addi--tionally CAZAUX is located in the vicinity of the big missile testing range of CENTRE D'ESSAISdes LANDES at SISCAROSE
- the need to facilitate the crews observation in each flight by a suitable recordingsystem, such as a voice recorder
- in certain cases the need of high frequency recordings or highapeed cinematographicequipment
- the reasonable number of test flights and amount of flying time to be alloted, takinginto account the overall duration of the assessment.

5 - ACCEPTANCE TESTING
Acceptance testing is a particular kind of flight testing, directed toward a very specificpurpose : controlling the quality and detecting any defect or deficiency of an individual productionaircraft as compared with the type aircraft.
To complete this task, the same means and organisation as described above can be applied.
In this particular case, the objectives are not as broad as described above, and there is a
smaller number of criteria to apply, since this is only a comparison between
- the type aircraft, and ...
- an individual aircraft from the production line.
The knowledge of the type aircraft results from the preliminary assessment made prior to thechoice which has lead to the purchase contracts ; here again, the "Main customer" has a better knowledgeof this aircraft.
On the basis of this knowledge a list of critical checks can be set up; a selection has to be
made in order to optimize the efficiency of the acceptance flying, which means
- perform the greatest number of the most important checks
- reduce the flying time as much as possible for cost considerations.
When there is a large number of aircraft ordered the answer to this difficult problem is tohave two types of acceptance flying programmes :
- an extensive one, which will be applied only to selected aircraft on the production linefor example, assuming that a number of 100 aircraft have been bought, these tests will be made on theaircraft number 10, 20 ,30 etc. which will require for example 5 or 6 flights (in FRANCE these A/C arecalled"Avion de lot")
- a reduced one consisting in one or two flights for all the other,
To draw up these two programmes, the extensive and the reduced one a knowledge as large aspossible of the type aircraft is required. This is why the Flight Test Services of the "Main customer"are here again in a much more comfortable position to do this job, since they were able to observeand very often monitor the development of the programme from the prototype to the preproduction or firstproduction aircraft ;thus they are well informed of all the defect, remedies to these defects, and of theweakest characteristics of the type aircraft.
This is in particular, the case for the French "groupe Reception " whose particular jobat the CEV (Centre d'Essais en Vol) is to make the flight testing needed to complete the acceptance trialprogramme.
A number of foreign customers of the French-made aircraft who are well aware of the limitationsof their own flight testing capabilities have decided to request that the acceptance testing be made bythe "groupe Rdception" since this is a kind of official quality label which is given to an aircraftaccepted by this team of experienced people.
For a new type of -aircraft this experience is built up progressively with the team designatedto accept an aircraft of a new type,participating in all the phases of the programme which are sumnarizedschematically as follows,:
Phase ]:preparation of the first flight of the prototpe ; development and assessment ofindividual functional and operational systems equipment, navigation systems, new engines (if applicable),armament ; all these tasks are generally completed on flying test beds.
Phase 2 flight testing for the development of prototype and Preproduction aircrafts ; debugging, extensionof flight envelope, system tests ; at the end of this phase the type aircraft is well defined and all themodifications are incorporated for presentation to the final examination of the following phase.
Phase 3qualification flight testing ; during this phase, there are in principle, no modifications madeto the definition of the type, with the exception of minor ones, or irrelevant ones (such as the colourof the seats :) which means that they do not affect the qualification tests ; the subjects of these testsare:
- airworthiness : verification of the aircraft safety level as requested by the regulations
- performance of aircraft and functional system : check that it meets the specifications of the mission
- performance and limitations of operational systems in particular weapon systems weapon delivery, com-patibility with safety.
Phase 4 experimental flying;usually these flights are made with the first production aircraft, to takeaccoun of any minor deficiency in the real environment of the mission, which could be very differentfrom that of the previous phases ; for fighter aircraft experimental squadrons are sometimes used forthis purpose and for preparing the operational use by the Air Force (this was the case of the BritishVTOL Harrier). These experimental flights can deal with several different purposes
- endurance flights to check with a high rate of flights any maintenance or operation problem that4, the previous test flights were unable to reveal
.~ ~~~ .

1-16
- operational flights to check any defect which could prevent the completion of some of the planned.missions and limit the use of the aircraft
- climatic tests to check that the aircraft can be. used under world-wide conditions, or at least inthe planned conditions.
This phase is therefore devoted to a particular, and very important series of assessment flightswhich are sometimes called "initial evaluation flights".
From the above description it can be understood that an Acceptance Team which has had the oppor-tunity of being involved in, or at least informed, about these four phases has all the needed elements todefine the most efficient programme of Acceptance tests.
Again it can be seen that a foreign acceptance team is in a more difficult position to draw upsuch a prograu e since it must rely on indirect information , that it cannot check, and that can besometimes filtered. To overcome this problem this team needs at least two sources of information
- information from the manufacturer
- information from any other user of the aircraft, and preferably from the main customer "if he agreesto release them.
6 - TECHNICAL PROGRAIMMS OF ASSESS14ENT AND ACCEPTANCE TESTS
As explained above the technical programmes must include all the tests which could reveal theweaknesses of the aircraft, as well as its most interesting performance. A general overview of all themain characteristics must also be provided. This is why a number of typical tests are generally includedin such prograsnes. The papers of this series willaddress a selection of these tests. They can be dividedinto several categories :
A - tests related to the aircraft itself considered as a platform on which the operationalsystems must work properly. In this category there are
A I checks of flight boundaries, stalling or minimum speed, spin resistance, maximum g andMach boundaries in turning manoeuvers.
A 2 check of performance, with or without external loads (if applicable) ;it must be pointed outthat the purpose of these tests is not to repeat the difficult and lengthy process which enables themanufacturer to establish the performance manual of the aircraft.
The aim is only to check that the individual measurements made in a small number are not incon-sistent with the "performance manual". Among the tests which are often made the following examples can bequoted :
- horizontal speed measured for a few reference weights, altitudes, thrust regimes
- vertical speeds under well defined conditions, or overall time to reach a reference altitude, fromtake off
- engine out vertical speeds
- fuel flow and range characteristics.
All these measurements can be compared with the data of the flight manual if due account ofthe atmospheric conditiOnsin particular the temperature, is taken.
A 3 - check of flying qualities under the most critical conditions of speed,mach number
altitlud; the transonic regime is one of these critical range of speeds.
A 4 - check of functional systems, such as autopilot, autothrottle, stability augmentationsystems, etc...
A 5 - check of safety devices
B - tests related to the operational systems.
A complete list of these tdats cannot be given ; the following examples can be quoted
- Navigation systems
- Avionic systems, such as terrain following radars
- Target acquisition radars
- Armament testing.
The papers in this series will cover these sub'jects.

1-17
7 - FLIGHT TEST TECHNIQUES
This overview of assessment and acceptance testing would not oe complete without a few wordsabout the training of crews in this very particular flying and some comments stressing the differencebetween flight testing and any other kind of flying.
The density of information to be gathered by the pilots and crews during assessment flightsis very high ; they must do this with simple means : usually the standard instruments on the dashboard.They cannot bb helped by a sophisticated and complex test instrumentation system leaving them freeto concentrate only on the flying itself : they must simultaneously control the aircraft accuratelyand perform the observations and measurements required.
This is not a beginner's task. Therefore acceptance test pilots are generally the most expe-rienced flying personnel.
When some instrumentation is available on board its purpose is to collect the data which ahtman being would be unable to collect in particular because the reponses are too fast.
It goes without saying that the high qualification reached in a Flight Test School is essentialto do this job. In the western world four of these schools are well known ; they teach Students fromany foreign countries. These are :
- the US AIR FORCE Test Pilot School at EDWARDS AFB California, USA
- the US Naval Test Pilot School at the Naval Air Test Center , MARYLAND, USA
- the Empire Test Pilot School at BOSCOMBE DOWN , GREAT BRITAIN
- the French Test Pilot School, EPNER at the CENTRE D'ESSAIS EN VOL ISTRES, FRANCE.
All these Schools teach experienced pilots who will be trained to become test pilots ; theFrench and US Schools provide overall training for complete crews including flight test engineersand observers.
Each Author in this series will describe the state of the art of flight testing for eachSubject. But there are general practices applicable to all these flights. I will not describe eachof them, it would be too long. I intend only to give a few examples.
Accuracy of speed stabilisation : it is impossible to make proper performance measurementswithout keeping the speed constant. The accuracy required is very often better than that achieved by theautopilot. This is manually feasible in still air with the attitude indicator as a basic instrumentrather than the airspeed indicator itself. For this purpose the attitude indicator must offer high sensi-tivity. The speed is better stabilized by keeping constant the attitude which governs the angle ofattack ; at a constant angle of attack the speed cannot change during a stabilisation of a couple ofminutes in still air. When an attitude indicator with high sensitivity is not available the sight of thehorizon may suffice, provited that some reference on the windshield such as a pencil mark enable thepilot to keep the nose of the aircraft at a constant elevation above the horizon. In France we used inthe past a device named "collimateur" to provide this adjustable reference ; this was the ancestor ofthe head up displays of today.
Exchanges of potential gravific energy and kinetic energy on jet fighters
On all jet fighters a slight reduction of speed at constant thrust setting produces a changein altitude. On the backside of the power curve, a reduction in speed will result in a lose of altitude.When measuring a rate of climb a small changeof speed during a stabilisation can produce a serious errorin the measurement of the rate of climb, when this measqrement is made directly on board, by dividingthe difference in heightby the time necessary to produce it.
A method of correction of this measurement is based on the concept a energy height which
will be explained in this series.
Number of physical parameters influencing in the requested measurement
When a measure such as the longitudinal dynamic stability of an aircraft has to be made,theresult is a function of a number of parameters. Some of them can be controlled, such as
The weight, CG location, flap setting, engine setting ; some other can be partially controlled
such as the air density which varies primarily with altitude. But since nobody except God can control thetemperature of the air at a given altitude. It is impossible to control this parameter completely.
A number of similar examples can be quoted. To cope with this problem it is generally nece-
exerting an influence on the measurement, and defining the reference conditions may be measured.
When a number of tests have to be carried out under the same flight conditions in order tomake some comparison this practice is very useful because it is easier to check between each manoeuverany indavertent change in the flight conditions (for example the trim setting) which could produce anerror.
Accuracy of Differential measurements
Differential measurements consist in practice in measuring the difference between the unknown
parameter and a well defined reference rather than trying to get directly the unknown one.
A good example is a method of calibration of the pressure error of the static pressure portfeeding the altimeter (and the Airspeed indicator) : this method is old, but so simple that it isalways used with some refinements. It is called the "Control Tower method", in French "Passages a latour".

1-18
It can be described as follows
The aircraft flies over the airfield along a straight line at a low level above the ground,close enough to the control tower to be able to stabilize its level at the height of the roof of thecontrol tower ; several runs are made to cover the range of speeds needed and the altimeter readingsat each run are compared to the true height of the tower.
In order to ensure that ground effects do not influence the results, the aircraft must beflown at least one wing span above the ground - 1,5 wing span is preferred.
The "differential"character of this type of measurement appears in the usual practiceaccording to which the height of the tower and the altimeter reading are not compared directly.
For this purpose a "reference" is used'before, and after the series of runs the aircraftstands at zero speed, on the ground, in the vicinity of the control tower, and the pressure altitude isread, setting 1013 mb in the window of the instrument ; this setting is kept during the entire flight.
If expressed in term of pressure altitude the static pressure error is given by the differencebetween the height of the tower and the height measured as the difference between the pressure altituderead during any run and that read at the "reference".
One of the "refinements" applied today to this old method consists in using a photo camerafixed on the roof of the tower. At each run an operator takes a photo of the aircraft passing in frontof the tower. This provides a means of correcting any difference between the level of each run, and thatof the tower roof.
8 - TWO EXAMPLES
I have choosen two examples of acceptance flight test programme
CONCORDE
The Acceptance flights of the 13th airplane of the production line of CONCORDE were carriedout in september 1978 according to the same programe as all the other British or French aircraft ofthat type.
The numbers of flights needed to complete this programme was 6 for a total of 17hours inclu-ding 7 hoursat supersonic speeds, and 10 landings.
The flying programme included 78 individual tests detailed below
Flying qualities 5 individual tests
Air intake system 8
Air data systems 4
Propulsion 3
Fuel system 4
Electrical generation 5
Hydraulic system 11
Air conditiouing system II
Deicing system 2
Auto Pilot 10
Navigation system 6
Communications system 3
Meteorological radars I
Co ercial devices 4
Accident data recordingsystem I
MIRAGE III E
The acceptance programme includes 4 flights of the types A, B, C and D ; the profiles of theseflights are given on figures 13 to 17.
It can be seen from these figures that, with the exception of flight D, devoted to the navi-gation system, none of the other three flights is specialized ins single specific field. The three flightsare organised so as to cover as many items to be checked as possible, ifn order to increase the effici-ency.

1-19
CONCLUSION
Achieving assessment and acceptance flight testing is very demanding for the crews, since a
very high density of items to be checked is the characteristic of the flight programe.
These tests are not "second" rate" flight tests. They require the skill of experienced crews.
To help their preparation and programming a good knowledge of the aircraft and its developmentflying is usefull.
It is hoped that this lecture series will be of assistance to those who have to perform thiswork.
AGARDLECTURE SERIES 108
A great number of documents have been published concerning flighttest techniques the following list is a selection of AGARD documents andother publications.
AGARD DOCUMENTS
N N 1 - AGARD flight tost manuel (4 volumes) 1959
CP n• 85 - Flight test techniques 1971
CP n0 160 - Take of and landing 1974
CP n° 187 - Flight / ground testing facilities correlation 1975
CP n0
223 - Plight test techniques 1976
CP n° 260 - Stability and control 1978
CP nc 242 - Performance prediction methods
AG no 160 - Volume 1 - Basic Principles of flight test instrumentation
AG n° 160 - Volume 2 - In flight temperature measurements
AG n° 160 - Volume 3 - The measurement of fuel flow
AG no 160 - Volme 4 - The measurement of Engine Rotation Speed
AG n° 160 - Volume 5 - Magnetic Recording of Flight Test Data
AG n° 160 - Volume 6 - Open and closed loop Accelerometers
Additional volumes of this series are in progress. A new series on flight
test techniques will be produced very soon.
BOOKS
Very few books have been published about flight testingthe following one was formerly used by the french flight test school EPNER.In spite of the age of this document it remains widely used in Europeancountries where french can be understood.
ESSAIS EN VOL (2 volumes) by Jr. RENAUDIE published
DUNOD FRANCE 1960.
IF

1-20
CONCORDEcc 2 CONCORDE VELOPMENT)
• _j i.OCONCORDE4O10 F 150 (CERTIFICATION)
.,.,. MIRAGE G3
a XC.142, Fl ,F-16m ::'... , ... ":FI.l . : CONCORDE 3
1 MIRA EI "(ENDURANCE)
u. MIAGE IV * JAGUAR0 ".---SMB 2 MRAGE V
.>- MVST. IV B - -EEDARDSi- MD450. MVST. IV A
U 10 52 S06000
1950 1960 1970 1980
YEARS
Trend in parameters recorded during flight tests
OBJECTIVES OF ACC. and ASS. TESTS
MANUFACTURER CUSTOMERS
SALES QUALITY MAIN OTHERMANAGER CONTROL CUSTOMER CUSTOMERS
SERVICE (supprting themanufacturer)
EMPHASIZE CHECK EACH CHECK EACH SELECT THETHE PRODUCTION STEP OF BESTQUALITIES AIRCRAFT DEVELOPMENT AIRCRAFT FOROF THE WITH REFERENCE PROGRAMME THEAIRCRAFT TO THE MISSIONTO TYPE AIRCRAFTSELL
3CRITERIA FOR ASSESSMENT
0 MISSIONS
LIGHT AIRCRAFTEXECUTIVE AIRCRAFTAIRLINE TRANSPORTAIRFORCE TRANSPORTFIGHTER HIGH ALTITUDEBOMBERLOW LEVEL PENETRATIONHOSTILE DETECTION AND RANGINGCARRIER OPERATIONROTORCRAFTVSTOL

1-21
CRITERIA FOR ASSESSMENT
0 TYPE OF OPERATIONSIFR VFR FLIGHT DAY OR NIGHTCREW QUALIFICATION NUMBERMINIMUM CREWCREW COMFORTPASSENGER COMFORTLEVEL OF SAFETYFLIGHT BOUNDARIESFLYING QUALITIESHANDLINGCOMPLEXITY
0 PERFORMANCE j
RE PORTS MISSIONFROM JOINT TEST REQUIREMENTS
CONSTRUCTORS TEAM INCL.SCUSTOMER /WEAPON TESTING
USERS CONTRACTOR COMPARISON WITHOFFICIAL TEST PILOTS OTHERESTABLISHMENTS TEST CREWSSPECIALISTS AIRCRAFT
INSLTTUEATO^N -ASSESSMENT FLYING I OUR....' v"" " " JI PROGRAM ME .,
CLIMATIC
FLIGHT I ASSESSMENT FLYING I_- TESTING
TEST FROM SELECTED REQUIREMENTS IFACILITIES AIRFIELDS
_ 5
TYPE A/C TYPE A/C QUALIFICATION and OPERATIONAL
FLYING PROGRAMME
ACCEPTANCE MAXI FLYING /Cr "AVION DEPROGRAMME A/C LOT"
MINI FLYING A/C rF2PROGRAMME f0 00 00 0
F1h~iYN A/C rf 5<:
0 00 00 0
"AVION DEACCEPTANCE MAXI FLYING A/C rflO <"'"PROGRAM ME
FLYING HOURS 0 0 0

1-22
TEST BED AIRCRAFT
PRTOTYPE .PREPROO DEVELOPMENT 0OFI" PROD AIRCRAFT SUBSYSTEMS andARMAMENT SYSTEME,I'SFRST FLIGHT _I
PRPRTIONPHS EVELOPMENT - /
STING PROGRAMMEPHASE 3 QUALIFICATION OF
FLIGHT TESTING - . ACCEP--TAN.C FMM S
PHASE 4 EXPERIMENTAL -- TESTINGFLYING (OPERATIONS, -CLIMATIC TESTS) 0/ ----
"MAXI (AVION DE LOT)
L8
TECHNICAL CONTENT OF ASST and ACCT TESTS
A - AIRCRAFT B - OPERATIONAL SYSTEMES
0 FLIGHT BOUNDARIES 0 NAV SYSTEMS0 PERFORMANCES 0 AVIONIC SYSTEMS0 FLYING QUALITIES 0 TERRAIN FOLLOWING SYSTO FUNCTIONAL SYSTEMS 0 TARGET ACQUISITION RADARO SAFETY DEVICES 0 ARMAMENT TESTING
000 000
O KEEP CONSTANT ATTITUDE TO STABILIZE SPEED ACCURATELY 9
ANGLE OF ATTACKPITCH ATTITUDE
HORIZON
'COLLIMATED"CROSS BAR ADJUSTABLE OPTICALI, GUNSIGHT
/' VISIBLE' HORIZON
I EYE
ADJUSTMENTKNOB

1-23
L100 KEEP SPEED CONSTANT FOR ACCURATE
MEASUREMENT OF RATE OF CLIMB
RATE OF CHANGE OF RATE OF CLIMBENERGY - (POTENTIAL GRAVIFIC ENERGY)
ACCELERAI /G+ (KINETIC ENERGY)
A VARIATION OF SPEED OF 0 01 G PRODUCESA VARIATION OF 1% OF THE RArE OF CLIMB(WHEN THE A/C IS FLOWN AT THE OPTIMUM SPEED FOR U.IMB)
o KEEP SPEED AND ANY OTHER PARAMETER CONSTANTFOR A SMALL TIME BEFORE ANY TEST MANCEUVER
AIRCRAFT CONTROL PRELIMINARY"ANSWER' IMPUT STABI LI ZATION
(REFERENCE)
~PARAMETERS:
SPEED CONSTANTALPHABETA= 0CENTER OF GRAVITYFLAP SETTINGAUTOSTAB SETTING
INERTIA (EXTERNAL LOAD)ETC...
12USE DIFFERENTIAL METHODS EXAMPLE ALTIMETERERROR CALIBRATION
CONTROL TOWER
dp :1 dpMEASURED COMPUTED
POSITION ERROR MEASURED COMPUTED
0 WWEEN PRESSURE FROM:kECORDED DURING 0 HEIGHT OF TOWEREACH RUN AND 0 AIR DENSITYAT HOLDING POSITION (ATMOSPH PRESSUREON GROUND and TEMPERATURE)

1-24
1
MIRAGE MI E FLIGHT AALTITUDE SURINIC CRUISEThousand of feet A I C IN
40--CC1.ERATI01,..o.. "
1#O 38000 FTM.1.4 4' 0
Gf S '
* GEAR up AIBAK
RETRACTED
10- MAX I LOAD FACO
x20 40 60
LANDING TAKE OFF WITHOUT REHEAT DISTANCE NM
ENGINE RAT]N All speeds indicated (ASI1
~ MAX WITH REHEAT- MAX WITHOUT REHEAT
AS REQUESTED *
SPECIFIC TESS
A Automatic Control Syst. N Nay systemB PitchYaw Damper M EngineC Roll stabilizer P Equipment.SystemsD Altitude Warning~monit. T Radio comm.E Airbrakes S Low speed warn.syst.F U/C Warning X Tail parachuteG U/C extension, retraction V AutothrottleK Load factor Q Fuel quantity indic.L Engine overspeed Z Radio Altimeter F131R RadarWeapon syst. e Air condit.syst.

1-25
MIRAGE HII E FLIGHT 8ALTITUDE
40 Thousand of feetACERT1NMACHACERAINCIS
2.0 1.8 1.6 1.4 1.2 1.0
30
S25 000 FT
20 KEY TO SYMBOLS20 REFER TO FIG 13
.- M N e) B10
LANDING TAKE OFF WITH REHEAT DSAC
ALTITUDENThousand of feet
60- L15
Ire
50m AB c- MIRAGE IJI E FLIGHT C
40- MACHACERAINCISL8 1.1 1.6 1.5 1.4 1.3 1.2 1.1 LO0
30--V
MRABCR TOFG1
30_
20 KEY04 TO SYMOL
TAKE Off WITH REHEATDITNC I

1-26
MIRAGE IE 16
FLIGHT 0: NAVIGATIONMEL CEILI
APPI.

* 2-I
USAF DEVELOPMENT TEST AND EVALUATION
by
LAURENCE P. COLBURN6510 TEST WING/TEEES
EDWARDS AFB, CALIFORNIA, U.S.A. 93523
SUMMARY
The test and evaluation of new weapon systems is an integral part of the total acqui-sition process. The major emphasis in the early development stages is placed on quanti-tative test and analysis to determine functional adequacy and specification compliance.Highly instrumented aircraft are used to provide data on aircraft performance, flyingqualities, structural integrity and subsystem operation, This paper addresses the manage-ment and test procedures used at the Air Force Flight Test Center (AFFTC) to plan, conductand report on the Development Test and Evaluation (DT&E) phase.
INTRODUCTION
The system acquisition process may be initiated through a request for proposal whichdetails the operating characteristics and capabilities of the desired weapon (F-16, A-10)or support system (C-5, KC-10). Interested contractors then submit design proposals in-tended to demonstrate their solution to the operational requirement. These proposals arethen studied from both technical and economic standpoints and a contract awarded for pro-duction of prototype article for initial development evaluation. A more recent adaptationof this procedure has evolved as a "fly-before-buy" concept utilized by the United StatesAir Force (USAF). In this process, the top two proposals are identified and a limitednumber of vehicles are built in prototype for a competitive fly off. This allows anintensive evaluation of the competing entries in the major areas of performance, flyingqualities, structures and system evaluation. Confidence in the final selection is natu-rally much higher than that achieved from studies of "paper airplanes" because major prob-lems may be corrected earlier in the acquisition process. This procedure has been success-fully used in A-9/A-10, F-16/F-17, Advanced Medium Short Takeoff and Landing Transport andAir Launched Cruise Missile developments.
A view of total systems acquisition process (figure 1) may be helpful in putting themajor decision points and the interrelationships of participating organizations in per-spective. Emphasis in this paper is on the DT&E process which is the test and evaluationconducted to demonstrate that engineering design and development are complete, that designrisks have been minimized, and that the system will meet engineering and operationalspecifications. DT&E is essentially a detailed engineering analysis of a system's per-formance beginning with individual subsystems and progressing through a complete system,where system design is tested and evaluated against engineering and performance criteriaby the implementing command (Air Force Systems Command in the USAF). Operational Test andEvaluation (OT&E) is usually an early and concurrent phase of the acquisition process asdepicted in figure 1. OT&E is conducted to estimate a prospective system's operationaleffectiveness and operational suitability and to identify any operational deficiencies andneed for any modifications. In addition, OT&E provides information on organization, per-sonnel requirements, doctrine, and tactics. OT&E is essentially an operational assessmentof a system's performance where the complete system is tested and evaluated against opera-tional criteria (requirement and employment concepts) by personnel with the same qualifi-cations as those who will operate, maintain, and support the system when deployed.
The policy on Test and Evaluation is stated in Department of Defense Directive (DoDD)5000.1 Major System Acquisitions (reference 1). The stated policy is "Test and evaluationshall commence as early as possible. An estimate of military utility and of operationaleffectiveness and operational suitability, including logistic support requirements shallbe made prior to large scale production commitments. The most realistic test environmentpossible and an acceptable representation of the future operational system will be used inthe testing." This policy is further explained in DODD 5000.3, Test and Evaluation(reference 2) which directs that "In each DoD component there will be one major field agen-cy, separate and distinct from the developing and procuring command and from the usingcommand, which will be responsible for OT&E." In the Air Force, this agency is the AirForce Test and Evaluation Center (AFTEC), a separate operating agency responsible for theoverall management of OT&E. AFTEC's role, detailed in Air Force Regulation (AFR) 23-36(reference 3), is to plan, direct, control and independently evaluate and report on OT&E.While OT&Z ideally should be separate from developmental testing, the early phases mayneed to be combined with DT&E. DODD 5000.3 policy states: "Operational testing should be
separate from developmental testing. However, developmental testing and early phases ofoperational testing may be combined where separation would cause an unacceptable increasein the acquisition cost of the system." In practice, a great deal of the two test phasesare accomplished concurrently for major system acquisitions to conserve costly test re-sources and reduce test time. The management structure which allows this is shown in fig-ure 2. AR 80-14 (reference 4) details the operating interrelationships which are die-
in thn1

2-2
DT&E is carried out to assess the critical questions and areas of risk of the systemand to meet the development objectives specified in the program documents. DT&E shouldaccomplish the following (reference 5):
1. Provide data to the contractor for the development process.
2. Identify deficiencies in the system, deficiencies in the development contractspecifications, and determine the degree to which those specifications have beenmet.
3. Insure the compatibility and performance of the support items (for example:simulators, life support systems, support equipment, computer resources, tech-nical manuals and other data).
4. Provide estimates of deployed system reliability and maintainability to be
expected when deployed.
5. Determine if the system is safe and ready for operational testing.
6. Accumulate and provide data to estimate the survivability, vulnerability, andlogistics supportability of the system.
7. Provide data for the compatibility and interoperability of the new system/equipment.
8. Provide data for refining estimates of requirements for training programs andtraining equipment.
9. Provide information on environmental issues to be used in preparing impactassessments.
10. Insure design integrity over the specified operational and environmental range byconducting preproduction qualification tests.
11. Validate and verify technical orders and computer software.
TEST PROGRESSION
Most DT&E programs have a set pattern of evolution. Early participation by AFFTC,using command and logistics personnel includes program and design reviews, reviewing andcommenting on documents, such as specifications and hazard analyses, preparation ofdetailed test plans, monitoring ground tests, and obtaining data for later use. Componentqualification tests at the vendor's facility are not usually monitored by the AFFTC.
The overall evaluation begins as the first aircraft is assembled and the various sub-systems are integrated for functional operation. Initial ground tests emphasize individu-al subsystem development and "debugging" which includes the interfaces among all the majorsubsystems. Early flight tests demonstrate basic vehicle airworthiness, handling quali-ties and satisfactory function of major subsystems such as flight controls, landing gear,engine, hydraulics and electrical. The instrumentation systems are also evaluated forfunction and accuracy during the initial flight stages as well as acquiring data for analy-sis. Flights progress with basic envelope expansion in the structural, flutter and flyingqualities areas. Initial functional systems tests are performed concurrently. The con-tractor normally maintains the aircraft during this period with subsequent Air Force main-tenance participation and finally, full Air Force maintenance in subsequent test phases.As the flight test activity progresses, the focus changes to an overall assessment of thetotal aircraft by subjecting the aircraft to environmental extremes, allowable limits andprojected operational usage. Some of the subsystems are evaluated separately to obtainbaseline information prior to evaluating the aircraft as a total weapon or support system.These tests are basically a continuation of the initial tests but the emphasis is testingagainst the operational requirement, testing for specification compliance, and determiningthe functional characteristics. The tests are designed to quantitatively and qualitativelyassess the capability of the total system to perform its design mission. Although not anintegral part of the aircraft, support equipment must be evaluated as part of the totalsystem. Reliability, maintainability, human factors, technical order, and other areas areevaluated to complete the assessment of support equipment and man machine interfaces(reference 6).
PROGRAM MANAGEMENT
Planning
Test programs require a considerable amount of planning, which includes definingobjectives, organizing and staffing the test organization, identifying and obtaining re-quired support, preparing detailed test plans and establishing reporting requirements.However, there are certain requirements that merit special attention. These include thefollowing:

2-3
1. Aircraft, systems and support equipment should be configured as closely as possi-ble to a production version. A frequent problem is that the test agency is usu-ally constrained to the use of preproduction aircraft and equipment which may notbe updated in time to allow effective evaluation of the changes.
2. Instrumented aircraft and ranges must be available to provide data for quantita-
tive analysis of test results.
3. Adequate calendar and flying time must be allocated for an effective evaluation.
4. The resources necessary to accomplish the program, including personnel and facil-ities, must be provided.
5. The Air Force (customer) should maintain the test aircraft with adequate person-nel, training, and skills to accomplish the test program effectively.
6. Technical manuals that are adequate for use by maintenance, aircrew, and engi-neering personnel must be available.
Organization
At the AFFTC, the test organization for a major program is normally designated as aCombined Test Force (CTF) which is organized and manned to accomplish all of the programobjectives, including all participating commands, and integrate all test and evaluationactivities. A typical CTF organization is shown in figure 2. To simplify the diagram,lines of communication within the CTF are not included. The number of personnel requiredis dependent upon the objectives, number of aircraft, complexity of the aircraft, and fly-ing and calendar time required.
Present day major flight test programs focus on combined (AFFTC, contractor, AFTECand operating and support commnands) DT&E/IOT&E (Initial Operational Test and Evaluation)programs (reference 7). The AFFTC and the contractor are responsible for the DT&E portionof the program and AFTEC manages the IOT&E portion. Two of the major areas of emphasis inworking with personnel from the participating commands are to minimize duplication of test-ing and to insure testing is oriented toward real world requirements. The focal point foroperational test requirements is AFTEC. Although much aircraft testing has an operationalflavor, critical parameters are rigorously controlled for an engineering assessment oftest results.
One of the key requirements in establishing a test organization is definition ofresponsibilities. The concept used on the YF-16/YF-17 Lightweight Fighter PrototypeProgram, which met with considerable success and is being used as a model for other pro-grams included the following:
1. Close working relationships and coordination between DT&E and OT&E test director.
2. Combined DT&E/OT&E test teams. The test team was comprised of personnel from theAFFTC, AFTEC, participating commands and contractors.
3. Combined test plans. Preparation and coordination of specific plans were accom-plished jointly by Air Force and contractor personnel. A single plan was pub-lished for accomplishment of both PT&E and OT&E objectives.
4. Participation of Air Force pilots in all phases of testing.
5. Integration of Air Force and contractor engineers and pilots. The Air Force ier-sonnel were physically collocated with their contractor counterparts.
6. Availability of all data to all members of the joint test team which facilitatedindependent analyses and reporting.
7. Combined Air Force (AFFTC, AFTEC and participating commands) deficiency report-ing represented the total expertise and general consensus of the Air Force testteam personnel.
8. Independent analyses and reporting allowed each organization to express its ownviews relative to its basic assumptions. This also gave the Air Force ManagementAgency (Program Office) added confidence in the test results on which all organi-zations agreed. In addition, it gave the Program Office more visibility and theopportunity to follow up on areas of disparity.
Total Program Integration
Numerous tests and evaluations must be accomplished to adequately satisfy programobjectives. One of the keys to overall systems testing is the integration of test plan-ning and test activities.

2-4
Normally, all of the major systems and components are evaluated. Some are evaluatedseparately to obtain baseline data before evaluating the total system. As an example,accuracy of the ranging of a forward looking radar is assessed prior to determining air-to-air gunnery or weapon delivery accuracy.
Specific evaluations must also-be integrated since many of them overlap. As an exam-ple, the human factors coverage must overlap into both the pilots' and the maintenanceevaluations of the cockpit. In turn, pilot inputs are an important part of the stabilityand control evaluation.
Instrumentation and Data Processing
Instrumentation and data processing systems are extremely important components ofsystems evaluation. The introduction of magnetic tape to airborne instrumentation systemsapproximately 20 years ago gave rise to a variety of instrumentation hardware and softwaredevelopments. Many airborne systems were developed in the United States by aircraft con-tractors to meet their own unique requirements. Compatibility with other facilities, suchas the AFFTC, was not a design requirement since it was assumed that most of the datawould be processed at the contractor's home plant. However, in many instances, the USAFeventually obtained the aircraft for testing. The AFFTC became involved with almostevery type of aircraft and instrumentation system ever built in the U.S. This led tonumerous support problems such as incompatibility with data processing hardware and soft-ware, maintainability problems, and long data turnaround times because it was necessary touse nonproduction oriented operations to force data through the system. In addition, thesystem had little or no residual value to the USAF because of the proliferation of manyunique, modified and often undocumented systems.
These problems, combined with the evolutionary changes in test philosophy towards
combined testing, mandated standardization of data acquisition and processing systems.This led the AFFTC to develop under contract, a modularized standard instrumentation sys-tem which could be easily maintained and supported as well as being compatible with AFFTCdata processing facilities. This system is currently being used or is planned for use ina wide variety of future aircraft test programs. Its development and use has alleviatedmany of the past data acquisition system problems which confronted the AFFTC.
Similar problems were encountered with data processing hardware and software. Dataacquisition system commonality solved some of the problems in these areas. In addition,action was taken at the AFFTC to develop and document a library of general purpose compu-ter subroutines which can be combined with airplane unique subroutines such as enginethrust calculation procedures. These approaches, the General Subsystem Analysis Program(GSAP) and Uniform Flight Test Analysis System (UFTAS), have alleviated many of the soft-ware development, checkout, control and documentation problems which occurred on past pro-grams (reference 8). Additional detail in the use of the computer in flight test is con-tinued in reference 9.
Reporting
Written AFFTC reports on DT&E results typically include deficiency, management andfinal reports. OT&E results are reported separately and independently by AFTEC. A sig-nificant amount of effort is expended on deficiency reports since these are consideredaction documents that are used to identify problems which should be corrected or studiedfor possible correction or refinement. The most effective method of preparing the defi-ciency reports is to have integrated inputs to each report from all interested organiza-tions on the combined test team.
Management reports are submitted on a regular basis to the Program Office and otherkey organizations. Normally, they are submitted on a monthly basis and include programstatus and limited or summarized test results.
Final technical reports are published after the program is completed, or when sig-nificant portions of the test have been accomplished. Special emphasis is placed on in-cluding positive features as well as problem areas. Qualitative information and quanti-tative data are included. A compact test summary report is also published on some pro-grams. The objective of this report is to present a concise overview of the entire testprogram in one document.
The AFFTC has also established a "corporate memory" data bank to feed back and com-pile problem areas with program management and major hardware problems. The intent is tohave information available to aid personnel on new programs and thereby maximize utiliza-tion of past experience.
TEST AND EVALUATION
Certain tests, common to all aircraft programs, include functional tests of systemssuch as propulsion and avionics and integrated areas of evaluation, such as testing atvarious climatic extremes. There are also evaluations such as the reliability and maintain-ability assessment which do not normally require dedicated flight time. Although not an in-tegral part of the aircraft, support equipment must be evaluated as a part of the total sys-tem. Following are discussions of each of the major evaluations accomplished during DT&E.

2-5
While space does not permit detailed coverage, examples of instrumented parameters, testmethods and generalized analysis procedures are discussed. A major share of the analysisworkload is comparison of the quantitative data to contract specifications. This activityis common to all the following subsystem discussion and will not be repeated under eachheading.
Performance
Performance testing involves a large number of parameters ranging from as few as 20parameters on a limited program to as many as 200 parameters for a multiengine aircraftprogram. Some of the primary parameters include airspeed, altitude, normal and longitudi-nal flightpath acceleration, angle of attack, total temperature, fuel flow and fuel quan-tity. Engine instrumentation often accounts for the bulk of the performance instrumenta-tion with engine rpm's, temperatures, pressuLRs and fuel flow.
The objectives of performance testing are to evaluate the aircraft against variousperformance specifications and to generate a performance model used for Flight Manuals andflight simulators. Basically the task involves generating a thrust-drag-fuel flow modelfrom conventional (climb, cruise, accelerations and turns) and dynamic roller coaster,windup turns and split-S) maneuvers. The resulting model should be able to accuratelyestimate the performance (excess thrust, fuel flow) of the aircraft for any set of condi- Ations within the operational envelope. Data from the conventional maneuvers (such asclimb rates, specific fuel consumption, turn rates) are also presented to give confidence
to the model and for comparison to other aircraft.
Flying Qualities
A representative listing of measurands for flying qualities testing would fill sever-al pages and be dependent on the design of the flight control system of the aircraft beingtested. A representative number of 60 to 75 parameters would be valid for a tacticalfighter. Primary examples include indicated airspeed, pressure altitude, ambient tempera-ture, angle of attack and sideslip, control surface positions, fuel quantities, aircraftattitudes and angular rates, three-axis accelerations, control forces, and some internalflight control parameters.
The primary objectives are to determine if the aircraft flying qualities meet the AirVehicle Specification, to evaluate its ability to perform the design missions and todevelop a stability and control model of the aircraft for use in flight simulators. Realtime monitoring of engineering units data is important during these tests, especially dur-
- ing hazardous missions such as high angle of attack flights. Typical postflight dataanalysis involves processing of dynamic maneuver data through a parameter identificationcomputer program to extract stability and control derivatives, analyzing pseudosteadystate maneuvers such as windup turns and steady sideslips for specification compliance,analyzing rolling maneuver data for time-to-bank, maximum roll rate, roll coordination,and roll coupling susceptability, and evaluation of data from pilot-in-the-loop tasks suchas air-to-air and air-to-ground tracking, formation flight, in-flight refueling andInstrument Landing System (ILS) landings for frequency response and task performance in-formation.
Flutter
Primary flutter instrumentation consists of accelerometers placed in wing and empen-nage locations to record surface movement. This is a test where real time analysis is amust. Data from the accelerometers are telemetered (TM) to a ground station for analysis.The test points are done to examine the trends of frequency and damping of critical modes.Critical test conditions are established from predictive analyses which are based onextensive wind tunnel and ground vibration investigations. Surfaces may be excited bymechanical methods (shakers), aerodynamic vanes or by abrupt inputs through the aircraftcontrol system. Data recorded at the ground station are processed through a minicomputerbased time series analyzer with associated software. In near real time the flutter testengineer analyzes damping characteristics and establishes trends with respect to airspeedto determine if the test may progress to more critical conditions (reference 10). Exten-sive postflight, or posttest, analysis is made against the predictive analysis to determinea safe operating envelope for the clean aircraft or with weapon configurations.
Structures
Structural instrumentation consists of strain gauges located throughout the aircraftthe major load carrying members. The gauges may provide stress levels or may be com-
bined to give shear, bending or torque loads. The test engineer uses buildup techniquesin aircraft maneuvers end dynamic pressure to insure that loads do not exceed the limitsote sctue. Einextrimely helpful. Postflight analysis of the exact test conditionompte srstue. Eineremeint uith toeredicte loansi of anals st onitinprovides a correlation data point with the predictive loads analysis.

2-6
Airframe Subsystems
The airframe systems include the structure, canopy, landing gear (brakes, steering,etc), flight controls, secondary power (hydraulics and electrical) and environmental(cabin conditioning, oxygen system, pressurization, etc) subsystems. Many of the airframesubsystem evaluations are conducted concurrently with other tests although some requirededicated time.
Instrumentation is mandatory for tests of the brakes, flight controls, secondarypower and environmental systems, and the arresting hook. Brake instrumentation typicallyincludes electrical signals, torque, pressures, and temperatures. Hydraulic pressures andtemperatures and electrical voltages and frequencies are instrumented. Extensive hydrau-lic and environmental control system instrumentation is required for climatic tests atextreme ambient temperatures.
The primary objectives of evaluating airframe subsystems are to determine their func-tional adequacy, operating characteristics, and potential operational effectiveness.Emphasis is placed on testing at flight conditions which closely approximate expectedoperational usage. Specific tests are also integrated with climatic tests, which are dis-cussed in another section of this paper.
Of primary concern are basic flight subsystems and those which allow the system toaccomplish its design mission(s). Evaluating the integration of these subsystems with theairframe system is an important part of the total system test. Evaluations which requirespecial attention because they are potentially hazardous include simulation of degradedmodes of operation, maximum performance braking tests, and aircraft/arresting gear com-patibility. Braking performance on wet runways is also determined. In addition, certaintests are accomplished to determine the effects of ground operation such as the waterspray characteristics induced by the nosewheel tires. Of primary importance are theeffects of water ingestion by the engine.
A functional analysis of component design and failure frequency is a major part ofthe assessment which requires no instrumentation. These problems are documented andrecommendations for correction made in the Discrepancy Report previously discussed. Thesereports form a substantial input to the airframe as well as all subsystem analyses dis-cussed in this paper.
Quantitative data analysis may vary widely for airframe subsystems. Brake tempera-tures may be evaluated to identify a need for increased brake stack sizing or in deter-mining handbook stopping distances under varying speed/gross weights. Hydraulic pressuresand flow rates are utilized to evaluate system capacity to handle varying workloadings.Electrical parameters can pinpoint system transients or overload conditions. Tailhookloads are analyzed to determine barrier engagement types, gross weight limits, speedlimits or offcenter maximums. Environmental control system pressures, temperatures andflow rates are used to evaluate system turbine efficiency, heat exchanger sizing and over-all system capacity.
Propulsion and Fuel Systems
For purposes of this paper, the propulsion systems include the engine, fuel system,auxiliary power unit, jet fuel starter and emergency power unit. Although extensivetesting is accomplished in test cells and wind tunnels prior to flight, many of the vari-ables to which an aircraft is exposed cannot yet be duplicated on the ground. As a conse-quence, propulsion system flight testing remains the only true test of integration betweenthe engine, flight airframe, and related systems.
Typical parameters to be measured are fuel flow rates, throttle position, compressor/turbine pressures and temperatures, fuel quantity, and jet fuel starter temperatures andpressures.
The primary propulsion system test objectives include determination of functionaleffectiveness. Test conditions as close as possible to operational usage are stressed.Tests are also integrated with other specialized types of evaluation, such as climatic andicing tests, which are addressed in other sections of this paper.
Of primary concern are the operating characteristics of the engine. They are evalu-ated during ground and air starting, engine transients, afterburner operation, extremeaircraft maneuvering such as air combat maneuvers, and high angle of attack flight. Theair start and afterburner operation envelopes are normally verified. Real time data isessential for certain tests of single-engine fighters such as air starts.
Obtaining a high amount of operating time on one or two engines is normally stressedto identify any problem prior to high usage of the engine in the field. The evaluation ofpropulsion performance parameters which are directly related to aircraft performance,e.g., fuel flow and specific fuel consumption, is also addressed.

2-7
Other areas of investigation include engine/bay compatibility, engine/armament com-patibility and external noise level surveys. Exhaust gas signature characteristics arean important consideration for aircraft to be operated in a combat environment. Aerialrefueling normally requires developing an operating envelope for inclusion in the aerialrefueling handbook.
The jet fuel starter is evaluated during ground and air starts. Evaluations of theauxiliary power and emergency power units also include both ground and in-flight startingand operation, with emphasis placed on their ability to provide sufficient power output toaccomplish their intended function under all expected operational conditions.
Analysis of these parameters results in the identification of airspeed/altitude enve-lopes for engine restart and afterburner relight capability for publication in the FlightManual. The fuel control may be rescheduled based on engine thermodynamic and mass flowanalyses. Jet fuel starter operational limits may be extended or limited as a result ofparameter analysis in that subsystem. In-flight refueling envelopes are defined for in-clusion in the Flight Manual.
Avionics Subsystems
The ultimate objective of avionics subsystem testing is to verify individual sub-system performance while evaluating the adequacy of the total integrated avionics package.One result of the sophistication of today's aircraft avionics systems is the difficulty inisolating systems for individual evaluation or troubleshooting. The latest technologicaltrend in integration of aircraft avionics systems is to employ digital data busses withinternal time division multiplexing. This creates unique and challenging problems in in-strumentation and software. Software is an integral part of the complete data acquisitionsystem, and preparation for the evaluations begins with the initial software developmentand component fabrication. Early correlation of measured parameters with evaluation cri-teria is required as a definition of the interface between airborne recording systems andground processing of data. Subsystem components, instrumentation, and software are exer-cised and refined during preliminary development with dynamic simulation in an integra-tion laboratory. Individual subsystem development dominates the initial flight tests. Asthe test activities progress, the focus changes to overall assessments of the total inte-grated avionics systems by subjecting the aircraft to allowable limits, projected opera-tional usage, and environmental extremes.
There are a multitude of individual avionics subsystems and interfaces which may re-quire evaluation and numerous ways of categorizing avionics equipment by functional ele-ments. For discussion purposes, subsystems may be subdivided into the following majorelements: navigation/guidance, fire control, penetration aids, communications, recon-naissance, automatic flight control, central integrated checkout and auxiliary electronicsequipment.
Rather than give a brief discussion of evaluation requirements for a number of theabove subsystems, a system involving a number of interfaces will be treated in some depth.A terrain following system has been selected because it involves numerous avionics inter-faces as well as with basic airframe subsystems such as the mechanical flight control sub-system.
Terrain following radar (TFR) subsystems usually provide low altitude terrain follow-ing, terrain avoidance and blind letdown capabilities. The TFR may consist of antennareceivers, transmitters, computers and power supplies, a radar scope panel and a controlpanel. The TFR receives inputs from the radar altimeter, attack radar, bomb-nay system orauxiliary flight reference system and central air data computer.
Typical data for TFR evaluation are gathered from the multiplexer bus on modern sub-systems. These might include forward looking radar range and range rate, radar altitude,inertial groundspeed, aircraft g, pitch attitude and rate, and airspeed.
With current TFR systems, the aircraft may be flown manually or automatically at apreselected terrain clearance. Climb and dive signals generated can be coupled into theattitude director indicator (ADI) and heads-up display (HUD). In the automatic mode, theclimb and dive signals are coupled into the pitch channel of the flight control system.The TFR mode can also be used to make blind letdowns to a presel~cted terrain clearance.
TFR test objectives typically include evaluation of manual and automatic terrain fol-lowing modes, including an evaluation of performance against various terrain features suchas sand dunes, trees, water, snow and sea-land transitions. The system must also beevaluated over terrain profiles which vary from gently rolling hills to abruptly changingmountainous terrain.
TFR evaluation provides an excellent area for the utilization of real time data(reference 11). A unique and complex application of the real time system was used toevaluate the B-1 in the TFR environment. The test engineer was provided with displaysshowing the terrain profile of a test course at the AFFTC and the aircraft flight profileabove that course, as well as deviations from predictions. This application merged onboardTH data with range data from a number of sources. The flight test range radar and onboardnavigation and control systems data were merged in the central computer to provide thesereal time displays for analysis.

2-8
A TFR evaluation is a prime example of a test which blends an evaluation of inte-grated subsystem performance with an assessment of aerodynamic characteristics. Avionicssubsystems evaluated during TFR runs include the radar, air data computer and cockpit dis-plays, including the HUD. Airplane control characteristics and performance capabilitiesmust be factored into the terrain following system to insure that terrain clearance pro-files are compatible with the aerodynamic characteristics of the vehicle.
Armament
The primary objective of armament testing is to determine if the aircraft/store com-bination can be employed to the criteria established by the technical specifications anduser requirements. Aircraft/munition compatibility and delivery accuracy are the finaltests in a complex effort starting with the conception of a munition and an aircraft whichdemonstrate the ability of both to function as a weapon system.
Prior to beginning the certification process on a given aircraft, which is discussedherein, the weapon itself goes through a development cycle. To illustrate, a conventionalbomb is designed to meet a given requirement which dictates shape, size, fin configura-tion, warhead arming and fuzing. The weapon is manufactured as a prototype. Loading, fitchecks and electrical compatibility tests are accomplished. The weapon is then tested foreffectiveness against appropriate targets, arming/fuzing functions are evaluated and theability to withstand airborne carriage environments is determined. If these tests provesatisfactory, the weapon is ready for certification on new and existing aircraft.
Separation characteristics are initially investigated in the wind tunnel. Modelweapons may be separated from the wing in free fall or in captive mode through sting bal-ance measurements and computer positioning. Pitch, yaw and roll rates are determined forvarying airspeeds. The weapons are next separated from the aircraft with these parametersrecorded by aircraft mounted cameras. This data is compared with wind tunnel results anda safe separation envelope (airspeed-altitude) determined for the aircraft/store configu-ration. The primary objective of store separation testing is to determine an airspeed/altitude envelope within which a store may be safely separated from an aircraft. This maybe a single store release or ripple (as used in weapon delivery) or jettison of a bombrack with weapons attached.
In addition to analysis of single store separation, store/store collision after re-lease and jettison of full/partially full racks and fuel tanks are also of interest. Rip-ple release of bombs is evaluated to determine the minimum release interval to obtain thetightest possible ground pattern without bomb collisions in flight. Determination ofejection velocity is also important for use in accuracy analysis and ballistic evaluationas discussed later. Clearance envelopes must also be determined for emergency jettison ofloaded or partially loaded racks or pylons. Careful analysis of center of gravity loca-tions must be accomplished prior to tests of this type. External fuel tanks may usuallybe jettisoned full with minimum difficulty. Empty tanks normally present problems athigher airspeeds as they tend to fly after release and may contact the aircraft. Partial-ly full tanks may be difficult to jettison due to tumbling tendencies induced by centerof gravity variations depending on the method of mounting/jettison.
The instrumentation for armament system testing may be divided into three generalcategories: airborne systems to record aircraft parameters and photography, range in-strumentation for external measurement of aircraft position/release conditions and wea-ther data for computation with range data. Some typical examples of aircraft-instrumentedparameters are airspeed, altitude, dive angle, pitch/roll yaw attitude and rate, g, radarrange and range rate, and weapon release/fire event. HUD film records pipper position atthe weapon event while external cameras provide data on weapon pitch/yaw/roll rates andposition during separation. Range instrumentation consists of tracking radar and cine-theodolites to provide aircraft x, y and z position dynamic rates.
Weapon delivery accuracy evaluation comprises two major areas: error analysis and astatistical presentation of weapon scoring. Error analysis is conducted to determine thereasons why the bomb missed the target. Errors may arise from two sources: (1) the air-craft was not at the planned release conditions when the bomb was separated, and/or (2)ejection/separation effects were such that the predicted ballistic trajectory was notobtained.
Aircraft dynamics at time of release are determined by range space positioning in-strumentation and the recording of onboard parameters. If the bomb missed the target, theaircraft release conditions are reviewed to determine if planned release conditions weremet. Errors on the ground are correlated with release errors. The analysis becomes morecomplex with computer bombing systems in automatic modes since the aircraft position atrelease is not preplanned. Here the aircraft conditions at release are compared withwhere the computer "thought" the aircraft was and the analysis conducted from this point.When aircraft release condition errors are identified, steps may then be taken to correctthe problems which caused them.
If the aircraft was at the programmed release conditions and the bomb still missedthe target, the problem lies in release dynamics; (i.e., delayed release, ejection velo-city error) or basic weapon trajectory. Onboard cameras are used to study weapon separa-tion and determine anomalies in the immediate vicinity of the aircraft. Phototheodolites

2-9
are used to record weapon trajectory. The end result is an aircraft which can be posi- Itioned properly and a weapon which will hit the target (within the tolerances allowed inthe weapon system specifications).
Computer batch processing plays an extremely important role in reduction and analysis
of this data. Onboard and HUD data are merged and utilized in a predictive ballisticsprogram to indicate bullet position relative to a target for air-to-air gunnery evalua-tion. A series of programs is also used in air-to-ground weapon delivery analysis todetermine error sources and their effects on weapon impact-to-target relationship.
Finally, statistical analysis is prepared to present actual miss distance data in aform which allows assessment of the system capability. Circular error probable (CEP) isperhaps the most common method utilized. In this analysis, the radius of a circle is de-fined which will contain 50 percent of all bomb impacts.
Several papers in reference 12 address more specific aspects of range instrumentationand weapon test techniques.
Climatic Test
The overall goal of climatic flight test is to evaluate the aircraft, support equip-ment, maintenance procedures and related human factors while operating in the variousenvironmental extremes. This is accomplished through four test phases: Climatic labora-tory tests at Eglin AFB, Florida, arctic tests at Eielson AFB, Alaska, tropic tests atHoward APB, Panama, and desert tests at Yuma Marine Corps Air Station, Arizona, orEl Centro Naval Air Station, California.
The primary goals of the climatic laboratory tests are to establish subsystem base-line data under controlled conditions and to identify any potentially hazardous climaticrelated deficiencies prior to flight tests. Any major deficiencies discovered in thelaboratory are corrected and the modifications are evaluated at the remote test sites.The laboratory provides a full exposure of temperatures from -54 to +52 degrees C (-65 to125 degrees F). All systems including the engine are operated in the. laboratory. Nor-mally, the tests begin at 21 degrees C (70 degrees F) and are then lowered to -18, -32,-42, and -54 degrees C (zero, -25, -45, and -65 de Pes F). Then they are raised to 21 and52 degrees C (70 and 125 degrees F) with the aircraft exposed to simulated rainfall andsolar radiation. Detailed aircraft inspections are accomplished after the cold and hottemperature exposure. Baseline data from the initial 21 degree C (70 degree F) runs andthe 21 degree C runs after cold soak and heat soak tests are compared.
The arctic test phase is conducted during January and February when the maximum num-ber of cold days is normally encountered. The overall objective is the evaluation of air-craft operations in an extreme cold environment. The aircraft must be exposed (soaked) ator below -29 degrees C (-20 degrees F) for a sufficient length of time to allow internalstabilization of component temperatures at or near ambient conditions. Tests are thenflown to simulate mission profiles while utilizing all of the systems.
The tropic test phase is normally conducted during October and November. The May-June time period may also be an acceptable alternative to the fall period. After periodsof rainfall, the aircraft is inspected for entrapped moisture and initiation of corrosion.Special attention is also given to the environmental control system, due to the additionalload required to remove humidity in the cooling cycle.
The desert test phase is conducted during July and August to expose the aircraft tomaximum ambient temperature conditions, combined with high solar radiation levels. Theaircraft is heat soaked for four hours prior to each mission and a 72-hour heat soak testis accomplished. Particular attention is given the environmental control system, hydrau-lic and engine lubrication system. Special attention is also given the cockpit to expo-sure to solar radiation.
Some examples of the quantitative analysis output of this test phase are identifica-tion of design deficiency in hydraulic heat exchanger capacity, failure of hydraulic actu-ation times at low temperature due to fall off of flow rate and identification of environ-mental control system capacity to provide avionics cooling through mass flow rate limit.These are but a small sampling of potential utilization of the many parameters availablefor climatic test. Much of the data is presented in tabulated or graphical format to aiddesigners of future systems in coping with realistic extremes of the environment.
Much additional information on climatic, as well as other areas of test and instru-mentation outlined in this overview paper, will be detailed in the AGARD Flight MechanicsPanel Symposium on Subsystem Testing/Flight Test Instrumentation. This symposium will beheld in Geilo, Norway in October 1980 and proceedings will be available in the spring of1981.
Adverse Weather
The basic objectives of adverse weather testing are to evaluate the aircraft and itssystems during all phases of operation in simulated and actual adverse weather and toestablish operating procedures and techniques for inclusion in the Flight Manual.

2-10
This is accomplished by evaluating instrument flight characteristics during variousphases of flight (descents, instrument approaches, etc) and various simulated and naturalclimatological conditions (rain, turbulence, thunderstorm activities, etc). Other generalevaluations include evaluation of the cockpit, night operations, ground handling on runwaysurfaces covered with ice, snow, slush, and water, and effects on systems.
The simulation tests are conducted under stringently controlled conditions prior toconducting tests in natural conditions. Rain and icing conditions are simulated by theuse of KC-135 and C-130 aircraft water spray tankers. Special emphasis is placed on anal-ysis of ice formation and texture to verify icing severity, water droplet size, and ambi-ent temperature conditions. In the case of the F-16 aircraft, very stringent lightningtests will be accomplished on the ground prior to flying near thunderstorm activities.After the simulation tests are completed, testing is accomplished in natural conditions.
Reliability and Maintainability (R&M)
The R&M evaluation results in qualitative and quantitative information. The latterincludes data products such as mean-time-between failure and maintenance man-hours perflying hour. The evaluation is heavily supported by maintenance personnel and must inter-face with the human factors efforts in a number of areas such as accessibility.
The basic procedure used at the AFFTC to obtain, store, retrieve, and analyze allmaintenance and operational data is called the Systems Effectiveness Data System (SEDS).This system is an Air Force Systems Command unique system and is designed spec4 fically foruse on weapon systems under test.
The concept of building prototype aircraft to predict operational suitability and re-duce risk had a resurgence in the U.S. in the early 1970's. The value of an R6M effort ona prototype program was the subject of considerable debate for a number of reasons. Nor-mally, maintenance is performed by the contractor with very little (if any) USAF "handson" maintenance activity. This limits the R&M evaluation to an over-the-shoulder obser-vation exercise. Secondly, many features of prototype aircraft are not representative ofa production article. As a consequence of these and other factors, objectives that havebeen developed as realistic expectations for prototype R&M evaluations are to: (1)identify system candidates for R&M improvement; (2) identify areas to retain prototypeR&M; (3) identify system and component candidates for reliability verification testing;(4) compute achieved/forecast R&M parameters; and (5) update R&M analytical models. Inaddition, the maintainability evaluation will result in a qualitative assessment of opera-tional suitability (access, skill level, inspection cycle, etc), analyses of fault isola-tion equipment, logistics support requirements and maintenance technical data, determina-tion of compatibility with USAF facilities and assessment of training aids. In summary,the R&M evaluations are required to realize the full benefit of the prototype concept andto provide advanced indications of production system operation.
Human Factors Engineering (HFE)
The HFE evaluation is an integral part of the total weapon system evaluation andtherefore interacts with all aspects and elements of the CTF. It is concerned withdetermining whether USAF personnel can operate, maintain, and support the weapon systemin its intended operational environment. The specific objectives are to determine if:(1) human engineering requirements and criteria (noise, temperature, access, comfort,visibility, performance and anthropometry) have been incorporated into the system designand are adequate; (2) biomedical and safety criteria (lighting, toxic gas, acoustics,and ventilation) have been met; (3) the system provides for efficient human performancein its intended operational environment; (4) personnel (speciality codes, skills, andnumber) planning information is appropriate, complete, and adequate; (5) job performanceaids are efficient and adequate; and (6) training and training equipment requirementshave been met. In addition, there is participation in the technical publication verifi-cation effort.
The HFE evaluation is supported by the pilots and maintenance personnel. The methodsof acquiring information include observations, interviews, debriefings, photography andcockpit evaluations. In addition, a video tape is invaluable in documenting human tasksand verifying and extracting results. Flight test instrumentation is also used forobtaining cockpit toxic gas data and temperature.
Systems Safety
The systems safety evaluation consists of reviewing hazard analyses accomplished bythe contractor, addressing systems safety during planning of hazardous tests and classi-fying problem areas by hazard level. Although AFFTC personnel do not develop detailedhazard analyses, such as fault tree analysis, reviewing the contractor analyses offers theopportunity of becoming familiar with areas of concern, providing feedback to the contrac-tor and Program Office and monitoring areas of concern throughout the program. A con-siderable amount of effort is expended in identifying hazards and hazard codes and effectsof potential hazardous areas in deficiency reports. On some programs, safety relatedtrends are determined by assigning hazard codes to in-flight discovered discrepancies.

2-11
CONCLUSION
The overall DT&E process is both extensive and complex. Properly executed, it re-sults in many subsystem changes and refinements to meet both specification and operationalrequirements. It provides substantial amounts of engineering data and narrative evalua-tions and analysis of subsystem performance throughout the operating spectrum of thevehicle. Not all specifications or operating goals will be achieved; however, most short-falls and their impact will be documented through the reporting process. Any nation in-tending to procure a weapon or support system which has undergone the extensive DT&E andOT&E cycle will do well to thoroughly examine the results. This examination, properlyaccomplished, will provide not only a detailed knowledge of system strengths and limita-tions, but also a baseline of information on which incountry evaluations may be intelli-gently planned. This will allow a concentration of effort within the areas of potentialproblems and on aspects of the system most vital to the buyer's intended operationalusage.
REFERENCES
1. DoDD 5000.1, Acquisition of Major Defense Systems.
2. DoDD 5000.3, Test and Evaluation.
3. AFR 23-36, Air Force Test and Evaluation.
4. AFR 80-14, Test and Evaluation.
5. "Test and Evaluation, A Guide for Test and Evaluation Management", ASDP 80-14,October 1978.
6. Lucero, F.N. and Adolph, C.E., "Overall Aircraft Systems Evaluation" Paper 14, AGARDSymposium on Flight Test Techniques, AGARD-CP-223, Porz Wahn, Germany, October 1976.
7. Adolph, C.E. and Abrams, R., "Joint Contractor - Air Force Flight Test Programs"presented at the Society of Flight Test Engineers Seventh Annual Symposium, St. Louis,Missouri, August 1976.
8. Adolph, C.E., "Flight Testing at the Air Force Flight Test Center: Yesterday, Todayand Tomorrow", presented at the Society of Flight Test Engineers Ninth Annual Symposium,Arlington, Texas, October 1978.9. Maunder, D.P. and Lee, R.E., "The Use of Advanced Computer Techniques in Flight Test
Evaluations" Paper presented at AGARD Flight Mechanics Panel, "The Use of Computers as aDesign Tool", Munich, Germany September 1979.
10. Lenz, R.W., and McKeever, B., "Time Series Analysis in Flight Flutter Testing at theAir Force Flight Test Center: Concepts and Results" Paper 12, Flutter Testing TechniquesConference, NASA SP-415, Dryden Flight Research Center, Edwards, California, October 1975.11. Johnson, C.O., and Sehneret, P.J., "The Automated Flight Test Data System", Paper 25,AGARD Symposium on Flight Test Techniques, AGARD-CP-223, Porz Wahn, Germany, October 1976.
12. AGARDograph No. 219 on Range Instrumentation, Weapons System Testing and RelatedTechniques.
GLOSSARY (reference 5)
1. Aetancets. Those tests performed to demonstrate that a specific lot of articleshave n uactured to specification tolerances.
2. Acquisition Process. Normally, it consists of five phases (conceptual, validation,full scale engineering development, production and deployment) with key decision pointsafter each of the first three phases.
3. Avalaility. Availability is a measure of the degree to which an item is in theoper an committable state at the start of the mission when the mission is called forat an unknown (random) time (inherent availability).
4. Compatibility. The capability of 2 or more operational items/systems to exist or func-tion a ments of a larger operational system or operational environment without mutualinterference.
5. Development Test & Evaluation. That test and evaluation conducted to assist the engi-neering design and development process and verify attainment of technical performancespecifications and objectives.
6. Evaluation. The review and analysis of qualitative and/or quantitative data obtainedfrom design review, hardware inspection, testing, and/or operational usage of equipment.

2-12
7. Follow-on OT&E. That test and evaluation which is conducted after IOT&E to continueand refine the estimates made during the IOT&E, to evaluate changes, and to reevaluatethe system to ensure that it continues to meet operational needs and retain its effective-ness in a new environment or against a new threat.
8. Implementing Comand. The command responsible for the acquisition and/or modificationof the system, subsystem, or item of equipment. For the U.S. Air Force, this is normallythe Air Force Systems Command.
9. Initial Operational Test and Evaluation (IOT&E). That portion of operational test andevaluation conducted prior to Milestone III decision.
10. Logistics Supportability. The degree to which adequate provisions can be made in sys-tem's acquisition for support of test equipment, supply support, maintenance manuals, tech-nical data, and support facilities.
11. Maintainability. A characteristic of design and installation expressed as the proba-bility that an Item will be restored to a specified condition within a given period of timewhen the maintenance is performed using prescribed procedures and resources. System main-tainability may also be expressed in such terms as Mean-Time-to-Repair, Maintenance Man-hours per Flying Hour, or Mean Downtime.
12. Military Utility. A generic term used to describe the value of an item or system withrespect to a current concept of operation.
13. Operational Suitability. The degree to which an operationally effective system can besatisfactorily placed in field use, with consideration being given to availability, pro-ducibility, compatibility, transportability, interoperability, reliability, maintainability,safety, human factors, electromagnetic compatibility, logistic supportability and trainingrequirements.
14. O perational Test and Evaluation (OT&E). Test and evaluation conducted to estimate thesystem's military utility, operational effectiveness, and operational suitability, as wellas the need for any modifications.
15. Preproduction Article. An article which is in final form, uses standard parts (ornonsta ara -parts approved by the agency concerned), and is representative of the finalequipment.
16. Production Acceptance Test & Evaluation. Test and evaluation of production items todemonstrate that items procured fulfill thMe requirements and specifications of the pro-curing contract or agreements.
17. Prototype. First full scale functional form of a new system, subsystem, or component
on which hedfesign of subsequent production items is patterned.
18. Reliability:
a. Hardware Reliability. Hardware reliability is the probability that a part, com-ponent, sibasembly, assembly, subsystem, or system will perform for a specified intervalunder stated conditions with no malfunction or degradation that requires corrective mainte-nance actions.
b. operational Reliabilit. The probability that an operationally ready system willperform as required to accompish its intended mission or function as planned.
19. Survivability. The degree which a system is able to avoid or withstand a manmadehostiie nvionent without suffering an abortive impairment of its ability to accomplishits designated mission.
20. System Acquisition Process. A sequence of specified decision events and phases ofactivity directed to achievement of established program objectives in the acquisition ofdefense systems and extending from approval of a mission need through successful deploy-ment of the defense system or termination of the program.
21 system Program Office. The office of the program manager and the single point of con-tact with inoustry, government agencies and other activities participating in the systemacquisition process.
22. Test. Any program or procedure which is designed to obtain, verify, or provide datafor te-evaluation: research and development (other than laboratory experiments), progressin accomplishing development objectives, or performance and operational capability of sys-tems, subsystems, components and equipment items.
23. Test Director. A person assigned to conduct a test in accordance with the test plan,and who exercises overall responsibility for achieving test plan objectives.
24. Test Plan. A formal document which gives the complete detailed coordination and inte-grated plan for the time phasid task of giving answers and solutions to the critical ques-tions and areas of risk identified in the program documentation. It must also list theresources required to conduct, analyze and report on the test.

2-13
APPEN~DIX A
FIGURES
DECISION MIETN LESTONE MILESTONE MLSTONEMILESTONES 1 I! ,I I I MITN
A~J.jg4DEMONSTRATIN FULL SCALE 0*
PHASES CONCEPTUAL AND ENGINEERINGVALIDATION I DEVELOPMENT
TEST DEVELOPMENT TEST AND EVALUATION (DT&EJIAND
EVALUATIN IOPERATIONAL TEST AND EVALUATION (OT&EJ
INITIAL DT&E FOLLOW-ON OT&E
Figure 1 System Acquisition Process
COMMAND
TEST MANAGEMENT ---OPERATIONAL CONTROLCOORDINATION-----
A 5 ASCCOMMANDS COMBINED TEST
ISOO DIECO A- AF1 IRCO
OR - - - - - D O
ATC USING1 MIER I ~ ~ FCTS THR
I __99
Figure 2 Test ai Evaluation Organization
3-
SOME EXAMPLES OF PROCEDURES USED IN U.K.FOR ACCEPTANCE TESTING OF AIRCRAFT PRODUCED
BY THE AIRCRAFT INDUSTRY UNDER GOVERNENT CONTRACT
By
R.J. PooleFlight Test Engineer
British Aerospace Aircraft GroupKingston-Brough Division
Dunsfold, England.
SUMMARYA new aircraft produced by UK contractors is tested to show that it complies with its specification and
its acceptability for service use is assessed by the Aeroplane & Armament Experimental Establishment atBoscombe Down.
These assessments are made, mostly on instrumented aircraft, and the scope of the testing carried out isillustrated here in order to indicate the range of data that can be made available to bodies evaluating aproduction aircraft.
The UK production aircraft are flight tested to a production flight test schedule to ensure consistenthandling and performance throughout the fleet and an example of the content of a schedule is presented here.
The lecture is concluded with some general observations to be borne in mind when planning an evaluation.
GENERAL INTRODUCTION
Aircraft manufactured in the United Kingdom for the British Armed Services are built to a specificationagreed between the Ministry of Defence (Procurement Executive) and a contractor.
This specification is evolved from studies conducted by departments of "The Ministry" and the ArmedServices in conjunction with several contractors and is finally agreed between a contractor and MOD (PE).Sometimes aircraft are designed on a private venture basis by a contractor and are adopted by the MOD afterwhich a specification is prepared (i.e. the BAe Harrier).
The specification includes a number of demonstrations which must be satisfied before the aircraft willbe accepted by the customer and these are recorded in a document called the "Acceptance Standard".
The Acceptance Standard requirements may include demonstrations of satisfactory performance,stabilityand control, handling qualities and airworthiness and the specification is satisfied contractually whenthese demonstrations are satisfactorily completed. The Acceptance Standard will contain the requirementto meet the standards of airworthiness and stability and control laid down in AvP970 and memos or U.S."Milspecs" (References 1 and 2) except where they are agreed to be invalid or obsolete by the contractorand MOD (PE).
Until recently all aircraft designed by UK contractors for the British forces were designed to meet orexceed the requirements of AvP970 which has been continuously amended since it was first published in 1935.Future British aircraft will be designed to meet or exceed the requirements of AvP970 and memos which arenow very similar to "Milspecs". Some collaborative projects have been required to meet the American"Milapecs" requirements.
Before an aircraft is delivered for use by the Armed Services it must be granted a Controller ofAircraft Release to Service defining the limits to which it may be flown by Service pilots. Theselimitations are generally the result of recommendations by the Aeroplane & Armament ExperimentalEstablishment who assess the aircraft's suitability for service use normally within structural andhandling qualities limits explored by the contractor.
Some aspects of the flight test programme may be conducted jointly by the Aeroplane a ArmamentExperimental Establishment and the contractor, but the Aeroplane & Armament Experimental Establishmentwill normally repeat contractors tests where the results are of a subjective rather than quantitativenature. Aeroplane & Armament Experimental Establishment "participation" in the flight test programmemay occur early in the test programme and they conduct a "Preview" on early independent assessment of theaircraft before the development programme is complete. The content of the Preview is chosen by theAeroplane and Armament Experimental Establishment and in consultation with the contractor.
The contract for the aircraft will include the expected cost of the flight trials including the costof test instrumentation fitted to a number of "development batch" aircraft. For example, the Hawk T Mk 1programme involved six development aircraft. The aircraft were all instrumented to slightly differentstandards but with some overlap to allow flexibility in the trials programme, and in order that if oneaircraft were lost its tasks could be readily re-scheduled to anoth(
The structural design and integrity of a new aircraft is submitt-. for approval to the Royal AircraftEstablishment structures department, who also vet and approve the load and flutter vibration test results.
FLIGHT TESTING PERFORMED
In order to demonstrate satisfactory airworthiness, performance and handling characteristics thecontractor will propose a flight trials programme which will include the following facets :
1. Measurement of aerodynamic loading and inertia loading on the airframe structure and thestructural dynamic stability (i.e. freedom from flutter).
2. Measurement of the aircraft stability and control characteristics and assessment of departurebehaviour.
3. Measurement of thrust and lift boundaries and take-off, landing, climb, cruise and descentperformance.
4. Determination of engine handling characteristics including re-lighting performance and responseto rapid throttle movements throughout the flight envelope envisaged for the aircraft.
5. Measurement of electrical, mechanical, hydraulic, avionic and armament system performance overthe range of climatic conditions in which the aircraft may be required to operate.

3-2
6. Determination of safe carriage, jettison, release and firing envelopes of all storescarried by the aircraft.
7. Clearance of all the aircraft avionics, armament circuits and electronic control devicesfor freedom from electromagnetic interference.
MEASUREMENT OF AERODYNAMIC AND INERTIA LOADINGS ON THE AIRCRAFT STRUCTURE
From analysis of wind tunnel data and the airload distribution estimated during the structural designof the aircraft, a number of electrical strain gauge systems are applied to the structure of one of thedevelopment aircraft. These gauges are positioned wherever possible to record pure shear, pure bendingand pure torsion.
The test aircraft is then mounted in a rigid loading frame and a system of hydraulic jacks isarranged to apply loads over the possible range of centres of pressure of the airloads on the airframe.These tests in effect calibrate the strain gauges mounted on the airframe and the structural deformationis related to the applied loads.
The aircraft is then removed from the test frame and flown at progressively more severe conditionsculminating in the greatest speed/g envelope the aeroplane will be cleared to fly at.
The extremes of centre of gravity position and inertia distribution are flown during this clearanceprocedure. The flight recordings of strain gauge output are compared with extrapolations of the strainsrecorded during the aircraft's loading in the static test frame and the structural loads applied in flightare deduced.
This method has been used with varying degrees of success on many aircraft. Its weakness is that theresults are dependent on how accurately the static loadings have been distributed on the airframe inrelation to the unknown flight loads and on the extrapolation to flight from calibrated static loadings.
Symmetrical wing and tail-loads are recorded using pull up and turning manoeuvres and fin and rearfuselage torsional loads are obtained from rolling pull-out manoeuvres. On combat aircraft thesemanoeuvres are extended to include rapid rate rolls where the inertia distribution of the aircraft mayallow coupling with the aerodynamic moments causing pitch or sideslip divergence to occur.
Ground resonance testing is used to confirm or revise the estimated structural elastic modes andfrequencies and so, if necessary, to update the computed flutter speeds. The flight records of frequencyand, in particular, damping of the structural modes are assessed and used to define any possible flutterboundaries. The structure is excited by flight in natural turbulence, by actuation of explosive devicesattached to the extremities of the airframe (bonkers) or by rotating eccentric weights.
The behaviour of the structure is determined from the output of accelerometers fitted to various partsof the airframe, and the results in terms of vibration frequency and damping are compared with the groundresonance testing.
Predicted critical external store cases will be tested as well as the basic clean aircraft.From the results of the aircraft loading and flutter tests the contractor determines a safe
structural speed, altitude, normal acceleration, rolling and sideslip operational envelope for the aircraft.The Aeroplane & Armament Experimental Establishment may decide to recommend a slightly more
restrictive envelope for Service operation if stability and control is such that these limits may beeasily inadvertently exceeded.
HANDLING & STABILITY & CONTROL ASSESSMENT
UK contractors measure an aircraft's stability and control characteristics for the following reasons:
1. To determine any handling limitations and to develop remedies for unacceptable shortcomings.
2. To demonstrate that the aircraft meets its specification and that it complies with therequirements of AvP970 and U.S. Milspecs where relevant.
3. To provide data for comparison with predicted stability and control characteristics and tothereby refine prediction methods.
4. To provide data for the programming of flight simulators for pilot training and for assessmentof piloting techniques before performing them in flight.
The aircraft's longitudinal and lateral/directional handling characteristics are normally assumedto be independent during this testing as is described in many text books (references 3 & 4).
This assumption does break down in some instances, however, where high rotation rates about any ofthe aircraft axes cause lateral disturbances to generate longitudinal responses. Examples of such effectsare inertia coupling during high rate of roll manoeuvres or the development of high incidence during fastspins or post stall gyrations. Unconventional airframe configurations may also exhibit unusual cross-coupling of the longitudinal and lateral behaviour.
Longitudinal assessments include the following aspects and the predicted centre of gravity limitswithin which the aircraft may be operated in service may be revised in the light of the test results
1. Assessment of static stability. (Measurement of static and CG margins)
2. Assessment of manoeuvre stability. (Measurement of tailplane/g and stick force/g)
3. Assessment of dynamic stability. (Measurement of period and damping of the Short PeriodPitching Oscillation and Phugoid)
4. Determina-ion of handling characteristics at the stall, stall warning magnitude, and theaircraft's controllability near the stall.
5. Behaviour of the aircraft at high Mach No and assessment of trim changes in the transonic region.
6. Assessment of stalling behaviour at high speed. (Measurement of instantaneous usable lift boundary)
7. Assessment of the pilot workload when performing precision tasks such as target tracking andinstrument flying ani optimisation of the control system.
8. Determination of trim changes due to engine thrust and extension and retraction of flapsundercarriage and airbrake etc. and assessment of the adequacy of trim system ranges.

3-3
Lateral/Directional assessments include the following aspects
1. Assessment of lateral and directional static stability. (Measurement of stability insteady sideslips)
2. Assessment of dynamic lateral and directional stability. (Examination of spiral, Dutch rolland roll subsidence modes)
3. Measurement of rolling performance.
4. Lateral and directional trim range assessment.
5. Assessment of crosswind landing performance and limits.
6. Inertia coupling tests.
7. Spinning and post stall gyration exploration for aircraft capable of achieving these flightconditions.
The contractors testing includes the effect of all likely under-wing stores combinations on the aboveassessments.
It is rarely possible to design store suspension systems that will allow a large range of stores to behung under the aircraft wings without affecting the centre of gravity and aerodynamic centre positions. Toexamine the effects of stores on handling, the aircraft is normally ballasted to the forward and aft cg limitswithout stores and then flown with the stores that produce the greatest forward and aft cg movementsrespectively.
As stability is normally decreased by aft centre of gravity and forward aerodynamic centre movementsthe tests at the aft cg with aft movement due to stores normally produce the most critical handling. Theforward centre of gravity limit is usually decided by the requirement to be able to flare the aircraft onlanding with full flap at low speed. If the cg is too far forward the tailplane may not be able to controlany nose down pitch even at full aft stick.
Forward cg limits may also be defined by rear fuselage or tailplane strength considerations.From the results of all these tests the contractors may present handling limitations for the pilot to
observe when manoeuvring the aircraft as functions of angle of attack or normal acceleration as a functionof speed, altitude and store configuration. Alternatively limitations may be expressed in the form ofrecomendations not to dwell in flight conditions that produce heavy buffet or wing rock or to persist withmanoeuvres where more than control authority is used to maintain the flight condition.
The Aeroplane & Armament Experimental Establishment may not reco-mend the release to service of thecontractors flight envelope if they consider that a limitation may be inadvertently exceeded with possibleloss of control or structural failure.
Longitudinal and lateral testing is covered in more detail in Lectures 3 and 4 in session 2.
PERFORMANCE MEASUREMENT
An aircraft's performance is measured by contractors for the following reasons
a) To provide flight measured data on which to base an "Operating Data Manual" (ODM)
b) To determine maximum and optimum performance flight conditions
c) To validate performance predictions
In order to produce an ODM it is necessary to determine any position error corrections that should beapplied to the measurement of airspeed, altitude, OAT and incidence. These corrections are normallyincluded in the ODM.
The results of the tests enable the ODM to be written to cover the following phases of flight
a) Take-off and landing
b) Climb
c) Cruise
d) Descent
e) Sustained turning performance (Thrust boundary)
The detailed description of the methods used in performance measurement is covered in Lectures 1 and 2of Session 2.
ENGINE HANDLING & RELIGHTING PERFORMANCE
Knowledge of an aircraft's engine handling characteristics throughout all the flight conditions it canachieve is essential for safe operation of the aircraft. For this reason the aircraft manufacturerconducts engine handling tests to determine surge boundaries and re-lighting tests in order to discover anyflight conditions at which pilot throttle movement is critical.
When developing an engine the UK engine contractor may perform handling tests including slam throttleopenings and re-lighting tests at sea level and at a range of altitudes in an altitude test cell.
From the cell tests surge and re-lighting boundaries are prepared and these give the contractor aguide to flight conditions at which to begin engine testing.
It is usual to investigate the engine's re-lighting performance under favourable conditions and thento establish as broad a re-lighting envelope as possible.
For example, the procedure adopted on the BAe Hawk was to commence re-lighting tests at the highestaltitude cleared in the altitude test facility, and then to reduce speed at the constant altitude untilthe maximum TGT recorded during the light up reached the maximum allowable.
The test altitude was then reduced and minimum re-light speed determined at altitudes down to 10,00 ft.The success of a re-light attempt is dependent on the engine windmilling speed, and if the speed is
too low to achieve an effective light the windmilling speed is easily increased by lowering the aircraft'snose.
Many aircraft have the ability to attempt a hot engine re-light just by switching the ignition onimmediately after closing the throttle and before the engine speed has decayed to the steady windmillingvalue. Such modes of operation are also checked during the aircrafts engine testing programme.

3-4
It is advantageous if the engine can be satisfactorily re-started at the best gliding range speed.If this is not possible due to a low engine windmilling speed the re-light may be assisted by theaircraft's self contained ground starting system if the aircraft is fitted with one. Of course the flightenvelope for this device must also be determined.
After the engine re-lighting performance has been demonstrated under an easily achievable flightcondition its handling conditions under all flight conditions are assessed.
Typical testing consists of slamming to full throttle as rapidly as possible from a range of steadyconditions with and without high sideslip and incidence while monitoring the JPT to detect surges.
The effect of rapid throttle closures on the minimum engine speed is also investigated in case rapidthrottle closure should extinguish the engine.
Should any critical handling areas be identified the aircrew manual will be written to reflect thesecharacteristics.
STORES JETTISON & RELEASE
Combat aircraft carry a wide variety of weapons and additional external fuel tanks and sensors inorder to perform their operational duties.
This equipment can be divided into 4 classes as far as flight testing is concerned z
1. Bombs and other offensive free fall devices
2. Guided and unguided missiles
3. Guns
4. Tanks and reconnaissance pods and unfired missiles etc. not normally released in otherthan level flight steady conditions.
Satisfactory separation of free fall devices is obviously dependent on the airflow distribution overthe aircraft which is in turn dependent on the flight condition at the point of release.
The contractors carry out flight separation tests to determine a release speed, height and normalacceleration envelope (up to the limits required by the aircraft specification) at which each particulardevice can be released without striking the aircraft and without being disturbed to the extent that itsaccuracy is unacceptably impaired.
Under-wing stores are normally ejected from the pylons by rams driven by gas impulses generated byexplosive devices. The distribution of the ejection force is optimised to result in the store clearingthe aircraft flow field with the minimum disturbance.
Stores in class 1 require the greatest practical release envelope for operational effectiveness andflexibility. Stores in Class 4 need only be released in level flight but the release envelope is oftenmore restricted than class 1 stores because they tend to produce more aerodynamic lift (especially emptydrop tanks).
The firing envelope for guided and unguided missiles may be limited by the effect of their exhaustgases on the aircraft engine which may be prone to surge if it ingests hot gas flows from missiles passingclose to and in front of the intakes. Unguided missiles are normally launched under approximately "lg"flight since they are normally used for ground attack with the pilot performing an essentially "lg"target tracking task.
Guided missiles which are used for air combat require a larger normal acceleration firing envelopesince it is desirable to be able to launch these missiles under any flight condition.
Contractors whose aircraft are required to carry guns conduct in-flight firing trials for thefollowing reasons :
1) To discover the location of any concentrations of unburnt cartridge gases in the airframeand to assess the efficiency of the ventilation of airframe cavities.
2) To determine any vibration effects on the aircraft's avionics or instrumentation and automaticflying control or stability augmentation systems.
3) To demonstrate that the engine is unaffected by gun firing gas ingestion or pressure andtemperature effects.
4) To demonstrate that the aircraft's structure adjacent to the gun is not damaged by blast effects.
Stores release and jettison tests are normally commenced in level flight at speeds and altitudes wherea safe separation is predicted from wind tunnel test results and calculations. The separation is filmedwith high speed cameras from a chase aircraft or an on-board cine pod and the records analysed to obtainthe store trajectory and the minimum separation. Measured results are then compared with the estimatedseparation and a sensible incremental increase in launch condition severity is formulated.
This procedure is repeated until the results indicate that the minimum practical separation has beenachieved.
A jettison release envelope can then be presented supported by photographic evidence.The effects of hot gas ingestion on the engine resulting from rocket and gun firing are determined
from on-board engine JPT, RPM and intake temperature measurements. As in the case of releases thefirings are made in increasingly severe conditions from a low risk starting point and the engine conditionsare monitored at each step.
Gun firing effects on the engine are determined from on-board engine instrumentation as on missilelaunching trials and the firing is normally filmed from a chase aircraft if the gun discharges links andcartridge cases to observe the clearance from the aircraft structure.
Most store release trials are made with ballistic test vehicles or BTV's which are inert storesballasted to accurately represent live stores in terms of weight and CG and inertia distribution.
SYSTEMS TESTING
The major systems incorporated in a new aircraft are normally tested individually on ground rigs builtfor the purpose of demonstrating the designed performance and reliability.
The behaviour of the systems in their entirety and any intentional or unintentional interactionbetween them is then determined on flight test.

3-5
Major systems that most combat aircraft embody are listed below
1) Electrical generation and distribution system
2) Hydraulic system
3) Pneumatic and cabin conditioning systems
4) Fuel systems
5) Avionic systems
i) Navigation
ii) Weapon aiming systems
iii) Communications
iv) Acquisition systems (Radar etc)
v) Stability systems (i.e. flying controls)
6) Armament systems
The effects of climate on the behaviour of these systems (particularly 1-4) are determined duringtropical and cold weather trials. Detailed descriptions of testing some of the above systems is givenin the following lectures.
PRODUCTION FLIGHT TEST SCHEDULE
UK contractors are required to flight test each new aircraft from the production line to ensure thatit is fully serviceable, that it's performance is satisfactory and that iths performance and handling areconsistent with other aircraft of the same type.
A standard flight test schedule is drawn up for the aircraft type by the contractor which is thenagreed by the MOD (PE) in the case of RAF and RN aircraft. In the case of export aircraft a productionflight test schedule may not be required by the customer, but the contractor will probably produce one asa standard to ensure consistency of performance of the production aircraft.
An example of the contents of a production flight test schedule for a single engine class IV traineraircraft is presented below
Pre Start Up
External Check of external finish, fit of panels, footsteps etc.
Cockpit Check optical quality of the transparencies, canopy locking, mirrors,labels and switches etc.Operation of LP fuel cock and re-light button.
Start Up
Engine Start Check engine start up time to light, max JPT during start up and idleRPM and JPT
Hydraulics Check hydraulic system and brake system pressures
Controls Check tailplane range. Check tailplane, rudder, aileron and tailplane standbytrim ranges and times for full travel
Flaps Check operation of flaps and cockpit indications and time up and down
Airbrake Check operation of airbrake and cockpit indicators
Communications Check radio volumes, transmit switches, mute switches etc.
Navigation Equipment Check compass, ground check navaids i.e. TACAN, VOR, ADF & DME
Altimeters Check main and standby altimeter zeros and operate built-in altitude testfacility
Taxy Check steering and braking operation and behaviour
Flight
Take-off Check engine accel time, max RPM and JPT. Stabilized max RPM and JPT
Undercarriage Measure time to retract and extend undercarriageTrims Check longitudinal, lateral and directional trims at fast Cruising Speed
low level
Climb Measure climb performance to near max operational altitude (Record Altitude,time, RPM, TGT, cabin altitude and fuel state every 5000 ft on the climb)Climb at IAS/IMN schedule
Cabin Conditioning On the climb check operation of cabin conditioning and airflow distributionsystem
Navigation On the climb check navaid ranges and bearings and standby compass heading
High Mach No Dive to max Mach No and note transonic trim chanaes and pull-out acceleration
High Altitude Cabin Check cabin pressurisation at standard high altitude and engine RPM.Pmsauzisation Momentarily switch "off" cabin conditioning and check altitude warning.
Engine Handling at Check acceleration from idle to near max RPMHigh Altitude
Engine Relight System Check airborne ignition of engine starter
Medium Altitude Check maximum RPM achieved on a level acceleration at full throttle.Accel/decel Trim Check Check satisfactory lateral and directional trim change with speed.

3-6
Stalling Check stalling speeds and buffet warnings and behaviour on clean aircraftand full flap undercarriage down
Ram Air Turbine Check deployment of the RAT and the minimum airspeed at which RAT functions
Spin Recovery Check aircraft enters and recovers from spins in each direction normally
Inverted Flight Check that engine oil system and fuel pressure are satisfactory ininverted flight
Max IAS/Max g Handling Check anti-g system at max g at max IASCheck max level airspeed at low level and corresponding RPM and JPT
Airbrake Check airbrake extension at high speed low level.
ILS Check ILS for correct function of indications
Landing Check anti-skid and braking operation
Fuel Low Level Check low level fuel warnings within limits
Aircraft fitted with complex flying control, engine control and weapon systems will require furtherdetailed checks to prove satisfactory operation, but the test schedule should include most of the elementsof the preceding example.
On receipt of a new aircraft from the production line the customer may fit additional equipment ormake some modifications and may then repeat a similar flight test schedule.
UK contractors do not normally submit aircraft at intervals on the production line to assessmentbodies for quality control checks.
MISCELLANEOUS TESTINGContractors must execute most of the tests described up to this point, however individual aircraft
may have additional systems or capabilities that enable them to perform their primary roles more efficiently.These features must also be examined by the contractor and/or the regulating authority (Aeroplane and
Armament Experimental Establishment.)
Some examples of such features are
a) Air to air refuelling systems
b) Operation from grass and unprepared sites
c) Operations using revolutionary techniques and equipment such as the BAe Harrier ski-jump
d) Operation from aircraft carriers
EVALUATION CONTENT
It is not necessary for a customer evaluating a UK aircraft to perform all the assessments notedherein, but it is useful to know what testing is performed by the contractor and acceptance authorityin order to understand the flight test information that is readily available.
Some of the acceptance testing can only be satisfactorily carried out on a comprehensivelyinstrumented aircraft which may not be available for evaluation. The lectures that follow will,however, suggest test techniques that enable useful data to be gathered from uninstrumented aircraftusing basic tools such as stopwatch, kneepad and pilot display camera records. (A cockpit voicerecorder is also a useful tool for gathering test data and recording qualitative assessments during flight).
The content of the evaluation sortie should come fully planned in advance with due regard for the taskthe aircraft is required to perform and after consideration of the contractors brochure data and publishedflight test data.
The evaluation should ideally be carried out by a pilot with test pilot training, supported byflight test engineers with experience of handling qualities, stability and control, performance datameasurement and avionic systems appraisal.
If the aircraft can achieve and sustain high g forces the evaluation pilot should be physically fitenough to be unaffected by this level of performance.
REFERENCES
1. Design Requirements for Aircraft for the Royal Air Force and Royal Navy, Ministry ofDefence (PE), Volume I Books I & II and Memos.
2. Military Specification Flying Qualities of Piloted Airplanes, MIL-F-8785B(ASG)16 September 1974.
3. A.W. Babister, Aircraft Stability and Control, Oxford, Pergamon Press, 1961.
4. B. Dickinson, Aircraft Stability and Control for Pilots and Engineers, London,Sir Isaac Pitman & Sons Ltd., 1968.

4-1
A R EVIEW OF FLIGHT TEST INSTRUMENTATION SYSTEMSFOR ACCEPTANCE TESTING OF THE PRODUCTION AIRCRAFT
byClaude Robert
Flight Test EngineerChief of the Measurement & Recording Division
S.F.I.M.13, avenue Marcel Ramolfo Garnier
Massy91301
France
SUMMARY
As long as the aircraft was only a simple vehicle of a limitated complexity, the acceptanceflight testirgs, which has to be done either by the manufacturer or the customer, was concentrated on theassessment of the pilot and his crew. Nowadays, the increasing complexity of the aircraft and its systemchanges completely the problems 2 a compromise has to be found between the largest increase of the flyinghours necessary to the acceptance or assessment of an aircraft and a limitation of these flying hours bymeans of a flighttest instrumentation installed on board.
1. IN 2MCTION
More and more, the development of a new aircraft is a long and expensive venture. Obviously,as soon as the first flight is reached, and during all the phase of the flight testing of the aeroplane,an extensive flight test instrumentation is installed aboard. And, as it is described in J.F.RENAUDIE'spresentation papers of this lecture series, the number of parameters recorded during the development of theprojects has tremendously increased during these last 25 years. To summarize this trend, one can say thatthe number of recorded parameters has been multiplied by 3 or 4 hundred during this period. This, of course,once again, corresponds to the main flight testing phase of the prototype or the pre-production aircraft.The result of that, is that, independently of the large increasing complexity of the aircraft and its sys-tem, the duration of the development phase has not been proportionally increased and, sometimes, like forinstance in the Airbus program (A 300), this development phase has been reduced with respect of time.
As far as the assessment or the acceptance testing of the production aircraft is concerned,the same evolution appears. Indeed,.-20 or 25 years ago, for the aircraft manufacturer or for the customer,only two or three flights were sufficient without any instrumentation to control or assess the performancesand handling of the vehicle and its system. Nov, for military or civil aircraft with their always increa-sing sophistication, the same guidelines cannot be followed. Thus, the aircraft manufacturer on the onehand, for his own control flights before proposing his aeroplane and the user himself on the other hand,the need of the flight test instrumentation in.talled on board of the production aircraft slowly appeared.
This need in fact appeared, to begin with, on the military single-seater aircraft. Indeed,on this type of machine, it is very difficult for a single pilot to check visually with the cockpit instru-ments the functioning of all the systems or to appreciate the accuracy of some of them.
When no instrumentation is available, this has the consequence to increase the number offlights for the acceptance testing of the production aircraft. Very often, the problem is not so seriouson a large aircraft like, for instance, airliners on which a full crew can note the information of thevarious instruments.
2. FLIGHT TST INTRUMATI ON DInNITION
In the case of the pilot assessment or the acceptance testing of the production aircraft,the definition of the flight test instrumentation cannot be made, generally speaking, through the sameapproach than the one which is used to define the main flight testing instrumentation on board the proto-type. The definition is the result of a sort of a compromise.
The ideal would be to begin with a list of parameters. This parameters'list should be builtwithout considering the difficulty corresponding to each one of them.
So, let's suppose that the specialists in charge of the acceptance testing of the productionaircraft have reached among them an agreement on this parameters'list.
One mast note, at this stage, that this parmeters'list has to be prepared by the aircraftmanufacturer for his customer. Of course, on the customer's side, one can always ask for addition or modi-ficationS. At last, about this parmeterslist, one mast never forget, during its establishment, that theproposed aircraft is a production one and has Already been flight tested, as far as the type is concernedtherefore, the purpose of the instrumentation is only to check that the production aircraft is in accordanceWith the aoree specifications.

4-2
Let's then suppose that the parameters'list has been agreed. The next stage is to considerhow each one of these parameters cm be acquired and recorded.
Two cases can be considered
- the aircraft is fitted with a crash recording system,
- no special recording means are available on the aircraft.
The case of the aeroplane or helicopter fitted with a crash recording system is of coursethe easiest one. In that opportunity, one just has to compare the parameters'list which has been selectedfor the acceptance testing to the parameters'list and the capacity of the crash recording system. Veryoften, most of the parameters included in the new parameters'list are among the recorded parameters ofthe crash recording system. Just a few complementary parameters will have to be added. For this, the pro-blem of the transducers (sensors) and their wiring has to be set up. For the extra transducers which haveto be installed, it mast be decided if they have to be removed or not after the flight test. AS a generalrule, the users are very reluctant to admit that on their aircraft, some extra weights which are not neces-sary for the normal flights or normal use of the aircraft will remain on board of it. But, through the ex-perience we have in France, the main problem on production aircrafts is the installation of transducersand their wiring to the data acquisition.
At the other hand, there is the case of the helicopter or aeroplane without any recording meanson board. More and more, a removable package is prepared and installed aboard for the few acceptance flights.Necesseraly, in this case, some extra wirings have also to be installed keeping in mind that most of themwould be removed after these assessment flights.
you will see, in the following examples, that this simple division in these two cases doesn'tcorrespond to the exact reality. Sometimes, due to the complexity of the aircraft which has already beenequiped with the crash recording system, one has to complete it or to add a special system. You will seethat this was the case of the SST Concord and the Airbus A 300.
3. WAL DBECRIPTION OF PRESENT ACCIDENT RORDING SYSTEMS
About since 1975, there has been among the main airlines an agreement on the definition ofAircraft Integrated Data System (AIDS) which is connected to the crash recorder required by nearly all theofficial national organisations as
- FAA - NTBU in U.S.A.,- CM in Great Britain,- D DO in France.
The characteristics of this system wAst be considered because they represent the actual possi-bilities of data acquisition equipments which are currently available.
It mat be precised, that the AIDS specified either in accordance with ARIM 573 or withARM 717 are used both for civil and military applications as far as the format and recording principlesare concerned.
It is thus worthy to analyse their main features
- Digital form of recording to be able to protect the datas against fire, shocks etc...
- As a consequence, a sampling rate for each parameter is imposed.
From these two basic points, the international authorities agreed on detailed specifications.We would like to sumarise them
- 30 to 35 parameters,
- total sampling rate 64 words of 12 bits per second (768 bits/sec.).
- recording format : 4 subframes of 64 words (subfrme duration t 1 second),
- autonomy of the recorder 1 25 hours.
Besides, survivability characteristics are imposed to the recorder in accordance with theMPA s 130 C 31 standard.
Obviously, such a system can be used as the basic element of an acceptance flight testinginstrumetation.
4. EInIII4.1. Military aircraft
About military aircraft, we would like to take the examples of modern single-seaters and air-carrier.

4-3
4.1.1. Mirage F1
In the case of the Mirage F1, there is aboard a full crash recording system.This system, developped by two french firms, consists of
- Data Acquisition F/N ED 3330 - SFIM
- Crash Protected Recorder P/N PE 6010 - Schlumberger.These two equipments have been adopted for military aircraft (volume, power supply...)
But, in principle, they are in accordance with the international regulations in this field.The main modification is the possibility to multiply by 6, the sampling rate of all
the parameters at the Data Acquisition level, and to increase the magnetic tape transport speedin the same ratio, in order to keep a similar packing density on the tape. The only drawback ofthis modification is to reduce to a few hours, the recorder antonomy which is acceptable for accep-tance flight testing.
4.1.2. Mirage 2000
On this last version of the DASSAULT fighters, the same philosophy is followed.
Once again, the Data Acquisition (P/N ED 3333 developped by SFIM) is connected toa crash recorder (P/N PE 6015 developped by Schlumberger).
There is also an increase of the sampling rate
- for the normal flights nominal sampling rate multiplied by 3,
- for the acceptance flights, the sampling is multiplied by 6.
This choice permits to use the same ground equipments in the Airlines, and in theAirforce.
4.1.3. Transall
This Germano-French Aircraft is, for the moment, equiped with a SFI trace recorderP/N A 26.
The A 26 has a function of crash recorder, but for the acceptance flights, the pho-tographic tapes are processed, and a dozen of parameters controlled.
4.2. Civil Aircraft
4.2.1. Falcon 10 - 20 - 50
'Ihis type of aircraft is either equiped with photographic recorders or with DigitalSystems depending on the type of flights they will have to do (private or public).
In both cases, with no modifications, the recording is processed after the accep-tance flights.
4.2.2. SST Concord
For this Aircraft, which of course, was the first Supersonic Transport to fly, arather long list of parameters was published.
The normal crash recording system, installed according to the Anglo-French regula-tion, was not always sufficient to accept the parameters selected for the first production air-crafts.
Therefore, a special Data Acquisition unit was designed by SFIM, matched with acassette-recorder.
But, this system, with an increased capacity, was designed, keeping the same reccr-ding system of the Aircraft. Thus, the same ground facilities were used for the data processing.
4.2.3. Airbus A 300
A removable package was designed with the same principle than the one used forCONCORD the SFIN SERAC system. This package is installed in the fuselage during the acceptanceflights, or for complementary flight testing.
But, here again, as the same recording format is kept, no special ground means areused.

4-5
EXAJIEN DES INSTALLATIONIS D'ESBAIS UTILISEES P(XjRLES VOLE D'EVAUATCN4 ET DS RZCEPTIOhI DAVIONS DE EERIE
parClaude Robert
Ingdnieur Navigant d'EssaisChef de la Division Mesure & Enregistrement
S.P.I.N.13, avenue Marcel Ramolfo Garnier
massy91301France
SCUENIRE
Tant que les saronefs 6taient de simples v6hicules de complexitAL limitte, lea vols de rA..caption qui devsient @tre faits, aasi bien par l'avionneur que par lutilisateur, 6taient bases sur l'A-valuation du pilote at de son 6quipage. Maintenant, ia complexit6 accrue, aassi bien des aviolns que deleur syst~me , pose le problime de fagon totalement diff6rente z ian compromis doit Stre trouv6 entre uneimp~rtante augmentation &A nombre d'heures de vol n~cessaires A 1'A4valuation on A Is r6ception d'un avianet use limitation de ce meine nombre d'heures de vol aua moyen d'une installation d'essais instal~ A bard.
De plus en plus, le d~veloppement d'un mouvel avian est une longue et coatause aventure,Evidemutent, depuis le premier vol et durant toute la dur~e des essais en vol de l'avion, tine installationd'essais tris d6velopp~e eat install~e A son bord. St. ainsi qu'il est expos6 dains le document de pr6ser-tation de cette s6rie dlexpos~s rL~dig~s par J.FRENAIUDIE, le nombre de parawfitres enregistrds durant laphase de d~veloppoment des prototypes a magmentk de fagon surpren ante durant ces 25 dernibres annees. Pourr~sumer cette tendance, on peut dire que le sombre de paramitres enregistr~s a 60 mltiplid par trois onquatre cents durant cette pdriode. Ceci, bien adr, une Lois encore, correspond A la phase principale desessais en vol du prototype on de l'avion du pr6-sLrie. Le r~sultat de cela est que, ind~pendment de l'E-norise accroissement de complexit6 de l'avion et de sea sysames, lat dur~e de la phase de d6veloppenent r'a,pas 6t& accrue dams lea aftes proportions et de surcro~t, parrois, come par example dams le progreAirbuis, cette phase de d~veloppement a pu Otre r6duite.
mn ce qui concerne 1 'Avaluation on la r6ception des avions de s6rie, une 6volution identiques'est produite. En fait, il y a 20 on 25 ans, asasi bien pour le constructeur que pour l'utilisateur, duxou trois vala 6tajent suffisanta pour effectuer 1 'Avaluation ou le contr~le des performance$ et qualitlade vol de l'a~ronef et de sea syst~mes, yols qui ant 6t4& effectuts sans aucwae installation dlessais. Main-tenant, que cela soit pour des avions militaires aussi bien que pour des avions civils dont la sophistica-tion me cease d'accrottre, la mfme philosophic ne peut pas 8tre poursuivie, Ainsi, lavionneur d'un c8t6,pour sas propres vols de contr8le effectu~s avant de presenter Ilavion A son client, et pour Ilutilisateurlui-m~oe, de l'autre c8t6, le besoin d'une installation d'essais embarqu6e sur avions de s~rie eat apparupeu A Peu.I
Ce besoin, en fait, se fait aentir am d~part star lea mono-places militaires. En fait, surcc type de machine, il est tria difficile pour usn pilate seul & bard de v~rifier, uniquemtext avec: sea Irs-truents de vol, le fonctionnement de tons lea systhmes et, en particulier, d'apprhcier I& pr6cision decertaina dVentre eux.
On comprend bien pourquoi, lorsqutucune installation d'essais n'est disponible, l'in6vita-ble consiquence eat d'aagmenter le nombre de vols n~cesaaires & ls r~ception des avions de s~rie. Notonscepandant que tris souvent, le probliae ne se pose pan de Larpon si aiguf sur des avions de fort tonnage, parexemple lea avions de transport civils sur lesquels um 6quipage couplet pent noter lea informations de zon-brexax instruments de vol.
2. DEFIITXI DE L'ZNSALLATICU DIESSAIS
Dana le can d'une simple &valuation on de la r6ception d'un avion de s~rie, la d~finition del'instailatios d'essais en vol peat etre Laite, d'xane Lagon g6n~rale, de la nbe smifire que celle utilis~epour d~finir l'installation d'essais principale monthe A bord des prototypes. Cette dWinition eat le rdsul-tat d'une certaine formne de compromis.
L'id~al est de commencer par 6tablir use haste de paranltres. Cette haste de parautres doitetre rddigte dams l'abaolu sans se soncier Provisoirement des difficult~s correspondant A l'acquisition dechacun dVentre cux.
Supposons sinai que lea sp~cialistes responsables des vols de rhception des avions de 96riesont arriv~s entre eux & us accord our cette haste de parmtres.
Notons, A cc stade, que cette luste de parawftres Gait etre pr6par~e par l'avionneur pour sonutilisateur. Dies eatendu, cet utilisateur, de son c8t6, peut toujours demander des compldments on des mo-difications. Enfin, A propos de cette liate de parsubtres, ii se taut pas perdre de vue, au a sde$

4-6
r~daction, qiac l'avion consid6r6 eat un avion de strie at qua'il a dfiji 6tt lrgement eaaay6 en vol en cequi concerne son type ;c'est posiequol, le but de cette installation d'esal n'est que de vkrifier quel'avion de strie eat conforme am% sp6cifications originalea.
Supposons done qu'uz accord a 6t6 troav6 relatif & cette liate de paravtres.
Deuax cMs peuvent @tre conaid~r~s
- l1avion eat 6qadlA d'un syatine d'enregiatreeit,
- aucum moye d'enregistrement particulier W eat diaponible A bord.
Le cas de l'avion ou de 1'h~licopt~re AquipA d'un syatime d'enregiatreaent eat iaaturellinsitle plus facile. Dana cecas CM 11 uffit de comparer la 14ste de parambtrea retenue pour lea vols de r~cep.tion & la liate de paramitres et la capacit6 du systime d'enregiatreuent d'accident. Le plus aouvent, laplupart des param~tres qui font partie de la nouvelle haste se trosavent dams le groupe de caix: qui aontenregiatr~a sur l'enregistreur d'accident. Seula, donc, queiques paratrea compldmentairea aeront n~ces-saires. Pour celar le problise des capteurs et de leur c~blage doit 6tre trait6. Pour lea capteura comn-pldmentaires qui devront etre instalhis, ii devra Itre dicid6 si ils aeront dimontia osa pas apria lea volsdlessais. Notona, que d'une fe~on ginkrale, lea utilisateurs bisitent beaucoup & ad~uettre que sun lairaviosi, quehquespoids sorta non jatiliada pour lea vola normaiax Cu l'emploi normal de l'avion aeront conser-vAds & son bond.
Mis, au travers de Ilexpdrience que nous avona en France, le problime principal mar leaavions de sdie rdside dazas l'instalhation de capteurs et de lair ciblage vera l'acquiaition de donnies.
D'un autre c~t6, i1 Y a le cas de l'hilicoptire oia de l'avion dont l'Aqaaipenent normal raecomporte pa de moyens d'enregistrement. De plus en plus, un ensemble mobile eat pnfipani et mont& A bordpour lea quelquea vola utiles A la riception. Niceasairement, dana ce cast quehques cablages complimentai-res devront Stre utilisis sans pendre de vue toxatefois que ha plupart dVentre aix devront Stre retir~sapria ces yols d'Avaluation.
Ainsi qaac 1Von posarna he voir dana lea examples qui suivent, cette simple division en deuxcean ne correspond pa igoureusement k la rtaliti. insi, de par ha complexiti de l'avion qui eat dfijhdquip6 cependant d'un systime d'enregiatrement d'accident, celui-ci doit etre complit6 Cu un systme sup-pliimentefre ajout6. Vous verrez que ceci a AtA le CMs dua TSS Concorde et de l'Airtas A 300.
3. D580 IITIdI4 GEMKAI.E DES SYSTEMSS S E GlSTtEME POTUELS
Dep'aia 1975, lea principales compagnies mondiales se sont accordies mar la dfifinition d'aansystime d'acqlisition des donndes intignica (AIDS) associ6 A l'enregiatreur d'accident exig& par la phi-part des organlisations officielles nationahes camme pa exeuple
- FAA - WTS aux U.S.A,- CAM en Grande Bretagne,- DGAC in France.
Lea carectiristiques de ce systime sont A coilaidirer paisqu'elles reprisemntmt lea possibili-tia actuelles dea 6quipementa d'acquisition des donnies qui sont disponibles facilement.
Pricisons de plus que lea AIDS spicifids aoit selon 1'ARINC 573 ou selon l'ARIUM 717 sontaaaai bien utihias sumr desaeviona civils que sui '1.5 evions militaires, mA moins en ce qui concenne leaprincipes et le format d'enregiatnanent.
11 vaut donc la peine d'en analyser lea pninciPales caractdristiques
- Enregiatrement sous5 forme digitale efin ditre en memane de protiger lea donnies contre le feu, lea chocs...
- En conaiquence, uma cadence d'6chantillonnage eat imposie pour chaqee paramitre.
De ces deux points de base, lea atoritis internationales se sont mises, d'accord mar des spf..cificatians ditaillies. Nais sauhaiterions lea risumrer
- 30 A 35 paramtres,
- 6chantillonnage total 64 mots de 12 bits par aeconde (768 bits/sec.),
- format d'enregistremtent :4 cycles courts de 64 mots (dunee du cycle court - 1 seconde),
- atonomie de l'enregistreen : 25 heeres.
En dehors de cela, lea caractiitiqaes de survivabilit,& sont imposies A l'enregiatreur aelonlea normes de l'AFA :TSO C 51.
De tecate 6vidence, un syatime pait Otre employ6 cosune 6liment de base pour une installationd'essais deatinie fax vols de riception.

4-7
4. EXEMPLES
4.1. Avions militaires
En ce qui concerne lea avions militaires, nous aimerions prendre comne exemples lea inter-cepteurs mono-places militaires et lea aviona de transport.
4.1.1. Avian Mirage 71
Dana le can du Mirage F1, il y a A bord de Ilavion un systime couplet d'enregis-treisent d'accident (systme de siciarit6). Ce systilse, diveloppt par 2 firmes frangaises, se compo-se de t
- tane acquisition de donnies type ED 3330 fabriqufe par la SF134,- tan enregistreur d'accident prot~g6 type PE 6010 Labriqu6 par Schiumberger.
Ces deux iquipements ant 6t6 adaptis A un avion militaire (volume, alismentation...)Mais, de fa~on ginirale, ils aont conformes aux riglements internationeux danas ce domaine.
La princiPale modification est la possibiliti& de mltiplier par 6 1& cadenced'6chantillonnage de tous lea paramutres aua niveau de lacquiaition de donnies et d'accro~tre *gE-lement la vitesse de la bande magnitique dans le mime ratio din de garder star celle-ci une densi-t6 d'enregiatrement siisilaire. Le scul inconvenient de cette modification eat de riduire & quel-ques heures l'autonomie de l'enregistreur, cc qui eat acceptable dana le can des vols de r6ception.
4.1.2. Mirage 20Star cette demuire version des intercepteurs DASSAJJLT, tine philosophic identique
a dt& retenue.
Une Lois encore, I'acquisition de donnies ED 3333 d6velopp~e par SPIN eat reliicA l'enregistreur d'accident PE 6015 divelopp6 par Schiumberger.
11 y a avassi tan accroisseuent de la cadence d'6chantillonnaget- pour lea vols normaux, la cadence d'ichantillonnage nominale est ultipli~e par 3,
- pour lea vols de riception, la cadence nominale eat multipli~e par 6.
Ce choix pemiet d'utiliser am sol lea mimes 6quipeents,soit dana lea compagniesairiennes ou dana l'armie de l'air.
4.1.3. TransallCet avian franco-allemand eat, pour le moment, 6quip6 avec um enregistreur pho-
tographique SPIN type A 26.
L'evregistreur A 26 a pour lea vols normaux, tine fonction d'enregistreur d'ac-cident, mais pour lea vols de riception, Ia bande photographique eat trait~e et une douzaine deparamstres contr~l~s.
4.2. Aviouis civils
4.2.1. Falcon 10 - 20 50Ce type d'avions sont, ou bien 6quipis dlenregistreur photo'r aphique, ou de Sys-
times numiriques suivant le type de vols quails intreprennent (prive on public).Dana lea deux can, sans sacune modification A porter aui systfte, lea enregis-
trementa sont traitfis dans le can des vols de riception.
4o2.2. 118 ConcordePour cet avian quit naturellement, 6tait le premier avion supersonique de trans-
port A voler, tine liate plut~t longue de paramitres avait 6tA 6tablie.
Le syatme normal dlenregistrement install6 conformiment sax riglements anglo-frangais ne permettait pan d'acquirir tan nombre suffisant de paramitres ainsi qu'ila avaient Wtsilectionnis star lea premiers avions de s~rie. Cleat pourquoi une acquisition de donnies sp~cialefiat diveloppie par la SPIM couplie.k tan enregistreur A cassette de sa fabrication.
Mais, cc systime, avec une capaciti accrue , fut &tudi& en conservant le mimeformat d'enregistrment que celui de l'enregistreur d'accident de l'avion. Ainsi, lea mimes moyerssol 6taient utilisea pour le traitement des donnics.
4.2.3. Airbus A 300
tin ensemble mobile fiat 6tudi6 avec lea mimes principes ginbrmax que ceux utilisispour CO(3DZ : le spa time SPIM SERAN.
Cet ensemble eat install6 dana le fuselage pendant lea vols de riception oudams le cas d'essais en vol comphimentaires.
Ici smssi, le mime format d'enregistrement est conserv6 afin de ne pas avoir A6laborer de systime particulier de traitement.

5-I
PERFORMANCE TESTING PRODUCTION AIRPLANES
ROGER C. CRANEU.S. AIR FORCE FLIGHT TEST CENTER
EDWARDS AFB, CALIFORNIA, U.S.A. 93523
SUMMARY
Efficient flight testing and data analysis techniques can be used to determine test-day airplane performance levels. Basic performance, instrumentation, and data analysisconcepts are discussed in this paper as well as ground and flight tests. These conceptsand tests can quickly, yet adequately, demonstrate Flight Manual performance using pro-duction planes with little or no special flight test equipment.
Specifically, the paper includes a discussion of basic performance testing and dataanalysis concepts along with pretest information requirements. Ground tests such asinstrumentation calibrations, installed static thrust calibrations and airplane grossweight and center of gravity checks are outlined. Flight tests which enable static sourceposition error determination, as well as an assessment of takeoff, cruise, accelerationand turning performance are discussed. Also described are tests that enable assessmentsof the engine handling characteristics of the airplane. The presentation and analysisof the data acquired during each type of tests are also outlined with emphasis on usingtest-day data as opposed to test-day data corrected to standard-day conditions.
SYMBOLS AND ABBREVIATIONS
A/B Afterburner
AFFTC Air Force Flight Test Center
AOA Angle of attack
CD Drag coefficient
cg Center of gravity
CL Lift coefficient
deg Degrees
deg C Degrees Celsius
deg/sec Degrees per second
DT&E Development Test and Evaluation
EPR Engine pressure ratio
Faex Excess thrust
F Gross thrust
POD Foreign-object damage
ft Feet
g Acceleration of gravity
Hc Calibrated pressure altitude
HE Energy-height
Hi Indicated pressure altitude
HUD Head-up display
AHpC Static pressure position error
Aht Height difference between ground reference and test airplane
in. Hg Inches of Mercury
K Temperature probe recovery factor
kt Knots
lb/hr Pounds of fuel per hour

5-2
MAC Mean aerodynamic chord
Mc Calibrated Mach number
Mi Indicated Mach number
4po Mach number position error correction
NAMPP Nautical air miles per pound of fuel
NLF Normal Load Factor
pot Percent
PLA Power Lever Angle
P Specific Excess Power
AP/qcic Static source position error coefficient
R/C Rate of climb
RF Range Factor
RPM or rpm Engine speed in revolutions per minute
RTO Rejected takeoff
sec Seconds
Ta Ambient temperature
TIT Turbine inlet temperature
TSPI Time-space positioning instrumentation
Vc Calibrated airspeed
V i Indicated airspeed
AVpC Airspeed position error correction
Wf Engine fuel flow
Wt Airplane gross weight
Wt/6a Weight-pressure ratio
6a Ambient pressure ratio (Pa/Pasl)
6a Ambient temperature ratio (Ta/Tasl)
P Atmospheric density
aa Ambient density ratio (pa/Pasl)
Climb angle
FOREWORD
This paper contributes to the portion of this lecture series devoted to helping thecountries involved assess and choose new aircraft. It discusses performance evaluation ofproduction airplanes equipped with little or no specially-installed flight test instrumen-tation.
INTRODUCTION
This paper addresses basic flight testing concepts and techniques that can be usedeffectively to assess the performance of military jet-propelled airplanes. The emphasiswill be on the practical application of theory and concepts so that the participatingcountries can be more able to understand and solve the many problems involved with per-formance flight testing of modestly instrumented or uninstrumented airplanes. Specifictest techniques will also be discussed, but only to the extent that they clarify concepts.
The basic assumption of this paper is that the task at hand is to evaluate the per-formance of a production airplane that has little or no special flight test instrumenta-tion. Specifically,
1. The airplane is a production model.

5-3
2. Optimum operating techniques (i.e., best speeds for climb, cruise,etc.) have previously been determined.
3. The evaluators possess, or desire to use, minimum resources fordata processing. All calculations are made on programmabledesk-top calculators.
4. Development Test and Evaluation (DT&E) performance reports areavailable from the manufacturer and country of origin.
5. A developed Flight Manual is available that is based upon flighttest results.
This last assumption is very important. The performance flight tests discussedherein are intended to provide limited test-day data with which to demonstrate andvalidate the airplane's Flight Manual. If the Flight Manual proves valid, it can be usedto assess the airplane's total performance capabilities against those of other airplanesas described by their respective Flight Manuals. The purpose of these tests is not tobuild or even fully check the airplane's Flight Manual, only to provide sufficien--infor-mation to assess its validity. The expensive flight testing required to develop a FlightManual is assumed to be the responsibility of the manufacturer and country of origin.The customer should contractually demand an accurate Flight Manual as part of the airplanepurchase.
Seven general topics will be discussed. They are;
1. Some basic performance concepts
2. Pretest data requirements
3. Minimum parameter requirements
4. Instrumentation systems
5. Data analysis considerations
6. Ground tests, and finally ...
7. Flight tests and evaluation
For each topic, general concepts will be discussed, test objectives will be specified,key parameters will be identified, some test techniques will be recommended, and dataanalysis considerations will be discussed.
BASIC PERFORMANCE CONCEPTS
Performance test and evaluation is a quantitative business. There is no such thingas qualitative performance. There are a large number of uncontrollable variables such asambient temperatures and pressures, windspeeds and directions, etc., that must be meas-ured and then considered when any performance data are analyzed. Not all are "correctedfor" by mathematical manipulations to the performance data, but all are considered sothat their impact on these data can be assessed. Therefore, the performance of an air-plane can never be fully defined until the quantitative data are: acquired, reduced,edited and thoroughly analyzed.
Airplane performance is defined as information that defines the actual performanceof the airframe/engine combination and is presented in terms of rate-of-climb (R/C),nautical air miles per pound of fuel (NAMPP), etc. Airframe data used to calculate air-plane performance, such as drag polars or lift curves, will be referred to as aerodynamicdata. Engine operating characteristics such as gross thrust, airflow, etc. will be re-ferred to as engine performance data.
When flight testing to demonstrate an airplane's performance against the FlightManual, the data need not be corrected to standard conditions since most current FlightManuals present airplane-performance information at off-standard atmospheric and aircraftgross weight conditions. Also, when comparing two different airplanes i.e., a directside-by-side comparison, correction need not be made to standard atmospheric conditionssince the airplanes are operating in the same air mass, although gross weight correctionsmight still be required. Actually, current thinking by performance flight test engineersat the United States Air Force Flight Test Center (AFFTC) is that mathematical manipula-tions and corrections to test-day data should be kept as minimal as possible because manyso-called "standardization" corrections are based on assumptions which are not alwaysvalid. This is perhaps what is so attractive about airplane performance demonstrationsagainst a Flight Manual or direct side-by-side comparisons: little complex mathematicalmanipulations to the test results are required.
It is appropriate at this point to define three more terms as they will be used inthis paper. They are performance evaluations, demonstrations, and comparisons. Athorough evaluation of the performance of an airplane involves the analysis of each per-formance element (i.e., lift, drag, thrust) so that the total capability of the airplane

5-4
can be determined and optimum operating procedures can be developed. Evaluations, as de-fined in this paper, require long flight test programs, sophisticated instrumentation andspecial aerodynamic analysis-oriented maneuvers.
A Flight Manual performance demonstration, as defined here, involves only the deter-mination of airplane performance (R/C, NAMPP, etc) under known, measured conditions. Noattempt is made to thoroughly analyze the aerodynamic or engine characteristics that com-bine to generatV this performance. Once the performance data has been acquired, it isused to determine if the test airplane's performance matches some reference document suchas the Flight Manual's performance supplement or the airplane performance reported in itsDT&E reports.
A comarison, by contrast, is defined as a direct, side-by-side flyoff between twoor more airplanes. Since the airplanes are operating at the same time through the samair mass, a direct comparison of specific performance can be made, however sufficientadditional data must still be acquired to define the atmospheric conditions and the con-figuration of the airplanes.
Both demonstrations and side-by-side comparisons can be accomplished with little orno special flight test instrumentation and a limited data acquisition system. The pro-duction cockpit instrumentation can be the primary data source. These tests can also besuccessfully accomplished with limited data processing and analysis resources. Further-more, they require no specially developed maneuvers designed to acquire aerodynamic data.The test maneuvers used are quite operations-oriented and include level or constant-altitude accelerations, stabilized turns and stabilized cruise points. The successfulcompletion of demonstrations and comparisons does require, however, that the test air-plane be at an advanced stage in its development cycle and performance limitations,optimum operating techniques and documentation be known and available.
PERFORMANCE DATA
The objective of this section is to discuss pretest performance information andaerodynamic data requirements, parameters to acquire during testing, instrumentation sys-tem requirements, data recording requirements, and data analysis concepts that will fa-cilitate a successful performance flight test demonstration or comparison.
A. PRETEST DATA BASE
Before any flight testing is attempted, the following documentation should be ac-quired from the manufacturer and/or the country of origin.
1. Development Test and Evaluation performance reports.
2. The Flight Manual complete with performance supplement.
3. The Flight Manual Performance Substantiation Document
This last document is very important and should be acquired, if available. It docu-ments what aerodynamic and propulsion data were used, how they were used, and what assump-tions were made on developing the airplane performance (R/C, NAMPP, etc) specified in theFlight Manual. Some of the important information contained in these documents is:
1. Lift 'r-'es
2. Drag polars
3. Thrust and fuel flow relationships
4. Inlet pressure recovery characteristics
5. Drag associated with configuration changes
6. External store drag
7. Weight and center of gravity relationships
8. Airplane physical dimensions such as wing area, mean aerodynamicchord location, etc.
Remember, as with the Flight Manual, performance flight testing of the productionairplane will also help to validate many of these data.
B. DATA REQUIRUMENTS
The following parameters can be considered the minimum for a successful performancedemonstration or comparison.

5-5
1. Time
2. Transmittable event tone
3. Event light
4. Total air temperature (TT)
5. Airspeed (Vi)
6. Pressure altitude (Hi): Set altimeter at 29.92 in. Hg
7. Normal acceleration (nZ)
8. Total fuel flow (Wf)
9. Power lever angle or position (PLA)
10. Engine speed (rpm)
11. Some engine parameter that can serve as a surrogate for power and/or thrustlevel, such as Turbine Inlet Temperature (TIT), Engine Pressure Ratio (EPR)
12. Fuel quantity remaining
13. Airplane configuration
14. Airplane loading
The above parameters are essential for any performance analysis. The followingparameters should be obtained if available; however, they can be calculated if they arenot.
1. Mach number (Mi )
2. Angle of attack (AOA)
3. Pitch attitude (0)
4. Bank angle ( )
C. INSTRUMENTATION SYSTEMS
The above performance parameters must be acquired and recorded. Instrumentationsystems can be either remote to the test airplane or onboard the aircraft. If takeofftests are to be accomplished, some form of remote time-space positioning instrumentation(TSPI) is very useful. These include cinetheodolite cameras, single-station solutioncameras, radar or laser trackers. These systems are not absolutely necessary, but experi-ence has proven that higher quality data results with their use as opposed to only onboardTSPI equipment. A remote source of weather data (i .e., ambient temperature, pressure,windspeed and direction) is also desirable for test control and data analysis.
For the purposes of Flight Manual performance demonstrations and/or side-by-sidecomparisons, the production cockpit panel instruments and the head-up display (HUD)system should suffice as the onboard instrumentation system. A quick scan of the re-quired parameters previously listed indicates that most are available in productionairplanes either on the panel or on the HUD. Head-up displays, of course, are relativelynew, but will likely be found on all future military airplanes, especially in fighterand attack types. They are very useful for flight testing because they present essentialinformation on easily readable and recordable displays.
Of course, all these data presented by the instrumentation systems must be recordedfor later analysis. If remote TSPI and atmospheric conditions reporting systems areused, their output can be hand recorded; however, most current systems have some form ofanalog or digital permanent output.
The onboard cockpit instruments or HUD may be hand recorded, voice recorded, re-corded on,film or video tape, or most desirably, a combination of these. The simplesttechnique is to hand record the applicable parameters. If stabilized maneuvers are prop-erly flown, this can be a very effective data recording technique. The more stable thetest conditions, the better the results.
Recently, AFFTC engineers have obtained increasingly satisfactory results using apilot's voice recorder to supplement hand recorded data. These systems are extremelysimple and inexpensive and 'consist of nothing more than a small cassette tape recorderinterfaced with the communications system of the airplane and are usually carried by anaircrwmember. During one test series, the small microphone of the cassette recorder wassimply taped inside the pilot's oxygen mask while the recorder was carried in his flightsuit pocket. During the tests, the pilot turned the recorder ON and described all thetest conditions and read the cockpit instruments.

5-6
Cameras designed to record instrument panel presentations have been used for manyyears with mixed success. These cameras are usually hand-held when testing larger air-planes or helicopters and mounted to the airframe when evaluating small or single-seatairplanes. Adverse sun angles appear to be the biggest problem. It always seems asthough the airplane has turned into the sun just at the moment data are required. However,if the tests are planned carefully, these cameras can be used with good results. Again,the more stable the test maneuvers, the easier it is to plan the sun angles so that thecameras are not affected.
Most current fighter or attack airplanes, and probably all future ones will have aHUD and a HUD recording system that uses either film or video tape. The HUD recordingsystem is very useful during pilot training for target scoring and as permanent documenta-tion of training maneuvers. These same HUD recording systems can be used as an outstandingsource of flight test data. Since these are designed to be visible to the pilot under alllight conditions, sun angles are not as critical as with cockpit cameras. Also, a recorderis often standard equipment. If the airplane has a HUD, but no recorder, small, lightweightand reasonably priced video recorders are currently available that are easily interfacedwith the production HUD. These video recorders are also available with optional time codegenerators whose output is displayed on the production HUD. FORMIDABLE.
D. DATA ANALYSIS CONSIDERATIONS
If valid conclusions are to be made from any flight test effort, all airplane per-formance data must be edited before any analysis is attempted. These data must bechecked for "wild points" or inconsistencies utilizing knowledge of airplane performancelimits such as maximum speeds at altitude, airplane acceleration limits and pilot-reportedatmospheric and airplane conditions. While editing and analyzing a relatively smallamount of data, time histories of all performance parameters (i.e., the parameter of in-terest plotted against time) must be plotted and faired. When the airplane performancevalues (such as R/C or NAMPP) are being calculated, the smoothly faired values of theseparameters at the points or times of interest and not the actual da-taporn-t values shouldbe used. By smoothly fairing the time histories or-mle pertinent parameters and usingthe faired values for the calculation of airplane performance, the effects of randomerrors, as indicated by scatter, in the data can be minimized. Although time consuming,this time history fairing technique is probably still the best way to produce high qual-ity performance data. Even the most sophisticated computerized data editing and curvefit routine cannot compare with the experienced flight test data analyst armed with asharp pencil and flexible curve when it comes to determining good data. Typical timehistory plots are illustrated in figure 1.
Indicated pressure altitude must be recorded for any airplane performance analysis.Indicated pressure altitude (Hi) is obtained by setting the altimeter "window" at 29.92inches of mercury. At this setting, the altimeter will read pressure altitude whether ina standard or nonstandard atmosphere.
GROUND TESTS
Carefully planned ground tests are an essential part of every flight test program,regardless of scope. The objective of this section is to discuss three of the most im-portant: instrument calibrations, weight and center of gravity determination, and installedstatic thrust engine calibrations.
A. INSTRUMENT CALIBRATIONS
No valid performance characteristics can be determined without calibrated instruments.The objective of this section is not to describe how to calibrate aircraft instruments,but to discuss some of the types of instrument error and how these errors impact flighttest data. The three principal instrumentation errors that must be accounted for duringflight testing are: bias, lag and hysteresis. Simply stated, bias presents itself as anincorrect instrumentation reading under static parameter conditions. Lag is indicated byan instrumentation error under dynamic or varying parametric conditions. Hysteresis ispresent when the instrumentation reading is a function of its past values, i.e.; the levelspresented are a function of the previously reported values. All three of these principalerror sources are present, to some degree, in all flight test or production airplane in-struments. They cannot be eliminated, but they can be accounted for in subsequent dataanalysis if the error characteristics of the instruments are known. Instrumentation cali-bration is the task of determining these error characteristics.
Once the instrumentation has been calibrated, it is relatively easy to account forinstrumentation errors during data analysis. First, for the actual flight tests, pickthe specific instruments with low, repeatable error characteristics. Indeed, this is thevery purpose of the calibration: not to Ofix" the instruments, but to determine theirerror characteristics so that the most predictable instruments can be used. During dataanalysis, instrument bias is corrected for by using the results of the instrument cali-bration. A typical instrument calibration is presented in figure 2. Note that at an

5-7
indicated airspeed of 200 knots, a 5-knot instrument error correction must be made. Be-cause of instrument hysteresis, the correction must be obtained by averaging the upscaleand down scale readings. Instrument correction is the very first step in data editingand analysis, and it is accomplished prior to plotting of time histories.
Lag constants can be determined by applying step input functions to the instruments.These techniques are documented in reference 1. Applying lag constants, however, is dif-ficult. For the purposes of an airplane performance demonstration or comparison, the bestway to handle instrument lag is to first, pick instruments with low lag values and second,plan stable test maneuvers so that the key parameters are held as constant as possible.
Hysteresis is also represented in figure 2 as the difference in the correction tobe added to indicated airspeed when going upscale or down scale. Notice that instrumenthysteresis results in errors as high as 10 knots at 200 knots indicated airspeed. Hyster-esis cannot be accounted for by applying a simple correction as in the case of bias or bymission planning as in the case of lag. Since it is essentially impossible to track theprevious history of the parameter being displayed, hysteresis presents itself as randomscatter on the data. Therefore, during data analysis, hysteresis is accounted for byusing an instrument calibration correction that is an average of the upscale and downscale readings and by putting a smooth fairing through the resulting time histories asdiscussed in the Data Analysis Section.
One preflight test procedure that fits loosely under the heading of instrumentationcalibrations is checking for and eliminating pitot-static system leaks. These are veryimportant checks and they are often overlooked. The exact method to leak check thepitot-static system of a given type airplane is specified in the Technical Orders forthat aircraft so methods will not be discussed here. The point to be emphasized, how-ever, is that pitot-static system leaks, if present, must be brought within reasonablelimits or the resulting airplane performance data will be erratic and inconsistent. Atthe AFFTC, acceptable maximum equivalent leak rates are considered to be: 1 knot per min-ute at 300 knots indicated airspeed, and 50 feet per 3 minutes at 15,000 feet indicatedaltitude.
At the AFFTC flight tests are not attempted without first accomplishing instrumentcalibrations and leak checks. If we go to a remote site on a quick-response test, cali-brated instruments for key parameters are taken and used to replace the airplane's pro-duction instruments. In later sections of this paper, key parameters will be identifiedwhose instruments must be calibrated for a given performance test. Unfortunately, in-strumentation calibrations require comparisons of the test instruments with some repeat-able, accurate standard and this usually means a sophisticated and complex calibrationlaboratory. Experience has indicated that any shortcuts taken in the calibration processusually result in erroneous performance data. If the testing organization does not haveaccess to these facilities (either within government or in the private sector) then themanufacturer of the test airplane must provide either instrument calibrations or datathat have already been adjusted for instrument calibrations.
To summarize, all instruments which will display key parameters must be calibrated.The instruments to be used for the tests are selected for low, repeatS-fe error levels.Pitot-static system leaks are brought within limits. Missions are flown to minimize theeffects of instrumentation lag. The first step in data editing is to apply correctionsto the indicated parameter values for bias and then the parameter time histories areplotted and smoothly faired to account for instrumentation hysteresis characteristics.
B. WEIGHT AND CENTER OF GRAVITY DETERMINATION
The performance of any airplane is a direct function of gross weight, and to a lesserdegree, center of gravity (cg) position because of longitudinal trim drag. The grossweight of the airplane must be known for all test conditions and any error in the deter-mination of gross weight will be reflected directly in the final airplane performanceresults. At the AFFTC, fuel tank calibrations are conducted to determine gross weightand cg as a function of internal fuel quantity and airplae pitch attitudes. For a pro-duction airplane, however, it is usually sufficient to use the manufacturer's recommendedweight, cg and fuel quantity curves as represented by figure 3. The manufacturer must,however, provide instrument calibrations for all cockpit fuel quantity indicators, includ-ing the totalizer, so that instrument error can be removed from the calculation of grossweights.
The test airplane must be weighed before and after each performance flight to deter-mine engine start and shutdown gross weight and cg location. This is required becausethe airplane's gross weight and cg will change from mission to mission because of dif-ferences in fuel specifics, loadings and configurations. Once the engine-start measure-ment for gross weight and cg are used to adjust the manufacturer's reconmmended curves,standard fuel burn sequences and cg variation with fuel quantity are always assumed, asillustrated in figure 3, Gross weight is determined for test conditions by subtractingfuel used from the measured engine-start gross weight. Center of gravity is obtained byusing the manufacturer's curves adjusted for the engine-start cg measurement.

5-8
Postflight gross weight and cg measurements are used to validate the in-flight weightand cg computations. If an unacceptable difference exists between the postflight measuredand the calculated values for gross weight and cg, a simple linear correction as a func-tion of time is applied to the calculated values as illustrated in figure 3. If testexperience indicates no significant difference between postflight measured and calculatedvalues, the requirement for the postflight weighings may be relaxed.
Special equipment is required to determine the weight and cg locations of the testairplane. Recently, a number of manufacturers have marketed portable scales designed toaccomplish this task. These portable scales have been used at the AFFTC with excellentresults. Specifications for these scales are given in reference 2. The key parametersthat must be measured are;
1. Fuel quantity from totalizer
2. Airplane gross weight (Wt)
3. Airplane center of gravity (cg)
The importance of an accurate determination of in-flight gross weight cannot be over-ly emphasized. Probably the two biggest problems in assessing "field" reports on airplaneperformance at the AFFTC is the uncertainty in instrumentation calibrations and erroneousgross weight information.
C. STATIC INSTALLED THRUST DETERMINATION
When conducting flight tests, there always exists a concern as to whether or not thetest airplanes are a representative sample from population or aircraft fleet of interest.One series of ground tests that must be accomplished to assist in this "representativesample" determination is a static thrust run. Specifically, the objectives of staticthrust calibrations are to determine if:
1. The test engine is representative of a production unit
2. Thrust levels before, during and after the performance testsare consistent
3. Airframe installation thrust losses are as advertised assumingthat the uninstalled engine performance is known
4. The engine information provided in the DT&E reports andperformance data substantiation documents is valid forthe test airplane
Obviously, only a limited amount of data can be acquired toward objective 4 since astatic thrust run permits exploration of only a small portion of the engine's operatingenvelope. However it is an important portion since it covers the takeoff envelope whichis always of concern. The data obtained also forms an excellent base from which to as-sess the data indicated for the remaining positions of the envelope.
To conduct static thrust runs, some method is required of measuring the horizontalcomponent of installed thrust from idle to maximum power. This is normally accomplishedwith a thrust stand where the airplane can be secured to allow maximum power operation.Thrust stands vary from complex balance-beam affairs with real time computational capa-bilities as represented by the AFFTC horizontal thrust stand to simple cable and load cellarrangements as presented in figure 4. The airplane is secured with a cable attached tothe landing gear struts and a ground tiedown. The cable is quite long (approximately 50feet) to both keep the angle between the cable and the thrust vector low, and to allow theload cell to be placed in a position of relative protection from the engine exhaust. Theload cell is a standard model calibrated prior to use and its output feeds into a signalconditioning system that allows for both a real time digital output and an analog per-manent record of the thrust levels attained. Excellent test results have been attained byAFFTC personnel using this simple and inexpensive thrust measurement system.
The key parameters that must be recorded are;
1. Pressure altitude (Hi)
2. Ambient temperature (Ta )
3. Ambient windspeed and direction (Vw
4. Engine fuel flow (Wf)
5. Power lever angle (PLA)
6. Engine speed (rpm)

5-9
7. An appropriate power indicating parameter such asturbine inlet temperature (TIT), engine pressureratio (EPR)
8. Measured static thrust (Fg)
After the airplane has been secured with the cable, run the engine to maximum powerfor a few seconds to remove any slack from the system and "set" the cable. Shut down theengine and null-the load cell output to zero. For the actual tests, traverse the en-gine static thrust range from idle to maximum thrust and back to idle in approximately 5percent increments of either rpm, EPR or measured thrust. Allow 3 to 5 minutes of enginestabilization after the point has been set or until the strain gauge output indicates astable thrust level. Record all atmospheric-data and key engine parameters at each incre-ment. If the test airplane is equipped with afterburners, either PLA, Wf or nozzle posi-tion (if available) can be used to supplement measured thrust as test control parameters.Of course, if only minimum and maximum afterburning thrust data are required, PLA is suffi-cient to set repeatable test points. Usually the thrust range is traversed twice withsingle-engine airplanes, and once for each engine then once with both engines for two-engine airplanes if fuel permits. For large airplanes with two or more engines mountedrelatively far from the centerline of the airplanes, tests should be planned to minimizeyawing moments created by asymmetric engine operations.
These tests should be conducted at least at the start and end of the flight testsduring periods of calm or very light w-Tns-The load cell should have a range ofoperation and the cable be of sufficient strength so that data can be acquired with allengines at maximum thrust. For safety considerations and test control, radio contactmust be maintained with the pilot at all times. It is important that foreign-objectdamage (FOD) screens not be installed over the airplane's engine air inlets during thesethrust calibrations.
The installed thrust run data are presented as illustrated by figure 5. The basicconcept is to obtain engine installed thrust as a unique function of engine parameters.During the tests, these plots are developed for test control by using indicated valuesfor the parameters. After the tests, however, instrument calibrations are applied andan effort is made to develop unique functions between installed thrust and rpm, EPR, TITand fuel flow. Parameter identification techniques have indicated that the engine datacan be normalized (i.e., reduced to a unique function) using the parameters presented infigure 5B, however, other coefficients can properly be used to normalize a given data
set. For example, 6a0 6 88 has been used rather than 0a 5 as indicated in figure 6.Other coefficients may be valid as long as it is recognized that they are good o for aparticular data set.
Performance demonstrations and comparisons could be successfully conducted withoutusing the static thrust run results to develop or confirm existing thrust and engineparameter relationships since no attempt is made to establish absolute levels of thrustand drag. What makes static thrust runs absolutely necessary for any performance flighttests, is the determination of: whether or not the airplane is a representative fleetsample; any engine performance changes during the flight tests; and finally, the extentof losses in engine performance due to the airframe installation.
FLIGHT TESTS
Finally, we arrive at the purpose indicated by the title of the paper: The perfor-mance flight testing of production airplanes. These flight tests can be used to evaluatenew models or subsequent production machines. It should be emphasized, however, thatno flight testing can be successfully accomplished without information from the groundtesting previously discussed.
A. AIRSPEED CALIBRATIONS
All airplanes are calibrated for pitot-static system error during development. How-ever, some export and virtually all later production airplanes have small configurationchanges around the nose or empennage that may cause these initial calibrations to becomeinvalid. There is no way to obtain quality performance data if a high level of uncertain-ty exists in the speed and altitude of the airplane. In flight testing for pitot-staticsystem errors, it is usually assumed that all the airspeed and altitude errors resultfrom the positioning of the static pressure-source and that the pitot probes are free oftotal pressure reporting error. This assumption greatly reduces the magnitude of thepitot-static position error determination and has been proven to provide performance dataof suitable quality.
The objective, therefore, is to determine static pressure source errors due to thepositioning of the static ports on the airframe. Total pressure errors and total temper-ature errors are usually not investigated. Analytical methods do exist for the calcula-tion of static source position errors but their applications hai met with mixed success.Most performance flight test engineers still rely on, indeed insist upon, flight tests todetermine the static source position errors. The task, therefore, is to determine the

5-10
actual pressure altitude at which the test airplane is flying and compare that altitudeto the altitude indicated by the instrumentation system after the proper instrument cali-brations have been made.
Volumes have been written about this subject. On the surface, the conduct and anal-ysis of static source position error tests would appear quite straightforward. In actualpractice, however, these tests and the subsequent data analysis is often quite complex.There are two principal methods that provide adequate data to assess subsonic staticsource position error. These are the pacer and the ground reference flyby techniques.The pacer technique involves flying the test airplane in formation and at the same altitudeas a "pacer" airplane with a known, previously calibrated, static pressure position error.The ground reference flyby technique involves flying the test airplane past some ground-based reference point at a known, and recorded pressure altitude. The static sourceposition error of the test airplane is then determined by comparing its reported pressurealtitude, connected for instrument error, with that of calibrated pacer or the known pres-sure altitude at the reference. In equation form, this process can be represented as:
AHpc . HcRef - HicTestwhere AHPC = static pressure position error of test airplane
HcRef - True pressure altitude of reference, either paceror a ground point
HicTest = Reported pressure altitude of test airplaneafter correction for instrument error
Since the ground reference is usually at a lower altitude than the test airplane,equation (1) must be expanded to account for a difference in height. The ground refer-ence flyby technique and the variables involved are represented in figure 6. For thistechnique equation (1) becomes:
T
a5
AHc Cs Hc Ref + a a x Ah t-H et (2)
where Tat = Test-day ambient temperature (deg K)
Ta = Standard-day ambient temperature (deg K)
Aht = Measured height difference between ground referenceand test airplane
Once AHpc has been determined, the effect of this static source position error onairspeed, Mach number, and static pressure for both subsonic and supersonic flight can becalculated using equations presented in reference 1. Only the subsonic equations arelisted below.
a f . 2 2.5AVpc-- AHpc x , x V56 - I + 0.2 a (3)
aM AHpc x 0.007438 (1 + 0.2 Mic2 (4)PC p aTa M ic
l iV. 2],2.5 2 1. (V. 2](1Wc)31 4 .5 1+0.2 ic x -Vt+ JQ7 a01 (Vic 1 a5 )Ap slT.1 a51 ] .Ll+0 J l l2 , ja
1+0.2 (-.0
a sl(5)
Where AV P Airspeed position error correction
as Density ratio (p/psl) measured at Hic
a.1 , Speed of sound at sea level - standard day conditions
Vic - Instrument corrected airspeed
AMC - Mach number position error correction
Ric - Instrument corrected Mach number

5-I I
T = Standard day temperature at HIC (deg K)S
To employ the ground reference flyby technique, one requires equipment to measurepressure altitude at the ground reference, and a method of determining the height betweenthe reference and the test airplane (Aht). At the AFFTC, 4 to 6 standard altimeters areused to simultaneously record pressure altitude as the test airplane passes the referenceground station. The readings from these altimeters are then averaged in a simple buteffective attempt to reduce the impact of hysteresis and random errors. Any height mea-suring system can be used to measure Aht. At the AFFTC we use geometrical triangulationwith the tower and flyby line as references but stadiametrics, cinetheodolites, lasertrackers, ground-based radars, etc., can be used. One very promising new concept is theuse of the onboard radar altimeter to measure Aht. In the past, these radar altimetershave not been of sufficient accuracy or resolution to enable their use in static pressureposition error determination. Newer radar altimeters, however, promise both greatly im-proved accuracy and resolution. The advantage of radar altimeters is that they are stan-dard equipment on the airplane so no modification to the airframe is required, and theyeliminate the need for any ground-based Aht measurement system.
The pacer method is probably the easiest to analyze and requires no special groundequipment, however, it naturally requires the expense and maintenance of a calibratedpacer airplane with approximately the same performance envelope as the test airplane. Atthe AFFTC, the maintenance of a fleet of four pacers is a full-time effort. Each pacermust be flown against a calibrated reference, such as another pacer or the ground refer-ence, approximately every 4 months so that its pitot-static system characteristics remainknow in spite of frequent instrumentation or airplane configuration changes. The instru-ments used in the pacers are frequently removed for calibration updates.
Regardless of which technique is used to obtain the static source position errorcalibration the following key parameters must be recorded for each data point;
1. Ambient pressure altitude from ground reference or pacerairplane (HcRef)
2. Ambient temperature (Ta
3. Indicated pressure altitude of test airplane (Hi)
4. Indicated airspeed of test airplane (V.)
5. Gross weight of test airplane (Wt)
6. Height from ground reference to test airplane: flyby methodonly (AHt)
The reference flyby technique as proven through experience to be the most precisemethod. It is, however, time consuming since only one data point is obtained per passby the reference, 2nd requires a relatively complex analysis. It also produces data atonly one, rather low, altitude. This does nct usually present a problem when calibratingfighter or attack airplanes that have both high airspeed and Mach number limits. It does,however, present a problem when testing larger airplanes that usually have rather highMach number speed limits but are restricted to relatively low values of airspeed, Oecausethey cannot be flown to true airspeeds high enough to enter the transonic region whenposition errors are usually the largest. When conducting reference flyby tests, care mustbe exercised to keep the test airplane at sufficient height so that the static sourceposition error calibration is not influenced by the proximity of the ground. At theAFFTC, a rule of thumb is to fly at least 1 wingspans above the ground while recordingdata.
The pacer method can be used throughout the altitude envelope of the test airplane.Because of the difficulties associated with flying in close formation at very preciseairspeeds, however, the pacer method usually produces static source position error dataof rather less quality than the ground reference flying method. It is recommended, how-ever, if the performance flight test organization has access to a calibrated pacer air-plane. It is a very time-efficient technique since many points can be obtained per mis-sion. The pacer method also allows AV to be directly measured so that the measuredvalues can be compared with those calculated from AHpc using equation (3).
There are other techniques that can be used to determine static source position er-rors, but they are not recommended. These techniques, such as the groundspeed course,usually require either complex analysis or are very dependent on the measurement of at-mospheric conditions such as windspeed and direction. Supersonic static source positionerror calibrations are possible, however, they will not be discussed in this paper due totheir rather limited application and because supersonic static or total pressure positionerrors are very small above the transonic speed range. Usually the ground reference fly-by technique is used with ground-based radars required to determine Aht. Since the testairplane is usually at very much higher altitudes than the ground-based radars, greatcare must be taken to account for atmospheric conditions when attempting to obtain super-sonic position error calibrations with radar data.

5-12
Typical static source position error data are presented in figure 7. The recommendedtechnique is to convert the AH c values obtained during flight testing to values of-P/qcic (which is called the static source position error coefficient) using equation (5).These values of referred pressure differences are then plotted versus lift coefficient andfaired as in figure 7. Lift coefficient calculated using instrument-corrected Mach numberis labeled CLic The determination of lift coefficient is discussed in the Cruise Perfor-mance Section and defined by equation (12). Once a consistent fairing for position errorcoefficient has been attained, the fairing can be converted back into AHDc fairings usingequation (6), and into AVpc and AMpc fairings using equations (3) and (4J, respectively.
=29.92126 [1+0.2 V ic2 23.
sl -1AH PC = q xP -- (6)qc-c 0.00108 8(
where o& = Density ratio at (Hic+ AH P/2)
Curve and table lookup values for the relationships expressed in equations (3), (4),(5), and (6) can be found in reference 1.
The basic concept is to obtain AHpc from flight test, convert AHpc to values of thestatic source position error coefficient (AP/q ic) and obtain a consistent fairing. Thisfairing is then converted back into fairings o AVVpc, AMpc and AHpc. Although this pro-cess appears relatively simple, obtaining consistent, accurate static source positionerror calibrations is one of the most basic, yet most challenging tasks in performanceflight test. Almost every conceivable phenomenon from angle of attack to ground effectto fuselage flexure around the static ports can and does effect the position error cali-bration data. Static source position error calibrations, however, must be conducted ifthere is any indication that the test airplane does not share the calibrations of the pro-duction airplanes as indicated in the Flight Manual.
B. TAKEOFF PERFORMANCE
The takeoff performance of an airplane is very important since it determines, amongother things, from where the airplane can be operated. The objective of these tests isto determine the horizontal ground distance that the airplane requires to acceleratefrom brake release to takeoff (lift-off) and from takeoff to some obstacle clearanceheight, usually 50 feet (the airphase distance).
Of course, to fulfill the objective, some technique or equipments are required tomeasure horizontal distances. Single-station solution cameras, cinetheodolites andlaser trackers have all been used with success. Some larger airplanes have downward-looking cameras mounted on the fuselage bottom to photograph runway features such aspainted stripes or tar strips that are at known distances along the takeoff roll. Onetechnique that has been successfully employed in the past during remote site testing is tostation several observers along either side of the runway at the anticipated takeoffpoint. After the actual takeoff each observer independently walks to the spot he or shethought the airplane lifted off. The distances from brake release to each observer arerecorded and averaged for a single takeoff distance. Although not terribly sophisticated,this technique can produce data of suitable quality for the purposes of a performancedemonstration or comparison. This technique cannot be used to determine obstacle clear-ance distance. In the absence of TSPI, obstacle clearance distances must be calculatedusing onboard production or flight test instrumentation and can be approximated by:
_ 50 50
S50 Tany - tan [sin-i ( 50 M vLo+v5O, (7)t50-tLo
Where S = Distance to 50 feet (ft)
t50 = Time from brake release to 50 feet (sec)
tLo = Time from brake release to lift-off (sec)
VLo - True airspeed at lift-off (ft/sec)
V5c - True airspeed at 50 feet (ft/sec)
A simple TSPI system to measure obstacle clearance distances can be implemented bystationing several manually-sighted theodolites and operators at predetermined distancesalong the runway between the Flight Manual-specified takeoff and obstacle clearance dis-tances. These theodolites are used to determine the height of the airplane as it passeseach station. Each operator would also be equipped with a portable radio and a stopwatch.At brake release the pilot activates the event tone as a signal for each operator to starttheir stopwatch. As the airplane passes each theodolite station, time and height above theground are recorded. The pilot must record takeoff and climbout airspeed@ either manuallyor with the onboard instrumentation. Using this technique, a reasonably accurate obsteoLe

5-13
clearance performanc-' analysis can be accomplished. Brake release to takeoff distancewould be determined y additional observers who would converge on their estimated lift-off point as previously discussed.
Maximum performance landing or rejected takeoff (RTO) tests are not recommended forperformance demonstrations and comparisons. Few airplanes can accomplish these testswithout presenting hazards both to the aircrew and ground observers. Lightweight maxi-mum performance landings present the possibility of blown tires due to skids and sub-sequent loss of control of the airplane. Heavyweight maximum performance landings orRTOs can result in fused brakes and flat or even blown tires due to the tremendous heatgenerated by the brakes during the stop. Maximum performance landing or RTOs are amongthe most hazardous tests conducted at the AFFTC and should be attempted only under verycontrolled conditions by experienced flight test personnel.
The key parameters required to demonstrate Flight Manual takeoff performance are:
1. Indicated airspeed during takeoff roll and airphase (Vi)
2. Aircraft indicated pressure altitude (Hi)
3. Ground roll distance to takeoff (STO)
4. Height of airplane above runway, if TSPI is available (ht)
5. Airphase distance from takeoff to 50 feet, if TSPI is available ($50)
6. Airplane gross weight (Wt)
7. Local meteorological data such as;
a. windspeed (V )b. Wind directionc. Ambient temperature (T
a
d. Ambient pressure altitude (Pa)
e. Runway slope
If takeoff tests are conducted to provide data for comparison with the Flight Manual,the airplanes should be operated as recommended by the Flight Manual. No-wind conditionsare by far the best for these tests, but they can be conducted in steady winds if theFlight Manual provides charts to account for winds during takeoff. Equations do exist toallow takeoff and airphase distances to be corrected to no-wind conditions, but they re-quire considerable experience to apply correctly and are not recommended. Equations alsoexist to allow correction of test day takeoff distances to standard day conditions. Theyare not required for these performance demonstrations because the basic objective is todetermine if the Flight Manual accurately represents the takeoff performance of the air-plane over a wide range of test-day conditions. Since takeoff performance data tends tobe quite scattered (large values of standard deviation), many tests with several repeatpoints are required before any defendable conclusions can be made. Therefore, every take-off accomplished during a performance demonstration or comparison should obtain groundroll and airphase distances. If takeoff performance is a prime concern for the test air-planes, consideration should be given to reserving one or two flights for the sole purposeof conducting takeoff tests. In this manner, not only can the data base be expanded, butthe effects of gross weight and temperature can be examined.
C. CRUISE OR RANGE PERFORMANCE
Cruise performance or range is an important factor in the assessment of the combatpotential of an airplane and tests to determine cruise performance must be included inany performance demonstrations. The accepted method currently used to determine cruiseperformance is the stabilized speed-fuel flow method commonly called the speed-powertechnique.
The key parameters that must be recorded at each stable speed-power point are listedbelow. Remember that each must bc corrected for instrument error and that airspeed andpressure altitude must also be corrected for static source position error before any dataanalysis is attempted.
1. Indicated airspeed (Vi)
2. Indicated pressure altitude (Hi)
3. Total temperature (TT )
4. Total fuel flow (Wf)
5. Total fuel remaining

5-14
Speed-power data can be obtained during any flight condition with stable airspeedand altitude, however, the two most popular methods are at constant altitude, and at con-stant weight-pressure ratio (Wt/6a). The constant-altitude method is very useful sincemost Flight Manuals have cruise performance presented as a function of airplane speed(Mach number) and weight at a constant altitude. Constant-altitude cruise data are ob-tained by flying the airplane at selected speeds from the maximum speed attainable orallowable at the nonafterburning power setting to near-minimum flying speed. Each speed-power point must be stable in airspeed, pressure altitude and power setting. Airplanetrim or configuration must not be changed during the speed-power point. From three tofive minutes of stable flight are required per point with data recorded at the beginning,middle and end of the stabilized period. It is important to fly as slow as possible whenobtaining the near-minimum flying speed point. This not only allows a qualitative assess-ment of the airplanes flying qualities at slow speeds, but insures that the airplane isflown on the "backside" of the power curve during the speed power tests. The backsidepoints are not required if only optimum cruise is of interest, but allow a concurrentassessment of the endurance or loiter performance of the airplane.
As previously noted, total temperature or ram air temperature must be recorded inflight. The Flight Manual will present cruise performance as a function of ambient tem-perature (Ta). To convert total temperature (Tt) to ambient temperature (Ta), use therelationships in equations (8) and (9).
TT = T l + K(1) M2] (8)
where TT - Total air temperature (deg K)
Ta = Ambient air temperature (deg K)
K = Temperature probe recovery factor (usually from 0.95 to 1.00)
y = Ratio of specific heats: Cp/Cp v
M = Mach number corrected for static source position error
If K is assumed to be equal to 1.00, which is an appropriate assumption for the pur-poses of a performance demonstration, and the ratio of specific heats (y) is assumed to beconstant 1.4, which is usually valid for Mach numbers less than 2.0, then equation (8)reduces to:
T = T /(l + 0.20 M ) (9)
If one of the objectives of the performance tests is to either determine the optimumcruise conditions or validate the Flight Manual's recommended optimum, the constant weight-pressure ratio technique is used. The test points are flown in the same manner as theconstant-altitude technique with stable airspeed, pressure altitude and power levels, butsuccessive points are flown at higher altitudes to maintain a constant value of Wt/6a asthe airplane becomes lighter due to fuel consumption. The ratio of test to sea levelstandard pressure (6a) is calculated as shown in equation (10).
6a = Pat/Pasl (10)
where Pat = Test ambient pressure
Pa., = Standard-day sea level pressure
By flying the airplane at stabilized speed-power-altitude points and at constantWt/ 6a with various Mach numbers intervals, the optimum cruise conditions can be validatedor determined. Optimum cruise performance will occur when NAMPP is maximized. Cruiseperformance is usually expressed in terms of the parameter Range Factor (RF) as defined
VTRF = NAMPP x W = Vf x W (11)
T W f t
where VT - True airspeed
Wf = Total fuel flow
Wt - Airplane gross weight
by equation (11). For jet-propelled airplanes, fuel flow is essentially a function of thethrust required for level flight (as opposed to power required for level flight as is thecase for propeller-driven airplanes). Thrust required for level flight is equal to totaldrag for that flight condition, which can be expressed as the nondimensional parameter,drag coefficient (CD). Drag coefficient, in turn, can be defined by lift coefficient(CL) and Mach number. Because of these relationships it can be shown that the cruiseperformance of a jet airplane, i.e., the speed-fuel flow relationships NAMPP and RF canbe expressed in terms of speed and lift coefficient. As indicated by equation (12) , liftcoefficient is a function of Mach number and the weight-pressure ratio for a given type ofairplane. Therefore, by flying speed-power test points at constant values of Wt/6a and

5-15
at various Mach numbers, we are essentially attempting to find the lift coefficient andits related Mach number which produces the lowest drag, and hence fuel flow, for the highestspeed. Best endurance or loiter performance is simply the speed, at any specified alti-tude, where minimum fuel flow occurs. Best endurance speeds can be determined at anyaltitude by merely reducing speed until either fuel flow stops decreasing and begins toincrease, or until flying qualities dictate that no further reduction in speed isadvisable.
CL.4...x * (12)
where nZ = Normal acceleration
S = Airplane reference wing area
Constant Wt/6a speed-power data are usually analyized by preparing plots like thosein figure 8. The recommended optimum cruise Mach number, altitudes, and gross weightsare obtained from the Flight Manual. Tests are then conducted at a number of weight-pressure ratios at and around this recommended optimum value, as illustrated in figure 8A.The full speed range from maximum speed in nonafterburning power to near-minimum flyingspeed should be investigated at each weight-pressure ratio. The number of speed-powerpoints flown during each weight-pressure ratio series depends on the speed range, but sixto eight is normally considered a minimum. The airplane should be flown at the high speedpoint first and then speed reduced for each subsequent point in the weight-pressureratio series. After the weight-pressure ratio series have been plotted on the RF versusMach number plot, the data are faired as illustrated in figure 8A. The peaks of theseconstant weight-pressure ratio fairings can then be plotted as shown in figure 8B to aidin further data analysis.
During a demonstration or comparison flight test, probably both the constant-alti-tude and weight-pressure ratio techniques will be used to determine cruise performance.Regardless of which technique is used, there are several corrections that can be made toadjust the resulting speed-fuel flow relationships for off standard or aim flight condi-tions. Theoretical relationships exist for correcting test fuel flows to standard am-bient temperatures, desired test weight-pressure ratios and to zero values of excessthrust. However, for the purposes of flight test to demonstrate Flight Manual perfor-mance, these corrections are not usually required or recommended. Cruise performance isnot exceptionally sensitive t5-mall variations in ambient temperature and, indeed,Flight Manuals only present NAMPP or RF for standard day temperatures. The requirementfor corrections to account for variations in weight, altitude and power levels duringany given test speed-power point can be minimized through proper pilot technique directedtoward insuring a stable point. If subsequent data analysis indicates that a particularpoint was unacceptable, it can easily be reflown since cruise performance tests canreadily fit into any test scenario. If program constraints require that a limited amountof unstable data must be analyzed, the equations and techniques required to apply temper-ature, weight, altitude and energy corrections to cruise data are presented in reference3. These corrections can become quite complex, however, and are not recommended forperformance flight demonstrations or comparisons. By far, the best results can be ob-tained by expending effort to fly good, stable speed-power data rather than to attemptcorrection of unsuitable data. ID. ACCELERATION AND TURNING PERFORMANCE
Sometimes referred to as "combat performance" in Flight Manuals, acceleration/deceleration and turning performance is of interest in all military airplanes, but es-pecially in fighter and attack airplanes. The objective is to determine if the FlightManual is correct and appropriately depicts the ability of the airplane to change itsenergy level and direction of flight. The basic concept for the performance demonstra-tions and comparison of production airplanes is to analyze dynamic performance character-istics, such as accelerations and turns, using as stable maneuvers as possible.
Energy-Height Concepts
Excess thrust Fex is the essential parameter for the analysis of acceleration anddeceleration performance. Unfortunately, unless the airplane is equipped with flightpathor body mounted accelerometers and a high sample rate data recording system, excessthrust cannot be measured accurat-ely and must be calculated. Further, it must be calcu-lated indirectly by first calculating Specific Excess Power (Ps) which is the time deri-vative of energ-height (HE). These calculations are based upon the measurement of thespeed and height of the test airplane obtained from either onboard cockpit instrumentationor ground-based TSPI.
The primary data to be obtained from acceleration (or deceleration) testing are timerequired to obtain a given Mach number and PS. Time required to accelerate to a givenMach number can be determined directly from faired time histories (our first data analysisstep) of either cockpit instrumentation-derived true airspeed and Mach number or ground-

5-16
based TSPI. Remember that the cockpit-derived values must be corrected for both instru-ment and static source position errors. These times to accelerate or decelerate can becompared directly with Flight Manual values for test day conditions.
Energy height, PS and Fex are found by considering the total energy of the test air-plane to be the sum of Potential and Kinetic energies at any point during the accelera-tion.
E = Wt (H + VT2/2gr ) (13)
where E = Total energy
H - Geopotential height, which is merely tapeline height (ht) corrected forlocal gravity
gr = Universal gravity constant 32.174 ft/sec2 or 9.806 M/sec
2
By dividing both sides of equation (13) by airplane test gross weight, Energy-Height(HE) can be obtained, and PS is merely the time derivative of Energy-Height. We must,however, calculate H using either the time differential of tapeline altitude (h) as ob-tained from ground-based TSPI, or the time differential of pressure altitude (Ac) as ob-tained from onboard cockpit instrumentation. For ground-based TSPI, equation (16) can beused. If, however, instrument and static source position error corrected onboard instru-mentation are used, equation (17) is appropriate.
VTE__ = H + V (14)HE =Wt r
S HE gr
PV9 T x(16)Psgr gh r VT
where 91= Local acceleration due to gravity
gL " / Tstd + a (17)
s rHc - + (17)Ttes t I
where Tstd = Standard-day ambient temperature at test altitude (deg K)
Ttest = Test-day ambient temperature at test altitude (deg K)
For most flight test work, and especially for performance demonstrations or side-by-side comparisons as defined, herein, both ratios gL/gr and (Ts t/Ttest)" can be assumedquite small and will not significantly effect the calculation 6 specific excess power.If this assumption is made, equation (17) reduces to equation (18). Excess thrust can be
Ps - +!TXVT (18)
calculated using equation (19).
WtFex - P5 x Wt (19)
With this last equation, all the essential elements have been obtained to evaluateFlight Manual acceleration, deceleration and turning performance. Specific excess powerdata are used to determine optimum climb and acceleration schedules and Fex data are usedto determine best turn speeds.
Key parameters that must be recorded during acceleration and turning performancetests are:
1. Indicated airspeed (Vi)
2. Indicated pressure altitude (Hi)
3. Total fuel quantity remaining
4. Total temperature (TT)

5-17
5. Normal acceleration (g)
6. Time
TEST MANEUVERS
Test techniques will be discussed for level accelerations, stabilized and windupturns. Level decelerations will not be discussed since they are essentially the reverseof level accelerations. Level accelerations are particular productive performance maneuversthat can be used to obtain direct side-by-side comparisons of the performance of two dif-ferent airplanes, the minimum practical flying speed as well as the thrust-limited maximumspeed, times to accelerate to given Mach numbers at selected normal load factors, and P.and Fex levels throughout the speed and altitude envelope at selected normal load factors.Level accelerations can be conducted at 1 g or at elevated normal accelerations and loadfactors if the performance of the test airplane permits. Level accelerations at elevatednormal load factors are accomplished in a turn at constant altitude. To accomplish theacceleration, the airplane is first stabilized at near the minimum flying speed. It isoften useful to use speed brakes and/or a turn at a load factor higher than the plannedacceleration to help stabilize the airplane at a low speed while keeping engine power ata relatively high level. This is especially helpful when testing airplanes equipped withslow-accelerating engines. When the airplane and engine(s) have stabilized and the desiredheading is reached, simultaneously retract the speed brakes, advance power to the leveldesired for the acceleration, and roll out wings level for a 1-g acceleration or to thebank angle appropriate for the selected normal load factor. Accelerate to maximum orthrust-limited speed at constant altitude. Onboard cockpit instrumentation, be it pilotcomments and notes or cockpit and/or HUD cameras or video recorders, should be used toacquire data at the maximum sample rate possible. Regardless of the data acquisitionsystem, the pilot should call out speeds and times during the acceleration for recordingby ground-stationed test personnel.
One of the items of interest that result from 1-g level acceleration tests is themaximum speed of the test airplaie at given test gross weights, altitudes, and tempera-
tures. It is often desirous to determine the maximum speed of the airplane at standardtemperatures and gross weights to evaluate guarantee compliance. This can be quitesimply, yet effectively done by plotting test-day ambient temperature versus maximumspeeds attained as functions of airplane test gross weight as presented in figure 9. Theplot can then be entered with standard-day values of ambient temperature, a specifiedgross weight, and the maximum speed for those conditions determined with reasonable ac-curacy.
Stabilized turns are designed to determine the thrust-limited turning performanceof an airplane. For any given airplane, the level of normal acceleration that can besustained in a turn is a function of the test gross weight and thrust available. Theseare excellent maneuvers to acquire data for performance demonstrations and comparisonsbecause the results are fairly insensitive to small variations in atmospheric conditionsor airplane gross weights. The Flight Manual values for sustained maneuvering capability,therefore, can easily be validated for the test conditions flown without corrections forfuel used during the maneuver or small changes in pressure altitude and ambient tempera-tures. The airplane is stabilized at the test values of speed (Mach number) and altitude.The stabilized turn is initiated by the pilot simultaneously selecting maximum power androlling into a turn to increase bank angle until normal acceleration, Mach number, andaltitude are stabilized. When speed and altitude are stable in maximum power, the re-sulting normal acceleration is the thrust-limited turning capability. These turns canoffer considerable pilot challenge at the higher normal accelerations and load factors.The exact technique used to stabilize in speed and altitude varies with pilot preference.AFFTC test pilots have learned that it is helpful to think of using bank angle to controlspeed and pitch altitude to control altitude while attempting to stabilize.
It is often useful to follow a level acceleration or thrust-limited turn with a wind-up turn to the maximum useable lift coefficient. After the acceleration or stabilized turnthe Mach number is maintained as constant as possible while normal acceleration is increasedat approximately 0.5 g per second to the maximum useable lift. The pilot notes buffetcharacterisitics as normal acceleration and load factor, and therefore angle of attack in-crease. These lift-limited turns can be compared with the thrust-limited performance toform a good quantitative picture of the maneuvering potential of the test airplane. Notethat the buffet levels and maximum useable lift as functions of angle of attack and CL arenot affected by variations in airplane gross weights or atmospheric conditions.
Specific excess power and Fex data presentation and analysis should be initiated bya time-history presentation of the instrument corrected and static source position errorcalibrated key parameters as is the case for all the test data discussed in this paper. Atselected times throughout the acceleration, equations (13) through (19) are used to calcu-late PS and Fex from the data fairings. Specific Excess Power and Fex values are usuallypresented as shown in figure 10. Both PS and Fex are plotted as a function of Mach numberand pressure altitude, with accelerations resulting in positive values of PS and Pex anddeceleration in negative values. These values of PS and Fex will be at the test altitudesand ambient temperatures and should be so noted. The resulting data fairings can be usedtL determine agreement with the Flight Manual which will usually contain hot day, standardday and cold day performance. The data can also be used to; validate or modify speeds for

5-18
optimum climb and maneuvering since correction to standard day ambient temperatures changethe levels of PS and Fex but usually do not significantly alter the shapes of the curves,determine maximum speeds and, along with pilot comments on handling qualities, minimumuseable flying speeds.
Stabilized thrust-limited turning peformance can be presented as illustrated byfigure 11. Normal acceleration (nZ) can be converted into thrust-limited turning rate (M)in degrees per second using equation (20).
.= -,3g(n 2 (20)VT
If the windup turns are accomplished the resulting data can be presented as illustra-ted by figure 12. Notice that lift-limited turning performance and buffet boundaries arealways presented in terms of CL or angle of attack since these parameters are independentof test atmospheric conditions or airplane gross weights. Once these data have been plot-ted and faired, the fairings of maximum useable CL can be changed into values of normalacceleration or load factor and maximum turn rate using equations (12) and (20). Thethrust-limited turning performance can be combined with the lift-limited or maximum turn-ing performance and buffet boundaries as illustrated in figure 13.
E. ENGINE HANDLING CHARACTERISTICS
No performance demonstration would be complete without an attempt to validate theengine handling characteristics of the test airplane. A certain amount of engine han-dling information will be acquired when flying the test mareuvers discussed previouslyin this paper, however, it will be limited since most of the maneuvers are designed tofacilitate stable engine operation. Therefore, special tests must be conducted to deter-mine the dynamic response characteristics of the test engine(s). Engine handling testsare quite easily accomplished but they do require flight time and detailed planning, es-pecially with single-engine airplanes, because unrecoverable engine stalls can possiblyresult. These are essentially "yes or no" tests and do not require any sophisticatedanalysis of the resulting data. Since modern turbojet engines and their controls areextremely complex, the results of engine handling tests are not always repeatable. Be-cause of this, a large sample size, i.e., a large number of test points, must be obtainedif any valid conclusions are to be made. Experience has proven that these tests cannotbe successfully integrated into the airplane performance tests because of safety consider-ations and separate flight time should be allocated for this task. All tests should beconducted in a buildup fashion: test points in the middle of the engine's operatingenvelope must be accomplished first, progressing to the outer portions of the envelope.
As in all the tests discussed in this paper, certain key parameters must be recordedat or just before the engine handling characteristics tests.
1. Indicated airspeed (Vi)
2. Indicated pressure altitude (Hi)
3. Total temperature (TT)
4. Power lever angle or throttle position (PLA)
5. Engine speed (rpm)
6. Turbine inlet temperature or exhaust gas temperature (TIT or EGT)
7. Total fuel flow (Wf)
Three engine handling tests are recommended. These are air starts, Bodes or engineacceleration tests, and afterburner lights. Air starts are accomplished as recommended bythe Flight Manual throughout the flight envelope with special emphasis on the high alti-tude, low speed corner. During the starts, data should be recorded at as rapid rate aspossible. Pilot comments are particularly important because these are handling qualitiesevaluations and require qualitative as well as quantitative assessments. Tests at loweraltitudes must be planned so as to allow sufficient height for acceleration to higherspeeds should the initial air start attempt prove unsuccessful. For single-engine airplanes,the initial air start tests should be conducted within gliding distance of the runwayshould a "flameout" landing become necessary. At the AFFTC, simulated flameout landingswith the engine operating at idle power are usually practiced before engine start testsare conducted on single-engine airplanes.
Bodes are rapid power lever or throttle movements (less than one second) betweenvarious oower levels to examine the in-fliqht engine acceleration and deceleration char-acteristics. These are accomplished throughout the flight envelope. Data should againbe sampled at the maximum rate possible. Pilot comments are especially important sincesome engine phenomena, such as compressor stalls (not enough airflow) or surges (toomuch airflow) are apparent to the pilot but often occur too rapidly to be indicated bythe instruments. Any rapid power lever movement can be used to determine engine response.one sequence used is:

5-19
1. Idle-to-Military rated (maximum nonafterburning) power
2. Military-to-maximum afterburning power
3. Maximum-to-Military
4. Military-to-idle
5. Idle-to-maximum
6. Maximum-to-idle
The engine should be allowed to stabilize after each rapid power lever movement.These tests should also be performed in the power approach or landing configuration attypical landing pattern and final approach airspeeds, but of course, at higher thanpattern altitudes.
If the test airplane is equipped with an augmented or afterburner (A/B) engine, thein-flight operation of this augmentation should be examined. These can be accomplishedwith the engine response tests (Bodes) just mentioned or independently. Again the fullA/B-lite envelope should be explored with emphasis on the low speed, high altitude andlow speed, low altitude portions. It is always a good idea to accomplish some of thesetests during ground runs before flight tests are attempted. This is also true for theBodes described above. By accomplishing these engine handling tests in conjunction withthe static installed thrust tests previously discussed, the basic engine handling charac-teristics can be validated or determined prior to flight. As in the previous engine han-dling tests, pilot comments are essential in assessing the "feel" of the A/B-lite chara-cteristics.
Data presentation is straightforward. Instrument corrected time histories of keyengine parameters are plotted as illustrated in figure 14A. By plotting PLA, rpm, fuelflow, and TIT or EGT versus time, the air start and response characteristics can be as-sessed. The envelope for successful air starts, stall-free Bodes, or successful A/B lightscan be determined by preparing a "bookkeeping" plot as presented in figure 14B. At eachpoint tested, a data point indicating satisfactory or unsatisfactory engine response isnoted as a function of pressure altitude and Mach number. This presentation can be usedto either spot check the Flight Manual engine operating envelopes or if accomplished ina thorough fashion throughout the envelope, define the acceptable engine operating re-gions.
F. CONCLUSIONS
When ass9ssing a new airplane for purchase or determining production airplane capa-bilities vis-a-vis a tested prototype it is important that some performance tests be con-ducted. Performance data need not be corrected to standard-day conditions if the intentis to use these data to demonstrate that the Flight Manual reflects the performance capa-bilities of the airplane because current manuals present performance levels for off-standard day conditions. Excellent performance data can also be obtained by flying testmaneuvers with the test airplane in formation with a similar airplane to determine theextent of the differences between the two.
All performance testing is quantitative, and data must be acquired durir each testmaneuver. When onboard production cockpit instruments are used as test instrumentation,they must be first calibrated so that instrument errors are known. If possible, highlysensitive, calibrated flight test instruments should be used in place of the productionunits. Even assuming that the Flight Manual fuel quantity, gross weight and cg relation-ships are correct, the airplane.should be weighed and its cg determined before and aftereach performance flight. Installed static thrust tests are required to assess whether ornot the test airplane is representative of the fleet, at least from a thrust standpoint.
If there is any reason to believe that the static source position errors as indicatedby the Flight Manual may not be representative of the test airplane, airspeed calibrationsare required. The ground reference flyby technique produces the most precise results,however, pacer missions may be required depending upon the speed envelope of the test air-plane. Test day data acquired during takeoff and cruise performance tests can be success-fully used to assess the validity of the Flight Manual.
Dynamic performance maneuvers such as level accelerations, and thrust-and lift-limited turns are quite easily performed but analysis of the results may be difficult be-cause of the limited instrumentation and data recording systems available on productionairplanes. Again, test data are clearly adequate for validating off-standard day per-formance indicated by the Flight Manual and for assessing basic airplane operating char-acteristics such as best climb and maneuvering speeds. Acceptable engine handling char-acteristics are essential for a combat airplane and an assessment of these characteristicsshould be made during any performance test program.r

5-20
Several traditional performance test maneuvers were omitted from the discussions inthis paper because they either require extensive, high-sample-rate, instrumentation, so-phisticated atmospheric condition measuring equipment, or extensive data analysis. Cor-rection of test-day data to standard-day conditions is not recommended since, once vali-dated by test-day performance levels, the Flight Manual can be used to obtain standard-day performance. If the Flight Manual is validated, it can also be used with the man-uals of other airplanes to assess the performance of the test airplane against its con-temporaries. If the test data indicates that the Flight Manual is incorrect and does notrepresent the test airplane, the manufacturer should be instructed to either change theFlight Manual or change the airplane, depending upon the requirements of the customer.
REFERENCES
1. lerrington, Russel M., et al, Flight Test Engineering Handbook, Air Force TechnicalReport Number 6273, Air Force Flight Test Center, Edwards AFB,--alifornia, revisedJanuary 1966.
2. Anon., Aircraft Portable Electronic Weighing Systems, Bulletin 74-03, Ormond Inc.,Santa Fe Springs, California, 1974.
3. Dunlap, Everett W., Porter, Milton B., Theory of the Measurement and Standardizationof In-flight Performance of Aircraft, FTC-TD-71-1, Air Force Flight Test Center,California, April 1971.

5-21
FAIRING OFTEST DATA POINTS
HC (ft)
TIME (hr min sec)Figure 1 Typical Time Histories
+ 0 INCREASING AIRSPEEDE) DECREASING AIRSPEED
CORRECTIONTO BE ADDED
200INDICATED AIRSPEED (kt)
Figure 2 Typical Instrument Calibation

5-22
PREFLIGHT WEIGHINGSo NO EXTERNAL STORES
FUEL ,l 0 EXTERNAL STORES
MANUFACTURERS CURVEFUEL FLIGHT TEST CURVE
QUANTITY / Iib) LINEAR CORRECTION
/ ' POST FLIGHT CENTER OF GRAVITY
EMPTYFUEL CENTER OF GRAVITY [Cg) LOCATION tpct MAC)
Figure 3 Airplane Center of Gravity Locations
50 ft
TIE DOWNS ON t
MAIN LANDING
__ IITIE DOWN
STANCHION
READOUT RECORDING
Figore 4 Simple Thrust Stand

5-23
A. THRUST vs ENGINE SPEED B. THRUST vs FUEL FLOW
AL/
MAX A/B MANUFACTURERS
F/a(b MIN A18 Fg/ lb CURVE
ENGINE SPEED [RPM) Wf (Ib/hr)
Figure 5 Static Installed Thrust Data
Note: H AIRPLANES INSTRUMENTCALIBRATED PRESSURE ALTITUDE
Hc REFERENCE PRESSURE3R ALTITUDE&h
=h HEIGHT
REFERENCEPOIT +
Hc + Hc+ ...C 2 +c HCR
Figure 6 Ground Reference Fly by Variables

5-24
L ~o FLY BY DATAoPACER DATA
PA-2,300 ft CR-20,000 ft CR-2.300 ft
AP/q Cic
PA =POWER APPROACH CONFIGURATION
CR = CRUISE CONFIGURATION
C Lic
Figure 7 Static Source Position Error
A. RANGE FACTOR vs MACH NUMBER B. OPTIMUM CRUISE PERFORMANACE
SYMBOL1 Wt / 6ao 50,000 100,000a 160.000O. FLIGHT MANUALv 170,000 RECOMMENDED OPTIMUM
ld -M
RANGE FACTOR M t
tnm)
RANGE FACTOR
Mc Wt /6a
Figure 8 Cruise Perfomisece

5-25
PRESSURE ALTITUDE = 35,000 ftGROSS WEIGHT
0 = 29,000 lb0 = 27,000 lb1A = 26,000 lb
AMBIENT 0 = 24,000 lb
TEMPERATURE[deg C)
MC
Figure 9 Maximum Speed Determination
PRESSURE AMBIENT1ALTITUDE TEMP
SYMBOL Ifti (deg C) NLF [g)
+ 0 5,000 10 1a 20,000 -5 1
SPECIFIC EXCESSPOWER (ft/sec) 0l
DnLE DLRATION M
Figure 10 Specific Excess Power

5-26
PRESSURE AMBIENTSYMBOL IALTITUDE Ift] TEMP (dog C)0 5,000 1013 200N -5 I
A30.000 -15
5,0 L
2,000 ft
NORMAL LOAD TURN RATE3000fFACTOR 1g)1 (dig/sic)3000f
M c M c
Figure 11 Thrust-Limited Turning Performance
A. MAXIMUM LIFT COEFFICIENT B. MAXIMUM NORMAL LOAD C. MAXIMUM TURN RATEvs MACH NUMBER FACTOR vs MACH NUMBER vs MACH NUMBER
PRESSURESYMBOL ALTITUDE [ff1
0o 110 GW =CONSTANT 'Z;* GW =CONSTANT
5,000 ft 5,000 ft
20,000 ft2000f30,000 ft
. z 30,000 ft
M c Mc -c
Figuri 12 Lift-Limited Turning Pirformance

5-27j
- - \LIFT-LIMITED
. - BUFFET ONSET
NORMAL LOAD // --
FACTOR (g) - THRUST-LIMITED711 AT Ta =10 deg C
ALTITUDE =5,000 ft PRESSUREALTITUDE
M C
Figure 13 Turning Performanaco at 5,000 Feet
A. ENGINE PARAMETER B. AIRSTART ENVELOPETIME HISTORY -MANUFACTURERS
RECOMMENDEDAL ENVELOPE
A L AL SUCCESSFUL START*UNSUCCESSFUL START
-J -~Wf - 00 RP
0
PC U_
TIME (hr min sec) Mc
Figure 14 Engine Handling Characteristics

6-1
EVALUATION OF LONGITUDINAL CHARACTERISTICSINCLUDING STABILITY HANDLING AND CG RANGE
R.J. PooleFlight Test Engineer
British Aerospace Aircraft GroupKingston-Brough Division
Dunsfold, England.
SUNMA.RY
Tests used by contractors to assess the longitudinal stability and control characteristics of anaircraft are enumerated here to give an indication of the measured flight test data that can be madeavailable to an evaluating body.
Simple flight tests to obtain qualitative and quantitative data on static, manoeuvre and dynamicstability, low speed handling, turning performance and high Mach No effects during an evaluation are alsodescribed herein
1. INTRODUCTION
Any evaluation of the longitudinal characteristics of an aircraft will depend on the class of aircraft(i.e. transport, fighter or bomber etc) and the type of control system fitted to it (i.e. power, manual orpower with manual reversion)
For the purposes of the ensuing discussions the aircraft being evaluated will be assumed to be ahighly manoeuvrable aircraft classified as belonging In class IV of References 1 and 2. Class IVincludes fighter/interception, attack, tactical reconnaissance and advanced training aircraft.
The following discussion will also be limited to aircraft with powered control systems with artificialfeel and hence stick forces generated by springs, bob weights and Q-feel pots. It is considered thatmanual control systems except for perhaps the rudder are no longer appropriate for this class of aircraft.
The handling qualities required of an aircraft are dependent on the role the aircraft is required toperform and this must be borne in mind when interpreting flight test data. For example a ground attackaircraft should possess sufficient stability to enable accurate target tracking in turbulence to beperformed, where as an interceptor requires agility at the expense of some static stability.
A number of the flight tests that are described here are performed by contractors for the followingreasons
a) To show that an aircraft meets specified stability and control requirements
b) To pro-ride data to aid the design of future aircraft
c) To provide correlation data with wind tunnel results
d) To provide aerodynamic data for mathematical modelling of the aircraft's characteristics onsimulators.
In addition the results of some of the tests are used to approve increasing increments of performancewhen approaching handling limitations in a progressive manner.
References 1 and 2 present levels of stability and handling characteristics required by Class IVaircraft in the various stages of flight and mset aircraft designed in the U.S. and U.K. will meet mostof these requirements. Occasionally these requirements will not be met but this is usually due to adesign inovation which renders a regurement obsolete or not applicable, (e.g. stalling speeds of avectored thrust VSTOL aircraft in semi-jetborne flight).2. LONGITUDINAL STATIC STABILITY
Aircraft manufacturers measure the longitudinal stability of their products for the followingreasons
a) To demonstrate that the aircraft satisfies any stability requirements specified in the
requirements to which it has been designed
b) To determine the position of the stick fixed neutral point in order to establish a satisfactoryaft CG limit for stable flight
c) To determine any degradation in static stability due to external stores.A potential customer evaluating an aeroplane may use the results of static stability tests when
comparing the stability of two designs.The general theory of static stability is well documented in references 3, 4 & 5 and stability
esaustions derived therein will be used in the following discussion of static stability.If an aircraft returns to a trimmed condition after a disturbance in speed at constant incidence or
incidence at constant speed it is said to possess longitudinal static stability. The static stability ofthe aircraft is related to the centre of gravity position to which the aircraft is loaded and if the e.g.is moved sufficiently far aft the stability reduces to zero. The c.g. position at which the stability iszero is called the neutral point and the stick position to trim is constant at all speeds.
If an aircraft has irreversible powered controls it's stability is independent of whether the pilotis holding the controls fixed or not and it is only necessary to consider the "stick fixed staticstability". (When considering the stability of aircraft with non-powered controls the effect of adisturbance with the controls free must be considered since the aerodynamic balance of the controlsurfaces causes them to "float" at different positions depending on incidence and speed.)
If an aircraft is stable with respect to speed and incidence it is necessary to move the stick aftto trim at decreased speed and increased incidence, and forward at increased speed and decreasedincidence. Aircraft with static instability can be flown by the human pilot but this condition induceshigh workloads which are not acceptable for tasks such as instrument flying for long periods. Slightstatic instability is sometimes accepted for example during the transonic period of an acceleration tosupersonic speed.
Sea* recent combat aircraft such an the 116 are statioal ustable ad rely a the ns of e p
_W3AO._d

6-2
is further complicated by the use of stick force rather than displacement to signal the pilots intentionsto the stability system.
An aircraft's longitudinal static stability is measured under one of the following conditions
a) In steady flight at constant altitude over a range of constant speeds with increased engine
power setting at each speed increment
b) At constant engine power adjusting the rate of climb or descent to hold a range of steady speeds
c) Performing a steady acceleration at full power to maximum speed and a steady deceleration atidle power.
Engine power settings have a relatively small effect on the tailplane angle to trim unless thetailplane is immersed in the engine jet efflux like the Harrier. If the power setting effect isthought to be significant method b) with the aircraft in a glide at idle power should give the bestestimate of the tailplane trim to balance the pure aerodynamic pitching moments on the aircraft.
Since most aircraft of Class IV are flown at power settings above idle most of the time method c)which in effect produces data at two power settings is more productive in terms of flying time.
The contractor will gather stability data with an aircraft carrying flight test =Astrumentationdata recording equipment but useful results can be obtained from cockpit gauge readings when evaluatingan uninstrumented machLne.
At each flight condition of a) and b) or at set increments of IAS during acceleration/decelerationof method c) the pilot should record IAS, ruel State, tailplane angle altitude and engine rpm.
After reading instrumentation records or applying cockpit gauge calibrations to the cockpitinstrument readings a curve of tailplane angle to trim with IAS/IWN at which it was measured may bedrawn. See Figure 1.
:xamination of the shape of the tailplane angle to trim - IAS(ImN) curve shown as Figure 1 willindicate whether the controls are moved in the conventional sense to trim with speed. Curve 1 is thercsult expected for a stable aircraft, curve 2 shows that at speedV2 the aircraft is neutrally stablevith respect to speed. aurve 3 is typical of the aircraft of curve 1 at a more aft C.G.
A quantitative assessment of the aircraft's static stability is obtained from the flight test resultsas follows.
The aircraft weight is computed from the fuel state and zero fuel weight and the C.G. position isdetermined from the aircraft load sheet on weight ^.#e.g. diagram.
Prom the measured flight data the normal lift coefficient Gn is computed from the relation.
cy . Z W W Z'o v- Pep -Tand is plotted with the corresponding tailplne angle to trim 9.- (See Figure 2
From the simple theory of static stability neglecting the effects of compressibility and airframedistortion these curves will be straight lines intersecting at thel, axis but in the general case theymay be similar to Figure 2.
In the simple case the slope of the straight lines and in the general case the local slope of thecurves at any chosen CN is indicative of the stability of the aircraft. It can be seen that an aft e.g.is less stable than a forward e.g. (The slope of the Lr - Cn curve is +re for an unstable aircraft andzero for neutral stability when the e.g. is at the neutral point).
From the standard theory the aircraft is stable when the change of the overall aircraft pitchingmoment with the normal force coefficient, i.e. cLC,/ n is -ve . The slope of the T- curve isrelated to &C-L/C, as shown below.
AcI/aLcf z PA,eLy&Cn. where VW 1 EIA = tailplane lift curve slope (a function of Mach No)
S- tailplane area= moment arm between C.G. and tailplane aerodynamic centre= standard mean chord of the wing
S = area of the wing
Veasurements of longitudinal static stability are normally made with the aircraft ballasted at twoor more e.g. positions as far apart as considered safe. The e.g. positions tested should include thefurthest practical aft and forward loadings.
At each e.g. the tailplane angles to trim and the corresponding normal force coefficients are plottedand the aircraft's neutral point or effective aerodynamic centre is determined by extrapolution at arange of values of c . (Note:- the neutral point is the e.g. position at which the stick movement tochange speed is zero).
The e.g. margin or the difference between the measured neutral point and the test c.g.s can bedetermined and can be compared with any minimum requirements in the aircraft specification.
The aircraft's static margin is the measure of it's overall static stability and hence the controlmovement to change speed. In general the static margin is a function .of speed and is proportional tothe e.g. margin such that Kq = vwhere V is a constant of proportionality and a function ofspeed.
The results of the teats may be presented aS a function of CR as shown in Figure 3.An example of the process of computing static margins is shown in appendix loWhen evaluating an aircraft's longitudinal static stability it should be flown on the most aft e.g.
of the production tolerance and fitted with the stores configuration that gives the most rearwardincrement in e.g. in conjunction with the most forward increment in aerodynamic centre position.
Some ground attack and air to air combat aircraft have very little static stability at moderate andhigh speeds and consequently exhibit very small trim changes while accelerating or decelerating duringweapon delivery or combat. Adequate static stability is desirable for low speed tasks, instrumentflying and very low level high speed flight.3. LONGITUIINAL DYNAMIC STABILITY
WThen an aircraft is trimmed level flight is disturbed in pitch with the controls fixed it normallyreturns to steady flight in an oscillatory maner.
Standard theory In Peferences 4 and5 shows that a statically stable aircraft may exhibit twosifltaneoua damped oscillatory motions while returning to steady flight after a disturbance. These aret-
a) A high frequency heavily damped oscillatory motion (The short period pitching oscillation(s.P.P.o.)) _. . . . . . . . ... .. •.. .

6-3
b) A low frequency lightly damped oscillatory motion (The Phugoid).References 1 end 2 lay down requirements for the damping of these modes and contractors measure the
damping and period to demonstrate compliance.An aircraft's damping in pitch is measured with the following test technique.The aircraft is trimmed in straight and level flight at the required speed and altitude condition
which shou.Ld be noted by the pilot. The stick should then be deflected smartly forward and returned tothe trim condition with the objective of achieving as near a triangular pulse stick input within0.5 sees as possible. Immediately the stick is returned to the trimmed position it should be releasedand allowed to remain free until the resultant motion damps out. The above procedure should be repeatedby deflecting the stick aft. The stick deflection in each case should be sufficient to give anincrement of approximately ±. Iq and the ailerons and rudder should be kept at the trimmed conditionthroughout the manoeuvre. An icample of a high altitude relatively lightly clamped SPPO is shown in Pig 4.
The S.P.P.O. is normally damped out very quickly and is assumed in simple theory to be an oscillationin pitch at constant speed. If the test is continued beyond the point when the S.P.P.O. has ceased thecharacteristics of the Phugoid can be assessed. From simple theory the Phugoid oscillation is manifestby an exchange of potential and kinetic energy at constant incidence.
The S.P.P.O. is normally very well damped and is best recorded with a continuous trace recorderrecording pitch rate and altitude and longitudinal control surface deflection. The Phugoid however canbe assessed from cockpit gauge readings.
The S.P.P.O. test results are normally presented as plots of the periodic time and the number ofcycles or the time to halve the amplitude of the oscillation against Mach No or IAS at each testaltitude. See Pigure 5 . Satisfactory damping can be qualitatively assessed by performing this testat high and low speed where the damping is most likely to be deficient if at all. Lack of adequate pitchdamping in the transonic flight region is normally overcome by fitting an automatic pitch damper thatsenses the pitching acceleration and applies a suitable damping tailplane input independant of thepilot's stick.
The characteristics of the S.P.P.O. are dependent on the aircraft's pitching inertia, aerodynamicdamping in pitch, and the static stability and is therefore related to the c.g. position. Aft movementof the c.g. normally reduces the damping in pitch and therefore the dynamic stability.
The Phugoid can be quantitatively assessed using a stopwatch once the S.P.P.O. has ceased since theperiod may be as great as 80 sees or more. The pilot should note the maximum and minimum speed andaltitude and measure the time elapsed between instances when the initial trimmed zonditions are achieved.If the maximum and minimum values of speed and height are compared over successive cycles theconvergence or divergence of the oscillation can be determined. See Figure 6 for a typical Phugoid.
The greatest difficulty encountered during these assessments is tha., the results are dependent on thepilot's ability to return the stick to the initial condition following the disturbance. A small residuallongitudinal trim error may make a stable Phugoid appear unstable.4. LONGITUDINAL MANOEUVRE STABILITY
An aircraft's longitudinal manoeuvre stability is measured in order to determine the controldeflections and hence the control forces that must be exerted by the pilot to manoeuvre the aircraft.
Contractors measure manoeuvre stability to demonstrate compliance with the requirements ofRef. 1 and 2 and to provide data to establish the practical e.g. range.
In order to manoeuvre a stable conventional aircraft the pilot is required to move the stick aft toincrease the wing incidence and hence the normal acceleration.
The tailplane deflection required to produce an incremental change of normal acceleration is relatedto the aircraft's manoeuvre stability and may be expressed in terms of tailplane/9.
Typical Class IV aircraft with powered controls use springs, bob weights and pilot-static pressuredifference systems to provide "feel" or stick force which increases with the normal accelerationdemanded.
References 1 and 2 suggest maximum stick forces which the pilot can be expected to exert duringvarious requirements of flight and U.K. and U.S. aircraft Ir.Il normally satisfy their requirements.The longitudinal stick force should not exceed 501b.
The aircraft is normally designed so that the stick force and stick force gradient required toachieve the maximum allowable normal acceleration with the aircraft trimmed for Ig flight is greatenough to avoid the maximum normal acceleration being inadvertently exceeded.
A minimum stick force gradient is also set by References 1 and 2 to ensure that the aircraft is notso sensitive that the pilot will be over controlling in pitch when making mall changes in incidence andflight path during target tracking and other precision tasks.
If the aircraft e.g. Is moved far enough aft no change in the tailplane angle to trim or stick forceis required to produce a change in normal acceleration. This position is termed the "stick fixedmanoeuvre point" or h. The difference between any e.g. position at which the aircraft is flying andthe manoeuvre point is a measure of the aircraft' s manoeuvre stability and is termed the manoeuvremargin H. = hm - h.
The general theory of manoeuvre stability and the derivation of the equations describing themanoeuvre margin are presented in references 3, 4 and 5 and the results only are quoted here.
In manoeuvring flight the incidence of the wing is increased relative to a Ig flight condition at theame speed. The trimming effect of the tailplane is related to it's local incidence which is depen4anton the Increased down wash from the wing and a nose up pitching velocity resulting from the curved .lightpath of the manoeuvring aircraft.
As in the case of static stability the aircraft's overall pitchin moment change with norml liftcoefficient aCs%1dC1 must be -we for Manoeuvre stability.
The manoeuvre stability is quantified at o.g. h by Hm= 11M - h where hat= thenondimensional position of the manoeuvre point.
Fron comparison of the pitching moment equations for an aircraft in manoeuvring and lg flight It canbe shown that the static and manoeuvre stabilitys are related by hm = hn +
J- %+ 2
whre, As, k = ild Relative Airgraft Density Parmter

6-4
W/= aircraft weightgravitation at constantair densitywing area
'= Distance between C.G. and aerodynamic centreIt should be noted that the stick fixed neutral point is normally ahead of the manoeuvre point and
the manoeuvre margin is normally greater than the static margin.The manoeuvre stability can be quantified from the following flight testsa) Steady pullouts from dives at constant speed
b) Spiral turns with increasing normal acceleration at constant speedThe latter method is more productive since each manoeuvre produces a number of data points per test.
The spiral manoeuvre is most productive when performed with aircraft fitted with continuouslyrecording flight test instrumentation but reasonable results can be obtained from cockpit gauges fornormal accelerations up to 5g.
Per the spiral manoeuvre the aircraft is trimned to fly straight and level at the test altitudeand target air speed and the the pilot should note altitude, air speed/Mach No, fuel state, tailplane,R I and incidence. The aircraft is then placed in a turn with gradually increasing normal acceleration.If performing the test with cockpit gauges only the pilot should increase the normal acceleration insteps reading the gauges for incidence, tailplane angle and normal acceleration at each increment. Asthe normal acceleration is increased the lift dependent drag also increases and it is necessary to allowthe aircraft to lose height in order to keep air speed constant. The addition of some power on entryto the turn allows the rate of descent to be reduced.
At high values of normal acceleration the aircraft may have descended significantly below the targettest altitude and the manoeuvre should be repeated from a higher entry altitude so that the limitingnormal acceleration is achieved at the target altitude.
It may not be possible to fly the aircraft steadily enough at the limiting normal acceleration torecord a steady tailplane angle to trim from the cockpit gauges. The pilot should however be able tosense stick force lightening or pitch up and the resulting reduction of tallplane angle to trim althoughhe may not be able to quantify the effect.
The spiral manoeuvres should be executed at a range of Mach No /IAS and altitudes and at two e.g.positions if it is intended to determine the stick fixed manoeuvre point.
From the aircraft fuel state the test weight and e.g. position are determined and the normal forcecoefficient is computed, i.e. C, r A.)VIk//V. - 2• aW/ V 2,P.. The test results are then plottedas curves of tailplane to pull g, 1. e%- normal force coefficient Cn . See Figure 7 . At discreetvalues of C" the local slope of the ilruCs curve is computed and the resultng tailplane angle/Cn isplotted against the e.g. position and is extrapolated to the point where d /100 is zero to determinethe manoeuvre point for the aircraft at the particular value of Cn. See Figure 8.
The position of the manoeuvre point at each speed and altitude can be determined as a function of CN.The manoeuvre margin HM at e.g. = h is computed as HM = h - h.The furthest aft e.g. to which the aircraft should be loaded and flown should be limited to a set
distance in front of the most forward position of the manoeuvre paint measured during flight trials andthis Inim- manoeuvre margin is normally not less than 0.05 E . The manoeuvre point is normally aftof the neutral p lint.
Prom the piloving point of view the stick force to manoeuvre the aircraft is of more significanceand is more readily understood than the manoeuvre margin stick fixed. The latter is of value whencomparing the stability of two aircraft quantitatively.
The stick force/g can be computed from the stick force and tailplane deflection with stick positioncalibrations at each increment of tailplane applied during the flight tests. The stick force movementfrom the trimmed lg flight condition is plotted against normal acceleration at each test altitude e.g.and each speed/Mach No as shown on Figure 9.
The stick force/g for the example can be seen to reduce at high g but the aircraft has positivemanoeuvre stability since it is always necessary to move the stick aft to increase g.
If an aircraft is to comply with Ref. 2 requirements for manoeuvre stability the slope of thecurves of stick force/g must be measured at low g and the corresponding normal acceleration/unit ofapplied incidence (Vor.) computed. The results are then plotted against the Ref. 2 requirementsshown typically on Pigurelo.
The Ref. 2 requirements are dependent on the design maximum normal acceleration and are shown onFigure 10 for an aircraft with a designed maximum of +8g.
As described in Ref. 2 the aircraft's characteristics are required ideally to lie within level 1but they may lie within level 3 where the pilot workload may be excessive or the mission effectivenessinadequate or both. ithin level 3 manoeuvres such as air to air combat can be terminated successfullyand take off, landing, cruise and climb etc. can be completed.4. LOW SPEED HANDLING AND STALLING
Knowledge of an aircraft'sa stalling speed, sotalmrning and it's handling characteristics at low speedare of great importance to the manufacturer and operator alike.
The -i-i- take off, approach and landing speeds are normally related to the measured stalling speedin the appropriate air frame configuration for these phases of flight with due regard to the stall-1zmng available.
The maufacturer aims to ackieve the lowest stalling speeds possible because they govern the groundrun distances for take off and landing and therefore the maximum payload that can be carried from agiven run.
The contraotor measures the stalling speeds in the cruise, take off, landing and approachconfigurations in order to furnish themselves, assessment authorities and customers with operating data.The results of the stalling tests are normally presented in the form of charts of stalling speed againstaircraft weight for each of the air frame configurations as shown in Pigurell.
Stalling speeds and incidences achieved at the stall are dependent ona) Amomt of aft stick travel available
b) The C.g. position
a) Ai"rft flap and undercarriage positions
d) xternsl stores configurations

6-5
e) Rate of aft stick movement and hence rate of decelerationTraditionally warning of an impending stall is given by the buffet generated by air flow separation
from the wing magnified by the separated flow impinging on the tailplane. This morning is termed buffetwarning or stall mrning and is quantified as the buffet margin, i.e. Margin = V-V ,
£gsd"Typically the buffet margin should not be less than 5 knots.
Some aircraft designs do not produce sufficiently prominent buffet maing and an artificial stallwarning system is provided to alert the pilot. The artificial warning may be audio or tactile and islikely to be engineered to be a function of the rate of approach to the stall.
It is desirable that the air flow separation on the wing at the stall should develop from inboardto prevent wing drop and therefore reduce height loss on recovery. In addition pitch up at the stallwill not occur if wing tip stalling is avoided on swept wing aircraft.
If a wing tip stall and hence pitch up cannot be avoided the aircraft's control system may include astick pusher that will push the stick forward automatically if the pilot exceeds the stall warningincidence by more than a tolerable level. Such a device will prevent the aircraft achieving acondition in which a high tail aircraft cannot recover because the tailplane is stalled in the wake ofthe wing and fuselage.
The maximum incidence that the aircraft can achieve is sometimes limited by the aft stick travelalone but the aircraft's manoeuvrability may be impaired if this is done.
Unlike slow speed aircraft with straight wings those of category IV may not pitch down at the stallbut may develop a divergent dutch roll motion or pitching oscillation while in a high rate of descent.Such oscillations should cease immediately when the stick is returned to the trimmed position.
When U.K. contractors perform stalling trials they are required to equip the aircraft with an anti-spin parachute or recovery rockets as specified in Reference 1.
Should the aircraft depart at the stall and enter a developed flat spin these devices will aidrecovery by producing an anti-spin pitching moment and reducing incidence.
U.K. contractors are required to examine an aircraft's stalling behaviour from straight and turningflight and to demonstrate that the stall can be averted without significant height loss on receipt ofthe stall warning. This examination should be performed at the extreme forward and aft e.g. positionsat which the aircraft is intended to operate.
Additional stalling tests should be made with all store configurations to be carried in order todetermine the effect of stores on the stalling speeds.
The contractor is also0 required to assess and report the aircraft's handling characteristics instraight flight and in 30 banked turns at speeds close to the stall.
The following techniques are typical of those used for the examination of the aircraft's stallingcharacteristics and speeds in straight and turning flight
STRAIGHT PLIGHTThe aircraft should be flown at 1.4 X the expected stalling speed with the control forces trmmed
out and the minimmn engine thrust set to allow a sufficiently slow deceleration to be achieved. Theaircraft should then be decelerated at a rate of less than lKt/second in level flight by slow aftstick movement until stick hard back or some uncontrollable pitching rolling or yawing motion occurs.
Every effort should be made to stop excursions in roll and yaw occuring with rudder and ailern andthe pilot should make an assessment of the amount of control required to arrest any excursion beforestick hard back is reached.
The pilot should note fuel state, configuration and altitude at the initial trim speed, buffet onsetspeed and minimu speed achieved. The minimum speed will normally be achieved with the aircraft in adescent and the normal acceleration (less than +i.0) should be recorded to correct the stalling speed.
he Vsr,,~ -a .~-If the aircraft is fitted with incidence or airetream direction detector gauges, their readings at
buffet onset and minimum air speed should be recorded. Some pilots fly incidence rather than speedduring circuit flying and are therefore interested in the buffet margin in terms of incidence.
TURNING PLIGHTWith all the control forces trimmed out and the engine power for level flight at 1.3 X the expected
stall speed in the turn the aircraft should be put into a turn at a target angle of bank. Onceestablished at the target bank angle the speed should be reduced by aft stick movement until theairraft stalls. The test should be repeated at increasing angle of bank up to that coresponding0.4 x maximum design normal acceleration, e.g. if maximm design g is +8 then AOB = See 0.4 x 8.0 = 720
The pilot is required to record the same data as on the straight stalls and to coment on thefollowing
a) The stall warning
b) Whether the stick was pulled to the aft stop before the stall occurred
c) The behaviour of the aircraft at the stall and the severity and extent of any wing drop
d) The method of recovery and the height lost from the stall to recovery to level flightOn both straight and turning stalls the pilot is required to determine whether the stall can be
averted if recovery action is taken at the receipt of the stall warning.BEHAVIOUR HAR THE STALLOnce the aircraft' a stalling speed has been established it should be determined if it can be trimmed
to fly laterally level at constant speed at 1.2 and 1.VS with hands and feet off. If not, the amountof control required should be recorded.
LOW SPEED TURNSAfter meaguring the turning stalling speed the pilot should determine the minimum speed at which
sustained 30 AOB turns can be made and the conditions which impose the limit. The pilot should assessthe amount of control required to sustain the turn and whether any lose of control effectiveness isexhibited.
A U.K. contractor supplying aircraft to the U.K. Armed Services will have been required to performmost of the previously mentioned tests. The results recorded from the tests will be presented in asimilar manner to Figure 12.
In general any evaluation of the low speed handling characteristics of an aircraft should includestalls to check stall speed and buffet margins claimed by the contractors in the operational flap/undercarriage configurations both on forward and aft e.g. positions.

6-6
In addition the adequacy of the buffet margin and the aircraft's handlin after receipt of stallwarning and before the stall should be assessed in case the aircraft does not respond to recovery actionwith the necessary rapidity.
Finally the effect on the stalling speeds and buffet margins of under wing stores should be checkedduring the evaluation of the aircraft.
The standard stalling tests do not use much flying time and reliable data is easily gained from thecockpit gauges.5. TURNING PER ORNCE MEASUREMENT
A combat aircraft's instantaneous turning performance is of vital importance and is depindant on themaxima normal lift coefficient that it can achieve. The limiting normal acceleration or the incidenceat which it is achieved is dependent on height and Mach No and can be presented as a manoeuvre boundarycurve in terms of achievable incidence v Mach No or IAS at each altitude tested, e.g. Figure13
The minimum achieveable radius of turn in attained at the maximum useable lift coefficient for theaircraft since it's lateral/directional characteristics may not allow the maxkimu lift coefficient to begenerated with the pilot retaining control.
The manoeuvre boundary is found from the limiting conditions of the spiral manoeuvres flown todetermine the manoeuvre margin (See Section 4 ).
The aircraft should be placed in a spiral up to the maximum normal acceleration achievable turn andengine power increased as required to maintain speed as constant as possible and to minimize height lose.
The pilot should note fuel state at the start of the manoeuvre and the normal accelerationincidence,IAS or DO, and altitude on receipt of any buffet warning and at maximum normal acceleration.
The test results are then presented as Figure 13 and are readily interpreted.The aircraft's manoeuvre boundary may be defined by the following conditionsa) Pull aft stick movement
b) Achievement of the aircraft's structural maximum allowable normal acceleration
c) The onset of lateral/directional oscillatory motions which the pilot cannot control and whichmay diverge rapidly enough to cause failure of the fuselage or fin
d) Very heavy buffet leading to reduced fatigue life
e) Build-up of excessive lateral or directional out of trim.The pilot should qualitatively assess which of the above factors limited the maximum achieved normal
acceleration and incidence and the amount of buffet warning received before departure from controlledflight.
If an aircraft's turning performance is limited by the build up of some form of oscillatory motionit may be fitted with a form of stability augmentation system. For example, an aircraft may developan uncontrollable wing rook at high incidence which could be tamed by a roll stabilizer and hence allowthe pilot to retain control until a greater incidence and therefore more lift, is achieved.
Some aircraft are fitted with control systems that limit the normal acceleration and incidenceachievable at any flight condition automatically. Incidence and normal acceleration are accuratelysensed and a computer restricts the control deflections to prevent the aircraft from reaching conditionswhere a departure from controlled flight can occur.
The results of the manoeuvre boundary tests can be refined to produce more interesting results thanjust an incidence Mach No curve at a given altitude as follows.
A typical plot of the maximum normal acceleration achieved at one weight/c.g. position and altitudewith Mach No is shown as Figure 14 . It should be noted that the maximum normal acceleration that canbe achieved at a given flight condition (IMN and Altitude) is dependent on the aircraft weight and amore general result is of greater value.
The maximum normal acceleration that can be achieved at any condition is a function of the maximumlift coefficient of the wing which is also a function o Mach No as is illustrated in Figures 15 & 16
The maximum normal acceleration can be expressed as L L/W where L = lift in the turn & W = WeightA 2 CTMAX = Max lift coefficient, M = True Mach No
In non-dimensional form n = l2 SCAX/2W where y'=Ratio of specific heats for dry airPo = Sea level standard pressure
Since Po and S are constants and C&.4q can be assumed to be a function Mach No only in generalfW ((t) . If AW/S is computed from the measured flight test results and is plotted against
Mach No the resulting unique curve will be independent of the test height and aircraft weight (NeglectingReynolds No effects) See Figure 16 .
If the normal acceleration at which buffet was recorded is also treated in the same manner a buffetboundary independent of height and weight may also be presented. See Figure 16 .
Having measured the maximum available g at any one height the maximum available g can be predictedfor any other height. Assuming constant weight at a particular Mach No (and hence CL44 ) the m--mg at the 2nd altitude is given by e 6, . The results of the test example figure areextrapolated to other altitudes. See Figure lc. The above technique for extrapolating theinstantaneous turning performance is not strictly valid when Reynolds No effects are significant. Toovercome the effects of Reynolds No the tests should be conducted over a range of altitudes and theextrapolation confined to small increments of altitude.
The ability of a combat aircraft to perform it's allotted task is critically dependent on theturning performance it can achieve and also by it's handling qualities.
In an operational environment the pilot will be required to divide his attention between the insideand outside of the cockpit and if he is manoeuvring the aircraft it is desirable that he has acmenatural indication that he is close to limiting flight conditions. This is especially important whenthe limiting condition is a sudden departure from controlled flight rather than the aircraft's refusalto generate more lift because the stick is on the aft stop.
A.ny evaluation of a combat aircraft should include both qualitative and quantitative aeesment ofthe manoeuvre boundary. The former is necessary because the manufacturer may be optimistic indescribing the limiting handling qualities and the latter is desirable since the results can be usedto test the validity of the contractors data.
The carriage of external stores will affect the mazoeuvre boundary in the following ways:- ,-

rr.w r r
6-7
a) By chaniyg th3 value of CLw4 y for the aircraft
b) By altering the aircraft's handling qualities which may be severely degraded in some instancesi.e. producing early onset of uncontrollable wing rock
c) By changing the centre of gravity position on the aircraftIn general if the c.g. is moved forward the tailplane carries a greater down load at high incidenceand therefore the normal acceleration achievable at a given weight is reduced.6. EFPECTS OF MACH NO ON THE LONGITUDINAL STABILITY AND CONTROL
Aircraft desiuied to fly at high subsonic, transonic and supersonic speeds experience trim changesand control effectiveness variations due to the rearrangement of the air pressure distribution on theair frame resulting from the formation of shock waves.
Contractors are required to show that the aircraft remains controllable through the transonic speedTamgb and in supersonic flight. Some relaxation of the static stability with respect to speed in thetransonic region is however tolerated.
An aircraft's behaviour in acceleration during high speed dives and the trim charges associated withrecovery must be demonstrated to be innocuous for operational aircraft flown by average pilots.
Reference 1 and 2 lay down desirable control force limits for recovery from high speed dives.As the flight Mach No is increased towards Mach 1.0 shock waves begin to form on the aircraft where
the local air pressure is lowest and the local Mach No has first become unity.The shock waves build in strength as the aircraft speed reaches Mach 1 and they cause the pressure
distribution on the wing to change such that the centre of pressure moves aft. The overall aerodynamiccentre migrates from approximately j SRO at low speed to j SVC when the aircraft is supersonic.
The aft aerodynamic centre movement causes a nose down trim change relative to subsonic conditionswhen the aircraft is truly supersonic.
In the transonic region the aircraft may experience trim changes in any direction about all threeaxes which may require unorthodox control movements to trim. Any disturbance in pitch especially,but also in roll and ya% may cause the air flow which has separated because of the shock waves toreattach and a further separation to occur elsewhere on the air frame. In re-trimming the aircraftat transonic speed the pilot may cause a similar variation in shock wave distribution.
At low speeds the change in pitching moments and lift forces with speed are neglected and staticstability is limited to the incidence effect at constant speed, i.e. the static margin and e.g.margins are numerically equal.
At high speed the effect of speed on the moments becomes significant and the pitching moment withforward speed derivative Mu, which is normally destabilizing, may become sufficiently large to cause thedirection of stick movement to trim to reverse as speed increased.
Under these conditions the static margin Kn is assumed to be made up of two componentsi) Contribution to the static margin due to incidence - 4cM/aCOLii) Contribution due to speed =(M/2c)CmhdM where dC./N is proportional to or MuIt can be seen that an aircraft that is statically unstable may be stable with respt to incidence
disturbances whilst being unstable with respect to disturbances in speed at one and the same time.While this phenomena is not very satisfactory an aircraft whose instability is small with respect tospeed in the transonic region may be regarded as satisfactory provided it is statically stable at lowspeeds.
On some aircraft the transonic trim changes are automatically reduced by a mach trimmer, a devicewhich applies a tailplane input independent of stick movement as a function of Mach No to check thetransonic trim change. Use of a bach trimmer enables the designer to keep the pilot's stick inputdirection in the conventional sense as the aircraft is accelerated through the tranesonic speed range.
Contractors flight trials include flight at speeds up to the design maximum and to the designmaximum normal acceleration and the envelope explored is presented typically as Figure 18.
The aircraft may not be controllable at the limits of this envelope however, and any evaluation ofan aircraft by a potential customer should include a flight along the boundary of the envelope payingattention to the aircraft's handling. On such an assessment the pilot should be on the look out forsigns of pitch up, pitching oscillations that are difficult to damp out, wing drop or yawingdisturbances.
Should any gross trim changes that are difficult to control be encountered it is important toconsider whether they will prevent the pilot satisfactorily completing the mission for which theaircraft is intended.
For example, a highly manoeuvrablo trainer may drop a wing at a particular Mach No above themaximum level Mach No during a transonic dive. Such an occurrence will not prevent a studentcompleting the acceleration to supersonic speed if he can pick up the wing using say j aileron andtherefore the wing drop can be considered insignificant.
on the other hand if the trim changes on the pullout from the dive result in a pitch up such thatthe pilot can only just avoid exceeding the maximum normal acceleration at the speed the pitch upoccurs the handling characteristics should be audged as unacceptable.7. TARGET TRACKING
Aircraft designed for air to air combat and ground attack should exhibit good target trackingcharacteristics since their operational effectiveness can be compromised if the pilot cannot tracktargets accurately.
An aircraft's target tracking performance is related to the following factorsa) Longitudibal static stability
b) Longitudinal manoeuvre stability
c) Longitudinal dynamic stability
d) Harmony of longitudinal and lateral controls
e) Sensitivity of the longitudinal control systemThe contractor will assess the aircraft's target tracking performance during the test progae
and my modify the control circuit geaning to increase or decrease the control sensitivity or theharmony of the longitudinal and lateral controls.

6-8
This assessment is largely qualitative and subjective since different pilots exhibit different levelsof skill in target tracking. Quantitative data for the assessment of target tracking accuracy can beobtained from gun and weapon aiming sight recording camera results.
Any potential procurer evaluating such an aircraft should examine the target tracking in theoperational role and carrying typical external store loads. This assessment ideally should occur inboth turbulent and non-turbulent weather conditions and the pilotb display recorder should be runthroughout each attack.
The acceptability of an aircraft's target tracking behaviour depends on the weapons the aircraft isrequired to deliver. For example, a degraded target tracking ability may be satisfactory whendelivering missiles with wide "look" or target acquisition angles but not when firing guns or unguidedmissiles.
Aircraft intended primarily for ground attack can usefully be more stable than for air to air combatsince they are often required to operate in turbulent conditions which will make target tracking harderfor the pilot. A ground attack manoeuvre is essentially a lg manoeuvre in the tracking phase so themanoeuvre stability is not so important as in air to air combat.
GROUND ATTACK TARGET TRACKINGThe pilot should carry out simulated ground attack manoeuvres over a range of speeds and dive angles
(related to the type of weapon to be used).If the gunsight has a fixed cross the pilot should track the target with the fixed cross# since
disturbances in the aircraft altitude related to aircraft stability will show in the displacement of thetarget from the cross.
Prom the gunsight camera records the displacement of the cross from the target in pitch and azimuthshould be measured and the following data deduced.
The control system performance is good and the controls well harmonised if the tracking errors inazimuth and elevation are small and of similar magnitude and the pilot reports equal workload inazimuth and elevation.
If there is a great difference between elevation and azimuth the harmonisation of longitudinal andlateral controls may be responsible and control surface/stick movement gearings may be modifted
If either elevation or azimuth tracking exhibits an oscillatory error of similar frequency to theaircraft's longitudinal S.P.P.O. or directional (Dutch Roll) oscillation then it is possible that theaerodynamics damping in pitch or yaw is not adequate. Deficiency in these areas may be reduced withthe incorporation of pitch or yaw dampers.
If the aircraft exhibits any oscillatory tracking problem this will be accentuated with destabilizingexternal stores and more attention should be paid to target tracking in these configurations.
If the aircraft's static stability with respect to incidence is too low then the pilot will haveto work harder in tracking the target in pitch. Low static stability with respect to speed howeveris an advantage when target tracking since the trim changes associated with speed changes are lesssignifi,,ant and annoying.
AIR TO AIR TARGET TRACKINGAir to air target tracking is assessed by tracking a target aircraft orbiting at steady increments
of normal acceleration up to the maximum sustained value.The gunsight camera film is analysed as for ground attack manoeuvres and similar observations can
be made.In air to sir target tracking the aircraft's anoeuvring stability and stick force/g assume greater
proportions than in ground attack. Any errors in tracking at high g may be related to the basicmanoeuvre stability of the aircraft. The stick force/g to correct tracking errors should not be toolarge for the pilot to smoothly adjust g end not so low that he is likely to overcontrol and induceoscillations.
The ability of the pilot to track a target at increasing normal acceleration should also be examinedup to the maxiimm normal acceleration that can be obtained.8. CONSIDERATIONS ARISING FROM RELAXED STABILITY
Some recent combat aircraft have been designed with -ve static stability and have advanced controlsystems to translate the pilot's control demands into unconventional control surface movements to trim.
The advantages occurring from relaxed stability are:-a) Reduced trim drag and therefore increased range or speed
b) Enhanced turning performance
c) Reduced landing and take off speeds due to generation of more lift.A statically stable aircraft as discussed in Section 2 normally carries a down load on the tailplane
during the cruise. Under these conditions the wing must develops enough lift to balance the weightand the tailplane down load. An aircraft with negative longitudinal static stability carries an up .load on the tailplane and so at a given weight the wing is required to produce less lift. It followsthat at a given weight the aircraft's induced drag and therefore overall drag is reduced.
Turning performance is enhanced fromreduced induced drag for a given weight.Landing and take off rune are reduced from reduced drag and increased lift.Unlike the stable aircraft discussed in Section 2 an aircraft with negative static stability will
exhibit the following charaoteristicsa) The tailplane angle to trim curve with speed will have a negative slope over most of the
speed range
b) A tailplane angle to trim with lift coefficient will have a +ve slope
c) The manoeuvre stability curve of tailpane angle/increment in normal acceleration is unchangedThe aircraft's control system is engineered so that if the pilot wishes to trim the aircraft at
higher speed he mast move the stick forward and apply a forward force just as if the aircraft werelongitudinally statically stable.
When evaluating a relaxed stability aircraft the pilot should assess whether the controls move inthe sense required of a stable aircraft and should deterzine how auch of the control surface deflectionrange is used during norual flight. In addition he should determine whether the control forces can betrimed out using the trimerin anl normal phases of flight.

6-9
9. OONCIJDING REMAKSA pilot evaluating the longitudinal stability and control characteristics of an aeroplane can easily
obtain quantitative data from cockpit gauges on the following topicsa) Stalling speeds and stall warning margins and trimi ng demands at low speed
b) Manoeuvring performance and maxim useable normal acceleration and incidence boundaries
c) Longitudinal static stability, manoeuvre stability and the acceptability of the C.G. range
d) Trimming demands in high speed flight
e) Effect of external stores on the aboveQualitati e data can be readily obtained fora) Dynamic stability
b) Manoeuvre stability
a) Controllability and stability in high speed flight
d) Target truckcLng performanceAn evaluation of an aircraft should wherever possible begin with a thorough assessment of the
operational requirements of the replacement candidate.
REPERCES
1 Design Requirements for Aircraft for the Royal Air Force and Royal -avy,Ministry of Defence (P.E.) Volume 1 Books I & II and Memos
2 Military Specification Plying Qualities of Piloted Airplanes,MIL-P-8785B (ASG) 16 September 1974
3 AGARD Plight Test Manual Vol II, "Stability and Control"
4 A. W. Babister, Aircraft Stability and Control, Oxford, Pengamon Press, 1961
5 B. Dickinson, Aircraft Stability and Control for Pilots and Engineers,London, Sir Isaac Pitman & Sons Ltd, 1968
'i S
rI
)
L'i

6-10
AA/"
ALP4AA-g 7RIMA CORVE'S
AL&AA/E'x j
7-A/bPL4E 'A. £ FoL r c~.~~~ RIe eLA:;Pvr-
AIW60V K,7
(% ~ 3 -rA7-I. a. C. 3. 1Af YIlS
Aww
S.)O 7WE RSrb)?Y

6-11I
)WAWD A'Ad,4r7 )C
AOMI~ Ad-.%
AA-# A1.0 4/
-S"oArlfl g 0 II~ 40A-fb -l
AI WVAI lAfvg OWALR AO
PA1u101D OSC/L/-AflOM
~4.-
D--rgVMA77aN OF M'-
!n*AMOEZ/L/Re Aqwr: ,
Now--,

6-12
* '2
/0v X0 370 4O 6_0
o~ 77k is7IB7 Rasulr3 A//r/ 5fz~fC7-M~ RiAC2.RA~/R'~VT j~ SYMA~~/AL19W ~Idr 'f7- La4O 8
£40P~L'E/
OWOvER 2C 216~OP AMO 36
Lsvm_ 3 3/6
/r 40 L0
r~~ 1 ,9e YReAI-S- I "
~AIWIA0W14-

6-!13
,~&AA/2
9- .~97ALL SAWa". LSZ0UP7r. D
AfA/C MOAC C/?sA/IA
MACh' *
ACCA'HA 6CEE~M
IrYPe1*rID AX/I-f L4 HA
* /t/dR/IALCOACChZJSA7O'
wotrw A4c~ Ah,

AD-AO788 530 'ADVISORY GROUP FOR AEROSPACE RESEARCHI AND DEVELOPRENT--ETC F/G 1/3AIRCRAFT ASSESSMENT AND ACCEPTANCE TESTING.(U)
NCLASSIFIED GARODLS-108 N
aillllll l2. ffffffIIII-EIIIEIIEIIE--

6-14
AAX/MUM Ii.SrAAVAU
0. pS
04 0.S 0A40
M4ACHy 44
L4JMfrkr7OAISq 4WEW/rA7?WA/
,sa 550CAL /ffliqArV AAmminc C.A.S. (n

6-15
APPENDIX I
Exampleiof th omuationof Static Margin, CG Margin5 PoiinO eutaPot
From trim curve tests with the centre of gravity at 0.2 and 0.3 the aircraft normal forcecoefficient was computed and plotted as Figure 1.
IN.
At c.g. position h
Static Margin Kn h, hldltCn
I'd CIhI, h i
= 0.167
and at c.g. position h, (move aft)
KpI = hh_1_ - 1
a h h(
= 0.083
The neutral point h n is found at C nA by extrapolation as shown in Figure 2 below.
~At18 2
h=0.6 P
C.G. margin H4, - hA - hi
- 0.6 - 0.2 - 0.4
N - hp. - h
- 0.6 - 0.4 - 0.2

6-16
APPENDIX I CONT.
The relationship between the static margin and CG margin is then computed for the valueof C04
(/,=Kn,/Hn, and5 - Kn/Hn
=0.083/0.2 and 0.167/0.4
=0.415 ,1 / =0.418
In this instance aft movement of the cg reduces the static stability at a slow rate than theCG movement itself. (See reference 5 page 66).

7-1
EVALUATION OF LATERAL AND DIRECTIONAL CHARACTERISTICSAND SPINNING BEHAVIOUR
BY
R.J. PooleFlight Teat Engineer
British Aerospace Aircraft GroupKingston-Brough Division
Dunsfold, England.
SUMARY
The lateral and directional handling characteristics that should be investigated during anevaluation of an aircraft already tested by a contractor and test techniques utilising limited flighttest instrumentation to gather quantitative data are described herein. Finally an approach to theassesement of spin entry and recovery behaviour is also presented.
INTRODUCTION
Aircraft designed in the U.K. and U.S. are required to comply with the lateral and directionalhandling requirements stated in AVP970 and Milapece respectively (References 1 and 2 ).
Aircraft of Class IV of these-requirements will normally be capable of achieving large roll ratesand hence have the ability to encounter large increments of sideslip that my exceed the design limitsif the control system is not powerful enough to limit it.
An aircraft's lateral and directional characteristics are normally assessed separately from thelongitudinal characteristics except in the cases of high rate rolling in conjunction with appliednormal acceleration and spinning and post stall gyrations.
Lateral and directional characteristics are very closely associated and at high incidence and manyClass IV aircraft resort to the secondary effects of their control surfaces to maintain steady flightconditions and for msnoeuvring. For example the use of rudder for roll control at high incidence withthe silemons in the neutral position.
High performance aircraft of previous generations only needed rudder controls to overcome crosswindeffects on landing, to hold heading when balancing the effect of a failed engine on a multi enginedaircraft and for checking drift during crosswind ground attack manoeuvres. On later aircraft the pilotwas required to use rudder for roll control when s certain incidence had been ekceeded and he had to betrained to think in terms of rudder usage at high incidence.
Some recent aircraft are fitted with control systems that mix the rudder and aileson inputs as afunction of incidence such that the pilot need only move the stick laterally or apply lateral force forroll control.
Contractore conduct rolling and other lateral and directional handling assessments for the
following reasons
1. To demonstrate that the dynamic and static stabilities are acceptable
2. To demonstrate that the aircraft complies with the specific limits of References 1 and 2
3. To determine any control limitations necessary to prevent departure from stable flightduring rapid rolling and other manoeuvres
4. To demonstrate spin or post stall gyration behaviour if the aircraft can achieve theseflight conditions
5. To determine any handling limitations on crosswind take off and landing performance
LATERAL AND DIRECTIONAL STATIC STABILITY
Lateral and directional static stabilit~es are closely related since they both depend on thegeneration of restoring moments due to sideslip in order to return the aircraft to wings level straightflight after encountering a disturbance.
If an aircraft has too little lateral and directional stability it will impose a high work load onthe pilot and may make precision flyvg tasks such as instrument flying difficult to perform.
Aircraft classed as belonging to Class IV of Ref. 1 are usually fitted with irreversible poweredflying controls and their stability with fixed control surfaces will be considered here.
Some recent aircraft have artificial static stability bestowed on them by advanced electroniccontrol systems while others Just use electronic systems to augment their stability in critical flightconditions. For example the Re Harrier uses roll and yaw stabilisers to input rudder and silenondeflection demands to the control system to minimize the effect of sideslip and roll disturbances whenIn semi-Jet borne flight.
The restoring moments when the aircraft is disturbed are developed as a result of design featuressuch as dihedral, weep back and fin geometry and are modified by the position of the wing on thefuselage. At high incidence the dihedral effect of a swept back wing may become over powering end theaircraft my be designed with anhedral to counter the increasing dihedral effect due to sweep back asIneidenee Is increased.
Contractorsa maur* these restoring moments by conducting steady side slip tests from which theyawing and rolling magento due to side slip angle (or lateral velocity),are determined.
For positive static stability the yawing and rolling moments generated from side slip must opposeasz diurbomee from straight and level flight. If the aircraft is in a positive side slip to the rightthe yawing mwent due to sideslip should be positive (to the left) and the rolling moment should beneative (riht wing up). See Figure 1 .

7-2
due to rudder and aileron inputs are known, either from calculation, from wind tunnel teats or fromflight-test measurements.
The yawing moments due to rudder can be determined by streaming a wing tip parachute with knowndrag characteristica and measuring the rudder angle needed to trim the aircraft in straight and levelflight.
The rolling moment due to aileron can be determined by loading the aircraft asymmetrically andmeasuring the ailezron angle required to trim the aircraft to fly straight and level.
When an aircraft is established in steady sideslip the net rolling and yawing moments are zero, i.e.
Ly + 4 + L = 0and N + N +N -= 0
in non-dimensional form
it + 'I I + =A 0q + nS 5---, o
For most aircraft 1 and n& are small except at high incidence since they represent the secondaryeffects of rudder ahd ailerh. So these equations can be reduced to
f = 4e-and 7if J and nq are neglected.
Prom the above equations 1 and n4 can be found if sideslip angle and the control angles aremeasured in flight using the following technique.
The aircraft is trimmed straight and level at constant speed and rudder and aileron are applied toproduce incremental changes in sideslip angle while holding heading constant. The test is continueduntil the maximum allowable sideslip or full rudder is achieved. At each increment of sideslip thepilot should note sideslip, rudder aileron and bank angle and also the fuel state at the start of thetest. Reference 2 statesthat control forces for a centre stick aircraft should not exceed 251b forfull aileron and 1751b for full rudder when executing normal manoeuvres within the flight envelope.These forces should be checked during sideslip teats.
Indicated sideslip angle should be connected for any position error effect and then plotted againstrudder and aileron angle, as shown in Figure 2 .
If the control derivatives are in the conventional sense, .e. left rudder produces right sideslipand left aileron produces left roll)the aircraft is stable if left rudder and right aileron are requiredto hold the aircraft in a sideslip to the right as indicated in the figure.
Quantitative data cannot normally be satisfactorily gathered on aircraft without flight testinstrumentation since sideslip, rudder and aileron angles are often not displayed in the cockpit.
A qualitative assessment of lateral and directional stability can be made from the direction ofthe control inputs required to hold the steady sideslip and from the response of the aircraft whenthe controls are released in a steady sideslip. If the aircraft returns to wings level flight quicklywhen the controls are released it has strong stability and if the maximum achievable sideslip angle issmall with full rudder control, it is deficient in control power. Should a large sideslip angle begenerated by a small rudder control input vhen the aircraft has been shown to be stable by it's responseon releasing the controls the rudder may be judged to be too powerful.
The aileron and rudder angle relationships with sideslip angle will not normally be linear overthe full aileron/rudder range. In the case of the rudder control this may b due to changes in
~fbn* or ng but if n, is neglected the ratio 1/1 is still equal to -4 and the aircraft is nottabl directionally unlbas the sign of)a changes (i.e. point I on figure nft).
A similar state of affairs exists with the aileron control where the aircraft would be laterallyunstable at point 2 on the figure.
Stick and rudder pedal forces required to hold an aircraft in a steady sideslip will be non-linearif the relationships between aileron and rudder with sideslip are non-linear. These forces may beoptimised with the incorporation of non-linear springs or changes of stick to control surface deflectiongearings. The control forces required to manoeuvre the aircraft may also be modified as a function ofspeed or Mach No by use of a pilot-static pressure difference sensor or "q" feel pot.
LATERAL AND DIRECTIONAL DYNAMIC STABILITYIf an aircraft is disturbed from a steady flight condition by a momentary pilot input or turbulence
it will exhibit a response that can be considered as three independent motions occuring simultaneously.
i) A normally heavily damped rolling motion where angle of bank changes occur withvirtually no change in yaw and sideslip. This is known as the Roll Subsidence Modeand determines the aircraft's response to lateral upsets and aileron.
ii) A normally lightly damped or slightly divergent motion in yaw and bank with virtuallyno sideslip. This is known as the spiral mode and it determines the long termstability of the aircraft and it's lateral trim.
iii) A lightly dmped or divergent oscillation in roll yaw and sideslip of relativelyshort period (typically 2-4 seconds) that determines the aircraft's long termsteadiness in turbulent air. This motion is described as the Dutch Roll Notionif the rolling component is large and mnaking if the rolling component is malland the motion is predominantly in yaw.
The above motions can be described by the solution of the three lateral equations of motion forside force, yawing moment and rolling moment after aking the assumption that they can be divorced fromthe longitudinal equations by neglecting cross coupling terms. Sideways velocity, yew rate end roll

7-3
rate are assumed to be exponential functions of time, i.e. V V 0 eP: Poo ;0
r r 0
The above expressions are substituted in the three lateral equations of notion and Vo, P and roare eliminated by simultaneous solution of the three equations in terms of 0
The atick~fixed l]teral zqtion of the aircraft is then represented by the characteristic quarticequation A X + B + C0 7t + D .+ E = 0 where the constant coefficients are composed of thelateral aerldynamic derlivatves andmertils s described fully in Reference 3.
The solution of the characteristic equation normally yields a large real root, a small real rootand a pair of complex roots which represent the three motions described above.
The large real root represents the Roll Subsidence Mode which is damped very quickly (typicallywithin i second) due to the damping in roll derivative lp generated principally by the difference inlocal incidence between the rising and falling wings as the aircraft rolls.
The small real root represents the Spiral Mode which may be divergent and which if uncontrolled willcause the aircraft to enter an ever tightening spiral. A spirally unstable aircraft will necessitatethe pilot often retrimuing laterally which may be annoying when instrument flying. If an aircraft isspirally unstable the instability should not be great enough to double the amplitude of the motion inless than 20 sesonds.
The complex pair of roots represent the Dutch Roll Mode which may on some designs be very lightlydamped and require a stability augmentation system to reinforce the damping.
Swept wing aircraft have a tendency to exhibit poor Dutch Roll damping at low speed on the approachwith wing flaps extended but the length of time that combat aircraft operate in this condition is shortand the deficiency will not necessarily increase pilot workload significantly.
With an instrumented aircraft all three dynamic stability modes can be examined by exciting theaircraft with the controls and observing it's response using the following technique.
The aircraft is trimmed for straight and level flight and the rudder is then smartly deflected ineither direction and immediately returned to the neutral position. The controls are then held fixedand the resulting oscillation observed until it damps out or diverges sufficiently for pilot to considerthat the sideslip structural limit may be reached.
Typical flight test instrumentation records of a damped Dutch Roll oscillation with spiralinstability and strong roll subsidence are presented as iguire 3 . The period and cycles and time to
amplitude are determined using the envelope on long decrement methods of Reference 4
The pilot cannot easily control a lightly damped Dutch Roll Motion and consequently the designrequirements specify a minimum level of damping. ?or U.K. designs the oscillation is required to decayto j amplitude within one cycle of removal of the excitation force. Roll rate/Yaw rate ratio shouldbe less than 3.0.
If the aircraft is fitted with a gyro gunsight with a fixed cross the dynamic stability can beobserved from the relative movements of the pipper and the fixed cross when the Dutch Roll Mode inexcited and s qualitative assessment can be made. Spiral instability can be seen by the aircraft'sgradual change of heading.
Quantitative data can be obtained if a pilot display gunsight camera is fitted and run during thetest.
Accurate free fall bombing and high definition serial photography and good target tracking aredifficult to achieve if the aircraft does not have good dynamic stability either with or withoutaugnentation and particular care should be taken to examine the Dutch Roll tendency when evaluating anaircraft for these tasks.
An aircraft that carries it's payload externally may be dynamically stable in the cleanconfiguration but it's stability may be seriously degraded when the external stores are fitted and theside area ahead of the centre of gravity is increased disproportionately. An evaluation of such anaircraft should include at least one flight with an aerodynamically destabilizing set of externalstores.
Reference 2 detailsvarious Dutch Roll damping criteria which they consider appropriate foreach aircraft type.
ROLLING PERPOMANCE ASSSSMENT
An aircraft's rolling performance nay be described in terms of the maximum roll rate that it canachisie under a given flight condition and the time constant of the rolling motion (i.e. the tine takento achieve 63% of the final steady roll rate after application of the roll control).
With an instrumented aircraft the roll response may be obtained using the following technique.
The aircraft is established in wings level unaccelerated flight at the target test speed andaltitude and the ailerons are then deflegted fully in one direction with the rudder held neutral.When the aircraft has rolled through 180 the controls are returned to the initial position andrecovery to levol flight completed. The fuel state just before entry should be noted in order toestablish the inertia in roll (A).
Normally with a fighter type aircraft the maximum rate of roll will have been achieved within thisbank angle change and a typical trace record of the manoeuvre is presented as Nigure 4
The aircraft's roll response to aileron is not normally affected by the Dutch Roll or Spiral Modecharacteristics since the time constant is so small and the roll response can be considered simply fromthe rolling moment equation
A L

7-4
The Initial slope of the response curve Pigure 4 oorresponds to the initial rolling acceleration% L9/A at the start of the manoeuvre.
Once the aircraft starts to roll the roll rate is opposed by the damping in roll derivative LFwhich Ases from the difference in incidence between the rsing and falling wings as the aircraft rolls,provided that the incidence is not close to the stall where Lp changes sip.
The rolling moment equation can be written in the form
A = I# + Lp neglecting other rolling derivatives.
When a steady-roll rate is achieved the equation can be written in non-dimensional foz asA
The dimensional roll rate is P x ZV/b
(If the control derivative is known the derivative m be estimated fro this test).
Simulation research into pilot opinion as to the rolling performance required by different typesof aircraft in various phases of flight has led to the formlation of opinion plots such as ligure 5.
The initial roll acceleration f and time constant ZR of the motion for several qualities ofperformance are presented in the figtre and the performance achieved by an aircraft under evaluationis also shown. The figure also illustrates that for'a given roll acceleration the time constant forgood handln must not be too great or too small.
If handling qualities diagrams such as Pigure 5 and prepared for various phases of flight for anaircraft type under evaluation the merits of one or a nmber of different aircraft can be deduced.
Rolling performnce may also be examined on the basis maximum roll rate achievable at each flightcondition and the time taken to roll through a given bank angle. The later technique being moreapplicable to non-aerobetic aircraft.
LATERAL AND DIRECTIONAL CONTROL DURING TAKE OFF AND LANDING
The maximum crosswind component in which an aircraft may take off and land safely is limited by theadequacy of the lateral and directional controls at low speed and the aircraft's directional controllabilityon the ground.
The adequacy of the lateral and directional controls at low speed in the take off and landingconfigurations can be determined from the sideslip angles achieved during wings level steady sideslip testsat low altitude using the following technique. The aircraft is flown straight and level at the expectedapproach speed and configuration. Sideslip is then generated incrementally using rudder whilast thewings are held level with the ailerons. The maximum sideslip generated when either full. rawer oraileron is achieved reflects the maximm crosswind component&) in which the pilot will be able to"kick off the drift" on landing or hold the wings level on take off
i.e. ( = VsinST.RjE
The pilot should not actually be reouired to use full lateral control under limiting conditionssince the aircraft may in practice experience gusts above the crosswind limits at lift off or justbefore touchdown. Crosswind limitations should therefore be chosen with reference to the sideslipthat can be held with i or '., of the critical lateral or directional control available.
The crosswind limit may be determined by the effectiveness of the aerodynanic controls or othersteering devices such as nosewheel steering or differential braking during the ground run on take off,or the roll out on Linding. The accuracy of the directional control on the ground my also cause themaxim- allowable orosswind to be scheduled in terms of runway width and to be further restricted fornight operations.
Crosswind limitations are determined during the contractors flight trials and are presented inthe Aircrew Manual. They may be qualitatively examined during an evaluation by landing and taking offon a crosswind runway in a moderate wind and estimating the amount of aileron and rudder travel used.
External stores, especially asymmetric configurations will effect the crosswind handling and atypical worst case should be assessed. during an evaluation.
EPECTS OP MACH! NO
As in the case of longitudinal handling the lateral and directional handling characteristicschange with increasing Mach No as shockwaves form on the aircraft distorting the pressure distribution.
Changes occur in the stability and control derivatives from variations in the pressure fieldand sirfame elastic distortion and these may occur rapidly in the transonic region.
Most aircraft suffer some stability degraedation in the transonic region but nay recover andexhibit improved handling when truly supersonic.
An evaluation should include examination of trim changes both at high Mach No at altitude and atthe altitude where the flight envelope allows the greatest dynamic pressure to be achieved.
Structural elastic distortion can cause control reversal which is undesirable and this is mostlikely to occur at high speed.
Reduction of an aircraft's stability with Mach No may be countered by use of a stability augmentationsystem or an entirely artificial stability and control system. In the latter case, whatever the flightcondition, a computer decides the direction and magnitude of control surface input necessaa to prevent anyflight path deviation. Pilot inputs to manoeuvre the aircraft are translated by the computer to demandthe appropriate surface deflection and to limit any requirement that would result in departure from stableflight or structural overload.
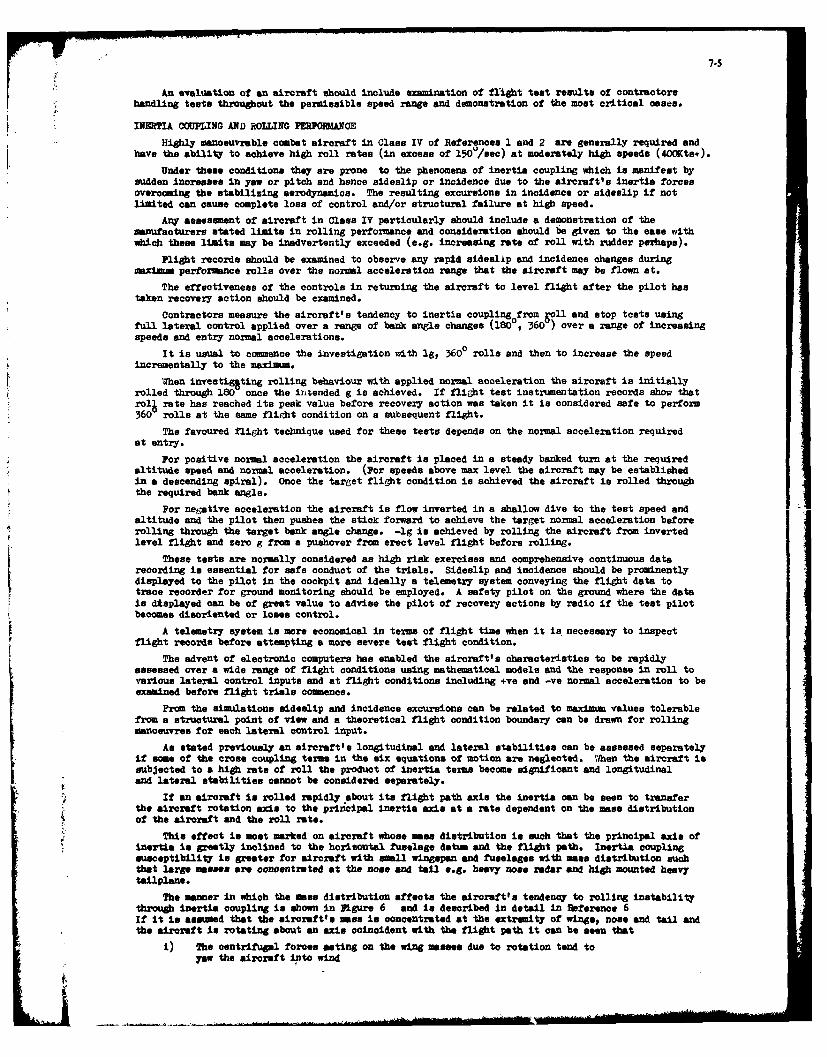
7-5
An evaluation of an aircraft should include examination of flight test results of contractorshandling tests throughout the permissible speed range and demonstration of the most critical cases.
INERTIA COUPLING AND ROILING PERPO3LAJCE
Highly manoeuvreble combat aircraft in Class IV of References 1 and 2 are generally required andhave the ability to achieve high roll rates (in excess of 150r/see) at moderately high speeds (40OKts+).
Under these conditions they are prone to the phenomena of inertia coupling which is manifest bysudden increases in yaw or pitch and hence sideslip or incidence due to the aircrft's inertia forcesovercoming the stabilizing aerodynamics. The resulting excursions in incidence or sideslip if notlimited can cause complete loss of control and/or structural failure at high speed.
Any assessment of aircraft in Class IV particularly should include a demonstration of themanufacturers stated limits in rolling performance and consideration should be given to the ease withwhich these limits may be inadvertently exceeded (e.g. increasing rate of roll with rudder perhaps).
Plight records should be examined to observe any rapid sideslip and incidence changes during
maximum performance rolls over the normal acceleration range that the aircraft may be flown at.
The effectiveness of the controls in returning the aircraft to level flight after the pilot hastaken recovery action should be examined.
Contractors measure the aircraft's tendency to inertia coupling from Sell and stop tests usingfull lateral control applied over a range of bank angle changes (1800, 360 ) over a range of increasingspeeds and entry normal accelerations.
It is usual to commence the investigation with Ig, 3600 rolls and then to increase the speedincrementally to the maximum.
When investigating rolling behaviour with applied normal acceleration the aircraft is initiallyrolled through 180 once the intended g is achieved. If flight test instrumentation records show thatroll rate has reached its peak value before recovery action was taken it is considered safe to perform360 rolls at the same flight condition on a subsequent flight.
The favoured flight technique used for these tests depends on the normal acceleration requiredat entry.
For positive normal acceleration the aircraft is placed in a steady banked turn at the requiredaltitude speed and normal acceleration. (Per speeds above max level the aircraft may be establishedin a descending spiral). Once the target flight condition is achieved the aircraft is rolled throughthe required bank angle.
Por negative acceleration the aircraft is flow inverted in a shallow dive to the test speed andaltitude and the pilot then pushes the stick forward to achieve the target normal acceleration beforerolling through the target bank angle change. -lg is achieved by rolling the aircraft from invertedlevel flight and zero g from a pushover from erect level flight before rolling.
These tests are normally considered as high risk exercises and comprehensive continuous datarecording is essential for safe conduct of the trials. Sideslip and incidence should be prominentlydisplayed to the pilot in the cockpit and ideally a telemetry system conveying the flight data totrace recorder for ground monitoring should be employed. A safety pilot on the ground where the datais displayed can be of great value to advise the pilot of recovery actions by radio if the test pilotbecomes disoriented or loses control.
A telemetry system is more economical in term of flight time when it is necessary to inspectflight records before attempting a more severe test flight condition.
The advent of electronic computers has enabled the aircraft's characteristics to be rapidlyassessed over a wide range of flight conditions using mathematical models and the response in roll tovarious lateral control inputs and at flight conditions including +ve and -ve normal acceleration to beexamined before flight trials comence.
Prom the simulations sideslip and incidence excursions can be related to maximum values tolerablefrom a structural point of view and a theoretical flight condition boundary can be drawn for rollingmanoeuvres for each lateral control input.
As stated previously an aircraft's longitudinal and lateral stabilities can be assessed separatelyif some of the cross coupling term in the six equations of motion are neglected. When the aircraft issubjected to a high rate of roll the product of inertia terms become significant and longitudinaland lateral stabilities cannot be considered separately.
If an aircraft is rolled rapidly about its flight path axis the inertia can be seen to transferthe aircraft rotation axis to the principal inertia axis at a rate dependent on the mass distributionof the aircraft and the roll rate.
This effect is most marked on aircraft whose mass distribution is such that the principal axis ofnertiLa Is greatly inclined to the horizontal fuselage datum and the flight path. Inertia couplingsusceptibility is greater for aircraft with mall wingspan and fuselages with mass distribution suchthat large masses are concentrated at the nose and tail e.g. heavy nose radar and high mounted heavytailplane.
The manner in which the mass distribution affects the aircraft's tendency to rolling instabilitythrough inertia coupling is shown in Pigure 6 and is described in detail in Reference 6If it is asaued that the aircreftts mass is concentrated at the extremity of wings, none and tai andthe aircraft is rotating about an axis coincident with the flight path it can be seen that
i) The centrifugal forces eting on the wing mases due to rotation tend toyaw the aircraft into wind

7-6
ii) The centrifugal forcea acting on the nose and tail masses tend toyaw the aircraft out of wind. If the aircraft's mass is largely concentratedin the fuselage the out of wind moment may be the greatest and the aircraft willonly remain stable if the aerodynami forces can balance the resultant inertia forces.
A similar condition can be seen to exist in the pitching plane as shown in Pigure 6The inertia effect in the pitching plane is destabilizing.
The aerodynamic moments which balance the destabilizing inertia forces are nv in the yawingplane and in the pitching plane.
If the aircraft's configuration is such that inertia coupling may occur at a low value of roll ratethe weathercock stability and effectiveness should be carefully optimised during the design. If theaircraft'a Ctrol system enables it to generate unnecessarily high roll rates at full aileron theaircraft my be fitted with high speed stops to limit the aileron travel, activated by undercarriageretraction for example, so that full aileron travel is available at low speed where required.
Inertia coupling effects are not always only found at the extremes of the flight envelope andspeed so the contractors investigation must cover intermediate flight conditions.
SPINNING AID RCOVERY
Intentional spinning of many modern highly manoeuvrable aircraft is prohibited but neverthelessspine may result when these aircraft are manoeuvring near the extremes of their flight envelopes.
Departures from stable flight occasioned by wing rock, wing drop or excessive sideslip at highincidence, can develop into wildly oscillatory or very fast flat spins from which recovery after aturn or two is not possible.
U K. contractors investigate the departure characteristics of their designs in order todetermine satisfactory recovery drills and to measure height loss during recovery from incipient andfully developed spins.
Prom the results of trials, conducted initially by the contractors, the Aeroplane and ArmamentExperimental Establishment may recommend that the Services be granted a clearance to spin. They mayalternatively recomend prohibition in which case they will offer advice on the recognition of anincipient spin and the best technique for recovery to steady flight.
A spin is a more or less steady motion which may result when an aircraft is disturbed in roll oryaw at incidences at or beyond the stall.
At incidences above that at which the stall occurs, some of the more important aerodynamicstability derivatives change sign or magnitude suddenly and enable the aircraft to enter a self-smstaining rotary motion or spin. The damping in roll derivative lp, which normally damps rollingdisturbances, becomes positive and consequently accelerates the aircraft when it is disturbed in roll,i.e. the falling wing, although at a greater incidence than the rising wing, produces less lift andtherefore carries on falling. Disturbances in yaw will also generate disturbances in roll, which cancause wing drop and entry into a spin.
Normally, an aircraft will enter a spin with the nose above the horizon and will take several turnsbefore It attains a steady helical flight path about a vertical axis.
If the spin axis is above the aircraft, the spin is said to be erect and if below the spin istermed Inverted.
The spinning motion is a complex one involving pitching, rolling, yawing and sideslipping, but ifit is steady all the moments and forces acting on the aircraft must balance and the aircraft will be ina state of equilibrium.
Sometimes, a steady spin is not attained and the aircraft oscillates in pitch, roll and yaw, butmore normally an aircraft with a conventional planform and inertia distribution, will orientate itselfin such a way as to reach equilibrium.
In the spin, the resultant aerodynamic force normal to the plane of the wings acts through theaxis of the spin. The aircraft drag is equal and opposite to the gravitational force and the liftforce in reacted by the centrifugal force generated by the rotation of the aircraft about the spinaxis. Sideforces are smll since sideslip is usually small and sideforce balance plays little part indetermination of the spin characteristics.
The type of spin and the aircraft's orientation are principally determined by the balance of themoments about the aircraft axes. Por equilibrium, the inertia moments are exactly balanced by theaerodysmic momenta, the balance being effected by the aircraft's adjustment of the rate of spinrotation and the sideslip angle.
Pitching moment balance:-
The Inertia Moment about the pitching axis is M = (C-A)prPar the Me Hawk (a-A) is positive (See Figure F) and in an erect spin, where p and r have the same
sign, is a nose up pro-spin moment. This is balanced by the net aerodynamic nose down pitch moment ofthe wings and tailplane.
Rolling moment balance:-
The inertia moment about the rolling axis is L = (B-C) qr
L is negative end in an erect spin it is balanced by a net pro-spin aerodynamic rolling momentComposed of 1 , 1 , 1v and 1 some of which are pro-spin and some anti-spin. Per a standard spinIp Ir aim lare pro-spin &L lv is anti-spin.
Yawing imt balance:-
The inertia yawing asmont about the yawing axis is N - (A-B) pq

7-7
N is -ve in an erect spin and is balanced by a net pro-spin aerodynamic moment composed of n p, nr,n andn
In a standard spin n is anti-spin and n, nr and n are pro-spin.
Alterations in any of the flying control settings will change the balance of the moments and willresult in a change in spin rate or sideslip angle or both.
Moving the stick forward will produce a nose down pitching moment and gyroscopic precession inyaw normally increases sideslip and spin rate. Increased spin rate increases the pro-spin nose upinertia moment and incidence will increase until balance is attained.
Application of aileron in the 4irection of the spin (in-spin aileron) will increase the roll rateand if the ailerons produce adverse yaw, will tilt the inner wing further below the horizon and slowthe spin rate. If the ailerons produce proverse yaw, the wing tilt will be reduced and the spin ratewill increase. See Figure 8 for aircraft orientation in a positive spin.
Application of aileron against the direction of spin (out-spin aileron) will produce the oppositeeffect, i.e. adverse yaw will decrease wing tilt and increase spin rate.
An increase in spin rate will usually result in an increase in incidence and will flatten thespin.
Before investigating spinning characteristics in flight contractors normally conduct tests withmodels dropped from helicopters or launched into the working sections of vertical wind tunnels suchas the Spinning Tunnel at the Institut de N echanique des Fluids de Lille, France.
The effect of control positions on spin entry and recovery are investigated using models whosecontrol surfaces may be actuated in flight by radio control and the most likely recovery procedure ispredicted.
The severity of the spin and it's likely tendency to become oscillatory is also assessed fromthese tests.
Spinning trials may be hazardous and contractors take steps to minimise the possibility of thepilot not being able to recover the aircraft by fitment of additional cockpit instrumentation andantispin devices.
Typical precautions include the following
a) Fitment of antispin parachute or rockets at the aircraft's tail to provide anose down pitching moment and reduce the wing incidence should the pilot runout of longitudinal control.
b) Development of the engine relight system before the spinning trials to ensurethat the pilot will be able to relight the engine if it is necessary to shutit down if a surge occurs.
c) Provision of additional hydraulic accumulator capacity in order to allow thepilot more control activity for recovery should the engine stop and the enginedriven hydraulic pumps be unable to supply adequate pressure.
d) Provision of prominent aileron and rudder control position gauges and indicationsof direction of roll and yaw to enable the pilot to accurately centralize thecontrols and easily determine the direction of aircraft rotation.
The use of telemetry to display the aircraft's behaviour to engineers and a safety pilot on theground to enable the safety pilot to offer advice to the test pilot if he becomes disoriented ishighly desirable and greatly enhances the trials safety.
The flight trials can be conducted in three stages and may be terminated at any stage if recoverycan only be effected with the assistance of an antispin parachute or other recovery aid.
Stage 1 :- Exploration of the incipient spin, the tendency to enter a spin withapplication of any of the controls and early recovery indication
Stage 2 Exploration of the fully developed spin, assessment of the effect ofin-spin and out-spin aileron and a range of tailplane inputs andrecovery techniques
Stage 3 :- Exploration of oscillatory spin modes and the effect of controlmishandling at spin entry and recovery. Determination of effectsof manoeuvring flpp, airbrake and engine power settingsmn& spinentry from mishandled aerobatic and high rate turning manoeuvres.Examination of the likelihood of entering an inverted spin andrecommendation of recovery procedure to be adopted.
The trials are normally commenced at altitudes above 30,000 ft with the aircraft ballasted to themid C.G. position.
The aircraft is slowed to the unaccelerated stall with wings level and engine at idle and theeffect of full sileron or rudder applied at the stall is determined. The controls are centralizedafter approx. 180 bank angle change if the wing drops. If recovery is satisfactory the test isrepeated with the pro-spin controls held for and increasingly greater bank angle changes until adeveloped spin is achieved. If the aircraft is spin resistant the effect of applying pro-spin controlin a steady banked turn or in conjunction with a rapid aft stick movement in level flight on receipt ofstall warning may be more successful in inducing a departure.
It is not necessary for a potential purchaser evaluating an aircraft to repeat the contractorsspinning trials but any evaluation of an aircraft cleared for spinning should include a demonstrationof the range of spin behaviour exhibited by the aircraft.

7-8
Prom the results of the spinning programe the contractor will be able to describe and demonstratethe following :-
1. The characteristics of the incipient spin, recovery procedure and expected heightlose on recovery.
2. The effects of the following variables on the spin characteristics, entry andrecovery and height loss
a) Power setting
b) In-spin and out-spinaleron input
c) Rudder input
d) Longitudinal control input
e) Effects of combinations of b) c) and d)
f) Centre of gravity
g) External stores
h) Extended manoeuvring flaps and air brake
3. The aircraft's behaviour in an inverted spin if it can be achieved.
If the contractors trials have shown that the aircraft cannot be recovered fra a departure fromnormal flight or a developed spin, the pilot may be given limitations to fly to in order to avoid lossof control. Alternatively, the aircraft's control system may be designed to limit it's manoeuvabilityin order to prevent incidence, sideslip and normal acceleration reaching levels at which departure willoccur.
An evaluation should question the ease with which a pilot may inadvertently exceed the limitationsand thereby enter a spin.
Most aircraft are more reluctant to enter an inverted spin since the fin and rudder are not easilyblanked by the turbulent wakeof the wing and tailplane. The contractors will determine the conditionsunder which an inverted spin may be achieved and the recovery procedure to be adopted. It should benoted that if the aircraft has a manual rudder it may be blown into a pro-spin position by the airflowat the rear of the aircraft and recovery from a well developed inverted spin may be dependent on themaximum foot force that the pilot can app._ .........
S111BOLS
Lp Rolling Moment due to roll rateI f " i " rudder angle
L" " I aileron angleof it " o " " sideslip
Total rolling moment
Rate of change of rolling moment coefficient due to rollingS ttiV II tt rudder
"I "I " " * " " " " aileron"I "I " " " " " " "sideslip
I II II II iI II II |! |" yawing
Np Yawing moment due to roll rateN1 " " " " rudder angleN" " " " aileron angle
" , , i sideslipTotal yawing moment
A. Rate of change of yawing moment coefficient due to rollingX o o ,, To It t ,I . rudder
"I " " " " ' " " " aileron"I " "I " " " " " sideslip
I is of if I" to "1 "1 yawing
U Total pitching moment
Rate of change of pitching moment coefficient due to vertical velocity
Rudder angleAileron angle
4Sideslip angle
v Sideways velocityp Roll -1ter Yaw rate
A, B, C Inertia Moments in pitch, roll and yaw

7-9
1 Design Requirements for Aircraft for th. Royal Air Porce and Royal navy,Ministry of Defence (P.P.), Volume I Books I & II and Memos
2 Military Specification Flyiri5 Qualities of Piloted Airplanes,MIL-F-8785B (ASG), 16 September 1979
3 A. W. Babiater, Aircraft Stability and Control, Oxford, Pengamon Press 1961
4 B. Dickinson, Aircraft Stability and Control for Pilots and Engineers,London, Sir Isaac Pitman & Sons Ltd, 1968
5
6 W. J. G. Pinsker, The Theory and Practice of Inertia Cross-Coupling, The AeronauticalJournal of the RAeS Volume 73, No 704 August 1969, London
......

7-10
YAWW
,ROLL/NO- I YAWII*- MOM0A1V3xgR_ 77r/rc IA7Zew. .s rAd/l in
AILROW LA. I~DOC?
RArAC
A'Oa. AfE YAW ,AAP.4C DZIAlA/- AD11MA AbU-. OC1/L.r1,O)

7-1!
-- -~ROL L ACSPMSE,
~7-0 Ail-a. A/L &RON
in ff/L. 1LEA7OHp- /
8' - -q
ASA-R,70- _O _ - - -
A
al 0.3 04 0-' a5* Ao a. o **, 401
"aIL mwOC T/#E cewsm7*4- (aCkw
RIxr loP/Zmv, ,3OVswDMl/cs' AOW.A'qoAO1' caolDrlo/v ov
A4IL ACCsLLERA1/DA/ AVAILARLE '. U*NT SMAIKE Aft.Q.~r

7-12
RoA~~o c-A pCR
/A/f?7A
' (C-A-OrAAPRO.SPJ.v
- /4000
A-S SMa HAWK /A/rgrA DPJEW~S'
- 20,coo Yk"A/aAJRCRAPT HA+3%
0QI~eNrA7Y1ON Oc AN AIRCAcr /#V A AMsrMAE- SRI" pa'A(aurS P/V A/lJ.40N ANC) PRo.3,A/ ,dmut'E/ AAPL/D
S~JOl49/s7A8.4~
I RX41P
A IS OVt/

m 8-I
FLIGHT RESEARCH TECHNIQUES UTILIZING REMOTELY PILOTED RESEARCH VEHICLES
R. Dale ReedNASA Dryden Flight Research Center
Edwards, California 93523U.S.A.
SUMMARY
This lecture presents a survey of the use of the remotely piloted research vehicle (RPRV) inaeronautical research. The paper emphasizes the flight test experience that has been acquired at theNASA Dryden Flight Research Center with several types of RPRV's, including those with a pilot in the loop,a concept developed at Dryden. The paper discusses the application of RPRV's to various test objectives;the approaches utilized range from the simplest and least expensive of vehicles, such as the Minisniffer,to the very sophisticated and complex highly maneuverable aircraft technology (HiMAT) RPRV.
The advantages and disadvantages of RPRV's are discussed, as well as safety considerations.The ground rules set early in a program can profoundly affect program cost effectiveness and timeliness.
1.0 INTRODUCTION
Experiments in remotely piloted vehicle (RPV) flight testing began at the NASA Dryden FlightResearch Center approximately 10 years ago. Those early tests started by adding a test pilot and digitalcomputer elements to state-of-the-art drone technology. Each succeeding RPV program made greater use ofthese elements in meeting research objectives.
The RPRV (the word research was first added to RPV in Ref (1)) became increasingly popular withNASA engineers and program managers because of its greater flexibility and because they had greatercontrol over what the aircraft did in flight. This control was achieved from an aircraft-type cockpit thatwas on the ground and incorporated a full instrument flight rules (IFR) panel, a forward-looking TV, andvariable stick-force gradients. A programmable ground computer functioned as a part of an experimentalaircraft control system. The RPRV was less popular with NASA test pilots, on the bther hand, becausethey had fewer opportunities to fly RPRV's and because more simulation time was necessary to prepare forflying RPRV's. The pilots' skill and knowledge were often quite highly taxed in order to successfullycomplete an RPRV mission.
In the meantime, arguments in favor of the RPRV met with success in the promotion of new pro-grams.
We originally put the test pilot on the ground and an RPRV in the air because the cost and timenecessary to develop new research aircraft the conventional way had become prohibitive. Much moreground system, structures, and wind tunnel testing goes into today's aircraft: in 1950, a new aircraftunderwent an average of 1200 hours of wind tunnel testing; in 1970, approximately 12,000. The additionalwind tunnel test time is due partially to the sophistication of the aircraft, which makes it difficult to dupli-cate configuration perturbations and flight conditions accurately in the systems, structures, and materialsground tests. The result is that many additional hours of wind tunnel facilities are necessary to giveconfidence in the data. And the enormous investment involved was discouraging the research communityfrom making bold moves into new technology.
We at Dryden found the RPRV attractive because it built confidence In new technology by demon-strating Its capabilities in the real and dynamic environment of flight. Use of RPRV's seemed especiallyadvantageous because it permitted testing to be done at low cost, In quick response to demand, and at norisk to the pilot.
The RPRV has the potential for low cost because of its smaller size, lack of life support systems,and lower requirement for redundant systems. The quick response time and reduced cost result from theelimination of many manrating tests and from the ability to use simple and modifiable structures. The use ofprogrammable ground-based control systems also provides quick response, as well as flexibility. Finally,hazardous testing is possible because the vehicles may be considered expendable or semiexpendable.
The RPRV differs from the military drone or RPV in that it gives a test pilot exactly the same re-sponsibilities and tasks as if he were sitting in a cockpit on board a research airplane. As in manned flighttesting, the pilot has complete responsibility for performing data maneuvers, evaluating vehicle and systemsperformance, and determining tie appropriate action to take in emergencies or If the aircraft does not re-spond as expected.
The mission of a military RPV, on the other hand, is so distinct that an autopilot can be programed.The craft's aerodynamic performance is accurately defined in extensive wind tunnel and flight testing, andthe design of the autopilot is based on these tests. Of course, the flexibility of the autopilot is limited tocertain routines, such as cruise, 150 turns, and 300 turns. The controller fine adjusts the autopilot, orseveral autopilots at once, for he may have a whole formation under his guidance.

8-2
In contrast, the RPRV is designed to venture into unexplored engineering territory. It does notperform a stereotyped routine, and part of its mission is to explore the aerodynamic performance of thevehicle. Versatility is necessary for this type of testing, and a pilot is the most versatile system we have.Completely responsible for vehicle control. a pilot can handle only one RP1V at a time. Versatility provedto be a significant selling point for RPRV's.
"Sending more commands up to the vehicle and getting a large quantity of high quality data backconstantly with no dropouts or glitches takes broader and more reliable radio-link bands than for an RPV.The RPRV control system would be vulnerable to electronic countermeasures, thus would be unsuitable ina military situation." Experience is always the best teacher. Six years of RPRV flight experience atDryden have been logged since the words above appeared in Reference (1). The purpose of this lectureis to pass on the lessons learned in RPRV flight testing during that time.
2.0 RPRV FACILITY
The RPRV has in its control loop a powerful ground-based digital computer (Fig 2.0-1). Pro-graming the computer substitutes for the expensive building of new control system design features intothe vehicle itself. The computer, located in a ground-based RPRV facility along with a ground cockpit,serves as part of the RPRV simulator as well. Unlike a manned aircraft control system, it can be used inseveral successive vehicles.
3.0 NASA RPRV PROGRAMS
Figure 3.0-1 illustrates the eight RPRV programs that have been conducted at the Dryden FlightResearch Center since 1969. The Big G Parawing and Minisniffer vehicles were operated more like con-ventional drones and were not considered true RPRV's.
Tables 3.0-1 and 3.0-2 summarize the objectives and characteristics of these RPRV programs.Hardware qualification (Table 3.0-1) signifies the testing of experimental system components intendedfor use in follow-on programs. From Table 3.0-2. it is obvious that the scope and cost of the RPRV pro-grams vary widely. For example, the very limited scope of the Big G Parawing program permitted itscost to be orders of magnitude less than that of the highly maneuverable aircraft technology (HiMAT)program. The message is that RPRV programs can be designed to match facilities, funds, and per-sonnel to the resources available.
A brief description of each RPRV program follows.
Backup control-TF-104G
B-____launch _______chase aircraft
RPRV Uplink
-Jr
o it Uplink discretesFt 0-1 .AV --nro i Ckpit
W[ l[][IM indicatrs !V-T3
Telemetry V-77 moo StickdaaJ control | |UplinkLdecommutation copue lowenor
station -- _ computer endr
, Telemetry da|
[ ~~~~~~~~~~~Fig 2. 0-1 RPRV control systlem. .......... eri....

8-3
Hyper I I I 318-scale F-15 DAST
HIOWTBig G Parawing Minisniffer
PA-30F-86
Oblique wing
1970 - 1980
Fig 3.0-1 NASA RPRV program8.
Table 3.0-1 RPRV Program Objectives
Objectives
RPRV program Basic research Proof of concept Hardware
Aerodynamics Propulsion System Aircraft qualificationStructures demonstration configuration
Big G Parawing .--- --- --- x xHyper Il x --- --- X X ---PA- 30 ......... K --- X3/-scale F-15 X --- --- X X ---Minianiffar X X X X X XOblique wing X ..- ---
DAST1 X X --- X X
HiMAT2 X X X X X
SF-6 X .......
" 1Dronea for aerodynmic and structural testing.2 Highly maneuverable aircraft technology.

8-4
Table 3.0-2 RPRV Aircraft Information
RPRV vehicle P I Parachute Type of Vehicle Strubure dt Vehicle
equipped' control system weight. kg parameters cost. dollars
Big G Parawing None Yes Direct, electric 270 Steel tube, aluminum 12 2000(2 vehicles)
Hyper Ill None Yes Direct, hydraulic 450 Steel tube. fabric. 16 5000fiber glass, (0 vehicle)aluminum sheet
PA-30 Prdpeller No Direct, hydraulic, 1600 Aluminum 35 Availableground computer for use
3/0-scale F-IS None Yes Direct, hydraulic. 1100 Wood, foam, 77 1.000.000
ground computer fiber glass (2.5 vehicles)Minisniffer Propeller No Direct, electric, 100 Wood. foam, 17 100.000
wings leveler fiber glass. Kevlar (2 vehicles)Oblique wing Ducted No Direct. electric 270 Wood, fabric. 16 200.000
propeller fiber glass (0 vehicle)DAST Jet Yes Direct, hydraulic, 950 Aluminum, 120 500.000
autopilot fiber glass (1 vehicle)HiMAT Jet No Ground computer. 1360 Composite: carbon. 450 17.300.000
onboard computer, Kevlar, aluminum, (2 vehicles)programer. steelhydraulic
F-86 Jet No Direct, hydraulic, 0400 Aluminum 17 Surplus
SAS1
Stability augmentation system.
3.1 Big G Parawing
The Big G Parawing program was initiated to explore the piloting problems involved in steering alimp-parawing spacecraft configuration to a precision landing on the ground. In 1967, the NASA JohnsonSpace Center was seriously considering the development of a large version of the Gemini spacecraft thatwould be capable of returning 12 astronauts to a landing on earth by means of a gliding parachute.
The Big G Parawing program at Dryden had two phases. The first, an RPRV phase, was intendedto qualify the parawing system, the structure, and the pilot control system, as well as to measure the loadsimposed on an anthropomorphic dummy (Fig 3.1-1) during parawing deployment and ground contact(Ref (2)). In the second phase, the anthropomorphic dummy was to be replaced by a test pilot (Fig 3.1-2)to explore the piloting problems involved in steering the craft to a landing while looking through aviewing port similar to that in the Gemini spacecraft. Forty successful RPRV flights were conductedfrom 3000 meter drops to precision landings by a visual pilot (a pilot watching from the ground) usinga model airplane transmitter. The second phase of the program was cancelled when NASA decided toabandon the drop concept in favor of the horizontal landing (shuttle) concept.
I -
E-J9782
Fig 3. 1-1 Parawing test vehicle.

3.2 Fig 3.1-2 RP V test Vehicle wih n th " P du my -20465
a The Objectteand at hi ' OUUS flyi n" Ch rat r1 o f
9 Ytt lnr g Cha aceristic,, gr (Ref (3)) Was to acquire f~~ aW a & n s f e r r e d t o a P i l o t u s i n W a- o d b y h e i s p a c e c r a f t l ,I h a t ~ v e s a t e h nw as tr to
' a able of flight si gl
Prbe a~ vi llo I Copter to 3oo, 'e ~
-Pi dowecopt Occurred in towed fligho a0O meteilt launch r h p
ute n n thenflwdont
theua p Ye ill h ered faeand land ~d
C O te O t fo u n d t a t 'b y C o n d ucm a aed e g r ;C o tr o
wetacrdnyopgon cocpindenting heflt ae S tud The bgest~~~o
atttlde Th coulditn, damp Out th es beop
te alh
radontr : ol n T; ractce on the mi nglthre a p o t urns byreerPio.Practiced
on BPeed-sae
Fig '2_1 Hyp"111withsice ed wng -20 64

8-6
3.3 PA-30
The control system for the light twin-engine PA-30 airplane (Fig 3.3-1) was originally developedat the NASA Dryden Flight Research Center for experimental control systems work. The controls on theleft seat are rigged electrically for fly-by-wire control through a hydraulic control system. The controlsystem commanded from the right seat is the basic mechanical system, and it employs a safety cutout systemso the safety pilot can take immediate control of the aircraft at any time. The downlink data transmissionsystem in the aircraft made it natural to install a control system uplink and a TV downlink for RPRV dev-lopment and research. The PA-30 has been used to develop several RPRV operational concepts, includingthe ground-based computer control system (Ref (4)) and automatic backup landing system for the HiMATvehicle. The aircraft is never flown without a safety pilot on board.
ECN 2089
Fig 3.3-1 PA-30 airplane used for RPRV development and simulation.
3.4 3/8-Scale F-15
The objective of the 3/8-scale F-15 program (Fig 3.4-1) was to explore the aerodynamic and con-trol system characteristics of the F-15 aircraft in spins and high-angle-of-attack flight. The program wasdesigned to make maximum use of existing equipment at the Dryden Flight Research Center. For example,hydraulic, gyro, and telemetry systems available from the retired lifting body programs were used for theaircraft's control systems. The proportional uplink then being used by researchers for transmitting radardata to pilot director instruments on board aircraft for curved instrument landing system (ILS) experimentswas incorporated in the 3/8-scale F-15 aircraft for uplink control. Ground data processing computers werealso pressed into service for the programmable ground-based control system. A general purpose simulatorcockpit being used for stability and control studies was utilized for the RPRV pilot control station. A mid-air recovery system (MARS) Firebee II parachute system was utilized for vehicle recovery during the firstflights. Later flights utilized horizontal landing fer recovery.
A contract was let to construct three models to contain the NASA-supplied equipment.
The complete familiarity of the NASA crew with the aircraft equipment, combined with easy accessto the equipment and uncrowded space inside the vehicle to work on the equipment made the operation ofthis vehicle relatively straightforward. In total, 35 launches were made from 14,000 meters. Data wereacquired to explore the effects of different nose shapes and aerodynamic devices as well as the effects ofvarious control system schemes on vehicle spin characteristics (Refs (5) to (7)).

8-7
ECN 4892
Fig 3.4-1 3/8-scale F-15 being guided to horizontal landing by RPRV TV link.
3.5 Minisniffer
The Minisniffer program, which began in 1975, was initiated to develop a small unmanned atmos-pheric survey aircraft capable of sensing turbulence and of measuring both natural and man-made atmos-pheric pollutants at altitudes up to 27,000 meters (Ref (8)). The vehicle was to be able to fly at low speedsand to be able to maneuver precisely at stratospheric altitudes to conduct atmospheric research on aroutine basis. The design missions called for the vehicle to carry an 11 kilogram air sampler to21,000 meters and to cruise at that altitude for an hour over a range of about 320 kilometers, or to glideback from a 27,000 meter climb.
An essential element in the Minisniffer concept was the development of a reciprocating monopro-pellent hydrazine engine to drive a large, slowly turning propeller. The NASA Johnson Space Centertook responsibility for the development of the hydrazine engine; Dryden was responsible for the develop-ment of the complete system. While Johnson worked on the hydrazine engine (Fig 3.5-1), Dryden builtthe Minisniffer with conventional gasoline propulsion for early flights (Fig 3.5-2) so work could proceedon the vehicle's aerodynamics, structure, and guidance and control systems.
E-31416
Fig 3.5-1 Minisniffer with hydrazine propulsion.

R-8
E-20924
Fig 3.5-2 Minisniffer with gasoline propulsion.
The first flight tests were conducted with model aircraft radio control systems. Actuators weredoubled up when greater hinge moments demanded it. Later, a special lightweight radio control systemcharacterized by longevity and high reliability at high altitudes was developed. A simple wings-levelersystem was found to be necessary in turbulent air. A yaw-rate gyro drove the rudders that served as thewings-leveler system. The system worked through dihedral effect at all altitudes and was designed toserve as a Dutch-roll yaw damper at altitudes above 15,200 meters. The hydrazine engine was demon-strated in flight to 6000 meters with a fixed-pitch propeller. However, program funds were not availableto develop the variable-pitch propeller needed to climb to higher altitudes.
A later study with the NASA Jet Propulsion Laboratory showed that the Minisniffer could performwell in the rarified carbon dioxide atmosphere of the planet Mars. The 38 percent earth gravity on Marsmakes less horsepower necessary for flight, giving the hydrazine-propelled Minisniffer a theoretical8000 kilometer range over the Mars surface. Use of a Minisniffer-type vehicle for Mars exploration is stillunder consideration.
3.6 Oblique Wing
The NASA Ames Research Center decided to investigate the oblique wing concept primarily becauseof its potential for enhancing transonic cruise efficiency. The idea is to position the straight-across wingat right angles to the fuselage for takeoff and landing and to swing one wingtip forward for cruise flight.Wind tunnel data acquired in the Ames wind tunnels indicated that an oblique wing configuration mighthave lower drag than, for example, variable sweep wings as well as have lower sonic-boom potential onthe ground track.
After a radio-controlled model was built and flown by Robert T. Jones at Ames, the Ames engi-neers devised an RPRV program to further demonstrate the configuration. A contract was awarded for thedesign and development of a subsonic-only oblique-wing RPRV. The vehicle was to be capable of flightwith no tail or with minimum tail so the aircraft could be made as compact as possible. A duct around thepropeller was part of the overall structural and aerodynamic scheme.
The resulting vehicle (Fig 3.6-1) was turned over to Dryden for flight testing. The flight testprogram was short and simple, with a small team of Ames and Dryden personnel working together to
Fig 3.6-1 Oblique wing RPRV.

acquire stability and control data (Ref (9)). Three flights were made, and the wing was placed at angles
up to 450 . The same model airplane uplink system used in the early phases of the Minisniffer program
was used to control the vehicle; however, bigger electric actuators were required.
3.7 Drones for aerodynamic and structural testing
The drones for aerodynamic and structural testing (DAST) program was designed to test large-scale models of wings designed for high efficiency cruise in flight at transonic speeds in combination withexperimental flutter suppression systems. The high fuselage fineness ratio and supersonic capability ofthe Firebee II drone made an ideal testbed for these experimental wings. A Firebee 1I drone loaned toNASA by the Air Force was equipped with an experimental wing (Fig 3.7-1) at the NASA Langley ResearchCenter. The drone was modified at the NASA Dryden Flight Research Center to incorporate an RPRVflight control system in which the test pilot has direct control over the maneuvers performed with the air-craft. The DAST I wing has a Whitcomb supercritical airfoil section and incorporates small aileron-likesurfaces controlled by an electronic-hydraulic flutter suppression system. The DAST I vehicle is intendedto be flown beyond the flutter boundary of the wing in order to demonstrate the effectiveness of the fluttersuppression system. A parachute system is available to recover the aircraft in case of an unpredictedfailure of the wing.
- >IN
ECN 10968
Fig 3.7-1 DAST RPRV with experimental wing.
3.8 Highly maneuverable aircraft technology
The HiMAT project utilizes a 44 percent-scale model of a 7700 kilogram fighter. It has a wingspanof just over 4.6 meters and a length of 6.9 meters. It was designed to be air launched from a B-52 airplane,and it should be capable of speeds in excess of Mach 1.5. Two of the research vehicles have been built.
The HiMAT RPRV (Fig 3.8-1) is an experimental vehicle in which a synergistic approach is beingused to accelerate the development of a new fighter aircraft (Refs (10) to (12)). This approach involvescombining many new high-risk technologies into one vehicle to provide information on the interaction be-tween the systems. One of the technological advances incorporated in the HiMAT vehicle is the compositematerial used for approximately 30 percent of its construction. In addition to weight savings, the compositematerial allows the wings and canards to be aeroelastically tailored for increased maneuverability andperformance. Aeroelastic tailoring uses the unique directional properties of the graphite composite mate-rials to control bending and twisting under aerodynamic loading. In the process of manufacturing thecomposite, the fibers in the material are oriented in the direction that results in favorable wing twisting asaerodynamic loading increases. The HiMAT's composite wing can be compared roughly to a wood veneerthat is stiff in one direction but pliable in another. Under g stresses, the composite structure deformsenough to give the vehicle about 10 percent additional maneuvering capability, even in very tight turns
The HiMAT control system i,; of the digital fly-by-wire type, which is lighter in weight than a con-ventional control system. Pilot commands are fed via telemetry to an onboard computer, which sendselectronic commands to the flight control surfaces. Another technology being tested is an integrated pro-pulsion system. Instead of a conventional hydromechanical system, this system uses a digital computer tocontrol the aircraft's entire propulsion system. The HiMAT vehicle is powered by a J58 jet engine. Theresearch vehicle also incorporates active control technology that causes the flight control system to providethe aircraft's basic stability. Use of this technology saves weight and increaweq performance. since thesize of the stabilizing surfaces can be reduced.
One of the design requirements for the HiMAT vehicle was that no single failure should permit theloss of the vehicle. Because of this design philosophy, dual systems were incorporated throughout theaircraft. This applied to the microprocessor computers, hydraulic and electric systems, servoactuators,uplink receivers and antennas, downlink transmitters, and antennas.

8-10
ECN 12055
Fig 3.8-1 HiMAT RPRV after landing on dry lake.
3.9 F-86
Dryden has been participating in a joint program with the Federal Aviation Administration (FAA)to minimize or eliminate the hazard to small aircraft of encountering the wingtip vortices generated bylarge jet aircraft. In this program, an instrumented manned T-37 jet trainer at Dryden had been used toprobe the wake of a B-747 aircraft at altitude. It was deemed too dangerous to encounter these vorticesclose to the ground.
The Naval Weapons Center at China Lake was then asked to participate in tests using one of theirF-86 RPV's (Fig 3.9-1). The Navy had developed an RPV target system around surplus F-86 fighter air-craft, using a system very similar to the one used for the 3/8-scale F-15 system. A surplus F-86 groundsimulator is used in conjunction with a transmitted TV image, and the pilot controls the F-86 directly, withfull aerobatic maneuvering capability.
A flight test program was then developed in which the F-86 RPRV was used to probe the visiblewake of a B-747 (Fig 3.9-2) during landing and takeoff. Twenty-four encounters with B-747 wingtipvortices were made with the F-86 RPRV. The RPRV pilot prevented the F-86 from contacting the groundseveral times through his ability to respond quickly to aircraft upsets; the value of the RPRV techniquewas demonstrated through these tests alone, because the data could not have been acquired in any otherway.
ECN 12317
Fig 3. 9-1 F-86 RPV used to probe wtngtip vortices generated by B-747.

W8- I8-11
Fig 3.9-2 B-747 with wingtip vortices made visible by smoke generators.
4.0 RPRV OPERATIONAL FEATURES
Table 4.0-1 summarizes some of the operational features of the RPRV programs conducted at theDryden Flight Research Center. The ground cockpit with downlinked TV is the most popular piloting tech-nique. Piloting through visual contact with the radio-controlled airplane has been used only in small pro-grams, where low cost and simplitity are of primary importance.
Table 4.0-1 RPRV Operational Features
RPRV vehicle Launch technique Recovery technique Piloting technique
Big G Parawing Helicopter drop Gliding parachute Visual, stationary
Hyper III Helicopter tow Horizontal landing skids, Ground cockpit, visual,parachute backup stationary
PA-30 Horizontal takeoff Horizontal landing Ground cockpit (TV),safety pilot
3/8-scale F-15 B-52 drop MARS and horizontal Ground cockpit (TV)landing
Minisniffer Horizontal takeoff Horizontal landing Visual car chase,radar, TV
Oblique wing Horizontal takeoff Horizontal landing Ground cockpit (TV)
DAST B-52 drop MARS Ground cockpit. F-104 chase
HiMAT B-52 drop Horizontal landing Ground cockpit (TV),F- 104 chase, automatic
F-86 Horizontal takeoff Horizontal landing Ground cockpit (TV),T-33 chase
The B-52 airplane is the vehicle currently being used to launch RPRV aircraft at Dryden. Althoughit is much larger than necessary to carry RPRV's aloft, it has proven to be cost effective in the manner inwhich it is being used: a low launch frequency (one 2-hour flight per month for the DAST and HiMATprograms) reduces its operating costs to a small proportion of the total program operating cost.
The midair recovery system was used for the 3/8-scale F-15 and DAST RPRV's. This recoverytechnique was chosen because the Edwards Air Force Base 6514th Test Squadron was willing and able tofurnish a helicopter and crew to capture the RPRV's in the parachute MARS mode. A high degree of crewproficiency and skill is necessary to make consistently successful captures. The Air Force MARS crewmaintains proficiency by practicing with dummy payloads and by retrieving Air Force drones and cruisemissiles. It would not be cost effective for NASA to maintain such a capability for its limited number ofRPRV's.
5.0 SAFETY CONSIDERATIONS
Each RPRV program has its own set of circumstances and approaches to safety. There are somebasic guidelines that are consistently followed, however. The most fundamental of these is that the safetyof the people in the launch aircraft and on the ground has priority over the preservation of the RPRV.
The ground rules set up for a particular RPRV program may specify that the vehicle is expendableor semiexpendable. These guidelines are followed when the acquisition of data or flight results underconditions that put the vehicle at risk is considered more important than the loss of the vehicle. Underthese circumstances, if all of the data objectives are achieved in one flight and the vehicle crashes atthe end of the flight, the program is still considered successful. The ground rules set up for the obliquewing program were similar to this. However, all three planned flights were flown without vehicle los.

8-12
The ground rules for the oblique wing were set up in this way because personnel safety and dataobjectives did not require vehicle recovery and because the program's cost and time constraints did notpermit the precautions that would ensure the safety of the vehicle. Personnel safety could be ensuredbecause the oblique wing was flown within the airspace over Edwards Air Force Base, an airspace fromwhich commercial air traffic is excluded. Further, there are no homes or businesses in the region wherethe flight tests were conducted. The vehicle was at risk because it had no autopilot functions and wasbasically spirally unstable. It had no redundant systems whatsoever, not even a backup visual pilot incase the IFR pilot in the cockpit using downlink TV lost control of the vehicle. Thus, many system failureswould necessarily have resulted in a crash. However, as planned, the lack of redundancy permitted theflight test program to be conducted at low cost and in a timely manner.
In direct contrast, nothing was spared to avoid the loss of the HiMAT vehicle. The design philos-ophy for HiMAT was "No single failure shall cause the loss of the vehicle." This project ground rule,of course, did not take priority over personnel safety. The foremost safety concern in any of the B-52launch operations is the safety of the B-52 air crew in a possible collision between the RPRV and the B-52after launch. Launch dynamics are carefully analyzed for every air-launch vehicle. Much thought goesinto the operational schemes to ensure a clean launch, especially in the case of unstable vehicles, andprecautions vary from locking the controls to installing jettisonable RPRV nose ballast.
6.0 INSTRUMENT FLIGHT RULES PILOT TRAINING
6.1 Cockpit characteristics
For RPRV's, most vehicle control is done from a ground cockpit not unlike a ground-based simu-lator cockpit. The cockpit contains aircraft controls and IFR instruments that are tied into the RPRV througha data link and tracking system. Ground computers are used with the more sophisticated RPRV's(Fig 2.0-1). The cockpit is equipped with a TV screen only if horizontal takeoffs or landings are planned.
At Dryden, RPRV's are usually flown from cockpits located in the so-called RPRV facility, an areain the main building. However, on occasion cockpits have also been installed in vans or trailers near theflight testing in order to shorten the radio range for landing and takeoff operations. The Hyper III andoblique wing cockpits were portable and used at the remote landing sites (Fig 6.1-1).
E-21392
Fig 6.1-1 Portable outdoor Hyper III cockpit with IFR and visual pilots in place.
6.2 Ground support crew
A flight test engineer often sits next to the cockpit (Fig 6.2-1) to assist the pilot in reading check-lists, timing maneuvers, and setting up vehicle control configurations through the ground computersystems. Making up a third member of the team Is the flight controller in the Dryden control room. Theflight controller is in charge of the operation, and all of the operational information is available to him onplot boards, Including vehicle telemetry data and radar tracking information. The controller is always indirect contact with the RPRV pilot, by hard wire If the cockpit is in the RPRV facility or by radio If thecockpit is at a remote site.

8-13
ECN 10925
Fig 6.2-1 HiMAT RPRV cockpit with pilot and flight test engineerat flight stations.
6.3 Iron bird simulation
A simulator cockpit identical to the RPRV cockpit is used for pilot training. In the case of theHiMAT vehicle, the signals from the actual RPRV cockpit are fed into a general purpose simulation computer.At some times, signals are fed into the actual (full-scale) aircraft, which is sitting in an adjacent hangar.When the actual airplane is hooked into the simulation (iron bird simulation), the flight crew, pilot, flighttest engineer, and controller develop procedures and techniques for verifying aircraft computer softwareprograming before flight to detect possible system failures during flight.
6.4 Training for ground controlled approaches
The controller and sometimes the flight test engineer may assume the responsibilities of a groundcontrolled approach (GCA) controller to steer the pilot through a landing pattern. Many hours of prac-tice on the simulator involving the RPRV pilot, flight test engineer, and flight controller are necessary todevelop flight plans, practice research maneuvers, and develop emergency procedures.
7.0 VISUAL PILOT TRAINING
Radio-controlled model investigations have been conducted at the Dryden Flight Research Centerwith models weighing less than 18 kilograms for the preliminary investigation of advanced concepts(Refs (13) to (15)), but they were not considered RPRV projects in and of themselves. Radio-controlledmodels did play a major support role, however, in providing the visual pilot with training for the largerscale Hyper IllI and Minisniffer RPRV's. The so-called mother ship (Fig 7.0-1), a large 3 meter span model
E-18297
Fig 7.0-I Radio-controlled mother ship, a model used to launch experimental models and todevelop RPRV techniques.

8-14
airplane originally used to launch model lifting bodies, was equipped with a vertical gyro for pitch androll control, an airspeed indicator, and a radar beacon to develop control transfer techniques between thevisual pilot and the IFR pilot.
A second radio-controlled model, a 1/6-scale model of the Hyper HI that was weight scaled forspeed (body lengths per second), provided an excellent training aid for the visual pilot, who hadthe task of landing the relatively low lift-to-drag-ratio (L/D - 5), unpowered, 450 kilogram, 10.7 meterHyper IH RPRV.
A similar 40 percent-scale model was used for visual pilot training for the Minisniffer RPRV.
8.0 LESSONS LEARNED IN RPRV PROGRAMS
8.1 Program planning
By definition, the purpose of the RPRV's is to acquire experimental data. It is important that re-search engineers spell out the data objectives for the program in as much detail as possible early in theprogram. The vehicle design and program operational scheme should be selected that achieve theseobjectives in the moat cost effective way. Any revisions of the program to match available personnel,facilities, and funds should be made only after a preliminary vehicle design and operational scheme havebeen selected. This type of activity is also important in developing manned research aircraft. However,the impact on RPRV programs is greater because decisions on operational techniques (air launch versusground launch, parachute recovery versus horizontal landings, and so forth) are highly dependent onresearch objectives.
8.2 Flexibility: an advantage of RPRV programs
More easily than most flight testing, an RPRV flight test program can be tailored to match availablepersonnel, facilities. and funds. This is possible because one RPRV program may require only the sim-plest of vehicles (one that uses a drone-type control system, for example), whereas another RPRV pro-gram may require a much more elaborate vehicle, such as one with a control system that requires severalcontrol systems people, for the data objectives to be met. Almost every RPRV program at Dryden was anexperiment in operations and was designed to match the available operational personnel and equipment.
8.3 Staffinc
Assigning an operations engineer and crew chief early in the vehicle design phase prevents theloss of much time later in the program. These are the people who must make the vehicle work later, andthey will make sure it will if they are able to make their needs known early in the vehicle design phase.This is true for any research aircraft, but it is no less important for RPRV's.
8.4 Simulation: a vital tool in RPRV programs
Because the IFR RPRV pilot lacks the motion cues, visibility cues, and sound cues that a test pilotsitting in a manned aircraft cockpit enjoys, he must work much harder to extract information from the cock-pit instruments. Simulation is vital to RPRV programs for both systems development and pilot training.The more complex an RPRV is, the more simulation time is necessary. RPRV flights are usually planned insuch a way as to extract as much data as possible from each flight because of the higher risk of vehicle loss.As a consequence, every minute of flight time is used to produce as much data as possible during the flight.Precise training for the maneuvers on a simulator is necessary to give this data return.
A small RPRV program such as that for the Minisniffer made use of a very simple and minimal sim-ulation. However, the simulation proved to be very valuable in developing the wings-leveler yaw-dampingsystem and in providing pilot training. Pilot training was especially important in that only a turn-rate andairspeed indicator could be used in yaw-damper-off data maneuvers.
8.5 Advantages of modular approach
Probably the most time-consuming effort in an RPRV program is the design, development, andground testing of the special or newly developed systems required due to the small size of the RPRV. Ifknown systems can be used, a structure can be sized and designed to utilize them much more quickly thanif special systems must be developed to fit a particular structure. (The minimum size of the structure of amanned vehicle Is dictated by the cockpit and life support systems.) A good analogy is wind tunnel testing.The wind tunnel itself, the wind tunnel measuring systems, and the data reduction systems are to windtunnel personnel what already established RPRV module systems are to flight test personnel. The air-craft structure Is analogous to wind tunnel test models.
Building an RPRV that has all-new systems as well as a new structure is similar to building a newwind tunnel test facility as well as a wind tunnel test model. The time necessary to accomplish the taskincreases accordingly.
8.6 The synergistic approach
The HiMAT is the RPRV in which the synergistic approach has been used. As of this writing, threeflights have been conducted with the HiMAT vehicle. More flights must be made before the full potential ofthe concept can be demonstrated, with all systems working together to result in greater vehicle performancethan can be provided by the sum of the individual systems.
9.0 ADVANTAGES AND DISADVANTAGES OF RPRV'S
In recommending the RPRV approach to a flight test program, it is easy to list the advantages of theapproach over manned flight testing, such as the ability to take higher risks in flight and to eliminate man-rating tests. The RPRV approach has the potential for reducing costs. In the real world, however, some

8-15
of these benefits may fail to materialize. For example, many systems actually become manrated because ofthe danger cf collison with manned launch aircraft and the fear of losing the RPRV.
The advantages and disadvantages of the RPRV approach to flight testing may be summarized as
follows.
9.1 Potential advantages
The potential advantages of the RPRV approach are lower program cost because of smaller vehiclesize, the elimination of manrated tests, and the elimination of life-support systems. Further, higherrisks can be taken in RPRV's than in manned aircraft.
9.2 Disadvantages
The disadvantages of the RPRV approach are as follows. Higher program costs and time delays areoften experienced as a result of the need to develop special miniature systems to fit into the limited space ofthe small aircraft. The limited space in small aircraft requires systems to be stacked, making work accessduring flight operations difficult. As program planning proceeds, very often extra redundancy or operatingrestrictions are imposed to ensure the safety of the people on the ground and in the launch aircraft. Theup- and downlink communications are vulnerable to outside radio interference, which jeopardizes missionsuccess. A large operational effort is required for crew training, the operation of tracking ranges andsafety chase aircraft, and the preparation of the RPRV g'ound facility for each flight. In addition, line-of-sight range limitations restrict high-speed RPRV operations.
The successful operation of an RPRV requires a highly disciplined operational team and sometimesa very elaborate operational network. Many manhours must be expended in training exercises, dry runs,and briefings to ensure successful operation. As a result, the operational cost per flight of an RPRV canand very often does exceed that for an equivalent manned aircraft. However, if high data output per flightcan be planned and if risk restrictions can be relaxed, RPRV operations can be cost effective.
REFERENCES
(1) Reed, R. Dale, RPRV's: The First and Future Flights, Astronaut. & Aeronaut., Vol. 12, no.4,Apr. 1974, pp. 26-42.
(2) Plattner, C. M., Flexible-Wing Recovery System Set for Unmanned Trials, Aviation Week a SpaceTechnology, Vol. 90, no. 6, Feb. 10, 1969, pp. 56-58.
(3) Reed, Robert D., and Thompson, Milton 0., Simulation Techniques Applied to Free-Flight Testing,Presented May 1970 at ISA 16th National Symposium, Seattle, Wash. (Available from NASA DrydenFlight Research Center Library, Edwards, Calif. 93523).
(4) Edwards, John W., and Deets, Dwain A., NASA, Development of a Remote Digital AugmentationSystem and Application to a Remotely Piloted Research Vehicle, 1975, NASA TN D-7941.
(5) Layton, Garrison P., A New Experimental Flight Research Technique: The Remotely Piloted Air-plane, Apr. 1976, AGARD-CP-187, pp. 13-1-13-7.
(6) Holleman, Euclid C., NASA, Summary of Flight Tests To Determine the Spin and ControllabilityCharacteristics of a Remotely Piloted, Large-Scale (3/8) Fighter Airplane Model, 1976, NASATN D-8052.
(7) Iliff, Kenneth W., Maine, Richard E., and Shafer, Mary F., NASA, Subsonic Stability and ControlDerivatives for an Unpowered, Remotely Piloted 3/8-Scale F-15 Airplane Model Obtained FromFlight Test, 1976, NASA TN D-8136.
(8) Reed, R. Dale, High-Flying Mini-Sniffer RPV: Mars Bound?, Astronaut. & Aeronaut., Vol. 16,no. 6, June 1978, pp. 26-39.
(9) Maine, Richard E., NASA, Aerodynamic Derivatives for an Oblique Wing Aircraft Estimated FromFlight Data by Using a Maximum Likelihood Technique, 1978, NASA TP-1336.
(10) Myers, Albert, Simulation Use in the Development and Validation of HiMAT Flight Software,Aug. 1979, AGARD-CP-272, pp. 24-1-24-12.
(11) Peterson, Kevin L., Flight Control Systems Development of Highly Maneuverable Aircraft Tech-nology (HiMAT) Vehicle, Aug. 1979, AIAA Paper 79-1789.
(12) Price, M. A., NASA, HIMAT Structural Development Design Methodology, 1979, NASA CR-144886.
(13) Reed, Robert D., Flight Testing of Advanced Spacecraft Recovery Concepts Using the Aero-modeler's Approach, Mar. 1968, AIAA Paper 68-242.
(14) Reed, Robert D., Can The RC'er Contribute To Aeronautical Research?, R/C Modeler Magazine,Vol. 5, no. 10, Oct. 1968, pp. 29-35.
(15) Gee, Shu W., and Brown, Samuel R., NASA, Flight Tests of a Radio-Controlled Airplane ModelWith a Free-Wing, Free-Canard Configuration, 1978, NASA TM-72853.

9-I
QUALITATIVE ARMAMENT SUBSYSTEM ASSESSMENT
byLAURENCE P. COLBURN6510 TEST WING/TEEES
EDWARDS AFB, CALIFORNIA, U.S.A. 93523
SUMMARY
Extensive and highly quantitative test and analysis is normally accomplished duringthe development of a weapon system. A qualitative system assessment is most appropriatefor an Air Force contemplating purchase of a developed weapon system in providing first-hand knowledge of the system capabilities and evaluation of these capabilities againstoperational needs. This paper addresses a qualitative approach to armament subsystemtest, the objectives which can be achieved and analysis methods for the major aircraftweapon subsystems. A substantial amount of information may be gathered to evaluate aweapon system without extensive or sophisticated instrumentation. Minimal aircraft andweapon range instrumentation requirements are detailed in the paper. Air-to-ground weapondelivery particularily lends itself to a quantitative statistical analysis for comparisonto accuracy demonstrated in development and to that of other similar aircraft. Detail ofthis more quantitative analysis is included as appendix material.
INTRODUCTION
All major armament subsystems lend themselves to qualitative test and evaluation.This encompasses air-to-ground bombing in both visual and automatic modes, air-to-groundand air-to-air gunnery and missile subsystems. Aside from the major area of interest inweapon delivery accuracy and capability; supporting technical data, ground equipment,weapon loading techniques and aircraft turnaround for weapon sorties should be examined.
As mentioned earlier, a qualitative assessment of weapon delivery capability must bepreceded by quantitative development test and evaluation. This phase of testing producessubstantial amounts of data and documentation which should be thoroughly reviewed andunderstood prior to attempting qualitative assessment (references 1, 2, and 3). Specificdocuments for review include complete technical and operating handbooks for the aircraftand its subsystems, evaluation reports prepared by the airframe contractor and reportsprepared by the original Air Force customer. These Air Force reports should include bothimplementing (or procuring) command (Air Force Systems Command in the U.S. Air Force) aswell as operating command technical evaluations. The primary objectives of this reviewallow:
1. Understanding of how the weapon subsystems were designed to operate includingprimary modes, degraded (or backup) modes and any airspeed/altitude or g limitingenvelopes.
2. Determination of problems encountered during development and corrections appliedto resolve them.
3. Determination of specification compliance including any shortfalls. Previouslyencountered problems or specification shortfalls might prove to be valid indica-tors of where qualitative tests might be concentrated for optimum evaluation.
4. Selection of weapon delivery profiles from previous operating command evaluationsand current operational procedures. These could form a baseline to which incountryoperating profiles could be added for complete subsystem evaluation.
Two primary objectives which can be accomplished in a qualitative evaluation arepilots or aircrewmembers' analysis of system employment and numerical analysis and compari-son of weapon delivery accuracy to a specification or to performance of another aircraft.Information on system maintainability, reliability and supporting equipment is also avail-able to the evaluators as a byproduct of the primary test objectives.
General test procedures begin with selection of weapons and delivery profiles for theevaluation. Ground tests, including careful boresighting and alignment, are accomplishedper the manufacturers' recommendations. Weapons may be delivered with samplings through-out the operating envelopes; however, concentration should be made of a select few condi-tions for statistical significance.
INSTRUMENTATION
Aircraft
Instrumentation requirements are few and may be kept simple. The primary requirementis for photorecording of the aircraft Head-up Display (HUD). This system is often includedas a part of the operational equipment. If not, a suitable camera system should be in-stalled by the airframe manufacturer prior to test. Weapon release/firing event should be

9-2
indicated on the HUD by a flag or light visible in the film frame. Care must be taken toinsure that the difference in time between weapon release/firing and appearance of eventon the HUD is known and is consistent. A known difference in time may be corrected forduring data analysis. Beware of signal processing which is routed through an onboard com-puter. This can result in a variable, and therefore unknown, time delay depending uponcomputer workload. The best method is to provide a direct signal from the trigger/bombbutton to the HUD electronics.
Time must be allowed for the HUD camera to attain operating speed before weapon release.This can be accomplished by pilot activation of a camera power switch during run-in. Someaircraft provide a two-detent trigger. Camera power is applied at the first detent andweapon firing occurs at the second detent as the trigger is pulled through. Camera framerates may vary from 24 to 48 frames per second depending on magazine capacity, ease ofchanging magazines in flight, and mission duration. Higher frames rates are preferred forthe greater accuracy in release/firing picture presented.
The following aircraft parameters should be recorded at weapon release: dive angle,airspeed, altitude, and load factor. This data may be available from the HUD and recordedon the HUD camera. It may be recorded by an over-the-shoulder camera photographing thecockpit instrument panel with a time reference to allow correlation with the weapon releaseevent.
Weapon Range
A weapons delivery range should have level, cleared terrain for target areas. Bombingtargets should have clearly visible concentric circles; one-hundred feet radii to four-hundred feet should be adequate. Two spotting towers with simple transits allow observersto identify bomb impacts in sequence for later miss-distance measurement. Impacts from thetarget center may be measured in x and y coordinates by survey transits or by chainingfrom the target center.
Strafe runs may be accomplished against 6 x 6 meters (20 x 20 feet) panel targetssupported by telephone-type poles. Provisions should be made to position the panels per-pendicular to the attacking flightpath. Angles of 10, 15, and 30 degrees are typical. Caremust be taken to establish these targets in a soft soil or plowed area to minimize ricochetpotential. The area should be maintained to remove spent projectiles or any hard objectswhich could result in ricochet occurance. Sufficient targets should be provided to permitone firing pass per panel. Scoring can be accomplished manually through measurement of xand y impact distance from the target center.
Wind direction and velocity must be measured as closely as possible to the range areaand proximate to the time of the mission. Standard weather balloon with transit trackingis adequate to record wind direction and velocity from the target area through the alti-tude of the delivery profile. This data is provided to the pilot for preflight correc-tions in manual bombing and is used in error analysis discussed subsequently.
Tracking radar is a useful tool in analysis of the aircraft parameters at weaponrelease/firing. It is not; however, a requirement. Tracking radar, used with a beacon-augmented aircraft, can provide sufficiently accurate data for determination of grosspositioning errors.
An extended treatment of range instrumentation may be found in AGARD-AG-219, "RangeInstrumentation, Weapon System Testing and Related Techniques".
TEST AND EVALUATION
Ground Tests
Mass properties (weight, center of gravity, and moments of inertia) of weapons to bedropped must be measured. Moment of inertia in the yaw axis is most convenient to measureand may be assumed equal to pitch inertia for symmetrical weapons. Mass properties arecompared to the weapon specification to assure that the units are within allowable limits.Visual inspection of fins should also be accomplished to assure that gross bending or mis-alignment is not present. Practice bombs do not normally require mass measurements sincemanufacturing tolerances will insure production within these limits. Fin alignment shouldbe determined within specification by use of a template. Care in mass property/alignmentchecks will allow rejection of out-of-tolerance weapons which could mask true weapon sys-tem performance through introduction of large dispersion errors.
The loading of weapons onto the aircraft allows the opportunity to evaluate the ade-quacy of the loading checklists and compatibility of loading equipment. After load crewsbecome proficient, timing required to reconfigure the aircraft with a load of weapons maybe determined for rapid turnaround considerations. Ease of arming wire installation andpreflight fuzing procedures may also be evaluated.
Careful alignment of rocket dispensers and HUD/gun harmonization is a vital precursorto any evaluation of these weapons. The airframe manufacturer should provide alignmentfixtures, boards, and detailed technical manuals to accomplish these tasks. The entiregun system including feed mechanism should be carefully inspected prior to harmonization.

9-3
Most U.S. aircraft gun systems are designed such that the projectiles and the pipperimage will be coincident at 686 meters (2,250 feet). The term "boresighting" refers tosighting through the gun barrel to establish the aiming point on the target. "Harmoniza-tion" is the process of correlating the gun aim point and the gunsight alignment such thatthe projectiles and the sight line will be coincident at 686 meters and the bullets willimpact the target. Procedures and target layouts are contained in the aircraft technicalorder.
Dry (nonfiring) boresighting is most easily accomplished using a target (Appendix B,figure 1) located 25.4 meters (1,000 inches) in front of the aircraft. The fuselage refer-ence line is aligned with the "Post" reference using sighting fixtures provided by themanufacturer. The target, mounted on a fixture moveable in azimuth and elevation, ispositioned to achieve this alignment. This establishes the proper relationship betweenthe target and the aircraft. The gun is then aligned so that the bore scope (inserted inthe gun barrel) is aimed at the gun circle cross. For the Gatling type gun, each bore-sight barrel is rotated into firing position and sighting position noted as each will varysomewhat. All barrels should aim within the circle (size determined by the particular gunspecification). The combining glass is removed from the cockpit mounted gunsight and anaiming fixture bolted into place. Crosshairs in this scope are aligned on the "sight omil" mark for the zero mil depression setting. The combining glass is then replaced andchecked for pipper alignment at the reference mark.
Dry harmonization will indicate a satisfactory gun/sight alignment; however, wet harmo-nization (firing) provides a higher degree of assurance that the system is, in fact, proper-ly aligned and delivering bullets in the correct geometrical relationships to system aiming.This requires more elaborate support capability. A structure must be available to containthe spent projectiles and support the harmonization target (similar to the 1,000-inchtarget - but larger). The aircraft is jacked and tied down securely to provide a stablegun platform, normally at a distance of 304 meters (1,000 feet) from the target. Thealignment procedure is accomplished as previously discussed. The gun is then fired usingground hydraulic/electrical power as required; bullets should impact at the "impact" ref-erence with a dispersion not exceeding specifications (5 mils may be typical) for the gununder test. Wet harmonization will assure proper alignment and further reveal any errorsdue to barrel wear or gun dynamics. Harmonization should be accomplished periodically(i.e., beginning, midpoint, and end) during the test program to evaluate the capability ofthe system to maintain alignment under use. Alignment should also be verified whenevererrors are encountered which cannot be attributed to other factors (i.e., delivery error,wind, etc).
It is also important at this time to boresight the gunsight/HUD camera. A bore scopeis normally provided which is installed in the camera mounting to align the unit. Areference for camera boresight should be marked on the target. The camera is then runwith the pipper visually fixed on a target reference. This will provide assurance thatthe camera photographs the pipper at the same location as viewed by the pilot; this maynot always be the case. Any discrepancy between the viewed and photographed pipper mustbe corrected or the difference accounted for during the error analysis.
Aircrew Training
Sufficient flights must be planned to allow thorough familiarization of the pilots/crewembers with aircraft handling qualities and operation of the weapon delivery sub-systems in all modes of operation. Allowances should be made to include pilots with a .
variety of skill levels representative of the population to evaluate the system. It doeslittle good to procure a weapon system which only a few of the highest skill level per-sonnel can operate. When accomplishing delivery sortiese however, the number of pilotsparticipating for data should be minimized to reduce scatter in data through variances inproficiency. Aircrew participants should have a variety of experience in other similaraircraft to allow comparison of the system under test with other tactical aircraft.
Air-to-Ground Bombing
A review of technical reports prepared by the original Air Force customer operationalcommand will provide the best source of delivery profiles for the test program. Utiliza-tion of these profiles will result in a selection which has proven optimum for the systemunder test and will provide a baseline for comparison of incountry results. Any uniquecustomer profiles may also be selected for evaluation. Weapons selected should also dupli-cate those previously tested to provide a basis for comparison. Use of "customer nation"weapons complicates an evaluation in that they must undergo extensive flutter, structural,separation, and ballistic quantitative test/analysis prior to use. It may generally beassumed that these weapons could be successfully integrated into the weapon system shouldit finally be procured. Practice weapons are suitable to demonstrate the proper function-ing of a weapon system fire control subsystem or accuracy of a ballistic handbook. How-ever, actual inert-ballasted operational weapons should also be used to allow verificationof their ballistics, weapon separation, proper arming, and loading checklists. Live ord-nance may be used; however, this introduces difficulty in scoring of impacts and additionalsafety considerations in weapon handling. It adds little value to the evaluation as theweapon blast characteristics and fragment lethality envelopes are usually well known.
Selection of bombing modes to be evaluated merits some close attention. Modern tacti-cal aircraft normally offer a wide selection of weapon delivery modes ranging from manual

9-4
(ballistic table) to automatic modes such as Continuously Computed Impact Point, Continu-ously Computed Optimum Release, Offset Bombing and Beacon Bombing. Automatic modes areusually capable of degraded operation as primary sensors become inoperative and secondary(less accurate) sensors are used for aircraft state input. Evaluation of all of the poten-tial modes with all available weapons would require an extensive test program. Selectionof the modes/weapons to be evaluated should be limited based on a review of developmenttest reports and the needs of the customer Air Force.
Conduct of the air-to-ground bombing tests consists of delivering the weapons selectedfrom the profiles and delivery modes of primary interest. The weapon impacts are scored inx (range) and y (azimuth) coordinates from the target center. HUD film is analyzed todetermine any aiming errors at weapon release. Onboard data is reviewed to determine anygross deviation from planned release conditions. Ground radar data may be used, if avail-able, to aid in this error analysis. These procedures will allow deletion of data fromimpacts resulting from gross pilot delivery errors or fire control system malfunctions.The data may also be used to factor out delivery errors induced by aiming to compute sta-tistical measures of system error (i.e., that error which excludes operator and windeffects). Most aircraft ballistic tables contain the data necessary to accomplish thistype of error analysis. A statistical treatment of impact data forms the core of theevaluation.
This phase of weapons accuracy testing cannot be accomplished prior to geometry veri-fication of a manual system or ballistic/functional verification of a weapon computing sys-tem. Any problems or errors inherent in the weapon delivery system must be solved; it isgenerally meaningless to expend weapons for a statistical analysis when a system has knowndeficiencies.
The following basic terms used in statistical analysis of weapons accuracy aredefined:
Mean Impact Point (MIP) : The geometric center of the weapon impact pattern as deter-mined by the arithmetic mean of the x (range) and y (azimuth) weapon impacts from the tar-get center. The MIP is useful primarily as a measure of weapon system bias. A "perfect"syst'em would deliver weapons in a pattern in which the MIP and target center would becoincident.
Circular Error Probable (CEP): The radial distance from the origin describing a cir-cle containing 50 percent of weapon impacts. The implication is that, of additional weaponsdropped from like delivery conditions, 50 percent would fall within the CEP computed fromthe original tests. Confidence limits can be applied to more clearly define CEP. CEPabout the MIP is a measure of system dispersion while MIP location with respect to thetarget describes system accuracy.
Circular Error Average (CEA): The arithmetic mean of radial distances of bombs fromthe target center. This statistic gives a feeling for "average" error of bombs actuallydropped during a test. It therefore, has limited value in describing or predicting weaponsystem accuracy on a long term basis.
There are many other statistical definitions which may be useful in describingweapon accuracy, but these are the primary ones.
It is most important in statistical analysis to compute a statistic only on comparableitems. Different delivery modes and profiles can produce widely varying accuracies. Forexample, high angle dive bombing is less accurate than lower angle dive delivery in themanual mode. Impacts from both profiles should not be grouped into a single CEP; the CEPshould be computed for each profile. CEP from manual dive bombing and automatic deliveryweapon impacts should not be computed as a group. In general, compute separate CEP's forseparate modes, profiles and weapons. This will provide a numerical comparison for evalu-ation of effectiveness. A good general breakdown for dive bombing would be low angle (0degrees - 30 degrees) and high angle (30 degrees - 60 degrees). The selection of compara-tive groups, will of course, depend on the individual system and the test objectives.
Sequential ratio techniques provide a means of determining if CEP of a weapon systemunder test meets a specified, or goal, CEP while limiting the number of weapon releasesrequired to reach a decision point. Risks of accepting a bad system or of rejecting a goodone must be assumed; however, the capability to evaluate a system with a relatively smallnumber of samples makes this an attractive approach. The CEP statistic may be used tocompare the system under test to a specification, performance of other similar aircraft,or related to predicted lethality for specific weapons. Detailed discussion of and samplecalculations for CEP, MIP, normality of distribution, and sequential ratio techniques isincluded as Appendix A.
The pilot/aircrew can provide a substantial input to system evaluation for the air-to-ground delivery modes. Ease of tracking, clarity of weapon system controls and displays,accessability of switches and general cockpit layout are examples of interest for aircrewevaluation. A qualitative comparison with other tactical aircraft in use by the "customer"nation provides an excellent baseline for these judgements. .... ..

9-5
Air-to-Ground Gunnery
Profile selection again may best be made from review of evaluations conducted by theoriginal Air Force customer operational command. Conduct of the flight tests and instru-mentation usage is similar to that previously addressed under air-to-ground bombing. Pro-files should be planned to allow tracking to the ground panel target after firing with guncamera operating. This will allow viewing of the impacts, assuming the range surfacegenerates a visual impact dust cloud, to determine any gross misses of the target panel.Statistical presentation of bullet impacts may be computed as discussed in Appendix A forbombing. However, a simple computation of percent hits on a given pass normally providessufficient data for comparison to previous results and a measure of system lethality/effect.Rounds fired per pass may be determined by a rounds counter, if available. Some gun systemsare mechanized such that sections of spent brass may be counted during ammunition down loadand correlated with firing passes to determine shots fired. Target practice or ball ammuni-tion is normally used for test due to lower costs and handling safety over armor-piercingincendiary or high explosive rounds. Scoring results should be identical. Tracer roundsmay be used for a visual aid in review of gun camera film; however, care must be taken withregard to potential range fires which thcy may ignite. Aircrew evaluation of tracking andtime on the target forms a valuable portion of these tests.
Air-to-Air Gunnery
Selection of the tow target is of primary importance in conducting air-to-air gunneryevaluation. The target should have maneuver capability consistent with the test aircraftfiring envelope to allow evaluation under demanding attack profiles. A scoring system isalmost a "must" for reasonable recording of hits or near misses. Dart towed targets andtowed banners may be used as nonscorable targets. The FIGAT fiberglass tow target providesa large profile available with a scoring system, but is costly with a demonstrated low rateof survival. The SECAPEM 901B tow target with SFENA MAE-15 acoustical scorer has been usedwith some success in gunnery evaluations. Targets may be flown in standard racetrack,figure 8, butterfly, or combat Dart patterns depending on desired shooter firing condi-tions. Tests should begin with benign low range, load factor, and angle off conditionsand proceed to more demanding target/shooter ranges and geometeries to fully evaluate sys-tem capability. Analysis of HUD film will reveal target tracking capability and firingopportunity durations. Hits per pass or passes on which hits are made are recorded toprovide comparisons with earlier results and some measure of system operational effective-ness. Pilot evaluation forms a very important part of this test phase covering aircrafthandling and tracking characteristics, HUD display clarity, utility and overall comparisonof gunsight effectiveness with other systems.
Air-to-Air Missiles
Qualitative evaluation of missile performance is a most difficult area of assessment.Costs can be substantial, both for the missiles themdelves, and for the operation of thetarget drones required. If missiles are fired with live warheads, the probability of tar-get destruction increases with attendant cost of replacement. If inert warheads are usedto lower the probability of target destruction, costly range and telemetry instrumentationare required to evaluate missile/target proximity and warhead function. The most practicalapproach starts with a comprehensive review of Development Test and Evaluation reports ofinstrumented missile performance. Test missiles with active seekers, inert motors, andinert warheads may be carried captive against aircraft targets. This will allow a quali-tative evaluation of missile/aircraft system interface up to actual launch and provide alook at missile capability to acquire and maintain sensor track with the target throughoutthe published envelope.
Heat-seeking missiles may be evaluated, to a limited degree, by firing at a flare-augmented target rocket. Five-inch high velocity aerial rockets may be used for this pur-pose, fired from the shooter or a test support aircraft. This allows a qualitative evalua-tion of the airframe/missile interface and allows the pilot to survey seeker side tone.However the augmented target bears no relation to actual aircraft infrared signature andthereby precludes realistic weapon evaluation. It does provide an opportunity for pilotfamiliarization and training.
Radar guided missile evaluation offers no low-cost means of live firing but requiresthe use of target drones and attendant telemetry and range capabilities.
CONCLUSIONS
A qualitative evaluation of the armament subsystem can provide the basis for deter-mining the operational effectiveness and suitability of the system for procurement. Inten-sive investigation and review of Development Test and Evaluation technical data are requiredto augment these tests. This data also provide a comparative baseline on which judgementscan be made of qualitative test results and system utility. Unique customer weapon deliveryprofiles and tactics may be accomplished to evaluate weapon system compatibility with in-tended usage.
I

9-6
REFERENCES
1. AGARD-AG-219, Range Instrumentation, Weapons System Testing and Related Techniques.
2. AGAD-CP-223, Flight Test Techniques.
3.* AGARD Flight Mechanics Panel Symposium on Subsystem Testing/Flight Test Instrumentationto be held in Gilo, Norway in October 1980. (Proceedings available spring 1981).
4. *CRC Handbook of Tables for Probability and Statisticsl', Chemical Rubber PublishingCompany, 2nd Edition.

9-7
APPENDIX A
STATISTICAL ANALYSIS
There are many formulae for CEP computation. The following formula is the exactmathematical representation of CEP as defined and has been found to be most suitable forweapon accuracy analysis:
-2 2-
0.5 = 1 x 2 + d d
x - LCEPT ] =
Where: SX = standard deviation in range
S = standard deviation in azimuthY
= KIP location in range
= KIP location in azimuth
xi = impact distance in range
Yi = impact distance in azimuth
This equation is based on the bivariate normal distribution and provides accurateresults, but requires substantial computer time for solution. The following formulae areapproximations of the double integral and have proven sufficiently accurate for practicaluse when computing CEP about the KIP:
IF: Sx - Sy and Sx/S - 0.28
CEP = 0.562 Sy + 0.615 sxy yS
IF: SX > Sy and S ,/S x 0.28
CEP = 0.615 Sy + 0.562 sx
IF NEITHER OF THE ABOVE APPLIES:
CEP = 0.5887 (Sx + Sx y
These formulae are for a bivariate normal distribution about the mean in range andazimuth. The bivariate normal means that we are dealing with two separate normal distri-butions; one in range and one in azimuth. This is the usual distribution encountered inweapon delivery where impacts are more widely distributed in range than in azimuth. A nor-mal distribution cannot be assumed, but must be verified before these formulae are used.The verification process is described later in the Appendix.
To compute CEP about the MIP, the following applies:
Sx2 1 1_T Z (x 1 -2=fS 2 1 xi)
y ---r (YjY-
and:
xn
Yi
Where: n m number of weapons (impacts)

9-8
For example, see figure A-1 and the sample weapon impacts numbered 1 through 10.These impacts translate into the following range and azimuth errors:
Bomb No. xi (feet) Yi (feet) sign Convention
1 -100 0 + x long
2 -45 +20 - x short
3 -10 +40 + y right of target
4 0 +30 - y left of target
5 +40 0
6 +95 +20
7 +100 -20
8 0 -30
9 0 -50
10 -40 -20
*11 +210 +121
*12 -190 -75
* For later reference
To compute the SIP coordinates:
xi 100-45-10+0+40+95+100+0+0-40 +
n 10
and:
ryi 0+20+40+30+0+20-20-30-50-20n 10
These parameters describe the location of the MIP. To compute:
Sx2= 1 - )2
S -r E (xiX)2
1 (-100-4)2 + (-45-4)2 + (-10-4)2 + (0-4) 2 + (40-4)2 + (95-4)2
+ (100 4)2 + (0-4)2 + (0 4)2 + (140 4)2
1 (-104)2 + (-49)2 + (14)2 + (-4)2 + (36)2 + (91)2 + (96)2 + (-4)2
+ (-4)2 + (-44)2
- 10816 + 2401 + 196 + 16 + 1296 + 8281 + 9216 + 16 + 16 + 1936
- (34190)
S x 3798.9
Sx -61.6

9-9
In a similar manners
S2 1
- . (7490)
s 2 . 832.2
S - 28.9y
Since Sx (61.6) > Sy (28.9) and Sx (2.9) = 0.47, which is > 0.28
17.8 + x I6.6CEP = 0.615 Sy + 0.562 Sx = 0.615 (28.9) + 0.562 (61.6)
= 17.8 + 34.6
CEP = 52.4 feet about the MIP (16 meters).
Let's look at the effect on CEP by doubling the number of bombs but maintaining thesame distribution (i.e., 10 more bombs in the same holes as the first 10). This will givea concept 3n the quantity of bombs alone as it effects CEP value.
E (xi-x) = 34,190 (2) = 68,3801
S2 = 1 (68,380) = 3599
Sx = 60
- 2E (yi-y) = 7,490 (2) = 14,9801
S = 2_- (14,980) = 788.4y I
Sy = 28.08
Since Sx > Sy and Sy/S x =0.47 which is > 0.28
CEP = 0.615 Sy + 0.562 Sx = 0.615 (28.08) + 0.562 (60)
CEP = 17.27 + 33.72 = 51.0 feet (15.5 meters)
By the same method with 100 bombs, CEP = 49.8 feet (15.2 meters) and with 1,000 bombs,CEP = 49.7 feet (15.1 meters).
This is an idealized situation but it illustrates the point that with a good system/good distribution, CEP will change little with larger sample size if the additional pointsare from the original distribution.
Now let's look at the effect on CEP produced by two outlying impacts. In addition tothe original 10 bombs, consider bombs 11 and 12 (figure A-l). Computing CEP for the 12bombs yieldst
CEP = 88.1 feet (26.9 meters)

9-10
This compares to a CEP of 52.4 feet (16 meters) for the original and illustrates theprofound effect the outlyers have on a small sample. Looking at the effect of adding thesetwo outlyers to the original 100 bomb sample yields:
CEP - 55.2 feet (16.8 meters)
This compares to original CEP of 49.8 feet (15.2 meters). This illustrates the valueof a large sample in minimizing the influence of a few "wild bomb" data points.
CEP about the MIP may or may not bear a significant relationship to the primary poinzof interest, namely the target. For example, weapons may be delivered in a very tight pat-tern (low CEP about the MIP) but impact 304 meters (1,000 feet) beyond the target due toinertial groundspeed error. In this case, weapon system accuracy could be described bycomputing CEP about the MIP and the location of the MIP in relation,to the target. If theinertial error were subsequently corrected, allowing delivery about the target, the originalbiased impacts could be computed about the corrected KIP for an expanded data base. Inour example, where target center and MIP were nearly coincident, CEP about both target andMIP would be identical for practical purposes.
In the preceding computations for the maximum likelihood estimates of CEP about theMIP, it was assumed that a bivariate normal distribution existed for the weapon impacts.The distribution must, in fact, be normal for the CEP computations illustrated to be valid.The Kolmogorov-Smirnov (referred to as K-S) test may be used to evaluate the data for nor-mality (tables A-1 and A-2). Normality must be determined for both x (range) and y(azimuth). Table A-1 illustrates the method for the x variable about the KIP. The tenimpacts are rank-ordered (i) from largest negative (short) to largest positive (long) and
X. - Xvalues (xi). The xi - x and -x columns are computed using the previously calculated
values, x - +4 and S = 61.6. Succeeding columns are computed as illustrated. The K-S testis implemented by sefection of a significance level at the sample level (n) and comparing
the largest value of - F ( ). Table A-1 shows this value to be 0.22 for ournSxexample. The following critical values were extracted from reference 4, page 426.
Sample Size Significance Level
(n) 0.20 0.15 0.10 0.05 0.0110 0.32z 0.342 0.36U 0.409 0.468-
Since 0.22 is less than any of the critical values, our distribution has a 20 percent or
X. - xgreater probability of being normal. If the largest value of - F ( - ) had been 0.?68
n Sxwe would have been "10 parcent sure" that our sample distribution were normal. The selec-tion of significance level in this process is judgemental. The same procedure for theazimuth distribution (table A-2) shows a maximum value of 0.15 which is also less than thecritical values, verifying normality in the y-direction. The CEP computation about theMIP is therefore, valid for our sample.
Failure to meet normality in either range or azimuth invalidates the CEP computationas accomplished. CEP can be calculated for other than normally distributed impacts usingnonparametric or unassumed common form of probability distribution function. However, thelack of normal weapon impacts about the target usually results from system error or bias.This should be corrected, since computing CEP for a malfunctioning system has little or nomeaning.

9-11
Table A-1
K-S TEST RANGE IMPACTS
xi x x - x i F (x )No. i x1i xii " S x S x n -
Nox1 n-xF -F
1 1 -100 -96 -1.56 0.0594 0.10 0.04
2 2 -45 -41 -0.67 0.2514 0.20 -0.05
10 3 -40 -36 -0.58 0.2810 0.30 0.02
3 4 -10 -6 -0.10 0.4602 0.40 -0.06
4 5 0 -4 -0.06 0.4761 0.50 0.02
8 6 0 -4 -0.06 0.4761 0.60 0.12
9 7 0 -4 -0.06 0.4761 0.70 0.22
5 8 +40 +36 +0.58 0.7190 0.80 0.08
6 9 +95 +91 +1.48 0.9306 0.90 -0.03
7 10 +100 +96 +1.56 0.0406 1.00 0.06
X. xWhereF( -) = F (x) as found in normal distribution tables starting on Page 127 inxx. - Xreference 4. (Use 1 - F (x) for negative S values).
- Sx
= +4
S = 61.6x
Table A-2
K-S TEST AZIMUTH IMPACTS
yi- y Yi-y i yF -Fi -F
No. i Yi Yi S
9 1 -50 -49 -1.70 0.0446 0.10 0.06
8 2 -30 -29 -1.00 0.1587 0.20 0.04
10 3 -20 -19 -0.66 0.2546 0.30 0.05
7 4 -20 -19 -0.66 0.2546 0.40 0.15
5 5 0 +1 +0.03 0.5120- 0.50 -0.01
1 6 0 +1 +0.03 0.5120 0.60 0.09
2 7 +20 +21 +0.73 0.7673 0.70 -0.07
6 8 +20 +21 +0.73 0.7673 0.80 0.03
4 9 +30 +31 +1.07 0.8577 0.90 0.04
3 10 +40 +41 +1.42 0.9222 1.00 0.08
1. Note on table A-i applies
y= -1
S - 28.9y

9-12
The sequential ratio test provides a method for determining if a bombing system meets,or fails to meet, a predetermined specification while limiting the number of weapons to bedropped. There's a price to pay in terms of "risk". The risks involve accepting a badsystem or rejecting a good one. Figure A-2 illustrates a typical sequential ratio testwhich we have adopted for use when none is specified or contracted. It represents areasonable balance between risk and sample size. The seller's (or contractor's) risk hasbeen chosen at 10 percent and is termed alpha. This means that the seller has agreed to a10 percent chance that the test will reject a system which meets specification. The buyer's(Air Force) risk (beta) has also been identified as 10 percent. The buyer has therebyassumed a 10 percent chance of the test accepting a system which does not meet specifica-tion. The discrimination ratio (lambda) describes a bad system in terms of a good one.In our example, a lambda of 1.4 means that if the specified CEP were 30.5 meters (100feet), we would accept a 42.7 meter (140 feet) CEP as having met acceptance criteria.These risks are, of course, variables and must be agreed to prior to accomplishing thetest. Buyer and seller may agree on unequal risk levels and discrimination ratio may bechosen as desired. The effects of varying risks will be presented later.
The boundaries of figure A-2 are computed as follows:
Solution of this expression with variable sample size describes the upper curve.
,2-0 n-ln-l
describes the lower curve where:
22l-0, n-l
is extracted from the Chi-square tables for selected 8 and n values
2Xa, n-l
is extracted from the Chi-square tables for selected a and n values.
X is the discrimination ratio of 1.4
a is the seller's risk of 0.10
B is the buyer's risk of 0.10
n is the sample size (number of bombs used in the CEP computation).
These boundaries define "accept", "reject", and "continue testing" regions.
Figure A-3 shows the effects of variation in a, 8, X and curves 2 and 4 illustratewhat happens with a change in buyer and seller risks while the discrimination ratio isheld constant. The maximum decision point moves from 35 samples when five percent risksare assumed to 22 sample with 10 percent risk assumption. This shows a substantial changein the number of tests required for decision with not a really big change in risk. Whilenot shown on the figure, a differential buyer/seller risk would close down the appropriatedecision area while increasing the maximum sample required. For example, if the seller'srisk on curve 1 were dropped five percent the upper curve would move up, closing down the"accept" area, opening the "continue testing" area and increasing the maximum decisionsample. Comparison of curves 1, 2, and 3 illustrates the effect of varying discrimina-tion ratio while buyer/seller risk are held constant. As discrimination ratio increasesthe accept area enlarges and maximum decision sample drops. This is as expected, sinceby increasing discrimination ratio, we are willing to call a larger CEP "good" withrespect to the specified CEP.
The test is accomplished by conducting a weapon delivery mission in the desiredprofile/mode. One weapon is delivered on target on each pass. The number of weapons permission will depend on the type of weapon and suspension equipment. For example, if theaircraft carries one SUU-20 training dispenser (six bomb loading), it would be logical toexpend six BDU-33 practice bombs on the first mission. It takes at least four weapons toreach any decision for the test as we have set it up.
The measured impacts for the first four bombs would be used to compute CEP as pre-viously discussed. This CEP would be divided by the specified CEP and the result plottedon the sequential ratio graph. If the CEP ratio fell within the "continue testing" region,a C3P for the first five bombs would be computed and plotted. The process continues onebomb at a time in the sequence of delivery until the "accept" or "reject" region isentered. The teat stops then. If, for example, the CEP ratio enters the "reject" region

9-13
on the 19th bomb and you have already dropped 24 bombs - stop. Do not keep computing tothe 24th bomb to see if you can get out of the "reject" zone. This would invalidate thetest. The risks are assumed for this purpose: to limit the number of samples. A goodsystem may have been rejected, but that's the risk involved in the sample-limitingapproach.
Bombs may be eliminated from the computation for large errors if there is a valid
cause external to the system under test. Some valid reasons might be:
The pilot inadvertently aimed at the wrong target.
The bomb momentarily hung on the rack and then released.
An input subsystem for automatic delivery failed.
These are just some examples; each instance would have to be judged on the merits.The important thing is not to eliminate impacts because "they're too far out". This sameselection process is equally applicable to the CEP computations previously discussed.

9-14
y_____________________ I CONTAINS 50 PERCENT BOMBS
75 1229.) - COMPUTED CEP (20 BOMBS112 Is COMPUTED CEP (10 BOWS)I
.10 5FEET O-X~i0 20 - IIm I 1+0
75 122.9ml- +
200 161.)l 100 (30.5.) 0 100 (30.5m) 200 (61.)
FEET
Films A-i Weapon Impact Distribution
0.6.
0.A6 010
1.0-COMPUTED CNIU
CEP/SPECIFIED CEPTEIN1.2-
1.4-RJC
1.6-0 4 8 12 16 20 24 26 32
SAMPLE SIZE
Figure A-2 Sequential Ratio Test

9-15
.41. ALPHA = 0.10 a ALPHA =0.10BETA = 0.10 BETA = 0.10
0.6- LAMBDA = 1.4 LAMBDA = 1.62. ALPHA =0.10 4. ALPHA =0.05
BETA = 0.10 BETA = 0.05
0.8- LAMBDA =1.5 LAMBDA =1.5
COMPUTED 1.0- CNIU2CEP/SPECIFIED CEPTEIN3
1.2-
1.4REJECT
1.6-
1.8-0 4 8 1'2 A' 12 2
SAMPLE SIZE
Figure A-3 Parameter Variation in Sequential Ratio

9-16
APPENIDIX B
FIGURES
*IMPACTPOST+
GUN
Figure 1 Typical Boresiglit Target

'0-I
ELECTRO-MAGNETIC COMPATIBILITYby
Henry MaidmentAEROPLANE AND ARMAMENT EXPERIMENTAL ESTABLISHMENT
Boscombe DownSalisburySP4 oJF
UK
SUMMARY
The wider use of electronic circuits in modern aircraft and their extension into critical areas ofengine and flight control systems, have increased the dangers of malfunction due to electromagneticinterference, and highlighted the importance of tests that demonstrate the adequacy of the EMC standardachieved.
This Paper reviews the historical background to the growth in problems of EMC in UK MilitaryAircraft, and discusses the present approach for minimising these problems during development. Theimportance of using representative aircraft for final EMC assessments is stressed, and the methods ofapproach in planning and executing such tests are also outlined. Some of the limitations of present testtechniques are also discussed.
INTRODUCTION
Twenty years ago, interference problems were largely confined to radio and radar systems, andreceived little attention from aircraft manufacturers beyond the fairly elementary requirements for bonding,suppression, and isolation of armament circuits. The introduction of semi-conductor technology encouragedthe use of electronic circuits in many more aircraft systems, and the effects of interference became morewidespread and serious, particularly in critical electronic control systems affecting flight safety, andit became apparent that the contractual responsibilities and design requirements and guides for EMC wereinadequate. A state of EMC in aircraft is still far from assured at the design stage, in spite ofimprovements in the various design specifications and guides available, and the importance of followingthrough good E4C design practise by thorough development tests of the complete aircraft has beenrecognised for the past decade.
Most systems in modern aircraft now employ electronic control loops, in analogue or digital form,that are potentially susceptible to Radio Frequency Interference (RFI). Long signal lines interconnectingsensors and control amplifiers are the most common means of coupling unwanted interference fields intothese systems, and a variety of effects have been observed in electrical generation, engine and fuel,flight control, inertial and gyro platforms and weapon systems. Some of these effects can have seriousconsequences, particularly in flight and engine control behaviour, weapons and explosives. Spuriousdeflections or corruption of readings can occur on various flight instruments now that most flight datadisplays are electronically driven. Head-up and Head-down multi-function CRT displays are particularlyprone to interference through their inter-connections to various sub-systems and sensors. By their nature,intercom systems and RF receivers are orders more sensitive to certain frequencies than most otherelectronic circuits, and the rejection of unwanted interference has always presented special problems inthe congested aircraft environment. Interference with communications or radars have usually been self-evident to the user, often no more than a transient nuisance factor. However, some intereferences canhave a greater consequence when automatic signal processing is used, especially where the intereferencesource is continuous; resulting in reduced range performance, and spurious or corrupted signals that arenot always self-evident.
The effects of interference generated by on-board systems are generally the most significant, butexternally generated fields cannot be neglected, where the susceptibility of electrically detonatedexplosive devices have always posed particular problems (1), and more recently, flight control systems.For on-board sources, HF communications transmitters cause most general interference, followed by UHF,where the trFnd towards higher power transmitters have aggravated the problems. The effects of other on-board sources, such as electrical generation systems, motors, actuators, de-icers, and circuit breakersare usually most evident in RF receivers, but large inductive transients can cause nuisance trips or shutdown of other systems. The existence of high power RF installations on ships, airfields or elsewhere, canaffect performance up to take-off and aircraft flying at low altitude, and during various aircraftdevelopment programmes there have been examples of flight control and other disturbances when flying nearship and land based transmitters. In the UK, at A&AEE, we have a facility for simulating the externalenvironment, which at present is capable of generating the fields shown in Table 1.

10-2
FREQUENCY MAX: FIELD TRANSMITTER CHARACTERISTICSBAND STRENGTH AVERAGE PEAK PRF
MHz STYPE POLARISATION POWER KW POWER MW (pps)
0.2-0.525 300 V/m CW Linear 0.4 - -
0.525-32 300 V/m CW Linear 30 - MODn
32-200 10 W/m2
OW Linear 1.0 - MODn
200-225 40 W/m2
Pulse Linear 0.9 0.45 250
225-400 20 W/m2
CW Linear 0.1 - MODn
400-430 6 W/m2
CW Linear 0.015 - MODn
300 W/m2
Pulse Linear 1.6 1.4 800/267
1120 800 W/m2
Circular 3.38 2.25 300to
5850 200 W/m2
Pulse Linear 1.5 1.0 1500
300 W/m2
Pulse Circular 1.5 1.0 300
5850 1000 W/m2
CW Circular 1.4 - -
to14000 200 W/m
2 Pulse Circular 0.56 0.75 1500
TABLE 1 A&AEE RADIO ENVIRONMENT GENERATOR FACILITIES
DEVELOPMENT
UK aircraft contracts require EMC to be considered at the design stage and followed up by thoroughdevelopment testing of systems in the laboratory, and on the aircraft. This is achieved in a mannersimilar to that followed in the USA (2). Each project generates its own EMC Control Document definingthe administrative and design practises, the specifications for the emission and susceptibilitycnaracteristics of equipment, and the test methods and procedures to be followed.
Laboratory or Test House measurements are performed on all equipments in accordance with the require-ments specified in the 194C Control Document. The current trend for critical equipment, is to introducemore requirements to test susceptibility of signal lines and to raise field intensity levels beyond thosegenerally specified (3, 4). In cases where safety is of prime concern, the trend is also to raise testlevels until the thresholds for faulty operation are determined. Laboratory results give confidenceregarding the potential EMC integrity of the design and provide data that assists in the derivation oftest schedules for the complete aircraft.
Avionics Systems development rigs are usually of limited value for EMC assessments, because they donot normally have the representative lay-out and screening properties of the aircraft. More recently theyare being used to provide development insight into potential EMC problems, by obtaining spectral sig-natures of radiated fields, and revealing additional potential susceptibilities of the inter-connectedsystems, when irradiated.
Prototype aircraft used during development usually differ in significant detail from productionaircraft in wiring and additions for instrumentation, and in the use of development standard equipments;they are nevertheless more representative than rigs. Ground test programmes are necessary for safetyclearance for flight, and to provide further development opportunity for enhancing the EMC status of thedesign.
A.ESSMD4T
In a fully developed aircraft the logical choice for a full EMC assessment is a production aircraftof the same standard as that delivered to the user. For new aircraft being introduced in Service, thisoften means tnat the assessment takes place some time after the initial deliveries, when aircraft havebeen upgraded to a definitive standard. The development programme is relied on for evidence regarding theEC integrity in the interim period. Where doubts exist in areas of safety, limited, but thorough testsare performed prior to tne delivery schedule. In this case any deviations or concessions to thedefinitive standard need to be carefully examined, and are acceptable only if their relevance to ENC canbe confidently predicted. Subsequent changes to in-Service aircraft in the form of modifications orimprovements are considered for their effect on EMC, and the requirement for reassessment reviewedperiodically, in the manner shown in Table 2.

10-3
SYSTEMSFLIGHT CRITICAL
HAS RF YE NO DO LIMITED |EVA RNME T l T ET
CHANGE ? O AME LIT O PROGRAMME
ESCRATICAL SYSTEMS
YS CHANGED LOW
SCONSIDER
SAIRCRAFT RISKSREPRESENTATIVE NO INVOLVED
PROVIDE d9 HIGH
YES REPRESENTATIVE
AIRCRAFT
TEST CLEARANCE *-PROGRAMME UPDATE
fl FULLCLEARANCEUPDATE
TABLE 2 EMC ASSESSMENT PROGRMME DECISION CHART
CATEGORISATION
The depth of testing depends on the EMC categorisation of systems according to the expectedconsequences of interference, recognising that this can depend on the severity of the interference.Categorisation in the UK is broadly similar to that used in the US (2) and is:-
a Category i - Degradation of performance that could lead directly to an accident or loss ofoperational effectiveness.
b It ii - Degradation of performance that could contribute to an accident or reduceoperational effectiveness.
c it iii - Degradation of performance that results only in annoyance or minor discomfort,,or in minor loss of effectiveness.
Systems are grouped into the areas relating to armament, flight control and mission avionics, andcategorised according to the potential seriousness of their malfunction.
"Armament", covers all weapons and explosive devices, detonators, ejectors and initiators, and allcontrol systems for release and jettison. Proven methods are available for determining the safety marginsin detonator circuits, and techniques for establishing similar criteria for semi-conductor control logic,now used in some armament circuits, are evolving. "Flight control" covers systems such as auto-stabillserand auto-pilot, engine, fuel, electrical generation and flight instrument systems, where certain testsneed to determine adequate margins of safety; as for armament systems. "Mission avionics" covers broadlythe remaining systems of tnis nature in the aircraft. Some, such as communications and navigation sub-systems may be vital to mission success, and performance margins may need to be determined, in others theeffects of interference may be less serious.
A typical categorisation may appear as shown in the Table.
ARMAMENT FLIGHT MISSION MISC
0I " c "SYTEMS AIRF YTS A zRSTO
0 H0 z
4 z :M H MOZH " E4 F4
CATIWDORY I:': HJ Z~ E-4H
TABLE 3 AIRCRAFT SYSTEMS CATEflORISATION

10-4
The table shows the highest level that applies to a system; some systems have fUnctional modes thatlie in more than one area, or carry lower categorisation, and these are identified by considering thefunctional modes during the preparation of the test schedules.
TEST SCHEDULES
EMC test schedules are based on the operation of all potential interference sources and theobservation of their effect on the various functional modes of the aircraft systems. For on-boardsources this could be achieved by permutating all modes and channels of all systems, each item acting inturn as a potential emitter and susceptor. However, to produce a manageable programme of tests, aselective approach is needed. Interaction matrices assist in identifying the test requirements. Table 4illustrates the first step in reducing the number of tests.
C4
SASMA MEMITTERSUSCEPTOR
WEAPON SELECTION * SS* S* *S
BOMBS* S*
ARMAMENT MISSILES ** *** *. .*
EJECTORS *** ** *
INITIATORS *
ELECTRICAL GENERATION * **ENGINE CONTROL & PROTECTION * * S
FUEL CONTROL *
STABILITY AUGMENTATION *
AUTOPILOT SS S**S S*
READ UP DISPLAY * * *HEAD DOWN DISPLAY ** *
CONTROL STALL WARNINGCENTRAL WARNING . ,* *
NOSEWHEEL STEERFLIGHT INSTRUMENTS * *ILS *TERRAIN FOLLOW * * *RADAR ALTIMETER * * IT ** 11
MISSION COMPUTER 5* 5* * * *
INERTIAL NAV ** 5 * 5
DOPPLER * * S
MAPPING RADAR ** *
LASER RANGE FINDER ** * * *MULTIFUNCTION DISPLAY***** *S ** **
MISSION HF COMMS * * * * * * *UIF COMMS * *INTERCOM * * * * * * * *WARNING RECEIVER * * * * * * *TACAN * * * * * *
IFF * * * * **MISSION RECORDER * ;
TABLE 4 EMC INTERACTION MATRIX
For each interaction identified, further matrices can oe used to specify the particular modes ofeach sub-system and depth of test required, according to its categorisation. The intersections on thismatrix contain the reference to the appropriate section of the schedule that would detail the tests to beperformed. Knowledge gained from the general development flight test programme is used to modify thecontent of the schedules, according to the accumulated experience of compatibility between regularly usedsub-systems and their susceptibilities. During flight development, many observations of system mal-functions not of immediate interest at the time may have relevance to EMC, and need to be considered byEMC specialists. Some mission systems, such as HF communications and counter-measure receivers are usedinfrequently in the development flight programme, and rarely in association with other mission systems asin an operational context, so these aspects need particular attention during EMC tests. Most transmitterreceivers have multi-channel capability, and predictive methods (5) can be used to determine potentialinterference frequencies, and Test House and rig results of emission and susceptibility spectra can be ofassistance in selecting the more probable conditions for tests. Currently, predictive methods fordetermining interference paths cannot be relied upon, because of the uncertainty that surrounds thecoupling mechanisms that occur in practice. An example of the prediction procedure is given in theAppendix.
The operating conditions of each functional mode require study in order to determine the appropriateconditions for observing the effect of potential interference. For some receiving systems it is necessaryto provide test signals in order to check for de-sensitiaation or corruption of output. In controlsystems, checks are made for the existence of undemanded outputs, eg control surface deflections, or losof control functions. In digital systems, test programs are loaded to monitor voltage levels on signalinputs and parity error rates, and operational programs are checked for corruption. Critical systemsrequire methods that provide for a quantitative measure of the margins of safety or performance available

rIO.S
(6) to provide for uncertainties regarding in-Service degradation. Qualitative judgements of aural, ordisplayed interference are usually adequate for systems that have no immediate safety or critical missionconsequences. The importance of any interference observed is related to its severity and duration, as wellas its consequence. The results of test may require reassessment of the original categorisation, eg if asource of interference can override UHF communications, this may be considered critical to flight safety;whereas transient interference may be judged as nuisance factor only.
AIRCRAFT FOR ASSESSMENT
It is known that interference problems vary from aircraft to aircraft of the same type, and areinfluenced by variations in performance of individual equipments. In the UK, importance is attached tothe need for careful preparation of the aircraft used for EMC assesment, so that the results are relatedto a known standard of performance. This can help in identifying the reason for any EMC differencesbetween aircraft.
In preparing an aircraft for assessment, systematic checks of aircraft equipment and antenna bondingare performed, and antenna system VSWR and loss are measured. The serviceability of equipments are care-fully checked before installing, using standard schedules. Transmitters are measured for spectral contentand output power, and where possible, upper tolerance samples are selected. Receivers are checked forsensitivity, and local oscillator harmonic radiation.
TEST PROGRAMME
The main EMC test programme is performed on an open site and is usually divided into three phases.The first phase is conducted using external supplies to operate the aircraft systems, and detailed testsperformed. The second phase comprises tests of the engine systems, and other critical systems operatingfrom normal flight power sources. The third phase consists of tests in the simulated external environmentat A&AEE. There are shortcomings in the use of an open site in tests of on-board transmitters due toground reflection paths. Experience has shown that this aggravates interference problems, but does notmask them. A limited flight test programme follows ground tests in order to confirm the presence ofcritical interference mechanisms observed during the preceding ground tests. In some systems, it is notpractical to stimulate the required dynamic operating conditions on the ground, and tests can only beperformed in flight.
The results of EMC tests are judged by A&AEE on the basis of the safety and performance marginsavailable, or severity of malfunctions observed, when recommending the need for modifications to eliminateserious defects, or the requirement to avoid incompatible transmissions or mode selections, if these havelittle operational significance.
CONCLUSIONS
The present equipment qualification procedures are based on assumptions regarding the electro-magneticfields present within the airframe, and the nature of the coupling mechanisms. These cannot be measuredwith any certainty in representative aircraft. Thus EMC assessments rely on practical tests. Avionicssystems critical to flight safety, and systems vital to mission effectiveness require test methods thatprovide a measure of the safety and performance margins available; to account for variations that occur inproduction and Service use. Some proven methods are available, notably for detonator circuits, but inmost other areas further work is required. Encouraging progress has been made in the use of currentprobes for the measurement of interfering signals on critical signal lines, in conjunction with complemen-tary Test House procedures, as a means for obtaining the safety margins required in flight and enginecontrol systems. Performance margins for mission systems using digital techniques are difficult todetermine, and there is a need for improved test techniques.
The present EMC qualification tests for equipment in the laboratory do not guarantee freedom frominterference when installed, and the results are limited in val'e for correlating with aircraft tests.Thus there is a need to evolve equipment design and qualification procedures that pay more attention tothe effect of interference on signal lines, and the use of test conditions that can be related to easily
performed measurements in the aircraft.
REFERENCES
1 MOD Ordnance Board (UK) 1972 "Principles of design and use for electrical circuits incorporatingexplosive components"
2 US Dept of Defense (DOD) 1968 "Electromagnetic compatibility requirements, systems" MilitaryStandard MIL-L-6051D(1).
3 US Dept of Defense (DOD) 1971 "Electromagnetic Interference characteristics, measurement of"Military Standard MIL-STD-462, Change 3.
4 British Standards Institution (BSI) 1973 "General Requirements for equipment for use in aircraft"3G.100:Part 4; Section 2.
5 Don White Consultants Inc: (USA) 1972 "Handbook series on electromagnetic interference andcompatibility". Vol 5 Edition 1.
6 G M Smith. 1978 "The determination of margins of safety for critical aircraft systems".IERE EMC CP39. IERE, 99 Gower Street, London WCi1.
Copyright ) Controller HMSO London 19WO

-6
APPENDIXFRIUENCY PREDICTION
These are based on the relationship between a transmitter frequency and its harmonics, with the sus-ceptibility of a tuned receiver due to its spurious responses; as derived from the following relationships:
ftx - - n.L01 -e !2 2(1)
= frx' P'frx (2)
P
= IF (3)pwhere: ftx = Transmitter fundamental frequency.
f rx = Receiver tuned frequency.
LO1 = Receiver 2nt local oscillator frequency.
LO2 = Receiver 2nd local oscillator frequency.
IF2 = 2nd intermediate frequency.
n,m,p, = harmonic integers.
An example of this prediction procedure is given for the case of an airborne TACAN transmitterinterfering with a typical double superhet UHF receiver, and the 37 relationships that may exist at fourtuned frequencies in the band are shown in the Table.
f LO IF TACAN +nL0 +mLO TESTrf 1 L02 2 ftx CHANNEL -L1 2 IF2 NO
236.1 210.0 27.95 1.85 1048.15 24 5 0 -1 151051.85 28 5 0 1 191076.1 52 5 1 -1 31079.8 56 5 1 1 91104.05 80 5 2 -1 311107.75 84 5 2 1 331132.0 108 5 3 -1 351135.7 112 5 3 1 3/
243.0 206.7 34.45 1031.65 08 5 0 -1 141035.35 11 5 0 1 181066. 42 5 1 -1 4lo69.8 46 5 1 1 81100.55 77 5 2 -1 301104.25 80 5 2 1 321135.0 111 5 3 -1 341135.0 il 6 -3 -1 261138.7 115 5 3 1 361138.7 115 6 -3 1 29
309.1 280.0 30.95 1025.3 01 4 -3 -1 251029.0 05 4 -3 1 281056.25 32 4 -2 -1 211059.95 36 4 -2 1 231087.2 63 4 -1 -1 61090.9 67 4 -1 1 111118.15 94 4 0 -1 131121.85 98 4 0 1 171149.1 125 4 1 -1 2
395.8 370.0 27.65 1025.2 01 3 -3 -1 24
1028.9 05 3 -3 1 271052.85 29 3 -2 -1 201056-55 33 3 -2 1 221080.5 57 3 -1 -1 51084.2 60 3 -1 1 101108.15 84 3 0 -1 121111.85 88 3 0 1 161135.8 112 3 1 -1 11139.5 116 3 1 1 7
TABLE Al INTERFERENCE PREDICTIONS, 'TACAN TO UHF
The last column indicates the most probable order of likelihood of an interference. A practicalschedule of tests would consist of a test sequence 1,5,7,10,12 and 20, for the highest UHF frequencychosen. From the results of these initial tests, the harmonic and image (IF) response characteristicsshown to be susceptible, can be checked at the other receiver frequencies, and in this way the number ofindividual observations are reduced from 37 to typically 10 or 12. Note that there are no relationshipsfor equations 2 and 3 in the example given.

I I-
CHECKING OF COMMUNICATIONSAND RADIO NAVIGATION SYSTEMS
byHenry Maidment
Aeroplane and Armament Experimental EstablishmentBoscomoe Down
SalisburySP4 OJF
UK
SUMMARY
Limited assessments need to take account of variations in ground station performance, and uncertaintyregarding radio wave propagation conditions. Antenna performance can vary markedly in different aircraftto affect the radial coverage of all systems, or the accuracy achieved by Direction Finding Equipment.Aircraft transmitting antenna characteristics can be quantified for a relatively modest outlay on ground-station equipment, and subjective communications quality assessments can be enhanced by using suitable yetinexpensive voice recorders that are also useful for noting observed navigation data for subsequentanalysis.
An accompanying aircraft of known performance can provide a comparative basis for the assessment ofrange performance and provide the means for checking air to air modes. Test objectives should be relatedto the intended operational use of the aircraft, but need to be interpreted into schedules for use overstandard test routes, that have the widest application for all classes of aircraft. An example is givenof a possible schedule of tests and the form of analysis that might apply.
INTRODUCTION
All communications and Radio-Navigation Aids rely on the characteristics of radio wave propagationand the ground station for the way in which they perform at any time from one' station to another, and theextent by which a flight test Engineqr can account for these variables, determiines the credibility of hisassessment. Tne subject of radio wave propagation is complex (1), but I will attempt to summarise thecharacteristics for the frequency band 10 KHz to 1 GHz, within which most of the commonly used militaryComma and Nav systems operate, because an appreciation is essential for anyone considering flight testingof these systems.
At low frequencies, up to 2 MHz, ground wave mode of propogation is predominant, strongly influencedby the conductivity of the soil or water. From 2 to 30 MHz 'sky-wave' is the major mode, propagating viathe ionosphere. 'Sky-wave' mode is very dependent on frequency, according to diurnal and seasonalinfluences and sunspot activity, that affects the ionosphere. Above 30 MHz, direct wave, or 'lane ofsight' mode predominates, which is horizon limited, but less dependent on diurnal or seasonal effects,although subject to anomalous propagation due primarily to variations of refractive index of the atmosphere,associated with temperature inversions, commonly referred to as "ducting" which can cause a loss or in-crease in range according to tne height flown. From about 100 KHz to 10 MHz, ground and sky wave pathscan interfere to cause severe fading, whereas above this frequency, and sometimes up to as high as 100 MHz,sky wave does not overlap, but can propagate for long distances. The losses in the 'diffraction' mode ofpropagation beyond line of sight, increase with frequency and vary according to terrain profile.Associated with propagation losses are the sources of noise that determine the minimum usable signal.Below about 100 MHz atmospheric sources of noise, or man-made noise generated within the aircraft, orresulting from overflying industrial areas may degrade receiver performance. Above this frequency theusable signal is normally dependent on the receiver noise threshold alone.
COMMUNICATIONS
Most military communications systems operate either in the HF/SSB/AM (2-30 MHz), the Tactical VHF/FM(30-76 MHz), or the V-UHF/AM bands (118-136, 225-400 MHz). HF is used in long range aircraft for communi-cations up to about 2,500 nm using norizontally polarised antennas and depends primarily on sky-wave modeof propagation, which require the use of frequency prediction charts (2) to determine the optimum workingfrequency. HF is also used for close support aircraft to exploit the short range ground-wave mode ofpropagation, which is less affected by beyond line of sight losses in rugged terrain. Satisfactory per-formance for this mode of pro~agation requires vertically polarised antennas of good efficiency at lowfrequencies, and few aircraft antennas meet these requirements (3). Tactical VHF equipment is frequentlyused for the same role for communications in relatively flat or gently rolling terrain. The performancebeyond line of sight is very dependent on terrain characteristics and antenna and equipment performance onthe ground and in the aircraft. Most military aircraft are fitted with VHF for communication with civilair traffic authorities, and UHF for military use. Limited propagation beyond line of sight is feasible(4) but is not normally exploited in military applications.
RADIO-NAV AIDS
The most commonly used Nav Aids are summarised in Table 1:

11-2
Type Designation Frequency Coverage Accuracy Error Sources
Bearing MF/DF 100 KHz-2 MHz 30-500 nm + 2* to Aircraft Antenna Location,Only ± 5' Propagation
UHF/DF 225-400 MHz Line of Sight + 5 ° Aircraft Antenna Location
HOMERS 30-400 MHz Line of Sight ± 50 to Aircraft Antenna and+ 150 Ground Station Location
Range and TACAN 960-1215 MHz 200 nm or t 10, Ground Beacon CalibrationBearing Line of Sight 0.2 nm
VOR/DME 118-136 MHz 200 nm or 10, Ground Beacon Calibration(VOR) Line of Sight 0.2 nm960-1215(DIE)
Hyperbolic OMEGA 10-13 KHz Worldwide + I to User Interpretation. Pro-Position ± 3 nm pagation. Antenna Noise
LORAN-C 100 KHz 550-15.0O nm _ 0.5 to User Interpretation. Sky± 10 nm wave Propagation
DECCA 70-130 YHz 250 nm + 0.25 to User Interpretation. Sky
+ 5 nm wave Propagation
TABLE 1 RADIO NAVIGATION AIDS - TYPICAL PARAMETERS
MF/DF 'Radio Compass' equipments are generally used in areas not served by ouher relatively inexpen-sive aids. Their accuracies are very dependent on aircraft antenna location, and the care exercised indetermining errors and inserting the corrections applicable to each installation. Individual MF/DF beacontransmissions are subject to propagation anomalies that can cause large errors in apparent direction overland/sea paths or complex geological strata. UHF/DF accuracy is also very dependent on the aircraft D/Fantenna location and aircraft attitude with respect to the sight-line, such that air-to-air D/F errors mayd-ffer from the air-to-ground case. Tactical VHF homers are used for various applications in close supporthelicopters, and UHF homers in search and rescue, air-to-air rendezvous, or supply dropping in other air-craft. Homers are also very dependent on antenna location for their performance.
TACAN is the most widely fitted position aid in military aircraft, and Figure 1 shows the dispositionof the principal European beacons, derived from the RAF en-route supplements (5). The rated coverage ofbeacons is dependent on geographic location, co-channel interference, and aircraft height. The accuracyof modern airborne equipment is typically better than 0.2 nm in range. Bearing accuracy is very dependenton beacon calibration, which has been known to be in error by as much as 30 (6). Range measurements fromtwo beacons are capable of providing one of the most accurate Nay fix±ng techniques available. VOR/DMEhas very similar characteristics to TACAN, primarily for use on civil air routes. The hyperbolic aidsprovide better low altitude coverage than TACAN, but are more susceptible to propagation path errors. Theyare very dependent on operator interpretation and receiver ambiguity resolving characteristics for theaccuracies attainable in practice, particularly in the sky wave interference region. Decca is capable ofhigh accuracy when used with care (7), and provides coverage in northern and western European areas.Loran-C has a wider coverage as shown in Figure 2, but is primarily intended for over sea routes, andappears to be less well documented in terms of accuracies attainable for aircraft use in the areas con-cerned (8). Omega is the least influenced by propagation, except during the hours of sunrise and sunset,by virtue of the redundancy available from the overlapping and worldwide coverage of the ground stations.
PROBLEM AREAS
Aircraft communications installations frequently fail to achieve optimum performance, because of mis-match between headsets and transmitter/receivers. Correct matching of impedance and sensitivity of mic-tels are usually achieved in a customised manner within the Communications Control System (CCS) of eachaircraft. The choice of headset plays an important role in communications performance according to itsacoustic noise attenuation or rejection properties. Microphone signals can overdrive CCS amplifiers ortranamitters, introducing distortion if incorrectly matched, or under conditions of high acoustic noise.Voice operated switches and various automatic modulation control devices vary in their ability to compen-sate for the shortcomings and are often incapable of functioning satisfactorily over the flight enveloperange of acoustic noise, or user speech levels. Failure to optimise CCS interfaces can also lead to lossof communications range due to under modulation of transmitters, and excessive sidetone levelb can pro-duce a similar effect. Changes in volume between services, or distracting crosstalk, and electricalinterference from other aircraft systems are also commonly met shortcomings in aircraft installation.
I have already mentioned some of the problems associated with the siting of antenna systems, and it israrely possible to satisfy the often competing requirements of all systems, given the constraints imposedby aircraft shape, size and aerodynamic requirements. However, the selection of antenna location does notalways match operational priorities for system usage. The choice of antenna can influence the efficiencyattainable in terms of signal loss, and hence range, particularly below 10 MHz. Loop antennas are oftenmore effective than capacitance antennas for frequencies below about 1 MHz, as they are less susceptibleto aircraft static noise in cases where wick dischargers are not fitted, or are ineffective. Incorrectmounting or bonding of antennas, or excessive attenuation in feeder systems are frequent sources of perfor-mance loss and a contributory factor in electromagnetic interference; these problems often arise throughinadequate design consideration of the installation requirements, or the result of subsequent in-Service

11-3
degradation due to corrosion, fluid contamination or chafing, - easily overlooked if adequate means ofaccess for inspection and testing has not been provided. Poor frequency accuracy or drift; long and shortterm stability of transmitter power, and variation in receiver sensitivity across the frequency band, arealso common sources of performance variation, which are sometime aggravated by the thermal environment inflight.
TRIALS FACILITIES AND REQUIREMENTS
Before I describe the minimum facilities required for checking aircraft Comma and Nay systems, I willbriefly outline those used in the UK for this purpose. Most systems are evaluated in Laboratory aircraftsuch as the Comet, Figure 3 and using Groundstation equipment as shown in Figure 4. Advantage is taken ofthe relative ease by which comparative or absolute tests of different systems can be made in the Comet,using on-line computing and recording facilities, and on-board and external datum aids. The on-boardnavigation datum aids include Decca, two-range Tacan, twin Loran-C and Inertial systems, high and lowaltitude Radio Altimeters, a Doppler DR system and vertical cameras; in conjunction with precision groundtracking radars, syncnronised with airborne records, by air-ground UHF links. In this manner, the intrin-sic equipment characteristics can be determined in more representative conditions than on the ground,leaving the in-flight assessment of operational aircraft to concentrate on the installation dependentaspects of systems, with the aid of the ground station facilities.
The A&AEE ground stAtion antenna farm is shown in Figure 4a. The V/UHF tower is of interest becausethe disposition of the dipole antennas at various heights is according to the test frequencies used, sothat each antenna is approximately 10 wavelengths above mean ground level. The coincidence of the verticallobe patterns provide a common basis for assessing signal strength during range assessments, and allow theuse of one height for measurement of several polar diagrams at different frequencies. The predictions ofthe theoretical performance shown in Figure 5 are based on simple ray theory modification of the free spacepropagation law taken from Williams (9). These are subject to error, and in-flight calibrations are per-formed using the Comet Laboratory aircraft as shown in Figures 5 and 6. The ground station is equipped(Figure 4b) for measurement of signal strength and is capable of recording signal strength from up to sixantennas simultaneously, covering HF, VHF and UHF, with facilities for monitoring modulation levels,transmitter powers, and recording and assessing speech quality. The measuring instruments are IEEEbuscompatible and interconnected with a computer data acquisition and processing system.
For limited assessments, much can be done on a purely subjective basis, given that a small dedicatedteam is available, consisting of flight test Observers or Pilots with a wide experience in the use of thesystems considered, and complemented by a test Engineer having a good appreciation of radio wave propaga-tion, antenna and transmitter/receiver design characteristics, and with practical experience of main-tenance and calibration of initallations. The Engineer can be responsible for any quantitative measure-ments and their analysis, and the monitoring or operation of the ground station facilities asseoiated withthe assessments.
A ground station site should be selected on a geographic basis so that it lies on a relatively low-lying flat open site for a radius of at least 1 nm and provides a suitable track as free as possible ofair space restrictions or mountainous terrain up to 200 nm. If possible the site should be co-locatedwith a TACAN beacon, and the track should feature regular landmarks for use by aircraft not equipped withsuitable fixing aids. Desirably the ground station should be equipped with means for monitoting signalstrength. The simplest reliable method is to employ an antenna change-over switch, so that a signalgenerator may be used to provide a calibration signal, which is adjusted to the level of the signalobserved on a meter monitoring the receiver automatic gain control line, after each reading. One of themore competitive methods for monitoring signal strength, is to use one of the current wide frequency rangespectrum analysers (10) which can provide direct ieading of sgnal amplitude to an accuracy better than IdB, and frequency to an accuracy in the order of I part in 100 . If equipped with data bus facilities,automatic recording or data processing can be added at a later date. However, useful assessments can bemade on a subjective or comparative basis, provided that certain requirements are met:
1 Standard teat frequencies are allocated for trials, so that all assessments can be correlatedwith frequency, and interference from other traffic is minimised.
2 Test altitudes are maintained for all results, eg one low and one high altitude condition chosento suit the widest range of aircraft.
3 Outbound and inb(..id legs always made on a common track for all aircraft.
4 Orbits always performed in the same area, associated with a given altitude as determined in 2above.
5 Tape recordings are made of all communications, using a good quality recorder.
6 All incoming signals should be monitored on an oscilloscope, and modulation meter to assist indiagnosis or reasons for poor intelligibility.
7 Qualitative assessments of signal strength and readability should be noted by ground and airobservers according to a standard code such as that given in Appendix A.
8 The ground station performance characteristics are monitored as indicated in Table 2 below.

11-4
ITEM MONITOR TEST FACILITIES
Antenna and Physical condition waterproofing, Thru-line wattmeterFeeders corrosion of connections. or network analyser
Antenna VSWR, feeder attenuation.
Transmitter Power output. RF wattmeterFrequency accuracy. Frequency meterModulation depth. Modulation meter
Receiver Signal to noise ratio. Signal generatorSquelch level. Audio wattmeterFrequency accuracy. Frequency meter
TABLE 2 GROUND STATION MONITORING
The ground station antenna radiation patterns, such as the example shown in Figure 6 can only reallybe satisfactorily determined by controlled calibration flights. Nevertheless, by flying a variety ofaircraft on common heights and tracks, it is possible to arrive at an estimate of the expected performanceto maximum range, as indicated by the aircraft results plotted in Figure 5. The range at which there islittle variation of signal strength with distance, ie between 95 and 120 nm in Figure 5, should beexplored by flying at 900 to the chosen track in order to determine the cross-track width of the area forconstant signal ± 1 dB, as in Figure 6. This then represents the optimum area within which polar diagramsmay be measured. Preliminary calibrations of this nature, even if only done subjectively, using a varietyof aircraft, are essential if assessments of any new aircraft are to avoid erroneous conclusions due toadverse ground station characteristics.
For the aircraft, means for recording speech at the headset telephone are required, and are sometimesavailable as part of the communications installation, but where not, it is usually relatively easy toinstall a good quality commercial battery operated cassette recorder, connected by means of an adaptorplug inserted in series with the mic-tel socket. The recorder should not be of the type using automaticrecord level circuits. The record gain needs to be set so that the recorder itself does not overload inthe worst flight condition for acoustic noise with speech, and this is best determined experimentallybefore the scheduled test programme. The final setting should be checked, and a 1 KHz test tone recordedto provide an amplitude calobration at tne beginning of each cassette. A locally manufactured batterypowered oscillator small enough to be carried by the aircrew will enable this to be done in flight on someaircraft. It is also desirable to be able to monitor received signal strength of communications or navi-gation receivers on a meter display, but this is usually difficult to achieve in a simple manner, unlessan appropriate signal line not susceptible to calibration drift is readily accessible. For navigationsystems, independent position references are required, and in the UK, certain instrumentation and positiondatum facilities such as I have already mentioned when describing the Comet Laboratory aircraft are some-times fitted, but they require extensive modification to the aircraft installation and are not practicablefor limited checks. Visual 'on-top' fixes of surveyed landmarks are an adequate means at low altitude forchecking most positional navigation systems for gross errors. Homing systems often employ uncalibratednull indicators, and paper scales graduated in arbitrary units, pasted to the face of the instrument enablereadings of deflection to be noted against compass heading, from which the response of the homing systemmay be judged.
TEST OBJECTIVES
I do not propose to describe individual tests for every system in the catalogue of Comma - Nay Equip-ment, as the general principles may I hope be deduced from what I am about to discuss. What can be achievedin any limited programme depends on the particular aircraft, its endurance, crew complement and range ofequipment requiring assessment. The objectives for a limited assersment should take account of the primeoperational role for the aircraft, particularly in terms of the choice of heights and speeds for the deter-mination of system performance, or the importance of maintaining system operation in turning flight. Naysystems require good all round coverage in level flight but can usually accept degradation in turns,because position fixing is normally done in level flight. Communications systems also require good allround coverage in level flight, and with the possible exception of highly manoeuvrable aircraft such asinterceptors, some degradation in turns may be acceptable provided that this only occurs on the beamaspects. If two antennas are required for a given system, they should provide complementary azimuth cover-age. Antenna vertical coverage at VHF and UHF is strongly influenced by flight attitude; and aircraftwhose incidence angle varies considerably over the height/speed range should be flown at representativespeeds for the heights chosen to determine the range performance.
High cockpit noise levels may occur at different points of the speed/height envelope, according to thesource of noise, be it aerodynamic, engine or air-conditioning in origin, so tests of the effect on com-munications intelligibility should be made in the flight regime that is operationally most severe. Theflexibility of facilities of multi-crew aircraft are closely related to the operational requirements interms of the need for independent operation of communicatinn systems and intercom networks; which shouldbe considered in an assessment along with the ergonomic considerations of placement of controls and dis-ploys for ease of use and. viewing. Accessibility of equipment for maintenance, and the extent and value ofBuilt-In-Test (BIT), or need for external test equipment are important considerations in determining thedegree of front line readiness that might be achieved.
GROUND AND FLIGHT TEST PROGRAMMES
The extent to which antenna systems can be usefully checked on the ground are limited unless an RFnetwork analyser is available for antenna Voltage Standing Wave Ratio (VSWR) and co-axial feeder lossmeasurements. Most passive antennas may be checked in this way, but these measurements are usually imprac-

tical for tuned antennas. For transmitting antennas a thru-line wattmeter provides an easily used methodfor determining transmitter power and, if measurements are possible at the antenna as well as the trans-mitter connections, the feeder loss and antenna VSWR may be determined. These measurements should be madeat the test frequencies to be employed which should be evenly spaced across the band. Methods do existfor checking polar diagrams of antenna systems on the ground. Full sized and scale models of aircraft areused as a design aid for optimising antenna location on most UK aircraft; but they are subject to limita-tions in measurement technique or modelling accuracy, so that actual installed performance is always con-firmed in the UK by in-flight polar diagram measurements.
Intercomm systems should be checked on the ground in order to assess the noise levels under quietconditions and whilst the various electrical and avionic a-ystems are switched on, and the dynamic range forspeech. Ground station transmissions should be monitored on the aircraft receivers as part of the inter-comm tests, to judge speech quality and determine the balance of volume between services and crosstalkcharacteristics. Transmitter sidetone levels should be assessed at the volume previously set for satis-factory reception. The ground station should record the aircraft transmissions and monitor speech quality,modulation depth and if possible, transmitter frequency. Voice recordings should also be made at theaircraft.
Nay position aid accuracies may be zhecked where signals are receivable on the ground, with respectto the airfield position, and to confirm that their behaviour is consistent with experience of other air-craft installations. Ground 'swings' of MFI/DF are a suitable method for determining D/F accuracy (11),provided that the site chosen is calibrated by a competent agency. Class I magnetic compass bases areoften wrongly assumed to be satisfactory for this purpose; however, a site suitable for MF/DF use isinvariably satisfactory for magnetic compass use. It is usual to check the accuracy of the aircraftcompass heading system at the same time.
The simplest approach for limited flight tests is to make comparative assessments, using an aircraftof similar capabilities to the aircraft undergoing tests. This guards against the possibility of erroneousconclusions due to propagation anomalies or ground station defects, and provides a relative basis for per-formance assessments. The, choice of chase aircraft should be restricted to those whose performance charac-teristics are already well known from the ground station calibration tests mentioned earlier. Two aircraftflying in company will also enable communications and Homer, or TACAN air-air modes to be. checked.
V/UHF Communications, TACAN or DME range performance tests should be performed at the pre-determinedheights and radial tracks from the ground station. On the outbound run at optimum cruise speed, two-wayair-to-ground communications should be checked at 10 m intervals at high altitude, or 5 nm intervals atlow altitude, using TACAN or other means for relaying information on distance, and noting readabilityand/or signal strength. These transmissions should continue until two-way contact is lost. The aircraftshould continue outbound for a further distance approximately 20% of that already flown, before flying ona reciprocal track. The ground station and aircraft should make regular calls once contact is lost, theseshould be brief call-sign exchanges to minimise the possibility of overlapping transmissions. Once con-tact is regained the procedure continues until the area for constant signal level (figure 6) is reached,where the aircraft executes an orbit, transmitting at 10 heading intervals, and listening to groundstation replies. The procedure is then repeated for opposite bank. Continuous voice recordings are madeof all transmissions in the aircraft and at the ground station. For TACAN, VOR/DME systems the ranges (orheadings during orbit) at which loss of lock occurs are noted, unless facilities are available for signalstrength monitoring. Desirably results should be obtained for several frequencies in the band. Whenassessment time is limited and only one frequency is possible, this should be in the upper part of theband for VHF and UHF, where the antennas are usually, though not invariably less efficient. Range perfor-mance of HF systems can only be assessed at frequencies that are dictated by the propagation conditionsfor the time of day and path over which the tests are contemplated, so that comparative tests between twoaircraft are the only feasible approach in a limited assessment. Hyperbolic aids, which are receive onlysystems, depend on the means available for observing signal strength and it is usually more pertinent toobserve the consistency of position information near the limits of ground wave cover, by overlayingposition plots from an accompanying aircraft and observing their characteristics during a low bank angleorbit in the same region. Such tests should be performed well outside sunrise and sunset periods. MF/DFsystems range performance is somewhat academic, provided that stable unambiguous bearing' information isattainable beyond the rated range of beacons.
Antenna polar diagrams (PDs) for the level flight condition are obtained by one of two methods in theUK. For aircraft with high altitude capability, polygonal orbits are performed whereby the aircraftlevels the wings at increments of 300 for 5 seconds, until 36 headings have been accomplished. For air-craft of low altitude only capability, this method is unsuitable and a 'cloverleaf' pattern is used, where-by the aircraft flies over a pin-point on successive headings. In each case the aircraft transmits theheading being flown, and for the 'cloverleaf' pattern, counts down to the overhead position. Thirty-sixheading azimuth polar diagrams for each antenna and several frequencies in each band are very time con-suming, and the comrromise shown in Figure 7 is one method of reducing the time taken without seridus lossof information. Switched antennas can be measured during one pattern, by selecting in sequence at eachheading. HF system polar diagrams can only be performed at short range and low altitude, because of theproblems of sky-wave interference and it is debatable whether such PDs have much value in assessments.TACAN or DME should be selected to a channel not employed by beacons in the region, so that the groundstation can monitor bn otherwise unoccupied channel for the aircraft PD transmissions. Homing system PDsare useful for determining the locations of false homing nulls which may have pseudo-stable homing charac-teristics. The false nulls in Figure 8 at 70* and 800 for instance, would merit examination in flight tosee if this were so. Because of the strong dependence on frequency, even limited assessments shouldattempt homing tests on more than one frequency. The tail aspect null must exhibit clear reverse senseindications, and on the head aspect it must be sharp enough to give positive directional information, butat the same time be tolerant of reasonable aircraft manoeuvre, is ! 20e bank angle, without a tendency toovershoot the homing course. When the homing system is fitted with a sensitivity control these charac-teristics will be affected by the setting. The Homing characteristics will also be affected by the typeof transmitting source and the aircraft distance from it.

11-6
A subjective assessment of communications quality (Appendix A) can be augmented by tests that assistin determining the underlying reasons for any degradation observed. Recordings should be made of aircrafttest transmissions with the microphone circuits OFF, microphone ON with no speech, and normal speech trans-mission. This sequence should be performed at normal cruise altitude conditions and repeated for any con-dition for high acoustic noise, in an area of good signal strength at the ground station. The groundstation should also record these transmissions, and, if possible monitor the modulation depth for eachcase, and inspect the audio signal on an oscilloscope for indications of excessive waveform clipping.
Navigation accuracy should be checked for gross errors against visual fixes, and by cross-referenceto other navigation sensors in the aircraft. MF/DF Radio Compass air swings should be performed duringdaytime at heights not less than 4,000 ft and at a distance that is within the rated range of the beacon.Beacons need to be chosen on the basis of local knowledge regarding their accuracy and freedom from inter-fering stations. A downwind homing run should be made, passing over a suitable landmark to determine theDF error with respect to the aircraft heading reference. Further passes should be made over the landmarkon successive headings in order to determine an eight-point air calibration. A range run should be per-formed at a similar height until DF indications begin to wander significantly, say ± 50 and at this range4 low bank angle orbit should be performed; at several points around the orbit, the aircraft should momen-tarily bank steeply to check that the DF indications restore correctly and without ambiguity. The beaconshould be over-flown in order to check that the cone angle of uncertainty is symmetric relative to theoverhead position, and not excessively lprge such that determination of overhead position is difficult.
TYPICAL TEST SCHEDULE
I have drafted a schedule for a limited assessment of an imaginary tactical strike aircraft, the'Gremlin Mk 40' (Appendix B) that sets out to determine the range performance, antenna polar patterns,communications quality and general navigation performance of the aircraft systems, in a manner that couldbe accomplished in two sorties by an experienced test crew; although in practice it would be prudent toallow a further sortie in order to complete any unfulfilled objectives. The systems I have chosen forassessment are listed in Table 3 and the antenna locations are shown in Figure 9.
EQUIPMENT ANTENNA
UHF (Main) 225-400 MHz (1) Fin Cap, Suppressed.
Transmitter 20 wattsSquelch lift 2ttV (2) Undernose Blade.10 dB Signal/Noise 54iV
UIF (Standby) 238-247 MHz a Shares main UHFTwo channel antennas.Transmitter 5 wattsSquelch lift 51sV b Automatic selection of10 dB Signal/Noise 81tV undernose blade when
generators fail.
UHF Homer, (associated Twin blades behindwith main UHF receiver), canopy.
TACAN. 126 channel Single blade under rearTransmitter 1.5 KW peak fuselage.Range & Brg lock threshold- 90 dBm
ADF Radio Compass MF/DF Ventrally mounted150-2000 KHz suppressed loop.
Suppressed sense antennain wing leading edge.
TABLE 3 COMMS-NAV INSTALLATION
I have assumed that the aircraft is fitted with a DR navigation system comprising a twin-gyro platformand doppler velocity and drift sensor, with error characteristics in the order of 1.0
0/hour in heading and
10 nohour in radial position. The general aircraft performance assumptions are given in Table 4.
ALTITUDE SPEED kn ENDURANCE(Fl) (TAS)
30,000 480 2 hr.
3,000 42o 1 hr
300 540 (includes 5 sin at 540)
TABLE 4 AIRCRAFT PERFORMANCE ASSUMPTIONS
The schedules are based on the use of a co-operating chase aircraft equipped with UHF comma and TACAN,whose performance characteristics have already been established over the routes chosen. I have also assumedthat both aircraft have voice recording facilities installed; that the tests are being performed from anairfield equipped with ground station facilities for monitoring UHF and TACAN received signal strength,TACAN and NDB MF/DF beacons and that the routes used have been calibrated in the manner I have already die-

17-7
cussed. A sumary of flight tests are given in Table 5 below, and the sortie patterns are given in
Figure 10.
Sortie Flt: Condition Test Time/Mins
1 30,000 ft 480 kn Outbound Range Assessment. 25
30,000 ft 480 kn Short Range Air-Air Comma 10and Homing.
30,000 ft. 480 kn Inbound Range Assessment. 15
30,000 ft 480 kn Polar Diagrams. 30
30,000 ft 480 kn Long Range Air-Air Comma and 10Homing.
5,000 ft 280 kn Homing Polar Diagram. 15
5,000 ft 420 kn Air-ground Homing. 10
STOTAL 2 hrs
2 300 ft 540 kn Comma Intelligibility. 5
3,000 ft 420 kn Outbound Range Assessment. 10
5,000 ft 420 kn MF/DF Air Swing. 15
3,000 ft 420 kn Inbound Range Assessment. 7
3,000 ft 420 kn Hi-low, Lo-Lo, Air-Air Comma. 7
TOTAL 47 min
TABLE 5 SUMMARY OF FLIGHT TESTS
ANALYSIS
In analysing the results from the limited tests I have described, it should be possible to identifyany important weaknesses in the systems and obtain a comparative assessment of whether the aircraft wasbetter or worse than the chase aircraft employed. If the trial were performed on a day when anomalouspropagation conditions prevailed, meteorological data on the presence of temperature inversions, orunusual gradients in refractive index should corroborate the chase aircraft evidence of abnormal perfor-mance over the established routes. The radio horizon is more usually taken as the limit, based on a 4/3earth radius, or 1.2,Vhft (nm). However this value varies significantly, particularly in the lower lati-tudes (4). It is safer to use the optical horizon ie 1.06lhft (um) as the criterion for predicting theexpected range for satisfactory operation of UHF and TACAN equipment. This would represent 180 nm at30,000 ft or 65 na at 3,000 ft over relatively flat terrain.
I have invented some antenna PDs from the sortie profiles as shown in Figures 11 and 12. Thesesuggest that the UHF fin-cap antenna has a very lobed pattern when compared with the lower antenna.Furthermore, both UHF antennas have poor coverage to the rear of the aircraft and are unlikely to be ade-quately complementary, which would have been apparent during the outbound range runs. The verticalpattern of the fin-cap is probably multi-lobed and this would cause difficulty in achieving consistentair-to-air communications at the longer ranges, and different relative altitudes for the sortie 2 case;for routes over ground of high surface reflectivity it could aggravate rapid fading effects due to multi-path wave propagation.
The standby UHF, having lower power than the main UHF will not provide the range performance of thelatter at high altitudes. The standby UHF range assessment was chosen for the low altitude case becausethis reduction in power is more than compensated for by the expected decrease in propagation loss at thereduced horizon range, provided that the antennae perform satisfactorily. The polar diagram for the lowerantenna in level flight shown in Figure 11 has significant loss on the tail aspect, but in an emergencysituation the aircraft would most probably be heading towards base and performance might be regarded assatisfactory.
The TACAN antenna would moat probably be adversely affected in the area of the head aspect, due toscreening by the under-fuselage missiles. Some screening may also occur on the beam aspects due to thewing stores which would be particularly noticeable in banked turns; this could be acceptaole, whereas lossof performance on the head aspect may be sufficiently serious to merit the addition of a complementaryantenna. As the schedule did not call for measurements of TACAN signal strength except during the polardiagram, the range performance will have to be judged on a comparative basis using the loss of lock indi-cations and their frequency of occurrence, in conjunction with the polar diagram and the chase aircraftresults.
The Radio Compass air swing may show significant errors due to the presence of external stores whichcould merit further investigation on the ground calibration site. Lack of symmetry in the overhead indi-cations might be evident as a result of the non-ideal location of the loop antenna, and may be an accep-table operational limitation, but a failure to resolve bearing ambiguities in some directions during the'air-swing' manoeuvres, could be sufficiently serious to justify relocating the sense antenna.
The tests of the Homer installation will enable the pilot to judge whether the flight path is con-trollable, and the homing squint can be deduced by plotting the track flown from the recorded TACAN data,and the pilot's own observations from the air-to-air cases. The homer azimuth response in Figure 8 would
L

11-8
indicate whether or not there are likely to be ambiguous homing bearings. It should be remembered thatthis type of Romer may have other frequencies at which the response characteristics could be significantly
different, and that completely satisfactory performance with respect to range, sensitivity and controll-ability, squint error or overhead performance, at all frequencies is unlikely to be achieved.
The communications quality may be. judged from thq ground station observers and pilot's reports, butparticular conditions such as the low level high speed tests may need further examination of the recordingsin order to establish whether the causes for loss of intelligibility are due to CCS overload or excessivebackground noise, perhaps due to inadequate microphone or headset acoustic attenuation. Care needs to beexercised in interpreting the recordings of the pilot's telephone signal, as these do not reproduce theacoustic noise to signal condition actually present at the ear. A comparison of chase aircraft recordingswith those of the aircraft under teat may show significant differences in the way in which the airbornereceivers respond to rapid signal fluctuation, or very strong signals during the air-to-air tests.
CONCLUSIONS
Worthwhile limiteo assessments of Comma-Nay systems can be made by a mall but experienced and dedi-cated team with relatively moderate resources, provided that the test objectives are carefully consideredbeforehand and conducted over well rehearsed routes, so thAt the performance expectations are predictable.The requirements for these routes, and the profiles flown typically do not represent the more interestingoperational situations, but they do provide a more objective basis for comparing various aircraft andsystems performance. The use of a known chase aircraft, not only provides a control check on groundstation performance and propagation conditions of the day, but also allows the scope of the test to beextended to cover air-to-air requirements.
Navigation system tests need to concentrate on the range and antenna dependent characteristics, andthe consistency of performance and ease of use rather than accuracy in absolute terms, as the latterrequires a more elaborate programme of trials.
Subjective assessments of communications quality are more appropriate to limited programmes, particu-lar3.y if use is made of speech recordings to help in identifying the features that may be the cause of lossof intelligibility. The ability to monitor signal strength on the ground enables useful quantitative datato be obtained on antenna performance and does not require extensive facilities.
REFERENCES
I K Bullington 1957. "Radio Propagation Fundamentals". Bell System Technical Journal Vol XXXVI No 3,
P 593-627.
2 CCIR "Atlas of Ionospheric Characteristics" and supplements. UIT. Geneva.
3 BAe/Montedel 1979. "HF/SSB Communications System for Military Helicopters" BAe 885/7218.BAe Dynamics Group, Electronic Systems, Filton House, Bristol BS99 7AR UK.
4 D B Clemow & E H Bruce-Clayton 1962. "Long Range VHF Air/Ground Communications."J Brit IRE Vol 26 Jan 1963, P 17-32.
5 RAF 1979 "En Route Supplements" Flight Information Publication, 1 AIDU(RAF) Northolt. UK.
6 H Maidment & N G Halliday, 1967. "Performance Assessment of the Prototype Hoffman Mk V AirborneTacan Set." A&AEE/Tec/355/Nav/Rad. DRIC (UK).
7 Decca Ltd 1976. "The Decca Navigator System Principles and Performance."
Decca Navigator Co Ltd, TP Dept, 247 Burlington Road, New Malden, Surrey, KT3 4NF, England.
8 US Coast Guard, 1974. "Loran-C User Handbook." CG 462. US Dept of Transportation.
9 H P Williams, 1966. "Antenna Theory & Design." Vol 2, Ed 2, Ch 3. Isaac Pitman & Sons Ltd, London.
10 Hewlett Packard 1977. "8568A Spectrum Analyser, Operation." 08568-90002.Hewlett Packard, 140 Fountain Grove, Parkway Santa Rosa, California, USA.
11 Marconi Ltd, 1964. "Aircraft ADF System Survey and Test Procedures." Marconi Technical Manual T3990,Issue 2. Marconi-Elliott Avionics Systems Ltd, Airadio Division, Christopher Martin Road, Basildon,Essex, SS14 3EL, England.
12 C E Williams & M H L Hecker, 1968. "Relation between Intelligibility Scores for Four Test Methods andThree Types of Speech Distortion." J Acoust: Soc: Amer Vol 44 No 4 - 1902.
13 Acoustical Society of America, 1969. "Methods for the Calculation of the Articulation Index."ANSI S3.5 - 1969. American National Standards Institute Inc. 1430 Broadway, New York, 10018.
ACKNOWLSEDGEENT
To the advice and assistance given in the preparation of this lecture by colleagues and staff ofNavigation and Radio Division at A&AEE, and others in the British Aerospace Industry.
Copyright E Controller HMSO London 1980.

11-9
34 0
34a
31t 3I319a

11-10
0
/ 0
00
0 30C0(
zz
E-
Ez
IA~
44 o
(3Qi.

UNF-CREW-VIUHF ADF LOOPS(3 LAS TACAN of VIRES (2)
'C' SAND TRANSPONDER
GLIDESLOPELORAN ADLZ3(Z)
LAECCANPLR7 I£LRDAT 2 A AA
FIG.-3a COMET 235 - ANTENNA SYSTEMS.
I D I C K C O O REIN A T I OEETU IR
ACN
I. b OMT 35- NRA OR COAYOTT.

11-12
FIG. 4oa Antenna Farm
FIG 4b Laboratory
FIG. 4 GROUNOSTATION FACILITIES

11-13
In
0 .l
-I A.-
ic, /,/ s-ma
Jh SM * .
S- - °Al - * -a----__10 ZL
SM *
S I I S I°
Li&
too
Nin. 0 0

11-14
NO fm
raI
0
_ _ _ _ _ _ _ _ _ _ _ _ _2
C.)
_ _ _ _ _ _ _ _ _____ _2
0
In
0'
OR1

11-1
C
944 I-
to
on V
dc=
I,, 4
41
40
a'a
lob

11-16
550 36 10
00? 0 6 - OI
FIG. HOMNG IDICAOR AIMUT RESoNS

11-17
UNIF OMERUHF SUPPRESSEDANTENASFl NCA P
..4-TACAN ANTENNA
UHIF LOWER-~ DOPPLER RADOME
ANTENNA LOOP ANTENNA
SENSE ANTENNAS
NUHF LOWER ANTENNA
FIG. 9 GREMLIN MK 40 ANTENNA LOCATION.
GREMLIN AIRCRAFT
120 nsm WI 9Snm. IZ2s.. W4
Vi AIRWELD WZ W6 VS
W2 W3W4,SOsAL 1. lin.. 225i
80 min. 95 min. 50 min. d36min
AIRFIELD 6min. 26 m"
CHASE AIRCRAFTSCALE, 0 30n.m 60...
FIG. 10a FLIGHT PROFILE SORTIE I
-e-41 min.-34 min. 19min
SCALE: 0 5 lOwL.
FIG. 1ob FLIGHT PROFILE SORTIE 2

DATE 1S1.0 390 MHz - 300 PORT BANKAIRCRAFT GREMLIN MK40Oo 390 MHz 300 STBN. BANKANTENNA UHF UNDER NOSE Z45 N: z LEVEL FLIGHTPOLARISATION VERTICAL 3-(OMLSDTALTITUDE 30,000 FT. (OMLSDIRANGE II10 rm. 3BEARING 2130 M.PATTERN ORBIT ISCL d9lV
POLYGON 30oO
0
FIG. I( POLAR DIAGRAMS, SORTIE 1, RUNS 1, 2 & S.
DATE 1 16.0 390 MHz - 30P ORT BANKI
AIRCRAFT GREMLIN MK 40 390 MHz-- --- 300 STBD. BANK
POLARISATION VERTICAL 5
ALTITUDE 30,000 FT.30RANGE 110 nm.BEARING 2130M. ZSAEd/i
PATTERN ORBIT
10
FIG. 12 POLAR DIAGRAMS, SORTIE I, RUNS 3 &4.

11-19
APPENDIX ACOMMUNICATIONS QUALITY ASSESSMENT
COMMUNICATIONS READABILITY
When carrying out communication trials the message heard in a telephone earpiece has to be describedas clearly as possible. If readability trials are carried out in conjunction with other tasks, anoperator should be allocated exclusively to this task. When subjectively assessing the quality of com-munication the following scale may be used:
1. Unreadable.
2. Readable intermittently.
3. Readable with difficulty.
4. Readable.
5. Perfectly readable.
It is evident that readings less than perfect must be so for a reason. A list of possible reasons isgiven below, to be used in conjunction with the readability scale.
a. With slight/heavy distortion.
b. With interference preseut.
c. With intermittency.
d. With background noise.
e. Weak.
These may be defined as follows:
Distortion is present when the speech waveform has been so modified as to affect the degree ofintelligibility.
Interference is present when spurious signals can be heard in addition to the wanted signal. Itssource should be established if possible, either as coming from a local transmitter, vehicle ignition, oradjacent channel traffic or that the spurious signal is being internally generated.
Intermittency is present when the received signal is arriving with breaks in the continuity of thecarrier or its modulation.
Background noise is present when noise is superimposed on the transmitted signal or is superimposedon the signal the operator hears.
The audio signal is weak when it is low with respect to the level the operator normally expects.
KEYWORD INTELLIGIBILITY TESTS
These consist of random selections of 5 figure number and letter groups, followed by unfamiliarsentences containing 5 keywords that are essential for a comprehension of what has been transmitted. Thelistener either writes down what he thinks has been said, re-transmits it or records it on a tape recorderfor later analysis.
Intelligibility scoring is performed separately for each group, so as to arrive at an index ofsuccessful comprehension for numbers, letters, and sentence keywords out of a maximum of five, in order ofincreasing difficulty. Sufficient message groups are prepared so as not to use the same message more thanonce. Examples of these are shown in the Table below:

11-20
Message Number Letter Keyword SentencesNo Group Group
1 71542 QNAJM A crowd listened to the radio durin the night.
2 66845 VVOCF He is fond of the sea and has his own Air~h2.
3 61402 GABBK The increase is due to the rise in price.
4 46357 FTRCK There are many hard problems to solve
5 32034 NRMID He has no thought for their comfort.
6 81943 BWHCD The pse was lit y a dim lmp.
7 89429 UVAHK The crew stayed aboard the jhi all night.
8 30605 XDPLH They did not make many runs in the first innings.
9 40332 RPVBE A new sect is being set M in the country.
10 00618 YIMAK Ten of the crew were being returned home.
TABLE A-1 TYPICAL KEYWORD GROUPS
There appears to be no entirely satisfactory objective method for use in a limited assessment ofcommunication intelligibility. There are variants of the keyword technique (12), and also the"Articulation Index" method (13) which requires audio spectrum analysis facilities; but none of thesemethods are likely to differ significantly from the subjective assessment of an experienced communicatiousoperator unless a statistically significant programme of tests are performed.

11-21
APPENDIX B
TYPICAL SCHEDULE OF TESTSSCHEDULE OF GROUND TESTS
Qualification or Control Checks
a UHF Communications
At the test frequenciesMeasure transmitter power at the equipment.Measure receiver threshold for unsquelch.Measure transmitter forward and reverse power at each antenna (or determine antenna and feederparameters witn Network analyser).
b Tacan
At the test frequenciesMeasure transmitter power at the equipment.Measure receiver threshold for range and bearing lock, at test set frequency only, if suitableequipment not available.Measure antenna and feeder parameters as for a.
c Establish initial record level setting for voice recorder with test tone in lieu of microphone.
d Fit homing indicator scale.
Assessment Checks
a Perform 24 point heading swing of MF/DF installation on calibrated base. Observe correctprocedures (11). Check aircraft heading reference system, with aircraft sighting rods and landingCompass.
b With external aircraft power.Record test transmissions in the aircraft and at the grqund station, with microphone OFF, microphoneON' under acoustically quiet conditions, and with normal speech. At the aircraft check the balance ofaudio between UHF main, UHF standby, Tacan ident, MF/DF, and other selectable services, check range ofvolume control available, and level of cross-talk from activated but deselected systems. At the1ground station, check modulation depth and frequency of aircraft UHF transmissions on required flight
test frequencies.
c With engine on full ground power, transmit to ground station at one UHF frequency. Record oncockpit voice recorder. At ground station record transmission and monitor modulation depth.
d Examine aircraft installation for ease of access for maintenance and test.
e Check aircraft voice recordings at b and c and reset recorder level, as required.
SCHEDULE OF FLIGHT TESTS
The following schedules have been prepared for the aircraft under test, designated Gremlin. Thelegend for the codes used are:
A = Gremlin Aircraft H = Homer R = Radio CompassC = Chase Aircraft L = Lower Antenna S = Standby UHFG = Ground Station M = Main UHF T = Tacan
U = Upper Antenna
SORTIE 1
TIME DISTANCE WAY- FRIQ:MHz HEIGHTOASEm POINT ANT: ft ACTION
START- -O 0 1 390MU 0 (A) Enter Waypoints. Check transmissions on M and SUP 245SL to G and C.
Check R and T with base beacons.
Base (G) Check transmissions to A and C.
Channels (C) Check transmissions to A and G.T & R Check T with base beacon.
TAKE- 0 0 1 (A) Overfly base and initialise DR Nev.OFI
CLIOl 0 to 0-50 2 30,000 (A) Voice recorder ON. Contact ( on M.+6 480 Transmit Mic OFF/ON sequence. Repeat on S, at
cruise height. Contact C for rendezvous at W2.(G) Voice recorder ON.
Monitor modulation on transmissions from A.
(C) Join A at W2. Voice recorder ON.

11-22
DISTANCE HEIGHTTIME FRM WAY- FRE :MHz ftATOEVENT FAY- ft ACTIONMINS POINT ANT:BASE nim TAS
OUT- +6 to 50-180 3 390MU 30,000 (A) Transmit on M, pass T range and brg, heading,BOUND +20 245SL 480 height, speed. Repeat on S.RANGE Repeat sequence at 10 nm intervals until read-
Base ability degrades, then repeat back readabilityChannels of G at 5 rim intervals.T & R Record loss of T lock vs distance.
Record R bearings vs T range and brg on oppor-tunity. Note general R performance.
(G) Monitor signal strength and readability on M.Note readability only on S.
(C) Fly in loose formation abeam.Monitor A and G on M and compare T position,record errors.Note readability of G vs distance.
MAX +20 to 180-225 4 (A) Note distance of last contact on M & S.RANGE +26 Abandon S but continue with regular M trans-
missions pass T range or DR range.Note maximum T range.
(G) Make regular short transmissions on M afterloss of contact.
(C) Note distance for last contact heard on M fromG to A.Note maximum T range.
AIR-AIR +26 to 225-250 4 390MU " (A) Turn to allow C to achieve 5 nm separation.COMMS & +36 245SL or as Maintain 2 way contact on S. When C turnsHOMING re- change to M, Homer mode.
quired Homing run to close formation. Note homing re-sponse to manoeuvre, and visual error on sight.
390ML Deselect Homer and check M in close formation,245SU change antenna selection and repeat.
Change Cassette.
(G) Stand by.
(A)+500 (C) At 5 nm separation turn 90* and reduce speed.Change UHF channel as requested by A.Note readability of all A transmissions.Change Cassette.
INBOUND +36 to 225-120 5 ML390 (A) Regular short transmissions on M until two wayRANGE + 50 245SU contact achieved, then at 5 rm intervals until
good readability; thence 10 rm intervals.Actions as for outbound leg.Near W5 update DR Nav with T fix.
(G) Commence regular short transmissions on M.
(C) Regain loose formation and continue monitoringas for outbound run.
POLAR +50 to 120-95 5, 6 (1)39OML 30,000 (A) In orbit area. 3600+ turn 30e port bank.DIAGRAM +60 48oORBITS (G) Record signal strength vs heading.
(C) Continue on track to Waypoint 7.
(2)39OL (A) Repeat (1) starboard bank.
(3)39014U (A) Repeat (1).
(4)390MU (A) Repeat (2).In 1 thru 4 transmit on M calling headings every10. Reset orbit to correct for wind.
(5)245SL (A) Fly polygon, wings level every 30e thru 360 e
calling actual heading when wings level.
(G) Request changeover to M1245 if signal strengthinadequate.
(6)390L (A) Correct position then repeat (5) with T selectedT ch 60 to Ch 60. Transmit on M calling actual heading.
(0) Record T signal strength vs heading.
(C) Loiter at W7.Listen on 245 M s.

11-23
TIME DISTANCE WAY FflJ:MH HEIGHTEVET TINS FROM POINT ANT: ft ACTION
MS BASE nm TAS
AIR-AIR +80 to 95-50 2 245ML 30,000 (A) Overfly W6, select T base channel. Reset DRCONKS & +91 480 Nav. Change Cassette. Contact C (thru 0 ifHOMING necessary) on M.
(0) .Monitor 245 MHz. Assist in A to C contact ifrequired.
(C) Fly on reciprocal track for base TAS 480 kn.Change Cassette. Change frequency on requestfrom A.
390HL (A) Repeat contact and note readability. SelectHomer on best comma frequency. Note headingfor Homer null. Check response to manoeuvreand record Homer Comma readability.
Check Homer on worst frequency at closer range.Spiral descent to W2.
(G) Prepare low power transmitter for frequencyrequested by A.
(C) Return to Base.
HOMER +95 to 50 2 See 5,000 (A) On worst Homer frequency. Commence 150 orbitPOLAR +109 Action 300 record heading for every unit change, of homerDIAGRAM indicator deflection left or right thru 3600.
(G) Switch on low power transmitter. Listen onother frequency.
(A) Repeat orbit procedure on best frequency.
(G) Change transmitter frequency.
HOMER +109 50-0 1 See 5,000 (A) Overfly W2. Perform homing run against con-SQUINT to +120 Action 420 tinuous ground station transmission. Record T
range and Brg every 2 na to overhead. Estimatecone of uncertainty and for reversed sense in-dications on overshoot. Return to Base.
SORTIE 2
HEIGHTEVENT TIME DISTANCE WAY- FREQ:MHz ft ACTION
MINS FLOWN POINT ANT: tTTAS
START- -0 0 1 39OML 0 (A) nter Waypoints. Check transmissions on M & SUP 245SU to G.
Base (G) Check A transmissions.Channels
T &RTAKE- 0 0 1 (A) Overfly on reciprocal track. Initialise DR
OFF Nav.
(G) Voice recorder ON.
ACCEL 0 to 0-37 2 " 300 (A) Voice recorder ON. Check transmission to G& TURN +5 420-540 prior to acceleration using Mic OFF/ON
sequence.(G) Check modulation depths.
(C) Check transmission to G prior to take off.
HIGH +5 to 37-77 3 " 300 (A) Repeat Mic ON/OFF sequence.SPEED +10 540 Repeat back keyword groups as heard.COMMS Continue until W3 reached.INTEL- (0) Check modulation depth.BILITY Transmit Keyword groups until terminated by A.
(C) Proceed to Waypoint 3 to join up in looseformation abeam of A at W3.
L im aI . . ....... .... Il...I1. .. '- I ...

11-24
HEIGHTTIME DISTANCE WAY- FREQ:MHz fT
rw MINS FLOWN POINT ANT: ft ACTIONTAS
OUT- +10 to 77-132 4 245SU 3,000 (A) Decelerate and climb. Contact C to formate onBOUND +19 390ML 420 track.RANGE Transmit on S pass T range and brg heading
heigut and speed. Repeat on M every 5 na untilW4. Note T performance and distance for unlockas for Sortie 1.
(G) Record signal strength of S and monitor read-ability of M transmissions as for Sortie 1.
(C) Fly in loose formation abeam. Monitor A & G on245 MHz, compare T position, record errors.Note readability of 0 vs distance,
RADIO +19 to 132-164 4 390ML 5,000 (A) Turn and climb to height and perform octagonCOMPASS +34 420 orbit, initially on reciprocal heading for base.SWING Record R bearing, aircraft heading and T range
and bearing at each wings level condition.(G) Standby.,
(C) Climb to 20,000 ft return and loiter at W3.
INBOUND +34 to 164-209 3 390MU 3,000 (A) Descend and overfly W5. Fix update DR Nay.RANGE +41 245SL 420 Change cassette. Recommence S tranamissions
until contact with G then continue at 5 nmintervals as.for outbound run.
(G) Commence short transmissions on 245 MHz untilcontact established. Continue as for outboundrun.Prepare low power transmitters for next stage.
(C) Change cassette.
RADIO +41 to 209-229 1 See (A) Home on to G transmitter, using H.COMPASS +4t Action Record T brg and range, R bearing and headingAND every 2 an. Overfly Base and note overhead andHOMER overshoot response of H and R.CHECK (G) Transmit on worst Homer frequency from Sortie 1.
(C) Select 390 MHz.
AIR-AIR +48 to 229-279 1 390MU 300 (A) Descend to 300 ft. Check two way comma.COWS +55 420 Repeat on ML.
If time permits repeat on parallel track 2 nmoffset from C (at 300 ft).
(G) Monitor air-air comma.
(C) Commence race track at 900 to Base track.Descend to 300 ft when requested by A.
IK

12-1
PERFORMANCE OF NAVIGATION SYSTEMS
by
Karlheinz Hurrag
Deutsche Forschungs- und Versuchsanstalt
fOr Luft- und Raumfahrt e. V.
Institut fOr FlugfUhrung
3300 Braunschweig, Germany
SUMMARY
Aircraft of today are navigated mainly by the radio navigation systems of VOR/DMEand TACAN, as well as Doppler navigation and inertial navigation (INS). These systemswill be described to show in which way and how far they can be used. Their error behav-iour will be described especially and in detail.
By combining various navigation systems, navigation accuracy can be greatly in-creased. One integrated system will be dealt with and will be explained with the aid offlight tests carried out by the DFVLR in Braunschweig.
1. INTRODUCTION
As far as any navigation system is concerned, it is very important to know howaccurate it is. Before describing the most outstanding navigation systems, certain basicfacts on the manner of representation of navigation errors will be given here:
A navigation system generally consists of the following components:
- sensors for measuring values of interest
- data conversion and transmission systems
- navigation computer
- indicators.
All these components are inaccurate to a certain degree which means that the navigationinformation is also inaccurate.
Deterministic and Random Errors
One has to distinguish between deterministic and random errors. The same determi-nistic error always occurs, when the navigation equipment is turned on. Random errors varyand cannot be anticipated. In most systems, random errors can be described best by aGaussian distribution:
p(x) 2 2P W P xP (- (x- X) / 2 c
Here
x is the random error
p is the distribution density
x is the mean error
a is the standard deviation.
The Gaussian distribution is best for most errors, because these errors are composedof many individual errors, especially in the case of navigation systems.
Normally, the error behaviour of a single component is of no interest, e. g. theerror behaviour of a VOR-receiver showing a certain bias error. When taking into consider-ation all components, or a certain navigation system, respectively, a systematic errormay be disregarded, since positive and negative systematic errors may cancel each otherout.
Determination of Navigation Errors
It would be unrealistic to quote the maximum errors as far as position errors areconcerned, because maximum errors seldom occur. Therefore, it is better to use certainstatistic parameters.
A position error is the difference between the true position and the indicatedposition:

12-2
AX Xt - XdAY- Yt -Yd"
Fig. 1 shows the position errors which have been measured in connection with a cer-tain navigation system. The error behaviour of this navigation system can be describedby two standard deviations a x and a y, as well as the correlation coefficient kxy
EAX2
2 x
2a2 ZAy iy N
k xi Yi 1xy a F axy
N is the number of measurements.
If the one-dimensional errors Ax and Ay belong to normal distributions, the followingstatistic facts are valid:
SO percent of the errors are within + 0.675 a
68.3 percent of the errors are within + 1 a
95.4 percent of the errors are within + 2 a
99.7 percent of the errors are within + 3
X
Fig. 1: Position Errors.
Error Ellipsis
The navigation errors shown in Fig. 1 lead to a correlation coefficient of about- 0.73. This negative correlation coefficient means that it is very likely that a negativevalue Ay corresponds to a positive error AX, and vice versa. Therefore, position errorscan best be shown by aeana of the so-called error ellipsis. The individual parameters ofan error ellipsis can be calculated with the aid of the following equations:

12-3
S= arctan 2k xy --
y x
= /(2 - 02)2 + C2kxyxay) 2y x xx
2 2
A2 x a y2
2 2B 2 ax + ay -2
Ifthere is a normal distribution, 39.4 % of all values can be found within an errorellipsis. An ellipsis having the ellipsis axes doubled (2o), comprises 86.5 % of allvalues.
Circular Error Probability (CEP)
The two-dimensional error behaviour of a navigation system is often described as so-called Circular Error Probability (CEP). The CEP is considered to be the radius of acircle that encloses 50 % of the measurements. This circle is also shown in Fig. 1. Anapproximation for calculating the CEP would be:
CEP = 0.59 Ca + ay) 1 3% if -< a < 3 a
In the special case where ax is vy, CEP will be 1.18 a.
Covariance Matrix
The so-called covariance matrix is frequently used in order to describe the errorbehaviour of complicated systems, such as inertial navigation systems, for example:
Q12 Q22
.. ... QNN
It normally depends on time and position. The diagonal elements (Q11, Q22 -. QNN) arethe squares of the standard deviations. Thus these elements always have to be positive.The off-diagonal elements are the cross-covariances which describe the correlation betweenthe individual errors. The correlation coefficient results from:
Qmnmm nn
A covariance has to be set up such as to satisfy the condition that k is always:
-1 < k < +1
The covariance matrix of the two-dimensional case shown in Fig. 1 is
ax kxyaxoy
2kxyoxoy a
Error Propagation
Normally, the covariance matrix is not directly available. It has to be calculatedfrom errors of the various elements of a system. This will be demonstrated here in thecase of the VOR/DNE-system which will serve as an example. VOR/DME is the civil standardnavigation system measuring the azimuth and distance from a ground station to an aircraft.As far as this system is concerned, a certain angle error as well as a distance error haveto be taken into account. Both errors are uncorrelated. The covariance matrix of theVOR/IME-system is therefore,
20E

12-4
a or a are the standard deviations of measurement errors of azimuth and of distance,rispectively. The conversion of the covariance matrix P into an x-y-coordinate systemhas to be made by using the following equation:
Q= CPT
C stands for the transition matrix. For the VOR/DME-system, it reads as follows:
3x asine E cosO
T=
cose -E sine
0 is the azimuth and E is the distance which were measured. The index T incicates amatrix transposition. The various elements of the matrix Q of the VOR/DME-system are cal-culated as follows:
2= = 2sin 2 0 + 2E2 cos 20
2 = 2= Cos2 0+ 2aE 2 sin 200y Q~22 'aEcs 0
2 _ a 2E 2)cosO sineQ12 Q21 = (O "E 2 c s 0iO
Element Q, is normally not zero. The position errors Ax and Ay are thus mostly corre-lated in his example.
Time Behaviour of Navigation Errors
Fig. 2 shows the distance error of DME-measurements as a function of time. It isclearly visible that this error mainly consists of a relatively high-frequency noise.This error behaviour is typical of most radio navigation systems.
E 0.30C
00.20 __ __
MEAN=0 02
- 0.10
-020
500 1000 1500 2000TIME OF FLIGHT Is]
Fig. 2: DM-Errors.
The dead-reckoning systems, such as doppler navigation systems or inertial navigationsystems, show a completely different error behaviour. In these systems, the navigationerrors constantly increase. This is caused by random or systematic errors of the sensorssuch as errors of the accelerometers in inertial navigation systems, for example. Yet theshorttime accuracy of these systems is extremely high.
By combining radio navigation systems with inertial navigation systems or dopplernavigation systems, it is now possible to determine the sensor errors such as gyrodrifts,for example, and thus to consider them for the navigation calculations. Such a combinedsystem can, therefore, reach an extremely high degree of navigation accuracy. Modernsystems use Kalman filters for this purpose. The principle of Kalman filters will not beexplained here.

12-5
Measurements of Navigation Errors
In order to determine navigation errors during flight tests, it is necessary tomeasure a reference flight path. Stabilized cameras in the test, aircraft, cinetheodolites,as well as tracking-radars are used today in order to reach this aim. With the help ofthese instruments it is possible to obtain position accuracies which are greater thanthat of any navigation system used today.
Fig. 3 shows the tracking-radar DIR made by RCA. This radar can measure automaticallydistance, azimuth, and elevation between the radar and the test aircraft. The accuracies(1o) which are obtained are as follows:
angle 0.03 0distance: 8 m.
Fig. 3: Digital Instrumentation Radar.
2. VOR/DME AND TACAN
At present, the standard navigation systems in many countries are VOR (VHF omni-directional range), DME (distance measuring equipment), and TACAN (tactical air navigationsystem). VOR is the civil bearing measuring system, DME is the civil distance measuringsystem, and TACAN is a military system measuring bearing and distance. The civil DME andthe distance measuring part of TACAN are essentially identical.
VOR-System
The VOR-system operates in the VHF-band from 108 to 118 MHz. The band from 108 to112 MHz is shared with the localizer portion of the instrument landing system. The spacebetween two adjacent VOR-channels or localizer channels is 50 kHz which means that thereare 200 channels altogether. The method of operation of the VOR-system as well as theangle measurement portion of the TACAN-system is similar in principle. Therefore, thismethod will be explained briefly by means of an optical system:
This system consists of a rotating beacon and a flash light. Both lights are in-stalled on a tower. The rotating beacon is always rotating continously in azimuth. Anobserver who is onboard a ship, for instance, always sees the rotating beacon shiningbrightly, whenever it faces the ship. The period of time for one rotation of the beaconis 360 seconds. Whenever the beacon points to North, the flash light is lit. The observeris then able to determine the bearing of his ship from Northern direction relative to thetower with the aid of a simple time measurement. All he needs to do is to take the timeelapsing between the flash of the lamp and the rotating beacon pointing towards him whichhe can do with an ordinary stop-watch. The number of seconds thus stopped corresponds tothe bearing of his ship, measured in degrees.
As far as the VOR-system is concerned, the rotating beacon is replaced by a rotatingantenna. It rotates at a rate of 30 rotations per second. This produces a 30 Hz-tone inthe VOR-receiver. Its phase relationship depends on the azimuth between North and the air-

12-6
craft in relation to the ground station. The flash light is replaced by an omni-direction-al reference signal which is also a 30 Hz-tone and is radiated by an auxiliary subcarrier.The phase between the two 30 Hz-tones corresponds to the bearing of the aircraft frommagnetic No'rth relative to the ground station.
Airborne VOR-Equipment
Since the VOR-signal is horizontally polarized, an appropriate antenna has to befitted onboard the aircraft for this purpose. The function of the VOR-receiver is mainlyto receive the VOR-signal as well as to produce the two 30 Hz-tones. Two procedures areused in order to show the 30 Hz-phase relationship: when using the first procedure, thephase comparison is made manually by the so-called omni-bearing selector. With the aid ofthis selector, it is possible to select a certain bearing or 'radial'; the deviation in-dicator which is part of this, shows a 'zero' deviation, when the aircraft is on theselected radial. A full scale deflection is approximately 100 off the selected bearing.The so-called 'TO/FROM'-flag is part of the deviation indicator. This flag shows whetherthe phase between the two VOR-signals is near 00 (FROM) or 1800 (TO). This arrangementenables the pilot to fly towards a VOR or away from it, along certain radials. As far asthe second procedure is concerned, the bearing is automatically indicated, normally onthe radio-magnetic indicator.
VOR-Coverage
There are three catagories of VOR-facilities:
Class
H (high altitude) 18000 -45000 ft 130 nm
L (low altitude) up to 18000 ft 40 nm
T (terminal) up to 12000 ft 25 nm
The maximum range is limited by signal power limitations or frequency protection. In theUSA and in the west european countries, there is VOR-coverage everywhere. Since the VOR-signals are basically line-of-sight-limited, there is sometimes no coverage between in-dividual stations in extremely low altitudes. Therefore, problems arise especially inmountainous areas.
VOR-Accuracy
The VOR-system error is usually divided into
ground station errors,airborne equipment errors,flight-technical errors.
Errors of ground stations are mainly caused by multi-path effects and reflections which
cause bearing errors.
Each reflected VOR-signal being received by the VOR-onboard-receiver, produces abearing error, because the phase of the two 30 Hz-tones is changed. Most reflections canbe found in the vicinity of VOR-sites. This means that great care has to be taken whenselecting these sites.
Errors of modern VOR-receivers are generally smaller than those of ground stations.Possible origins or causes of errors related to the receiver will not be dealt with here.
Fig. 4 shows the typical error behaviour of the VOR-system. It represents the sumof ground errors and onboard errors as a function of time. A conventional VOR-station inNorthern Germany was used for this purpose. The measured data were collected by a testaircraft of the type HFB 320. A tracking-radar and an inertial navigation system wereused as reference. This Figure also shows a relatively high-frequency noise which is typ-ical of most radio-navigation systems. The standard deviation here is about 2.40 k1o);the mean is very low.
Use of the VOR-System
The modern Air Traffic Control System (ATC) above continents is based on rigid air-ways which are determined with the aid of ground stations. One airway segment is deter-mined by the line between two ground stations. Today these ground stations are almostexclusively VOR-stations. During the flight, the pilots have to try to fly as preciselyas possible along the centrelines of the airways. How this is done in practice is shownin Fig. 5. When the aircraft has passed the VOR-ground station, the TO/FROM-flag changesto 'FROM'. Then the pilot has to select 700 on the omni-bearing selector, according tothe new radial of 70 . If the heading of 500 is maintained, the aircraft will graduallyreach the radial of 700.

12-7
0
0
_
-2.5 J,
- 5.01 1__ _ __ _ _ Ii I__ _ _ _ _
0 500 1000 1500 2000TIME OF FLIGHT [si
Fig. 4: VOR-Errors.
VOR RADIAL
27
!p 18
FRM "FROM" INDICATOR
FLY LEFT TO INTERCEPTDESIRED COURSE
-T"INDICATOR
OMNI BEARING SELECTOR
Fig. 5: Use of the VOR-System.
oshows how accurately aircraft can follow the centre-line of airways. It showsgI rac:ks out of a total of 1000 tracks. The standard deviation of the aircraft
Sfrom the centre-line is appT'ximately 1.6 nm.
-4.1 now, the VOR-system has been improved by the so-called Doppler-VOR.i-si) will not be explained here.
.. '- perture of the Doppler-VOR is about 13 meters. Therefore, it is- rester than that of a conventional VOR. Since the site eiror is
-a '*the antenna aperture, the error of a Doppler-VOR should decrease%e. ~d at sites where conventional VORs are too inaccurate.

12-8
2o Bond
2a - Bond
/ KIR
NST
10 n. m. - .-- ,1
Fig. 6: Aircraft Trajectories.
Distance Measuring Equipment (DME)
Since 1959 DME, together with VOR, have been the standard short-range navigationsystem. It is an active system measuring the distance between an aircraft and a certainground station. In order to measure such a distance, the round trip propagation time,from the aircraft to the ground station, and back again, is used. DME uses the same sig-nals as that part of TACAN which measures the distance. For this reason, VOR and TACANstations are normally combined in a so-called VORTAC. The DME-frequency band covers960 MHz to 1215 MHz. This band is divided into 126 channels. One hundred of these areprovided for civil DME, i. e. mainly for VORTAC-stations, whereas 26 are reserved formilitary TACAN-stations only. As there are altogether 200 VOR channels and localizerchannels, the number of channels for DME and TACAN is doubled by the so-called x-channelsand y-channels.
Twin pulses are used in order to measure the round trip propagation time. Each twinpulse received by the ground station causes the ground station itself to retransmit atwin pulse t4. the interrogator after a fixed time delay (50 us) on a frequency shiftedby 63 MHz upwards or downwards. The intervals between pulses of the twin pulse are
aircraft - ground x-channel 12 usy-channel 36 us
ground - aircraft x-channel 12 usy-channel 30 us
Ground Transponder Unit
For several reasons, the DME ground stations also radiate twin pulses, even if theyreceive no interrogation pulses. The radiation of these 'squitter pulses' happens on afrequency which is varying in a random manner. The average pulse repetition frequency is3000 pulse pairs per second. This frequency is kept also, if interrogation pulses arereceived. The squitter pulses are reduced accordingly under such circumstances.
Since the upper limit of the pulse repetition frequency is approximately 3000 pulsepairs per second, a ground station can only be used by a restricted number of aircraft;normally about 100. If too many aircraft want to use the same ground station, this groundstation can become saturated. In such a case, only those aircraft having a stronger sig-nal will obtain the necessary information from the ground station. Consequently, thoseaircraft being closer to the ground station or having a more powerful interrogator trans-mitter, are favoured.
As far as the VORTAC-ground stations are concerned, each VOR-frequency is pairedwith a certain TACAN-channel. DME-ground stations can also be used together with theInstrument Landing System (ILS). Therefore, each localizer channel is also paired witha certain DME-channel.
DME-Airborne Equipment
Before a DME-onboard unit can start measuring the distance continously, i. e. beforeit is in the so-called 'track-mode', the distance itself has to be determined by an acqui-sition process. Older types of onboard units used a moving gate for this purpose. Thoseunits needed acquisition times of 30 to 60 seconds. After changing a channel, 30 to 60seconds ellapsed until the receiver is geared to track-mode. Modern units use digitaltechniques for the acquisition process and need less than one second for this.

12-9
During the acquisition process, the pulse pair repetition rate is approximately75 to 150 pulse pairs per second. This rate is reduced to 15 to 30 pulse pairs per secondin the track-mode. In the case of localizer channels, a pulse pair repetition rate of75 to 100 pulse pairs per second is maintained in the track-mode. This is done in orderto obtain greater accuracies. Owing to the fact that VOR-frequencies or localizers areallotted to the DME-frequencies, the right DME-channel is automatically selected by theVOR-receiver.
DME-Coverage
Here, the same applies as in the case of VOR.
DME-Accuracy
The ICAO limit for DME-accuracy is either 0.5 nm or 3 1 of the DME-range. Today mostof the DME-systems are much more accurate than that ICAO-standard. Modern equipment haserrors of less than 0.1 nm. Fig. 2 which has already been mentioned earlier, shows theerror behaviour of a modern DME-equipment. It has the typical error noise again. Thestandard deviation is 0.06 nm (ia) here; the mean is 0.02 nm. The plot in this Figure isobtained from the same test flight as that mentioned in connection with the VOR-error inFig. 4.
TACAN-Systen
The principle of distance measuring has already been described. The basic principleof azimuth measuring is the same as in the VOR-system. In the TACAN-system, an antenna isrotating at a rate of 15 rotations per second. This causes a 15 Hz-amplitude modulationof the twin pulses which are radiated. When the antenna poirts to North, a certain groupof pulses is radiated as a North reference signal. In addition, an amplitude modulationof 135 Hz is produced by means of a certain construction of the rotating antenna. Furthergroups of pulses are used by the ground station to indicate a North reference for a sogenerated multilobe signal of 135 Hz. The 135 Hz-signal is used as a fine measurementsystem of the bearing.
TACAN Bearing Receiver
In the bearing receiver, the reference pulse groups of 15 and 135 Hz, as well as the15 Hz and 135 Hz-tones have to be decoded first of all. The reference pulse groups areused in order to determine the phase relation of the two tones. The phase of the 15 Hz-signal is eaual to the bearing in degrees. The 135 Hz-tone helps to improve the bearingaccuracy. A phase angle of 360 corresponds to a bearing angle of 400. As far as thereceiver is concerned, the accuracy is thus theoretically improved by a factor of 9, ifthis fine system of 135 Hz is applied.
TACAN Bearing Accuracy
As in the case of the VOR-system, the bearing accuracy of the TACAN-system largelydepends on site conditions. If site conditions are favourable, and if modern receiversare used, accuracies of up to 0.20 or 0.50 can be achieved. If the conditions are lessfavourable, the accuracies may decrease to 20 or 30. In case of both poor signal and poorsite conditions, care must be taken tc ensure that large bearing errors in the 15 Hz-tonedo not cause a false acquisition of the 135 Hz fine signal. This causes a bearing errorof + 40 0.
3. DOPPLER NAVIGATION
A doppler navigation system is a dead-reckoning system. A doppler radar measuresprimarily the ground velocity of an aircraft. This velocity is measured in a coordinatesystem which is fixed to the aircraft. The aircraft velocity related to a navigation co-ordinate system has to be determined by means of heading and attitude angle of the air-craft. A navigation computer is used to determine the position of an aircraft with theaid of the measured velocities.
The advantages of doppler navigation are as follows:
1. It is a self-contained system onboard the aircraft.No ground stations are required.
2. Velocity measuring is very accurate.
3. Doppler navigation can be applied everywhere, i. e.even in underdeveloped areas, where there are only-very few radio navigation aids.

12-10M
4. Doppler navigation is possible under almost allweather conditions; only extremely heavy preci-pitation may cause disturbance.
S. As no ground stations are used, no international
agreements are necessary.
6. A doppler navigation system needs no preflight
alignment procedure.
The disadvantages of doppler navigation are:
1. The position error increases according to thedistance which is covered.
2. The short-time accuracy of the velocity measure-ment is not as great as the long-time accuracy.
3. A heading and attitude reference system is re-quired in order to convert the velocities into aground fixed coordinate system.
A doppler navigation system comprises the following components:
doppler radarnavigation computer
heading and attitude reference systemdisplay unitsteering indicator unit.
Fig. 7 shows a typical physical configuration of a doppler navigation system. Many navi-gation computers are able to carry out the necessary calculation for area navigation. Thecontrol display unit (CDU) can be used for the following tasks:
input of take-off position of an air-craft into the navigation computer,
input of way-points into the navigationcomputer,
presentation of position of an aircraft,
presentation of the distance of an air-craft to the next way-point, and similartasks.
5.47.3
SOC RTA y 4.5a
190(5.5 (3f53CM
1. 50a
(IS.556.12 - J' .0
SH (0.26 CIP)
I5; .... -CDU
Fig. 7: Typical Doppler Radar Configuration.
CDU : Computer Display UnitRTA : Receiver Transmitter AntennaSDC : Signal Data ConverterSHIU: Steering Hover Indicator Unit
Similar to the deviation indicator in the VOR-system the steering control unit can be usedas indicator of the deviation of an aircraft from a certain track.

12-II
Principle of Doppler Radar
The principle of a doppler radar will be described briefly by explaining Fig. 8. Thetransmitter of the doppler radar sends micro wave energy to the surface of the earth.This energy is reflected from the ground. Part of the reflected energy is received by thedoppler, radar and evaluated by it. Owing to the fact that the aircraft is moving, thefrequency of the micro wave energy which is received, is shifted due to the doppler effect.The velocity of aircraft is calculated from this shift.
In order .to determine the direction of velocity, it is necessary to radiate at leastthree different beams to the surface of the earth. Most doppler radars direct four beams;2 forwards and 2 backwards.
FREQUENCY \ FREQUENCY
DECREASED / INCREASED
(FT-AF) / +AF)
Fig. 8: Principle ol a Doppler Radar.
Doppler Noise
Since each doppler radar antenna beamr has a finite beam width, the received signaltherefore, represents a frequency spectrrfr., and not a sLngl, frequency. This frequencyspectrum causes a noise which is typical r:f all doppler radars. The velocity error mainlyconsists of this noise. The standard deviation is approximately
a /0-50 S v (m/s) [m/s]
for all usual types of doppler radars, and thus it depends on the velocity. Fig 9. showstypical doppler velocities as a function of time. The along and across velcciti of a jetaircraft during take-off is plotted. The smoother curves represent the velocities by an
150 -- ,--VELOCITY, MEASURED BY
B (79 DOPPLER RADAR V
Io. fXJ 100W
Vy
50
0 20 40 60 80 1o0 120TIME OF FLIGHI Is)
Fig. 9: Velocitjes measured by a DopplerRadar (.) and INS

12-12
inertial navigation system. At first, the doppler noise is small due to the low velocity,but it increases gradually while the aircraft is accelerating, and finally the dopplernoise reaches about 2 m/s (ia). The doppler noise also leads to a limitation of naviga-tion accuracy. As far as typical doppler sensors are concerned, it is approximately
As - VO.OS dFmJ [m]
This equation shows a basic behaviour of doppler navigation systems: The positionerror depends on the travelled distance (d). For this reason, the error given by themanufacturer, is always related to a certain distance, 10 nautical miles, for example.
Land Sea-Effect
The back-scattering behaviour of normal land differs from that of sea. As a conse-quence, there is a different doppler shift over sea. Many doppler sensors have a specialso-called 'land-sea' switch which takes care of this. Some doppler sensors are able toeliminate automatically the land-sea effect. Above water, micro-waves can be reflectedonly, if there are irregularities as sea-waves. A completely calm sea is like a mirror,so that no reflected signal will be returned to the doppler radar. This may happen over-head lakes, when there is absolutely no wind.
Further Errors of Doppler Sensors
The following table comprises further errors of doppler sensors:
error source type
beam direction scale factor
transmission frequency scale factor
frequency tracker bias
installation bias, scale factor
calibration scale factor
read-out bias, scale factor
The total error of a typical doppler radar is approximately
0.3 % + 0.25 knot (1a)
This error is related to a distance of about 10 nm.
Accuracy of a Doppler Navigation
The accuracy of a doppler navigation system largely depends on the performance ofthe attitude and heading reference system. The heading error is of special significance.An example will show the navigation accuracy of three types of attitude and heading ref-erence systems. These systems are:
1. a simple gyro-compass having an alignment errorof about 20 in azimuth,
2. a high-performance attitude and heading referencesystem having a random drift of 0.1O/h and aninitial alignment error of 10'.
3. an inertial navigation system having a randomgyro-drift of 0.010 /h, and' an azimuth alignmenterror of approximately 3'.
The following table shows the navigation errors of those three above mentioned na-vigation systems; i. e. for a flight in western direction, as well as for various dis-tances: 10, 50, 100, and 200 km. This table shows that the position error caused by thedoppler noise is relatively small in each case. With regard to a reference of the qualityof an inertial system, the total error is essentially caused by the scale factor and biaserror (0.3 % + 0.25 knot). In the case of system 2, the error in East-West direction iscaused by the scale factor error, whereas the error in North-South direction is mainlydue to a bad initial alignment of the heading reference. As far as a normal gyro-compassis concerned (system 1), the error in East-West direction is mainly caused by the scalefactor error.of the doppler sensor, whereas the position error in North-South directionis mainly caused by the heading reference.

12-13
Errors caused by
System Flight Doppler Noise and Scale Factor and Bias Alignment Error Total ErrorDistance Gyro-Drift 0,3 S 0,25 kn in Azimuth
km East-West North-South East-West North-South East-West North-South East-West North-South
10 17 m 56 m 30 m 19 m 0 m 349 m 34 m 354 a
so 38 605 150 93 0 1745 154 1849
100 53 171S 300 187 0 3490 305 3893
200 76 485S 600 374 0 6981 605 8S11
10 17 17 30 19 0 29 34 39
s0 38 44 ISO 93 0 14S 1S4 188
100 $3 84 300 187 0 290 30S 35SZOO 76 198 600 374 0 581 605 719
10 17 17 30 19 0 9 34 27
so 38 38 1S0 93 0 44 154 1I03100 S3 S4 300 187 0 87 30S 213
200 76 78 600 374 0 174 60S 420
Table 1: Errors of Doppler Navigation Systems.
Limits of Application of Doppler Radars
Doppler radars can be used up to a certain altitude above ground, depending on thepurpose they are to serve. The maximum altitude depends on the performance of the trans-mitter as well as on the principle of operation. The maximum usable altitude is about40 000 ft.
There are some types of doppler sensors (e. g. pulse doppler radars) which cannotmeasure velocities below a certain altitude, i. e. 40 ft above ground. Nor can manytypes of doppler radars measure velocities below a certain velocity, for instance below80 knots.
Lately, doppler radars for helicopters have been developed, directly operating onthe ground and having a velocity range of negative as well as positive velocities. Veloc-ities obtained with such a doppler radar are plotted in Fig. 9.
4. INERTIAL NAVIGATION
Similar to doppler navigation inertial navigation is a dead-reckoning system. Posi-tion and velocity of an aircraft are determined by measuring their acceleration and pro-cessing the acceleration data in a computer. An inertial navigation system has the follow-ing advantages:
1. The velocity is determined instantaneously and con-tinuously.
2. An inertial navigation system is completely self-contained, since accelerations are measured insidethe aircraft. Therefore, it is non-radiating andcannot be jammed.
3. Navigation information is nearly independent of themanoeuvres of aircraft.
4. Inertial navigation currently determines azimuth-,pitch- and roll-angle. It is the most accurateattitude reference system.
S. Inertial navigation is possible everywhere and underall weather conditions. No ground stations areneeded.
Inertial navigation has the following disadvantages:
1. The position'error increases gradually, even if theaircraft does not move.
2. The equipment is very expensive (approximately0 110,000 in 1980).
3. An initial alignment is necessary.
A typical inertial navigation system comprises the following units:

12-14
navigation unit,
control display unit,
mode selector.
The navigation unit contains the major system elements and the computer. The control dis-play unit has the same function as explained with the doppler navigation system. The modeselector is required in order to turn on the system. Moreover, it is used for selectingthe basic operating modes, such as stand-by, align, navigate.
Error Behaviour
No detailed description of the way, in which an inertial navigation system operates,will be given here. Only the error behaviour will be explained briefly. The errors arecaused by errors of the gyros and of the accelerometers. As far as the gyros are concerned,there are constant drift and irregular drift errors, whereas bias errors are the importantones of accelerometers. Fig. 10 shows, what effect such errors will have in a platformsystem. The left hand side shows the effect, which an accelerometer bias has on vecocityand position. It can be seen in Fig. 10 that the velocity error is a sine oscillatingwith the so-called 'Schuler-Period'. The position error is a cosine and its magnitude islimited. The effect of gyro-drift can be seen on the right hand side. of Fig. 10. Herethe velocity error is a shifted cosine also with the 'Schuler-Period'. Owing to thisshift, the position error increases nearly in a linear manner. There is an importantrule of thumb for inertial navigation:
navigation error in kilometers per hourcorresponds to a one hundredth degree perhour gyro-drift.
Inertial navigation systems being used today in civil aviation operate with anaccuracy of about 1 nm/h. A MTBF of approximately 3.000 hours is achieved.
eSt Dt 2
/// /
6A / IV /
(92 84 min R
Acceleromter Bias Gyro - Drift
Velocity Errors
/ 3
/ /
Big 84 min 84 minI.t; -
Accelrometr Bias Gyro-DriftPositions Errors
Fig. 10: Error Behaviour of INS.
* S. INTEGRATED NAVIGATION SYSTEM
It has already been mentioned earlier that it is possible to improve navigationaccuracy substantially by combining various navigation systems of different error be-haviour. The combination of radio-navigation systems with dead-reckoning systems isparticularly effective. A simple integrated system will be described here as an example.This system consists of a simple dead-reckoning systeq aided by DME distance measure-ments. Both systems are integrated by means of a Kalman filter. The dead-reckoning systemuses heading, true air speed (TAS), and an estimated velocity of the wind. The DME-inter-rogator is constantly switched over to frequencies of different ground stations (multiple! DbM).
The position errors of a dead-reckoning system using true air speed, heading, andwind, are caused by the following sources:

12-15
1. inaccurate determination of true air speed,
2. inaccurate heading and side slip angle,
3. unknown wind conditions.
Taking into account the above errors, and in addition systematic errors of the DME-groundstations, the Kalman filter has to estimate the following elements:
1. position errors in eastern direction ornorthern direction, respectively,
2. scale factor error when determining true airspeed,
3. heading error,
4. wind velocity in eastern direction ornorthern direction, respectively,
5. vector comprising the systematic errors of theDME-ground stations.
2The cycle time of the Kalman filter was set to 2 seconds. The DME-station was also changedevery 2 seconds.
The mechanization of the Kalman filter is of the closed loop type: The results areimmediately used by the dead-reckoning system. The advantage of this mechanization is thatno great position error will occur due to a strong wind, for example.
During intervals when there are no DME measurements, the navigation procedure con-tinues using the wind and all the other elements which were estimated by the Kalman filter.
Flight Test Results
Some test flights were made by a HFB 320 (Hansa jet) of the DFVLR in Braunschweig inorder to check this simple multiple DME-system. Fig. 11 shows two of these test flights.They were made across North Germany. Altogether 10 different ground stations were usedduring these flights. Figure 12 shows the degree of accuracy which can be achieved. Thecross track error as well as the along-track error are plotted in this figure. When theaircraft had reached an altitude of 4500 ft, after 10 minutes flight, five different DMEstations could be used. Afterwards the navigation error was always smaller than 100 metres.
DH
HALBE A
..........
Fig. 11: Map with Test Flight Paths and DE Stations.
IN

12-16
0m
200-
100 OCR ICROSS TRACKI
0 I
2000 4.000 [sI 6000-100- CALALO TRACKI FLIGHT TIME
-200 -1
Fig. IZ: Cross and Along Track Error.
The advantages of this integrated system are:
1. The accuracy of the VOR/DME navigation is improved.
2. The navigation is not interrupted in case of lossof DME signals.
3. The wind is continuously estimated and thus avail-able onboard the aircraft.
4. The system is suitable for precise area navigation.
The disadvantages are:
1. A digital computer and the necessary interfaces arerequired in addition to the standard equipment.
2. The site coordinates of the VOR/DME ground stationshave to be entered into the computer. This meansmore work load for the pilot, if there is no devicefor automatic entering of these data.
With regard to the necessary digital computer, the following has to be stated:during the last few years, the computer development has made great progress, i. e. thecomputers have become smaller, less expensive and more efficient. There is a possibilitythat all aircraft will be equipped with a computer within the next few years, which isable to make all calculations for both the dead-reckoning and the Kalman filter.
Even better results can be obtained, if an inertial navigation system or a dopplernavigation system is used instead of the simple system using heading and true air speed.The navigation accuracies thus achieved are of a very high degree so that such an inte-grated system can be used as a reference system for calibrating radio-navigation systems.
6. REFERENCES
[1] KAYTON, M. and FRIED, W.R., "Avionics Navigation Systems",New York, 1969.
(2] GELB, A., "Applied Optimal Estimation", M.I.T. Press, Massachusetts, Instituteof Technology, Cambridge, Massachusetts, 1974.
(3] LATHAM, R., "Aircraft Positioning with Multiple DME", NAVIGATION: Journal of theInstitute of Navigation, Vol. 21, No, 2, 1974.

B
BIBLIOGRAPHY
This Bibliography with Abstracts has been prepared to support AGARD Lecture Series No. 108 by the Scientificand Technical Information Branch of the US National Aeronautics and Space Administration, Washington, D.C., in
consultation with the Lecture Series Director, J.Renaudie, Chairman of AGARD Flight Mechanics Panel.
A great number of documents have been published concerning flight test techniques - the following list is aselection of AGARD documents and other publications.
AGARD DOCUMENTS
M N I - AGARD Flight Test Manual (4 volumes) 1959
CP 85 - Flight Test Techniques 1971
CP 160 - Take-off and Landing 1974
CP 187 - Flight/Ground Testing Facilities Correlation 1975
CP 223 - Flight Test Techniques 1976
CP 260 - Stability and Control 1978
CP 242 - Performance Prediction Methods
AG 160 - Volume I - Basic Principles of Flight Test Instrumentation
AG 160 - Volume 2 - In-flight Temperature Measurements
AG 160 - Volume 3 - The Measurement of Fuel Flow
AG 160 - Volume 4 - The Measurement of Engine Rotation Speed
AG 160 - Volume 5 - Magnetic Recording of Flight Test Data
AG 160 - Volume 6 - Open and Closed Loop Accelerometers
Additional volumes of this series are in progress. A new series on flight test techniques will be produced very soon.
BOOKS
Very few books have been published about flight testing - the following one was formerly used by the FrenchFlight Test School, EPNER. In spite of the age of this document it remains widely used in European countries whereFrench can be understood.
Essais En Vol (2 volumes) by J.F.Renaudie published Dunod France 1960.
! "

>1 4- 0
0£ 03 (bo 00 A L C 4 Wcc 50 4 0la - U) U) u o~ w 0- 3£C*Q r 3 .
0 D 4 t 1( u. c4 U C 0 3'4@0 L LO O"UCF- -0 )= u(AD 9 Ec 201 0 (*0 L-. In 0L - C -.
c.0 a-- -4Z1, 14I-c L 0- 4-t 0C VQ~ J 7j MI4 3- C
o D C :D0 w 7 4- c- * P C- 0! . - M -. ua- C C 400 or 0 10 4- O 4 L--- -lC 40 Q .1 4-mC- 0 C'--CLC OP. -. 41~ W f-C0 - 0C -~ -u~ ul - 0-10 0 - C 3 - 0 L 0
0- 0 " .-- < (D 01 0.u OCe .- wN3u XCL---- £CCOO"CECOCL z cc i 0 I N - 0 .- t-0 0 O 0 30) 00CtfQl: 4- 1- C I EOL(-
Go0 0 0- 9 w L -~- U1 4100 E U 4 0E-0a0-- t 4 _ Er( CO4 01 C 0 - w >0.1( - E .0 4j tL o - V 0 4- 4)100- -1 0 -0 - 010 )4 u LUC L r-C>" - -
".C- E*4u.1-f .91m o(aq-0C')- Dr 0t C 0 LM1LC 0L U ap0.1- c CD 0a 0-Ato r- &6 -4 4C U-03--3- C0 W .c0 to1f- 0- 30- PE01 QC C
M L. L -o0 4.O Q -0.L..-- w 'c4 m. 4 1 - * 4L - " L- C01a- 0 - 4) 00Ca V) 01-- OZ -- - OC'M L- . - - a- M 1) - L " lo- L 004 C -- 0
M-4 1 t - h -. in 4 .W- 010 D 00- L 0 L L - W U C - 000In 0" 0 1- Z . C_- W '-C M E -- >- -D 0> t*U- 40 Q) E--0.E04-o U) CZIAOC'40 a N..- 0 - N 0 1* L IC0 0 M0 "- op1go- '- -0 MC - L C
016 N. O0'-'-O L a0 - t 101L1-0 00 LO 0) -U I-> 4 0 fL 10 L30 - Q00DC - - -U Ln Ol>COP L IdL -C_- 0 -. C 0 .r 4)0 L >"- o cO 0 >
O ~ 9- .4-2 1'. 0l4O~.C -4C C .'- >10 E UL ) L'L >0m4z0-0 -4u-0U 0 0"- 03- 0 V)- LM10-C-0
02 E00 ()4 :) " -4 C -.- - - u C 0* c ) VD> -.. u- 0- > M1£4-0 a C0 0 OP *0 - - Ul 1.--- >-Lt £O O U C a 'D EL£V£0M1-0 C - L - a-4-.-4- "- U
C L) (0 - ix - N. t, - C00WU 0-'0.- C 0-0 E*- L10 C 0,0100.0 L- - -N 10 1L0200 - O'-ul(202 -4-u - 01 r:cL- k - 0kc a- m0 0-M 0c00 010 0- U C t L-- 1') C41,7WIX- - U) - L ( 'oIC MO--~1 '- a U) - . L4 t -0.- - N 0) P
U£0L 4 Q X0 .414 4- -D..Q£0 E0 0- 4) 0 'a (I'- U-0 C- Oft-L f-0.0 - 0 431-0 w 1-.-0'-C 10 -0 -3 ay >.- . *4N1 in*1044 -< Q Q
3 C 0- . - wi (L 0.- T x cC C- WC - -4 21L 001D4- 0 Z E 3- >. 0L- L0 V0C I) ' to 40> -4-a:c Mz C0- 0) 1) CN L .0 'C - OC4-- -- CDo I- L 0E (A U) lW1- -" U 0 ~ 00 u CL C_ t 4f 0 *> -4 - - . ; zOo> a 020 -UUL-i oz c> 30 c L- m a E10 10 - r- N4->1 3'~ 0004-W w 0C r- -'- " CO'- t- *0C C - " W W ) IA- 0-0 g- m 0 -)0-aU0 c 00 - C LCh -P- 1-P- W -V) 0 L Z0040 3C " C* 01 L Q1_. 0 -C- 0£ rCIc 10 co 0 00Inm m4 IL 00 4-O 1 L- L O O 0 OZ0 al 00 0 Cc "-C- 0-0-0 - D 0 A4.
n. 0 U>L 44 '-' z V m M 9 L t)-4 U) W0 CM 1 x-- OWC 3D -O) D---Cm-OC> DC4 *0 zoo M0 O0M 1 < 3L C ---. 0 > 0 Q0x U N V) M atoD - -0O- Lt.t4 1- ~ c .44W.~ 4 -0C -uO0 UW 0.-'DV4- a 0 W00 -JW DC 10 -L C U - D 3
P.- u)'= - 1.tZ--0 4 1.- z 0 C -o0v *Ec c C - C C *-N.'* P- 0 4-MC L - 0 -OG1C 0 0L1-0P00 f.- C w V (I0." #-N t A M- C - (DW 00 4- 0 1. -0 LN I- N.0D1 - . 3'Q.-Q.0001L £-
a -4 ~o4444 4 ) fl )4 3 0 _j M 0 WDu uOU 3 03 CLQt- D4 C MZ 4 0 0 ~U.0 - r_ a
c a:. w 0 0 4 0 U-.1 I. 0~ = P M 02xI - 1*.4 0 MA 0 of- .44 W c a
z4.- ID U Z 0 . M -0 91
M A.- CLW 7: - q1 0. Z*-c0_-_- :30W -0 (au U '- 02 1 ( W Z' WW0ulz.4 (ft
-3UI- 0z u u ( 0 0. WO £0 u l wOP- (304.9- so
*WU C. 0. _j OP X ) O-2 '-1 -W '-0. L.W- IA' 103'. .4 0 C Z Z'O (341 D V)- 00.L
>..dl >WW..4us W 0C2(40 22 Tj V)w UW4-'0 f-0 0 a = 2 -?' UA L W j1-0 C
L)b1-2 - I N 0- E W X 0 00.400 0-- 4 -us 3: M.-Mo- 00 0. CL U3U) U U -N., Oft)
0- w-J a ( USI- 02 000 a > CWW 3E( l3 nU ~ V G.N OC (3 U. Z 0 - W 0 0 V) 0-U0
4 :)-m D U) -441-1 w 1-UJ 0 0- WN _;4) 1Jz hwt w w L- '10 0 L _jO m1 E 2:1- COz z in .4P 0-402 V 4-2wUJ r L W LL C' 0 1-' )- 02Z4 V OPuw~'-u 0 .- *If £4 -9 COJ- (N 01-1 N -0. 4 £ Z - 4
-w 21'V) D0.Wm 0 01') V) 0 N- 4$-PZ 0 0 44wV1-40.L -. q A. --%n U10. -CD0 - b1IJ ' II)
04.-1IL Z D 'nZ _j .lW O0 f0-3- . - A ix I C *- Z0 CC024 010 0 CL C."0 t 410 2 z 0 x: . l> W- -2z1.- 0 ' .4
D 00 - - 3- & -4 C'-IL .- ) - U 100t- -0-u) 0 >030.0. *at80r02 &1- 4 40 01> Wl aD OLO.'Z1 4- P.-Za0 0-.4w.9 :ho-Cw cc- c C42 z ~ 2 10. 0-- L 1>. 0- ',, 1- 8 1
.- 1-:0 "-OWs 4 v44 I.- S1L.£O *_ 12 0',0 _. !- n .- *U0.Ir:)- L. c >. 0 021'C4 Owjozif- U)-ccl Im-
_j u -4N 4 0W 0 f 41 -. OPIL 4O CL. US 0 -1W N. Jw USc0 4 1- I e 4-9 l IM a 002 0 - . . - :Un 0 L.0.4 _,- !jI.)- U.- 2*-- c0.or a . .4 Q00 to0 4w I- t- 0h 40) low4W~ .N 4-4-J4 -P U. Ci e 010t A !
o~zg w "! J.2 8 .. -('4 ". 1-4 4-9~ a~-(-0 0 .0 4- 0'. N. 00. -N.' 00 C. Ia- * -00
a '. 4- 00- U) > I- -t- 0.2 41- V) .0- 0 01-C'M* 4m -A I- - -0. 0 w 0 COOJI £00 Z c £. - - 04 4' 4. 0-O)L. &0 .6 0. e. u O It 41- *0W4 4-U *u W-j' 00 1-IL a *4flo2a -IA4
LI 2 f. -9 a- 4 L0 a Zm CieL~~~ ~ ~ ~ ~ 2rZ'dc -w -
--- 0100 02-'> 22 -C D0 44 IL 4-00 41- E --.- 2 5-00)0. z u, Q00 0 a$--Zm' ft I.- 000 -)- Z >.t10.)
c . 04 ' a 0- z .- 00. 4 v a; P 1 - - 0. (3 z 2~2.(n 4 £Z -- 20- P.0)10M.IL Ul I.- 'i -4) t-0 1-- :)I 029:X l-IL-4 2U to . L - =4 QS x 4 1 4 PuWW u
.. L._ .- Zwsv :a *- 02J *-ZS- t- -;U -'SL ;W u0.K0-- j a 0 t @.- 3B 1-Q. 0 2 4 t-3 11 -- 4 u cc Pl -ma I 24 1-01
Z 44* . 2 o 249 "11 A 2 .4 - L.4 -4it0 N%14 z .4 440) 4 Am0 A ~49 P

B-2
SI 4w
C. 0 0 E 01- -4
C - 0 0 0 C 4- _ C m- -(' C -0-4.' fa 00 alo 00 0) a O- >uQa xc
Uo D'C L . 040> MCLL 0- C .01) aC'~- M C -.>-.' a-O C -0 C Q4- 0 C-C4000C>. 0 >- 0 C0 - 0
!: CIA z i - . :;0 0- L 0 0 E0> z 0 0 .. jI h 0 ->00 3-~c - C m - 0 -'-O C. m 4~ CU L' -- E 0 ECVv0tLaC. C- 0.'O-D.C L 34J-L 3 0t) 0-U O LL.-'.do G.-.C all 0 E , C - C ( wU)- > L
C m 0 404 ( M D 0- C' W-4 O0 0 L-' 0 00- ( iU 30) - -C M .M - 10 L - a T 01-- .- E( 4 L (_L 0 0 t-) D- '- 0 - 1DE0' O -L C >04)I LC- o(D I CO.. 0-IV OL- C- -1'-4EE 0) 4) CLC 0..'4 ) - -- O-A
OLL0 a U E L 3O Zo -4 - L - L (0 0-C0OO O -4 0) C 0W C ) QO. -#A 0CC'.) . 0-O0WLO0 - 0 0 ) 0I' Dl - -0a0C0 - 0 c L4C' 4. 'DC' *0C E 0 L D D C_31c- VC inC 0t -- %nL OOr- COE a.)>'4..'OCLCM0-' E0-1' - > EC -- 00.-o 0 - 0 ' 0 - U 0EI.00 L 4L- c '-00- I E P LV -- - -O UfC L - V 0 00 0CC 0 - O 0M 0 -0-V CO a)--L& 41 > 0 c - 0a 40 - ) -3
'0 L -0'- -U-.'O00 C0M00 *- 0 CE -0 l -0- (E 0U I - 0 0 L-10 IL3OE-In I C U C ID -U 0 0-CL ( C4l 0"-- D 00m U) -V C -M 4 . 4)Vi . ->O - U 91X01M4T : ;W M- - r- WOO N - C(0 C-C -CO-N. r sE < W 0. fL CL-CDCL- UCOLS
E OV O U . 0 LC') w) 0- C4. M >0 ON < 'C COL O-MU-- 3 C 0CU0 VOW0- > D U 0- a C -*U) -'0E E 0 L M -0 W-M0 0 L- 0 0- VO. d'E >
C >- C14 - M CLW0 n. W- M u-00 -E- VN 0 4 .. E - CI fL M UL C LI)U->W (D O -f- r U- ;- 5 U) C L)- -O V Z M Ca) :3WEC -u. - U 0 - ..C_E - 0- 0 -'4Ot' u 0-'I-L) a *U)-- -0 to m-'D' -En ~ C OAI - .- C- C 0 C.-'flLD
CL - 3n-'. CO.VE.- C L U) 0C-4' 0 0 0-- - 0 00a40uC-' L - 0C U z ' > ) t-0 -L - 4b - (3) M 0 0 -'- L- --000 1 ) to L- .0 0 to- ) -- C LU t 0 0C0
-1L C D a. I W - O -O- Z) (- E0) CEU )L - - -U LfO C0> - Cm - - -4 0>C>-' Q) ) C )L.- -1 L -- U) CLC a UC0M>. M U-- C>U - :31 U)'L> '0 V) C
10C -0 0 c 'D-0- ( cW LOU '0 ---. W'C .'- 4 0) - .C--0 0-'U E)--C4-'-- (a0 - C-C-) 0.0 - CL C 3C' <0 U)-.'- U -000: CL C0 to M 0 X > L io U) LU-V
c f C)0) U 0 m --00m (a- -- (-3 >EU"uU z0 C- .0- 4C3 6-0 C_ -OC C L 0U C - VC ac > ~ 4) - C -0.-E U) - C- - 0 0)-CUVE )0 0 aL0
OW 0 Cd 0~- C0 - U M0 --L) t toL * L- '- 0 - 0C V' L 0lC)(0 -- OCLI 000 3 cOL -- MU. C W--e U COOCUU)-MLLL0U) C.0 -C 3 .C-D-4 £ wC>0 - 04-u C'.' 0 00L 0 : - 1 -t "- I O- C 0 C 0 -0 O_' 0-- D( 003> >-C
aC E"-0 - 0 FVVOO 0 - CO O MLV0- 0)4 a>u 1a .-- LNV - C 'L) 010> E4U-a -D -D )0 0--'U--''CO C-) (LW~ 0 m - -C 0 Q,0 C V) 3 U)E>W CLV L' XWLM
4' L L 0 L0 . LrD - 0 - CU L0d0- a)Z- - O 0> .< -CW CC0 C C L 04 0 1- UCCu U COLO- C a) .- 0 jC 0.- D -C.' 0)u ED - 0- - - - ---. 0 00 0000WW 3IOW - U 0-V 0. 3 -00 - E t,-- a )0 0 ) -- ' OCUUOC r-0- LC -CL)'V aO G -4- ) .
V)W M-.D'WCU)0 M -' 03C.I7)- -- L -0-.-' 0-0C ( 0 0) L -0O- 0 > L0- 3 OE-0a'. 0.E W- E U) V - LLO < 0 U (0 U -LE.-' DMO 3 UJ -L- Ul U - 0 <--WC00.'0w
0~ m~ 1-J.'0 L-. U) 4--U00 44.- U)Cw. U_ a 0 0 C0s _ 0 )A)1 0Lr-fOC0 0 GoU3go)Z Z 0- -- O. - CCCr C00-4 0
-JO -OO-' M'0 0 -JQCNOaOJOO D o V0 L--'03I 03U- -0)C >U4f0.-UL C-C --EC-- -QU00 E LC I- UU)@0-Mr-- C.' a 000
C C')10-0OW4-E'E-0'I hJ La M I--'C'-LE0 O41 U) ;I -00 V 04ab-.
0 0) i- U --do0U)c14 ~ 0 0LC0 L L 0C.1 V - LX1 0) 0) L - nV et C 0
W 4- C)5- 0 m I m aV CA (a 0) C C- -C 0 C VO O 0- 0 0 0 4. 5 0 to CC- L ZID )f
Q C Y 0 0u -C -'- C ) 4 -OL L a 0> 0 a 4)-I-- C4O C 0--0--O a (p)1-U VW-m 0 C0 -' U) C CO V 0 U-00- df 0U >3 -L 0 I -0 0- C E.DEC. - C 10-0 OC-C"I
C. 0 OC E -U >O 4- .C'- 0 a- Q06 Q<3C 3 0 0 MO-.' Q> - l 0 0 am . c- --1- C(' 0-0 c -c- L OCO1 0 4 3 -C
0 L 0-CV0-W U 0 'M- U) - - L LxVo _Ot Q; VO.L r LC0 0 ) L.- -00.- 4 -C) 0 - 'U EC M D ID U00 0 D0 (a L~. 00 3
0 . -- 03 C 0 C Q L-')0U)U0- L OC. E L 0 CM00 00. >-'OOOLI (zL- -C' ) OC .- r ). 0 PL L0 0 . - C # l
-Ec 4 0 1 a a)O LU) V-'- 0 aC 0 U-C * - (n- 4- C -U0>0c - 0 001)>000f - O C-- u -E V- n 0.UL-4 - CL 4) VCNC. T 0 . 4D E- toC - - -0. Q'00 r_ C3 0 U) U_-4
0 0 3 a0 4) C000EC 0 0 C- if-COm L. - 00 0 -- u c f ito:k-13(G C L -W lo- 01 0 0 u 0 L - N 0: C) COC 03 L .)O L JOL C
>- - -0 L"-0D -L C4 4 3 0 0(P 0 03 E 0 >0 0"-- 004-DC ) Mt C- uL -0C C L V0) C( '0 4-) W- E -0 o .000 00 >O1 0 - -U < 401 010 2CL )00 1-CO V0 - wL- ' 0 04- :;MC4 -
3 C -0-->- 00 I j> I N -u 00 U--O - LC U). U L- - U -OCC -O C 3u s>QGo C - LIO E 3- D 40G0- 0 30- 1 C- 0 C 41 0 0O .r-3>0-L01 U O L ( 0. V- 00- EL LL UC 0- - -0O 0-' L0;' Q
L. C.' aV U)-1OU EC0. c 1-'to 0- ~ W'L- -L -0 0>OL -E 00 CL 0- V-- 3 0oO L -U) .'CW 03 IM- -- LLLLIL0Q
-C Cc' rL 0O 03E 0IOE w0 - > L-4 n' 4mU 03C 0&D - 0 C OO 4- 0-a n 0 M- LCD 4,' 101 -0 C-D0 0 -0 0 E0O 1 -- 0- C -- C 0 0 a LLC1 ) L-( ) : C -VC O IU- C- -0 004.O -C 00 - C 0 E - >o )CC M d 00 00 4- - N 0( -'L-oEO(a4 0OLU)L4C O0 a00-. 4C M0- 000u1 01. u4 *L 03L 9,-01- VW >3C30toto 0L0.00O- - 0 T ' XOc- 000 L 0U L-E 0..; 00003000L-0C.SU
0 C. C. CO C.OO 00 do0 )-L.g -004 - ON-- C--LOOC w_ 04 0-0-C. 0. x ma- L i-'0m0 > L LAn. L- Q LuA 4- M 4J --U. - 4- 00 C0
0- .4- 01 a-0-'C 0LO0 - 0 000 4 ES x g4)) -03 - a 0 & - aC 0 CC0 U) C- .0- - C') Q 0 00QL-4-Lw0 020 V.C )-'C ON 000 8 0a00) - --up ut aCCU 00--t j-0VO 3c. -0L0r. C--M C'-C .5-SOuu 1
0o -L-CI O- 0 C0-c') C. 3VC4 C - 00 L OOC J3U ) -4-M 00'-.-P0 - CI-~- -L LV E *00 -C', 04 Wu o a0 C 0 0L -Ca- 0 aa& LC0 *100l - ',0M0 L Or 2.c I I. 034 C 4 0 & Cz N 0 ao f- 0 0 CA z L 0 0 -k3k
at -9 ' w 0- unen f 00.'L U0 a4 Q- 0C---C' s.W0 1
OSL

W-3
0 " s 00 C ~ 0- 4.S0 r. we C C * L a 6.-#- 4'. 0 -. -g A641 Do r%.L 0 L Om - k'L ' 0-
-. LZ 4- 0 U nQ 3Z U 10 gO 004 - M0 aQgo Z- go u - c g- i --.~~~£L£~~ CC Q. V C 0 C--3,t ! aLC L D mC. ~ e- -!iu00t - -u EL E u 00- 0-Dz -- -c um4 - ;ciz ~ E.~e0- c M 0Li cm-c Cc C -- o C 20c C- g41 0- 4)mm 0 raD 1- 0:~.c - iC-0C-mlc0- Lme W ~ o4-r .- 4 (L42-0 (a -a L. ~c ~ u.LW0 0 -eo -CO O .0L >-4' mO i oamWeoeeem m Ms 0m~ lflCmO E,*L 0 LDL 0 *- c * L3 a0n 0 0 -.- -. 4 :;: -0-L- -L Om >2 Cn L. Q.4 *g 0" U 1 '0- 0.304 0 a- 1 a0 ot o -- 4- 4- Lmce' M- 01a 0 M0 3 _DL o - ED-2c 1- - L gc 0 441 00_000 - - :!:; >0 C --~ L 0 - - L4 cn er-u- a,
IC 0 3c-. .- 0 . aO cece-4 e ml 4N 00-4-L L u- 0 1C .2mm e-- u xerce - L O4C r- - u -. C -iL- 0C -r - (0. uu-a)oo C Q. > WU - U.- m 0 - 10oQ
M 0U. -1-! P 10 4) 0( C-- -)0' -j0C C.C z o3.g-D~ L-o U. ~m v Q CO0 CW.O .0 1 -4 0 VC C r-0 L 4, r.5 F 0-L - Co E' E- V)L to-m L *- M -Q.-W L)V) c 0 Qa. Lnc-wa)wU 0 -0+.
c )M ro i 0 10 3 Ui O44C'- 0o m Zc0 3( UOL4--- gouC a > C U %.c C 04 -ri U -mc 0,ceC --*CLLmu 0 - Mo CU 0L W----u0-u
4) t 0 4-4-4C. 0 L.0 L QU-D C Olc L Q. 4-i >N. W14 f-U. - L > -Z )0a cm co W < .!!EUD00)c 04-UV, -G w cUC U (D _ w.-- d *W W)0- ONgW CL
LLO.4 3L_ CN OFL .- ~ -~ L imV- c ID- x.~~ Q.*)C4. - V)m- cm c)- 4) -g *ea(n c 32 ceu mi E e--.. t M W M Ln W Z M - x 9 -to 0
C OD 10 . 4 E C L ' V M L 0 W- C L -E- QLCOLZ:- W M 0 -4-w Lg c 4)C4 r , C 4- M0 L 0C - '-4' ) - L 0) f-L x u ( ,3C - 0 cm
-E E 0E 0 4 - 2 0) M m.m t Qc "c-m0 a) L -0(o a) L - UOO4 W- -4-"-0 ZE 0eL ULu o a L c a L C4)M '0--3 C 0 -L t- -4" - LU NM LflC " E4'OrO -a0 z C oro*m 0- > u- z ~L - - n c-~ - .- E- 3 o-c.- 0 L
0----- -4 W--a F.- W- L .- M 0 e- m L 04 LO-0- * ED Oam L-L£ aC . m-c V -- .- M 3- C- E Q.U C rw)-f.- to-toM Q. o
.c--cece0- 4A 0-i *- -c- 0 MC C c> me m0 0 M- e E-L> 0DC0.O- CLa, 4i -C M~~-~ C~ - CVEMU
ag- > owo a 40t - W. >ge1-e 0 o 4a- * C Lc m C*o- -- C 00-L . >.L.- a'" C c -L*U -CL[ 04 0g4)f- 0 L 3m9- u0- L>Z.---L 0 a.-toam m-.0C A)
* 111:--; - !In4 !!-; 4 0 r-LC 'A c - 40-m 40E rafin C CL 0 Q- -"Aa- g a' 11 g----ci - 0x- 0CAx 3EO0 0C CEDlm L- U 49 OZ-D1 6 -*CL-10rCE 0gL- mm mCdc 0 NM XCeWL W-4- t*ec M o-- eo 0)L3 0"4 <c *Q- m(c4-4
Lm-m0 J.-LU M* C mcE-- LW ODL 0~r m D mc to ~ m *IfMlU3aCO- L r-03 :e3-g-.-rC' C -w M- -Q(la01Unr L '-,- UM LU- - uo.-Mn0c co - u " o -cL >.Lm0L M 0 08Z CO L 03 W -E C0 M - 0)L "- 4) 3 ME -Z< 00L :: -)> C -0 - --Go0 m > 0 4r jan n 4 3C )z C 0 L r-4 0r 0C- -Q.w ) - , 00 ~4 -O40 I-Z-UW0 LL-'40'.
*E * 00 4.4 u 93U C r- -4
lose0 * C -N V) (') L 0 -1030 ac 0 > 00 E Cern C. I -* 30. - Q. Be
L 0- Li - -> E ;;4 08- a04 -6a 4' C 004im- M u Lfl Z9)+ 3 .5CO0 - 0~-- Q 4 i01 - v >ga O 0 .0 C -00 10w u 0 4. ca
0 o - -c--pW M 4g m 0 3 4> E - 0 m Cw-C L ugr ze 04,C.-g4' 04-m an. M C Q LCO0- 00 04- U c-o0 a 4C - 4-VC - D a
M 0a --miC "0 3c a - in w u.e v - -u. c C in " - a 40C CC-.; 0 . -U 0m - Min 'E -- a- - 0 10 )- -- -l 10 L- ;:l -o!
04L4 > f-Clw 0>C :) u -- Too as a -- om)4 a-e0 30E~a- -e0 l-9 0 t-m - 0 L> - r-0 ZMC- 0,4 CC~aL- X U 0 0, - L0-40-
;:-CO U *.4 0 - 41 C L- m 43-9 LO U) C Omi C 4' 5O ->0i-* D> x C-- > -U 3 r"3L0 - cg 0 x -4E U 0o
->a-> E FL ZL- I-C J.0 ia .w -g - 0~ argoa a 01 0 - -1m gem 0& S0L L f- o cgvqum C~ -u-t c c w -a- I. - C U) -"VeC 0L 0>m 4-go- 1 ~ 4Va -- CL0 - 0C C -- in aM - 0 M) mci T * - - W-CPO r La')
a' C a " o L 01 MUEOmmlgCOlLCM0> 4 4- £44> *-ic-L40>isu * M 0 0 -uV 0 ~>a~ 0 0 -- 0 V)M z Q. rm m 0 4-o
-:0 C. L 0-c L > Ci 'A - 4-BC.-CO0 C 4-* in-E * D U Z; LO 04 'CLOD. r C~4- * c>-g m 0 a - 0004 W-0. - -~ 00 ICC U - W i--m o D-0 In0 CA - L -E 0a 04-Lc-* ur c -- i~ 3 0 c - cearm0cC C 0 a-M -gO W *O .0L C C 4 ,- im
ic - -4 0>m c- C W -Om 0Lmo 0m- C 0 C 0 -L C a:0 aeo- > 3 .- m 0-0-- 0 a' c 0oe - ma C - 40 1- 00.4- 40 Q - C-)COC4-EDSn-4 4. C*-. 30 - OLL3 Q gC 0gZ 10 IL- Z - rc -- m4---rO-OC
Q L -- 0 Q- L MID aC co - cum.-am -a - C U L U) in . - a3 U e 00-4- C- go -gm)(0 -c C 0- c V 4 3 xm to C- L-g03,0 so0-C.; 4W4 U (A-; 0- 3U 0D10- VL WaC- i I > L -- OXU - 4C 3 &L. L C-em -940-mg0 mEo0U CC 000-DO C 4 44- m> ~ ems:pq104> D-w - Z -U4-- 1)--;muL =-- -4- cc 8 mmM-& 3 ;k0-c p 3-
40 04 oo r . m n--.- o-0 a cei £5 EC0EE 0- >- 0 m OL Cco S CV 0 -00 0 -3- - 0-OC -a-V 1 ~V g- ) T 9)-CucQd0 0 GI.SEO L> - .C r-I-
0 . 0 a >-4COE c m im0U LC M-m-4 a'WErMo0c 4 *-4iC4-" -a on*- L 4-4 E *-.-- -1o0- .rgC E 10 4c- C1 C U 0-o0-.- 3E - - w- 0
OEMC 00' L6 4. 0-gwa4c s-r 0 V-m> 0
40
CS 0 431-0 N- -455to - 5 -- iMl 1 > z a .m M o~ 0 u0L
u 4 n c -M -0-0 3 L j- M L C 0 00 4-O2 Lc -- i cXg 3 U.3D 9)9 0 1 aLOOL~UO - - 0 0)C 4'4->iO'E o C 4-0 :;Im ~~o~~. 4Mw
L Me 0 X - L4-0 L,4- UC. a-.L C. 17 &4-540 C 60c - L3 L C2 UO-iUE **1U 0 Sq - OQ OOQZm-JL -A
%--6028U 0C C4-w LD 4. 1
--- Q-- *0- 0-0aacc
10-,D )1 044 S 0C U O >-i* - C 4 1' - CLOX E LW .4

AD-AOBA 530 ADVISORY GROUP FOR AEROSPACE RESEARCH AND OEVELOPP4ENT--ETC F/6 /I AIRCRAFT ASSESSMENT AND ACCEPTANCE TESTING. U)IA AY 80
UNCLASSIFIED AGARDLS-10 NLfl4 l!6f70 8
B4
4' LO 4' C #A CC rc 33 0 L- a W -1 -0 40 C 4
10 0 L' C, a Z V 0-L a .L6- c 0 00'kG 0 0 100- C a- 40 luck .0 Q 0 - i I- 4' C C4 .0 0 w- C'..C -- C -. 3L. fi C 4'0 4'E MC Umf*i-0 -0 6 0 *- 0 -(
an 0 Sa a 0 00 U O 4 . C" 0C 0 *'s-(0* .. o, >. 0W 0C4 - r LUtIW'.- 0 0 f* QD CL L
C, 0~x£ -0 u -c 0) . COc )-I -0- 66 -C a fw -- 0 tE . 2 WUUU OC- 0 E6-. u. U L--EC.O0 4 Lo~4
r_ 0 C C 20 ;: >-; C'- z X) 3. r'- c C0- 0 0 3W;;- go 0 0c4' 0. C OC -0 4E). Vd 4C - 0 0Oa'U 0 -L a 41El 0 U(0vIAo 0 L' - r -L .0 E Z u 30( (4 - u )W0(I-- _ .0 0 L
C = -C. r £--. 0 - N 0 0 0 fL 0 a a to 3a-0 M >. L ; C .- 0 aa 00(00 0Q.%- 10 0 t- 0 QA. L 00OV -0 E M0 A0 0 G6. (Q - i n Ira
0 N0) M- > W-f LW 0'Ea04'U4'"00-0- OCt' C. .2 C10 0 0c; O E 06~ 0C '510.(L IT C- E W6 0- U V i 10 -C a *CL
o * E -U Vf- -0) 0 00 .11W0-0 00.l'L L C- 1 1 a W0 0-2 bZ 0, - - -Cl 3 C W D rl - 0 - 0C- C 40 30Q 6 L r£L V- 0 _j( t -3=4' e z0w" 0 0a 0- C 3 C L O- W(0 w-VC.E 0 0 a0 E I2 .4-
X : .. C L L ; -; (01--80 '.WU MOZ " 00C 0 V,10>C 1; Q (04' 4. '
0 0 L0 W a C0W ')CE TC 04- 00 0 0UU- LU 0 *. ) &C 0. OW2E L-.a . O -0 0 r- >L0 04 C x~( -nIOO C C>£ r- a0o WULQC0 0-6 266 10 0 0.-.4 0 a-- '04 0020. * cpo 00t (2 0 r-clC
L C. (0 - 40 > a0C I0.- Q . W -*C (00 LL U 40 10 - E UflSCV M-4 0. 4 Ol'04- 0- 0- 41 >- 02e(a0 4 0 a >be COD . 0 N_ C 0 N. X3 0
2 0 5 M 'U : U D a; 0 -- I C >'.-C W.C IU- C . IVM10- - 0 400 (0o 0c 06-f D a N .. C V -q 01 e o-C *0 *o e 40 0 4' £ Ua3 C £ >1C>C <4 U~C0 - 0- uwC O V W 0 1.- 0 1'U -4'E (l "u a0)L 4 (a0- 0- 1r o 0- -( .- 6 wfl0 -Zn V) 4 C C -0
-W L > EOE.C- 'C L4L :; -6U)-LLEO-.' a0- W ( 0 0 xC. .- to0(a 0 £- L E 004 00ZW.CWL - u 32I 3 W 0 L 416)'W0E -20 U04' U IL CO--C'- 00. -U 0:30- (1 flu u 4D D (0C 0 ."0 W - - 0L 0 E 0 C -0L 0 - - to(0 0C0 a - W U > (DE M04 Qu 1 0 .- C 3- 0-C 0 M 0WML MCJ£UJ4'- CW (0- -- 0
0L f- C0 0 0OE L4U a ox V44.%0 0 'a.Cr- D L (1)uC 02a 00 0 if) 0a. 3C NL < W L 0 . L * N-*.- 0 0 0 0 C N0.- 0WO L U C In0
0 0 -. 0 to -(0 10- inC 4 >rC *>- M )C C L L NC_10-- - - CC -6 (0£.W.-C 0L CD- *-0 Cn 4 C@4 1 0 "0 g 84 0 0U to '-C
00 ~ 2VC >6~~%6
'. UCCQ 0- w-'-( 00 * 0 --c. - 10 a- L4 a ..- ( EW0-u- (a - W (- L 41 6C 4'LC -h04L woo 0£I
4'.j 4.. (0Cw "c.004- t, >000> wv0-C(0 60wU 00 a - Xu (MCS064 o CV0-0(a -C6> 6 to V00(l- 00f E0 0- 6 E * LOE 00a-
£00 10 4 1006> C- -U 0C ZIA 04DIC fi5-L2 a -CE( 61, L .0)) CP 4 CL OCoE
U M a 0 a0 0- -VU-6toC--0O .£C i4- E - - _ 41 - 3£r-WW - ul in(_j 0: . L 0 C - L 0-4 -J- M.-- L -0£ u 3 0U "0 C0 -') .JVU£.C 4N
1.- 0 - 3i£C aCfl£ 4C a a 0 Q I.- > M L Z -a) 0 Q 0 00 a-- >>.t- . 16- 0 aU4O:2 U -2 C 3 0 04. L 0 U a 'D 6 4 0-lOU---- E " (0 0 Q.L 04,Cw E (0 0 t ~-4 394'- -
* C *C C N 0 0'6 '0C. C 00 0 x 0 04- C. .. 0 0 C a 44* 0 -- J C_ L. E -- 20 6 L W 3- 00 16 a %.
> > C . 1-41 0 0.4 0D4.- 0 3 0C C. 4'IhW 4.. 4 C SC 0 L0 0 0 44 -4q 4~ '6- C. 0a0 (( 426' 5 2
CC -£- E. to -4 . fl.4CW0C0.L -0 1 0--' a0 0.4 to -4(CO 5- 4C -C - fa co >6a U CL _j4-0 4 . 0>. C r- C) . a. -iC - 0540 CO0V0O0L 4 .-. f- -J - C 0infL--%- 0 In IL 2k0 50 .6se-
- 0-CE uwCu0 - *k>66W 4 , "0 - 0 -00 C 0 u aL . '00(0 - 6a w00 EW 0 0 z CeU C L CO - - C_~>0 C(00-4 -6UCw-cO(0 L £- IXL 0 40 C U.WUO. w- > >0 -C-S 61 *0 SCC c
2 L
46' -L 46-0 ZW4I 04 4-IL 4 13 Z - C U'4. 1 - 0004. 2U0 0 0.~fl0 0O 00 -C 04 C. 4. G u--S( 3- 4.mo0se 00 030 sl 0...uM. *.0 N£. 0 0 C'S. 0 L C- 00 4'4.*.. C L
On-0 - a 0C O I%. IL.4 - 44'E£'b C O£ -- -Ed' A 66W4 0065006.- Q) 2Cso c, iaU IS -0 - CL; v s"; Cw42 0 -
0, U -rCC-CO - C" *U04' 4C 0 0 C (0- a' 60Q.6 au 60a0C.£ EC UW o(o0;- a l C. LaTUDW(ZCW 6 0 0 (0 OL L LEMLIV,-M'-5.-D0 go, 62- U L. -a 0 a 2 C 0-1.- D0 - w 4. _ £0. -- 0 aUc *.I
.5fWL0-C V 0 C" 1 C. 0' CC-G U 0 1 6. 00 -L O C- 0x v Z&I W C- C C U I: - WWU245qC L. 1- 4"6 W O -b u - O. 1 '0 '0 UW -(- 4,4, t- In to a 6£ 0in C Cl ag'-no- 6 64 60 no .13 10(a000 0 N. L L4 000 am 0 a -6r. CU a 0 L. 0 a . c 0 a *dZ .C 0 aC )k 3E4 - 4'£r 1 f- 0 - 0 E 4'C.0. -,Cca 0 0 >1W "6U".OIv 0 'CO 0--C W > C 00 010
4; ~ ~ ~ ~ ~ ~ ~ ~ U 4-0001- -1S~ ;' -_ 0&w ' ;#aOC 0 - I 2 ;~0. C. W- -£3.U C 2 0o
A) C62( 0.423- C 4W 4-."~ C, ;1- 0400U 60.6dC 6 C. 6 UEC>. 4 u'a> 0 0 -0~O.C4 - xV0 U4 C 2 6 U CCc'-. U ma CCm 0 CCCLO C V
0 20 2 9- L . C C-O w' 40 0 0 0. U4 - E - 00. M * - 0 N Ce0 6 *-9-9 C E0 0 -4'C'NI. w.0 C 62 L EOLE.C-O C 0£0-0£ 2q L. o6IW 'E 0 U-W 0 U 51 0 W - L .%U. 000 C-mE -- XC V0C4 0 0 3 E #- If4(C.-4C0004
ooC AE -6 *-* O C0 -. 31 --- 02L 0 CCa4. . C *C NU U9 OLO 6 _%-0( C *--C004. L 0W C.o 3 ) Om C~Q~ f-C9 m0 l
C.6- U- a iW 61DVO'f OS(' 66 LC0'CC C-U 01 I
304 - -4300~~~~~~. 0.4 4'U.% c o -:CLLL- U-L 3O *i---0 C~'U2-. 0-0C~I 0 1)00 Z- 0 L6 - a 20L
f LQ 0W U.I -9 4 - U. L U C 8 4 4 -14-4U 4' - .-UC.1%
4 0U 04W'4U 00U 6 4 4 P* 0C u 4 02 40464 2 0--Z-4 90-1-LQg of .a

*~~~~ a 0,00sg *~4'0 C. 40 4'6-60 *LO UOCE PLI.
c 40. 08- 56 L 0
SCOOLO £ C66-.-6 of 0.6.C 0 ' -4 0 Q 0 -L 00&4.
6 4;%*oo 4 co 3 sa .- 4.-. 0 0ZOECLU-t0 ozom Lwc C 0Q Q.L 0 ) *0' t4. d Lr UmL L ;. 0100 0 40 1t-
WO a0000 0 0 0 4pOS6 do * . .Z-0104C (.0 C w4fl0 c Wo. 0.0OL 40
EO -1UN f 6- 0 U *C 0 C 40 OP a0 N 0Oa E - 1S~ 0 li0~ Z,
i**-O1 z %. L. & L3 OU0C L4 CS *
4o-'o is a*. 0£ee1- - r£0m L 0 402 me.- !,w . .££ 0-- 4.0
seen 00 ~ 0. 4Li I- *S£ ,6 4.5E w. 4 .3 - iS 0 u 6 0 04. 00 U0
0 V CL0 ;.? LU 0Q 04 'C 0 4* :;,0 0~ 3.5 S . 0 0 0.U 4I . b
mC 0r- *.oo C "'i-!>; u.C C 4'- U..0 00.-0C..-06£ -
;03-300C s0 sW=W Mcus-Cig
C a u.e0 I o e u ga4.MoSCWI 13A *ISD £4LE0CIC
3 06 3 Q a~ u -. 00 0 D -U t jC 0 W- 0,a 2 L.a 3 Ac u 0-n -e2es ~ a 04' 0 aUo6-S-C
5C00 .1 L .0 a sC
-o ; IS. CO L c- C 4 -iS6 4. r -lCWn 0 QC ale . c4.U6..D0S
LrE Oflan z L4 Q4 0 -0a 6 0 60- In gAC -6 R) 0O.O-O0 0 4
*OmLCO0 1n X o C L -5'.O0 SC - ££
£0 0 L. Mo
In x U 0 10 C U- Ct-I&C M C 0L.W- z. 05 z~ a5l6 4 0- Q 0
**o-LC@ L a64. E..4 *Oif4 _0 060 0-0)L VCi C 06 0;4C* C - 4.a X.iSf' 4. I.* 6
C 2. 0.I .-SI4. CC C 6 -44L0 U45 4. SI4.O S CiI56
* 0 0- aUC . . 0 I- C o E . -C ~ a . W6 ' . 0 0W i ~ S 0 - g55 00 4.56 0 -a ;; , C
04'~. 60 116. 0 i n c->Sc.'iU In aNfl- .i0-- 0 6.- 4-- .6 .- 1US a6 %.-04.0 t- 10 46- C 0.> a SRa;
U0'4.O~f~7 C- *CL- 5-0 010-4 . C C 0 -OR L-0, -a-- 0-4 a0.-s uueLc- 0 1 40*5 0 4. a -0 -5..&" 0 0
a o 2a S1 S -4-f'r28i "o 060 S 6 L. CD 04 ; 2 a >L ti
r, o SC 040 L 1 C 0 1 L CID 0 6-C C SO- C0 eh> 4..C4.-O 0 6U u 040 -506-- 6. 0 0 -Ci 06 1) 'C-WI
6.5~ 0 50-'S iD.2Il. 2LO *0 RC -15 50 -6 > %, -CC£S501.' 0~C ,-C 2~ ! *.'0 :S.A L 4.0 0 0'
lo -., 04. A> ci 4.0 0 0a :0 U SA Co-- Cus Cus on.' "0.' waC awO C04£ CS -I PC. S a 0 to a 0C4CS0004065 CS U1 '-o6 6 4.5 * i -0 - C 06- 4 S -. S
it) C aCL , 0RV V E e 4. 05 =.. ae. i' w654 1t !41 4.6 LoL 6-v u . J. VOS --- 0. 0
i£ 4.0, 1?. 0.6* m N 00a6.56. 0%U- *Z c I S- C6L. -. 0 N - L0 40 0065 -- 04 000 0 C E 0E 0 66.6 0- -UC24.S 0 0 C SpSC_ a. . * * d:00
10r-a COf %- 22 0050*CGO- 0 OC0U*%; CS SS-'-C 005. 4'
.. 4-C00564 4 U-00f 0&00&C-Ui4.@a WL-6 S0-- C-bos -4 00w *MOLL6t 131 0*:'0 *
-C0eS 00 49 w OC- 4 > 0C OC L * Me-0 0 040 060 IgI 8 .' Ch 4-
c -4 0 6 L.4 .op -4 -B...1 C 4S,0* r. a 60 - 6.

REPORT DOCUMENTATION PAGE
.Recipient's Reference 2.Originator's Reference 3. Further Reference 4. Security Classificationof Document
AGARD-LS-108 ISBN 92-835-0266-3 UNCLASSIFIED
S. Originator Advisory Group for Aerospace Research and Development
North Atlantic Treaty Organization7 rue Ancelle, 92200 Neuilly sur Seine, France
6. Title
AIRCRAFT ASSESSMENT AND ACCEPTANCE TESTING
7. Pesented at a Lecture Series under the sponsorship of the Flight Mechanics Panel and theConsultant and Exchange Programme of AGARD, on 5-6 June 1980 at Goul, Norway; 9-10June 1980 Athens, Greece and 12-13 June 1980 Ankara, Turkey.
8. Author(s)/Editor(s) 9. Date
Various May 1980
10. Author's/Editor's Address 1I. Pages
Various 202
12. Distribution Statement This document is distributed in accordance with AGARDpolicies and regulations, which are outlined on theOutside Back Covers of all AGARD publications.
13. Keywords/Descriptors
Quality control AcceptabilityAircraft industry Design criteriaAcceptable quality level Flight testsStandards
Abtract
The Lecture Series reviews the present state of the art of aircraft assessment andacceptance testing of production aircraft. This particular kind of testing is neededto select, from a variety of offers, the best aircraft type for a mission and to checkthat any aircraft on the production line is identical to the type, with acceptabletolerances.
Emphasis is placed on the practical aspects of this technique in order to help the flightcrews and organisations dealing with this activity. Flight test instrumentation methodsare set forth that do not require the use of sophisticated ground and airborne instrumenta-tion for data acquisition or large computers for data processing. Flight test techniquesdescribed illustrate ways to acquire acceptable results utilizing a minimum of instrumenta-tion or no instrumentation.

00
.b - 2
00 0
-S -
0 00
0 O '5 z0 8-
4..
00 0n 00 a-a j
0b 0 .0. Oz
o
Sol, 0

0SI 00-
00
4-
r..
-e .2- .~0 to
A, E02 E-
'r, rz *z z~4
0cC~4) z
co 04)0 60~ )
-&
CU P ~ ~.0 -4-6
m o:to0 ~U:jO)U U
0. we oE : o
:1 0 V
oZ
'r 20 o