,EEEEEEE - DTIC
65
-A164 458 PEAK-FLUX-DENSITY SPECTRA OF LARGE SOLAR RADIO BURSTS t/1 AND PROTON EMISSION FROM FLARES(U) AIR FORCE GEOPHYSICS LAB HANSCOM AFS MR E CLIVER ET AL, 19 AUG 85 UNCLASSIFIED AFGL-TR-80-BiBB F/G 3/1 NL ,EEEEEEE Imlllll Lm m l
-
Upload
khangminh22 -
Category
Documents
-
view
7 -
download
0
Transcript of ,EEEEEEE - DTIC
-A164 458 PEAK-FLUX-DENSITY SPECTRA OF LARGE SOLAR RADIO BURSTS t/1AND PROTON EMISSION FROM FLARES(U) AIR FORCE GEOPHYSICSLAB HANSCOM AFS MR E CLIVER ET AL, 19 AUG 85
UNCLASSIFIED AFGL-TR-80-BiBB F/G 3/1 NL
,EEEEEEE
Imlllll
Lm m l
L2.
14
! MICROCOPY RESOLUTION TEST CHARTNATINAL BUREAU OF STANDARDS-I1963-A
I11 .1 m A
I IJ ;E ," ' ', " " "'' '-" " , ' ' " '- , ". " ' '," " ", i ,', ' " " , . ., ," . ' ' . . .,. '. ' -."': , .,, -,. . ,, ., . .u.'

AFGL-TR-85-01 180ENVIRONMENTAL RESEARCH PAPERS, NO. 924
LO Peak-Flux-Density Spectra of Large Solar Radio Bursts -
and Proton Emission From Flares
DTICL. F. McNAMARA -LECTE1. C. GENTILE FEB 211986j
SS
Approved for public release; distribution unlimited.
.j SPACE PHYSICS DIVISION PROJECT 2311
AIR FORCE GEOPHYSICS LABORATORYHANSCOM AFB4 MA 01731
. .. ~ *~*~* . .- ~2 2Fi

-2-'
L- L 1 U !X--.---7 7r-rX-I KI RI
This technical report has been reviewed and is approved for publication.
FOR THE COMMANDER
E.G. MULLEN, Chief RITA C. SAGA4N, rectorSpace Particles Environment Branch Space Physics DivisionSpace Physics Division
This document has been reviewed by the ESD Public Affairs Office (PA) and isreleasable to the National Technical Information Service (NTIS).
Qualified requestors may obtain additional copies from the Defense TechnicalInformation Center. All others should apply to the National TechnicalInfomatlon Service.
If your address has changed, or if you wish to be removed from the mailing* list, or if the addressee is no longer employed by your organization, please- notify AFGL/DAA, Hanscom AFB, MA 01731. This will assist us in maintaining
a current mailing list.
. °
S" . - • . . , ' ''. , " . . . . . . , ? . . . .- - . -. . -' -:i i : ' : i -' ' ---- --

UNCLASSIFIEDSECURITY CLASSIFICATION OF THIS PAGE
REPORT DOCUMENTATION PAGE1* REPORT SECURITY CLASSIFICATION 1b. RESTRICTIVE MARKINGS
Unclassified2a. SECURITY CLASSIFICATION AUTHORITY 3. OISTRIBUTION/AVAILABILITY OF REPORT
2b. DECLASSIF ICATION/DOWNGRAOING SCHEDULE Approved for public release; distributionunlimited.
4. PERFORMING ORGANIZATION REPORT NUMBER(S) 5. MONITORING ORGANIZATION REPORT NUMUER(S)
AFGL-TR-85-0180 ERP. No. 924
6 NAME OF PERFORMING ORGANIZATION b. OFFICE SYMBOL 7.. NAME OF MONITORING ORGANIZATIONafpplica ble)Air Force GeophysicsLaboratory I PHP
6c. ADDRESS Ity. State and ZIP Code) 7b. ADDRESS (City, State and ZIP Code) r.
Hanscom AFB >_" .=7Massachusetts 01731
80-. NAME OF FUNDING/SPONSORING Bib. OFFICE SYM130L 9. PROCUREMENT INSTRUM&ENT IDENTiFICATION NU MB
ORGANIZATION (If applicable)
Be. ADDRESS (City. Slate and ZIP CoseJ 10. SOURCE OF FUNDING NOS.
ELEMENT NO. NO. N.NO.
- i61102F 1231 (1 12"''11. TITLE (Include SCurity Casifiato)
4 Peak-Flux-Density Spectra of Large Solar Radio Bursts and Proton Emi sion From Flare212. PERSONAL AUTHOR(S)Cliver, E. W., McNamara, L. F. , and Gentile, L. C.*
1.1a TYPE OF REPORT 13b. TIME COVERED 14. DATE OF REPORT (Yr. Mo.. Day) 15. PAGE COUNTScientific Interim FROM July 81 TOJU__y_ 1985 Augtist 19 601B. SUPPLEMENTARY NOTATION
*Ionospheric Prediction Service, Darlinghurst, New South Wales, -ustralia**Emmanuel College, Boston, MA
17. COSATI CODES lB. SUBJECT TERMS (Continue an rewra. ,it(eceuary and identify!..by block numbe
FIBLO GROUP SUB. OR. Solar Flares Solar Part cle Events3 2 16 Solar Radio Emission
19. ABSTRACT (Continue on ,rverse if neceauary and identify by block, number)
.- We have reexamined the relationship between "U-sha d6 peak- ux-densi micro-wave spectra and solar proton events for 200 large [Sp r 2 nz) 800 s ar flux units '
(sfu)] microwave bursts (1966,- 1979). The radio spectra fell i to two ba ic classes:(a) U-shaped with two maxima f 800 sfu) in the range from 20) MHz to 10 GHz (59percent of all events), and (b) cutoff spectra with a maximum 800 sju at f ;'4 GHz andSp (200 MHz) < 100 sfu (18 percent). Nine percent of the events had intermediateP spec-tra with a maximum 800 sfu at f 2 GHz and 100 sfu Sp (200 MHz) < 800 sfu. Wewere unable to classi y 15 percent o the events because f incomplete data.
The associations f the three cI sses of spectra w'O Type II (and/or Type IV) x eterwavelength bursts an, > 10 MeV proton events of any ize (0 01 pr - m -ec-Iare as follows: U-sha ed Type II/IV/ (90 percent of large mi rowave bursts w.. U-shaped "-spectra are associate with Type II IV events), protons (77 p~rcent); int rmediate Type 1 .II/IV (78 percent), pr tons (73 perce nt); and cutoff (Type II/IV (22 percen), protons (over)
20. DISTRIBUTION/AVAILABILITY I F ABSTRACT 21. ABSARACT SECURITY 4LASSIFICATION,
UNCLASSIPIEO/UNLIMITEO 13 SAL.4E AS APT. 0 OTICUSERS 0 Ui classified A22. NAME OF RESPONSIBLE INDIVIDUAL 22b TEL PHONE NUMBER 22 OFFICE SYMBOL
(Include Ame Cod"l
E. W. Cliver ,611) 861-3 7 AFGL/PHP
D0 FORM 1473,83 APR EDITION OF I JAN 73 2S OBSOLETE. UNCLASSIFIEDS SECURITY CLASSiPodATiON OF THIS PAGE
~/7E- '
% %

UNCLASSIFIED
SECURITY CLASSIFICATION OF THIS PAGE
19. ABSTRACT (Contd)
(33 percent). These statistics affirm various lines of evidence linking coronal shockwaves and interplanetary proton events. They also suggest that the meter wavelengthbranch of the U-shaped spectrum may be attributable to second phase (vs flash phase)accelerated electrons. We have examined this latter supposition and find that it can-not be true in general, ecause for only about half of the bursts with the U-shaped spec-trum (U-bursts) in our s mple was a Type II in progress at the time of the peak of thelow frequency branch. F these events one cannot rule out a possible contribution tothe peak 200-MHz flux fro either the second harmonic of the Type II burst or fromflare continuum of the type C II, provided that the starting frequency of the fundamentalType II burst is > 100 MHz. The low frequency branch of the U-burst appears to bemore closely reated to impul *ve phase Type III emission. We note that the smallsample of U-bursts that lacked ype II/IV association is also poorly associated withproton events, and conclude that he observed association between U-bursts and protonevents probably results from the ig Flare Syndrome rather than a close physical linkbetween these two phenomena. \
If the current NOAA prediction hreshold of J (> 10 MeV) L- pr cm - 2 sec - 1 sr - 1
had been in effect during the period vered by our data base (1965 - 1979), the U-burst"yes or no" forecast tool would have d a false alarm rate of 50 to 70 percent andwould have failed to provide warning fo 40 to 50 percent of the significant prompt pro-ton events attributable to disk flares. We note that several (8 of 46) of the prompt pro-ton events with J (> 10 MeV) _> 10 pr cm' 2 sec- 1 sr-1 observed from 1965 to 1979originated in flares that had relatively we, ( 5 300 sfu) burst emission at 200 MHz.
qL'1 UNCLASSIFIED
SECURITY CLASSIPICAI1tl OP THIS PAGE
'% -

Preface
A shorter version of this study has been published in the Journal of Geophys-
ical Research, July 1, 1985, Vol. 90, pp. 6251-6266 (AFGL-TR-85-0176). The
tables of events omitted from the JGR paper have been included in this report. We
thank R. F. McGuire for providing proton data plots and S. W. Kahler and M. A.
Shea for critical readings of the manuscript. We are grateful to A. Novak for
typing and editing assistance.
AccesiOn For
NTIS CRA&IDTIC TAB 0Unannouncedjustiicatio ........-
Di:-t. ibutio, .
AvailabiAitY Codes
\ '"L / Avail ai,d I or3 Dist Spucial
iii
A .o
I we**~*~ t ~q

Contents
1. INTRODUCTION 1
=2 2. RADIO AND PROTON DATA (1965-1979) 6
2.1 Radio Data Sources 62.2 Selection Criteria 62.3 Constructing Spectra 72.4 Spectral Classes 162.5 Associated Sweep Frequency Meter Wavelength
Events 242.6 Proton Data 282.7 Major Proton Events, 1965-1979 30
3. DATA A.NALYSIS 32
3. 1 Peak-Flux-Density Spectral Type vs Proton Events 323.2 The U-Burst as a Forecast Tool 343.3 Radio Signatures of Major Proton Events 373.4 Microwave Spectral Class and Type II/IV Bursts 403.5 Timing of Type II Burst and 200-MHz Peak 43
4. DISCUSSION 45
4.1 Summary 454.2 The U-Burst as a Prediction Tool 464.3 The Low Frequency Branch of the U-Shaped Spectrum 474.4 U-Bursts and the Big Flare Syndrome 484.5 Impulsive Phase Proton Acceleration 484.6 Proton Flares With Weak 200-MHz Emission 49
REFERENCES 50
iv1N
: .. . . '-

Illustrations
1. Examples of the Classic U-Shaped Spectrum, With theLow Frequency Maximum Occurring Near 200 MHz 17
2. Examples of the Classic U-Shaped Spectrum With theLow Frequency Maximum Occurring Near 200 MHz 18
3. Examples of U-Shaped Peak-Flux-Density Spectra ThatHad Their Lower Frequency Maximum in the Deci-metric Range 19
4. Examples of U-Shaped Peak-Flux-Density Spectra ThatHad Their Lower Frequency Maximum in the Deci-metric Range 20
5. Four of the Ten Events in Table I That Were Classifiedas U-Bursts Because of Our Decision to Favor HighFlux Values at 200 MHz 21
6. The Timing of the Maximum - 200-MHz Emission for theU-Bursts in Table 1 Relative to the Timing of the
10-GHz Maximum 22
7. Examples of Microwave Bursts With What We HaveTermed "Intermediate" Peak-Flux-Density Spectra 25
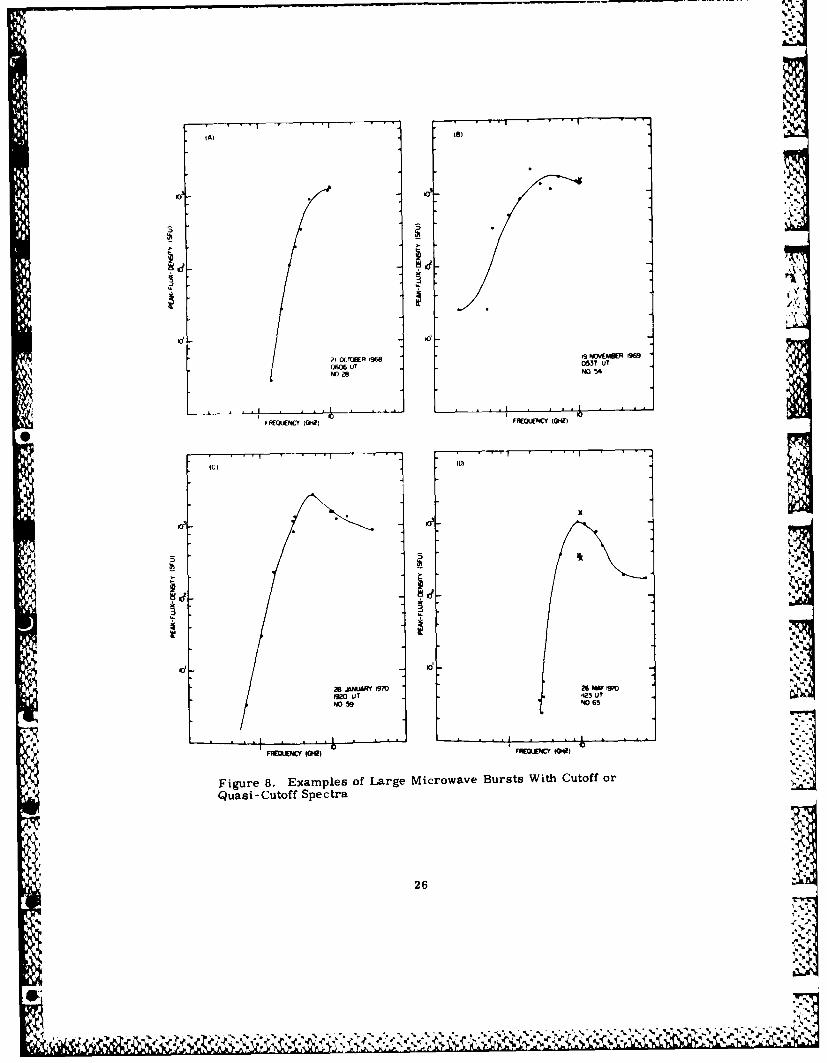
8. Examples of Large Microwave Bursts With Cutoff orQuasi-Cutoff Spectra 26
9. Examples of Large Microwave Bursts With Cutoff orQuasi-Cutoff Spectra 27
10. Histograms of the Longitudinal Distributions of the HaFlares Associated With the Large Microwave Burstsin Table 1 Distributed According to Spectral Classi-fication: (a) U-Shaped, (b) Intermediate, and (c) Cut-off 35
11. Histogram of the Reported Peak-Flux Density at - 200MHz for the Parent Flares of the Large [ J (> 10 MeV)
1 10 pr cm - 2 sec -I sr - 1] Prompt Proton Events inTable 2 That Were Observed From 1965 to 1979 37
12. Histograms of the Durations of (a) Type II and (b) TypeIV Emission for the Largest [ J (> 10 MeV) -? 10 prcm " 2 sec "1 sr-1] Disk Flare (85°E f-= 850W)Associated Prompt Proton Events That Occurred From1965 to 1979 40
N

Tables
1. Large Microwave Bursts 1965-1979: Peak-Flux-DensitySpectra, and Sweep Frequency Burst and Proton Asso-ciation 8
2. Large Proton Events 1965-1979 With Unambiguous 4
Visible -Disk-Flare Associations 31
3. Peak-Flux-Density Spectral Class vs Proton Event Size 33
4. Association of Sweep Frequency Bursts and ProtonEvents With Peak-Flux-Density Spectral Classes 41
'0
vi
5%

Peak-Flux-Density Spectra of Large SolarRadio Bursts and Proton Emission From Flares
I. INTRODUCTION
Castelli et al proposed that the 'U-shaped" peak-flux-density radio spectrum,with high flux densities [ 1000 solar flux units (1 sfu = 10-22 W m-2 Hz- 1)] at
meter and centimeter wavelengths and a minimum in the decimeter range, is the"preferred spectrum" for major solar proton flares. This concept was investi-
gated in a series of papers by Castelli and his co-workers. 2-6 In the initial re-1,2
ports on this topic, evidence was presented indicating that the U-shaped spec-
trum was a necessary or almost-necessary condition for a solar flare to produce
a polar cap absorption (PCA) event. Thus, Castelli et al found U-shaped radio
spectra for the three visible hemisphere PCA flares of 1966.
In a verification of the utility of the U-shaped spectrum, O'Brien compiled a
comprehensive list of 30 microwave events with this spectral shape (U-bursts)
from observations reported by Sagamore Hill, Manila, Nagoya, and Pennsylvania
A, State University from 1966 to 1968. He associated 13 of these flare-bursts with
principal (- 2.0 dB of absorption measured by a 30-MHz riometer) PCA events
and 14 with minor ( < 2. 0 dB) PCAs or with proton events detected only by satel-
lites, but was unable to associate the three remaining U-bursts with a near-Earth
(Received for Publication 12 August 1985)References 1 to 6 will not be listed here. See References, page 50.
9 I I
1ge
S ' '. . " " ,r'-,' ,, ,.:.,'-'-. - - , ..z .- ,- . " . ,

particle enhancement. Significantly, in the reverse association, O'Brien found no Icases of principal PCAs during this period that were not associated with U-bursts.
Castelli and Barron 5 compiled a comprehensive list of 81 U-bursts from 1966 to
1976. For nine of these events, a major proton event (PCA) was in progress at ,
the time of the U-burst and no fresh injection of protons was observed. Seventy of
the remaining 72 events were associated either with PCAs (27 of which had peak
absorption i- 2.0 dB) or satellite proton events. For the same period, 1966 to
1976, Castelli and Tarnstrom 6 published a catalog of 114 proton events that were
associated with flares that did not have U-shaped microwave spectra. Seventy-six
of these events could be identified with visible hemisphere flares, and, of these,
only three were principal PCA events. Thus the current picture of the relation-
ship between U-bursts and proton events is that the U-shaped spectrum is: (1) an
almost sufficient condition (70/72 = 97 percent) for the occurrence of an inter-
planetary proton event of any size, and (2) an almost necessary condition (27/30 =
90 percent) for a principal PCA ( a 2. 0 dB) to occur.
Largely as a result of the efforts of Castelli and his colleagues, the presence/
absence of a U-shaped spectrum is used as a "yes or no" indicator of significant
proton acceleration in solar flare-bursts at the U. S. space forecasting centers in
Boulder and Omaha. 7 Moreover, the successful application of the U, coupled
with the ability to view the sun through clouds at radio wavelengths, was a signifi-
cant factor in the evolution of the worldwide solar radio patrol of the USAF 10 and
the establishment of the present day Radio Solar Telescope Network (RSTN) 1 1 that
monitors solar emissions in the frequency range from 245 MHz to 15.4 GHz.
Despite the use of the U-shaped spectrum as a forecasting aid, however, cer-
tain questions about its development, pragmatic application, and physical interpre-
tation remain unanswered. Kahler and Simnett (1980, private communications)
7. Heckman, G. (1979) Predictions of the space environment services center, inSolar Terrestrial Predictions Proceedings, vol. 1, p. 322, R. F. Donnelly,Ed., National Oceanic and Atmospheric Administration, Boulder, Colo.
8. Cliver, E. W., Secan, J. A., Beard, E. D., and Manley, J. A. (1978) Pre-diction of solar proton events at the Air Force Global Weather Central'sspace environmental forecasting facility, in Effect of the Ionosphere onSpace and Terrestrial Systems, Conf. Proc., J. M. Goodman, Ed., U. S.Government Printing Office, Washington, D. C.
9. Thompson, R. L., and Secan, J. A. (1919) Geophysical forecasting at AFGWC,in Solar Terrestrial Predictions Proceedings, vol. 1, p. 350, R. F.Donnelly, Ed., National Oceanic and Atmospheric Administration, Boulder,Colo.
10. Castelli, J. P., Aarons, J., Guidice, D. A., and Straka, R. M. (1973) Thesolar radio patrol network of the USAF and its application, Proc. IEEE61:1307.
11. Guidice, D. A., Cliver, E. W., Barron, W. R., and Kahler, S. (1981) TheAir Force RSTN system, Bull. AAS 13:553.
2
.................................................%,

pointed out that certain events in Castelli ard Barron's list of 81 events did notappear to satisfy the stated definition of a U-burst, while other events whose peak-
flux-density spectra conformed to the definition were omitted. A preliminary in-12spection of the data compiled in Solar Geophysical Data and the Quarterly Bulle-
13tin of Solar Activity confirmed these apparent discrepancies and revealed others.
Some of the difficulty lies in the definition of the U-shaped spectrum as stated byCastelli and Barron.5
The criteria . .. were that the flux density of the radio burst at time ofmaximum have a spectrum resembling a "U" where (1) flux density isrising in the short wavelength direction and is Z 1000 [ sfuj in the X3 cm range, (2) flux density in the decimeter range passes through anemission minimum, and (3) flux density in the long-meter-wavelengthdirection rises again to values Z 1000 [ sfu].
A shortcoming of this definition is that it contains no mention of the allowable sep-
aration in time between peaks at different frequencies. For certain events in
Castelli and Barron's (CB) list (Nos. 6, 17, 22, and 61), the low frequency maxi-
mum occurs from 10 to 50 min after the - 10-GHz peak. In two of these events
(Nos. 17 and 61), the - 200-MHz emission did not begin until - 15 min after the
* centimeter wavelength maximum. Constructing peak-flux-density spectra from
discrete frequency peaks separated by tens of minutes strains the credibility of
the U as a forecast tool (and as a meaningful physical construct), since, given
enough time and the relative high frequency of bursts at the longer wavelengths,
unrelated microwave and meter wavelength bursts might be combined to give U-
shaped spectra. For other events on CB's list, the desired result, association of
U-bursts with principal PCA events, was assumed. For the 02 December 1968event (No. 25), observations were not available above 2700 MHz (Penticton, 270
sfu), but O'Brien, by applying the average spectral index in the 3- to 9-GHz range
for radio bursts associated with principal PCAs deduced that the U-shaped criteria
would have been satisfied for this event had observations been available at 9 GHz.For the 02 November 1969 event (No. 36) associated with a flare Z 10' behind the
western limb, the highest flux value reported at frequencies < 1 GHz was 300 sfu
(Moscow, 204 MHz). Castelli and Guidice 14 make the assumption that had this
event occurred on the visible disk, a high flux, presumably Z 1000 sfu, would have
12. Solar Geophysical Data, National Oceanic and Atmospheric Administration,, Bulder, Colo.
13. Quarterly Bulletin of Solar Activity, International Astronomical Union,Eidgen. -St-ernwarte, Zurich. B,
14. Castelli, J. P., and Guidice, D. A. (1972b) The radio event associated withthe polar cap absorption event of 2 November 1969, in Proc. of COSPARSymposium on Particle Event of November 1969, p. 27, J. C. Ulwick, Ed.,
* AFCRL-72-0474, AD 763081.
3 .a,

been recorded at the longer wavelengths. giving a U-shaped spectrum for thisevent in accordance with the stated criteria. There are other difficulties with the
CB list. The U-burst on 24 May 1972 had low frequency emission Z 1000 sfu only
at f - 100 MHz, but it is included in CB's list (No. 55) despite statements 4 '' 0 that
the U-shaped signature for proton events applies only to the spectral range from
200 MHz to - 10 GHz. Finally, for the 01 November 1968 (No. 20) and 06 May
1969 (No. 34) events, the highest flux densities reported at f -- 1000 MHz are
400 sfu and 325 sfu, respectively. While the appropriateness of the inclusion of
the above-mentioned events on the U-burst list of Castelli and Barron is debatable,
other events that satisfied the U-shaped spectral criteria were omitted from thelist. Well-defined examples of such events occurred on 04 September 1966
(0417 UT), 04 March 1967 (1716 UT), 21 March 1969 (1334 UT), 14 January 1971
(1122 UT), and 06 March 1972 (1116 UT).
From our perspective, a more fundamental question than the classification of
individual events in previous studies of U-shaped spectra and proton events con-
cerns the basic methodology of these studies. Despite the considerable effort that
has been expended on investigations of the U-burst/proton event relationship, no
systematic study has been undertaken to classify the peak-flux-density spectra of
large solar bursts into different types and then to compare the proton association
of non-U types with that of the U-bursts. Thus at present, we know neither the
approximate fraction of large radio bursts that have U-shaped spectra, nor the
degree of association between large bursts with non-U spectra and proton events.
* .Until these questions are addressed, it is difficult to assess the value of the U as
a yes or no forecast tool since it is not known how well it discriminates against
large microwave bursts of different spectral type.
Finally, questions about the physical interpretation of the U-shaped peak-flux-
density spectrum have persisted since its introduction. In the original papers, 1,2
little attempt was made to provide an explanation for the observed association be-4tween U-bursts and proton events. Subsequently, Castelli and Guidice interpreted %
this relationship in terms of a two-stage acceleration process. In their model,
flash phase electrons accelerated downward toward the solar surface (or trapped
on low-lying loops) give rise to the centimeter wavelength branch of the U. The
intensity of the microwave peak (Z 1000 sfu in U-bursts) served as an indicator
that the energy release during the impulsive phase was sufficient to produce a
coronal shock wave (inferred from a Type II burst) through which the electrons ""v
accounting for the meter wavelength branch of the U and the protons observed at -:
Earth were accelerated via a Fermi-type process. The idea of two phases of par-
ticle acceleration in flares was proposed by Wild et al 5and de Jager.16 The
References 15 and 16 will not be listed here. See References, page 50.
4
N.,
***~4*.......

picture suggested by Castelli and Guidice for the relationship between the two stages
is in qualitative agreement with the detailed model of Lin and Hudson. 17 However,
since Cliver et a118' 19 have shown that significant [J (> 10 MeV) 2! 10 pr cm -2 sec- 1
sr ] proton events can be associated with relatively small [Sp ('- 9 GHz) < 100 sfu]
microwave bursts, as was also indicated by Castelli and Tarnstrom, 6 the explana-
tion of the U-burst/proton relationship proposed by Castelli and Guidice is problem-20 21atical. Nevertheless, Lin2 0 and Svestka and Fritzova-Svestkova have noted an
association between Type II bursts and interplanetary proton events, and it would be
interesting to see if large flare bursts with the U-shaped spectrum are preferen-
tially associated with Type Ils in comparison with large non-U-bursts. Without
such additional evidence for a physical link between U-bursts and proton events, the
inclination is to dismiss the U-burst/proton event association as an example of the
Big Flare Syndrome, 2 2 perhaps useful for forecasting purposes but incapable ofproviding insights on the problem of proton acceleration in flares. In essence, the
Big Flare Syndrome states that a flare that is prominent in one energy or wave-
length tends to be prominent in all, and cautions about over-interpreting associa-
tions/correlations observed in samples of big flares.
* In this study we classify the peak-flux-density spectra of all large radio bursts
[Sp (- 2 GHz) >n 800 sful observed from 1965 to 1979 and compare the associations
of bursts of different spectral classes with interplanetary proton events and Type
II/IV bursts. In addition, we examine the nature of the low frequency branch of the
U-shaped spectrum and conduct a search for necessary conditions in the radio do-
main for the occurrence of a significant 1J (> 10 MeV) -! 10 pr cm -2 sec "1 sr- I1
proton event.
In the next section, we discuss our data sources, event selection criteria, and
burst classification procedures and present the list of events to be analyzed. The :N,
various statistical associations are presented in the following section, and a sum-
mary and discussion of results are contained in the final section.
17. Lin, H. P. and Hudson, H. S. (1976) Non-thermal processes in large solarflares, Sol. Phys. 50:153.
18. Cliver, E. W., Kahler, S. W., Cane, H. V., Koomen, M. J., Michels,D. J., Howard, R. A., and Sheeley, Jr., N. R. (1983b) The GLE-asso-(iated flare of 21 August, 1979, Sol. Phys. 89:181.
19. Cliver, E. W., Kahler, S. W., and McIntosh, P. S. (1983c) Solar proton
flares with weak impulsive phases, Astrophys. J. 264:699.
20. Lin, H. P. (1970) The emission and propagation of 40 keV solar flare elec-trons. I: the relationship of 40 keV electron to energetic proton and rela-tivistic electron emission by the sun, Sol. Phys. 12:266.
21. Svestka, Z., and Fritzova-Svestkova, L. (1974) Type II radio bursts andparticle acceleration, Sol. Phys 36:417.
22. Kahler, S. W. (1982a) The role of the big flare syndrome in correlations ofsolar energetic proton fluxes and microwave burst parameters, J. Geophys.Res. 87:3439. ,-
5
N.

2. RADIO ANDI PROTON DATA (1965-1979)
By 1965, near the start of the 20th solar cycle, radio and particle patrols of
the sun were reasonably complete. Radio coverage at a range of discrete frequen-
cies was provided principally by patrols at Gorky (USSR), Berlin - Adlershof/
Tremsdorf (DDR), Pennsylvania State University (USA), and Toyokawa/Hiraiso
(Japan). ISagamore Hill (USA) began reporting in January 1966. J Solar particle
events in 1965 were monitored from space (e.g., IMP 2, IMP 3, PION 6) as well
as by ground-based polar riometers.23 The final year considered, 1979, was the
last full year for which comprehensive radio, proton, and optical flare data were'ftavailable at the time we began the study.
2. I Radio Data Soures
For discrete frequency data we relied primarily on the Quarterly Bulletin of
Solar Activity (QBSA) for events occurring before 1969 and Solar Geophysical Data
(SGD) for subsequent years. Since the QBSA did not always list all peak-flux-
density values/times when several stations reported observations at or near a
given frequency, it was necessary to supplement this data source with the burst
compilations from individual observatories such as Hiraiso, Toyokawa, Ondrejov,
Gorky, and Slough. Also, for a few periods, data from certain observatories
* were not published in either QBSA or SGD and are only available in the individual
observatory reports. The two prominent examples of this that we noted were for
Manila (1968) and Toyokawa (1978). It is important to note that, for consistency,
only tabulated data were used. Reference was not made to either published burst
profiles or to the Sagamore Hill strip chart data which we have archived for the
years 1966-1981.
2.2 Selection Criteria
In our search for large microwave bursts occurring during this period, we
used the following selection criteria:
(a) Sp - 800 sfu at f >- 2 GHz, and
'(b) 85"E - 0 5 850W
where SP peak radio flux density, and # is the longitude of the associated Ha
flare. We considered frequencies 2t 2 GHz since this frequency serves as a nom-
inal divider between the decimetric wavelengths, where intense narrow band fea-
tures often occur without significant associated microwave emission, and the
23. Bailey, D. K. (1964) Polar cap absorption, Planet. Space Sci. 12:495.
6
% % %A X ILt

centimetric wavelengths, where spectral variations are typically smoother. 24
The : 800-sfu level is roughly equivalent to Castelli and Barron's Z 1000-sfu
level. In our initial screening of the data we selected all events for which any
observatory reported a peak flux value -: 800 sfu at any frequency 2t 2 GHz. We
then eliminated those events for which reported flux values _ 800 sfu were not
supported by observations at the same or adjacent frequencies, when such obser-
vations were available. The solar longitude criterion was adopted to screen out
events occurring close to or beyond the limb for which the radio source may have
been partially occulted. The 193 events satisfying these selection criteria are
listed in Table 1. Event date, - 10-GHz maximum time, - 200-MHz maximumtime, and Ha flare location and classification are given in columns two through
six, respectively. The time of the 10-GHz maximum (200-MHz maximum) was
obtained by averaging the reported times at frequencies from 8. 2 to 11. 8 GHz
(184 to 328 MHz). For event Nos. 14, 21, 30, 75, 76, 163, and 170, Ha flare
associations are questionable since two candidate optical events were in progress
at the time of the radio burst. The listed flare is, in our opinion, the more likely
source of the intense microwave emission.
2.3 Constructing Spectra
Several of the events in Table I had more than one reported peak in their
flux-density time profiles that satisfied our Sp ( - 2 GHz) - 800 sfu selection
criterion (e.g., two of the large bursts in the August 1972 sequence, Nos. 98
and 101). For such events, we constructed spectra at the time of the largest
peak at the highest frequency for which observations were reported. Since sec-
ondary (late) peaks in microwave outbursts tend to have their maxima at pro-
gressively lower frequencies, this procedure was designed to select the
initial major peak in the listed events. While this tactic did not always, in fact,
identify the first reported centimeter wavelength peak -- 800 sfu (e. g., Nos. 16
and 98), it did ensure a consistent approach to the data. We considered only
those lower frequency flux-density maxima that fell within a five-minute sliding
window containing the highest frequency/highest flux "anchor time". No two dis-
crete frequency maxima that were used to determine the peak-flux-density spec-
trum could be separated in time by more than five minutes. The five-minute
24. Kundu, M. R. (1965) Solar Radio Astronomy, Interscience Publishers, New
York, New York.
25. Kai, K. (1968) Evolutional features of solar microwave type IV bursts, Pub.Astron. Soc. Japan 20:140.
26. Kahler, S. W. (1982b) Radio burst characteristics of solar proton flares,
Astrophys. J 261:7 10.II 7

cc I.Id 0 CN I I I0 N-4 *4
A I I I I
000000000 i 0000 0 0 0 0 0 0 0 0 0 030 0
0 000 00 00 000 Gol 000 00 00 0 00
2c. C"D ~ U 'L l 0 N4ION .- 4Un ( -4 -- 1, 2NN
0 ~ C 00"0 00 00 0 0 2 000, 0 0
0 0UC>4 00 o Qo o oo8 0 o 0N o oN0 oN 00 o 0-L.. f - --- .t No -4 N (D N N, -L) 4.4 N De 0Ulc~
NJ)( ~ ~ ~ ~ oC D Wc d.. 0 0 0 0 0 0 0 0 0 000 0 00 0 00 0 0
Ix 0..-. n t LN O '0n 0 0 l 0 0 o0 0 0 0 0 0 "1 CD N0 Ln 0 00o0QL ~ ~ at N Nl m N c , C> o N1, -4 -m 4 n - UM ~ Nn M a a%0 4L 4 N m4 N Ln
$4 0 0 0 0 0 0 0 0 00 o2 l 0 -0f 00 000 C
La4Y m4 *44 co .4N -l CM. -A 4-4 NY c f
cJ >< I- C0uCDC00000000 0 O f 0 0. O OO O-0 000o0 0 o C
La - - .4 -4 .r0o00o ,C D D0 o oC 0 Cxa C.I nL n00 l% n Qo0C
Go. PN LN0 AU cq m c tL % L nC N C l
x CD o 0%~ 0 o oco oC 0 0n o - 04 C C>f O D, C0, 00U2i 6-1 N %D 0l N -4 C, C, cm C0 0 '0 N ,Chc
u Aw C l NN4oNC)4 o oO o 0 0~% o %00%.n0 o00 o C38 o k n '0 0 CQ: I' o 4 fl4D ~ C0a0'co- o o 0 Ns 1- 0 .- CM '40(~l C, C o n 0
CU 4W 0C ,C o8QC Co0I) 40 % C00o.C, o 0 4 C,4C. oIU0%0%~0 :.N o 0)n'~ Q aDn oC
Cw .t O C4 0a 0'm 0~ rn r-_ In0 00 oam O nNo (df C N n 4 *I-N * ~0 1 4 4 I(4aIN a 4 ~ ~ n
(M P- Ov 0o-oooc'oan'0 0 N OoNNOOO-4'OccOanOC> CIN-CINN4D "(DOW0= " I .1 .* oo~ Lnwo oNcanUI 4-oIn IN4 ~ 0 LN~ no.-I.-4 Iu "M"
orA 4-c,%N.nn'N a0 C %0 0 ~)0 0 n 8 o'0'0NnO0 0o0DenoN'oI0I000~ o I I- I CIO I wooo d4-.-4n 0 .I. 1I.-40I o0 0 NO' IOL-It
-1 '0' 0 '0D0 M '0 N M N Nl Nn o N- V, 00 0 0 00 0 0 0 % 0U- 0'0'0 cr 00m'00'0''00''0M''0 A' 0 00 0''0',0 0''0m'
-4Nc c4.li 0 I-. 0-NE n'0N0%04NI n'0 0 N C J'-i ~ ~ ~ ~ ~ -444---- w- N N No N N Na N Nm N No cc am M) cm co=mc 3a oc om ec oc o=c o
m Mc C mC~ - C4 cs Vm ~ V c MC- ~ C) c~ ~8V l
-W 0%0 s§a )C~ nk -mP-{ - D0

r.h
CL- - I n I %0-N InN0-'- w1-4 In 0 a . I--X i I w .- K- w 2K 1 -W w .c XI www0 P
x K--- II X IcI
w- x- w *( ) I (I I I I I cc:- w2I:I
LL Lal~ C hf n "l -W -fr2c IAJ CJ le In~ I4 *0 . 0 c" - n 0 fn *.C I
5T4 io1.- (. r.- 4 ~ 4 oZ 0a-U 0C II 4'06 -0
L,- )D 0 50D 0o S-rI 0 0 000r00I
00 00 000 00 00n
ul ~00 0 0 0 1 0 oooooo 000 00100-'D I,
)~c o'. 00 0 5 00 0 000 00 co o C00 0o000000 000 0000cdt 0000 N 00Ua In 0 Lna,6 m Lfl 0n 00 W0Ui40 R'n 'Am0 Ln 00 OlL L 0 n
c 0- CJ~l0. 0 0.00 00 00-~0 ~ N£ 0 0£0N 0 , C 0 0 0C-
u. nI 4 iL v 1 - m 0 (V "In - M % - C-
CD MI-o. c 000) 0 0 00000 0o0 0 00000C080~000 00 Co0 0w - oI- C N0 C 40. 0 c> ~o o 0 0 o o 0 0 0
10 0I 0000- 0 0 OIn O 00 e ~ L00 %00 000 w n 00 0
0 c)'-I'4 0 0 " 0 0J 0 C, 000 0 0mC0 0 0oOvOO
r. - 4 c0ui "o~ orvv -ooIn 00fl ci W In ..r0-N N O 0' Incu ~ -N-- N- - £ w£ N -li -- .-:1= . D 0 000 00 0 0 5 5 5 5 0 0 0 5 ~ ~ 00000
.o.o .00 0 0 0 8 08o R0 0 8o 8
0 0 CU£0 C £U~~ '0 I= 00U 0 0 !- C InOcc . Nr 00In - - L 1- 0 In N0 a n 8 Lr .4.1 I r 40 -
0 J>CI-- 0o 0 0008008 000 N £ 0 8 0 0O0 0 0000 0 0f )0sflO-4OlU o OU0 0
=2I C-~o 8Lo tD ~~ -0 I 0- Y00 0 10 I ~ 01-j - 10 ND 30-M 4 0 % m W-i cm .4 N- - 44m'. 0
-4 C40I. - - S ur-M r, - 0 0f008(>-)- n0 0 C 00i8 - ')00 0 In0 C . 0In0C 0 0 .)In0 00 l Lz mo In 00 10 1 (l I m OON "n(N 10001 I ~ m I - O l r-.IO
o) 0 0Z.J~ 0 In( Lfl. 0411 0 0 0 -400m 0 n 80 n0 0 0~ 0 0 l
Xj Nn 10N In C l C 0 0 " N ~ Oe C~o
m '" . n M m NO 1 -- 4-40-4-4-4-4-40-40-0- -4- -I N 000 -4 N o m
0 0 4-
>, , r CI n m-O4~ 0 ;0 c04 O0N; ON 8 N440; 4 O,O0 -; a,0<5 I440 N 00.wUnunmI "m44II 0 1N-4Nj I0"N "m - -I4U)~ ~~~Q N -4 --4maj' a NO4 --4NmN O 00000mcl C%-n0 wON 4nm -4 0 W10----------0NC40.f-~~ ~ ~ ~ ~ W %0.1 8NNNNN0-NNN40N--4-N NN.- NOk Q lPtoN 'JNN %0 %04-%4-4O O%0-4% O c 0%ak k-4 N 4f140 40 r- 040'.q'..'. 0-0 -,000000---'-.0000 0000--Cc O.4%0000000000

ai. OU 0n 14 0;ItI )0t
U 0 IO I )( I >C IC 1 )1 *)3; )( 0 I >CC * w %C w I >C >C X I 2)(4c I W>9) I I I I I x C
0. L Li- NM C, w C, V)1 I-~
I- 0" 0 4. 1') 100 -441). -V M 00 m N02. 1Ok o --4 m nCD -40- .4 o 0 N %
- .. m .- AN-c N0W -4.- C'4-402-4M" N 10,~~- MM
0~ 0f 000C0 80C, 00 o0 0 0 0 0 8 0 C) o 0 00000 00 0 0 ,0805j= OO(:)cLaO~z1o 00000o 00 0 0000000000 000 0
)( xc- 0D0 00C C 00 0 00 0 00 000 0 0o 0 C5 I-C11 100 0)o0 000 0 Cp00 0000000 LA 10 0 C
" i, m m C m m. NN N.4 N11' f2 %a100 4 40% o 0 .r 01 r- 0> WW
0, 1 0 0 00 000 0 0 00 000 o00 00 0 0 ", 00La U- -C o00 00 , 00 o 0 0 000 000 0 D0 0 0 0. 00=# ~ 0 m 00 -, Q0 nC 100 0 100 o000 0 10 0 4= C 00Q
U- XI 0 0 10 001'O cm 0%-MI 0 VO N 000c 000 m0"0 00O
><I-1' 0 0D 1n0 C,4 m 1 , NON a')1D 00 N10400-410N21'~oC. J0E- .4 V~ .4 a0' C4-4 C 0 " ) 0t 0 oo in 1~ N.w-4.o-"Nw
G) - I5 -4 01
C, C0 0 000 C 0 00 00 0 000 0 00v C)~-. 0n 000 In Ln1001001v0 00 0000 -t 0 1 0 k 00 0
L ~ ~ C-4 CM 04. C4. m4 .4 cm Nj N% 0 4 4
0 0 0J. 0 0 20 CSW 0 0 0C r 0 I o0 0 000001000= 0000 C00 N 000I ~ ~ ~ O O C I C4L-01 0244-W IN0-1 010402-0-001001)0104
C3 ... 4 10w q. - - - N 4. -t N 10 N t . 0210 0- 0- m m4
N in w 4
n~J= 10C'10 o0 o oN40 014a) 0 002N 01010NN4=u 0 )oL ,0L nt 0 -SN 4N- C 0 c4)
Nr NN C' -4 . N 01 -r 4
X -3 -c. . CD4. 1 Lm 1 02mc n0 N 0 2..4 wN0 1 0 1 1-.e4N01' 4NN44v
0o .> : 0 11 0 C 04t I I 101%0 1 N0C,0310 I 10 I -40 I 0 I Ln 1'.0 4=C ~t0, 0" ONIn 10. 0 r 4)1D 10021'. - 0 .4 NO61 %0M-v4N101..
.4i M.I'NP4 A 01 N4 . nN
0DCD I a I C) ICDIo 02 N C, 100-1') o 0 1 a W NCI) C)I 0N 0 1000. c
10L A 1) .A04 1') 10 i .4 J7 OO.4.- -400
s C) w-40 10 N110 O 44110 100 l'14 1002tomww mm -c W 01- o v V. w44= f.'-C 401 C02101')
F ~ M,40 "0,0 0N1-.10o 004N 0 m V0N 0(4) w 10 m La ,m o
00 C, I 4 I-- I4 N -m 04 "- Na 0m 0 0 00.C 0------ v- V4- m4 -4D 4 .L4
00 .m 0200 2004=1010104=00002S 1001 f.1. m cO' .W00NM
m O tn w w m w 0% m o 00200D2 a% -i 4m -41010r O P C 1.40%4 m Y V DNn ID0
INOOOO 4)I4NN 444N.- (4)010 NN.4(4
* ~ ~ ~ k 0 0 0 04N4N1444 044.. ON OC ) NN N4 -41' 0 008 4NN.-IQ D l co0 0 C:-.
0C 1405 -40)10002=0 0. 1=' 442401 4 14 0-4- 01_ Nr _r-'V
.4P 0O- N4 . NO . 0 - 0 0 4 0 N0 0 0 4 N P- N- N- r, N rr r ,r-P ,r 02 I -rDoO
k 1 0% 1 1 - - 000 mV nto wm q 4 o )w h0 m V 4=40 r, -020 NOm-4 -4mCm mma o4 NO N - N 0 N O O 0NQC4) 0 ON-l 4-4 04)
-4-.41J - .4.- 4 44NN4 ()411102 0000N4)40011 10141.

LLS
< x~ I~ WW1 X C II xx*1x IxI>Xx>CxxX
'-4 00 LOO 0 -4,04,
0. La b1 CM~ co -I 4N - - - .4 - - N 4. 0, Ll m No NA co4 4 1 -C, Ln N Ln -r
VA) 0 l 4 o 00 000 i 1 C;c,- -00 0 0 C400 0 00
II ok L.n 00Ll0.4 l0 en Ln n 0 - m4N4 0 ) Oil 0%
3 II- ooOdl o- o40upo Mulo O UOl0 C)400 o440
00 0 00 0 0 0 o 0 0 00 0 800 0oL1 j I ooo )0D00 C 00 230o0 0 o 0 )80 8 0 0 000 aOND 0o
ci xo. 0 0000 0 0 o D0 O 0 0ooU n0000C 0 0 0 0 00 2 0oo.L 000 0 0C, 0 00: 000 0 0n L0n00 000 0IL nL ,C c na ~ ,u ,L 1L
x x0000 0 o 0 00 o 000 Z 0 0 0 ,NZ00 OO o .1:: I.. -CCDNDCNo o C 0 0 0 o C,00o C, 0 4N a C
10 In .4- N n 10 0, -4.4 n -0 " " -
o'x D 0 0000000000000 0 00000000 0 000C C OU.1.L..ooC o c O C 0 0 0 a0004 o o00 0 004l0 0
ce C0D 044000000 cl oC, Z D 0000 C o 001 C D o o0DI4N00 " - 0O l) C 1 ' ON o4~4 00 0 N 4 4 l00 0o0 Ch1- m0l l
to >c o D4 0 000 0 0 0 0 0 - l w 00CD0D00) 0000L n00oNo0o 00000o1X 00 0 4 0004 MOO00n 00000400N4,nCDr- m000D 4Wt0n 00r
%D4 o, .' .4 Colcmqr q nN .9 .4 0 N -it am Nm oI
M 4 4 -40 N - -NN 40-. 4 -
o) -i. Do )oooomoo r' ,ooooc,04 ,c ncC> ONI I0 ,00 0 004,4,0no~-40Zr~o ILn-. 04 0 0 0 0- 00 0 00 0
.0-0 001 10 00 0 -* " "Lm l 00 0N N04fl 0004 000l0 10. ~ ) N C p
on ND I 1 0 o w 0 o -4L % 0 0 . )Ion %On ~ o~ I~' 0 00I 0 al 0
00 NZ - 4110 0 0 n1 Nn .- LM o4 4,n -4 -4 nC 0 R f)
41. N i 0-4 I-4- - 1N Nn 0- m-- N04- -4-- - 444404440
0-4- No I.N .4 a. N N 0----- NN -- 44- -4-0
4. 0 r,4 4 4 4 40 0 0 0 0 0 0.0 01 N0 0% 0 W Nn Nn Na N~ N N N N N N N m ND N NW M NINN N N n N m N N e N W3NN NN3>c4 04N Z NNNNwNNNN 4 C4 4,,4,4 -1 444 4,4,4 4 44
-4-4-4ci n -44-44-44 4q -4-4-n44-44-44-44-44-44- -4-4--4-4--4-4-0 5M: 0 n (, cr L L r r :,, q M LUW04 11W.CUai4I- , C 1 L r l l 1l li 91 l 9l 'tIC 1 1 99 u

A -I.. I04 4 - NN - . h IO O IN I44 -I~ I-IIj I
-.j
a .. )6 CA 0006 o m n l - -0 .r 4-4C 04-40w-I I4) mii Vi No d. NI0C>I '0IU e ) LaIm l I II I I mU)-0 %CI- CVJ-
- 0D 0 col4- - I 0 0 l l NO1J 00 0 40 0p 0,
).C O~~~-' 0000 .0 O~ 0 0 0 0 O 00O0C,0 0 okno (D0.) 0-. 0 M 6)0l00 In < Lc) 0NU C (n)6a,)-OOU) OO'00'0 0"n 0 -0 'D) I
o'f 008z~ 0000000.) o 000o00 0,00 0 00a00000 0 o 0~
:z I. 000 0 CD 0 0 00 0U 0 0 = 0 01. 00oo 00I ~ 0 0 00coo 00 U) 0Ln p.-. U) U) L) 0 n LO Ln Ch N n U) LO Ln o) Ln r., Ln 0 n U, 0 ) LO 6) U) U) 1- CD U) 0.-0-U U) U) Lm 1-6 In
00 00 0000 D DC)C 0000m 00 0 0000 0 00 0 0Dmm00 0 0 L 0000 o0U 0 U) 'nC k 0000 0 0 0 " U)
o a,~. -40, 0-06 6-46 0 r- q )0- ) 64qr 0 o O ) 6) 0 OL0 " - - -0 ' -4 - - -M-I44 -40 - NI - N' 'D N-
:D, 0 C)- 00 0 0 000 = 0 00 00 0 0000 0 00 o0 o 0 0W JL. <~ 00o0 000 0 o00 000C)0 0 0 0 000 0 0 0 -1)C 0 0x0I- o 00D 0 00 0CD00 00 0 0 000LnCD 0 0 0 0 0 0o f- 0)
4.. b Ln L U)U) Z-U 00-mN r 0'0' h0 Cli a, mN 6 6, 1- 1- NC4
. = N ~JC00UC)L o D 0 40 0 0 000 0 0 4 DL U00m0D0C 00t.--I0 NO U)0) 0 1 L 10 -U)N-'0U)U 4 q4 f- ()0 N 0 06)N
Ua 0%. N N -1 -k 4-Jc h c o
0* C> 00oC 0 0 D a0 00000) 00C)0 0 000000 00L"...-I 000 0 U) C>U)Ino0 0 0 L a0 0 U)0 0 0)m0 0U)U) 00
0 OE> 0))4) '0 '0 C, o 0 06) C 00 0 0'0CU)C, 0 0 )0 ) Uo)m r -c CIn nM1 0)0 " Ln- -40 U) 0 ) -DL n >C 0. CC oL n C
c 00 M1o-W4 00 U )0 0 VI .rfl IOOONOU)0000I00000'0U) n)U)006)0I00U)U)cI 10~ 0 U) 46e r V0 D -4 0 LO IUn t 0 -1 m m w 0 - ID In W0 cm
r*4Xp 0- O~n Il'0 n on (:I'l00 0 "I OO)4'0-40)N0) oc:'0-4 '000-'
00. 1 U).-1 0 1) 00U)0 I 4 0 U 00U)40.4010001U 00
L. N m) I-n N0 C-4 N . 0)0)4
c> ~ ~ 0 0) UDn- D - N ) 4 o 4-oa4 L ~ i nL D )C DC
00I N 0 o 1OOI 1 0 1I6)40U)00o".)OI U)0 I I I f ool I0U)0000
I A 4n .4 n U) U) U) 0
o 01 X 010101-o mC I0 0I0 )0-0m Doo0 L --- o- 0 0 00 0 CDCC ~ ~ 0 0: C )0 N4 -40 04r- 0 v - 4NNC 0 C,0 00C C
'H ON 0) N1 m 0 '0 '0 qT)4 f)6ONI ~- 0 0) U) .
0 NNNIINm.===Mm= NN.-N0 ===N .- NNN--4
w Omw oC4 Do"- enI 0U) -4r0oNN )0)6m 0) -c4'0t- 4N0 m)U-4) m .- 40 M )U)U 0N*w q0I-. 40N-I. I u) . e- n U )- w0o i)-4r- r- wr"c e0N4 v -0q00o- m mm
00ww Ow0 4.- U) m)6 N 0'LA )n CO -- 0 0N0%6)m '0 m )0v U)U)0)0M
OZ-9 0 '0 0 0 Ln ZN 0 4 010 '04U)N6M)'0- 10 - 40)I-n m
0q 04 i i- U) O N(1-0 ) 0 0 ' 0 ' 4 U )' 0 6 0 0 4) U 0 0 ' 0 Nc '0
C -k In 00 -- 0 c n m l nd (-I0 -N NN.t4 mN.NN 04' 0~6 ))) 0- 4-4- 0.1 -4-4V4n N
0000-444 0 000 00 0000 000---444--444--
12

CU
o t)to 4-
00 t
o~~~c £4QLnO -C4-
44 4) 4. 0£4 0C .:4
0. ~r woo4 £~U) C) v 0
(n r- WO
0 0 CD D4
CU ~0 co
C) 'a4) ca0
0.~ CU 44qU~
*d 04
x z ''-C 0Ot
40 b~tn ou0 :
U) - W4
.
0 1 o;~o r 42 -
-4 -4
CU4 0 w
6; U )Q ) 14- CU 0~ r. - - - m
0 o -- 4 6 -)U O~0 0, 0 -41 Z
490 Ot> o0m 7.U
4G) ..o. q)
4-. Z4 Co CD0 1w- 6C Cq
cd ~C
U0 0 to . O0 M.0CU 0 -a-- *
4J4
bOX 4..N
0 0.

width of the time window was arbitrarily chosen, and, while it may still be too
large to provide physically meaningful spectra, it is an improvement on the rela-tively open-ended approach of Castelli and Barron. 5In practice, as we shall
show, large microwave bursts often have their maxima at frequencies across the
spectrum occurring within 1 to 2 min.
The reported peak-flux-densities in the five-minute window were plotted as a
function of frequency on log-log graph paper (Figures 1 through 5 and 7 through 9).We considered only frequencies it 200 MHz with the exception of Boulder (184
MHz). Generally the highest observed/reported frequencies were in the 10- to
20-GHz range, although observations at 35 GHz (Sagamore Hill and Nagoya) and
beyond (Slough) were available occasionally. Visual fits were made through the
plotted points for each event. At frequencies > 2 GHz, it was relatively easy toconstruct a consensus peak-flux-density spectrum from the plotted points owing
both to the smoother spectral and temporal variations at these frequencies and
also to the reasonably good (10- to 20-percent variations) 2 2 .27 inter-calibration
of the worldwide patrol. Below 2 GHz, and especially near 200 MHz, the situa-
tion becomes more difficult. The narrow band features in the decimeter range
" Opresent a particular problem since one cannot be sure whether an apparent pro-
nounced spectral variation is real or the result of an erroneous report by a single
observatory. The procedure we eventually adopted at decimeter wavelengths was
close to a "connect the dots" approach, smoothing out minor variations that could
be due to calibration differences but following exactly large variations that we had
no reason to doubt. Examples of events with relatively narrow band decimetric
features in their spectra are given in Figures 3(b), 3(c), 4(b), 4(c), 7(b). 9(b),
and O(c). At f - 200 MHz peak-flux-densities reported by different stations Ob-
serving at closely spaced frequencies can vary by a factor of 2 to 5 or more
[Figures 2(a), 4(b), 4(d), 5(a)-5(d), and 7(a)l. It seems doubtful that variations
of this size could be due to faulty calibration since the difference would also ap-
pear in the daily measurement of the quiet-sun-flux. Rapid spectral variations in
the burst emission at these lower frequencies may play a role, although, for cer-
tain cases (e.g., Nos. 23, 95, 155), large discrepancies were noted in the re-
ported peak-flux-densities of observatories monitoring the ame nominal frequen-
cies. We suggest that the significant differences often observed near 200 MHz
result from the effects of different time constants on bursts with fast time struc-
ture or froTh non-linear receiver response for large events. Since both of these
effects will tend to reduce observed peak-flux-densities (assuming one does not
27. Tanaka, H., Castelli, J. P., Covington, A. E., Kruger, A., Landecker,T. L., and Tlamicha, A. (1973) Absolute calibration of solar radio fluxdensity in the microwave region, Sol. Phys. 29:243.
14
'WvS
.N

over-correct for non-linearity), we favored the higher reported values in events
with widely divergent peak -flux-densities at 200 MHz. This decision affected the
spectral classifications of 12 events (Nos. 9, 19, 22, 32, 43, 50, 60, 90, 110,
111, 121, and 139) in Table 1.
While observatories may report the t ime s/peak -flux -densities of several
maxima at a given frequency in a complex burst, this practice is by no meansIstandard and often only the largest peak is reported. This is a particular prob-lem at the lower (< 1 GHz) frequencies where the largest peak may not occur
until late in the event. For certain events with insufficient spectral data at theanchor time, however, it was possible to infer the spectral shape by using peak
fluxes reported later (or earlier) in the event as upper limits (Nos. 13, 29, 44,
78, 80, 82, 100, 135, 183, and 186). Also for two cases where a peak 200-MHz
flux was reported without a corresponding time (Nos. 6 and 11), we were able to
classify the microwave spectrum by assuming that the 200-MHz peak time was the
same as that of the peak at the next highest frequency reported (- 600 MHz in
both cases).
For each event in Table 1, we have included a sufficient number of frequency/
0 peak -flux -density pairs to allow one to recreate the spectral curves that we ob-
tained by fitting the tabulated data. In columns 7 through 11, the peak-flux-den-
sities of our constructed spectra at f = 200 MHz, 500 MHz, 1 GHz, 3 GHz, and
10 GHz are listed. In columns 12 through 17, frequency/flux -density pairs for
the spectral minimum, maximum, and highest frequency reported are listed. If
the highest frequency for which observations were reported is less than 10 GHz,
the value in column 11 was obtained by extrapolation. For all but 19 cases, in-
dicated by an asterisk in column 17, the information in columns 7 through 17 is
sufficient to reconstruct the peak -flux -density spectrum with reasonable accuracy.
For the 19 events requiring further data, an additional frequency/ peak -flux -den -
sity pair is given following the table. The additional data points were needed pri-
marily to describe rapid spectral variations in the decimetric range (300 MHz to
-2 GHz). Certain of the events exhibited apparent spectral minima at f -=' 10 GHz
(e.g. , No. 45, Figure 4(a)l ; these higher frequency variations are not covered by
the data in Table 1. The negative numbers appearing in place of peak -flux -density
values in columns 7 through 11 are defined as follows:
-I F a station is observing at this frequency but does notreport an event,
-2 =_no station is observing,
-3 uncertain value but - 100 sfu,
-4 uncertain value but < 100 sfu,
-5 Euncertain value.
4" 15
, 6e.-

2.4 S lx.'tral (Oase'
Despite the occasional complexity that may present itself in the peak-flux-
density spectrum of any given event, we found that we wcre able to classify the V
spectra of the events in Table 1 into two basic groups and an intermediate type.
The dominant spectral type was the U-shape, designated by a I in column 18, that
comprised 59 percent (113/193) of the sample. For a peak-flux-density spectrum
to be classified as U-shaped, we required:
(a) a spectral maximum _- 800 sfu at some frequency f - 2 GHz,
(b) a second maximum _> 800 sfu at some frequency ( _ 200 MHz)
below that of (a), and
(c) a spectral minimum at some frequency between that of the
maxima in (a) and (b) (but ' 10 GHz) with a flux-density value
significantly ( -> 40 percent) below those of (a) and (b).
The condition that the minimum occur at f - 10 GHz excludes event No. 9928 that
has its only minimum at f - 15 GHz. This is consistent with the specification by
(:astelli and Barron 5 that the spectral minimum occur in the decimetric range.
Event No. 170 had the highest frequency spectral minimum (5 GHz) of the 113
events that satisfied these criteria. Event Nos. 61, 63, 134, and 187 only mar-
ginally met the - 40 percent minimum criterion and are lower-confidence U-
bursts.
The above definition allows a variety of spectra to be classified as U-shaped.
A number of examples of this spectral type are shown in Figures I through 5.
Figures 1 and 2 contain examples of the classic U-burst spectrum, with the low
frequency flux-density maximum occurring from - 200 to 500 MHz. Approxi-
mately 75 percent of the U-bursts in our sample had this type of spectrum; - 20 (percent had their lower frequency maximum in the range from > 500 MHz to 2 GHz.
The spectrum in Figure 1(c) has emission maxima in both of these wavelength
ranges. Figures 3(a), 3((!), 3(d), and 4(a)-4(d) give seven of the fifteen cases of
U-bursts that had their low frequency peak at f > 1 GHz. The events in Figure 3
were on the list of Castelli and Barron5 while those in Figure 4 were not. Figure
5 contains four of the twelve events in our sample that were classified as U-bursts
because of our decision to favor high flux values at 200 MHz. Event No. 32
[Figure 5(b)J was also on CB's list.
At this point it is of interest to compare our list of events with U-shaped
spectra to that of Castelli and Barron for the period in common from 1966 to 1976.
Of the 85 previously identified U-bursts during this period (81 from CB and four
28. Zirin, H., and Tanaka, K. (1973) The flares of August 1972, Sol. Phys.32:17 3.
16

(A) (B) 4
,o' ,o'
24 MACK 196 29 IETRP023,2 UT AW UTNO 5NO 27
FRMateCV (C ) FREOENCY tGtW
(C) (0)
-0--
01 i
28 '0UK K97 05 TXEBR 19741252 UT '535 U
TNO 6 Nc '5'
FRWQ.8NCv (WM) FK0TOq.KCY e
Figure 1. Examples of the Classic U-Shaped Spectrum, With the Low Fre-quency Maximum Occurring Near 200 MHz. The event on 28 October 1970(c) had an additional maximum in the decimetric range. Each of theseevents was on Castelli and Barron's 5 list of U-bursts. In Figures 1 through5 and 7 through 9, Xs indicate doubtful or uncertain flux density values anddownward (upward) pointing arrows indicate upper (lower) limits. Uncer-tainties in measured peak fluxes at frequencies > 2 GHz are typically. < ± 20 percent. Differences in reported values at f ;< 2 GHz may be sub-
stantially larger (factors of 2 to 10) as can be seen from these figures.Note that the origin of the y-axis of the plots in Figures 1 through 5 is at10 sfu vs 1 sfu in Figures 7 through 9
17
......... ........

(A) (8
go' ]~."
x
1000
2 O(YOKA r977 22 NOVEWBER 19770951 UT01,UNO 138 O 3
1 QNCY (G,.Z) FEQUENCY (G.2)
(C) (0)
%m ,
2/.*
. _ 10
-9'
' Figure 2. Examples of the Classic U-Shaped Spectrum With the Low Frequency
', ,"Maximum Occurring Near 200 MHz. These events occurred after the period ex-amined by Castelli and Barron. 5 The U-burst on 22 November 1977 (b) was one
of 12 events in Table 1 whose peak -flux-density classification was affected by
our decision to favor higher reported flux values at f -- 200 MHz
18
y-5.,.%.PM
'* ' - . .- . 9 - . - .9 . - 4 ' " .r • " . " . . " . " - " . " - " . , ' , '' , ° ' , ' '

(A) 8
26 S P.U ER 96 24m A W tW o n
0030 UT 2W2 UT
2~OuNCY GHZIFREQUENCY (13142)
(C)
(D)I
4 'J
3- -
06 APA3L 1971~~. ! Ogur7 7,EPVER
Figure 3. Examples of U-Shaped Peak -Flux -Density Spectra That Had TheirLower Frequency Maximum in the Decimetric Range. Each of these eventswas on Castelli and Barron's 5 U-burst list
19

(A)A
* 53 8
'0 0'
14-0~, MACH ~28 &)NJE r970
1334 UT203UNO 45 N 7)
FROEUECY (GHZ) 0FREQUENCY ()e
(C) )
3 0
.6 DCENR 197. O MARCH 19730348 UT 1120 UTNOK), NO .07
FREQECY (Oe) FREQUECY IW
Figure 4. Examples of U-Shaped Peak-Flux-Density Spectra That Had TheirLower Frequency Maximum in the Decimetric Range. These events were noton Castelli and Barronlsd list
I 20

r*4
(A) (B)
10,
X!
1331 UT 2257 UT
FREQUENCY II-)
- 02-
p •
0830 UT 199 UT
NO 90N10
FREQUENCY (W) FREQUENCY (W4)
Figure 5. Four of the Ten Events in Table I That Were Classified as U-BurstsBecause of Our Decision to Favor High Flux Values at 200 MHz. The event on31 October 1968 (b) was also classified as a U-burst by Castelli and Barron5
21
C%5. sk

6added by Castelli and Tarnstrom, 11 occurred either at or behind the solar limb
(# > 85) and were not considered for our list. For event No. 10 (02 November
1967. 0856 UT) on the CB list. no observatory on patrol reported an event with
Sp at 800 sfu [ Gorky, Sp (9.4 GHz) > 520 sfu]. For 14 other events on CB's list
(several of which were discussed in the introduction), we were either unable to
classify the peak-flux-density spectrum because of insufficient data in the five-
minute window (nine cases) or arrived at a different classification (five cases).Thus there were 59 events in the intersection of our U-burst data sets for the
common years of these studies. In addition, we identified 25 events during this
period, not included on the U-burst list compiled by CB and Castelli and
Tarnstrom, that satisfied the U-shaped spectral criteria we adopted. We point
out that 13 of these 25 events (Nos. 3, 4, 19, 49, 50, 63, 66, 67, 71. 75, 105,
110, and 111) would not have been classified as U-bursts if spectral maxima ?
1000 sfu (vs > 800 sfu) in the meter/decimeter and centimeter wavelength ranges
had been required. This would account for their absence from the CB list. (By
the same standard, event Nos. 5, 7, and 26 in Table 1 might be excluded from the
CB list. ) The 12 events that appear to satisfy their criteria and are missing from
their list are Nos. 6, 12, 37, 45, 61, 83, 90, 94, 97, 107, 112, and 133.
Figure 6 is a histogram showing the timing of the flux-density peak at 200
MHz relative to that of the 10-GHz peak for the U-bursts in Table 1. Only cases
where reported maxima at both of these frequencies fell within the five-minute
30-200 MHZ 200 MHZ
MAXIMUM MAXIMUM25 PRECEDES FOLLOWS
20-
5 15 ,
5[
MINUTES MINUTES
I GHZ MAXIMUM
Figure 6. The Timing of the Maximum - 200-MHz Emis-sion for the U-Bursts in Table I Relative to the Timing ofthe - 10-GHz Maximum. For - 70 percent (70/102) ofthe cases the peaks at these widely separated frequenciesoccur within ± 1. 5 min of each other. The data are takenfrom columns 3 and 4 in Table 1
.dq22
B ,S

sliding window were considered. The histogram shows that intensity maxima at
these widely spaced frequencies often occur quite close in time, within ± 1. 5 min
for - 70 percent (70/102) of the cases.
For 52 of the 165 events in Table 1 for which we were able to determine
spectra, a z- 800-sfu maximum at f - 2 GHz was not accompanied by a maximum Iwith Sp 2- 800 sfu at a lower frequency. In many cases the high frequency emis-
sion was apparently unaccompanied by any emission at lower frequencies and
emission would appear to taper smoothly down from the centimeter wavelength
maximum and cut off at frequencies > 1 GHz. In other cases the spectrum was
U-shaped but the lower frequency maximum did not have Sp 2 800 sfu. Still in
a few other cases the spectrum below the centimeter wavelength peak neither cut
off completely nor turned back up, but remained relatively flat at a given fluxdensity level. To distinguish between these various types of events we adopted
the following classification scheme. We classified as having intermediate peak-
flux-density spectra those events for which:
(a) a spectral maximum 2 800 sfu occurred at f - 2 GHz,
(b) no significant (Sp -! 800 sfu) spectral maximum occurred
* at a frequency lower than that of (a) (down to 200 MHz), and
(c) Sp (200 MHz) = 100 sfu.
This set of criteria distinguishes these events from those having cutoff or quasi-
cutoff spectra for which criteria (a) and (b) also apply, but for which criterion
(c) becomes: Sp (200 MHz) < 100 sfu. Thus microwave bursts of the intermedi-
ate spectral class, designated by a 2 in column 18, have peak 200-MHz emission
between that of U-bursts and cutoff events (3 in column 18). We point out, how-
ever, that the occurrence of a decimeter wavelength peak with Sp : 800 sfu auto-
matically qualified an event as a U-burst in our classification scheme (assuming
it met the other stated criteria), regardless of the peak-flux-density of any re-
ported 200-MHz burst.
While for many of the events having cutoff spectra, emission appeared to becut off well above 200 MHz, we know from experience that, because of the rela- 4tively high level of activity at the lower frequencies, many and perhaps a major-
ity of the smaller events (Sp < 100 sfu) at 200 MHz go unreported. 2q Thus the
cutoff events are not necessarily those for which no low frequency emission was
observed, but rather are events for which the peak 200-MHz emission was sig-
nificantly down (a factor of eight or more) from its centimeter wavelength maxi-
mum. In all cases where no event was reported near 200 MHz (184 to 328 MHz),
29. Roelof, E. C., Dodson, H. W., and Hedeman, E. R. (1983) Dependence ofradio emission in large Ha flares 1967 - 1970 upon the orientation of thelocal solar magntic field, Sol. Phys. 85:339.
23
J%% --

we checked the published patrol times to see if a station (e.g. Hiraiso, Gorky,Sagamore Hill) was, in fact, observing in this frequency range. If a station was i
observing and did not report an event, we assumed that Sp ( 200 MHz) < 100 sfu.
No station was observing near 200 MHz for event No. 165, and we could not clas-
sify its spectrum by our method.
Eighteen of the 193 events in our data set (nine percent) had intermediate
peak-flux-density spectra and 34 (18 percent) had cutoff spectra. Examples of
intermediate spectra are shown in Figure 7 and examples of cutoff spectra are
given in Figures 8 and 9. Examples of intermediate and cutoff spectra with deci-
metric peaks are shown in Figure 7(b), and Figures 9(b) and 9(c), respectively.
We were unable to classify the peak-flux-density spectra of 28 (15 percent) ofthe events in our data sample (? in column 18). The most common reason (20
cases) for our inability to construct a meaningful spectrum was the lack of data
points, particularly at low frequencies, within the five-minute sliding window.
For five other events (Nos. 1, 20, 21, 128, and 172), burst maxima within the
five-minute window were reported across the spectrum, but the peak-flux-density
values at - 200 MHz, on which our classification system hinges, were uncertainand were < 800 sfu. I Because we favored high reported flux values at lower fre-
quencies, we classified four events (Nos. 11, 32, 92, and 169) with doubtful
- 200-MHz flux values > 800 sfu as U-bursts. ] For two cases (Nos. 119 and
4 136), unresolvable discrepancies in reported flux values at one or more frequen-
cies made it impossible to assign a classification. Note that criterion (a), re-
quiring a spectral maximum - 800 sfu at f L- 2 GHz, is the same for all three
spectral classes. Only one event in Table 1 did not satisfy this requirement and
fell into the unclassified category. Event No. 30 had a single spectral maximum
at 606 MHz of 260, 000 sfu; emission declined to a value of 220 sfu at 19 GHz, the
highest frequency at which observations were reported.
2.5 Associated Sweep Frequenc) MIeter %avelengti Events
The starting times of meter wavelength Type II sweep frequency bursts, as-sociated with the large microwave bursts under consideration, are given in col-
umn 19 of Table 1, and the occurrence of an associated Type IV burst is indicated
by an X in column 20. To determine the Type II onset (and end) times that are
used in the analyses in the next section, we preferentially used the meter wave-
length times reported by Ft. Davis, Culgoora or Weissenau. If two of these sta-
tions reported an event, we averaged the reported times. However, if one of
these three stations was on patrol and did not report a Type II burst and another
station (e. g., Durnten or Sagamore Hill) did, we considered the Type II report to
be valid. Also, if no meter wavelength Type II or IV was observed but an event
24
WTI
. . . . . .. . .

(A) (f)
losx
4)'I1 FEBUARY 1970 I Y 9730707 UT It49 UT
NO 60 OD4 UTe 060
NO 106
FREOPENCY (GHZ) FREQLNCY ( .)
10
0
08A.N&6JY P9790238 UT 26 AUGUST 97
6066N I678
F;= (W)F ip&cY ("I) .Y
Figure 7. Examples of Microwave Bursts With What We Have Termed"Intermediate" Peak-Flux -Density Spectra. The classification of theevent on 11 February 1970 (a) was affected by our decision to favor thehigher reported flux values near 200 MHz. The spectrum of the event _on 11 January 1973 (b) has a decimetric component, while that of 08January 1979 (c) is relatively flat in the meter and decimeter range
Us,,'25
--
o 1Jnay17
b a
eimti
opnnwieta
f0
-. *( ,*
.CA.
.. *"
5 p
I-
()
SX
iL
II
Quasi-Cutoff66SpectrU
~ 26
% %.. ......
F~~0AINCY ~ % (01)rgicP(4

JA)(8
10'
I4 4JUNE 970 M6 aT0507 UT
ND 68 N 13
FP4LENY (GEZ) FROLECY (GE)
(C) I
11JULY 1978 15 NOE I 1979 .12 31 UT Ml5 UTNO '56 NO 19
* 3..FRE0(J(NCY (W) FRC0LE7CY (GE)
Figure 9. Examples of Large Microwave Bursts With Cutoff or Quasi-Cutoff .
Spectra. The events on 13 October 1974 (b) and 11 July 1978 (c) exhibited adecimetric component in their spectra
.Pr27
r.
- -. ,'~ ~ ~ >- ;I2-%

was reported at decimeter (c) or decameter (k) wavelengths, we have indicated so
by appending a c or a k to the entries in columns 19 and 20 as appropriate. For
the Type IV associations, we did not consider events for which continuum (but not
Type IV) was reported.
Meter wavelength Type III associations are indicated in column 21 by an X
(with c and k appended as in columns 19 and 20). We considered a Type III event
to be associated with a listed microwave burst if Type III emission, reported by
any observatory, occurred within ± 10 min of the listed time of the 10-GHz emis-
sion maximum. We considered long duration (S or N) Type III activity to be asso-
ciated only if it began within ± 15 min of the 10-GHz maximum. The s descriptor
(for "simultaneous") was used when the Type III duration encompassed the time of
the 200-MHz maximum, ended !S 0. 5 min prior to the 200-MHz maximum, or
began 5s 0. 5 min after it. Of course, as Svestka and Fritzova-Svestkova 2 1 point
out, it is impossible to tell if Type III emission and the 200-MHz maximum areexactly coincident, without examining the sweep frequency records, for the typi-
cal case for these large bursts of a Type III series lasting for several minutes and
composed of tens of individual bursts.
We used QBSA and SGD as sources for the sweep frequency data. In columns
19 through 2 1, N. 0. (no observations) indicates events for which sweep frequency
data were not available.
2.6 Proton Data
For the proton associations for the events in Table 1, we used the Catalog of
Solar Particle Events, 1955-1969, 30 reports by Dodson et al. 31,32 and the pub-
lished list of van Hollebeke et a13 3 for the years 1965 through 1972. We made the
associations ourselves for the subsequent years. In column 21, we have listed
the characteristic of the logarithm of the peak prompt (i. e., non -sudden com -
mencement associated) >l0-MeV proton flux [J 1 10 MeV) in pr cm-2 sec - 1 sr -1 ]
for each event with proton association. We only considered increases for which
30. Svestka, Z., and Simon, P., Eds. (1975) Catalog of Solar Particle Events,1955 - 1969, D. Reidel Pub. Co., Dordrec', Holland.
31. Dodson, H. W., Hedeman, E. R., and Mohler, 0. C. (1977) Survey andComparison of Solar Activity and Energetic Particle Emission in 1970,AFGL-TR-77-0222, AD A048479.
32. Dodson, H. W., Hedeman, E. R. , and Mohler, 0. C. (1978) Solar and Geo-physical Associations With the Principal Energetic Particle Events in 1971and 1972, AFUL-TH-78-0266, AD A065260.
33. van Hollebeke, M. A. I., Ma Sung, L. S., and McDonald, F. B. (1975) Thevariation of solar proton energy spectra and size distribution with helio-longitude, Sol. Phys. 41: 189.
28
.4k

the logarithm of the peak near-Earth > 10-MeV flux had a characteristic 2- -2.
Somewhat smaller increases, with log (J) < -2. can be observed by existing sat-
ellite sensors, but fluctuations at this level are common, and it is difficult to
confidently associate these small increases with flares. 2 6 , 3 3 For the period
from January 1965 to May 1967, we relied on the proton event classification of
Smart and Shea 3 4 as used in Svestka and Simon 3 0 to determine the logarithm of
J (> 10 MeV). For the period from May 1967 to May 1973, we were able to make
this determination directly from the > 10-MeV data acquired by the Johns Hopkins
University/Applied Physics Laboratory (JHU/APL) experiments aboard IMP F,
G, and I and published in SGD. For the years 1973 to 1979, we worked with the
20- to 40-MeV data collected by the JHU/APL sensors aboard IMP H and J. For
this differential channel, a peak flux of - 10-4 pr cm -2 sec 1 sr- MeV-1 cor-
responds to a peak > 10-MeV flux of J 10-2 pr cm "2 sec - 1 sr-1 if one assumes
a spectral slope of -3. In all cases we subtracted the background due to earlier
events when determining log (J). .-
Since: (1) prominent flares from complex active regions tend to be closely
grouped in time (e. g., the August 1972 region where four major flares occurred
in a five and one-half day period), (2) big flares tend to produce big proton events,
and (3) large proton events have durations ranging from tens of hours to days, it
is not surprising that many of the events in Table 1 occurred when a proton event,
perhaps associated with an earlier listed event, was already in progress. In
some of these cases a fresh injection of protons can be seen above the enhanced
background. In other cases no new injection of protons is evident. In these latter
cases, we have indicated that a possible event was masked by putting an M in
column 21. The number in parentheses following the M is the characteristic of
the logarithm of the enhanced > 10-MeV flux at the time of the listed microwave
event. For several events in Table 1, an apparently associated proton event may
have, in fact, been caused by another flare (or flares) occurring closely in time.
(Or, alternatively, several flares may have contributed to the peak proton flux.)
This is a particular problem for proton events originating in eastern hemisphere IIactivity, since these particle events tend to have longer rise times. In column
2 1, we have denoted these "ambiguous" flare proton event associations with an A.
The number in parentheses following the A is the characteristic of the logarithm
of the peak prompt . 10-MeV flux. It is important to note that not all parent-flare
34. Smart, D. F., and Shea, M. A. (1971) Solar proton event classificationsystem, Sol. Phys. 16:484.
35. Heinhard, R. , and Wibberenz, G. (1974) Propagation of flare protons in thesolar atmosphere, Sol. Phys. 36:473.
29
X.'

candidates that might have produced a given A event are necessarily listed in
Table 1, but only those that met our selection criteria.
We note that for the period May 1967 to May 1973, Svestka and Simon 3 0 and
Dodson et a13 1 32 listed several events in Table l as sources of low energy
(< 10 MeV) proton events [Nos. 6 (spectral class = 1), 63 (1), 72 (1), and 80 (3)]°,
high energy (> 10 MeV) events with low (< 10 pr cm sec sr ) fluxes
[81 (1)1, or high energy events only observed by satellites far removed (> 60*)
from the Earth-sun line [ 56 (3) and 84 (?). For these events, we have placed a
"-" or an M (followed by the masking flux) in column 21 depending on whether the
pre -event level was at quiet background or an event was in progress.
2.7 Major Proton Events, 1965-1979
By examining the proton association of the 113 U-bursts in Table 1, we can
determine a false alarm rate for the U-burst forecast tool for predicting proton
events above a given threshold. However, since some major proton events may
be associated with flare-bursts without U-shaped spectra, or may have Sp
(2 2 GHz) < 800 sfu, 6, 19 it is not possible to determine from Table 1 the fraction
of proton events of a given peak intensity that will be associated with U-bursts. In
order to determine this parameter, we have compiled the data in Table 2 for the
46 prompt proton events with J (> 10 MeV) - 10 pr cm sec sr (above pre-
event background) occurring from 1965 to 1979 that had unambiguous visible hemi-
sphere (85°E - 0 -5 85°W) parent Ha flare associations. This is the same list of
events that was used in the study by Cliver et al, 19 but was not published there.
The J (> 10 MeV) R! 10 pr cm sec sr threshold was selected because it is
currently in use at the NOAA Boulder forecast center. 7 Columns 2 and 3 in
Table 2 give the flare date and location. Columns 4 and 5 give the times of the
associated Type 11 and Type IV bursts, respectively. In column 6, the peak-flux- ii
density and the time of its occurrence at 200 MHz (184 to 328 MHz) are given.
This is not a consensus or averaged value of the flux near the frequency, but is
the highest flux value reported by any observatory on patrol in this frequency
range during the time of the Ha flare. This is also the case for column 7 where
the maximum flux density reported by any observatory in the 10-GHz range (8.2
to I I. 8 GHz) is listed along with the time of its occurrence. A "-" in columns 4
and 5 indicates that no event was reported; an N. 0. means that the appropriate
observations were not made. In column 8, a U denotes those flare-bursts that
had U-shaped spectra satisfying the criteria used in Table 1, while a 40 indicates
proton events with J > 10 MeV) _ 40 pr cm -2 sec - I sr- I
30
.%!N.
L-. 30 t

Table 2. Large Proton Events 1965-1979 With Unambiguous Visible-Disk-
Flare Associations
FLARE 200 MHz 10 GHzDATE LOCATION TYPE II TYPE IV MAX FLUX/TIME MAX FLUX/TIME U/(J>40)
T74~W- T- -T T--67 --- 77 -T-T-1. 05 Feb 65 N08 W25 - (a) 1800-1940 >250/? 9/1831 - -
2. 24 Mar 66 N20 W42 0234-0253 ? (b) 2090/0234 930/02-2 U/403. 07 Jul 66 N35 W48 0038-0114 0042-0200 950/0039 12750100:8 U/404. 28 Aug 66 N22 E04 1531-1548 1527-1640 (70000)/1527 3580/1528 U/-
5. 02 Sep 66 N22 W58 U554-0614 50001(0556) 6970/0556 U/406. 23 May 67 N27 E28 1838-1905 1839-2320 N.O. 23000/1947 U/407. 28 May 67 N28 W33 0539-0556 - 3600/0540 7300/0542 U/408. 09 Jun 68 S14 W08 - 0839-0940c 6800/0848 1360/0850 U/409. 29 Sep 68 N17 W52 1619-1639 1636-1650 8700/1620 2810/1620 U/-
10. 04 Oct 68 S16 W37 0000-0027 - * (2170)/2359 85/0020 - -
11. 31 Oct 68 S14 W37 2359-0005 0002-0035 790/0009 2000/0011 U/4012. 01 Nov 68 S18 W47 0852-0900 0853-0915c 175/(0841) 1930/0912 -/40 A
0925-0952c13. 25 Feb 69 N13 W37 - 0904-1130 80000/0915 6600/0912 U/4014. 26 Feb 69 N13 W46 0426-0441 * >1360/0426 3670/0425 U/-15. 27 Feb 69 N13 W65 1404-1426 1407-1450 3750/1405 3000/1408 U/-16. 07 Jun 69 NIl E34 - 0953-0959c 55/0956 245/0956 - -
17. 25 Sep 69 N14 W14 - - * 400/0834 17/0753 - -
18. 31 Jan 70 S23 W62 1518-1522 1536-1614 137/1807 33/1601 _ _19. 07 Mar 70 S14 E48 - - - 42/1126 -/4020. 29 Mar 7U N13 W37 0040-0053 0038-0300 >13300/0103 5600/0041 U/4021. 30 May 70 S08 W32 - - * 300/0315 30/0340 - -
22. 23 Jul 70 N09 E09 - 1836-1903 8000/1934 4200/1845 U/-1918-19361946-1957
23. 05 Nov 70 S12 E36 0324-0351 0325-0450 470/0339 1250/0327 - -
24. 24 Jan 71 N18 W49 2316-2342 2317-0250 1000/2320 9100/2323 U/4025. 06 Apr 71 S19 W80 N.O. N.O. 50/0941 2300/0944 U/4026. 04 Aug 72 N14 E08 - 0621-1245 (500000)/0642 36500/0627 U/4027. 07 Aug 72 N14 W37 1519-1602 1517-1540 (8500)/1516 27056/1522 U/4028. 29 Apr 73 NI14 W73 2101-2122 2100-2250 16700/2216 11897/2103 U/-
29. 07 Sep 73 S18 W46 1200-1207k 1155-1200k 610/1141 334/1200 - -
1207-1215k30. 04 Jul 74 S16 W08 1359-1407 1353-1446 105000/1408 4950/1354 ?/-31. 10 Sep 74 N1O E61 2136-2158 2134-2220 3850/2143 9700U/2141 U/4032. 19 Sep 74 N09 W62 2233-2310 2232-0045 (968)/2238 3300/2240 U/4033. 05 Nov 74 S12 W78 1536-1551 1545-1700 1421/1535 321/1535 U/40(c)34. 30 Apr 76 S08 W46 2106-2128 2105-0055 897/2103 3188/2108 U/4035. 16 Sep 77 N07 W20 2233-2247 2230-0025 (2500)/2400 900/2308 ?/4036. 19 Sep 77 N08 W57 1038-1044 1042 1130 325/0950 2239/1037 U/4037. 22 Nov 77 124 W40 - 1002-1045 1600/1035 4735/1004 U/4038. 13 Feb 78 116 W18 0138-0200 0134-0400 300/0152 317/0202 -/4039. II Apr 78 N22 W56 1359-1425 1350-1449 770/1405 1318/1354 U/4040. 28 Apr 78 N22 E38 1320-1331 1319-1540 143600/1323 8728/1329 U/4041. 07 May 78 N23 W72 0328-0355 0329-0715+ 15000/0329 3450/0329 U/4042. 22 Jun 78 N18 E16 1704-1724 1703-1756 1150/1706 75/1742 - - I
1735-1748 68/102 -/0
43. 23 Sep 78 N35 W50 0958-1028 0954-1100 3850/1001 682/1002 -/4044. 09 Oct 78 S14 W61 1959-2016 * 4060/1950 415/1951 - -
45. 21 Aug 79 N17 W40 0615-0645 0608-0620c 51/0613 27/0618 -/4046. 15 Nov 79 N29 W35 2147-2206 2145-2235 90/2144 634/2151 -/40
31
777 I
p "".

',
.,
Table 2. Large Proton Events 1965-1979 With Unambiguous Visible-Disk-Flare Associations (Contd)
Notes:
(a) Ft. Davis reported unclassified bursts with Type II characteristics,1800 to 1811 UT.
(b) Type IV emission began at 0300 UT, "- 2 hr before the Ha onset ofthe listed flare, and continued until 0523 UT.
(c) The high frequency spectral maximum occurred at f _ 35 GHz(Sp - 2000 sfu).
* Continuum or Type I activity, beginning during the listed flare, wasreported for these events.
3. DATA ANALYSIS
3.1 Peak-Flux-Density Spectral Type vs Proton Events
In Table 3 we present our results on the association of proton events with
large radio bursts of different spectral types for the events in Table 1. Since it
is well known and understood in terms of interplanetary propagation that the pro-
tons accelerated in western hemisphere flares are more likely to be observed
near Earth than those with an eastern hemisphere origin, we have divided the
table into two parts, (a) and (b), corresponding to western- and eastern-hemi-
sphere events, respectively. We have further divided the events from each hem-
- .~ isphere into clean and masked or ambiguous cases. The clean events are those
in which the flare association is unambiguous, and a fresh injection of > 10-MeV
protons is observed above the flux background, either quiet or disturbed, existing
at the time of the flare. 4."
Considering the clean cases only, the percentage association of protons with
the three spectral types is as follows:
Spectral Type West East Total
(1) U-burst 91% (31 /34) 64% (25 /39) 77% (56/73)
(2) Intermediate 71% (5'7) 75,9 (3/4) 73% (8/11)
(3) Cutoff 75% (3,'4) 18% (2 11) 33% (5/15) %
The high degree of association between U-bursts and proton events for westernShemisphere flares supports the evidence presented by Castelli and Barron, in-
dicating that the U-burst is an almost sufficient condition for the occurrence of a
32
@4 %2X
, ~~~~~~~~~~~ ~~~~~ .,' .. .b ". . .' . . .' . N..%% " *% % " " "" "" " " " ,"" " "' P " " " % ' '%" O"" !" '

'I,
Table 3. Peak-Flux-Density Spectral Class vs Proton Event Size
(A) WESTERNHEMISPHERE "CLEAN" CASES MASKED EVENS
_ _ _ _ _D IVNTLOGAaTRM OF
>ECTRALTYPE FU >2 I 0 -I -2 -2 ?2 1 0 -I -2SPECTRAL TY EII
U-SHAPED 10 12 4 3 2 3 2 6 3 4 2
INTERMEDIATE 2 2 1 2 1 I 1 1
CUT - OFF I 2 25
UNCLASSIFIED I 2 I I 2 3 I
(B) EASTERN HEMISHEREAM8GU()UJS orHEMISPHERE CLEAN* CASES MASKED EVENTS
LOGARITHM OF' --.. 10 MEV-><2 _2
SECTRALTYP LUX 21 0-1-<2 21 0-1-2
U-SHAPED 2 4 4 7 8 14 1 1 6 7 8
INTERMEDIATE I 2 I I 2
CUT-OFF I I 9 3 3 2 3
UNCLASSIFIED 1 14 I 2 6
33
,. ..\
I.

S. i
proton event of any size. However, we note that the large western hemisphere
flare-bursts with intermediate and cutoff spectral classifications also have sig-
nificant proton association (71 and 75 percent, respectively). Since the number
of western hemisphere events of these two spectral types is small, it may be ..
appropriate to increase our sample size by considering the percentage associa-
tion of the three spectral types with protons for flares occurring anywhere on
the visible disk (85°E _: 0 !5 85°W). As expected, the percentage association for
U-bursts is smaller when the whole sun is considered. It is significantly below
the 97 percent (70/72) association found by Castelli and Barron for the visible
disk. [We note that the full sun association increases to 82 percent (60/73) if
one includes the four low energy/low flux proton events that were linked to U-
bursts (Section 2).] The proton association for the intermediate events is con-
stant over the full disk, although the total number of cases (11) is still not large.
For the entire sun, however, the percentage association of the cutoff events (33
percent) begins to distinguish itself from that of the U-bursts (77 percent) and the
intermediate events (73 percent). Although one cannot rule out the propagation
effect as the cause of the weak proton association of the eastern hemisphere cut-
off events vs that of the U-bursts, we note that the longitudinal distribution in
this hemisphere of flare-bursts of the three spectral types (with clean proton
circumstances) does not appear to favor either the U-bursts or the intermediate
events vs the bursts with cutoff spectra (Figure 10). The median eastern hemi-
sphere longitude for such events in each spectral class is as follows: U-bursts
(E38, 29 events), intermediate events (E50, 4), and cutoff events (E29, 11). Thus
in a consideration of the relationship of microwave peak-flux-density spectra to
proton events of any size, the U-shaped spectrum is differentiated primarily from
the cutoff spectrum that is deficient, and in many cases apparently lacking, in
200-MHz emission.
3.2 The U-Burst as a Forecast Tool
To derive a false alarm rate for the U-burst forecast tool, we counted as
successes only those cases in which a U-burst was followed by a proton event
with J (> 10 MeV) - 10 pr cm sec sr . If we consider only western hemi-
sphere events, we have 22 successes vs 21 false alarms for a false alarm rate of
40 percent (21/43). To determine the number of false alarms, we added the num-
ber of U-bursts without proton association to the number of U-bursts with clean
and ambiguous/masked proton associations for which the characteristic of log
(J 10 MeV) was - 0. We did ,iot (:onsider the eight masked or ambiguous cases
for which the peak - 10-MeV7 flux was above the prediction threshold. Technically,
ambiguous cases with J 1 10 MeV) - 10 pr cm -2 sec - sr - should be counted as
34
vN .~ .
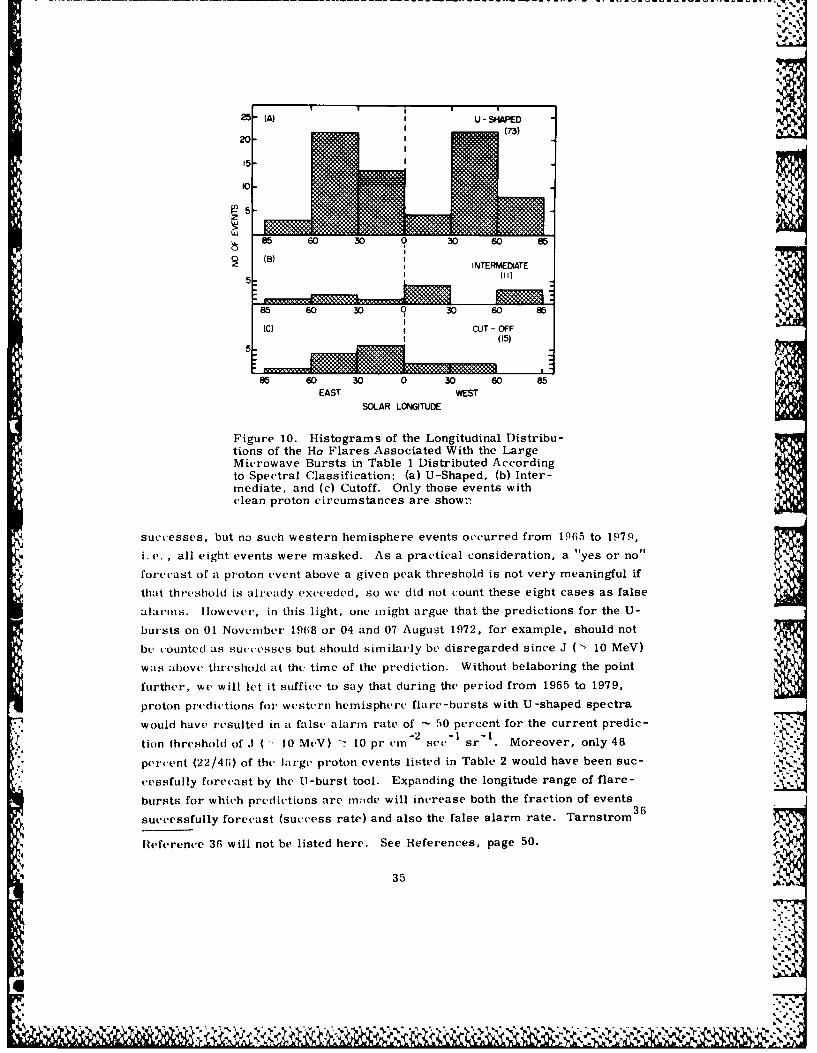
"a. -=
25(A) U- SAPED
20-
15-
85 60 30 30 60 85
(8) IINTERMEDATE
(C) CUT- OFF
EAST WEST
SOLAR LOWGITUDE
Figure 10. Histograms of the Longitudinal Distribu-tions of the Ha Flares Associated With the LargeMicrowave Bursts in Table 1 Distributed Accordingto Spectral Classification: (a) U-Shaped, (b) Inter-mediate, and (c) Cutoff. Only those events withclean proton circumstances are show:
successes, but no such western hemisphere events occurred from 1965 to 1979,
i. c. , all eight events were masked. As a practical consideration, a "yes or no"
forecast of a proton event above a given peak threshold is not very meaningful if
that threshold is already exceeded, so we did not count these eight cases as false
alarms. However, in this light, one might argue that the predictions for the U-
bursts on 01 November 1968 or 04 and 07 August 1972, for example, should not
be counted as successes but should similarly be disregarded since J ( 10 MeV)
was above threshold at the time of the prediction. Without belaboring the point ,
further, we will let it suffice to say that during the period from 1965 to 1979,
proton predictions for western hemisphere flare-bursts with U-shaped spectra
would have resulted in a false alarm rate of - 50 percent for the current predic--2 -1 -1
tion threshold of J ( 10 MeV) ! 10 pr cm sec sr Moreover, only 48
percent (22/4(6) of the large proton events listed in Table 2 would have been suc-
cessfully forecast by the ti-burst tool. Expanding the longitude range of flare-
bursts for which predictions are made will increase both the fraction of events
successfully forecast (success rate) and also the false alarm rate. Tarnstrom 3 6
Reference 36 will not be listed here. See References, page 50.
35
1," %
L..

noted that for the period from 1966 to 1976, the performance of the U-burst fore-
cast tool would have been optimized by issuing yes-no forecasts following U-bursts
associated with flares located between E20 and W90. From the events in Tables 1
and 2, the values of the success and false alarm rates for this longitude range,
actually E20 to W85, are 54 (25/46) and 56 percent (32/57) respectively. We note
that even if the longitude range from E85 to W85, comprising all events in Table 2,
is considered, the success rate is still only 61 percent (28/46) while the false
alarm rate is 73 percent (75/103).
Since the U-burst forecast tool was originally developed for prediction of PCA
(Vents with 2. 0 dB of 30-Mlz riometer absorption, 1-3 corresponding to proton(vent wt.1 0 40 c-2 -1I -1 I G 37
(.-nts with J ( 10 M(.V) - 40 pr cm - se sr , it is appropriate to con-
side-r how w(ell it works for these larger events. Of the 46 events in Table 2, 29
(indicated by a 40 in column 10) had prompt components with J (> 10 MeV) :->
40 pr cm-2 s(IC sr- Of these 29 events, 22 had U-shaped microwave spectra,
(i d(el'inite-ly did nt have U-shaped spectra, (Table 2, Nos. 12, 19, 38, 43, 45,
and 46), and we were unable to classify the remaining event (No. 35) from the
data reported in SGD. Since event No. 19 on 07 March 1970 is considered to be a
doubtful flate association, 19 the percentage association of U-bursts with these
large prompt proton events ranges from a worst case of 78 percent (22/29) to a
best case of 82 percent (23/28) obtained by assuming No. 35 was a U-burst and
disregarding No. 19 because of the parent flare ambiguity. It is interesting to
note that four of the five large ( 40 pr cm sec sr ) proton events (disre-
garding No. 19) without U-burst association occurred after 1976. The 22 U-
bursts associated with the J Z 40 proton events are not particularly distinguish- -
able from the other U-bursts in Table 1. Although their peak flux densities at
the centimeter and m-ter wavelengths tend to be larger, as might be expected,
they range from values ' 1000 sfu (Table 2, Nos. 2 and 34) to > 20, 000 sfu (Nos.
6, 26, and 27) at 10 GHz, and from values < 1000 sfu (Nos. 3, 11, 25, 36, and
39) to > 50, 000 sfu (Nos. 13 and 40) at 200 MHz. Moreover, the microwave
spectra of these events encompass the full variety of shapes that are allowed by
our definition of a U and include classic examples such as (Table 2) Nos. 2, 7,
13, 33, and 37 [see Figures 1(a), 1(d), and 2(b)] as well as less obvious cases
such as Nos. 3, 24. 25, 32, and 34 [see Figures 3(b)-3(d).-
37. Juday, R. D., and Adams, G. W. (1969) Riometer measurements, solarproton intensities and radiation dose rates, Planet. Space Sci. 17:1313.
36
10 .
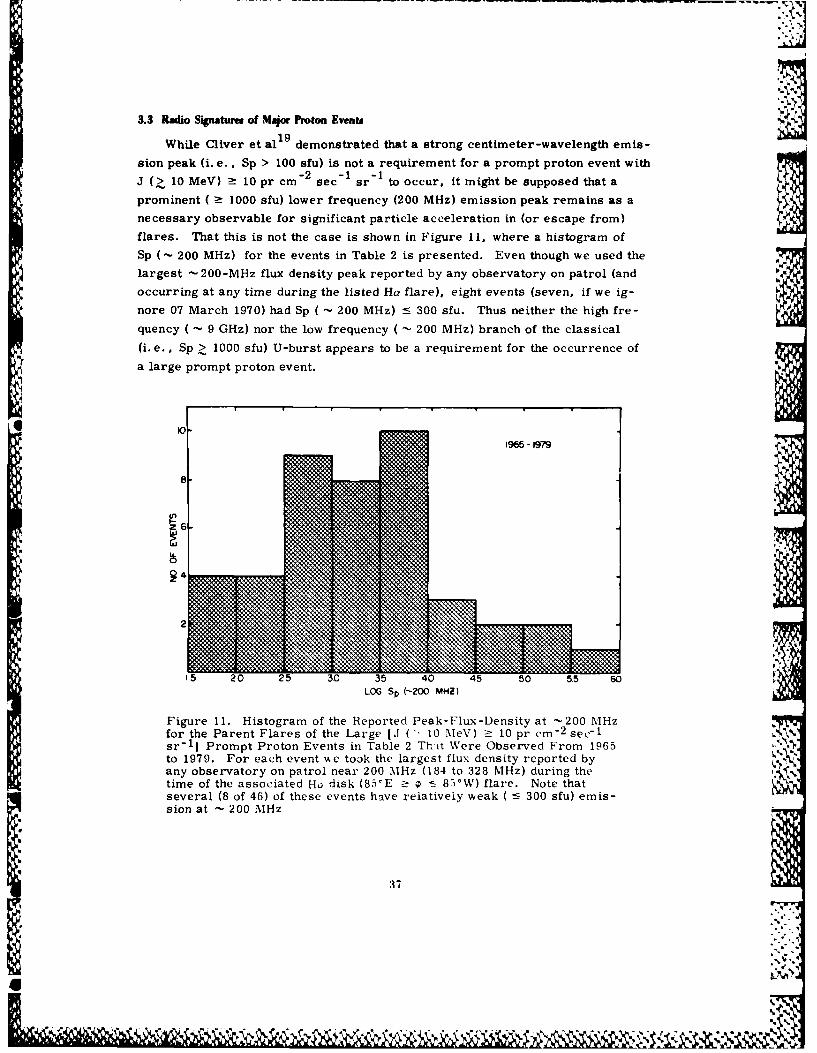
3.3 Radio Signatures of Major Proton Events
While Cliver et al 1 9 demonstrated that a strong centimeter-wavelength emis-
sion peak (i. e. Sp > 100 sfu) is not a requirement for a prompt proton event with
J (> 10 MeV) - 10 pr cm-2 sec "I sr "1 to occur, it might be supposed that a
prominent ( 2- 1000 sfu) lower frequency (200 MHz) emission peak remains as a
necessary observable for significant particle acceleration in (or escape from)
flares. That this is not the case is shown in Figure 11, where a histogram of
Sp (- 200 MHz) for the events in Table 2 is presented. Even though we used the
largest -200-MHz flux density peak reported by any observatory on patrol (and
occurring at any time during the listed Ha flare), eight events (seven, if we ig-
nore 07 March 1970) had Sp ( 200 MHz) :- 300 sfu. Thus neither the high fre-
quency ( '- 9 GHz) nor the low frequency ( - 200 MHz) branch of the classical
(i. e., Sp Z 1000 sfu) U-burst appears to be a requirement for the occurrence of
a large prompt proton event.
10
1966-1979
8-
15 20 25 3.0 35 40 45 50 55 60LOG Sp (-200 MHZ)
Figure 11. Histogram of the Reported Peak-Flux-Density at -200 MHzfor the Parent Flares of the Large [J ( 10 .\e\I) - 10 pr cm - 2 sec " 1
sr"1] Prompt Proton Events in Table 2 T-'it Were Observed From 1965to 1979. For each event we took the largest flux density reported byany observatory on patrol near 200 MHz (184 to 328 MHz) during thetime of the associated Ho disk (85'E € 85°W) flare. Note thatseveral (8 of 46) of these events have relatively weak ( - 300 sfu) emis-sion at - 200 MHz
37
%9

Work by Pick-Gutrann, Harvey, and Castelli and Tarnstrom indicated
that the integrated microwave flux-density (E.) obtained by taking the product of
the burst mean flux-density and duration, might be an important parameter in re-
gard to proton acceleration in flares. 40 In particular, the Pick-Gutmann and
Castelli and Tarnstrom studies suggest that an integrated flux-density E. Z 10- 17
Joules m-2 Hz is a requirement (or threshold) for the observation of a polar cap
absorption event. However, this value of E; is relatively small and can be
achieved by a predominantly thermal burst (gradual rise and fall or post-burst
increase) with a mean flux-density of 15 sfu and a duration of two hours. In fact,18
with the possible exception of the 21 August event, the weak impulsive phase19 - 17
proton events discussed by Cliver et al had values of E. > 10 , primarily
because of their long durations. Since there is no apparent close physical link22
between thermal microwave emission and non-thermal energetic protons, the
concept of an integrated microwave flux-density threshold for proton acceleration "19 -
in flares may be misleading. 19
At this point, it is of interest to compare the U-shaped spectrum as an almost
necessary or favorable condition for a significant proton event to occur with meter
wavelength phenomena that have been linked to proton acceleration, specifically,Type 11 bursts.2 0 ,21 and Type IV bursts. 26,41,42 We find that Type Ils and Type
lVs are associated with the events in Table 2 (and with the subset of events with-2 -lI -l1
J (> 10 MeV) > 40 pr cm sec sr Iin the following percentages:
J ( 10 MeV)
> 10 protons cm -2 sec-1 srl > 40protons cm -2 sec-1 sr-l-
Type II 80% (35/44) 85% (23/27) AType IV 84% (36/43) 92% (24/26)
U-burst 65% (28/43) 81% (22/27)
38. Pick-Gutmann, M. (1961) Evolution des emissions radioelectriques solairesde Type IV et leur relation avec d'autres phenomenes solaires et geophys-iques, Ann.- Astrophys. 24:183.
39. Harvey, G. A. (1965) 2800 megacycle per second radiation associated withType II and Type IV solar radio bursts and the relation with other phen-omena, J. Geophys. Res. 70:2961.
40. Kundu, M. R., and Haddock, F. T. (1960) A relation between solar radioemission and polar cap absorption of cosmic noise, Nature 186:610.
41. Bell, B. (1963) Type IV solar radio bursts, geomagnetic storms, and polarcap absorption (PCA) events, Smithsonian Contr. Ap. 8:119.
42. Maxwell, A., Defouw, R. J., and Cummings, P. (1964) Radio evidence forsolar corpuscular emission, Planet. Space Sci. 12:435.
38
AJ, - *

The 07 March 1970 event was not included in these percentages; also excluded
were Nos. 25 (Type II), 2 [see footnote (b) to Table 21 and 25 (Type IV), and
30 and 35 (U-burst). We emphasize that these percentage associations were ob-
tained strictly on the basis of data reported in SGD and QBSA. A reexamination
of the sweep frequency records might reveal possible Type II events [ e. g.,
Maxwell, 43 and Bdhme and Kruger 4 4 reported possible Type Us for two flares in
the August 1972 sequence (Table 1, Nos. 100 and 101) for which no Type II burst
was initially reported in SGD; see also footnote (a) to Table 21. Nevertheless, in
view of the perceived link between Type II bursts and proton events, it is inter-
esting that - 20 percent of the events in Table 2, comprising the largest proton
events observed from 1965 to 1979, did not have obvious associated metric Type
II bursts. We suggest two reasons for the absence of meter Type Ils in several
large proton events. First, Robinson et a14 5 have recently shown that interplan-
etary Type II bursts, often associated with major particle events, can have
starting frequencies < 20 MHz and thus go undetected by ground-based sweep fre-quency patrols. Second, H. Ubarz (1984, private communication) informs us that
a lack of dynamic range on the Weisenau spectrograph during this period (since
corrected) could have resulted in a few Type Ils being masked by intense Type IV
bursts.
The distribution of the durations of Type II bursts for the events in Table 2
is given in Figure 12(a). This distribution is similar to that obtained by Kahler 2 6
from a sample of Type II bursts associated with proton events of any size for the
period from June 1973 to June 1980. (There are 17 common events in the two22
distributions. ) In determining the percentage association for Type IVs, we did
not consider reports of either continuum emission or Type I activity (beginning
during the Ho flare), both of which may be organically related to Type IV. The
five events for which either of these emissions (but not Type IV) were reported
are indicated in Table 2. The distribution of the durations of the Type IV events
in Table 2 is given in Figure 12(b).
43. Maxwell, A. (1073) Dynamic spectra of four solar radio bursts during theperiod 1972 August 2-7, in Rep. UAG-28, pt. I, p. 255, H. E. Coffey, Ed.,World Data Center A for Solar-Terr. Phys. , Boulder, Colo.
44. B6hme, A. , and Kruger, A. (1973) On the type IV bursts of August 2, 4 and7, 1P72, in Rep. UAG-28, pt. I, p. 260, H. E. Coffey, Ed., World DataCenter A for olar- Terr. Phys. , Boulder, Colo.
45. Robinson, R. D. , Stewart, R. T. , and Cane, H. V. (1984) Properties ofmetre-wavelength solar bursts associated with interplanetary Type IIemission, Sol. Phys. 91:159.
46. Cane, H. V. , and Stone, R. G. (1984) Type II solar radio bursts, inter-planetary shocks, and energetic particle events, Astrophys. J. 282:339.
39
W.4

(A) TYPE 3
42 U'4-
0i_, <5 5-65 15-25 25-35 >35
DURATION (MIN)
(B) TYPE XT
z 86
<20 21-40 4 -60 61 -120 > 120
DURATION (MIN)'
Figure 12. Histograms of the Durations of
(a) Type II and (b) Type IV Emission for theLargest [J (> 10 MeV) - 10 pr cm -2 sec - 1 0 ',
sr-l] Disk Flare (85°E ! 85°W) Asso-ciated Prompt Proton Events That OccurredFrom 1965 to 1979. Events where onlydecimetric (DCM) or decametric (DKM)
emissions were reported are indicated; all
other events were observed at meter wave-
lengths
3I.4 Microwave. Slx-ciral (Clas atid "r.e11/ lil l so
B(caus' of the statistical relationships between U-bursts and proton events
and between Typ, l/lV bursts and proton events, we have examined the associa-
tions of Type [/IV bursts with large microwave bursts of different peak-flux-
density spectral types. The percentage associations of these phenomena are pre-
sented in Table 4, where it can be seen that the percentage associations of micro-
wave bursts of different spectral class with Type II/IV bursts parallel their asso-
eiation with proton ('vents (85'E >-0-< 85°W). We note that the microwave events
with cutoff peak-flux -density spectra also appear to be deficient in Type III bursts.
The statistical results in Table 4 are consistent with the current picture1 7 ' 4 7 - 4 9
References 47 to 49 will not be listed here. See References, page 50. 4'
40
OR'' ~

r K K
1'
Table 4. Association of Sweep Frequency Bursts and Proton Events WithPeak-Flux -Density Spectral Classes
ASSOCIATED TP yE yc TVC FULL DISKSPECTRALTYPE TYPE TYPE TYPE PROTONS
TYPE Tu IT/orm (bLEANAsI)(109) (73)
U-SHAPED 93% 707, 73% 90% 77%(18) (II)
INTERMEDIATE 72% 61% 67% 78% 73%
(32) (15)CUT- OFF 34% 12% 19% 22% 33Y,
(25) (12)UNCLASSIFIED 80% 68% 68% 80 % 67%
that the protons observed at Earth are accelerated at a shock front, and it appears
I that the U-bursts are preferentially related to protons, in contrast to cutoff events,
because of their higher percentage association with Type Il/IV events. We should
b, able to (heck this supposition directly by comparing the proton association of
U-bursts (and cutoff events) that were accompanied by Type 11 and/or Type IV
emission with those that were not. However, as can be seen from Table 4, the
control group of U-bursts without Type [I/IV association is relatively small. Only
I I U-bursts that lacked both Type It and Type IV associations are listed in Table 1.
The spectra of three of these events, Nos. 19, 90, and 160, are shown in Figures
5(a), 5(c), and 2(c), respectively. Nine of these 11 events were associated with
eastern hemisphere flares. For two of these nine events, Nos. I1l 1-2 (M)J and
151) 1-1 (M)I, possible proton events were masked by small events in progress,
while only one of the remaining seven events, No. 90 (-2), was associated with
protons at the level ( -- -2) considered. Of the two western hemisphere events,
one, No. 160 1 -1 (M)), was masked, and one was unassociated. Thus only one of
the eight clean control events (albeit seven of these from eastern hemisphere
flares) was associated with a >10-MeV proton event. For comparison, we note
that 74 percent (23/31) of the clean eastern hemisphere U-bursts with Type II and/
or Type IV bursts had proton association. The seven clean eastern hemisphere U-
bursts without Type lt/IV association had a median longitude of 45, slightly less
favorable than the 31 clean eastern hemisphere U-bursts with Type II/IV associa-
tion, 38'. A consideration of the associations of cutoff events with ani without
41
o%

Type II/IV bursts and proton events is also hampered by small numbers although
the results are consistent with the overall statistics presented in Table 4; three of
the five clean cutoff events (E 16 median longitude) with Type l/IV association
were related to > 10-MeV events as opposed to two of ten clean cutoff events (E20
median longitude) without Type If/IV association.
At this point, it is instructive to consider in greater detail some of the cutoffevents that have proton association. For the event on 27 October 1968 [ No. 29,
log (J) = -1], Tanaka (see Svestka and Simon, 30 Part 2), reports Type IV emis-
sion beginning at 1307 UT, '- 30 min after the peak listed in Table 1 and near the
start of a major [ Sp (5 GHz) = 860 sfu] burst that we consider to be a secondary
peak in an extended flare event. Similarly for the event on 16 November 1970
[No. 79, log (J) = -1], the Type II/IV event begins at 0112 UT, - 20 min after the
listed peak, but near the maximum of a significant [Sp (9. 4 GHz) = 1030 sfuj burst
apparently associated with the same Ha flare. For both event Nos. 29 and 79,
200-MHz bursts were reported only in association with the later peak. These
events indicate that it may be misleading to expect the spectrum of a single peak
* •in a complex microwave burst to tell the entire story in regard to a flare's asso-
ciation with Type II/IV bursts and protons. For the above cases, it is tempting
to speculate that the flares evolved from a compact to an open magnetic field
structure. 50
One cutoff burst was associated with a large J (> 10 MeV) proton event. In
the 15 November 1979 event [log (J) = 1], the Type I/IV event began at 2147 UT,
4.2 min before the 10-GHz maximum. It can be seen from Svestka and Fritzova-
Svestkovals 2 1 Figure 4 that such events are relatively rare. 39 This event also
had a low ({ 2. 7 GHz) and apparently broad spectral maximum [Figure 9(d)]. In
the published Penticton record of this event, 12 the listed peak is preceded by a
smaller [ Sp (2.8 GHz) '- 250 sfu] peak at 2142 UT. Thus we tentatively identify
the listed event as a secondary peak in a complex microwave Type IV event, 51
and, as such, note that it may have a rather different nature than the other cutoff
events in Table 1
50. Pallavicini, R.. Serto, S., and Vaiana, G. S. (1977) A survey of soft x-raylimb flare images: the relation between their structure in the corona andother physical parameters, Astrophys. J. 216:108.
51. Cliver, E. W. (1983) Secondary peaks in solar microwave outbursts, Sol.Phys. 84:347.
" 42
..

S- - - - - - -
3.5 Timing of Type II Burst and 200-MHz Peak
Given the statistical associations between Type Ils, protons, and U-bursts
(and the relative deficiency of Type II emission and proton association in the cut-
off events), it seems logical to ask if the shock wave observed via the Type II '
burst, and presumably accelerating the protons, might in some way account for
the low frequency branch of the U, particularly the high fluxes often observednear 200 MHz. There are two possible ways that the Type II burst could account
for, or contribute to, the 200-MHz radiation. First the Type II itself is gener-
ally an intense emission with flux densities ranging from - 50 to several thousand
sfu. 24 For those events with relatively high starting frequencies, emission at the
second harmonic would be in the 200-MHz range and thus might contribute to the
low frequency branch of the U. About one-third of Type II bursts have fundamen-
tal starting frequencies > 100 MHz, 52 and about 60 percent of Type Ils exhibit
harmonic structure. 24 A second possible way in which a shock wave might con-
tribute to the 200-MHz emission that often comprises the low frequency branch of
the U is through the flare continuum emission designated as FC II by Robinson and
Smerd. This emission follows the Type II burst at any frequency and is thought
to be due to shock accelerated electrons trapped in a large scale magnetic loop. 54
To see if either the Type II or FC II could contribute to the 200-MHz emission in
U-bursts, we determined whether the associated (if any) Type II burst was in
progress at the time of the 200-MHz peak (within the sliding five-minute window)
for each of the U-bursts in Table 1. We counted as concomitant those cases in
which Type 11 bursts were in progress or began within 's 0. 5 min after the aver-
age peak time at 200 MHz. Since the low frequency branch of the U-shaped spec-
trum may be due to flash phase accelerated electrons, we also looked to see if a
Type III burst was in progress at the time of the low frequency maximum (Xs in
column 21 of Table 1), since these emissions are a characteristic component of
the impulsive phase. 55 (Type IV emission was in progress at the time of the 200-
MHz peak for about half of the U-bursts, but since flare continuum can also have
52. Maxwell, A., and Thompson, A. R. (1962) Spectral observations of radiobursts, II: slow drift bursts and coronal streamers. Astrophys. J. 135:138.
53. Robinson, R. D., and Smerd, S. F. (1975) Solar flare continua at the metre 1,>
wavelengths, Proc. ASA 2:374.
54. Robinson, R. D. (1978) A study of solar flare continuum events observed atmetre wavelengths, Aust. J. Phys. 3 1:533.
55. Kane, S. R. (1974) Impulsive (flash) phase of solar flares: Hard x-ray micro-wave, euv and optical observations, in Coronal Disturbances, Proc. of IAUSymp. No. 57, p. 105, G. Newkirk, Jr., Ed., D. Reidel Pub. Co.,Dordrecht, Holland.
43

component attributed to primary phase electrons, an ambiguity exists.) Theresults of the timing comparisons were as follows:
In Progress atTime of 200-MHz Peak*
(%)Type II only 19Type II and Type Ill 30
Type III only 44
Neither 7
*Sample size = 103 events. For 10 events the re-ported 200-MHz maximum either fell well outsidethe five-minute window, observations were notmade at 200 MHz, or sweep frequency observa-tions were not available.
From these statistics, it can be seen that the FC II and Type II emissioncould contribute to the peak 200-MHz emission in U-bursts in at most - 50 per-
cent of the cases, assuming that the starting frequency of the fundamental Type 11emission is > 100 MHz. For 21 U-bursts in Table 1 that occurred duringCulgoora observing hours, we were able to check the starting frequencies of theassociated Type Ils from a compilation by Robinson et al. Harmonic emission
started at f 200 MHz for only about half of these events (11/21 = 52 percent), 52
although for those events where the Type II was in progress at the time of the 200-MHz peak, harmonic emission began at f > 200 MHz in 71 percent (10/14) of thecases. (We note in passing that only one of the 11 20th solar cycle U-bursts hadstarting harmonic frequencies > 200 MHz vs 10 of 10 from the 21st solar cycle.)For 51 percent of the U-bursts in our sample, a Type II was either not observed,ended prior to, or began - 0. 5 min after the peak of the 200-MHz emission. Acomparison of the peak 200-MHz flux densities of these U-bursts (the 51 percent)with those of the Type II coincident events revealed no marked differences between
the two distributions. The median 200-MHz flux value of the Type 11 coincidentevents (3400 sfu) is larger, as might be expected, but the median value for the
non-coincident events (2000 sfu) is also well above the minimum value C-' 1000 sfu)required for the classical U-burst. Since the 200-MHz peak is coincident with
56. Robinson, R. D). Tuxford, J. M. ,Sheridan, K. V., and Stewart, R. T.(183) A catalogue of major mctre -wavelength solar events recorded bythe DAPTO and C:ulgoora solar radio observatories (1P61 - 1981), Proc.ASA 5:84.
44
• .~ ~. .. . . .. . . ... .

Type III emission for 74 percent of the U-bursts examined, it appears that flash
phase electrons are primarily responsible for the low frequency branch of the
U-shaped spectrum.
4. DISCUSSION
4.1 Summary
From this study of the peak-flux-density spectra of nearly 200 large [Sp ( 2
GHz) -> 800 sfu] microwave bursts and their associated proton and sweep frequen-
cy emissions, we have found the following:
(1) There appear to be two basic peak-flux-density spectral types: (a) U-
shaped, with two maxima 2! 800 sfu in the range from 200 MHz to :- 10 GHz (59
percent of all events) and (b) cutoff, with a spectral maximum > 800 sfu at f _> 2
GHz and Sp (200 MHz) < 100 sfu (18 percent). Nine percent of the events had what
we termed intermediate spectra with a spectral maximum 2! 800 sfu at f - 2 GHz
and 100 sfu - Sp (200 MHz) < 800 sfu. We were unable to classify 15 percent of
the events in our data sample.
(2) If the current NOAA proton prediction threshold of J (> 10 MeV) - 10-2 -1 -I
protons cm sec sr had been in effect during the period covered by our data
base (1965-1979), the U-burst "yes or no" proton event forecast tool would have
had a false alarm rate of - 50 percent and would have failed to provide a warning
for - 50 percent of the significant prompt proton flares attributable to disk flares
during this period. These figures apply if proton event warnings had been issued
only following U-bursts associated with western hemisphere flares. If warnings
had been made following U-bursts from anywhere on the sun (85°E - <- 85°W),
the false alarm rate would have been 73 percent, and 39 percent of the significant
proton events would nAt have been predicted by this method.
(3) The associations of flare-bursts (85°E * 85'W) of different peak-
flux-density spectral type with Type II and/or Type IV bursts and with > 10-MeVd., proton events of any peak intensity ( - 0.01 pr cm-2 sec 1 sr 1) are as follows:
U-shaped Type lf/IV (90 percent of U-bursts are associated with Type II/IV
events), protons (77 percent); intermediate - Type I/IV (78 percent), protons
(73 percent); cutoff Type lI/IV (22 percent), protons (33 percent).-'01
(4) In 74 percent of the microwave bursts with U-shaped spectra, the 200-
MHz emission peak occurred during a Type Ill event. For 49 percent of the U- ,
bursts, a Type II was in progress during, or began - 0. 5 min after, the peak
200-MHz emission.
%
45

(5) S(-ral (8 of 4;) of the proton events with J ( 10 McV) - 10 protonscm stc sI (1 (;5 - 1979) originated in visibl, hemisphere flares with rela-
tively weak (Sp 300 s'u) associated 200-Mliz emission.
L.2 The I 11 tursl i as a 1'redjet ion Tool
Tih- pessimistic picture of the U -shaped peak-flux-density spectrum as a[WAnpeito tool that wch--v(-esn in this std ontrasts with that of
aict. stuics. WC point O,,, however, that the differences in our results stem
- priMMily fir-om: (1) the L-r(' of a lower c('vent priediction threshold than was previ-3.!-7 -2 2 1,, Msty Ised, 7 i. e. , J ('> 10 Mc'V) " 10 pr (Anr scli sr vs J 40 pr cm sec , ,,1
ST , i anil (2)tiobev in after 1976, h ia e osdrdi tdeby (:ist.clli nnd 1;ar'ron ' and (Casielli and Tarnistron, I; if several (Table 2, Nos.
31, 43, 45, and 4(i) large (.1 _ 40) proton events that originated in flares with non-
If miic'rowavc spectra. l)espite diffcrn(O.s in the basic approach (and the classi-
ti at ion of several individual events) between ours and the earlier studies, our
r'-skilts pertaining to the U -burst as a forecast too] are in general agreement with t .-
Sho~s , ::steli iand his co-workers for the prediction threshold and the time
pr rii they considre -d. Moreover, until a more reliable early indicator of pro-57
hm a)( ic.h i.rtionlescapc in fla res is i(hentif'ird, the U-!hi, st tool (or variants')
Will Irost Ihkely contilnnoc to h( us(ed in combination with Hu and sweep-frequency
ralio signalilr(-s at solar forccast c,-ters.
Ni'v, cIhr lr-ss. -the rec ent observation of four large (J _ 40) proton events
I Iwoi nif which (FbleIh 2, Nos. 43 an-i 4-) were ground level events] associated
w i1h1 11 iw v.I bul':;.. 1 ith non- U spectra undei-scores suspicions raised in otherl9, 22, 2GiI
studies 1 2 that the U-shaped spectrum may not have a strong physical con-
nection with th( process by which the protons observed at Earth are accelerated.
Evcn for the- J. 40 events that were preceded in - 80 percent of the -ases by
bursts with i-shaped spectra, the wide variation in spectral shape among events
like 06 April 1971 1 Table 1, No. 86, and Figure 3(c)] with a large decimetric
pt-ak and weak 200-MHz emission, events like 07 July 196658 and 24 January 1971
I No. 85, Figure 3(b)I that are classified as U-bursts because of relatively sharp
spectral variations in the decim2tric range, and the more (lassie types such as
Nos. 5 and 131 [Figures l(a) and l(d)], mikes it difficult to embrace U-bursts as
..... 2,,-
57. Akinyan, S. T., Chertok, 1. M., and Fomichev, V. V. (1979) Quantitativeforecasts of solar protons based on solar flare radio data, in Solar Ter- A.restrial Predictions Proceedings, vol. 3, D-14, R. F. Donnelly, Ed.,National Oceanic and Atmospheric Administration, Boulder, Colo.
58. Svestka, Z. (1976) Solar Flares, D. Reidel Pub. Co. , Hingham, Mass.,p. 193.
46
V..* N.

a special class of microwave bursts that are somehow uniquely related to inter-
planetary proton events. We attribute the high percentage of association (31 of
34 western hemisphere cases) of these phenomena to the fact that U-bursts are
generally (90 percent of the time) accompanied by Type II and/or Type IV bursts
indicative of a second stage process involving a shock wave.
4.3 The Low Frequency Branch of the U.Shaped Spectrum -
59Kundu and Vlahos have suggested that the U-shaped spectrum is a reflec-
tion of nothing more than the fact that there are two different sources of burst
radiation, one for centimeter wavelengths and one for decimeter wavelengths,
with different electron energy distributions and different magnetic fields. In this
study we asked whether the two emission maxima might not also reflect different
acceleration processes for the radiating electrons that give rise to the separate
branches of the U-shaped spectrum. In particular we entertained a picture in
which a shock wave might account for the low frequency ('- 200 MHz) branch of
the U, either through emission from the second harmonic of the Type 11 burst or
through flare continuum (FC II) radiation, 54in those cases where the starting
frequency of the fundamental Type II burst is > 100 MHz. We found that this pic-
ture cannot obtain in general since a Type II burst was in progress at the time of
the low frequency maximum (nominally at 200 MHz) for only about half of the U-
bursts in our sample. This conclusion is based on the assumption that the shock
either does not exist or is incapable of accelerating electrons prior to the occur-
rence of a Type 11 burst. In 74 percent of the cases, the peak 200-MHz emission
in U-bursts occurred at the time of reported Type III emission, suggesting that
the low frequency branch of the U is primarily due to radiation from flash phase
electrons. In fact, since both the starting frequency and intensity of Type III
emission can be expected to increase with the size of the associated microwave
(hard x-ray) burst, 60it seems likely that, for the U-bursts, the low frequency
branch is often due to the Type III burst itself. In this context we note that, in
addition to having relatively weak proton and Type II associations, the cutoff
events in our sample were also deficient in Type III emission.
59. Kundu, M. R., and Viahos, L. (1982) Solar microwave bursts - a review,Space Science Reviews 32:405.
60. Kane, S. R. (1981) Energetic electrons, type III radio bursts, and impulsivesolar flare x-rays, Astrophys. J. 247:1113.
47

4.4 U-Bursts and the Big Flare Syndrome
The large f Sp ( -: 2 GHz) 2 800 sfuJ microwave bursts examined in the study
tend to have U-shaped peak -flux -density spectra (59 percent, 113/ 193) and to be
associated with Type II/IV bursts (76 percent, 139/184) and > 10-MeV proton
events (69 percent, 77/111). However, the small number of events with U-shaped
spectra that lacked both Type II and Type IV emission were poorly associated with
interplanetary protons. This argues that the Type II/IV burst is the critical ob-
servable for particle acceleration and not the U-shaped spectrum. The fact that Athe statistical association of the cutoff bursts with proton events parallels their
associations with Type II/IV bursts provides additional support for this contention.
In addition, we note that for the majority of the U-bursts in our sample, the high
fluxes often observed near 200 MHz appear to be more closely related to Type III
emission than to the shock wave (Type II burst) that is presumably accelerating
the protons. Thus we conclude that the U-shaped spectrum, at both high (- 10
GHz) and low ('-200 MHz) frequencies, is primarily an impulsive phase phenom-
enon and that the observed statistical U-burst/proton association is probably due
to the Big Flare Syndrome 2 2 rather than the result of a direct physical connectionbetween these two phenomena. The observation that the cutoff events are defi-
cient in Type III as well as Type II emission relative to the U-bursts, however,
suggests that a less direct or "once-removed" connection may exist between the
U-shaped spectrum and proton acceleration in that the probability of shock forma-
tion (Type If/protons) in these large flares apparently increases in more open
magnetic field structures (Type I/U-burst).
4.5 Impulsive Phase Proton Acceleration
Forrest6 1 and Forrest and Chupp 6 2 have recently presented yv-ray evidence
indicating that ions are accelerated along with electrons in the impulsive phase of
all flares. However, Cliver et al63 have shown that the correlation between 'v-ray
line fluences and interplanetary proton fluxes is poor. This leaves open the pos-
sibility that the ions observed at the sun via gamma ray line emission are accel-
erated by a different process than the bulk of the protons detected at 1 a. u. In
particular, we favor a picture, as advocated above, in which the protons observed
at Earth are accelerated in a second stage process involving a shock wave. 64, 65
Cane et al 6 5 have shown that interplanetary particles accelerated during the
flare impulsive phase have a narrower cone of emission/propagation than those
presumably accelerated by a shock wave. In this context we note that nine of the
References 61 to 65 will not be listed here. See References, page 50.
48
'I ..-

11 U-bursts lacking Type II/IV association originated in eastern hemisphere 16
flares, making it difficult to observe at Earth any impulsively accelerated protons
that may have escaped from the sun in these events.
4.6 Proton Flares With Weak 200-MHz Emisson
As a final comment, we note that in the largest disk flare associated proton
events (J > 10) observed from 1965 to 1979, the 200-MHz emission was often rel-
atively weak, :5 300 sfu in eight of 46 cases. While either Type II or Type IV
emission was lacking in a comparable number of cases, the identification of these
sweep frequency events is m:re subject to interpretation, and it is possible that
upon reexamination of the original records, the missing phenomenon might be
noted. The 200-MHz records should be less ambiguous, however, and we con-
sidered the highest flux density reported by any observatory during the associated
Ha flare. Moreover, inspection of Table 2 reveals that several of even the events
with J (> 10 MeV) > 40 pr cm 2 secI sr "1 had relatively weak emission at
f - 200 MHz, the lowest frequency currently monitored on a 24-hr per day basis
by the ground based solar radio patrol. Thus the low -frequency (-- 200 MHz)
branch of the classical (i. e., Sp Z 1000 sfu) U-burst does not appear to be a re- %
quirement for the occurrence of a large prompt proton event. The lack of a radio
response at this frequency commensurate with the observed intensities of these
large proton events indicates that, for certain flares, a radio signature of particle
acceleration/escape may only exist at lower frequencies ( < 200 MHz) as was the
case for the 04 October 1965 proton flare, 66.67 the GLE -associated flare on 21Auut 1979 68August 1979,8 and the eruptive filament event on 05 December 1981.
66. Bahme, A. (1972a) The time behavior of the continua during the initial stageof type IV bursts, Sol. Phys. 24:457.
67. Bdhme, A. (1Q72b) Spectral behaviour and proton effects of the type IV broad68. band continua, Sol. Phys. 25:478.
68. Kahler, S. W., Cliver, E. W., Cane, H. V., McGuire, R. E., Stone, R. G.,and Sheeley, Jr. . N. R. (1986) Solar filament eruptions and energetic
,>, particle events, Astrophys. J. (in press).
49
','I A~

= - =:
References
I. Castelli, J. P., Aarons, J., and Michael, G. A. (1967) Flux density measure-ments of radio bursts of proton-producing flares and nonproton flares, J.Geophys. Res. 72:5491.
2. Castelli, J. P. (1968) Observation and Forecasting of Solar Proton Events,AFCRL-68-0104, AD 669347.
3. O'Brien, W. E. (1970) The Prediction of Solar Proton Events Based on SolarRadio Emission, AFCRL-70-0425, AD 875024.
4. Castelli, J. P., and Guidice, D. A. (1972a) On the Classification, Distribution,and Interpretation of Solar Microwave Burst Spectra and Related Topics,AFCRL-72-0049, AD 741750.
5. Castelli, J. P., and Barron, W. R. (1977) A catalog of solar radio bursts1966 - 1976 having spectral characteristics predictive of proton activity,J. Geophys. Res. 82:1275.
6. Castelli, J. P., and Tarnstrom, G. L. (1978) A Catalog of Proton Events1966 - 1976 Having Non-Classical Solar Radio Burst Spectra, AFGL-TR-78-0121, AD A060816.
7. Heckman, G. (1979) Predictions of the space environment services center, inSolar Terrestrial Predictions Proceedings, vol. 1, p. 322, R. F. Donnelly,Ed., National Oceanic and Atmospheric Administration, Boulder, Colo.
8. Cliver, E. W., Secan, J. A., Beard, E. D., and Manley, J. A. (1978) Pre-diction of solar proton events at the Air Force Global Weather Central'sspace environmental forecasting facility, in Effect of the Ionosphere onSpace and Terrestrial Systems, Conf. Proc., J. M. Goodman, Ed., U. S.Government Printing Office, Washington, D. C.
9. Thompson, R. L., and Secan, J. A. (1979) Geophysical forecasting at AFGWC,in Solar Terrestrial Predictions Proceedings, vol. 1, p. 350, R. F.Donnelly, Ed. , National Oceanic and Atmospheric Administration, Boulder,Colo.
50
PIPI I 64
10. Castelli, J. P.. Aarons, J., Guidice, D. A., and Straka, R. M. (1973) The
solar radio patrol network of the USAF and its application. Proc. IEEE61:1307.-
11. Guidice, D. A., Cliver, E. W., Barron, W. R. . and Kahler, S. (1981) TheAir Force RSTN system, Bull. AAS 13:553. .'
12. Solar Geophysical Data, National Oceanic and Atmospheric Administration,Boulder, Colo.
13. Quarterly Bulletin of Solar Activity, International Astronomical Union,Eidgen. Sternwarte, Zurich.
14. Castelli, J. P. , and Guidice, D. A. (1972b) The radio event associated withthe polar cap absorption event of 2 November 1969, in Proc. of COSPAR
S osium on Particle Event of November 1969, p. 27, J. C. Ulwick, Ed.,AFCRL-72-0474, AD 763081.
15. Wild, J. P., Smerd, S. F., and Weiss, A. A. (1963) Solar bursts, Ann. Rev.Astron. Astrophys. 1:291.
16. de Jager, C. (1969) Solar flares; properties and problems, in Proc. ofCOSPAR Symposium on Solar Flares and Space Research, p. 1, C. deJager and Z. Svestka, Eds., North Holland Pub. Co., Amsterdam, Holland.
17. Lin, R. P., and Hudson, H. S. (1976) Non-thermal processes in large solarflares, Sol. Phys. 50:153.
18. Cliver, E. W., Kahler, S. W., Cane H. V., Koomen, M. J., Michels,D. J., Howard, R. A., and Sheeley, Jr., N. R. (1983b) The GLE-asso-ciated flare of 21 August, 1979, Sol. Phys. 89:181.
19. Cliver. E. W., Kahler, S. W., and McIntosh, P. S. (1983c) Solar proton I-
flares with weak impulsive phases, Astrophys. J. 264:699.20. Lin, R. P. (1970) The emission and propagation of 40 keV solar flare elec-
trons. I: the relationship of 40 keV electron to energetic proton and rela-tivistic electron emission by the sun, Sol. Phys. 12:266.
21. Svestka, Z., and Fritzova-Svestkova, L. (1974) Type II radio bursts andparticle acceleration, Sol. Phys. 36:417.
22. Kahler, S. W. (1982a) The role of the big flare syndrome in correlations ofsolar energetic proton fluxes and microwave burst parameters, J. Geophys.Res. 87:3439.
23. Bailey, D. K. (1964) Polar cap absorption, Planet. Space Sci. 12:495.
24. Kundu, M. R. (1965) Solar Radio Astronomy, Interscience Publishers, NewYork, New York.
25. Kai, K. (1968) Evolutional features of solar microwave type IV bursts, Pub.Astron._ Soc. Japan 20:140.
26. Kahler, S. W. (1982b) Radio burst characteristics of solar proton flares,Astrophys. J. 261:710.
27. Tanaka, H., Castelli, J. P., Covington, A. E., Kruger, A., Landecker,T. L., and Tlamicha, A. (1973) Absolute calibration of solar radio fluxdensity in the microwave region, Sol. Phys. 29:243.
28. Zirin, H. , and Tanaka, K. (1973) The flares of August 1972, Sol. Phys.32:173.
29. Roelof, E. C., Dodson, H. W., and Hedeman, E. R. (1983) Dependence ofradio emission in large Ha flares 1967 - 1970 upon the orientation of thelocal solar magnetic field, Sol. Phys. 85:339.
51
-. ""
Nh.

30. Svestka, Z. , and Simon, P., Eds. (1975) Catalog of Solar Particle Events,1955 - 1969, D. Reidel Pub. Co., Dordrecht, Holland.
31. Dodson, H. W., Hedeman, E. R., and Mohler, 0. C. (1977) Survey andComparison of Solar Activity and Energetic Particle Emission in1970,AFGL-TR-77-0222, AD A048479.
32. Dodson, H. W., Hedeman, E. R., and Mohler, 0. C. (1978) Solar and Geo-physical Associations With the Principal Energetic Particle Events in 1971and 1972, AFGL-TR-78-0266, AD A065260.
33. van Hollebeke, M. A. I., Ma Sung, L. S. , and McDonald, F. B. (1975) Thevariation of solar proton energy spectra and size distribution with helio-longitude, Sol. Phys. 41:189.
34. Smart, D. F. , and Shea, M. A. (1971) Solar proton event classification le.system, Sol. Phys. 16:484.
35. Reinhard, R., and Wibberenz, G. (1974) Propagation of flare protons in thesolar atmosphere, Sol. Phys. 36:473. 1
36. Tarnstrom, G. L. (1978) Terrestrial proton events and solar- radio burstswith U-shaped spectra, unpublished report.
37. Juday, R. D., and Adams, G. W. (1969) Riometer measurements, solarproton intensities and radiation dose rates, Planet. Space Sci. 17:1313.
38. Pick-Gutmann, M. (1961) Evolution des emissions radioelectriques solairesde Type IV et leur relation avec d'autres phenomenes solaires et geophys-iques, Ann. Astrophys. 24:183.
39. Harvey, G. A. (1965) 2800 megacycle per second radiation associated withType II and Type IV solar radio bursts and the relation with other phen-omena, J. Geophys. Res. 70:2961.
40. Kundu, M. R., and Haddock, F. T. (1960) A relation between solar radioemission and polar cap absorption of cosmic noise, Nature 186:1').
41. Bell, B. (1963) Type IV solar radio bursts, geomagnetic storms, and polar*: cap absorption (PCA) events, Smithsonian Contr. Ap. 8:119.
42. Maxwell, A., Defouw, R. J., and Cummings, P. (1964) Radio evidence forsolar corpuscular emission, Planet. Space Sci. 12:435.
43. Maxwell, A. (1973) Dynamic spectra of four solar radio bursts during theperiod 1972 August 2-7, in Rep. UAG-28, pt. I, p. 255, H. E. Coffey, Ed..World Data Center A for Solar-Terr. Phys., Boulder, Colo.
44. Bahme, A., and Kruger, A. (1973) On the type IV bursts of August 2, 4 and7, 1972, in Rep. UAG-28, pt. I, p. 260, H. E. Coffey, Ed., World DataCenter A for Solar-Terr. Phys., Boulder, Colo.
45. Robinson, R. D., Stewart, R. T. , and Cane, H. V. (1984) Properties ofmetre-wavelength solar bursts associated with interplanetary Type Ifemission, Sol. Phys. 91:159.
46. Cane, H. V., and Stone, R. G. (1984) Type II solar radio bursts, in er-planetary shocks, and energetic particle events, Astrophys. J. 282:339'.
47. Kahler, S. W., Hildner, E., and van Hollebcke, M. A. 1. (1978) Promptsolar proton events and coronal mass ejections, Sol. Phys. 57:429.
48. Cliver, E. W., Kahler, S. W., Shea, M. A., and Smart, D. F. (19t82)Injection onsets of - 2 GeV protons, - I MeV electrons, and - 100 keVelectrons in solar cosmic ray flares, Astrophys. J. 260:36i2.
49. Mason, G. M., Gloeckler, G., and Hovestadt, D. (1984) Temporal varia-tions of nucleonic abundances in solar flare energetic particle events. 1i.Evidence for large scale shock acceleration, Astrophys. J. 280:902.
52

50. Pallavicini, R. , Serio, S., and Vaiana, G. S. (1977) A survey of soft x-raylimb flare images: the relation between their structure in the corona andother physical parameters, Astrophys. J. 216:108.
51. Cliver, E. W. (1983) Secondary peaks in solar microwave outbursts, Sol.Phys. 84:347.
52. Maxwell, A. , and Thompson, A. R. (1962) Spectral observations of radiobursts, I: slow drift bursts and coronal streamers, Astrophys. J. 135:138. .
53. Robinson, R. D. , and Smerd, S. F. (1975) Solar flare continua at the metrewavelengths, Proc. ASA 2:374.
54. Robinson, R. D. (1978) A study of solar flare continuum events observed atmetre wavelengths, Aust. J. Phys. 31:533.
55. Kane, S. R. (1974) Impulsive (flash) phase of solar flares: Hard x-ray micro-wave, euv and optical observations, in Coronal Disturbances, Proc. of IAUSymp. No. 57, p. 105, G. Newkirk, Jr., Ed., D. Reidel Pub. Co.,Dordrecht, Holland.
56. Robinson, R. D., Tuxford, J. M., Sheridan, K. V., and Stewart, R. T.(1983) A catalogue of major metre-wavelength solar events recorded by theDAPTO and Culgoora solar radio observatories (1961 - 1981), Proc. ASA5:84.
57. Akinyan, S. T., Chertok, I. M., and Fomichev, V. V. (1979) Quantitative '
forecasts of solar protons based on solar flare radio data, in Solar Terres-trial Predictions Proceedings, vol. 3, D-14, R. F. Donnelly, Ed.,National Oceanic and Atmospheric Administration, Boulder, Colo.
58. Svestka, Z. (1976) Solar Flares, D. Reidel Pub. Co., Hingham, Mass.,p. 193.
59. Kundu M. R., and Vlahos, L. (1982) Solar microwave bursts - a review,Space Science Reviews 32:405.
60. Kane, S. R. (1981) Energetic electrons, type III radio bursts, and impulsivesolar flare x-rays, Astrophys. J. 247:1113.
61. Forrest, D. J. (1983) Solar y-ray lines, Am. Inst. of Physics Conf. Proc.101:3.
62. Forrest, D. J., and Chupp, E. L. (1983) Simultaneous acceleration of elec-trons and ions in solar flares, Nature 305:5932.
63. Cliver, E. W., Forrest, D. J., McGuire, R. E., and von Rosenvinge, T. T.(1983a) Nuclear gamma rays and solar proton events, Conf. Pap. Int. Cos-mic Ray Conf. 18th 10:342.
64. Kahler, S. W., Sheeley, Jr., N. R., Howard, R. A., Koomen, M. J.,Michels, D. J., McGuire, R. E., von Rosenvinge, T. T., and Reames,D. V. (1984) Associations between coronal mass ejections and solar ener- Cgetic proton events, J. Geophys. Res. 89:9683.
65. Cane, H. V., McGuire, R. E., and von Rosenvinge, T. T. (1985) Twoclasses of energetic particle events associated with impulsive and longduration soft x-ray flares, Astrophys. J. (in press).
66. Bdhme, A. (1972a) The time behavior of the continua during the initial stageof type IV bursts, Sol. Phys. 24:457.
67. Bdhme, A. (1972b) Spectral behaviour and proton effects of the type IV broadband continua, Sol. Phys. 25:478.
68. Kahler, S. W., Cliver, E. W., Cane, H. V., McGuire, R. E., Stone, R. G.,and Sheeley, Jr., N. R. (1986) Solar filament eruptions and energeticparticle events, Astrophys. J. (in press).
53
%p

4
p p
p
p
0
.4'
'N
'I'
*1,,'~
'I
-* 7 7. - ~ f ,. .~

INC