The pattern of stimulation influences the amount of oscillatory ...
Upload
independentCategory
view
3download
0
Journal of Food Engineering 64 (2004) 179–186
www.elsevier.com/locate/jfoodeng
Viscoelastic properties of microbial alginate gelsby oscillatory dynamic tests
Mauro Moresi a,*, Maria Bruno a, Eugenio Parente b
a Department of Food Science and Technology, Via San Camillo de Lellis, University of Tuscia, Viterbo, 01100 Italyb Department of Biology DBAF, University of Basilicata, Potenza, Italy
Received 27 April 2003; accepted 22 September 2003
Abstract
The jellifying capacity of some alginate gels excreted by Azotobacter vinelandii DSM 576 was studied by oscillatory tests at
alginate concentrations (c) of 1.0% and 1.5% w/w. Frequency dependence of the complex shear modulus (G�) permitted these gels to
be discriminated in terms of their different orders of the relaxation function (a) and ‘‘gel stiffness’’ (Aa) values using Friedrich and
Heymann theory [Journal of Rheology, 32 (1988) 235]. Of the samples tested that characterised by a guluronate content of 25% and
a number-average molecular mass (Mn) of 263.4 kDa exhibited a gel stiffness at c ¼ 1% w/w of the same order of magnitude of that
pertaining to alginates extracted from Macrocystis pyrifera or Lessonia nigrescens with greater guluronate contents (35–40%) but
smaller number-average molecular masses (70–110 kDa) with about half of a.Whereas a was found to depend exponentially on the ratio of guluronate to mannuronate monad frequencies (NG=M) only, Aa was
expressed as a power function of c, Mn, NG=M, and average G-block length (NG). The limited data available, as well as incomplete
understanding of the real controlling factors for ionotropic gelation of alginates, made such empirical correlations just useful for a
preliminary screening of alginates independently of their weed or microbial origin.
� 2003 Elsevier Ltd. All rights reserved.
Keywords: Alginate; Azotobacter vinelandii; Frequency sweep; Storage and loss moduli; Strain sweep; Viscoelastic properties
1. Introduction
Alginates are linear heteropolysaccharides, composed
of residues of b-DD-mannuronic acid and its epimer a-LL-guluronic acid, that are currently extracted from brownalgae (Onsøyen, 1992; Moe, Draget, Skj�ak-Bræk, &
Smidsrød, 1995). They can also be produced by mem-
bers of the genera Azotobacter and Pseudomonas
(Clementi, 1997; Rehm & Valla, 1997; Sabra, Zeng, &
Deckwer, 2001). About 30,000 metric tons/yr of sodium
alginates are currently used in the food, cosmetic,
pharmaceutical, textile and paper industries as thicken-
ing, stabilising, and jellifying agents.The decreasing availability of seaweed (traditional
sources not only of alginates, but also of agar and car-
rageen), the safety concern for using extracts that are
potential accumulators of the heavy metal cations
*Corresponding author. Tel.: +39-0761-357494; fax: +39-0761-
357498.
E-mail address: [email protected] (M. Moresi).
0260-8774/$ - see front matter � 2003 Elsevier Ltd. All rights reserved.
doi:10.1016/j.jfoodeng.2003.09.030
(Hgþþ, Cdþþ, Crþ3, Cuþþ, etc.) present in polluted
seawaters, and increasing costs for their extraction–
purification processes are the main reasons for the
present interest towards the microbial production of
exopolysaccharides (EPS). Their peculiar chemical–physical properties would make them useful not only for
the traditional agro-industrial applications, but also for
other more specific applications in biotechnology and
biomedicine, even if the potential of microbial EPS as
industrial polymers is still a controversial matter.
Moreover, information on either their production costs
or rheological behaviour as thickening or jellifying
agents is yet limited. However, the possibility of usingraw materials free from seasonal and/or geographical
variations, selected strains under closely controlled
operating conditions might be sufficient to compensate
for the relatively low yields and high acetylation degrees
of bacterial biopolymers.
Alginate production from glucose-based media by
Azotobacter vinelandii DSM 576 was previously opti-
mised in the shaken-flask scale (Clementi, Fantozzi,

180 M. Moresi et al. / Journal of Food Engineering 64 (2004) 179–186
Mancini, & Moresi, 1995) and then scaled-up in labo-ratory fermenters (Clementi, Crudele, Parente, Mancini,
& Moresi, 1999; Parente, Crudele, Ricciardi, & Cle-
menti, 2000).
The aqueous dispersions of such alginates were found
to behave as pseudo-plastic liquids (Clementi, Mancini,
& Moresi, 1998), similarly to those containing algal
alginates (Mancini, Moresi, & Sappino, 1996). It was
also observed that at constant alginate concentrationand temperature the thickening properties of several
bacterial and algal alginates depended only on the
molecular mass, regardless of their origin (Clementi
et al., 1998).
Formation of alginate gels is quite a complex process,
depending on the type of alginate used (i.e. high-gulu-
ronic ‘‘G’’ or high-mannuronic ‘‘M’’ alginates), degree
of conversion into calcium alginate, source of calciumions (viz. calcium chloride, phosphate, lactate or ace-
tate) and methods of preparation (Moe et al., 1995;
Sime, 1990).
The viscoelastic properties of algal alginate gels have
been assessed so far using either static (Mancini, Moresi,
& Rancini, 1999a, 1999b; Mitchell & Blanshard, 1976;
Nussinovitch, Peleg, & Normand, 1989) or dynamic
(Doublier, Launay, & Cuvelier, 1992; Segeren, Bosk-amp, & Van Den Tempel, 1974) tests. The results of
stress-relaxation exhibited a solid-like behaviour that
was described by a mechanical model consisting of two
Maxwell elements in parallel with one spring (Mancini
et al., 1999a, 1999b; Nussinovitch et al., 1989). On the
contrary, the results of creep experiments showed a
liquid-like viscoelastic behaviour that was described by
a mechanical model consisting of one Maxwell elementin series with two Kelvin–Voigt elements (Mitchell &
Blanshard, 1976). In dynamic tests, the mechanical
spectra of these gels were found to be characterised by a
flat dependency of the shear storage modulus (G0) and
loss modulus (G00) on frequency (f ) for f ranging from
about 10�2 to 102 s�1 with G0 one or two orders of
magnitude greater than G00 (Moresi, Mancini, Bruno, &
Rancini, 2001; Segeren et al., 1974).By using Friedrich and Heymann theory (1988), the
viscoelastic properties of several algal alginates of the
high-mannuronic (M) and -guluronic (G) types, as de-
termined by small amplitude oscillatory dynamic tests,
were discriminated in terms of their different orders of
the relaxation function (aÞ and ‘‘gel stiffness’’ (Aa) val-
ues. The latter was approximately 4–5 times greater in
high-G alginate gels than high-M ones, while the formerwas practically constant and equal to about one twelfth
or one eighteenth for high-G or -M alginates, respec-
tively (Moresi et al., 2001).
The aim of this work was to assess the viscoelastic
properties of a few high-M microbial alginates obtained
from A. vinelandii DMS 576 using oscillatory dynamic
tests, so as to compare their jellifying capacity to that of
a series of high-M and high-G alginate gels previouslytested.
2. Materials and methods
2.1. Production of microbial alginates
Alginate production with A. vinelandii DSM 576 was
carried out in the following medium: glucose, 20 kgm�3;(NH4)2SO4, 0.6 kgm�3; Na2HPO4, 2 kgm�3; MgSO4 Æ7H2O, 0.3 kgm�3; yeast extract (Oxoid), 6 kgm�3. The
inoculum preparation and fermentation conditions were
those described previously (Parente et al., 2000). To
obtain alginates with different molecular weight and
different compositions, agitation speed, medium com-
position, and recovery time were varied as follows. For
the production of sample A, agitation speed was kept at400 revmin�1; recovery was carried out at 48 h. For the
production of sample B, agitation speed was kept at 400
revmin�1 throughout the fermentation, but bentonite (1
kgm�3) was added after 30 h to reduce degradation of
alginate by alginate lyases; recovery was carried out at
72 h. For the production of sample C, agitation speed
was kept at 400 revmin�1 for the first 24 h and increased
at 600 revmin�1 thereafter; recovery was carried outafter 48 h. For the production of sample D, a greater
concentration of (NH4)2SO4 (i.e., 0.9 kgm�3) was used,
agitation speed was kept at 600 revmin�1 throughout
the fermentation and bentonite (1 kgm�3) and glucose
(20 kgm�3) were added after 30 h; alginate was recov-
ered after 142 h. Alginate was recovered from the fer-
mentation broths and finished as white freeze-dried
powders, as previously described (Clementi et al., 1999;Parente et al., 2000).
2.2. Chemico-physical characterization of microbial
alginates
The percentages of mannuronic (M) and guluronic
(G) residues and sequences of MM-, MG- and GG-
blocks for the four samples tested were determined by
NMR spectroscopy at the Polytech S.coop.r.l. (Trieste,Italy) and are listed in Table 1. By using two different
Mark–Houwink relationships correlating the number-
(Mn) and weight- (Mw) average molecular masses of
several weed [Fucus vesicularus (Mackie, Noy, & Sellen,
1980), Laminaria digitata (Smidsrød, 1970), L. hyper-
borea (Mackie et al., 1980; Martinsen, Skj�ak-Braek,Smidsrød, Zanetti, & Poletti, 1991), L. cloustoni (Don-
nan & Rose, 1950), Macrocystis pyrifera (Martinsenet al., 1991)] or bacterial [Azotobacter vinelandii (Mackie
et al., 1980)] alginates to the corresponding intrinsic
viscosities ([g]) in 0.1 kmolm�3 NaCl at 25 �C (Clementi
et al., 1998), it was possible to estimate the Mn and
Mw values of all microbial alginates tested and, conse-

Table 1
Main chemical (percentage of overall guluronic-, FG, and mannuronic-, FM, blocks and of MM-, FMM, MG-, FMG, and GG-, FGG, blocks) and physical
properties {intrinsic viscosity ½g� at 0.1 M ionic strength, number-, Mn, and weight-, Mw, average molecular masses; number-average degree of
polymerization, dp} of the microbial and algal alginates examined in this work
Alginate from Type No. FG(%)
FM(%)
FMM
(%)
FMG
(%)
FGG
(%)
[g](dL/g)
Mn
(kDa)
Mw
(kDa)
dp (–) Ref.
Azotobacter vinelandiia High-M A j 25 75 50.5 24.5 0.5 9.6 120.6 460.4 609 b
B m 24 76 52.5 23.5 0.5 20.4 263.4 990.5 1330 b
C d 25 75 50.5 24.5 0.5 26.6 347.4 1297.1 1755 b
D r 17.5 82.5 65.5 17 0.5 15.1 192.4 729.6 972 b
Laminaria hyperborea High-G BDH 63 37 29 8 55 5.9 73.1 280.7 369 c
LF10/60 57 43 33 10 47 6.8 84.6 324.3 427 c
SF60 63 37 24 13 50 17.0 217.7 822.9 1099 c
Macrocystis pyrifera High-M LV 38 62 44 18 20 5.9 72.7 280.7 367 c
MV 35 65 46 19 16 9.6 119.9 460.4 606 c
CE 35 65 53 12 23 9.3 116.2 445.8 587 c
Laminaria hyperborea SF120RB 45 55 36 19 26 12.7 161.8 611.9 817 c
Lessonia nigrescens LF10/60-L 40 60 43 17 23 5.6 68.9 266.2 348 c
a The chemical composition of microbial alginates was determined by Polytech S.coop.r.l. (Trieste, Italy).b This work.cAs extracted from Moresi et al. (2001).
M. Moresi et al. / Journal of Food Engineering 64 (2004) 179–186 181
quently, their number-average degree of polymerization
(dp ¼ Mn=198), as shown in Table 1. These samples were
found to be more or less easily dispersible in water de-
pending on Mn.
2.3. Gel preparation
Calcium alginate gels were made according to the
internal setting method (Onsøyen, 1992) using two dif-
ferent alginate concentrations (c), that is 1.0% and 1.5%
(w/w). Once chosen the alginate concentration (c), it waspossible to calculate: (i) the molar mass of sodium al-
ginate (nNaAlg) to be dissolved in demineralised water; (ii)
the g-equivalents (nCaþþ ¼ 1=2nNaAlgdp) of calcium ionsto be added (to saturate theoretically all the carboxylic
groups present in any alginate molecule, this involving a
Naþ:Caþþ ratio of 0.5); (iii) the mass of calcium acid
phosphate dihydrate (CaHPO4 Æ 2H2O)as nCaþþ times the
molecular mass of the calcium source (i.e. 172.09 Da);
(iv) the mass of glucono-d-lactone being equal to that of
the calcium source used in accordance with Mitchell &
Blanshard (1976) and Nussinovitch et al. (1989).As an example, to prepare 100 g of a gel consisting of
sodium alginate no. A (Table 1) at c ¼ 1% w/w, 1 g of
the above sodium alginate and 0.43 g of the calcium salt
were thoroughly dispersed in 98.13 g of demineralised
water at ambient temperature under vacuum to mini-
mise entrapment of air bubbles. By adding 0.43 g of
glucono-d-lactone under vigorous mixing, pH reduced
from 7.8 ± 0.1 to 6.3 ± 0.1 after about 30 min, thus libe-rating the Caþþ ions. The resulting dispersion was
quickly poured over a 15-cm square glass tray and
stored at room temperature for about 24 h, thus ob-
taining a gel slab with a thickness of ca. 3 mm. Such
a slab was then segmented into 25-mm disks using
a stainless steel sharp-edged cork borer (inside dia-
meter¼ 25 mm and thickness¼ 0.5 mm).
2.4. Rheometrical tests
All rheometrical determinations were performed at 20
�C by using a dynamic stress rheometer (RS200, Rheo-
metric Scientific Inc., Piscataway, NJ, USA) equipped
with a 25-mm parallel plate geometry with smooth
surfaces (type LS-PELT-IP25). During all tests 25-mm
photocopy paper disks were stuck on both plates to avoid
the specimens slipping away; afterwards, the new zeroposition of the upper plate was automatically assessed.
All bases of any gel disk were gently drained off using a
photocopy paper sheet, the specimen axis was then
aligned with the instrument one by letting it adhere to
the paper disk stuck to the upper plate sensor, which
was finally lowered by 2% of the initial height of the gel
disk. In accordance with Mancini et al. (1999b) a 5-min
delay was assumed to be enough to let practically allshear history be relaxed away and to reconfigure the
unperturbed state of any specimen before testing.
The temperature was controlled within 0.1 �C by a
Peltier element in the lower plate. Evaporation of the
sample was prevented using a water-lock.
Dynamic strain sweep tests were performed at a fre-
quency of 1 s�1 and dynamic frequency sweep tests at a
strain amplitude of 0.5%.All tests were replicated at least three times, and mean
values and corresponding standard deviations calcu-
lated.

182 M. Moresi et al. / Journal of Food Engineering 64 (2004) 179–186
3. Results and discussion
In agreement with previous work (Moresi et al.,
2001), once assessed the range of linear viscoelasticity
for the microbial alginates tested, a series of frequency
sweep tests were carried out to study their viscoelastic
properties as a function of alginate concentration and
type.
3.1. Rheometrical determinations under strain sweep tests
By performing a series of strain sweep tests at lowfrequency (f ¼ 1 s�1), it was possible to confirm that the
four microbial alginate gels tested behaved as solid-like
materials (G0 > G00). Fig. 1 shows the effect of alginate
type on the complex dynamic shear modulus (G�) and
loss tangent (tan d) for 1.5% (w/w) alginate gels.
It was possible to discriminate two different regions,
namely a linear viscoelastic region in which G� and tan dwere practically constant, and a non-linear one in whichG� started to decrease with increasing strain while tan d
Table 2
Effect of the alginate type (see Table 1) and concentration (c) on the critical st
(G�) and loss tangent (tan d) values, as determined via strain sweep tests at
Alginate type c (% w/w) c0c (%)
A 1.00 2.2
1.50 2.2
B 1.00 0.9
1.50 1.6
C 1.00 2.8
1.50 1.4
D 1.00 3.6
1.50 2.8
1000
10000
0.1 1 10 100
Strain (%)
G*
(Pa
)
0.01
0.1
1
10
tan
δ
Fig. 1. Strain sweep tests for a few microbial alginate gels at 1.5% (w/
w) alginate concentration (c), 20 �C and frequency 1 s�1: complex shear
modulus (G�: closed symbols) and loss tangent (tan d: open symbols)
vs. strain amplitude (c0c). For alginate types same symbols as in
Table 1.
began to increase. As the shear strain amplitude (c0)increased from 0.2% to 10%, tan d was generally far
smaller than 0.1 except for sample C, thus revealing no
real crossing of the G0ðc0Þ and G00ðc0Þ curves (data not
shown). However, the slipping away of gel disks from
the plates made this region inaccessible for all gels
tested.
Despite practically constant the loss tangent tended
to reduce firstly up to reach a minimum value and thento increase. The strain amplitude associated with such a
minimum value was regarded as the upper strain limit
(c0c) of the linear viscoelastic region for these gels. Table
2 shows the effect of the alginate type and concentration
(c) on the critical strain (c0c) together with the corre-
sponding G� and tan d values.
Of the samples labelled A, B, and C in Table 1 pre-
senting almost the same mannuronate content (FM) anddiad sequence with Mn increasing from 121 to 347 kDa,
sample B exhibited the highest gel strength (expressed as
G�) of circa 3.0–4.0 kPa for c increasing from 1.0% to
1.5% w/w with the more restricted range of linear vis-
coelasticity (Table 2). On the contrary, sample D gave
gels with about half G� values (1.6–2.3 kPa) within the
same concentration range, probably because of its
greater mannuronate content (FM ¼ 82:5%) and smallermolecular mass (Mn ¼ 192 kDa).
It can finally be noted that the critical strain ampli-
tude (c0c) for these bacterial alginates did not exceed
3.6%, while it was found to vary up to 6.3% in the case
of the high-M algal alginates previously tested (Moresi
et al., 2001).
3.2. Rheometrical determinations under frequency sweep
tests
The microbial alginate gels showed approximatelyflat mechanical spectra in small amplitude oscillatory
experiments with G0 one or two order of magnitude
greater than G00 (Fig. 2), this being also in agreement
with Segeren et al. (1974) and Moresi et al. (2001).
rain value (c0c) together with the corresponding complex shear modulus
20 �C and frequency of 1 s�1
G� (kPa) tan d (–)
1.60± 0.03 0.039± 0.003
2.3 ± 0.1 0.040± 0.004
3.0 ± 0.3 0.074± 0.002
4.0 ± 0.5 0.078± 0.004
2.6 ± 0.2 0.049± 0.002
3.2 ± 0.2 0.078± 0.004
1.55± 0.05 0.020± 0.001
2.3 ± 0.1 0.036± 0.004

1000
10000
0.01 0.1 1 10 100Frequency (s-1)
G' (
Pa)
1
10
100
1000
G''
(Pa)
Fig. 2. Frequency sweep tests for a few microbial alginate gels at 1.5%
(w/w) alginate concentration (c), 20 �C and strain amplitude 0.5%:
storage modulus (G0: closed symbols) and loss modulus (G00: open
symbols) vs. frequency. For alginate types same symbols as in Table 1.
1000
10000
0.01 0.1 1 10 100Frequency (s-1)
G*
(Pa)
0.001
0.01
0.1
tan
δ
Fig. 3. Frequency sweep tests for a few microbial alginate gels at 1.5%
(w/w) alginate concentration (c), 20 �C and strain amplitude 0.5%:
complex shear modulus (G�: closed symbols) and loss tangent (tan d:open symbols) vs. frequency. The continuous and horizontal lines were
respectively calculated using Eqs. (4) and (3) with the empirical para-
meters listed in Table 3. For alginate types same symbols as in Table 1.
Table 3
Mean values and standard deviations of the gel stiffness parameter (Aa)
as a function of alginate concentration (c) and type, together with the
optimal values of the order of the relaxation function (a)
Alginate Type c (% w/w) Aa (kPa rad�a sa) a (–)
A 1.00 1.68± 0.01 0.022
1.50 2.24± 0.01
B 1.00 2.70± 0.03 0.036
1.50 3.70± 0.01
C 1.00 2.02± 0.04 0.037
1.50 2.90± 0.03
D 1.00 1.54± 0.01 0.015
1.50 2.10± 0.01
M. Moresi et al. / Journal of Food Engineering 64 (2004) 179–186 183
In previous work (Moresi et al., 2001), the four-
parameter relaxation function used by Friedrich &
Heymann (1988), to describe the phase transition of
cross-linking networks near the gel point or after the
transition sol–gel, was found to be able to reconstructthe evolution of shear storage (G0) and loss (G00) moduli
in the frequency domain as follows:
G0ðxÞ ¼ G1;a þffiffiffi2
p
rS�a cos
p2a
� �xa ð1Þ
G00ðxÞ ¼ffiffiffi2
p
rS�a sin
p2a
� �xa ð2Þ
where xð¼ 2pf Þ is the angular rate, a is the order of the
relaxation function; while G1;a and S�a are respectively
the equilibrium modulus and material parameter all
pertaining to a. Provided that the equilibrium modulus
(G1;a) were equal to zero (this holding for the sol state
and at the gel point) or negligible (this holding at the gel
state in a limited frequency range only), the tangent ofphase shift would be dependent on a only, while the
complex dynamic shear modulus G� would be function
of a and S�a :
tan d ¼ G00
G0 ¼ tanp2a
� �ð3Þ
and
G�ðxÞ ffiffiffiffi2
p
rS�ax
a ¼ Aaxa ð4Þ
In this way, based upon the model by Friedrich &
Heymann (1988), the three-dimensional structure cha-
racterising a gel was described in terms of the order of
the relaxation function (a), while Aa measured the
‘‘strength’’ of the cross-linking polymer network.
In this specific case, for f ranging from 0.2 to 20 s�1,G0ðxÞ and G00ðxÞ were found to be respectively linear
functions of ½cosðp=2aÞxa� and ½sinðp=2aÞxa�, while the
estimated values of the equilibrium modulus (G1;a) re-
sulted to be negative (that is devoid of any physicalmeaning) or statistically negligible at the confidence
level of 0.05 for all gels tested. Therefore, in the above
limited frequency window for all gels examined G� was
expressed using Eq. (4). Once assumed an arbitrary avalue for any alginate type, the experimental G�ðxÞ datawere divided by xa, thus yielding a series of Aa values,
which were averaged. By minimising the corresponding
sums of squares with respect to a via a non-linear esti-mation method, it was possible to determine the mean
values and standard deviations of Aa together with the
optimal value of the order of the relaxation function a,as listed in Table 3. The continuous lines in Fig. 3 show
a remarkable agreement with the experimental G� traces,
while the horizontal lines in Fig. 3 differ from the
experimental tan d data from as small as )7% to as great
as +55%.
1
10
100
1 10 100Aα
α
,exp
A,c
alc +2.5%
−2.5%
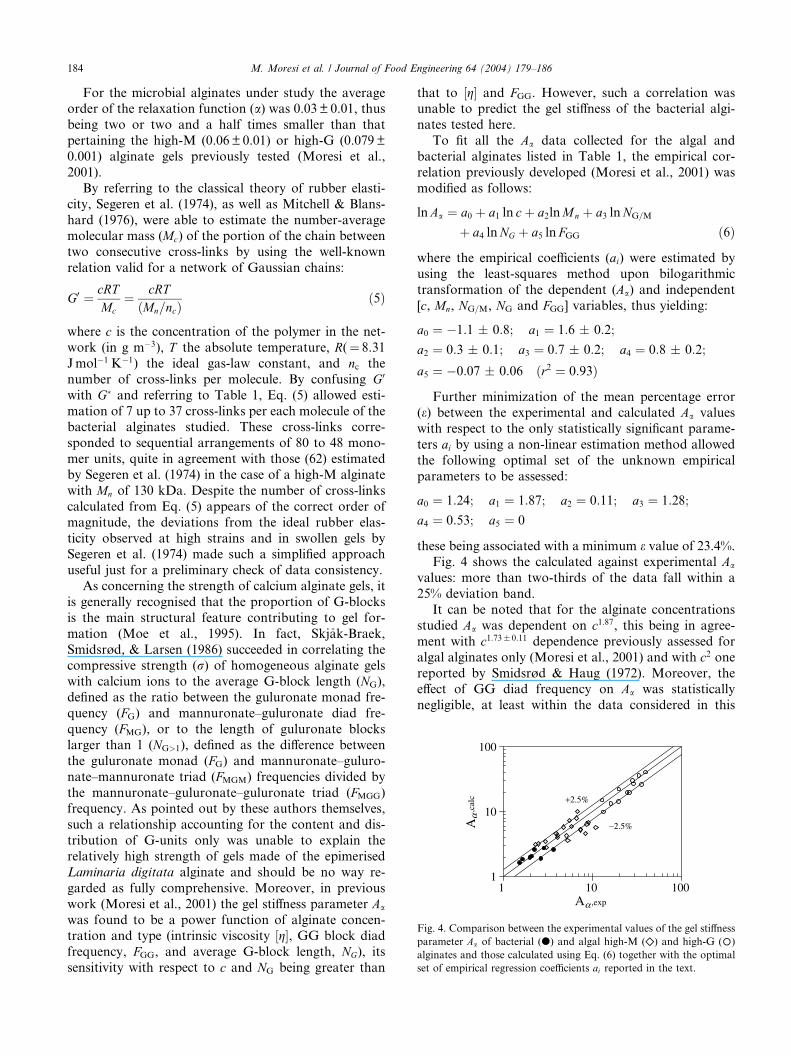
Fig. 4. Comparison between the experimental values of the gel stiffness
parameter Aa of bacterial (d) and algal high-M (�) and high-G (�)
alginates and those calculated using Eq. (6) together with the optimal
set of empirical regression coefficients ai reported in the text.
184 M. Moresi et al. / Journal of Food Engineering 64 (2004) 179–186
For the microbial alginates under study the averageorder of the relaxation function (a) was 0.03 ± 0.01, thus
being two or two and a half times smaller than that
pertaining the high-M (0.06 ± 0.01) or high-G (0.079±
0.001) alginate gels previously tested (Moresi et al.,
2001).
By referring to the classical theory of rubber elasti-
city, Segeren et al. (1974), as well as Mitchell & Blans-
hard (1976), were able to estimate the number-averagemolecular mass (Mc) of the portion of the chain between
two consecutive cross-links by using the well-known
relation valid for a network of Gaussian chains:
G0 ¼ cRTMc
¼ cRTðMn=ncÞ
ð5Þ
where c is the concentration of the polymer in the net-
work (in g m�3), T the absolute temperature, R(¼ 8.31
Jmol�1 K�1) the ideal gas-law constant, and nc the
number of cross-links per molecule. By confusing G0
with G� and referring to Table 1, Eq. (5) allowed esti-
mation of 7 up to 37 cross-links per each molecule of thebacterial alginates studied. These cross-links corre-
sponded to sequential arrangements of 80 to 48 mono-
mer units, quite in agreement with those (62) estimated
by Segeren et al. (1974) in the case of a high-M alginate
with Mn of 130 kDa. Despite the number of cross-links
calculated from Eq. (5) appears of the correct order of
magnitude, the deviations from the ideal rubber elas-
ticity observed at high strains and in swollen gels bySegeren et al. (1974) made such a simplified approach
useful just for a preliminary check of data consistency.
As concerning the strength of calcium alginate gels, it
is generally recognised that the proportion of G-blocks
is the main structural feature contributing to gel for-
mation (Moe et al., 1995). In fact, Skj�ak-Braek,Smidsrød, & Larsen (1986) succeeded in correlating the
compressive strength (r) of homogeneous alginate gelswith calcium ions to the average G-block length (NG),
defined as the ratio between the guluronate monad fre-
quency (FG) and mannuronate–guluronate diad fre-
quency (FMG), or to the length of guluronate blocks
larger than 1 (NG>1), defined as the difference between
the guluronate monad (FG) and mannuronate–guluro-
nate–mannuronate triad (FMGM) frequencies divided by
the mannuronate–guluronate–guluronate triad (FMGG)frequency. As pointed out by these authors themselves,
such a relationship accounting for the content and dis-
tribution of G-units only was unable to explain the
relatively high strength of gels made of the epimerised
Laminaria digitata alginate and should be no way re-
garded as fully comprehensive. Moreover, in previous
work (Moresi et al., 2001) the gel stiffness parameter Aa
was found to be a power function of alginate concen-tration and type (intrinsic viscosity ½g�, GG block diad
frequency, FGG, and average G-block length, NG), its
sensitivity with respect to c and NG being greater than
that to ½g� and FGG. However, such a correlation wasunable to predict the gel stiffness of the bacterial algi-
nates tested here.
To fit all the Aa data collected for the algal and
bacterial alginates listed in Table 1, the empirical cor-
relation previously developed (Moresi et al., 2001) was
modified as follows:
lnAa ¼ a0 þ a1 ln cþ a2lnMn þ a3 lnNG=M
þ a4 lnNG þ a5 ln FGG ð6Þ
where the empirical coefficients (ai) were estimated by
using the least-squares method upon bilogarithmic
transformation of the dependent (Aa) and independent
[c, Mn, NG=M, NG and FGG] variables, thus yielding:
a0 ¼ �1:1 � 0:8; a1 ¼ 1:6 � 0:2;
a2 ¼ 0:3 � 0:1; a3 ¼ 0:7 � 0:2; a4 ¼ 0:8 � 0:2;
a5 ¼ �0:07 � 0:06 ðr2 ¼ 0:93Þ
Further minimization of the mean percentage error(e) between the experimental and calculated Aa values
with respect to the only statistically significant parame-
ters ai by using a non-linear estimation method allowed
the following optimal set of the unknown empirical
parameters to be assessed:
a0 ¼ 1:24; a1 ¼ 1:87; a2 ¼ 0:11; a3 ¼ 1:28;
a4 ¼ 0:53; a5 ¼ 0
these being associated with a minimum e value of 23.4%.Fig. 4 shows the calculated against experimental Aa
values: more than two-thirds of the data fall within a
25% deviation band.
It can be noted that for the alginate concentrations
studied Aa was dependent on c1:87, this being in agree-
ment with c1:73� 0:11 dependence previously assessed for
algal alginates only (Moresi et al., 2001) and with c2 onereported by Smidsrød & Haug (1972). Moreover, theeffect of GG diad frequency on Aa was statistically
negligible, at least within the data considered in this

0
20
40
60
80
0 0.5 1 1.5 2NG/M
1/α
Fig. 5. Effect of the ratio between guluronate and mannuronate monad
frequencies (NG=M) on the reciprocal of the experimental order of the
relaxation function for bacterial (d) and algal high-M (r) and high-G
(�) alginates. The continuous line was calculated using Eq. (7).
M. Moresi et al. / Journal of Food Engineering 64 (2004) 179–186 185
work. However, this result is apparently in contradiction
with the general statement that contiguous guluronicacid residues exert a prevailing role in the jellifying
process of alginates in presence of bivalent cations, such
as Caþ2, the presence of which being regarded as es-
sential for forming binding sites for calcium ions and
giving rise to junctions in the gel network of the ‘‘egg-
box’’ type (Moe et al., 1995; Sime, 1990; Stokker et al.,
2000). Despite such an empirical correlation accounted
for the presence of G-units in the alginate molecules viatwo distinct parameters, i.e. NG=M and NG, it disregarded
several factors controlling lateral association of chain
segments, as well as the formation of precursor struc-
tures, structural interruptions of regular residue se-
quences limiting the length of the junction zones, etc.
(Stokker et al., 2000). Moreover, the data represented
here are still too limited to allow to elaborate more on
this point.Finally, by plotting the reciprocal of the order (a) of
the relaxation function vs. NG=M the following empirical
hyperbolic function was obtained by the least squares
method:
1=a ¼ exp½ð2:36 � 0:03Þ þ ð0:28 � 0:01Þ=ðNG=M � 0:06Þ� ðr2 ¼ 0:93Þ ð7Þ
thus allowing the experimental a values to be recon-
structed with a mean percentage error of about 10%
(Fig. 5).
The parameter (1/a) tended to decrease from 18± 1 to
12.6 ± 0.1 when dealing with high-M or high-G algalalginates, while it increased from about 27 to 67 for the
bacterial alginates tested here, these being characterised
by a high content of M-blocks (FM > 0:75) and a very
limited content of GG-blocks (Table 1).
4. Conclusions
A series of sequential oscillatory dynamic tests were
able to characterise the different gelling ability of bac-
terial and algal alginates by determining their range ofapparent linear viscoelasticity and frequency depen-
dence of G� in terms of their different order of the re-
laxation function (a) and gel stiffness (Aa) values using
Friedrich & Heymann theory (1988).
Whereas a was found to depend exponentially on the
ratio of guluronate to mannuronate monad frequencies
(NG=MÞ, Aa was expressed as a power function of alginate
concentration (c) and type [number-average molecularmass Mn, NG=M, and average G-block length (NG)], its
sensitivity with respect to c and NG=M being greater than
that to Mn and NG. However, the limited data available,
as well as incomplete understanding of the real con-
trolling factors for ionotropic gelation of alginates,
made the prediction capability of such correlations just
useful for a preliminary screening of alginates indepen-
dently of their weed or microbial origin.Under constant alginate concentration and number-
average molecular mass, as well as temperature, the
viscosifying properties of the bacterial alginates in
aqueous dispersions were found to be comparable to
those of the algal counterparts (Clementi et al., 1998).
However, this cannot be extrapolated to the gelling
properties. In fact, of the samples tested that charac-
terised by a guluronate content of 25% and a number-average molecular mass of 263.4 kDa exhibited a
gel stiffness at c ¼ 1% w/w of the same order of
magnitude of that pertaining to alginates extracted from
M. pyrifera or Lessonia nigrescens with greater guluro-
nate contents (35–40%), but smaller number-average
molecular masses (70–110 kDa). Provided that the
greater molecular mass of such a bacterial alginate
compensated for the corresponding lower guluronatecontent, should the limited range of linear viscoelasticity
observed for such a calcium gel be a signal of a shear
sensitivity typical of a physical rather than a chemical
gel?
Further studies might be needed to increase the gu-
luronate content of the bacterial alginates, by optimising
the culture media formulation (i.e. by adding Caþþ ions)
and fermentation conditions (pO2 levels and oxidativestress), as suggested by Rehm & Valla (1997) and Sabra
et al. (2001), or resorting to sequential treatments con-
sisting of a preliminary deacetylation step followed by
enzymatic processes, such as those used by Skj�ak-Braeket al. (1986) to epimerise for instance DD-mannuronan
from Pseudomonas aeruginosa into a polymer containing
40% G.
Acknowledgements
This research was supported by a special grant
(COFIN2000) from the Italian Ministry of Research
and University.

186 M. Moresi et al. / Journal of Food Engineering 64 (2004) 179–186
References
Clementi, F., Fantozzi, P., Mancini, F., & Moresi, M. (1995). Optimal
conditions for alginate production by Azotobacter vinelandii.
Enzyme Microbiology and Technology, 17, 983–988.
Clementi, F. (1997). Alginate production by Azotobacter vinelandii.
Critical Reviews in Biotechnology, 17, 327–361.
Clementi, F., Crudele, M. A., Parente, E., Mancini, M., & Moresi, M.
(1999). Production and characterization of alginate by Azotobac-
tevinelandii. Journal of Agriculture and Food Science, 79, 602–
610.
Clementi, F., Mancini, M., & Moresi, M. (1998). Rheology of alginate
from Azotobacter vinelandii in aqueous dispersions. Journal of Food
Engineering, 36, 51–62.
Donnan, F. G., & Rose, R. C. (1950). Osmotic pressure, molecular
weight, and viscosity of sodium alginate. Canadian Journal of
Research, 28(Sec. B), 105–113.
Doublier, J. L., Launay, B., & Cuvelier, G. (1992). Viscoelastic
properties of food gels. In M. A. Rao & J. F. Steffe (Eds.),
Viscoelastic properties of foods (pp. 371–434). London: Elsevier
Applied Science.
Friedrich, Chr., & Heymann, L. (1988). Extension of a model for
cross-linking polymer at the gel point. Journal of Rheology, 32,
235–241.
Mackie, W., Noy, R., & Sellen, D. B. (1980). Solution properties of
sodium alginate. Biopolymers, 19, 1839–1860.
Mancini, M., Moresi, M., & Sappino, F. (1996). Rheological beha-
viour of aqueous dispersions of algal sodium alginates. Journal of
Food Engineering, 28, 283–295.
Mancini, M., Moresi, M., & Rancini, R. (1999a). Mechanical
properties of alginate gels: empirical characterization. Journal of
Food Engineering, 39, 369–378.
Mancini, M., Moresi, M., & Rancini, R. (1999b). Uniaxial compres-
sion and stress relaxation tests on alginate gels. Journal of Texture
Studies, 30, 639–657.
Martinsen, A., Skj�ak-Braek, G., Smidsrød, O., Zanetti, F., & Poletti,
S. (1991). Comparison of different methods for determination of
molecular weight and molecular weight distribution of alginates.
Carbohydrate Polymers, 15, 171–193.
Mitchell, J. R., & Blanshard, J. M. V. (1976). Rheological properties of
alginate gels. Journal of Texture Studies, 7, 219–234.
Moe, S. T., Draget, K. I., Skj�ak-Bræk, G., & Smidsrød, O. (1995).
Alginates. In A. M. Stephen (Ed.), Food polysaccharides and their
applications (pp. 245–286). New York: Marcel Dekker.
Moresi, M., Mancini, M., Bruno, M., & Rancini, R. (2001). Visco-
elastic properties of alginate gels by oscillatory dynamic tests.
Journal of Texture Studies, 32, 375–396.
Nussinovitch, A., Peleg, M., & Normand, M. D. (1989). A modified
Maxwell and a nonexponential model for characterization of the
stress relaxation of agar and alginate gels. Journal of Food Science,
54, 1013–1016.
Onsøyen, E. (1992). Alginates. In A. Imeson (Ed.), Thickening and
gelling agents for food (pp. 1–24). London: Blackie Academic &
Professional.
Parente, E., Crudele, M. A., Ricciardi, A., & Clementi, F. (2000).
Effect of ammonium sulphate concentration and agitation speed on
the kinetics of alginate production by Azotobacter vinelandii DSM
576 in batch fermentation. Journal of Industrial Microbiology, 25,
1–7.
Rehm, B. H. A., & Valla, S. (1997). Bacterial alginates: biosynthesis
and applications. Applied Microbiology and Biotechnology, 48, 281–
288.
Sabra, W., Zeng, A.-P., & Deckwer, W.-D. (2001). Bacterial alginate:
physiology, product quality and process aspects. Applied Microbio-
logy and Biotechnology, 56, 315–325.
Segeren, A. J. M., Boskamp, J. V., & Van Den Tempel, M. (1974).
Rheological and swelling properties of alginate gels. Journal of
Chemical Society, Faraday Discussions, 57, 255–262.
Sime, W. J. (1990). Alginates sadf. In P. Harris (Ed.), Food gels
(pp. 53–78). London: Elsevier Applied Science.
Skj�ak-Braek, G., Smidsrød, O., & Larsen, B. (1986). Tailoring of
alginates by enzymatic modification in vitro. International Journal
of Biological Macromolecules, 8, 330–336.
Smidsrød, O. (1970). Solution properties of alginate. Carbohydrate
Research, 13, 359–372.
Smidsrød, O., & Haug, A. (1972). Dependence upon gel–sol state of
the ion-exchange properties of alginates. Acta Chemica Scandina-
vica 26, 2063–2074 (as cited by Lapasin & Pricl, 1995, p. 403).
Stokker, B. T., Draget, K. I., Smidsrød, O., Yuguchi, Y., Urakawa,
H., & Kajiwara, I. (2000). Small-angle X-ray scattering and
rheological characterization of alginate gels. Macromolecules, 33,
1853–1863.
Copyright © 2022 FDOKUMEN