Scopolamine injection into the olfactory bulb impairs short-term olfactory memory in rats
Upload
khangminh22Category
view
0download
0
Oscillatory Current Responses of Olfactory Receptor Neurons to Odorantsand Computer Simulation Based on a Cyclic AMP Transduction Model
Noriyo Suzuki, Masakazu Takahata and Koji Sato1
Animal Behavior and Intelligence, Division of Biological Sciences, Graduate School of Science,Hokkaido University, Sapporo 060-0810, Japan
1Present address: Department of Fisheries, Wildlife and Conservation Biology, University ofMinnesota, 200 Hodson Hall, 1980 Folwell Avenue, St Paul, MN 55108, USA
Correspondence to be sent to: Dr Noriyo Suzuki, Animal Behavior and Intelligence, Division of Biological Sciences, Graduate School ofScience, Hokkaido University, Sapporo 060-0810, Japan. e-mail: [email protected]
AbstractNeural oscillatory activities triggered by odorant stimulation have been often reported at various levels of olfactory nervoussystems in vertebrates. To elucidate the origin of neural oscillations, we studied first the oscillatory properties of currentresponses of isolated olfactory receptor neurons (ORNs) of the rainbow trout to amino acid odorants, using a whole-cellvoltage-clamp technique and found that the damped current oscillations were intrinsic in both ciliated and microvillous ORNsand occurred when ORNs were stimulated by odorants at high intensities. Continuous wavelet analysis using the Gaborfunction revealed that the dominant frequency of oscillations was 1.89 ± 0.50 Hz (mean ± SD, n = 92). There was nosignificant difference in oscillation frequency between the two types of ORNs and between different perfusion conditions withstandard and Na+-free (choline) Ringer’s solutions, but there was a slight difference in oscillation frequency between differentholding potential conditions of negative and positive potentials. We then performed a computer simulation of the currentresponses with a cAMP olfactory transduction model. The model was based on the assumption that the current responses ofORNs were linearly related to the sum of concentrations of active cyclic-nucleotide-gated channels and Ca2+-activated Cl–
channels, and was expressed by 12 differential equations with 44 different parameters. The simulation revealed that theoscillations of current responses of ORNs were mainly due to the oscillatory properties of intracellular cAMP and Ca2+
concentrations. The necessary reaction component for the oscillations in the transduction model was direct inhibition ofadenylate cyclase activity by Ca2+. High Ca2+ efflux by the Na+–Ca2+ exchanger and cAMP-phosphodiesterase activity weremost influential on the oscillations. The simulation completely represented the characteristics of current responses of ORNs:odorant-intensity-dependent response, intensity-dependent latency and adaptation. Thus, the simulation is generallyapplicable to current and voltage responses of ORNs equipped with cAMP olfactory transduction pathway in other vertebratespecies. The simulation programs for Macintosh (cAMP 9.2.7 and 9.2.8 for MacOS 8.1 or later) and cAMP JAVA appletversions based on cAMP 9.2.8 have been published on the world wide web (http://bio2.sci.hokudai.ac.jp/bio/chinou1/noriyo_home.html).
IntroductionSince the pioneering work on olfactory physiology byAdrian (Adrian, 1955), neural oscillatory activities triggeredby odorant stimulation have often been reported at variouslevels of olfactory nervous systems in a wide variety ofvertebrates: fish (Sutterlin and Sutterlin, 1971; Tucker andSuzuki, 1972); amphibians (Ottoson, 1956, 1959a; Takagiand Shibuya, 1960a,b, 1961; Hamilton and Kauer, 1989);reptiles (Tucker, 1975a,b); birds (Shibuya and Tucker, 1967);and mammals (Adrian, 1956; Ottoson, 1959b; Mathews,1972).
The oscillatory activities in the peripheral and higherolfactory nervous system have recently been restudied in
order to determine their role in odorant information coding.The oscillations of electro-olfactograms (EOGs) occur intheir decay phases in response to different odorants andtheir dominant frequencies are 28 Hz in the channel catfish(Parker et al., 1999) and 16 Hz in the toad (Nakazawa et al.,2000). It has been shown (Parker et al., 2000) that thedominant frequency of oscillations of summated impulseresponses of small populations of olfactory receptor neur-ons (ORNs) to amino acid odorants was 13–37 Hz and thatthe oscillations were triggered and enhanced by trisodiumcitrate with its action of Ca2+ chelation from the surfaceof the olfactory epithelium. Optical recordings of odorant
© Oxford University Press 2002. All rights reserved.
Chem. Senses 27: 789–801, 2002

responses from different loci in the turtle olfactory bulb haveshown that there are three different oscillations withdifferent frequencies in the olfactory bulb (Lam et al., 2000).Simultaneous recordings of EOGs or summated impulseresponses of small populations of ORNs (peripheralwaves—PWs) and summated impulse responses of smallpopulations of neurons at different bulbar loci (local fieldpotentials—LFPs) to volatile odorants in the salamander(Dorries and Kauer, 2000) and amino acid odorants in thechannel catfish (Nikonov and Caprio, 2001; Nikonov et al.,2002) have shown that the PWs and the LFPs are cross-correlated; the frequency and magnitude of the LFPsincreased with PWs and their oscillations are phase-locked.These studies suggest that the oscillations of both levelsshare a common source and are modulated together and thattheir common source might be the oscillatory properties ofindividual ORNs in the olfactory epithelium.
The characteristic frequency ranges of neural oscillationsin different nervous systems are basically determined by twotypes of features; one is patterns of connectivity betweenneurons and the dynamic properties of the interveningsynapses and the other is the network rhythmicity that arisesvia the coupling of oscillatory subunits, each of whichpossesses an intrinsically determined frequency preference,although these two features are not mutually exclusivesince network connectivity could reinforce the patterns ofexcitation produced by coupled oscillators (Hutcheon andYarom, 2000). In the olfactory nervous system, such inde-pendent and intrinsic oscillatory activities have actually beenobserved in isolated ORNs (Frings and Lindemann, 1988)and in the olfactory bulb slice preparation (Desmaisons etal., 1999). Reisert and Matthews (Reisert and Matthews,1997, 2001a,b) reported that the oscillation frequency of iso-lated ORNs in response to a prolonged odorant stimulationof 30 s was 0.083–0.28 Hz in the frog and 0.42–2.70 Hz inthe mouse. They suggested that the oscillations might be dueto the Na+–Ca2+ ion exchanger (NCX) mechanisms in themembrane of ORNs. We also have noticed the oscillationssuperimposed on current responses of isolated ORNs fromthe rainbow trout in our previous patch-clamp studies (Satoand Suzuki, 2000, 2001).
In the present work, we studied the oscillatory propertiesof current responses of isolated ORNs from the rainbowtrout and performed a computer simulation of currentresponses of ORNs based on a cAMP transduction model inorder to elucidate the origin of oscillations in ORNs. Thesimulation studies revealed that the oscillations of currentresponses of ORNs are mainly due to the oscillatory prop-erties of intracellular cAMP and Ca2+ concentrations andthat the necessary reaction component for the oscillations inthe transduction model is the direct inhibition of adenylatecyclase (AC) activity by Ca2+. High Ca2+ effluxes by NCXand cAMP-phosphodiesterase (cAMP-PDE) activity weremost influential on the oscillations. The simulation com-pletely represented the characteristics of current responses
of ORNs: odorant-intensity-dependent response, intensity-dependent latency and adaptation.
Materials and methods
Whole-cell current recordings of isolated ORNs fromrainbow trout
The ORNs of rainbow trout (fork length, 17–20 cm; weight,60–90 g) obtained from a local fishery were isolated forwhole-cell patch-clamp recordings. Cell isolation by theCa2+-free solution method and whole-cell voltage-clamprecordings using a pressure ejection stimulation system wereperformed as described previously (Sato and Suzuki, 2000,2001). Briefly, both types of ORNs—ciliated (cORNs) andmicrovillous (mORNs)—were isolated and stimulatedfocally at their cilia or microvilli with a quadruple aminoacid mixture (1.0 or 10 mM: L-Glu, L-Arg, L-Ala and L-Nva)in the perfusion of standard Ringer’s solution (in mM:NaCl, 100; KCl, 3; CaCl2, 2; MgCl2, 1; D-glucose, 10;HEPES, 5; NaOH, 2.2; pH 7.4) or Na+-free (choline)Ringer’s solution (in mM: choline-Cl, 100; KCl, 3; CaCl2, 2;MgCl2, 1; D-glucose, 10; HEPES, 5; NaOH, 2.2; pH 7.4) inorder to record Ca2+-activated Cl– ion channel currentresponses. The calibration of the waveforms of ejectedodorant pulses, examined by measuring liquid junctioncurrents and voltages, confirmed that there were no meas-urable bumps superimposed on the odorant pulses. Therecording pipette was filled with K+-internal solution (inmM: KCl, 93; EGTA-2K, 5; HEPES, 5; ATP-2Na, 1.0;GTP-Na, 0.1; KOH, 2.26; pH 7.4] and its resistance was8–12 MΩ. The recording pipette was connected via asilver–silver-chloride (Ag–AgCl) wire to the headstage of apatch-clamp amplifier (CEZ-2200; Nihon Kohden, Tokyo).The reference electrode was an Ag–AgCl plate immersed inthe bath solution. Current signals were low-pass filtered at3 kHz and stored on magnetic tape using a PCM datarecorder (DC-13 kHz bandwidth; PCM-501ES; Sony,Tokyo) for later off-line analysis.
Analysis of oscillatory properties of current responses
Current response data for a period of 5 or 15 s were firstlow-pass filtered at 40 Hz (4 dB/oct, Butterworth) anddigitized at 200 Hz sampling speed using PowerLab Chart3.6.8 (AD Instruments, Mountain View, CA) on a PowerMacintosh computer and the data for each record weretransformed into the file format for Igor Pro 4.0(WaveMetrics, Lake Oswego, OR). The data files were thendisplayed as Igor Pro graphs and their decay phase wasfitted by a double exponential function curve. The data ofthe fitted function curve were subtracted from the decayphase data of the record and the residue data for thedecay phase were obtained for each record and transformedinto a text file format. The text files were then subjectedto a continuous wavelet analysis using a JAVA softwareMEM—maximum entropy method (Ishikawa, 2000)—with
790 N. Suzuki, M. Takahata and K. Sato

the eighth-order Gabor function (Mallat, 1999). The powerdensity of the frequency for each record was analyzed ateight levels, each of which was divided into four divisions, inthe frequency range between 0.19 and 32.02 Hz. Theanalyzed data for each record were displayed on a computerscreen as an 8 bit grayscale diagram with axes of frequencyon ordinate and time on abscissa. The text files of theresidue data of records were also subjected to thecalculation of mean of root mean square (RMS) for theevaluation of signal fluctuation by PowerLab Chart 4.1.1.The statistical evaluation of frequency analysis data wasperformed using StatView 4.5 (SAS Institute, Cary, NC).
Development of simulation programs
Simulation programs of the current responses for a PowerMacintosh computer were developed with REALbasic 3.5J(REAL Software, Austin, TX) based on a cAMP trans-duction pathway model for the current responses (Figure 3).The model was constructed on the basis of cAMP secondmessenger system models for neurons at different levels ofthe nervous system (Cooper et al., 1995; Bhalla and Iyengar,1999), using some of the parameter values in the referencescited in review articles (Zufall et al., 1994; Nakamura, 2000)and empirically determined parameter values. Althoughmost functional molecules in the olfactory transductionpathway are thought to be concentrated in the membranesof olfactory cilia or microvilli, it was assumed in the presentmodel that these functional molecules are evenly distributedin the cell (Bhalla and Iyengar, 1999). The unit conduct-ances of cyclic-nucleotide-gated (CNG) ion channels andCa2+-activated Cl– (CAC) ion channels were also ignored,so that the whole-cell current responses were assumed to belinearly related to the sum of concentrations of active CNGand CAC channels for an ORN. In addition, IP3-involvedreaction processes and CO/cGMP-involved processes thathave been proposed to exist in the olfactory transductionpathways in fishes (Restrepo et al., 1990, 1993; Lo et al.,1993; Cadiou et al., 2000) and in mammals and amphib-ians (Schild et al., 1995; Lischka et al., 1999; Zufall andLeinders-Zufall, 1997) were excluded to avoid complicatingthe simulation procedure. Thus, the reaction processes in themodel were expressed by 12 differential equations with44 different parameters (see Appendix). The simulationprograms for Macintosh (cAMP 9.2.7 and 9.2.8 for MacOS8.1 or later) and the cAMP JAVA applet versions basedon cAMP 9.2.8 (http://bio2.sci.hokudai.ac.jp/bio/chinou1/noriyo_home.html) calculate numerical solutions using theEuler integration method or the 4th-order Runge–Kuttaintegration method (Gershenfeld, 1999; Schutter, 2001) on afixed integration time step, usually 0.001 s or shorter anddisplay the solutions for 12 different functions expressed asthe concentration in µM on the ordinate versus the time inseconds on the abscissa. The time scale of the abscissa ischangeable up to 10 s for cAMP 9.2.7 and 100 s for cAMP9.2.8. The polarity and scale of the ordinate are changeable
for the numerical solution curves to represent similarly asactual inward current responses, especially for the sum ofconcentrations of active CNG and CAC channels. Theprograms also export the solution files as reversible row texttables for Igor Pro, from which the three-dimensional graphswere obtained using its surface plot option.
All graphs obtained by the various software packages inthe present study were further processed for presentationusing Canvas 6 graphics software (Deneba, Miami, FL).
Results
Oscillations of whole-cell inward current responses
Figure 1A illustrates typical whole-cell current responses ofa cORN to the amino acid mixture puff with a 25 msduration at a holding potential of –60 mV. The amplitude ofinward current response increased with increased odorantintensity, as the odorant intensity was shown to relatelinearly to the ejection pressure (Sato and Suzuki, 2000).Since the responses were all phasic, with a fast rise andslower exponential decay, the decay phases of responseswere fitted by different double exponential function curves.The fitted function curve data were subtracted from thedecay phase data of the record and the residue data for thedecay phase were obtained. The corresponding residuenoises to the original responses in Figure 1A are shown inFigure 1B. The signal fluctuation measured by the mean ofRMS for these residue noises increased with increasedodorant intensity and the residue noises became moreoscillatory with increases of signal fluctuation, i.e. theoscillations occurred in high odorant intensity ranges. Thepositive correlation between the current response peak andthe signal fluctuation of residual noises (r = 0.78, n = 23records from four cORNs) also indicated that the oscil-lations appeared in the responses of ORNs when stimulatedby odorants in high intensity. The residue noise records werethen subjected to wavelet analysis and displayed as powerdensity diagrams for frequency versus time relation, asshown in Figure 1C.
Figure 2A shows whole-cell current responses of anmORN to the amino acid mixture with different prolongedstimulus durations (1, 3 and 5 s; 1 kgf/cm2) at a holdingpotential of –60 mV and the fitted double exponentialfunction curves to their decay phases. The residue noise wassubjected to wavelet analysis to show its dominant frequency(Figure 2B).
Oscillation frequency of whole-cell current responses
Table 1 summarizes the oscillation frequencies of whole-cellcurrent responses determined by wavelet analysis underdifferent recording conditions. The mean of theoscillationfrequencies of current response records from 41 ORNs (31cORNs and 10 mORNs) was 1.89 ± 0.50 Hz (mean ± SD,n = 92, range 0.98–3.51). There was no statistical difference
Oscillatory Current Responses of ORNs and Computer Simulation 791

in the mean frequency between different types of ORNs[cORNs, 1.95 ± 0.25 Hz (n = 41, range 0.98–3.51); mORNs,1.85 ± 0.22 Hz (n = 21, range 1.36–3.51); P > 0.3,Mann–Whitney U-test] or between different perfusionconditions [standard Ringer’s solution, 1.92 ± 0.49 Hz(n = 62, range 0.98–3.15); Na-free (choline) Ringer’ssolution, 1.86 ± 0.28 Hz (n = 28, range 1.36–2.93); P > 0.5,Mann–Whitney U-test], but there was a statistical differencein the mean frequency between different holding potentials[–60 mV, 1.91 ± 0.25 Hz (n = 71, range 0.98–3.51); +20 mV,1.59 ± 0.15 Hz (n = 13, range 1.36–2.58); P < 0.01,Mann–Whitney U-test].
Simulation of whole-cell current responses
As described in Materials and methods, the simulationprograms were developed on the basis of a cAMP trans-duction model for current responses of ORNs, where it wasassumed that the sum of concentrations of active CNG andCAC channels was linearly related to the whole-cell inwardcurrent response (Figure 3). The solutions for 12 differentialequations using 44 different parameters (see Appendix) werecalculated by the Euler or 4th-order Runge–Kutta inte-gration methods at 1 ms integration time step. No obviousdifferences in the solutions obtained by these two methodswere observed at 1 ms step integration. Figure 4 shows one
Figure 1 Oscillations of current responses of a typical cORN to the amino acid mixture. (A) Whole-cell inward current responses to the amino acid mixtureat different stimulus ejection pressures (0.2–2.0 kgf/cm2; duration, 25 ms) at a holding potential of –60 mV. Stimulus ejection pressure (kgf/cm2) is shownon each trace. Top trace shows the timing of ejection pressure pulse. The decay phase of each record was fitted by a double exponential function curve. (B)The fitted function curve data were subtracted from the decay phase data of the record and the corresponding residue noises to the record in (A) are shown.(C) The power density diagram in 8 bit grayscale analyzed by the 8th-order Gabor function. The diagram was obtained from the lowest residue noises (2.0kgf/cm2) in (B). The dominant frequency for the record ranged between 1.56 and 2.15 Hz.
792 N. Suzuki, M. Takahata and K. Sato

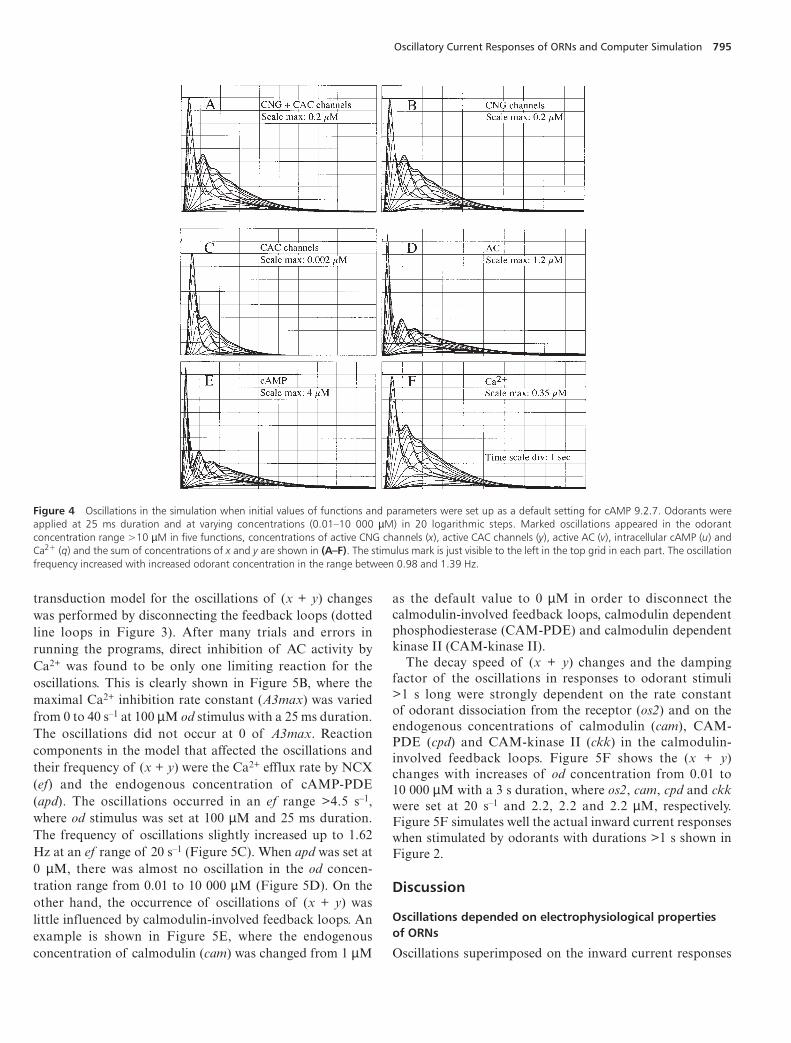
set of solutions when the initial values of the12 functionsand 44 parameters were set up as defaults for the programsshown in the Appendix. Odorant stimuli (od) with a 25 msduration at different concentrations ranging from 0.01 to10 000 µM (10–8 and 10–2 M) were applied in 20 logarithmicsteps. The resulting function changes were phasic, with aninitial fast rise and a slower exponential decay and return tothe initial level within 6 s. For od concentrations >10 µM,the damped oscillations were superimposed on the decayphases of the changes. Marked oscillations occurred in fivefunctions: the concentrations of active CNG channels (x);active CAC channels (y); active AC (v); cAMP (u); and freeCa2+ (q). Oscillations also occurred in the sum of con-centrations of active CNG and CAC channels (x + y) inod concentrations >10 µM (Figure 4A–F), although thecontribution of the concentration of active CAC channels
to the sum of concentrations of (x + y) was small comparedto the concentration of active CNG channels (note that thescale maximum in Figure 4C is one-hundredth of that inFigure 4B). Less marked oscillations were observed inconcentrations of active PKA (s) and calcium–calmodulincomplex (p) in od concentrations >10 µM (graphs notshown). The changes of all 12 functions, including the fivefunctions with marked oscillations, became saturated in odconcentrations >1000 µM.
Characteristics of (x + y) changes in the simulation
Figure 5 shows three-dimensional presentations of (x + y)changes, of which the polarity of y-axes was reversed tomimic actual whole-cell inward current responses. Thechanges in (x + y) increased with increased od concen-trations and the damped oscillations were superimposed on
Figure 2 Oscillations of current responses of a typical mORN to the amino acid mixture. (A) Whole-cell inward current responses to the amino acid mixturein different stimulus durations, 1, 3 and 5 s at 1.0 kgf/cm2 at a holding potential of –60 mV. Top trace in each record shows the timing of ejection pressurepulse. Middle trace shows the residue noises obtained by fitting of double exponential curve to the decay phase of each response record in lowest trace. (B)The wavelet analysis expressed by the 8 bit grayscale power density diagram using the eighth-order Gabor function. The diagram was obtained from the topresidue noises, the same as that in the 5 s duration record shown in (A). The dominant frequency for the record ranged between 1.17 and 1.56 Hz.
Oscillatory Current Responses of ORNs and Computer Simulation 793

their decay phases in od concentrations >10 µM. Thechanges saturated in od concentrations >1000 µM. Thelatency for (x + y) changes became shorter (from 181.8 to22.7 ms) with increased od concentration. The frequency ofdamped oscillations increased slightly (from 0.98 to 1.39 Hz)
with increased od concentration (Figure 5A). These char-acteristics of (x + y) changes simulated well the odorantintensity relation of actual inward current responses shownin Figure 1.
A search for the limiting reaction components in the
Table 1 Oscillation frequencies in different types of ORNs and different recording conditions
Types of ORNs/recording conditions (no. of ORNs) Peak frequency (Hz)a P-valueb
1. All records–60 or +20 mV, standard Ringer’s or Na+-free (choline) Ringer’s(41 ORNs: 31 cORNs; 10 mORNs)
1.89 ± 0.50 (92; 0.98–3.51) –
2. Type of ORNscORNs (31), –60 mV, standard Ringer’s 1.95 ± 0.25 (41; 0.98–3.51) >0.3mORN (10), –60 mV, standard Ringer’s 1.85 ± 0.22 (21; 1.36–3.51)
3. Holding potential–60 mV, standard Ringer’s (25 cORNs; 9 mORNs) 1.91 ± 0.25 (71; 0.98–3.51) <0.01+20 mV, standard Ringer’s (6 cORNs) 1.59 ± 0.15 (13; 1.36–2.58)
4. Perfusion solutionStandard Ringer’s, –60 mV (17 cORNs; 10 mORNs) 1.92 ± 0.49 (62; 0.98–3.51) >0.5Na+-free (choline), –60 mV (13 cORNs) 1.86 ± 0.28 (28; 1.36–2.93)
aData of peak frequency are expressed as mean ± SD (number of observations; range)bBy Mann–Whitney U-test. Statistical significance was noted only in different holding potential conditions.
Figure 3 The cAMP transduction pathway model for the simulation. The model was constructed based on the references cited in previous work (Zufall etal., 1994; Nakamura, 2000). Arrows with solid lines indicate the downward regulation processes between individual enzyme reactions and arrows withdotted lines indicate the negative feedback regulation processes between them. It was assumed that the whole-cell current responses are linearly related tothe sum of concentrations of active CNG and CAC channels. The definitions of character symbols in this figure and their dimensions are shown in theAppendix.
794 N. Suzuki, M. Takahata and K. Sato
transduction model for the oscillations of (x + y) changeswas performed by disconnecting the feedback loops (dottedline loops in Figure 3). After many trials and errors inrunning the programs, direct inhibition of AC activity byCa2+ was found to be only one limiting reaction for theoscillations. This is clearly shown in Figure 5B, where themaximal Ca2+ inhibition rate constant (A3max) was variedfrom 0 to 40 s–1 at 100 µM od stimulus with a 25 ms duration.The oscillations did not occur at 0 of A3max. Reactioncomponents in the model that affected the oscillations andtheir frequency of (x + y) were the Ca2+ efflux rate by NCX(ef) and the endogenous concentration of cAMP-PDE(apd). The oscillations occurred in an ef range >4.5 s–1,where od stimulus was set at 100 µM and 25 ms duration.The frequency of oscillations slightly increased up to 1.62Hz at an ef range of 20 s–1 (Figure 5C). When apd was set at0 µM, there was almost no oscillation in the od concen-tration range from 0.01 to 10 000 µM (Figure 5D). On theother hand, the occurrence of oscillations of (x + y) waslittle influenced by calmodulin-involved feedback loops. Anexample is shown in Figure 5E, where the endogenousconcentration of calmodulin (cam) was changed from 1 µM
as the default value to 0 µM in order to disconnect thecalmodulin-involved feedback loops, calmodulin dependentphosphodiesterase (CAM-PDE) and calmodulin dependentkinase II (CAM-kinase II).
The decay speed of (x + y) changes and the dampingfactor of the oscillations in responses to odorant stimuli>1 s long were strongly dependent on the rate constantof odorant dissociation from the receptor (os2) and on theendogenous concentrations of calmodulin (cam), CAM-PDE (cpd) and CAM-kinase II (ckk) in the calmodulin-involved feedback loops. Figure 5F shows the (x + y)changes with increases of od concentration from 0.01 to10 000 µM with a 3 s duration, where os2, cam, cpd and ckkwere set at 20 s–1 and 2.2, 2.2 and 2.2 µM, respectively.Figure 5F simulates well the actual inward current responseswhen stimulated by odorants with durations >1 s shown inFigure 2.
Discussion
Oscillations depended on electrophysiological propertiesof ORNs
Oscillations superimposed on the inward current responses
Figure 4 Oscillations in the simulation when initial values of functions and parameters were set up as a default setting for cAMP 9.2.7. Odorants wereapplied at 25 ms duration and at varying concentrations (0.01–10 000 µM) in 20 logarithmic steps. Marked oscillations appeared in the odorantconcentration range >10 µM in five functions, concentrations of active CNG channels (x), active CAC channels (y), active AC (v), intracellular cAMP (u) andCa2+ (q) and the sum of concentrations of x and y are shown in (A–F). The stimulus mark is just visible to the left in the top grid in each part. The oscillationfrequency increased with increased odorant concentration in the range between 0.98 and 1.39 Hz.
Oscillatory Current Responses of ORNs and Computer Simulation 795

Figure 5 Three-dimensional representations of the sum of concentrations of active CNG (x) and CAC channels (y) with different parameter settings. Thepolarity of the y-axis was reversed to mimic actual whole-cell inward current responses and the polarity of the z-axis was reversed, except in (B), forvisualization of the oscillations. Odorants of 25 ms duration and 3 s duration were applied in (A–E) and (F), respectively. Odorant concentration was changedfrom 0.01 to 10 000 µM in 20 logarithmic steps in (A) and (D–F) and was fixed at 100 µM in (C) and (D). (A) Odorant concentration dependence of (x + y)at the default settings of the parameters. This graph was three-dimensionally plotted from the data of the graph shown in Figure 4A. Note that the latencyof the (x + y) changes became shorter with increases in odorant concentration, as is similarly shown in (D–F). The figure simulates well the actual whole-cellinward current responses shown in Figure 1. (B) The maximal rate constant of AC inactivation by Ca2+ (A3max) was stepped up from 0 to 40 s–1 in 20 linearsteps. There were no oscillations at 0 s–1 of A3max, at which the process for direct AC inactivation by Ca2+ was disconnected, indicating that the process isnecessary for the oscillations. (C) The rate constant of Ca2+ efflux (ef) was changed from 0.1 to 20 s–1 in 20 logarithmic steps. The oscillations appeared inthe range >4.5 s–1. (D) Odorant concentration dependence of (x + y) when the endogenous concentration of cAMP-PDE (apd) was set at 0 µM. Oscillationsdisappeared almost completely. (E) Odorant concentration dependence of (x + y) when the endogenous concentration of calmodulin (cam) was set at 0 µMto disconnect the calmodulin-involved feedback loops. Oscillatory behaviors of (x + y) did not change significantly. (F) Odorant concentration dependenceof (x + y) changes for odorants associated with longer stimulus duration. The rate constant of odorant dissociation from odorant receptor (os2) was set at20 µM–1s–1. The endogenous concentrations of cam, calmodulin-dependent phosphodiesterase (cpd) and calmodulin-dependent kinase II (ckk) were also setat 2.2 µM. The oscillations appeared in the odorant concentration range >10 µM. The figure simulates well the actual whole-cell inward current responsesshown in Figure 2A.
796 N. Suzuki, M. Takahata and K. Sato

of isolated ORNs from rainbow trout occurred in bothcORNs and mORNs when stimulated by amino acidodorants at high intensity. The dominant frequency ofoscillations in both types of ORNs did not differ signifi-cantly. This similarity of oscillation properties was probablydue to the similarity of electrophysiological properties ofthe I–V relations and reversal potentials for the amino acidodorant between both types of ORNs (Sato and Suzuki,2000, 2001). In addition, there was no significant differ-ence in oscillation frequency between different perfusionconditions for different ion channel current recordings,indicating that both types of ORNs have the same kinds ofefferent ion channels—CNG and CAC channels—in theirtransduction pathways, although these two types of ORNsmight have different types of odorant receptors (Sato andSuzuki, 2001). On the other hand, the oscillation frequencywas significantly different in different holding potential con-ditions. The dominant frequency of oscillation at –60 mVwas slightly higher than at +20 mV. The results were alsoattributed to the voltage-dependent characteristics of thecurrent responses to amino acid odorants, in which thedecay speed of the current responses was faster in negativeholding potential ranges than in positive potential ranges.Thus, the oscillation frequency of whole-cell currentresponses depended superficially on their electrophysio-logical characteristics.
Comparison with previously observed oscillations
The oscillation frequency of isolated ORNs from rain-bow trout in the present study (1.89 Hz) was higher thanthose previously found in isolated ORNs from thefrog—0.10–0.12 Hz (Frings and Lindemann, 1988) and0.083–0.28 Hz (Reisert and Matthews, 1997, 2001a)—andwas in the range of those found in the mouse—0.42–2.70 Hz(Reisert and Matthews, 2001b). Differences in oscillationfrequencies might be due to the different odorant stimu-lation methods used in various studies; we used shortperiods of stimulation from 25 ms to 5 s with the pressureejection method, while other groups used a longer odor-ant stimulation time of 30 s or >1 min with steppingsuperfusion or continuous bath application methods. Thedifferent oscillation frequencies of ORNs in differentspecies also suggest species-specific differences in reactioncomponents in olfactory transduction pathways of ORNs(see later discussion on simulation).
Generation mechanisms of PWs
Oscillations of current responses of ORNs should directlyinfluence both EOG responses and nerve impulse responsesof the populations of ORNs in in vivo preparations, sinceEOG responses are composed of the sums of slow potentialchanges of ORNs in the olfactory epithelium, and nerveimpulses from the populations of ORNs are direct outputsfrom ORNs triggered by current or voltage responses ofindividual ORNs. The oscillation frequency of current
responses of isolated ORNs from the rainbow trout(1.89 Hz) in the present study, however, was much lowerthan those of the PWs of EOGs in the channel catfish(28 Hz) (Parker et al., 1999; 2000) and in the toad (16 Hz)(Nakazawa et al., 2000), and the nerve impulse responsesof small populations of ORNs in the channel catfish(20–28 Hz) (Nikonov and Caprio, 2001; Nikonov et al.,2002). The higher frequency of oscillations in the PWs couldnot be explained by the simple summation of slow oscil-lations of individual ORNs, because spatial and temporalexcitation of individual ORNs in different locations in theolfactory epithelium would elicit the PWs as a whole (Parkeret al., 1999). If there are electrical connections betweenindividual ORNs in the olfactory epithelium as has beensuggested (Zhang et al., 2000), the generation mechanism ofthe PWs would become much more complex.
Parameter setting in the simulation
The present simulation revealed that the oscillations ofcurrent responses of ORNs are mainly due to the oscillatoryproperties of intracellular cAMP and Ca2+ concentrations.The necessary reaction component for the oscillations in thetransduction model was the direct inhibition of AC activityby Ca2+. High Ca2+ effluxes by NCX and cAMP-PDEactivity were the parameters that most influenced the oscil-lations. The important role of NCX in Ca2+ efflux in theoscillations of ORNs, as suggested by Reisert and Matthews(Reisert and Matthews, 1997, 2001a,b), was consistentwith the previous result that the Ca2+-chelating action oftrisodium citrate on the surface of olfactory epitheliumtriggered and enhanced the PWs (Parker et al., 2000).
We used 44 different parameters in the simulation, someof which were obtained from data available in previouslypublished studies and the references therein (Zufall et al.,1994; Nakamura, 2000). Since many other parameters wereunknown, we took arbitrary but reasonable ranges of valuesin ORNs, as used in previous simulation studies (Cooperet al., 1995; Bhalla and Iyengar, 1999). For example,endogenous concentrations of enzymes such as pka, go, ac,ckk, apd, cam and cpd were taken as 1–5 µM per ORN. Theendogenous concentrations of CNG and CAC ion channelswere set at 1 µM per ORN. Unknown rate constants andtheir maximal rates for enzyme reactions such as AKmax,PKmax, rg, a, A2max, A3max, ca, PDmax, CDmax andCKmax were also set at 0.1–40 s–1. In addition, the rateconstants for Ca2+ influx (if) through CNG channels andefflux (ef) by NCX were set at 20 and 10 s–1, respectively.However, essentially similar simulation results wereobtained in the intracellular Ca2+ concentration range up to300 nM (Leinders-Zufall et al., 1997, 1998), even if thesevalues were changed to the order of several thousands persecond (Hilgemann, et al., 1991; Niggli and Lederer, 1991)when we kept the ratio of influx and efflux rates at ~2:1.Thus, these empirically chosen values, conversely, have been
Oscillatory Current Responses of ORNs and Computer Simulation 797

shown to be appropriate for the simulation of actual currentresponses in the present study.
The current carried through CAC channels is thought tocontribute mostly to the whole-cell current response toodorants in the newt at ~40% of total current (Kurahashiand Yau, 1993) and in the rat at ~80% of total current (Loweand Gold, 1993). In the present simulation, however, thecontribution of the concentration of active CAC channels to(x + y) was as small as one-hundredth of that of the activeCNG channels. This quite different feature in the simulationmight be due to our parameter setting: we ignored the unitconductances of CNG and CAC channels, and the half-maximal concentration of Ca2+ for CAC channel openingswas set at 5.0 µM (Kleene and Gesteland, 1991), whichmight have been rather high for the intracellular Ca2+
change up to 300 nM (Leinders-Zufall et al., 1997, 1998).
Simulation of oscillations with lower frequency inducedby prolonged stimulation
The present simulation matched the oscillations of currentresponses of ORNs to odorants with short stimulusdurations from 25 ms to 5 s and their damped oscillationfrequency was in the range of 0.98–1.62 Hz. The frequencyof current or voltage oscillations observed in frogORNs—0.10–0.12 Hz (Frings and Lindemann, 1988) and0.083–0.28 Hz (Reisert and Matthews, 1997, 2001a)—wasmuch lower than the frequency range of the presentsimulation. The damping of oscillations during prolongedstimulation of up to 1 min or more was not observed inthese studies. We tried to simulate such low-frequencyoscillations without damping with prolonged stimulusdurations of up to 60 s with the simulation program, cAMP9.2.8, by changing parameter settings, but we could notfind such oscillations, although damped oscillations withfrequencies as low as 0.4 Hz were obtained when odconcentration, if and ef were set at 0.1 µM, 1 s–1 and 0.1–0.5 s–1, respectively. Therefore, the present simulation modelmight have needed some other transduction processes thancAMP-involved processes such as IP3-involved processes(Restrepo et al., 1990, 1993; Lo et al., 1993; Schild et al.,1995; Lischka et al., 1999; Cadiou et al., 2000; Iida andKashiwayanagi, 2000) and CO/cGMP-involved processes(Zufall and Leinders-Zufall, 1997). However, since thesimulation completely represented the major characteristicsof current responses of ORNs to odorants with shortstimulus durations—odorant-intensity-dependent response,intensity-dependent latency and adaptation—the presentsimulation is generally applicable to current and voltageresponses of ORNs equipped with the cAMP olfactorytransduction pathway in other vertebrate species.
AcknowledgementsWe thank Dr Yasuhiro Ishikawa (Ishikawa Medical Clinic,Saitama, Japan) for his kind guidance during the use of MEMwavelet analysis software. We also thank Dr Michio Yazawa
(Division of Chemistry, Hokkaido University) for valuable com-ments on the construction of the cAMP transduction model andDr Shin Tochinai (Division of Biological Science, HokkaidoUniversity) for uploading the cAMP 9.2.7 and 9.2.8 simulationprograms and the cAMP JAVA applet versions to our web site(http://bio2.sci.hokudai.ac.jp/bio/chinou1/).
ReferencesAdrian, E.D. (1955) Potential oscillations in the olfactory organ. J. Physiol.
(Lond.), 128, 21–22.
Adrian, E.D. (1956) The action of the mammalian olfactory organ.J. Laryngol. Otol., 70, 11–14.
Bhalla, U.S. and Iyengar, R. (1999) Emergent properties of networks ofbiological signaling pathways. Science, 283, 381–387.
Cadiou, H., Sienaert, I., Vanlingen, S., Parys, J.B., Molle, G. andDuclohier, H. (2000) Basic properties of an inositol channel in carpolfactory cilia. Eur. J. Neurosci., 12, 2805–2811.
Cooper, D.M.F., Mons, N. and Karpen, J.W. (1995) Adenylyl cyclases andthe interaction between calcium and cAMP signalling. Nature, 374,421–424.
Desmaisons, D., Vincent, J.-D. and Lledo, P.-M. (1999) Control of actionpotential timing by intrinsic subthreshold oscillations in olfactory bulboutput neurons. J. Neurosci., 19, 10727–10737.
Dorries, K.M. and Kauer, J.S. (2000) Relationships between odor-elicitedoscillations in the salamander olfactory epithelium and olfactory bulb.J. Neurophysiol., 83, 754–765.
Frings, S. and Lindemann, B. (1988) Odorant response of isolatedolfactory receptor cells is blocked by amiloride. J. Membrane Biol., 105,233–243.
Gershenfeld, N. (1999) The Nature of Mathematical Modeling. CambridgeUniversity Press, Cambridge.
Hamilton, K.A. and Kauer, J.S. (1989) Patterns of intracellular potentialsin salamander mitral/tufted cells in response to odor stimulation.J. Neurophysiol., 59, 609–625.
Hilgemann, D.W., Nicoll, D.A. and Philipson, K.D. (1991) Chargemovement during Na+ translocation by native and cloned cardiacNa+/Ca2+ exchanger. Nature, 352, 715–718.
Hutcheon, B. and Yarom, Y. (2000) Resonance, oscillation and the intrinsicfrequency preferences of neurons. Trends Neurosci., 23, 216–222.
Iida, A. and Kashiwayanagi, M. (2000) Responses to putative secondmessengers and odorants in water nose olfactory neurons of Xenopuslaevis. Chem. Senses, 25, 55–59.
Ishikawa, Y. (2000) Wavelet Analysis for Clinical Medicine. Igaku-Shuppan,Tokyo (in Japanese).
Kleene, S.J. and Gesteland, R.C. (1991) Calcium-activated chlorideconductance in frog olfactory cilia. J. Neurosci., 11, 3624–3629.
Kurahashi, T. and Yau, K.-W. (1993) Co-existence of cationic and chloridecomponents in odorant-induced current of vertebrate olfactory receptorcells. Nature, 363, 71–74.
Lam, Y.-W., Cohen, L.B., Wachowiak, M. and Zochowski, M.R. (2000)Odors elicit three different oscillations in the turtle olfactory bulb.J. Neurosci., 20, 749–762.
Leinders-Zufall, T., Rand, M.N., Shepherd, G.M., Greer, C.A. andZufall, F. (1997) Calcium entry through cyclic nucleotide-gated channelsin individual cilia of olfactory receptor cells: spaciotemporal dynamics.J. Neurosci., 17, 4136–4148.
798 N. Suzuki, M. Takahata and K. Sato

Leinders-Zufall, T., Greer, C.A., Shepherd, G.M. and Zufall, F. (1998)Imaging odor-induced calcium transients in single olfactory cilia:specificity of activation and role in transduction. J. Neurosci., 18,5630–5639.
Lischka, F.W., Zviman, M.M., Teeter, J.H. and Restrepo, D. (1999)Characterization of inositol-1,4,5-trisphosphate-gated channels in theplasma membrane of rat olfactory neurons. Biophys. J., 76, 1410–1422.
Lo Y. H., Bradley, T.M. and Rhoads, D.E. (1993) Stimulation of Ca2+-regulated olfactory phospholipase C by amino acids. Biochemistry, 32,12358–12362.
Lowe, G. and Gold, G.H. (1993) Nonlinear amplification by calcium-dependent chloride channels in olfactory receptor cells. Nature, 366,283–286.
Mallat, S. (1999) A Wavelet Tour of Signal Processing, 2nd edn. AcademicPress, London.
Mathews, D.F. (1972) Response patterns of single units in the olfactorybulb of the rat to odor. Brain Res., 47, 389–400.
Nakamura, T. (2000) Cellular and molecular constituents of olfactorysensation in vertebrates. Comp. Biochem. Physiol., A126, 17–32.
Nakazawa, H., Kaji, S. and Ishii, S. (2000) Oscillatory electric potential onthe olfactory epithelium observed during the breeding migration periodin the Japanese toad, Bufo japonicus. Zool. Sci., 17, 293–300.
Niggli, E. and Lederer, W.J. (1991) Molecular operations of the sodium–calcium exchanger revealed by conformation currents. Nature, 349,621–624.
Nikonov, A.A. and Caprio, J. (2001) Electrophysiological evidence for achemotopy of biologically relevant odors in the olfactory bulb of thechannel catfish. J. Neurophysiol., 86, 1869–1876.
Nikonov, A.A., Parker, J.M. and Caprio, J. (2002) Odorant-inducedolfactory receptor neural oscillations and their modulation of olfactorybulbar responses in the channel catfish. J. Neurosci., 22, 2352–2362.
Ottoson, D. (1956) Analysis of the electrical activity of the olfactoryepithelium. Acta Physiol. Scand., 35, 1–83.
Ottoson, D. (1959a) Comparison of slow potentials evoked in the frog’snasal mucosa and olfactory bulb by natural stimulation. Acta Physiol.Scand., 47, 149–159.
Ottoson, D. (1959b) Studies on slow potentials in the rabbit’s olfactorybulb and nasal mucosa. Acta Physiol. Scand., 47, 136–148.
Parker, J.M., Lindemann, B. and Caprio, J. (1999) Electrical communi-cation among olfactory receptor neurons by peripheral waves. Chem.Senses, 24, 576.
Parker, J.M., Chang, Q. and Caprio, J. (2000) Citrate enhances olfactoryreceptor responses and triggers oscillatory receptor activity in thechannel catfish. J. Neurophysiol., 83, 2676–2681.
Reisert, J. and Matthews, H.R. (1997) Effects of sodium removal on theoscillatory response to prolonged stimulation in frog olfactory receptorcells. J. Physiol. (Lond.), 499, 88P.
Reisert, J. and Matthews, H.R. (2001a) Response properties of isolatedmouse olfactory receptor cells. J. Physiol. (Lond.), 530, 113–122.
Reisert, J. and Matthews, H.R. (2001b) Responses to prolonged odourstimulation in frog olfactory receptor cells. J. Physiol. (Lond.), 534,179–191.
Restrepo, D., Miyamoto, T., Bryant, B.P. and Teeter, J.H. (1990) Odorstimuli trigger influx of calcium into olfactory neurons of the channelcatfish. Science, 249, 1166–1168.
Restrepo, D, Boekhoff, I. and Breer, H. (1993) Rapid kinetic measure-
ment of second messenger formation in olfactory cilia from channelcatfish. Am. J. Physiol., 264, C906–C911.
Sato, K. and Suzuki, N. (2000) The contribution of a Ca 2+-activated Cl–
conductance to amino-acid-induced inward current responses of ciliatedolfactory neurons of the rainbow trout. J. Exp. Biol., 203, 253–262.
Sato, K. and Suzuki, N. (2001) Whole-cell response characteristics ofciliated and microvillous olfactory receptor neurons to amino acids,pheromone candidates and urine in rainbow trout. Chem. Senses, 26,1145–1156.
Schild, D., Lischka, F.W. and Restrepo, D. (1995) InsP3 causes an increasein apical [Ca2+]i by activating two distinct current components invertebrate olfactory receptor cells. J. Neurophysiol., 73, 862–866.
Schutter, E. de (2001) Computational Neuroscience: Realistic Modeling forExperimentalists. CRC Press, Boca Raton, FL.
Shibuya, T. and Tucker, D. (1967) Single unit responses of olfactoryreceptors in vultures. In Hayashi, T. (ed.), Olfaction and Taste II.Pergamon Press, New York, pp. 219–233.
Sutterlin, A.M. and Sutterlin, N. (1971) Electrical responses of theolfactory epithelium of Atlantic salmon (Salmo salar). J. Fish. Res. BdCanada, 28, 565–572.
Takagi, S.F. and Shibuya, T. (1960a) Potential oscillations in the lowerolfactory pathway of the toad. Nature, 186, 724.
Takagi, S.F. and Shibuya, T. (1960b) The potential oscillations observed inthe olfactory epithelium, nerve and bulb to the toad and frog. Jpn. J.Physiol., 10, 499–508.
Takagi, S.F. and Shibuya, T. (1961) Studies on the potential oscillationappearing in the olfactory epithelium of the toad. Jpn. J. Physiol., 11,23–27.
Tucker, D. (1975a) The role of respiratory ventilation in reliably obtainingelectrical waves from olfactory mucosa and nerve in response to odorousstimulation. In Ichioka, M. (ed.), Proceedings of the 9th JapaneseSymposium on Olfaction and Taste, Osaka (Tokyo), pp. 16–17.
Tucker, D. (1975b) Waves elicited from peripheral neural tissue (olfactory) inresponse to odorous stimulation. Biophys. J., 15, 271a.
Tucker, D. and Suzuki, N. (1972) Olfactory responses to Schreckstoff ofcatfish. In Schneider, D. (ed.), Olfaction and Taste IV. WissenschaftlicheVerlagsgesellschaft, Stuttgart, pp. 121–127.
Zhang C., Finger, T.E. and Restrepo, D. (2000) Mature olfactory receptorneurons express connexin 43. J. Comp. Neurol., 426, 1–12.
Zufall, F. and Leinders-Zufall, T. (1997) Identification of a long-lastingform of odor adaptation that depends on the carbon monoxide/cGMPsecond-messenger system. J. Neurosci., 17, 2703–2712.
Zufall, F., Firestein, S. and Shepherd, G.M. (1994) Cyclicnucleotide-gated ion channels and sensory transduction in olfactoryreceptor neurons. Annu. Rev. Biophys. Biomol. Struct., 23, 577–607.
Accepted August 7, 2002
Appendix
Differential equations
dx/dt = cn*ix – cn2*x – cm*x
dy/dt = cl*iy – cl2*y
dz/dt = urc*os*uod – os2*z – pk*z + pk2*r
Oscillatory Current Responses of ORNs and Computer Simulation 799

dw/dt = rg*iw*z – rg2*w
dv/dt = iv*a*w – a3*v – a2*v
du/dt = ca*v – pd*u – cd*u
ds/dt = is*ak – ak2*s
dr/dt = pk*z – pk2*r
dq/dt = if*x – ef*q
dp/dt = cc*cam*(q/4) – cc2*p
do/dt = cp*io – cp2*o
dn/dt = ck*in – ck2*n
where
io = cpd – o
in = ckk – n
iv = ac – v
ix = cng – x
iy = cac – y
iw = go – w
urc = rc – z – r
uod = od – z – r
is = pka – s
cd = CDmax*o
cp = CPmax*p
ck = CKmax*p
cm = CMmax*p
a2 = A2max*n
pk = PKmax*s
ak = AKmax*u
pd = PDmax*apd
cn = CNmax*u^N1/(u^N1+ K1^N1)
cl = CLmax*q^N2/(q^N2+ K2^N2)
a3 = A3max*q^N3/(q^N3+ K3^N3)
Definition of functions and parameters, and defaultsettings of these values for numerical calculation
x: concentration of active CNG channels (µM) = 0.0001(x0)
y: concentration of active Ca–Cl channels (µM) = 0.0001(y0)
z: concentration of odorant–receptor complex (µM)= 0.001 (z0)
w: concentration of active Golf (µM) = 0.001 (w0)v: concentration of active AC (µM) = 0.001 (v0)u: concentration of cAMP (µM) = 0.001 (u0)s: concentration of active PKA (µM) = 0.001 (s0)r: concentration of inactive odorant–receptor complex
(µM) = 0.001 (r0)q: concentration of intracellular calcium ions (µM)
= 0.001 (q0)p: concentration of Ca4CAM (µM) = 0.001 (p0)o: concentration of active CAM-PDE (µM) = 0.001 (o0)n: concentration of active CAM-kinase II (µM) = 0.001
(n0)
od: concentration of odorants (µM) = 1.0uod: concentration of unbound odorants (µM)rc: concentration of receptor (µM) = 1.0urc: concentration of unbound receptor (µM)os: rate of odorant binding to receptor (1/µMs) = 0.1os2: rate of odorant dissociation from receptor (1/s) = 2.0pka: concentration of PKA (µM) = 1.0is: concentration of inactive PKA (µM)ak: rate of PKA activation by cAMP (1/s)AKmax: maximal rate of PKA activation by cAMP (1/µMs)
= 0.1ak2: rate of PKA inactivation (1/s) = 1.0pk: rate of receptor inactivation by active PKA (1/s)PKmax: maximal rate of receptor inactivation by active PKA
(1/µMs) = 1.0pk2: rate of reversal of receptor inactivation (1/s) = 0.1go: concentration of Golf (µM) = 1.0iw: concentration of inactive Golf (µM)rg: rate of activation of Golf by odorant–receptor complex
(1/µMs) = 10rg2: rate of inactivation of Golf (1/s) = 2.0ac: concentration of AC (µM) = 5.0iv: concentration of inactive AC (µM)a: rate of AC activation by active Golf (1/µMs) = 2.0ckk: concentration of CAM-kinase II (µM) = 1.0in: concentration of inactive CAM-kinase II (µM)a2: rate of AC inactivation by CAM-kinase II (1/s)A2max: maximal rate of AC inactivation by CAM-kinase II
(1/µMs) = 1 0a3: rate of AC inactivation by calcium ions (1/s)A3max: maximal rate of AC inactivation by calcium ions (1/s)
= 40ca: rate of cAMP synthesis by active AC (1/s) = 40apd: concentration of cAMP-PDE (µM) = 1.0pd: rate of cAMP hydrolysis by cAMP-PDE (1/s)PDmax: maximal rate of cAMP hydrolysis by cAMP-PDE
(1/µMs) = 10cng: concentration of CNG channels (µM) = 1.0
800 N. Suzuki, M. Takahata and K. Sato

ix: concentration of inactive CNG channels (µM)cn: rate of CNG channel activation by cAMP (1/s)CNmax: maximal rate of CNG channel activation by cAMP (1/s)
= 5.0cn2: rate of CNG channel inactivation (1/s) = 10cam: concentration of CAM (µM) = 1.0cc: rate of calcium binding to CAM (1/µMs) = 0.1cc2: rate of calcium dissociation from CAM (1/s) = 1.0cm: rate of CNG channel inactivation by Ca4CAM (1/s)CMmax: maximal rate of CNG channel inactivation by Ca4-
CAM (1/µMs) = 10if: rate of calcium ion influx through CNG channels (1/s)
= 20ef: rate of calcium ion efflux by NCX (1/s) = 10cac: concentration of Ca–Cl channels (µM) = 1.0iy: concentration of inactive Ca–Cl channels (µM)cl: rate of Ca–Cl channel activation by calcium ions (1/s)CLmax: maximal rate of Ca–Cl channel activation by calcium
ions (1/s) = 5.0cl2: rate of Ca–Cl channel inactivation (1/s) = 10
cpd: concentration of CAM-PDE (µM) = 1.0io: concentration of inactive CAM-PDE (µM)cp: rate of CAM-PDE activation by Ca4CAM (1/s)CPmax: maximal rate of CAM-PDE activation by Ca4CAM
(1/µMs) = 10cp2: rate of CAM-PDE inactivation (1/s) = 0.01cd: rate of cAMP hydrolysis by CAM-PDE (1/s)CDmax: maximal rate of cAMP hydrolysis by CAM-PDE
(1/µMs) = 20ck: rate of CAM-kinase II activation by Ca4CAM (1/s)CKmax: maximal rate of CAM-kinase II activation by Ca4CAM
(1/µMs) = 10ck2: rate of CAM-kinase II inactivation (1/s) = 0.01K1: concentration of cAMP at which CNG channel activa-
tion is half-maximal (µM) = 3.4K2: concentration of calcium ions at which Ca–Cl channel
activation is half-maximal (µM) = 5.0K3: concentration of calcium ions at which AC inhibition is
half-maximal (µM) = 0.2N1,2,3: Hill coefficients for the processes = 1.4, 2 and 3
Oscillatory Current Responses of ORNs and Computer Simulation 801
Copyright © 2022 FDOKUMEN