3D printing of layered brain-like structures using peptide modified gellan gum substrates
Upload
khangminh22Category
view
1download
0
DRYING AND REHYDRATION
OF GELLAN GUM GELS
Mattia Cassanelli
A thesis submitted to
The University of Birmingham
For the degree of
DOCTOR OF PHILOSOPHY
School of Chemical Engineering
College of Engineering and Physical Sciences
University of Birmingham
2018

University of Birmingham Research Archive
e-theses repository This unpublished thesis/dissertation is copyright of the author and/or third parties. The intellectual property rights of the author or third parties in respect of this work are as defined by The Copyright Designs and Patents Act 1988 or as modified by any successor legislation. Any use made of information contained in this thesis/dissertation must be in accordance with that legislation and must be properly acknowledged. Further distribution or reproduction in any format is prohibited without the permission of the copyright holder.

I
Abstract
Food drying is an essential process to extend product shelf life by water removal. In
complex food formulations, single ingredients might dry and rehydrate differently, based
on their microstructure and their interaction with water. In this context, hydrocolloids are
often used as gelling agents, thickeners and stabiliser to modulate the product properties.
This thesis aims to advance knowledge in food engineering, investigating the role of the
drying process on gellan gum gel microstructure and the subsequent rehydration from a
structural and molecular perspective.
This research shows, for the first time, the freeze-dried low acyl (LA) gellan gum, high acyl
(HA) and HA:LA mixture gel structures and their properties upon rehydration. The water
interaction with the gel structure is affected by the presence of acyl groups along the HA
gellan gum polymer chain. The rehydration rate was shown to be lower for HA gellan gum
and was not dependent on the polymer concentration.
In the second instance, the effect of the gel pH on the dried structure is studied as well as
the water re-absorption extent and rate. In this part, two drying methods, freeze- and
oven-drying, were performed.
Finally, a comparison of the three drying processes (freeze-, oven- and supercritical fluid
drying) is reported, proposing the effect on the molecular structure by investigation of the
disordered chain domains of the gel network.

II
As supercritical fluid drying requires a pre-treatment in alcohol, its effect on the gellan gum
network was investigated. It is shown how alcohols change the gellan gum configuration,
leading to a considerable variation in gel texture.
A novel supercritical fluid batch rig is also proposed, characterised by high process
flexibility and reduced set-up and energetic costs, and therefore particularly suitable for
small/laboratory-scale use.

III
Acknowledgments
This PhD represents a milestone in my life and my career, three unforgettable years that
have given me unique skills and an incredible personal enrichment. It has been possible
with the support and help of people that I consider special.
Firstly, I would like to thank my supervisors, Professor Ian Norton, Dr Tom Mills and Dr
Valentina Prosapio for their guidance and support throughout my PhD. They believed in
me, reassuring me in difficult periods and motivated me to achieve the best results. They
welcomed me to the EPSRC Centre for Innovative Manufacturing in Food, which funded my
research and where I found great people.
Special thanks goes to Dr Ian Hamilton and Dr Abigail Norton, whose support and
mentorship have been fundamental to overcome difficulties.
I will be always grateful to Lynn Draper, who welcomed me when I first arrived in
Birmingham, younger but less wise then now.
I would like to genuinely thank the entire Food Microstructure Group, in particular Ernesto,
Domenico, Matteo, Federico, Giuseppe, Carlotta, Benedetta, Gaia, Ramona and Fabio, who
made me feel a bit closer home. Thanks to Aris, Yadira, Ourania, Ioanna, Panos, Amir, Amy
Ellis, Chris, John, Richard, Zoe, Kilian, Emmanuelle and all the other friends I have in
Chemical Engineering. Big thanks to all my friends I found in Birmingham.
To my family, who on a daily basis give me their undivided love. I should write another
thesis to explain how important they are to me.
Generally, the most important acknowledgment is left at the end. I leave this “special slot”
to the person who loves me and always believes in me. Thank you Chiara!

IV
Table of Contents
Abstract……………………………………………………………………………………………………………………….……I
Acknowledgements ……………………………………………………………………………………..…………………III
Table of Contents ………………………………………………………………………………………….….……………IV
List of Figures …………………………………………………………………………………………………..…….………XI
List of Tables…………………………………………………………………………………………………………………XXI
Chapter 1. Introduction…………………………………………………………………………………………….1
1.1 Project context………………………………………………………………………………………………..…………2
1.2 Aims…………………………………………………………………………………………………………….…….………3
1. 3 Thesis structure…………………………………………………………………………………………………..….…4
1.4 Publications and presentations………………………………………………………………………….………6
Chapter 2. Literature review……………………………………………………………………………………9
2.1 Introduction…………………………………………………………………………………….………………………10
2.2 Hydrocolloids……………………………………………………………………………………………………………10
2.2.1 Gellan gum………………………………………………………………………………………………………18
2.3 Drying mechanisms in the food industry………………………………………….………………………26
2.3.1 Freeze-drying……………………………………………………………………….…………………………30
2.3.1.1 Pre-treatments and freezing……………………………………………….………………32
2.3.1.2 Collapse temperature………………………………………………….………………………33

V
2.3.1.3 Primary drying………………………………………………………………………….…………34
2.3.1.4 Secondary drying…………………………………………………………………………………38
2.3.2 Air-drying…………………………………………………………………………………..……………………39
2.3.2.1 Heat and mass transport mechanisms…………………………………..……………40
2.3.2.2 Drying kinetics and drying periods………………………………………………………42
2.3.2.3 Vacuum drying……………………………………………………….……………………………46
2.3.3 Supercritical fluid technology………………………………………………………….………………47
2.3.2.1 Supercritical fluid drying………………………………………………..……………………51
2.3.2.2 Supercritical fluid extraction……………………………………….………………………54
2.4 Dried gels…………………………………………………………………………………………………………………59
2.5 Rehydration………………………………………………………………………………………..……………………61
2.6 Conclusions………………………………………………………………………………………………………………62
Chapter 3. Investigation of freeze-dried gellan gum structure: effect of gel
formulation……………………………………………………………………………………..…………………………64
3.1 Introduction……………………………………………………..……………………………..………………………65
3.2 Materials and methods………………………………………………………………………………….…………67
3.2.1 Gel preparation………………………………………………………………………………………67
3.2.2 Molecular interactions: μDSC and FTIR………………………………..…………………68
3.2.3 Texture analysis………………………………………………………………..……………………69
3.2.4 Freeze-drying……………………………………………………………………….…….…………70
3.2.5 Normalised Moisture Content (NMC) and water activity…………....…………71
3.2.6 Drying modelling……………………………………………………………………………………72

VI
3.2.7 Microscopy…………………………………………………………………….………………………73
3.2.8 Static contact angle and wettability…………………………….…………………………74
3.2.9 Rehydration and swelling……………………………………………………………….………74
3.2.10 Rehydration modelling…………………………………………………………………………75
3.2.11 Sugar release……………………………………………………….………………………………75
3.2.12 Sugar release modelling…………………………………………………….…………………76
3.2.13 Statistical analysis……………………………………………………………..…………………77
3.3 Results and discussion……………………………………………………………………………..………………78
3.3.1 Investigation of LA/HA freeze-dried structure………………………..………………78
3.3.1.1 Freeze-drying…………………………………………………………..…………………78
3.3.1.2 Freeze-dried structure………………………………………………….……………87
3.3.1.3 Rehydration and swelling…………………………………………..………………91
3.3.1.4 HA/LA gellan mixture…………………………………………………………………99
3.3.2 Investigation of freeze-dried structure with mannitol or sucrose…………105
3.3.2.1 Gels before freeze-drying……………………………………………….……..…105
3.3.2.2 Freeze-dried gels………………………………………………………………………114
3.3.2.3 Rehydration and leaching…………………………………………………………123
3.4 Conclusions…………………………………………………………………………………….……..………………130
Chapter 4. Acidified/basified gellan gum gels: the role of the structure in
drying/rehydration ………………….………………………………………………..………………………132
4.1 Introduction…………………………………………………………………………………………..………………133
4.2 Materials and methods………………………………………………….……………...………………………135

VII
4.2.2 Gel preparation……………………………………………………………………………………135
4.2.2 Zeta potential…………………………………………………..…………….……………………135
4.2.3 Texture analysis……………………………………………………………………………………136
4.2.4 Post-gelation exposure…………………………………………………………………………136
4.2.5 Molecular interactions: μDSC and FTIR……………………………..…………………136
4.2.6 Freeze-drying……………………………………………………………………………….………136
4.2.7 Oven drying……………………………………………………………………….…………………136
4.2.8 Moisture content analysis…………………………………………….………………………137
4.2.9 Micro computed microscopy (μCT) …………………………………..…………………137
4.2.10 Rehydration…………………………………………………………………………….…………137
4.2.11 Statistical analysis………………………………………………………………………………138
4.3 Results and discussion……………………………………………………………………………………………138
4.3.1 Effect of pH on gel structure and mechanical properties………………………138
4.3.2 Gel drying and rehydration ………………………………………………………….………152
4.4 Conclusions……………………………………………………………………..………………………….…………161
Chapter 5. Gellan gum dried gel structure: molecular and macroscopic
investigations……………………………………………………………………………………………………………162
5.1 Introduction……………………………………………………………………………………………………..……163
5.2 Materials and methods……………………………………………………………………………………….…167
5.2.1 Gel preparation and solvent pre-treatment for sCO2-drying……………..…167
5.2.2 Freeze-drying……………………………………………………………………………….………168
5.2.3 Oven drying …………………………………………………………………………………………168

VIII
5.2.4 scCO2-drying…………………………………………………………………………………………168
5.2.5 Moisture content and water activity………………………………………………….…169
5.2.6 Microstructure characterisation…………………………………………………………..170
5.2.7 Molecular interactions: μDSC and FTIR…………………………………………………172
5.2.8 Texture analysis…………………………………………………………………………..………173
5.2.9 Gel rehydration…………………………………………………………………………….………173
5.2.10 Statistical analysis………………………………………………………………………………173
5.3 Results and discussion……………………………………………………………………………………………173
5.3.1 Role of the drying technique on the low-acyl gellan gum gel structures.173
5.3.1.1 Drying ……………………………………………………………………………………173
5.3.1.2 Dried microstructure: Effect of the water removal ………………...174
5.3.1.3 Dried microstructure: Effect of the process parameters…….…….180
5.3.1.4 Gel rehydration……………………………………………………………….………183
5.3.1.5 Effect on gellan gel molecular structure…………………………..………185
5.3.2 Effect of alcohols quality on gellan gum gel structure…………………………190
5.3.2.1 Alcoholic pre-treatment on gellan molecular level…………….……190
5.3.2.2 Alcoholic pre-treatment on gellan macroscopic level…………..…198
5.3.2.3 Comparison with gelatin and k-carrageenan………………………..…205
5.4 Conclusions……………………………………………………………………………………………………………206
Chapter 6. Design of a cost-reduced bench-scale plant for supercritical-fluid-
assisted applications………………………………………………………………………………………………209
6.1 Introduction……………………………………………………………………..……………………………………210

IX
6.2 Materials and methods……………………………………………………………………….…………………212
6.2.1 Materials……………………………………………………………………………………………212
6.2.2 Rig description and procedure……………………………………………………………213
6.2.3 Thermodynamics…………………………………………………………….…………………216
6.2.3.1 Equation of state (EOS) …………………………………………………………216
6.2.3.2 Method for calculation of CO2 amount…………………………….……219
6.2.4 Experimental procedures……………………………………………………..……………222
6.2.4.1 Gel drying………………………………………………………………………………222
6.2.4.2 Freeze-dried gel impregnation with vitamin E………………….……223
6.2.4.3 Caffeine extraction……………………………………………..…………………223
6.2.5 Characterization methods………………………………………………………….……224
6.2.5.1 Gel drying………………………………………………………………………………224
6.2.5.2 Freeze-dried gel impregnation with vitamin E…………………….…224
6.2.5.3 Caffeine extraction…………………………………………………………………225
6.2.6 Cost analysis………………………………………………………………………..……………225
6.3 Results and discussion……………………………………………………………………………………………226
6.3.1 Gel drying………………………………………………………………………..………………226
6.3.2 Freeze-dried gel impregnation with vitamin E…………………………………227
6.3.3 Caffeine extraction…………………………………………………….……………………229
6.3.4 Cost analysis…………………………………………………………………….………………230
6.3.4.1 Set-up costs……………………………………………………………………………230
6.3.4.2 Running costs…………………………………………………………………………231
6.4 Conclusions………………………………………………………………………………..………………….………234

X
Chapter 7. Conclusions and suggestions for future work………………….…………235
7.1 Investigation of freeze-dried gellan gum structure: effect of gel formulation………….236
7.2 Acidified/basified gellan gum gels: the role of the structure in drying/rehydration….238
7.3 Gellan gum dried gel structure: molecular and macroscopic investigations…………….239
Chapter 8. References……………………………………………………………………………….……….…242

XI
List of Figures
Figure 2.1: Schematic illustration of the “sol-gel” transition……………………..…………………11
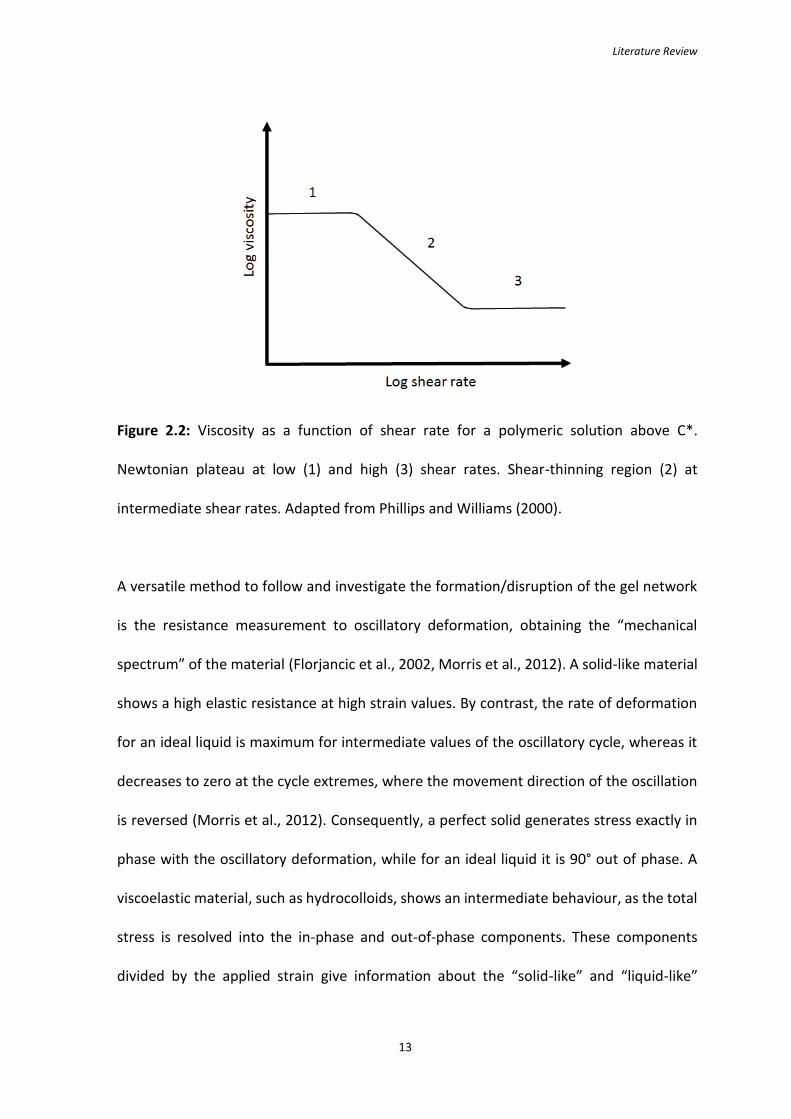
Figure 2.2: Viscosity as a function of shear rate for a polymeric solution above C*.
Newtonian plateau at low (1) and high (3) shear rates. Shear-thinning region (2) at
intermediate shear rates. Adapted from Phillips and Williams (2000)..………………………….13
Figure 2.3: G’, G’’ as a function of shear rate frequency: (A) 1% xanthan gum solution, (B)
1.5% amylose gels. Adapted from Phillips and Williams (2000)…………………………………….15
Figure 2.4: Schematic representation of some molecular structures of pure gels (Aguilera
and Stanley, 1999): (A) Cross-linked, (B) Triple-helices (gelatin), (C) Egg-box structures
(pectin and alginate) in the presence of calcium cations, (D) Aggregated domains
(carrageenan and gellan gum), (E) Double helices in bundles (agarose), (F) Particulate gels
(globular proteins)…………….………………………………………………………………………………………..16
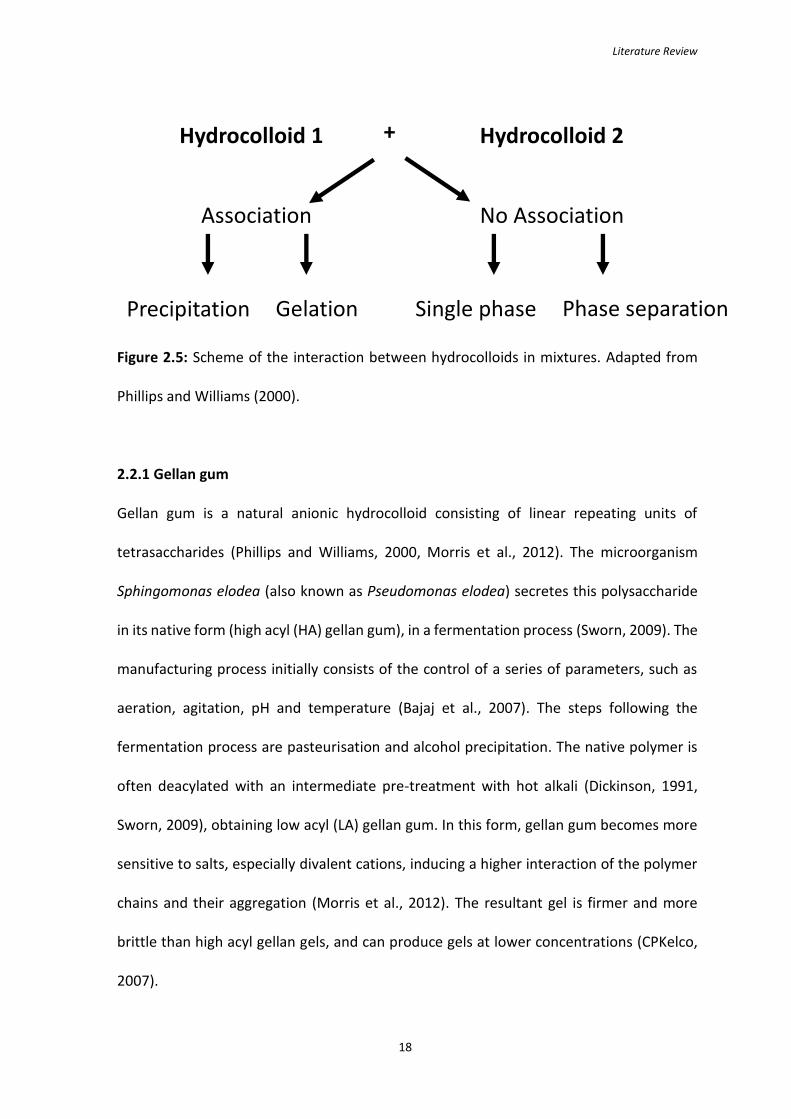
Figure 2.5: Scheme of the interaction between hydrocolloids in mixtures. Adapted from
Phillips and Williams (2000)………………………………………………………………………………………..18
Figure 2.6: High acyl gellan gum (A) and low acyl gellan gum (B) units. Adapted from Mahdi
et al. (2015)………………………………………………………………………………….……………………………..19
Figure 2.7: G’(circles) and G’’ (triangles) as a function of temperature. Measurements at
0.1 rad/s and 0.5 °C /min: heating (filled symbols) and cooling (open symbols) and heating.
Different gellan gum concentrations (A) 1 wt%, (B) 2 wt% and (C) 3 wt%. Adapted from
Miyoshi and Nishinari (1999b)…..…………………………………………………………………………………20

XII
Figure 2.8: “Cation-mediated aggregate” model for gellan gum. Double helix aggregation
is promoted by the presence of cations (filled circles). Adapted from Robinson and
Manning (1991)…………………………………………………………………..………………………………………21
Figure 2.9: Textural properties of different hydrocolloids. Adapted from Phillips and
Williams (2000)…………………………………………………………………………………………………………...23
Figure 2.10: Suggested models for binary hydrocolloid mixtures (Dickinson, 1991). (A)
Only one hydrocolloids forms the gel network, (B) one polymer forms an
interpenetrating” network in the other, (C) demixing and following gelation of both
hydrocolloids form a phase-separated network, (D) intermolecular binding forms a
coupled network…………………………………………………………………………………………………………..24
Figure 2.11: Food stability map: food deterioration rate as a function of moisture content
and water activity. Adapted from Ariyawansa (2000)..…………………………..…………………….27
Figure 2.12: Schematic freeze-drying system. Adapted from Barbosa-Cánovas and Vega-
Mercado (1996)…………………………………………………………………………………………………………..31
Figure 2.13: Freeze-drying cycle on the water phase diagram. “Actual” means how the
real process occurs: the system passes from 2 to 5, then it reaches 3, forming a cycle...36
Figure 2.14: Sublimation rate as a function of chamber pressure, shelf and product
temperature: example of primary drying. Adapted from Rey and May (2010)……..……….37
Figure 2.15: Typical configurations of air-dryers. Grey arrows refer to material to be dried
and black arrows to air. Adapted from Mujumdar (2014)…………………………………………….40
Figure 2.16: Typical rate of drying curve as a function of time. Adapted from Mujumdar
(2014)……..………………………………………………………………………………………………………………….42

XIII
Figure 2.17: Mass and heat transfer processes through. Adapted from Aguilera and
Stanley (1999)……………………………………………….…..…….…………………………………………………..44
Figure 2.18: Generic phase diagram. The supercritical state is formed above the critical
point. Adapted from Nalawade et al. (2006)..………………………………………………………………48
Figure 2.19: Illustration of supercritical state formation. Presence of gas-liquid interface
below the critical point (1-3). Homogeneous phase as the critical point is reached (Brown,
2010)……………………………………………………………………………………………………………………………48
Figure 2.20: Generic isotherm phase diagram for a binary system CO2/solvent. Adapted
from Akien and Poliakoff (2009)...………………………………………………………………………………...50
Figure 2.21: Illustration of a typical SCF drying process. Adapted from Wang (2008).……52
Figure 2.22: H2O-CO2 system: isotherm diagram expressing the presence of mixture
liquid-gas. Adapted from Takenouchi and Kennedy (1964)…………..……………………………….54
Figure 2.23: Example of crossover pressure for phenanthrene in scCO2. Mole fraction
solubility (y) as function of pressure and temperature. Adapted from Gupta and Shim
(2006)….………………………………………………………….…………………………………………………………..56
Figure 2.24: Polymer chains of the Ls-36 and Ls-45 surfactants. Adapted from Liu et al.
(2002)…………………………………………………………………………………………………………………………..59
Figure 2.25: Scheme of dried gels after air-drying (xerogel), freeze-drying (cryogel) and
using supercritical fluids (aerogel). Adapted from Rolison and Dunn (2001)………………….61
Figure 3.1: Water activity (aw) as a function of drying process time and LA (A), HA (B) gellan
gum content………………………………………………………………………………………………………………...80
Figure 3.2: Desorption isotherms at 25 °C: () LA gellan 2 wt% and () HA gellan 2 wt%.84
XIV
Figure 3.3: Moisture content ratio (MR) for LA gellan gum (A) and HA gellan gum (B) both
at 2 wt% as a function of drying process time. Experimental average values are
reported……………………………………………………………………………………………………………………….85
Figure 3.4: Moisture ratio (MR) vs water activity for LA (blue stars) and HA (red circles)
gellan gum. Mass fraction at 2 wt%.………………………………………………………………………………86
Figure 3.5: Microstructures by µCT: 2 wt% LA gellan gum (A) and HA gellan gum (B)…….88
Figure 3.6: Pore distribution after freeze-drying. Percentage is referred to the total pore
volume. ………………………………………………………………………………………………………………………89
Figure 3.7: Microstructures by optical microscope: 2 wt% LA gellan gum (A) and HA gellan
gum (B). ………………………………………………………………………………………………………………………90
Figure 3.8: Rehydration expressed as NMC as a function of rehydration time and LA (A),
HA (B) gellan gum content. The final value of rehydration, after 24 hours, is expressed in
the legend. …………………………………………………………………………………………………………………..92
Figure 3.9: Rehydration expressed as NMC (x(t) in table 3.2) as a function of rehydration
time for ha and LA gellan gum 2 wt%. The model used is Peleg. ……………………………………94
Figure 3.10: HA and LA gellan gum gels before drying, freeze-dried gels and after 30-
minute/24 hour rehydration. ……………………………………………………………………………………….95
Figure 3.11: Peak force for LA (A) and HA (B) gellan gum gels as a function of polymer
content…………………………………………………………………………………………………………………………96
Figure 3.12 Pore distribution after freezing the gels in liquid nitrogen and freeze-drying.
Percentage is referred to the total pore volume. ………………………………………………………….98
Figure 3.13: 1:1 HA/LA mixture at 2 wt%: water activity vs time (A), drying kinetics (B).100

XV
Figure 3.14: Rehydration expressed as NMC as a function of rehydration time. La gellan 2
wt% (), HA gellan 2 wt% (), LA + HA 1:1 2 wt% (). The final value of rehydration,
after 24 hours, is expressed in the legend. ………………………………………………………………….101
Figure 3.15: μDSC curves for LA, HA gellan and 1:1 mixture at 2 wt%. The μDSC curves are
plotted as an average of the first cycles in triplicate. Peak temperatures and enthalpy
values are reported in Table 3.5. The individual μDSC curves have been offset on the y-
axis. ……………………………………………………………………………………………………………………………102
Figure 3.16: Microstructure by µCT: 1:1 HA/LA mixture at 2 wt%. Gel before drying (A),
freeze-dried gel (B). ……………………………………………………………………………………………………104
Figure 3.17: Peak force (A) and Young’s modulus (B) as a function of sugar type (
sucrose, mannitol) and content. Gellan gum without sugars ()……………………………106
Figure 3.18: μDSC curves on cooling for gellan/sucrose (A) and gellan/mannitol (B). The
μDSC curves are plotted as an average of the first cycles in triplicate. Peak temperatures
and enthalpy values are reported in Table 3.7. The individual μDSC curves have been
offset on the y-axis……………………………………………………………………………………………………..108
Figure 3.19: Peak temperature as a function of sugar type (C) ( sucrose, mannitol)
and content. Gellan gum without sugars ().……………………………………………………………..109
Figure 3.20: Entropy difference (ΔS) as a function of sugar type ( sucrose, mannitol)
and content. Data are referred on cooling and are related to the μDSC curves in Fig 3.18
A-B. ……………………………………………………………………………………………………………………………110
Figure 3.21: FTIR spectra for gellan/sucrose (A) and gellan/mannitol (B). Red line is related
to LA gellan gum gel, green to pure sucrose or mannitol, blue to LA gellan gum + 20 wt%
sugar. The peak wave numbers are referred to gellan/sucrose and gellan/mannitol…..113

XVI
Figure 3.22: Water activity (aw) as a function of sugar type ( sucrose, mannitol) and
content. Gellan gum without sugars ().…………………………………………………………………….114
Figure 3.23: µCT, freeze-dried microstructures: 2 wt% LA gellan gum (A), 2 wt% LA gellan
gum + 20 wt% sucrose (B), 2 wt% LA gellan gum + 20 wt% mannitol (C). Gel before drying,
2 wt% LA gellan gum (D, reference). ……………………………………………………………………………116
Figure 3.24: Pore size distribution (A) and pore-wall thickness distribution (B) for freeze-
dried LA gellan gum + 20 wt% sugar (grey-sucrose, black-mannitol). Freeze-dried LA gellan
gum is in red. ………………………………………………………………………………………………………………119
Figure 3.25: ESEM, freeze-dried microstructures: 2 wt% LA gellan gum (A), 2 wt% LA gellan
gum + 20 wt% sucrose (B, C), 2 wt% LA gellan gum + 20 wt% mannitol (D, E)……………...121
Figure 3.26: Force (N) vs distance (mm) for dried gellan/sucrose (blue) and
gellan/mannitol (green). Red solid line refers to the dried gel without sugars…..………….122
Figure 3.27: Rehydration expressed as NMC over time as a function of sucrose (A) or
mannitol (B) and content. ………………………………………………………………………………………….124
Figure 3.28: Sugar release over time as a function of sucrose (A) or mannitol (B) and
content. ……………………………………………………………………………………………………………………..127
Figure 3.29: Dissolution process: Higuchi model (Eq. 3.9) for both 10 wt% gellan/sucrose
and gellan/mannitol. ………………………………………………………………………………………………….129
Figure 4.1: Peak force (A) and elastic modulus (B) as a function of LA gellan gum (2% w/w)
gel pH. ……………………………………………………………………………………………………………………….139
Figure 4.2: Acidified/basified LA gellan gum gels (2% w/w). ……………………………………….140
Figure 4.3: Electrophoretic mobility of LA gellan gum at 0.1% w/w as a function of gel
solution pH………………………………………………………………………………………………………………...141

XVII
Figure 4.4: Peak force (A) and elastic modulus (B) as a function of LA gellan gum (2% w/w)
gel pH and exposure to distilled water, acid (pH 2.5) or basic (pH 11.5) solutions for 24 h.
…………………………………………………………………………………………………………………………………..144
Figure 4.5: Peak force of 2% w/w LA gellan gum (natural pH) as a function of the exposure
medium pH………………………………………………………………………………………..……………………….146
Figure 4.6: Peak force as a function of LA gellan gum concentration at natural pH (5.2) and
pH 3.5. …………………………………………………………………………………….…………………………………147
Figure 4.7: μDSC thermograms for acidified/basified gels (2% w/w) on cooling (A) and
heating (B). A magnification of the curve on heating related to gel at pH 5.2 is reported
(B). The μDSC curves are plotted as an average of the first cycles in triplicate and offset
on the y-axis. Peak temperatures and enthalpy values are reported in Table 4.2…………149
Figure 4.8: FT-IR spectra for acidified gels (2% w/w). …………………………………………………..151
Figure 4.9: Drying kinetics curves for 2% w/w LA gellan gum expressed as NMC over time:
(A) freeze-drying; (B) oven-drying at 50 °C…………………………………………………………………..153
Figure 4.10: Rehydration curves for 2% w/w LA gellan gum expressed as NMC over time.
The dried samples were placed in distilled water after freeze-drying (A) and oven-drying
(B). ……………………………………………………………………………………………….……………………………155
Figure 4.11: 24-hour rehydrated samples (2% w/w) after freeze-drying (A) and oven-
drying (B). Gel comparison (pH 4) on rehydration after freeze-drying (C) and oven-drying
(D). ……………………………………………………………………….……………………………………………………158
Figure 4.12: Peak force (A) and elastic modulus (B) of dried and rehydrated gels (2% w/w)
as a function of their pH. ……………………………………………………………………………………………160
Figure 5.1: Shrinkage measurement method: formula (eq. 5.1) on the top………………….171
XVIII
Figure 5.2: LA gellan gum 2 % w/w, visual comparison: freeze-dried (A), oven-dried (60 °C)
(B), scCO2-dried (50 °C and 100 bar, no flow) (C), hydrogel before drying (reference, D).174
Figure 5.3: LA gellan gum 2 % w/w, µCT: freeze-dried (A), oven-dried (60 °C) (B), scCO2-
dried (50 °C and 100 bar, batch) (C), hydrogel before drying (reference, D)…………………176
Figure 5.4: LA gellan gum 2 % w/w, ESEM images: freeze-dried (A, D), oven-dried (60 °C)
(B, E), scCO2-dried (50 °C and 100 bar, batch) (C,F)………………………………………………………178
Figure 5.5: µCT: 2% w/w LA gellan gum after oven-drying at 20 °C (A) and 60 °C (B)……182
Figure 5.6: µCT: 2% w/w LA gellan gum after process in semi-continuous configuration
applying 1 mL/min (A) and 2.5 L/min flow (B). Temperature was set at 50 °C and pressure
at 100 bar. ………………………………………………………………………………………………………………….183
Figure 5.7: Rehydration curves after different drying processes () freeze-drying, ()
oven-dried (60 °C), () scCO2-dried (50 °C and 100 bar, batch). …………………………………184
Figure 5.8: μDSC curves for the gellan gum hydrogel before drying. Heating/cooling cycles
were applied from 5 °C to 80 °C (A) and from 5 °C to 60 °C (B). ……………………………………186
Figure 5.9: μDSC curves after drying process on cooling. The μDSC curves are plotted as
an average of the first cycles in triplicate. Peak temperatures and enthalpy values are
reported in Table 5.2. The individual μDSC curves have been offset on the y-axis………..187
Figure 5.10: FT-IR spectra for LA Gellan gum and ethanol: (A) (4000-600 cm-1), (B) (2000-
600 cm-1). The peaks values are related to the alcogel………………………………………………...191
Figure 5.11: DSC curves: LA gellan gum on heating (A) and cooling (B). The μDSC curves
are plotted as an average of the first cycles in triplicate. The individual μDSC curves have
been offset on the y-axis. ………………………………………….………………………………………………..193

XIX
Figure 5.12: DSC curves: LA gellan gum treated with different ethanol concentrations. The
μDSC curves are plotted as an average of the first cycles in triplicate. The individual μDSC
curves have been offset on the y-axis. …………………………………………………………………………195
Figure 5.13: FT-IR spectra for LA Gellan gum with 1-propanol (A) and isopropanol (B). The
peaks values are related to the alcogel. ………………………………………………………………………197
Figure 5.14: Ethanol treatment: directly by using a specific concentration (wt%) (black
bars) and through ethanol gradient (grey bars). ………………………………………………………….198
Figure 5.15: Peak force for LA Gellan gum treated with ethanol……………………..…………..200
Figure 5.16: Peak force for LA Gellan gum treated with 1-propanol and 2-propanol……201
Figure 5.17: True stress vs true strain for LA gellan gum as a function of solvent quality
after complete gradual treatment. ……………………………………………………………………………..203
Figure 5.18: Young’s modulus for LA gellan gum as a function of the solvent concentration.
The collected data are related to a gradual solvent treatment up to the specific
concentration. ……………………………………………………………………………………………….204
Figure 5.19: DSC curves: gelatin (top) and k-carrageenan (bottom) on heating and cooling.
The μDSC curves are plotted as an average of the first cycles in triplicate. The individual
μDSC curves have been offset on the y-axis. ……………………………………………………………….206
Figure 6.1: Schematic representation of the designed rig. The pressure vessel (PV)
geometry is highlighted on the right. Solvents or active compounds are placed below the
sample. ………………………………………………………………………………………………………………………214
Figure 6.2: Process steps reported on the CO2 phase diagram: (1a) CO2 cylinder in vapour-
liquid equilibrium; (1b) vessel filled with CO2; (2) CO2 critical point; (3) working
condition…………………………………………………………………………………………………………………….215

XX
Figure 6.3: Generic isotherm phase diagram for a binary system CO2/solvent adapted
from (Akien and Poliakoff, 2009). ……………………………………………………………………………….220
Figure 6.4: Proposed method for CO2 calculation. The constraints are represented by “ >”.
The subscript 1 is referred to CO2, whereas 2 is referred to EtOH………………………………….221
Figure 6.5: Photo of LA gellan gum gel (left) and aerogel produced at 50 °C (right)……..226
Figure 6.6: Pore distribution after scCO2-drying (at 50 °C and 100 bar)………………………..227
Figure 6.7: FT-IR spectra of HA/LA gellan, α-tocopherol and HA/LA gellan+α-
tocopherol......................................................................................................................228

XXI
List of Tables
Table 2.1: Typical values of physical properties for gas, liquid and SCF. Adapted from
Brunner (2005)....………………………………………………………………………………………………………….49
Table 2.2: Critical pressures and temperatures of common supercritical fluid. Adapted
from Brown (2010)……………………………………………………………………………….…..……………………50
Table 2.3: Critical temperature/pressure for EtOH/CO2 binary mixture as a function of
EtOH mol %. Adapted from Reid et al. (1987)………………………………………………….………………58
Table 3.1: Models used for freeze-drying. …………………………………………………………….………72
Table 3.2: Peleg model for rehydration. ……………………………………………………………..…………74
Table 3.3: Parameters used for the Higuchi model at 10 wt%…………………..…………………….77
Table 3.4: Difference in peak load after freezing and thawing compared to the gels before
drying. …………………………………………………………………………………………………………..………………98
Table 3.5: Peak temperatures and enthalpies of thermal transitions on cooling for LA gellan
gum 2 wt%, HA gellan gum 2 wt% and their mixture (1:1) at 2 wt%. These values were
calculated from Fig. 3.15. …………………………………………………………………………..………….……103
Table 3.6: Gel swelling (weight) after 24 hours in distilled water. Values are compared to
the initial gel weight, before freeze-drying. …………………………………………………………………104
Table 3.7: Peak temperatures, enthalpies and entropies measured on cooling as a function
of mannitol or sucrose content. These values were calculated from Fig. 3.19………………..111
Table 3.8: Contact angle as a function of sucrose and mannitol contents. LA gellan gum is
kept at 2 wt%.………………………………………………………………………………………………………………125

XXII
Table 4.1: Peak temperature and enthalpy of thermal transitions on cooling for LA gellan
gum at 2% w/w as a function of gel pH. These values were calculated from Fig. 4.7……..150
Table 4.2: Water content percentage before drying for acidified LA gellan gum gels at 2%
w/w. The gel pH was adjusted by adding citric acid…………………………………….…………………156
Table 5.1: Bulk densities and shrinkage values.…………………………………………………….………179
Table 5.2: Peak temperatures, enthalpies and entropies for the gel before drying and after
the drying process, followed by rehydration for 6 hours.………………………………………………189
Table 6.1: Experimental caffeine concentration expressed as a molar fraction after
extraction in supercritical CO2………………………………………………………………..…………………….229
Table 6.2: Cost indexes of the different components that can be part of a rig equipped with
a 150 mL vessel. …………………………………………………………………………………..………………………230
Table 6.3: Current power requirements of the rig devices. …………………………………..………232
Table 6.4: Average process step times needed for a rig equipped with a 150 mL vessel…232
Table 6.5: Energy consumption calculation for each process step for a rig equipped with a
150 mL vessel. ……………………………………………………………...…………………………………….………233

1
Chapter 1
Introduction
Introduction
2
1.1 Project context
Under the growing influence of agricultural engineering in the mid-20th century, food
science and engineering emerged, gaining a continuous interest (Karel, 1997, Saguy et al.,
2013). Food science and engineering embraces chemical, biological, physical and
engineering concepts with the intention to study and advance the knowledge within the
food industry (Bhandari, 2012).
Niranjan (2016) divided food engineering into five main areas:
Food product manufacturing;
Food structure engineering and sensory testing;
Food sustainability, environmental impact and security;
Health, transport processes in the GI tract, metabolism and satiety;
Food formulation, safety and quality.
In this context, the drying of food is principally located in the first and second areas, as it
is based on the research into drying kinetics, generated dried structure and subsequent
rehydration/solute release. However, the drying process crosses the other areas,
especially in terms of food safety and quality, since an essential requirement is to avoid
spoilage (Barbosa-Cánovas et al., 2008).
It is clear how food drying is a fundamental process to extend shelf life, improving storage
and preservation (Mujumdar, 2014). In addition, the water removal from the food product
and, therefore, weight reduction also brings economic benefits, especially in terms of the
reduction of transport costs (Mujumdar, 2014).
The investigation of the drying mechanisms, through a microstructural approach (Norton
and Foster, 2002), aims to enhance the quality of the final product as well as improving

Introduction
3
the drying process (Ratti, 2001). Since most of the dried food products require rehydration
before consumption to recover the initial properties and texture (Marabi et al., 2006), it
remains fundamental to combine the evaluations on the dried material with the
rehydration process. In parallel, depending on the specific formulation and the presence
of solute that can be leached into water, the release of compounds and substances might
occur. Solute release needs to be considered together with rehydration, providing a whole
picture of the “Drying and Rehydration in the Food Industry”.
1.2 Objectives
The current use of gelling agents, stabilisers and thickeners result in more complex food
products, varying their chemical and physical properties also throughout the drying and
rehydration processes.
Among the common hydrocolloids, low and high acyl gellan gum have a similar backbone
structure, yet their mechanical properties are completely different due to the presence of
substituents along the polymer chain. The possibility to blend them in synergistic
combinations might give the possibility to simulate the mechanical properties of other
hydrocolloids generally used in the food industry, even at low polymer concentrations.
This thesis aims to understand and investigate the hydrocolloid behaviour, specifically for
gellan gum chosen as gel model system, on drying and rehydration.
Knowledge within the food industry has been enhanced as follows:
Investigation of drying kinetics and generated dried structure of complex gellan gum gel
systems in freeze-drying and study of the rehydration process. Characterising behaviour

Introduction
4
of low and high acyl gellan gum mixtures and combination of low acyl gellan gum with low
molecular weight compounds (mannitol and sucrose).
Design and engineering of acidified/basified gellan gum gels for drying/rehydration
applications.
Understanding of the impact of the water removal mechanism (i.e. sublimation,
evaporation and solvent replacement) on the gel microstructure.
Study of water removal by alcoholic dehydration and solvent quality in low acyl gellan gum
gels.
Design and development of a novel and cost-reduced supercritical fluid rig for industrial
applications (drying, extraction, impregnation of active compounds).
1.3 Thesis structure
The relevant literature to date is reviewed (Chapter 2) to contextualise the overall project,
introducing the three main results sections.
Chapter 3 is the first results section that reports information about the effect of the gel
formulation on the freeze-dried gel structure and subsequent rehydration. This chapter is
divided into two main parts: Section 3.3.1 investigates how the gel type (low and high acyl
gellan gum) affects the drying and rehydration processes to more deeply comprehend the
behaviour of their mixture. Section 3.3.2 evaluates a more complex system, consisting of
low acyl gellan and low molecular weight compounds (mannitol and sucrose), throughout
freeze-drying.
Chapter 4 embeds the previous findings on the gel formulation and freeze-drying to design
acidified/basified low acyl gellan gum gels for drying and rehydration applications. In

Introduction
5
parallel to freeze-drying, oven-drying is investigated, and the resulting gel structure is
compared with the freeze-dried gel.
The following chapter (Chapter 5) is split into two main sections; Firstly, Section 5.1
investigates the role of the water removal of three drying processes (i.e. sublimation,
evaporation and solvent replacement) on the gel structure. The formulation of the low acyl
gellan gum gels is kept constant, highlighting the impact of the drying technique on the
dried structure at both the molecular and macroscopic levels. Secondly, Section 5.2 aims
to evaluate the effect of alcohols (i.e. ethanol, 1-propanol, 2-propanol) on the gel
structure, as the solvent replacement/extraction by using supercritical carbon dioxide
requires an alcoholic pre-treatment. Specifically, the effect on the polymer chains and
network is shown.
Based on the use of supercritical carbon dioxide as a method of drying discussed in Chapter
5, Chapter 6 proposes the design and development of a supercritical fluid rig, as a novel
instrumentation. This chapter highlights this technology suitable for batch applications on
a laboratory scale.
In the final part (Chapter 7), the conclusions as well as the main outcomes of this research
are reported and the future work is suggested.
All the references are listed in Chapter 8.

Introduction
6
1.4 Publications and presentations
The results obtained throughout this study have been published as follow:
Publications:
Cassanelli, M., Norton, I. & Mills, T. (2018). Role of gellan gum microstructure in freeze
drying and rehydration mechanisms. Food Hydrocolloids, 75, 51-61.
Cassanelli, M., Norton, I., & Mills, T. (2018). Interaction of mannitol and sucrose with gellan
gum in freeze-dried gel systems. Food Biophysics, 13, 304-315.
Cassanelli, M., Prosapio, V., Norton, I., & Mills, T. (2018). Acidified/basified gellan gum gels:
the role of the structure in drying/rehydration mechanisms. Food Hydrocolloids, 82, 346-
354.
Cassanelli, M., Prosapio, V., Norton, I., & Mills, T. (2018). Design of a cost-reduced flexible
plant for supercritical-fluid-assisted applications. Chemical engineering and technology,
DOI: 10.1002/ceat.201700487.
Cassanelli, M., Norton, I., & Mills, T. (2017). Effect of alcohols on gellan gum gel structure:
bridging the molecular level and the three-dimensional network. Food Structure, 14: 112-
120.

Introduction
7
Oral presentations
Cassanelli, M., Norton, I., Mills T., Investigation of gel structure in freeze-drying process,
1st Early Career Conference, Birmingham, 2015.
Cassanelli, M., Norton, I., Mills T., Drying techniques in the food industry, 2nd EPSRC Centre
for Innovative Manufacturing (CIM) in Food, Loughborough, 2016.
Cassanelli, M., Norton, I., Mills T., Drying techniques in the food industry, 8th International
Food Factory Conference, 2016, Laval, France.
Cassanelli, M., Norton, I., Mills T., Correlation between food drying techniques and gel
rehydration rate by porosity modulation, 3rd EPSRC Centre for Innovative Manufacturing
(CIM) in Food, Birmingham, 2017.
Cassanelli, M., Norton, I., Mills T., Interaction of mannitol and sucrose with gellan gum in
freeze-dried gel systems, 3rd UK Hydrocolloids Symposium, Sutton Bonington, Nottingham,
2017.
Cassanelli, M., Norton, I., Mills T., The Food Industry: Investigation of Drying Mechanisms,
3rd Early Career Conference, Birmingham, 2017.

Introduction
8
Poster presentations:
Cassanelli, M., Norton, I., Mills T., Investigation of gel structure in freeze-drying process,
2nd UK Hydrocolloids Symposium, Birmingham, 2015.
Cassanelli, M., Norton, I., Mills T., Drying techniques in the food industry, EPS Research
Conference, Birmingham, 2016.

9
Chapter 2
Literature Review

Literature Review
10
2.1 Introduction
The aim of this chapter is to review the most relevant literature to date related to this
research. Before providing information about gellan gum, which is the material used in this
project, a general overview about the hydrocolloids in the food industry is presented. In
the second part of this chapter the drying methods (freeze, air and supercritical fluid
drying) involved in this study are reviewed, especially highlighting the effect on the gel
structure.
2.2 Hydrocolloids
Hydrocolloids are polymeric materials, either proteins or polysaccharides, that form three-
dimensional cross-linked structures through the gelation mechanism (Phillips and
Williams, 2000, Gulrez et al., 2011, Rizwan et al., 2017) and are characterised by
viscoelastic properties (Saha and Bhattacharya, 2010). They are produced from a range of
natural and synthetic polymers, characterised by a high water absorption and retention
(Gulrez et al., 2011) due to the presence of a large number of hydroxyl (-OH) groups along
the polymer chains (Saha and Bhattacharya, 2010, Rizwan et al., 2017). Hydrocolloids are
widely used in different industrial sectors, and especially in the food industry, for their
function of thickener, emulsifier, gelling agent, flavour release controller, stabiliser and fat
replacer (Phillips and Williams, 2000, Milani and Maleki, 2012, McClements, 2015).
The most common hydrocolloids used as gelling agents in the food industry are gelatin,
gellan, carrageenan, alginate, agar and pectin (Phillips and Williams, 2000, Williams and
Phillips, 2002), often present in the formulation of food products, such as ice creams,

Literature Review
11
cakes, jams, candies and jellies (Saha and Bhattacharya, 2010, Piccone et al., 2011, Goff
and Hartel, 2013).
The ability to form gels is specific for a class of hydrocolloids, whereas the water-
thickening properties are specific for all hydrocolloids (Saha and Bhattacharya, 2010,
Sundar Raj et al., 2012). Moreover, different hydrocolloids are often mixed in a synergistic
way to provide food products with new and improved rheological as well as textural
attributes (Phillips and Williams, 2000, Milani and Maleki, 2012).
In addition to the applications for the food texture and rheology design, hydrocolloids have
been used for their prebiotic effects (Phillips and Williams, 2000), in weight-loss
programmes (Paeschke and Aimutis, 2008) and for their nutraceutical benefits as
cholesterol reducers (Imeson, 2011).
The formation of the gel network occurs by a gelation mechanism, the so-called “sol-gel”
transition, which takes place by either a physical gelation or by chemically cross-linking
(Nishinari et al., 2000, Gulrez et al., 2011). Initially, the polymer is dispersed in water,
forming the “sol”. As the chains crosslink, the polymer molecular weight increases,
decreasing its solubility and generating a continuous network, which consists of an
“infinite polymer” (“gel”) (Gulrez et al., 2011), as schematically reported in Fig. 2.1.
Figure 2.1: Schematic illustration of the “sol-gel” transition.

Literature Review
12
Hydrocolloids can be solubilised, resulting in them having a specific critical concentration
C*, a function of the polymer molecular weight, above which the transition from the so-
called “dilute region” to the “semi-dilute” region occurs (Phillips and Williams, 2000).
Below the critical concentration, the molecules are free to flow and can independently
move in solution and the system behaves as a Newtonian fluid (Phillips and Williams,
2000).
On the other hand, as soon as the polymer concentration becomes higher than the critical
value, a marked increase in the viscosity of the polymer solution occurs due to the
molecule interpenetration (Phillips and Williams, 2000). In terms of viscosity-shear rate
profile, three different regions are typically observed above C*(Fig. 2.2) (Phillips and
Williams, 2000):
1. Newtonian plateau at low shear rates, where the disruption rate of entanglements is lower
than the rate of re-entanglement.
2. Shear-thinning region, where the disruption of entanglements predominates, resulting in
a viscosity decrease to a minimum Newtonian plateau.
3. Newtonian plateau at high shear rates.
Literature Review
13
Figure 2.2: Viscosity as a function of shear rate for a polymeric solution above C*.
Newtonian plateau at low (1) and high (3) shear rates. Shear-thinning region (2) at
intermediate shear rates. Adapted from Phillips and Williams (2000).
A versatile method to follow and investigate the formation/disruption of the gel network
is the resistance measurement to oscillatory deformation, obtaining the “mechanical
spectrum” of the material (Florjancic et al., 2002, Morris et al., 2012). A solid-like material
shows a high elastic resistance at high strain values. By contrast, the rate of deformation
for an ideal liquid is maximum for intermediate values of the oscillatory cycle, whereas it
decreases to zero at the cycle extremes, where the movement direction of the oscillation
is reversed (Morris et al., 2012). Consequently, a perfect solid generates stress exactly in
phase with the oscillatory deformation, while for an ideal liquid it is 90° out of phase. A
viscoelastic material, such as hydrocolloids, shows an intermediate behaviour, as the total
stress is resolved into the in-phase and out-of-phase components. These components
divided by the applied strain give information about the “solid-like” and “liquid-like”

Literature Review
14
responses of the material. It is referred to as “storage” and “loss” modulus and they are
generally denoted as G’ and G’’ respectively. The ratio between the “loss” modulus (G’’)
and the “storage” modulus (G’) is defined as the loss tangent, tan δ (Phillips and Williams,
2000, Morris et al., 2012).
The commonly used hydrocolloids are formed by a physical cross-linked network during
gelation and they can be categorised into “strong” and “weak” gels. The former have
permanent bonds between the chains, forming the so-called junction zones, whereas the
latter consist of temporary associations between the polymer chains (Gulrez et al., 2011,
Milani and Maleki, 2012).
In Fig. 2.3, G’ (storage modulus), G’’ (loss modulus) are plotted against frequency (Phillips
and Williams, 2000). Rheological analysis can clearly distinguish weak (A) and strong (B)
hydrocolloid gels (as shown in Fig. 2.3) (Phillips and Williams, 2000). For the weak gels, G’
assumes values slightly above G’’, while strong gels have G’>>G’’ for all frequencies.

Literature Review
15
Figure 2.3: G’, G’’ as a function of shear rate frequency: (A) 1% xanthan gum solution, (B)
1.5% amylose gels. Adapted from Phillips and Williams (2000).
In physical gels, the extent of the junction zones induces a variation, especially in
mechanical properties (Banerjee and Bhattacharya, 2011, Morris et al., 2012). In Fig. 2.4,
the gelation mechanisms are reported (Aguilera and Stanley, 1999).

Literature Review
16
Figure 2.4: Schematic representation of some molecular structures of pure gels (Aguilera
and Stanley, 1999): (A) Cross-linked, (B) Triple-helices (gelatin), (C) Egg-box structures
(pectin and alginate) in the presence of calcium cations, (D) Aggregated domains
(carrageenan and gellan gum), (E) Double helices in bundles (agarose), (F) Particulate gels
(globular proteins).
Gels can be sensitive to temperature, since a class of them is thermo-reversible (e.g.
carrageenan, gellan, gelatin and agar). On heating, it is possible to re-melt the structure
and solubilise the polymer. On the other hand, thermo-irreversible gels can only degrade
on heating (e.g. low methoxyl pectin and alginate) (Banerjee and Bhattacharya, 2012).
The gelation process can occur in two different ways. Conventional gels, known also as
“true gels”, set under quiescent conditions (Banerjee and Bhattacharya, 2012, Morris et

Literature Review
17
al., 2012) and respond to stress application by fracturing (Morris et al., 2012). The rheology
of such systems comes from the interaction between the polymer chains, which can be
disrupted by a shear stress application (Norton et al., 2006). The resulting systems, known
as “fluid gels”, consist of gel particles in a continuous aqueous medium, forming a
concentrated micron-size gel suspension (Mills et al., 2013).
Gel mixtures have synergistic properties that are not only a combination of those of the
single constituents (Phillips and Williams, 2000). If the hydrocolloids in the mixture can
associate, either gelation or precipitation may occur (Fig. 2.5), whereas, if they do not
associate, the system will appear as a single phase at low polymer concentrations or a
phase separation occurs, especially at high polymer concentrations. In the latter case, the
two polymeric solutions are enriched in one of the two hydrocolloids: it can be considered
as “water-in-water” emulsion, where droplets with a high concentration in one of the
polymer are dispersed in a continuous aqueous, enriched in the other (Capron et al., 2001).
If either or both hydrocolloids can independently form a gel network, then gelation occurs
at the same time of phase separation (Fairclough et al., 2012).
Therefore, the type of hydrocolloid and its concentration within the mixture can
completely affect the final rheological/textural properties (Phillips and Williams, 2000).
Literature Review
18
Figure 2.5: Scheme of the interaction between hydrocolloids in mixtures. Adapted from
Phillips and Williams (2000).
2.2.1 Gellan gum
Gellan gum is a natural anionic hydrocolloid consisting of linear repeating units of
tetrasaccharides (Phillips and Williams, 2000, Morris et al., 2012). The microorganism
Sphingomonas elodea (also known as Pseudomonas elodea) secretes this polysaccharide
in its native form (high acyl (HA) gellan gum), in a fermentation process (Sworn, 2009). The
manufacturing process initially consists of the control of a series of parameters, such as
aeration, agitation, pH and temperature (Bajaj et al., 2007). The steps following the
fermentation process are pasteurisation and alcohol precipitation. The native polymer is
often deacylated with an intermediate pre-treatment with hot alkali (Dickinson, 1991,
Sworn, 2009), obtaining low acyl (LA) gellan gum. In this form, gellan gum becomes more
sensitive to salts, especially divalent cations, inducing a higher interaction of the polymer
chains and their aggregation (Morris et al., 2012). The resultant gel is firmer and more
brittle than high acyl gellan gels, and can produce gels at lower concentrations (CPKelco,
2007).
Hydrocolloid 1 Hydrocolloid 2
Association No Association
Precipitation Gelation Single phase Phase separation
+

Literature Review
19
The tetrasaccharide unit is composed of β-D-glucuronate, β-D-glucose and α-L-rhamnose
(Phillips and Williams, 2000), with a molecular weight range between 100 and 200 kDa
(CPKelco, 2007, Kirchmajer et al., 2014). In Fig. 2.6 both the high acyl (HA) and deacylated
or low acyl (LA) gellan gum chains are reported (Mahdi et al., 2015).
Figure 2.6: High acyl gellan gum (A) and low acyl gellan gum (B) units. Adapted from Mahdi
et al. (2015).
Since gellan gum gels on cooling, it belongs to the class of “cold set” gels (Banerjee and
Bhattacharya, 2012). On the G’, G’’-temperature graph (Fig. 2.7), it is possible to distinguish
the coil-helix transition temperature (Tch) as the marked change in slope of the G’ curve,
while the sol-gel transition temperature (Tsg) as the intersection of the G’ and G’’ curves
(Miyoshi and Nishinari, 1999b).

Literature Review
20
Figure 2.7: G’(circles) and G’’ (triangles) as a function of temperature. Measurements at
0.1 rad/s and 0.5 °C /min: heating (filled symbols) and cooling (open symbols) and heating.
Different gellan gum concentrations (A) 1 wt%, (B) 2 wt% and (C) 3 wt%. Adapted from
Miyoshi and Nishinari (1999b).
When dispersed in hot water, the polymer is in form of disordered single-coils. On solution
cooling, the random coils initially rearrange to form threefold double helices (“coil-helix”
transition), followed by helices aggregation (“sol-gel” transition) on further temperature
decrease, resulting in a three-dimensional gel network (Banerjee and Bhattacharya, 2012).
The ordered domains are called junction zones (Morris et al., 2012), stabilised by non-
covalent interactions (hydrogen bonds, electrostatic forces, hydrophobic interactions, Van
der Waals attractions) and molecular entanglements (Hui, 2006). The gellan gum
mechanism of gelation is, therefore, based on the “domain model”, divided into ordered
and disordered network zones (Morris et al., 1980).
The presence of physical interactions between the polymer chains makes gellan gum highly
sensitive to the presence of cations, mainly monovalent (Na+ and K+) and divalent (Ca2+
and Mg2+). Both cation types interact with the gellan gum chains in a slightly different way:

Literature Review
21
sodium and potassium indirectly crosslink the double helices (Fig. 2.4 D), through the
presence of water molecules, while calcium and magnesium bridge the polymer chains
through the interaction between the carboxylate groups of contiguous double helices
(Tang et al., 1996). Robinson and Manning (1991) schematically proposed the “cation-
mediated aggregate” model for gellan gum (Fig. 2.8).
Figure 2.8: “Cation-mediated aggregate” model for gellan gum. Double helix aggregation
is promoted by the presence of cations (filled circles). Adapted from Robinson and
Manning (1991).

Literature Review
22
In Figure 2.8, it is possible to observe that the absence of salts reduces the double helices
aggregation generating a “weak gel”.
Since the strength of the chain attraction depends on the polymer linear charge density as
well as the specific cation charge (Morris et al., 2012), divalent cations promote more
effectively the gellan gelation, resulting in gels twice stronger and firmer compared to
monovalent cations (Banerjee and Bhattacharya, 2011).
The ion size also affects the strength of binding, as it increases with increasing ion size (Li+
< Na+< K+ < Rb+ < Cs+) (Morris et al., 2012). However, an optimum salt concentration and,
therefore, the extent of aggregation has been reported (Morris et al., 2012). Similarly, an
increased concentration in H+ by acidification of the polymeric solution, especially close to
the gellan gum pKa, leads to a more aggregated network (Norton et al., 2011, Bradbeer et
al., 2014). Although the charge density on the gellan gum molecules is reduced by
decreasing the pH, the presence of more cations leads to a higher aggregated network
(Bradbeer, 2014), as further discussed in Chapter 4. Interestingly, further addition of Na+
and Ca2+ as in acid gels generally results in the strength reduction of the system (Sworn,
2009).
In terms of sol-gel transition temperature, divalent cations induce structural ordering at
higher temperatures compared to monovalent cations, although no significant
dissimilarity is found between Ca2+ and Mg2+ (Milas and Rinaudo, 1996). In other words,
the thermal stability induced by divalent cations is higher and, therefore, their amount to
promote gel gelation is considerably lower than monovalent cations (Milas and Rinaudo,
1996, Morris et al., 2012).

Literature Review
23
On the other hand, HA gellan gum (biosynthesised native polysaccharide) forms gels,
which re-melt at approximately 65 °C, without showing “thermal hysteresis”. The amount
of HA gellan gum that can form a “self-supporting” gel network is at concentration above
~0.2 w/w %, compared with 0.05 w/w % for LA gellan gum (Sworn, 2009).
In HA gellan gum, the acyl substituents (glycerate and acetate) (Fig. 2.9) results in a softer
and more flexible gel, compared to the more brittle and firmer properties of LA gellan gels
(Phillips and Williams, 2000).
Figure 2.9: Textural properties of different hydrocolloids. Adapted from Phillips and
Williams (2000).
Although the acyl substituents do not modify the overall molecular network and the
double helix structure, they do affect the gelation (Chandrasekaran and Thailambal, 1990).
The glycerate provides stabilisation by adding new hydrogen bonds, yet disrupting the
binding site for cations by orientation change of the adjacent carboxyl group
(Chandrasekaran and Thailambal, 1990). It leads to the loss of polymer aggregation
mediated by cations and, consequently, to a reduction in mechanical properties. On the
other hand, the acetate further hinders the helix aggregation (McClements, 2015).
The two gellan gum types can be blended to provide synergistic properties to the system,
especially in terms of mechanical properties (Phillips and Williams, 2000). Morris et al.
Hard Firm
Brittle
Soft Elastic
Flexible
HA gellan LA gellan
Xanthan/LBG
Gelatin
Pectin
Alginate LA gellan K-carrageenan
Agar 50 HA: 50 LA gellan

Literature Review
24
(2012) reported that the textural attributes of HA/LA gellan gum mixtures are intermediate
between the extreme brittleness and hardness of the low acyl form and extensibility of the
high acyl form. Generally, binary mixtures of gels form a complex structure as
schematically reported in Fig. 2.10 (Dickinson, 1991). The two gellan gum gel types form
an interpenetrating three-dimensional gel network (Mao et al., 2000), resulting in the
double helices not to include strands of the two gel types (Fig. 2.10 B) (Morris et al., 2012).
Figure 2.10: Suggested models for binary hydrocolloid mixtures (Dickinson, 1991). (A) Only
one hydrocolloids forms the gel network, (B) one polymer forms an interpenetrating”
network in the other, (C) demixing and following gelation of both hydrocolloids form a
phase-separated network, (D) intermolecular binding forms a coupled network.
From a gelation mechanism perspective, HA gellan gum gel sets at higher temperatures,
whereas LA gellan forms the gel structure within the HA gellan network on further cooling,
creating a structure described as a “gel within a gel” structure (Imeson, 2011).
Gellan gum and hydrocolloids in general are often used in combination with sugars
(Miyoshi et al., 1998, de Vries, 2002, Norton and Foster, 2002, Renard et al., 2006). Miyoshi

Literature Review
25
et al. (1998) reported the effect of sugars in the gellan gum gel system and they concluded
that sugars can promote gelation and conformational ordering of gellan gum and,
particularly, that mannose is less effective than glucose. Both the coil-helix transition (Tch)
and sol-gel temperatures (Tsg) tend to overlap at 41°C upon sugar increase. The
conformational ordering of gellan is influenced by the sugar type as follows: sucrose >
glucose >> fructose (Miyoshi and Nishinari, 1999a). The reason for this is ascribed to the
competition in molecular interaction between polymer-water and sugar-water, which is
highly related to dynamic hydration number (Nishinari and Watase, 1992).
Sugars have also an effect on gellan gum mechanical properties (Sworn and Kasapis, 1998).
It was found that sugars (d(-)-fructose, maltose and d(+)-glucose) generally increase the
gel strength, promoting gellan gum chain aggregation by replacing the solvent (Gekko and
Kasuya, 1985, Deszczynski et al., 2003), yet too high co-solute concentrations lead to a
strength drop, due to an excessive polymer cross-linking. This excessive biopolymer
aggregation results in a sharp decrease in mechanical properties (Kawai et al., 2008). The
reduction in the number of effective junction zones by increasing the solute concentration
leads ultimately to the gellan precipitation (Morris et al., 2012). However, the “optimum
extent” of association and cross-linking is significantly dependant not only on the sugar
content, but also on the presence of salt, which can be contained in the gellan formulation
(CPKelco, 2007, Morris et al., 2012). Nickerson et al. (2004) proposed that the presence of
co-solute in high concentrations forms “gel islands” embedded in a co-solute matrix.
Similar observations were found for HA gellan gum-sugar systems in terms of mechanical
properties as well as setting/melting temperatures (Sworn, 2009). Specifically, an increase
in sugar concentration leads to an increase in gel strength.

Literature Review
26
2.3 Drying mechanisms in the food industry
The presence of water in food influences physical, chemical and mechanical properties
(Barbosa-Cánovas et al., 2008). The main limit to biological conservation is the presence of
microorganisms, which can grow and proliferate in a humid environment (Aguilera and
Stanley, 1999), resulting in a reduction of the product shelf life, spoilage and organoleptic
degradation (Ratti, 2001, Fellows, 2009). The water content is generally expressed on
either dry basis or wet basis (Perry and Green, 1999). The former is normalised on the solid
content, whereas the latter on the total weight. However, not all the water within food
plays the same role in microorganism growth (Aguilera and Stanley, 1999). Part of water
interacts more with the material structure in a dynamic equilibrium, while part of water is
less affected by the material matrix, becoming more available for physical, chemical and
microbiological reactions (Barbosa-Cánovas et al., 2008).
Water activity (aw) provides thermodynamic information about the energy status of the
system and, therefore, the water availability to participate in reactions (Mathlouthi, 2001,
Barbosa-Cánovas et al., 2008). One of the first mathematical definitions was suggested by
Labuza (1975), defining aw as the ratio of the vapour pressure (Pv) in the material, over the
vapour pressure of pure water (Po) at the equilibrium (Eq. 2.1).
𝑎𝑤=𝑃𝑣
𝑃𝑜 (Eq. 2.1)
𝑎𝑤=𝑃𝑣
𝑃𝑜 (Eq. 2.1)

Literature Review
27
Water activity is expressed on a scale from 0 to 1 and, generally, values below 0.3 indicate
that water strongly interacts with the material structure, whereas values above 0.7 that
water acts more as a solvent (Barbosa-Cánovas and Vega-Mercado, 1996)
Water activity is used to define a stability map for food spoilage (Ariyawansa, 2000,
Barbosa-Cánovas et al., 2008, Rahman, 2009) (Fig. 2.11), since water that strongly interacts
with the material structure (Aguilera and Stanley, 1999, Mathlouthi, 2001) is not involved
in reactions.
Figure 2.11: Food stability map: food deterioration rate as a function of moisture content
and water activity. Adapted from Ariyawansa (2000).

Literature Review
28
From the stability map (Fig. 2.11) it is noticeable that spoilage is considerably delayed at
water activity values around 0.70. However, it is known that some moulds may grow very
slowly in water activity range between 0.60 and 0.62 (Jay et al., 2008). Furthermore, water
activity plays a key role in regulating the enzyme and vitamin activities as well as chemical
modifications, such as the browning due to the Maillard reaction or the vitamin C loss and
discoloration (Brown, 2010).
Water activity is strictly dependent on the material properties and, therefore, products
with the same water content may have different aw values. In addition, the formulation
may be designed to limit the occurrence of water participating in reactions by adding low
molecular weight solutes, such as sugars or salts (Barbosa-Cánovas et al., 2008).
The most common drying process is air-drying, based on the water evaporation from the
material due to a thermal treatment, typically around 65-85 °C, although low temperature
process have been developed (~20 °C) (Kilic, 2009, Brown, 2010). The resulting material is
characterised by high apparent density and low porosity as well as microstructural damage
and deteriorated product properties (e.g. colour, aroma, texture and nutritional value)
(Ratti, 2001). Air-drying is discussed in more detail in Section 2.3.2.
Depending on the specific application, alternative drying methods are often used, such as
microwave assisted, vacuum assisted and freeze-drying. However, none of the processes
is ideal in every aspect (Nijhuis et al., 1998a, Wang and Xi, 2005).
Microwave or radio frequency (RF) assisted drying is characterised by fast heating,
generated by the interaction of the electrostatic field with water molecules, and rapid
mass transport. Although the energy absorption is proportional to the moisture content in
the material (Wang and Xi, 2005), through electrical resistance and/or dipole

Literature Review
29
reorientation, the structure may be damaged, showing “puffing” (Brown et al., 2008,
Rakesh and Datta, 2011). Moreover, the microwave-drying process is relatively expensive
in terms of set-up as well as running costs (Nijhuis et al., 1998a).
A variation of the microwave drying consists in the application of vacuum. The reduced
pressure allows a lower process temperature, preventing the product damage and
degradation. Furthermore, the absence of air limits oxidative reactions, preserving the
nutrient content and colour. Interestingly, the vacuum extent leads to different textural
properties: for example, the high product internal pressure in conjunction with the low
chamber pressure promotes the material expansion (Brown, 2010).
Freeze-drying is an alternative method for drying, which allows a high-quality product in
terms of structure preservation, since it is based on ice crystal sublimation (Scherer, 1990).
Similarly to the microwave vacuum drying, the low pressure as well as the possibility to
reduce the process temperature limits chemical reactions and degradation (Ratti, 2001).
Freeze-drying is discussed in more detail in Section 2.3.1.
An emerging method for food drying applications is through the use of supercritical fluids
(Brown et al., 2008). In particular, supercritical CO2 is commonly used for its low cost and
non-toxicity (Gupta and Shim, 2006). Furthermore, its chemical and physical properties
can be modulated according to the employed pressure and temperature. Supercritical fluid
drying is discussed in more detail in Section 2.3.3.1.
In parallel to drying methods, dehydration treatments are often used to reduce the
moisture content and water activity to an intermediate level, often as a pre-treatment to
the drying process (Garcia-Gonzalez et al., 2007, Brown et al., 2008, Prosapio and Norton,
2017b). Osmotic dehydration in hypertonic solutions (Bakalis and Karathanos, 2005,

Literature Review
30
Prosapio and Norton, 2017b) and alcoholic dehydration (Cassanelli et al., 2017a) are some
common methods.
2.3.1 Freeze-drying
Freeze-drying, also known as lyophilisation, is based on the direct sublimation of the solid
solvent, generally ice into a gaseous state (Barbosa-Cánovas and Vega-Mercado, 1996,
Evans, 2008). The process consists in decreasing the thermodynamic conditions of the
system, pressure and temperature, below the triple point of water (6.1 10-3 bar and 0.01
°C) (Barbosa-Cánovas and Vega-Mercado, 1996). Since the capillary forces are absent
throughout drying (Scherer, 1990), the final product structure is characterised by an
excellent quality preservation (Ratti, 2001). In parallel, nutrients and volatile aroma
compounds can be more easily preserved due to the low process temperatures (Ratti,
2001), avoiding some drying-associated reactions such as the Maillard-browing reaction
(Evans, 2008), which typically occur with other common drying methods, such as air-drying
(Ratti, 2001).
The freeze-drying process starts by freezing the product, resulting in ice crystal formation.
Once the pressure is sufficiently lowered, the ice crystal sublimation is thermodynamically
encouraged (primary drying) and the process can then be prolonged into the desorption
of unfrozen water molecules (secondary drying) to reach the desired moisture content
(Rey and May, 2010).
The whole process can take a significant amount of time and a typical production cycle can
last from hours to a few days (Tang and Pikal, 2004). It is, therefore, important the

Literature Review
31
optimisation of the freeze-drying process in all its stages to reduce the energy cost and
reach a high efficiency.
In Fig. 2.12 the schematic freeze-drying system is reported, consisting of (Evans, 2008):
Vacuum pump to achieve the desired pressure and remove non-condensable gases.
Condenser, set at a lower temperature, for the vapour removal by deposition and constant
pressure control.
Trays/shelves, often connected to a temperature-controlled system, where the samples
are located throughout the process.
Figure 2.12: Schematic freeze-drying system. Adapted from Barbosa-Cánovas and Vega-
Mercado (1996).
Since each gram of ice can produce significant amounts of vapour, dependent on the
working pressure, the water vapour is collected at the condenser and not in the pump, to
avoid the pump degrading. The role of the vacuum pump is rather the removal of air or

Literature Review
32
other gases. Moreover, a too low condenser temperature can be inefficient, adding extra
costs to the drying cycle. It should be set in order to have a high deposition rate to avoid
pump overloading.
2.3.1.1 Pre-treatments and freezing
The term “pre-treatment” is referred to the prior-to-freezing optimisation of the product
formulation and the surface area of the product exposed to the drying (Nireesha et al.,
2013). The former means the revision of the ingredients to modulate the stability, the ice
crystal size and shape and the product appearance, while the latter considers the study of
the best geometry to allow an efficient drying process, reducing the required time (Tang
and Pikal, 2004).
The freezing stage may be performed directly in the freeze-dryer, by using liquid nitrogen,
methanol or dry ice as common refrigerants. To obtain high-quality freeze-dried products,
a completely frozen material is required to avoid any boiling liquid, which irremediably
would lead to the collapse and damage of the structure (Cook, 2009).
The sublimation rate is strictly dependent on how the freezing is conducted, as the size of
the ice crystals affects the drying kinetics. Specifically, it is preferred to induce the growth
of larger crystals to form an interconnected ice path, used by water to leave the structure
as the drying continues (Abdelwahed et al., 2006b). However, some cellular products, for
instance meat or vegetables, may not tolerate the internal stress from large ice crystals
and, therefore, smaller crystals are preferred to avoid a poor texture and nutrient loss
(Chassagne-Berces et al., 2009). In this context, both the product formulation (e.g.

Literature Review
33
presence of excipients and solutes) and freezing rate influence the degree of supercooling
and, therefore, the shape and size of crystals (Sinha, 2007, Roos, 2012).
A slower freezing is recommended if large crystals are desired and it is often combined
with the annealing step, which consists of a temperature increase, generally 5 °C above Tg’
of the material, defined as the glass transition of a maximally frozen material (Evans, 2008).
This last stage involves a temperature cycle to thermodynamically and kinetically
encourage the crystal growth by decreasing the free energy of the system (Evans, 2008).
2.3.1.2 Collapse temperature
For an amorphous material an important parameter is the collapse temperature Tc, specific
for each substance, which is the temperature above which the viscous flow of amorphous
material occurs, leading to the collapse of the frozen structure (Fonseca et al., 2004, Wang
et al., 2004, Roos, 2010), often noticeable as a radial shrinkage (To and Flink, 1978). Above
this temperature, the polymer matrix is not sufficiently rigid, collapsing on itself as soon as
the ice crystals sublimate (Pikal and Shah, 1990). In this event, the failure of the material
and the defect formation are evident (Kett et al., 2005, Rey and May, 2010). The loss of
the typical porous structure results, firstly, in a less efficient and incomplete drying process
and, secondly, in a poor product quality. In addition, it results particularly difficult to
reduce the final moisture content, since the collapsed structure offers a considerable
resistance to water to be removed (Tang and Pikal, 2004).
Materials can be divided into crystalline and amorphous. The former have a specific
melting temperature or eutectic point Teut (if the material is a mixture of more
constituents). For the latter, it is possible to identify the glass transition temperature Tg,

Literature Review
34
which determines the transition between the vitreous state and the rubbery and high-
mobile one (Rey and May, 2010). For freeze-drying applications, Tg’, defined as the
temperature of the maximally frozen material, is the temperature related to Tc, generally
a few degrees lower than the collapse temperature (Pikal and Shah, 1990, Evans, 2008,
Roos, 2010). Conceptually, Tg’ is different from Tg, which refers to the solid dried material.
If the material is semi-crystalline a mixed behaviour is raised, depending on the respective
percentage, considering both Teut and Tg’. In this case local softening events/melting might
occur.
Since the collapse temperature (or Teut for crystalline materials) prediction may result
difficult, especially with complex systems, different characterisation techniques have been
developed to experimentally individuate it. Among these, freeze-drying microscopy (FDM)
allows to visually identify the collapse temperature throughout the application of
heating/cooling cycles to the sample (Wang et al., 2004). In addition, the thermal and
electrical impedance analyses may provide a more complete characterisation (Rey and
May, 2010), distinguishing Tg’ and other thermal transitions.
2.3.1.3 Primary drying
The primary drying consists in the solvent removal from the material by sublimation. The
driving force for this mechanism is the vapour pressure differential (VPD) between the
equilibrium vapour pressure of the ice leaving the material and the ice at the condenser
(Nireesha et al., 2013).
Considering that sublimation is an endothermic process that requires a considerable
amount of energy (~2800 J g-1), it results in heat being required for drying to occur. This

Literature Review
35
energy is usually provided by heating elements assembled near the product (with
temperature equal to Tshelf) or by the surroundings (through the freeze-dryer walls) and it
is transferred to the material by convection, conduction and radiation. The input energy
should be ideally equal to the required energy for sublimation, otherwise it may increase
the product temperature (Tp) if the resistance of the product is sufficiently high (Rey and
May, 2010). Here, it is possible to understand why temperature, defined as a target
temperature (Ttar), is chosen a few degrees lower than the collapse temperature: if the
product temperature rises, the system is still below Tc. However, it is important to note
that only 1 °C decrease results in a 13% increment of primary drying time (Pikal and Shah,
1990), essentially by VPD reduction.
On the water phase diagram in Fig. 2.13, the schematic and real sublimation mechanism
during freeze-drying are reported. After the freezing step (1), the chamber pressure (Pc) is
set 30-50 % lower than the equilibrium vapour pressure at the target temperature (1’)
(Chang and Patro, 2004), to ensure that the sublimation process starts (2). If the system
were exactly in 1’, the thermodynamic equilibrium would occur and there would not be
sublimation. At this point, Tp decreases due to the endothermic process (3), establishing a
new equilibrium, yet the condenser depletes the pressure, removing the generated vapour
in the chamber (4), shifting the system away from the equilibrium. Another slight decrease
in Tp occurs (5), temporarily stopping the sublimation process until it repeats itself, after a
slight temperature increase, that leads to an equilibrium at higher pressure (3) (Chang and
Patro, 2004, Rey and May, 2010).

Literature Review
36
Figure 2.13: Freeze-drying cycle on the water phase diagram. “Actual” means how the real
process occurs: the system passes from 2 to 5, then it reaches 3, forming a cycle.
Since the heat needs to be transferred to the material, a too low chamber pressure implies
that the heat transfer is mainly by conduction and radiation, while the convection
contribution is reduced, resulting in a sublimation rate decrease.
In Fig. 2.14 the sublimation rate is the reported output, while the chamber pressure,
product temperature and shelf temperature are the inputs.
Temperature
Pre
ssu
re
Tamb Tc TTtar
Pa
mb
Pc
0 1
1’ 12 3
4 5
2 3
5
Actual

Literature Review
37
Figure 2.14: Sublimation rate as a function of chamber pressure, shelf and product
temperature: example of primary drying. Adapted from Rey and May (2010).
Firstly, it is observed that a higher chamber pressure leads to an increase in the sublimation
rate as well as in the product temperature (Rey and May, 2010). In effect, if the pressure
is higher, the predominant heat transfer mode is convection with a consequent higher ice
removal rate. Secondly, if the heating elements are equipped, it is possible to control
precisely the provided energy (Rey and May, 2010). Therefore, an increase in Tshelf results
in a faster sublimation process. It is deduced that Tp remains constant if Tshelf increases and
Pc decreases or vice versa.

Literature Review
38
A “safe zone” can be delimited by the collapse temperature and the choked flow. This last
phenomenon occurs at too high sublimation rates, resulting in an increase of both
chamber pressure and product temperature (Rey and May, 2010).
The end of the primary drying can be determined by two ways. Firstly, it is possible to
notice the increase in the product temperature up to the shelf one, due to the end of the
sublimation. Secondly, the chamber pressure stops to fluctuate, because the vapour
leaving the chamber decreases (Chang and Patro, 2004).
2.3.1.4 Secondary drying
Secondary drying is often required to further reduce the moisture content down to 1% or
less (Tang and Pikal, 2004). As the ice is completely removed during primary drying, the
process is based on water desorption rather than sublimation. Unfrozen water molecules
are encouraged to leave the porous matrix by increasing the shelf temperature, even
above 0°C, and consequently breaking the physical and chemical interactions with the
structure. On the other hand, it is noteworthy to mention that depending on the
formulation, overdrying may result in a poorer product quality (Rey and May, 2010).
During the secondary drying, the unfrozen water desorption is more sensitive to
temperature variations compared to pressure changes. However, the vacuum can be
maintained to further force water desorption. Microstructurally, since small pores lead to
a more exposed surface area, an initial faster freezing rate is preferred in this context
(Rambhatla et al., 2004).
At the end of secondary drying, the vacuum is usually broken by using inert gases (Nireesha
et al., 2013).

Literature Review
39
After secondary drying, the freeze-dried products have an enhanced shelf life as long as
they are stored in a sealed environment, being highly hygroscopic, and below the glass
transition temperature (Evans, 2008).
2.3.2 Air-drying
One of the most common drying processes used in both food and chemical industry is air-
drying (Brown, 2010). It is based on the evaporation of the solvent, generally water, from
the material, requiring simultaneous mass and heat transfer (Aguilera and Stanley, 1999).
The final product is characterised by a relatively high apparent density and low porosity
(Krokida and Maroulis, 1997, Joardder et al., 2015). Temperature is a key parameter in this
process, having a considerable effect on the drying kinetics (Scherer, 1990) as well as on
the material properties (Ratti, 2001). In the food industry, a typical thermal treatment,
performed at 65 °C-85 °C (Brown, 2010), may lead to a microstructural damage (e.g.
shrinkage and case hardening) (Joardder et al., 2015) and a chemical-physical modification,
with a product quality reduction and loss in nutrients (Mujumdar, 2014).
During drying, and especially in the earlier stages, external variables, such as humidity and
airflow properties, temperature, pressure, exposed surface area and type of supporter,
influence both the final product quality and drying efficiency (Mujumdar, 2014). Therefore,
dried microstructure and water removal rate are highly dependent on the type of dryer.
Specifically, there are three factors that can influence the process (Mujumdar, 2014):
Type of operation (batch, semi-continuous or continuous).
Type of flow geometry (parallel, co-current, counter-current or cross-flows).
Type of flow (mixed or plug flows).

Literature Review
40
The air-dryers are classified in Fig. 2.15 (Mujumdar, 2014).
Figure 2.15: Typical configurations of air-dryers. Grey arrows refer to material to be dried
and black arrows to air. Adapted from Mujumdar (2014).
To rapidly estimate the process conditions and determine the amount of moisture in air,
it is common practice to use the psychrometric charts (Perry and Green, 1999), where the
thermodynamic properties of water vapour-air systems are reported on the chart in terms
of dry- and wet-bulb temperature, dew point temperature relative humidity and enthalpy
(Mujumdar, 2014).
2.3.2.1 Heat and mass transport mechanisms
Air-drying is based on heat and mass transfer mechanisms between the material and the
surroundings (Aguilera and Stanley, 1999). Generally, heat is initially transported to the
No mixing
With mixing of one or two phases
Batch Semibatch SemibatchContinuous cocurrent
Continuous Continuous countercurrent countercurrent
Continuous cross-flow

Literature Review
41
material surface by convection, while the evaporation zone is reached by conduction and
radiation, which can also locally increase the dried layer temperature (Aguilera and
Stanley, 1999). However, the predominant heat transfer mode depends on the material
properties and microstructure. The provided energy raises the material temperature,
having an effect on the mass transport mechanism. If the temperature of the wet solid is
below the water boiling point, the prevailing moisture transport within the material is by
liquid diffusion, otherwise it is by vapour diffusion (Mujumdar, 2014). At the same time, if
the vaporisation rate is higher than the vapour transport rate through the solid material,
the hydrostatic pressure differences may play a key role (Mujumdar, 2014).
For a continuous dryer, the mass and heat transfer mechanisms are described by the
balance Equations (Eq. 2.2 and 2.3) (Barbosa-Cánovas and Vega-Mercado, 1996,
Mujumdar, 2014).
∑ 𝑀𝑖𝑛𝑖
𝑖 𝑤𝑖𝑛𝑖 = ∑ 𝑀𝑜𝑢𝑡
𝑖𝑖 𝑤𝑜𝑢𝑡
𝑖 (Eq. 2.2)
∑ 𝑀𝑖𝑛𝑖
𝑖 𝐶𝑝𝑖(𝑇𝑖𝑛𝑖 − 𝑇𝑟𝑒𝑓) = ∑ 𝑀𝑜𝑢𝑡
𝑖𝑖 𝐶𝑝𝑖(𝑇𝑜𝑢𝑡
𝑖 − 𝑇𝑟𝑒𝑓) + 𝜆𝑊 (Eq. 2.3)
where Min and Mout stand for entering and exiting mass rates (kg s-1), win and wout are the
moisture contents for each term (kg kg-1 db), Cp is the heat capacity (kJ kg-1 K-1), λ the latent
heat of vaporisation of water (kJ kg-1), T is temperature (K) for each term and W is the
evaporated moisture from the solid feed.
The heat and mass transfers between the dried surface and the evaporation zone are
highly dependent on the microstructure of the product. The transfer rate is defined by the
driving force for both heat and mass transfers (identified as the temperature difference

Literature Review
42
for the former and partial pressure or moisture difference for the latter) and the transfer
coefficient, which considers the system microstructure evolving over time (Aguilera and
Stanley, 1999).
2.3.2.2 Drying kinetics and drying periods
Evaporative drying does not cause only physical and microstructural modifications of the
product, but also an evolution in drying mechanisms over time. A way to depict the drying
kinetics is through the drying curves, in which different periods are identified, as reported
in the general example (Fig. 2.16) (Mujumdar, 2014).
Figure 2.16: Typical rate of drying curve as a function of time. Adapted from Mujumdar
(2014).
Constant drying rate period
First falling drying rate period
Second falling drying rate period
Time
Rat
e o
f d
ryin
g

Literature Review
43
The plot shows an initial constant drying rate period, dependent on the water evaporation
from the surface, which ends at the critical moisture content w*. Both the material
structure and air conditions may affect the critical moisture content (Aguilera and Stanley,
1999). The evaporation rate, E, is proportional to the difference between the liquid (Pv)
and ambient (Pa) vapour pressures, as shown in the Equation 2.4 (Scherer, 1990).
𝐸 = 𝑘(𝑃𝑣 − 𝑃𝑎) (Eq. 2.4)
where k is dependent on the temperature and humidity, as well as the material surface
area.
As the evaporation rate is no longer balanced by the water diffusion to the material surface
due to internal resistances, the drying kinetics start to decrease, resulting in one or more
falling periods (Mujumdar, 2014). The material surface is not any longer assumed to be
covered by a thin wet film, rather it is considered to be unsaturated (Aguilera and Stanley,
1999). It suggests that the process relies on the internal structure and diffusion through it,
rather than depending on the external conditions (Scherer, 1990). Based on the material
porosity, typical in gel systems, the water movement to the surface is also led by capillarity
(Scherer, 1990).
A second falling period may take place as the distance between the surface and the drying
front increases as well as the water is discontinuous with not fully filled pores. The drying
rate is now controlled by the moisture movement within the material and heat transfer
(Aguilera and Stanley, 1999), since the capillary pressure gradient decreases (Scherer,
1990).

Literature Review
44
The mass transfer throughout the material is depicted in Fig. 2.17 (Aguilera and Stanley,
1999).
Figure 2.17: Mass and heat transfer processes through. Adapted from Aguilera and Stanley
(1999).
On drying there is a continuous microstructure evolution due to the generation of stresses
and deformations. The material deforms upon drying and shrinkage can take place due to
capillarity, osmotic pressure, disjoining pressure and moisture potential (Scherer, 1990).
This can result in the material cracking, especially where the local stress is concentrated
(Scherer, 1990). In particular, cracking of material is generally observed if the drying rate
is high and the product is thick.
Capillary pressure (ΔP) occurs to avoid an increase in system energy. In effect, when the
water evaporates the more energetic solid/vapour interface would replace the solid/liquid
one (Scherer, 1990). The liquid tends to minimise this by spreading and limiting the area

Literature Review
45
between solid and vapour. This generates capillarity tensions (ΔP) dependent on the
curvature radius (r) of the meniscus and on the surface tension liquid/vapour described by
the Young–Laplace Equation (Eq. 2.5) (Scherer, 1990).
𝛥𝑃 = 𝛾𝑙𝑣(1
𝑟1+
1
𝑟2) (Eq. 2.5)
where γlv is the liquid surface tension, while r1 and r2 are the curvature radii of the
meniscus.
Equation 2.6 is simplified for spherical geometries (Eq.2.6)
∆𝑃 =2𝛾𝑙𝑣
𝑟 (Eq. 2.6)
The maximal capillary tension is defined as follows (Eq. 2.7):
∆𝑃 =(𝛾𝑠𝑣−𝛾𝑠𝑙)𝑆𝑝
𝑉𝑝 (Eq. 2.7)
where Sp/Vp stands for the ratio between pore surface and volume, γsv the solid/vapour
surface energy and γsl the solid/liquid one.
Other mechanisms causing the material deformation during drying are the osmotic
pressure, disjoining pressure and moisture potential (Scherer, 1990).
Firstly, the osmotic pressure is generated in the presence of a solute gradient of
concentration and relies on diffusion through a semipermeable membrane.

Literature Review
46
Secondly, the disjoining pressure is based on electrostatic interactions and results from
the interaction between two interfaces, either attractive or repulsive. The disjoining forces
become significant when the solid surfaces, covered with a thin layer of oriented water
molecules, become closer and, therefore, they generally take place at the end of drying.
Thirdly, the moisture potential, defined as the partial specific Gibbs free energy of a liquid
in a porous matrix (Scherer, 1990) is the overall moisture holding pressure in the material.
Higher drying rates as well as the system formulation may lead to the formation of a rigid
external crust, since the moisture content starts to rapidly decrease (Wang and Brennan,
1995). This phenomenon is known as case hardening (Joardder et al., 2015). It occurs due
to the rubber-glass transition during drying and due to the deposition of solutes on the
external surface, transferred by diffusion from the inner part of the material. As a
consequence, it can influence the overall drying process.
2.3.2.3 Vacuum drying
One of the drying methods to remove water from highly temperature-sensitive products
is by applying vacuum (Joardder et al., 2015). This may help to prevent nutrient loss, colour
change and structure degradation due to the low temperatures and pressures (Krokida
and Maroulis, 1997). Specifically, the absence of air decreases the occurrence of oxidative
processes.
The dried structure is affected by pressure especially in terms of generated porosity
(Joardder et al., 2015). It has been reported that decreasing the pressure, the total porosity
increases, limiting the shrinkage of the material (Joardder et al., 2015). As the drying

Literature Review
47
temperature may be lower, the system may dry on a temperature below its glass transition
temperature, reducing or preventing the product collapse (Ratti, 2001).
The vacuum drying kinetics can be considerably higher than for conventional air-drying
since the air and water vapour expansion within the food can provide a larger area/volume
ratio, enhancing both the heat and mass transfer (Lee and Kim, 2009).
Since the pressure is reduced, the main heat transfer modes are based on conduction and
radiation rather than convection (Mujumdar, 2014). However, due to the possible
occurrence of shrinkage and consequent surface area reduction, conduction might not be
efficient (Mujumdar, 2014).
2.3.3 Supercritical fluid technology
Supercritical fluid technology has gained interest due to the unique properties of
supercritical fluids (SCFs) in a variety of areas, including chemistry, biomedicine,
pharmaceutics, cosmetics and food (Gupta and Shim, 2006). The supercritical state is
achieved by raising both the pressure and temperature over the substance critical
properties (Wang, 2008), as reported in the generic phase diagram (Fig. 2.18).

Literature Review
48
Figure 2.18: Generic phase diagram. The supercritical state is formed above the critical
point. Adapted from Nalawade et al. (2006).
The resulting phase is homogeneous with the absence of the meniscus between liquid and
gas, as reported in Figure 2.19.
Figure 2.19: Illustration of supercritical state formation. Presence of gas-liquid interface
below the critical point (1-3). Homogeneous phase as the critical point is reached (Brown,
2010).
Pre
ssu
re
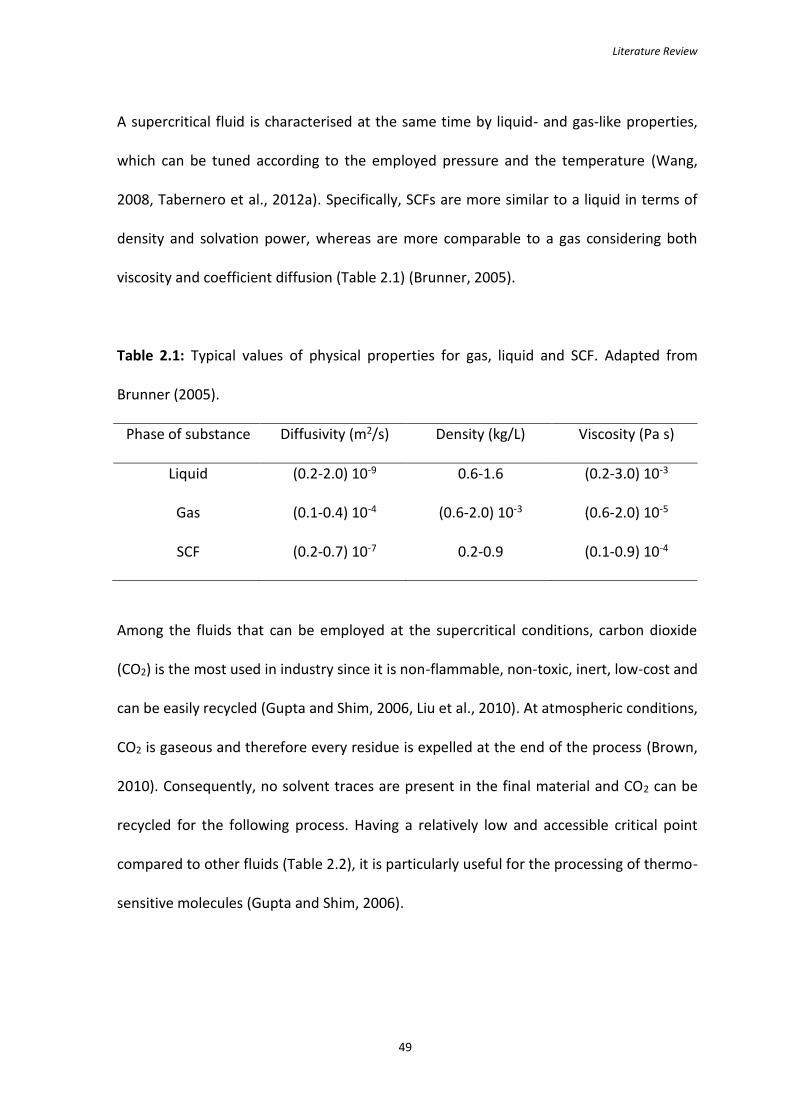
Literature Review
49
A supercritical fluid is characterised at the same time by liquid- and gas-like properties,
which can be tuned according to the employed pressure and the temperature (Wang,
2008, Tabernero et al., 2012a). Specifically, SCFs are more similar to a liquid in terms of
density and solvation power, whereas are more comparable to a gas considering both
viscosity and coefficient diffusion (Table 2.1) (Brunner, 2005).
Table 2.1: Typical values of physical properties for gas, liquid and SCF. Adapted from
Brunner (2005).
Phase of substance Diffusivity (m2/s) Density (kg/L) Viscosity (Pa s)
Liquid (0.2-2.0) 10-9 0.6-1.6 (0.2-3.0) 10-3
Gas (0.1-0.4) 10-4 (0.6-2.0) 10-3 (0.6-2.0) 10-5
SCF (0.2-0.7) 10-7 0.2-0.9 (0.1-0.9) 10-4
Among the fluids that can be employed at the supercritical conditions, carbon dioxide
(CO2) is the most used in industry since it is non-flammable, non-toxic, inert, low-cost and
can be easily recycled (Gupta and Shim, 2006, Liu et al., 2010). At atmospheric conditions,
CO2 is gaseous and therefore every residue is expelled at the end of the process (Brown,
2010). Consequently, no solvent traces are present in the final material and CO2 can be
recycled for the following process. Having a relatively low and accessible critical point
compared to other fluids (Table 2.2), it is particularly useful for the processing of thermo-
sensitive molecules (Gupta and Shim, 2006).

Literature Review
50
Table 2.2: Critical pressures and temperatures of common supercritical fluid. Adapted
from Brown (2010).
Fluid Pc (bar) Tc (°C)
Water 221 374.1
Propane 43 96.8
Nitrous Oxide 72 36.6
Ethanol 64 243.1
Ethane 49 32.5
Carbon dioxide 74 31.1
Ammonia 113 132.4
Two fluids can form a supercritical fluid mixture with homogeneous properties if the binary
system is above and on the right of the mixture critical point (MCP) (Fig. 2.20) (Akien and
Poliakoff, 2009).
Figure 2.20: Generic isotherm phase diagram for a binary system CO2/solvent. Adapted
from Akien and Poliakoff (2009).
EFL

Literature Review
51
On the left of the MCP (Fig. 2.20) and above the critical pressure, the system is called an
“expanded liquid” (or enhanced fluidity liquid, EFL). The anti-solvent (CO2) may contain
larger quantities of solvent in a single homogeneous phase, behaving similarly to the
supercritical fluid mixture (De Marco and Reverchon, 2012) in terms of reduced surface
tension and viscosity (Martin et al., 2013).
Supercritical CO2 (scCO2) assisted processes have been successfully applied to several
fields:
Drying and aerogel production (Ghafar et al., 2017, Jiang et al., 2017)
Petroleum and coal processing (Brunner, 2005)
Material impregnation of active compound (Medeiros et al., 2017)
Extraction and purification (Prieto et al., 2017, Rosa et al., 2017)
Micronisation (Peker et al., 1992, Sievers and Eggers, 1996)
2.3.3.1 Supercritical fluid drying
Supercritical fluid drying is widely used in the production of inorganic aerogels (Scherer,
1990, Estella et al., 2007, Zera et al., 2014) as well as organic aerogels (Tamon et al., 1997,
Brown et al., 2010a). The main advantages of using SCF for drying applications from a
microstructural perspective are the absence of the vapour-liquid interface and the
possibility to carry out the process in a single homogeneous phase, reducing the stress due
to capillarity (Scherer, 1990) (as discussed in Section 2.3.2.2) and avoiding both gel cracking
and collapse (Namatsu et al., 1999, Bouchaour et al., 2003). Supercritical fluid drying may
induce a very little extent of gel shrinkage, but only up to one tenth of the initial volume
(Scherer, 1990), especially upon depressurisation (Rangarajan and Lira, 1991). Rangarajan

Literature Review
52
and Lira (1991) suggested that the shrinkage may be related to a redistribution of the
condensed phases by desorption and subsequent re-adsorption from one pore to another
within the dried gel structure.
A parallel benefit of the use of SCF is the possibility to limit structural thermal damages as
well as chemical reactions by contrast to air-drying, since the CO2 critical temperature is
relatively low (31.1 °C).
A typical SCF-assisted drying process (Fig. 2.21) consists of both vessel pressurisation and
heating above the critical point of the fluid by using a pump/compressor and a heat
exchanger (Wang, 2008). The system is usually controlled through an expansion valve that
can decrease the internal pressure below the critical pressure, leading to a subcritical stage
later in the process. The solubilised solvent in the supercritical fluid medium is collected at
the end of the process by a separator (Wang, 2008).
Figure 2.21: Illustration of a typical SCF drying process. Adapted from Wang (2008).

Literature Review
53
Typically, the SCF-assisted plants for drying work in a batch or semi-continuous
configurations (as further discussed in Chapter 6). The former is based on the solubilisation
of the solvent in the supercritical fluid (which acts as an anti-solvent) within the material
to dry, while the latter consists in a continuous flow of the selected SCF.
Similarly to an extraction process, the drying using supercritical fluids could be considered
as a water removal from the material. However, since the water solubility in supercritical
CO2 is relatively low (Sabirzyanov et al., 2002), a pre-treatment with other organic solvents
(e.g. ethanol) is often required. In this case, water is replaced by a solvent with higher
affinity with the anti-solvent. The SCF enters the sample to be dried in a similar way that
occurs during the extraction process (Brown, 2010): the solvent to be removed is
solubilised in the supercritical fluid medium and displaced out of the material.
In other cases, the solubility of water in the supercritical fluid medium can be enhanced by
using co-anti-solvents (Kopcak and Mohamed, 2005), such as ethanol or acetone, or
surfactants. They can be present at the bottom of the vessel of the batch configuration
(Sawada et al., 2008), or directly pumped as a mixture with the SCF (Brown, 2010).
The reason for the use of co-anti-solvents lies in the fact that the solubility of water in
scCO2, which depends on both the temperature and pressure, is very low. At 50 ⁰C and 200
bar it can be estimated at around 4 mg of water per gram of CO2 (Sabirzyanov et al., 2002),
while at 40 ⁰C and same pressure it is equal to 2.4 mg/g. Therefore, the solubility is almost
halved due to a 10 ⁰C temperature drop (Sabirzyanov et al., 2002), whereas it has a little
dependence on pressure within the range between 20 and 500 bar (Reighard and Olesik,
1996). In Figure 2.22 the low water solubility in scCO2 is reported (Takenouchi and
Kennedy, 1964).

Literature Review
54
Figure 2.22: H2O-CO2 system: isotherm diagram expressing the presence of mixture liquid-
gas. Adapted from Takenouchi and Kennedy (1964).
2.3.3.2 Supercritical fluid extraction
In addition to the drying applications, supercritical fluids are used to extract specific
substances from materials. In this context, the supercritical fluid acts as a solvent, whereas
other organic fluids (e.g. ethanol) as a co-solvent if they are necessary.

Literature Review
55
Solubility is measured as the maximum solute amount which can be dissolved by a solvent
at dynamic equilibrium, leading to a homogeneous solution (Peach and Eastoe, 2014) and
it can be expressed in g L-1 or in mol dm-3. It is related to the amount of solute (e.g. active
compounds to remove from the material) in the supercritical fluid medium.
The solute (e.g. active compounds to remove from the material) can be fully soluble or
have partial solubility in scCO2 and this behaviour is driven by the reduction of the system
energy. In other words, if the solvation process is encouraged, the molecules of the solute
tend to be surrounded by the solvent ones and they avoid staying together (Peach and
Eastoe, 2014).
Different factors contribute to the solvation power, e.g. system polarity, pressure and
temperature, and especially near the critical point supercritical fluids are highly sensitive
to small parameter changes (Sabirzyanov et al., 2002).
Temperature affects the solubility in two distinct ways (Brown, 2010). Firstly, higher
temperature leads to an increase in vapour pressure and consequently to an enhanced
solubilisation of the solute. Secondly, an increment in temperature causes a decrease in
solvent density, affecting the solvation power. These two factors are opposing and the
predominant mechanism depends on the pressure of the system.
In particular, the solubility of single compounds in scCO2 is characterised by the existence
of a so-called “crossover” pressure (Chimowitz and Pennisi, 1986, Gupta and Shim, 2006).
It is defined as the specific pressure around which solubility isotherms (in a range of the
near-critical temperatures) tend to converge (Gupta and Shim, 2006). Figure 2.23 shows
that below the crossover pressure an isobaric increase in fluid temperature results in a

Literature Review
56
solubility reduction. An opposite behaviour is noticed above the crossover pressure (Gupta
and Shim, 2006).
Figure 2.23: Example of crossover pressure for phenanthrene in scCO2. Mole fraction
solubility (y) as function of pressure and temperature. Adapted from Gupta and Shim
(2006).
One of the main drawbacks for scCO2 is that it can completely dissolve only non-polar or
slightly-polar substances. A generally used term is “like dissolves like” (Hansen, 1967) and
40 °C 50 °C 60 °C

Literature Review
57
it refers to the tendency for a polar solute to be easily solubilised by a polar solvent (Peach
and Eastoe, 2014).
To better understand the solubility and the term “like dissolves like”, it could be useful to
mention the Hansen theory (Hansen, 1967). It is based on three parameters (HSP)
expressed in MPa0.5, defined as:
δP the energy for molecular polarity (related to dipole moment)
δD the energy related to dispersion forces (van der Waals)
δH the energy from hydrogen bondings
In the Hansen space, it is possible to identify a point with these parameters as coordinates.
An interaction radius R* can be defined, which expresses how alike two substances are. It
can be calculated as follows (Eq. 2.8):
Ra² = 4(δD1-δD2)² + (δP1-δP2)² + (δH1-δH2)² (Eq. 2.8)
The closer two different substances are, the more probable they tend to solubilise into
each other. In other words, if a material is within the sphere of the solvent found in the
Hansen Space, they are compatible (Hansen, 1967).
Co-solvents or surfactants enhance the solubility of the polar compounds, denoted as the
“entrainer effect”, as well as influencing the critical temperature/pressure of the new
mixture (Reid et al., 1987, Sun, 2002), as shown in Table 2.3.

Literature Review
58
Table 2.3: Critical temperature/pressure for EtOH/CO2 binary mixture as a function of
EtOH mol %. Adapted from Reid et al. (1987).
Mol EtOH (%) Pc (MPa) Tc (°C)
0 7.38 31.1
0.95 7.65 32.7
2.14 7.83 35.3
2.78 8.07 37.2
3.66 8.25 39
4.64 8.61 42.1
6.38 9.19 47
An alternative way to increase the solute solubility is by addition of surfactants, surface-
active amphiphilic molecules composed of a hydrophilic head and a hydrophobic tail that
interact with both polar (e.g. water) and non-polar (e.g. CO2) substances (McClements,
2015). Similarly, to the high system sensitivity to co-solvents, small quantities of
surfactants dramatically change the solution properties. However, the increase in
thermodynamic stability depends on the affinity with the solvent and the dispersed phases
(Liu et al., 2002).
It has been argued that fluorocarbons are more CO2-philic than the equivalent
hydrocarbons (Peach and Eastoe, 2014). Recently, a reduction of the use of fluorocarbons
has been aimed to limit environmental hazards (Peach and Eastoe, 2014). To keep the
toxicity down, silicones have been investigated, considering that this polymer class belongs
to the CO2-philic substances (Liu et al., 2002). However, these polymers need higher
pressure to obtain a single homogeneous phase compared to the fluorocarbons (Liu et al.,
2002).

Literature Review
59
Liu et al. (2002) reported that two non-ionic, non-fluorous and non-silicone surfactants (Ls-
36 and Ls-45) are recommended to be used to solubilise a significant amount of water in a
CO2 medium (Fig. 2.24).
Figure 2.24: Polymer chains of the Ls-36 and Ls-45 surfactants. Adapted from Liu et al.
(2002).
These surfactants have both EO (ethylene oxide) and PO (propylene oxide) groups. The
number of EO groups along the polymer chain is expressed by “m”, whereas “n” refers to
the number of the PO groups. In particular, the latter is more CO2-philic than the former,
therefore the higher the ratio PO/EO is, the higher the solubility of the polymer in CO2 is.
In other words, the solubility depends on the ratio m/n (Liu et al., 2002).
2.4 Dried gels
The resulting dried gels from the discussed techniques are classified into three main
classes (Gulrez et al., 2011, Banerjee and Bhattacharya, 2012):
Xerogels are solid monoliths of material obtained by unhindered shrinkage (Banerjee and
Bhattacharya, 2012). It is typically the result of air-drying (Job et al., 2005), which leads to
the collapse of the network and gel densification (Joardder et al., 2015). The pore size is
relatively small compared to the other dried gel structures.

Literature Review
60
Cryogels are freeze-dried macroporous materials (Job et al., 2005), that can be considered
like a sponge (Lozinsky et al., 2003, Kumar et al., 2010), where the solvent fills the
structure. The polymer chains are forced to align and to associate along the ice crystal
edges in a so-called side-by-side mechanism (Zhang et al., 2013). Upon rehydration, these
cryogels are comparable to the gel structures obtained by freezing and thawing weak gels
(Richardson and Norton, 1998, Giannouli and Morris, 2003).
Cryogels have often a high-porous structure, with relatively large pores (Lozinsky et al.,
2003) and thinner pore-walls (Cassanelli et al., 2017c).
Aerogels are mesoporous materials composed of “being” (solid domains) and
“nothingness” (free volume space) (Rolison and Dunn, 2001). The resulting structure has a
low-density and high specific surface area (Banerjee and Bhattacharya, 2012). They are
generally produced by using supercritical fluid, which can solubilise and displace the
solvent within the gel network, limiting the shrinkage of the material (Scherer, 1990). It
has been shown that the porous structure is exclusively dependent on the supercritical
fluid conditions during the drying process (Brown, 2010).
Figure 2.25 shows the dried gels are schematically reported (Rolison and Dunn, 2001,
Lozinsky et al., 2003).

Literature Review
61
Figure 2.25: Scheme of dried gels after air-drying (xerogel), freeze-drying (cryogel) and
using supercritical fluids (aerogel). Adapted from Rolison and Dunn (2001).
2.5 Rehydration
Dried food is often expected to rehydrate to recover the properties of the fresh product,
such as texture, colour, shape and flavour. Hence, the quality of dried products to be
rehydrated cannot be satisfactory if their rehydratability is limited or there is only a partial
water re-absorption (Ratti, 2001). Although it depends on the specific product, the amount
of water to be recovered should be close to the quantity before drying. Examples of food
intended to be rehydrated are vegetables (Bakalis and Karathanos, 2005, Goula and
Adamopoulos, 2009, Vergeldt et al., 2014), pasta and cereal products (Ogawa et al., 2014),
ready meals and food/dairy powder (e.g. soups or sauces) (Hogekamp and Schubert, 2003,
Richard et al., 2013, Abdel-Haleem and Omran, 2014).
The extent and rate of rehydration are strictly dependent on the drying conditions, which
can degrade and alter the material structure as well as its chemical/physical properties
(Marabi et al., 2006). The extent of rehydration gives information about the quantity of
water that it is re-absorbed by the material at the equilibrium, while the rate indicates the
speed of the rehydration. They are both influenced by the material structure, especially in

Literature Review
62
terms of shape, shrinkage, porosity, pore size distribution and thickness of the pore wall,
and by the chemical properties, such as material wettability (Aguilera and Stanley, 1999).
Rehydration can be assessed by measuring the sample moisture content over time
(Krokida and Marinos-Kouris, 2003), finding rehydration ratio R0, calculated as the ratio
between the mass of the rehydrated (Mr) and dried sample (Md) (Eq. 2.9).
Rehydration ratio (Ro) = Mr/Md (Eq. 2.9)
The water transport through the dried material is generally based on molecular diffusion,
but multiple mechanisms may occur at the same time, such as vapour diffusion, Knusden
diffusion, surface diffusion, hydrodynamic flow and capillary flow (Saguy et al., 2005).
In addition to the chemical/physical properties of the material, the medium properties
affect the rehydration process. In particular, the temperature, viscosity and polarity of the
liquid, as well as the presence of solutes, may influence the process kinetics (Krokida and
Marinos-Kouris, 2003).
Based on the final application of the product, it results clear that drying should be designed
according to the rehydration process.
2.6 Conclusions
The quality of dried food is key for the food industry. Preservation of nutrients, shelf life
extension, enhanced product stability, customer-pleasing appearance and high
rehydratability are the main factors to pursue to meet the high-quality standards. Their
achievability is strictly dependent on the drying technique. Water can be removed by

Literature Review
63
sublimation, evaporation or via solvent replacement, leading to a different structure and,
therefore, quality. The final application of the dried food and the market to target can
indicate the best way to dry the material. Once the method is defined, the optimisation of
the drying process is required to have a more efficient, robust and safe process. The
presence of ingredients that highly interact with water within the food formulation, such
as hydrocolloids, makes the study of drying and rehydration mechanisms more complex,
as they are likely to interact also with other product constituents.
64
Chapter 3
Investigation of freeze-dried gellan gum structure: effect of gel formulation
This work is published as follows:
Cassanelli, M., Norton, I., & Mills, T. (2018). Role of gellan gum microstructure in freeze
drying and rehydration mechanisms. Food Hydrocolloids, 75: 51-61.
Cassanelli, M., Norton, I., & Mills, T. (2018). Interaction of mannitol and sucrose with gellan
gum in freeze-dried gel systems. Food Biophysics, 13, 304-315.

Investigation of freeze-dried gellan gum structure: effect of gel formulation
65
3.1 Introduction
Hydrocolloids are of importance in the food industry, as gelling agents, stabilisers or
thickeners (Phillips and Williams, 2000, Norton and Foster, 2002, Williams and Phillips,
2002, Renard et al., 2006). They are often used in complex products, such as dairy or instant
food, to modulate and enhance their mouthfeel and textural properties (Rolin, 1993, de
Vries, 2002, Norton and Foster, 2002, Renard et al., 2006). As the quality of the food
product is the result of the interaction between the formulation constituents
(Pongsawatmanit et al., 1999, Kaushik and Roos, 2007), hydrocolloids might behave
differently depending on how they interact with other ingredients. Particularly in the
confectionery industry, gelling agents are often used in combination with
sugars/sweeteners (Edwards, 2007). Interactions with other gums and/or additives can
lead to synergistic rheological/textural properties (Phillips and Williams, 2000).
To improve both preservation and storage, food frequently needs to be dehydrated (Brown
et al., 2010a) or to have a reduced moisture content and water activity, depending on the
specific industrial applications (Barbosa-Cánovas et al., 2008). To achieve a high product
quality, all the formulation constituents and their interaction should be considered during
the drying process. Among the common drying techniques, Scherer (1990) recommended
freeze-drying as a method to enhance both product shape and volume preservation,
decreasing shrinkage, since it is based on the sublimation of water from the solid matrix,
and providing a high-quality structure (Ratti, 2001).
Before consumption, the dried food is often rehydrated (Marabi et al., 2006, Joardder et
al., 2015). The water uptake is dependent on both the structure and properties of the
freeze-dried gel embedded within the product formulation, affecting some mechanisms,

Investigation of freeze-dried gellan gum structure: effect of gel formulation
66
such as sugar/salt release from the gel network if they are present as solutes (Hoffman,
1987, Tønnesen and Karlsen, 2002, Lin and Metters, 2006, Nishinari and Fang, 2016).
Freeze-dried gels from hydrocolloids, such as low acyl (LA) and high-acyl (HA) gellan gum
gels, have already been investigated in terms of dried structure (Silva‐Correia et al., 2011,
Tiwari et al., 2015). However, Silva‐Correia et al. (2011) and Tiwari et al. (2015) reported
analyses only based on Scanning Electron Microscopy results, without providing
information about pore size distribution throughout the entire bulk volume. A micro
Computed Tomography analysis can provide a deeper understanding at the
macroscopic/microscopic level. Interestingly, there is a lack of information about freeze-
dried HA gellan gum structure, or a clear comparison with LA gellan gum. Furthermore, the
freeze-drying kinetics for gellan gum systems has not been investigated yet, especially
highlighting the role of the molecular configuration. Abramovič and Klofutar (2006)
suggested that the water absorption on gellan gum polymer is strictly dependent on its
molecular structure, providing a useful support for drying kinetics modelling. However, in
that study these considerations were applied to a generic drying process, and without
considering the 3D macrostructure. Gantar et al. (2014) investigated the rehydrated gellan
gum after freeze-drying in terms of final water uptake. Nevertheless, in the same work the
rehydration kinetics was not proposed and HA gellan gum was not considered.
Although Morris et al. (2012) reviewed the role of sucrose in gellan gum gels, the literature
to date does not report any information about the effect of alternative sweeteners, such
as mannitol, on the gellan gum gel systems at the molecular level. Mannitol is a sugar
alcohol produced by several organisms (Wisselink et al., 2002), commonly used in the food
industry as an alternative sweetener (Mitchell, 2008). Although mannitol and polyols are
Investigation of freeze-dried gellan gum structure: effect of gel formulation
67
referred to as sugar alcohols, they are not actual carbohydrates, as they contain two more
hydrogens in their formula due to hydrogenation (Mitchell, 2008). Mannitol tends to
crystallise from aqueous solution on freezing, showing a polymorphic behaviour (Berman
et al., 1968, Kim et al., 1998, Yu et al., 1999, Yoshinari et al., 2002), whereas sucrose forms
an amorphous matrix from the aqueous solution after freeze-drying (Islesias and Chirife,
1978, ChinachotiI and Steinberg, 1986, Carstensen and Van Scoik, 1990, Mathlouthi and
Reiser, 1995, Levenson and Hartel, 2005, Abdelwahed et al., 2006a).
Nussinovitch et al. (2000) investigated the effect of sucrose in freeze-dried gellan, agar and
k-carrageenan gels on both the mechanical and acoustic properties, yet the influence of
sucrose on the freeze-dried structure, in terms of porosity and pore-wall thickness
distribution, was not mentioned.
In this Chapter, the study of freeze-drying and rehydration for low acyl (LA) and high-acyl
(HA) gellan gum gels and their mixtures from a molecular and structural point of view is
proposed. In addition, the interaction between sucrose and mannitol with LA gellan gum is
investigated in terms of freeze-dried gel microstructure and subsequent water re-
absorption.
3.2 Materials and methods
3.2.1 Gel preparation
In this study, low acyl (Kelcogel F, CPKelco, UK) and high acyl (Kelcogel LT100, CPKelco, UK)
gellan gum were used as gelling agents. Different polymer mass fractions (1.5, 2, 2.5, 3
wt%) were used to prepare gels. For the polymeric solution, distilled water, obtained by a
water still system (Aquatron A400D, Stuart, UK), was heated up to 85 °C and then gellan

Investigation of freeze-dried gellan gum structure: effect of gel formulation
68
gum powder was slowly added to avoid clump formation. To have complete powder
hydration and dissolution, the solutions were stirred for two hours at constant
temperature.
Sugars were added in different contents (5, 10, 15 and 20 wt%) and, in this case, LA gellan
gum was kept constant at 2 wt%. D-Mannitol (Sigma-Aldrich, UK) or sucrose (Sigma-Aldrich,
UK) were added to hot distilled water at 85 °C, followed by a slow addition of gellan gum.
All materials were used with no further treatment or purification.
The gel samples were moulded with a 22 mm diameter and 60 mm height, covered with a
plastic film to avoid water evaporation and stored at room temperature (20 °C ± 1 °C) for
24 hours before characterisation.
Afterwards, the gels were cut, and from each mould, four samples were obtained (22 mm
in diameter and 15 mm in height). The sample dimensions were chosen to facilitate the
visual assessment of the gel during texture analysis.
3.2.2 Molecular interactions: μDSC and FTIR
Analyses were performed by using a μDSC 3 evo (Seteram Instrumentation, France).
Samples were accurately weighed (0.6 g ± 0.1 g) and placed in the “closed batch cell”. The
reference cell was filled with an equal mass of distilled water. A series of two
heating/cooling cycles was applied with an isothermal period to reduce the thermal history
effect at the beginning. The samples were initially held isothermally at 5 °C for 15 minutes.
The first cycle consisted of a sample heating from 5 °C to 85 °C and following cooling to 5
°C. The rate of both heating and cooling was constant at 1 °C/min. The second cycle was
set at the same conditions.

Investigation of freeze-dried gellan gum structure: effect of gel formulation
69
The μDSC curves were plotted as an average of the first cycles in triplicate and offset on
the y-axis for clearer visualisation, whereas the related values of transition temperature,
enthalpy and entropy were reported with plus/minus a single standard deviation.
Molecular interactions between the gellan gum and sugars were evaluated by Fourier
transform infrared (FTIR) spectroscopy (Spectrum Two IR Spectrometer, Perkin Elmer, USA)
in reflection mode within the wave numbers range 600–4000 cm−1 at a resolution of 4 cm-
1. For each sample, 16 scan signals were averaged to reduce the noise.
3.2.3 Texture analysis
Mechanical properties were determined by uniaxial compression test using a texture
analyser (TA.XT plus, Stable Micro System Ltd, UK), fitted with a 40 mm diameter cylinder
probe (P-40), lubricated with silicon oil to minimise friction between the samples and the
probe/plate (Bagley et al., 1985). The analyses were carried out with a compression rate of
2 mm/s (Norton et al., 2011). For each sample, the load to failure and elasticity were
determined by measuring the peak force after 50% strain and the Young’s modulus. The
peak force was used to have an indication about the gel strength on compression.
The gel compression was plotted in force/distance, reporting a plus/minus standard
deviation on the curve every 0.5 mm.
The load to failure value is the force peak in the force-time graph, whereas the Young’s
modulus is measured by elaborating the “true strain” (H)/“true stress” (T) curve, using
the following Equations (3.1-3.4) (Mao et al., 2000):
Investigation of freeze-dried gellan gum structure: effect of gel formulation
70
E = (H0 –h)/H0 (Eq. 3.1)
H = ln(1 + E) (Eq. 3.2)
E =F/A0 (Eq. 3.3)
T =E (1 + E) (Eq. 3.4)
where E and H are respectively the engineering and true strains, while E and T are the
engineering and true stresses. A0 and H0 are the cross-sectional area and initial height of
each sample. F and h are the recorded compression force applied and height of each
sample.
3.2.4 Freeze-drying
The gel samples were put into a -18 °C freezer for 24 hours, applying a 0.2 °C/min freezing
rate, previously measured by using thermocouples at both the sample surface and core.
Afterwards, they were placed into the freeze-dryer (SCANVAC 110-4 PRO, LaboGene,
Denmark) onto the shelf trays at room temperature (20 °C ± 1 °C). The chamber pressure
was lowered to 0.18 mbar by a rotary pump and the temperature of the condenser was set
at -110 °C.
The drying kinetics experiments were performed by running the process at 1, 3, 6, 18, 24,
30 and 48 hours, after which the samples were stored under low vacuum conditions in a
desiccator with silica gel beads until characterisation.
The dried-gel structures obtained by combining the two gellan gum gel types or
mannitol/sucrose were investigated after 48-hour freeze-drying.

Investigation of freeze-dried gellan gum structure: effect of gel formulation
71
These process parameters were kept constant for all experiments, to highlight the effect of
the gel formulation on the structure.
3.2.5 Normalised Moisture Content (NMC) and water activity
The dimensionless value NMC (Normalised Moisture Content) (Brown et al., 2010a) was
used to monitor the sample water content at the end of the drying process and during
rehydration (Eq. 3.5).
(Eq. 3.5)
Where Md is the sample mass after drying (or during rehydration), Ms the solid sample
mass, and Mo sample mass before drying. Mo was measured before putting the gels into
the freezer. NMC is expressed as g water/g solid content at the time t over the initial
moisture content in g water/g solid content on a dry basis (Eq. 3.5).
According to this measurement, Ms was calculated. To find it, part of the samples was put
into an oven to air-dry for 24 h at 60 ⁰C. This gentle thermal treatment could avoid potential
gel degradation due to the high temperatures, yet assuring a moisture content plateau is
reached (24 hours). When the solid mass percentage of these samples from the same batch
was found, it was used to assess Ms. The solid content experimentally calculated was equal
to the value calculated by using the constituent mass percentage used for the gel
preparation, showing that the assumption about the method of Ms calculation was suitable.
The negligible moisture content threshold is suggested by Brown (2010) as NMC < 0.1.
The Aqualab dew point water activity meter (4TE, Labcell LTD, UK) was used to measure
the water activity values. The gel samples were placed into the test chamber at 25 °C, after
𝑁𝑀𝐶 =
(𝑀𝑑 − 𝑀𝑠)𝑀𝑠
(𝑀𝑜 − 𝑀𝑠)𝑀𝑠
=(𝑀𝑑 − 𝑀𝑠)
(𝑀𝑜 − 𝑀𝑠)

Investigation of freeze-dried gellan gum structure: effect of gel formulation
72
being crushed to expose the remaining water in the core of the sample, if present due to
an incomplete drying.
3.2.6 Drying modelling
Drying kinetics was evaluated by comparing two semi-theoretical models commonly used
for drying (Table 3.1), the Newton model (Jain and Pathare, 2004, Akpinar, 2006) and the
Page model (Akpinar, 2006, Erbay and Icier, 2010, Belghith et al., 2016). The regression
analysis is based on the Least Squares method.
Table 3.1: Models used for freeze-drying.
Model Model’s Equation Parameters
Oswin (Abramovič and
Klofutar, 2006)
𝑀𝑒𝑞 = 𝐴[𝑎𝑤
(1 − 𝑎𝑤)]𝐵 LA gellan:
A=0.136; B=0.446
HA gellan:
A=0.106; B=0.478
Page (Akpinar, 2006)
𝑀𝑅 = 𝑒−𝐾𝑡𝑛 K: empirical coefficient
n: number constant
t: drying time
Newton (Akpinar, 2006) 𝑀𝑅 = 𝑒−𝐾𝑡 K: empirical coefficient
The drying kinetics models chosen were based on both the actual moisture content (Mcd)
and at the equilibrium point (Meq), defined by the Moisture Ratio (Darvishi et al., 2014),
expressed on a dry basis in the Equation 3.6:

Investigation of freeze-dried gellan gum structure: effect of gel formulation
73
(Eq. 3.6)
Where Mco stand for the initial moisture content before drying.
In order to find Meq and the desorption isotherm curves, the Oswin model (Table 3.1) was
used to have the relationship between water activity and the moisture content at the
equilibrium, based on experimental aw data for both LA and HA gellan gum. The gels were
analysed at specific drying times by placing them into the water activity meter, where they
reached the equilibrium at 25 °C. Abramovič and Klofutar (2006) have argued that the
Oswin model, in comparison with other models, better fits the experimental data in all the
range of water activity (aw) specifically for both LA and HA gellan gum.
3.2.7 Microscopy
Investigation of the dried gel structure was performed by using a light microscope (Brunel
SP300-fl Brunel Microscopes Ltd., UK) fitted with an SLR camera (Canon EOS 133 Rebel XS,
DS126 191). Objective lens up to 4× magnification was used.
In combination with optical microscopy, X-ray micro computed tomography (Bruker µCT,
SkyScan 1172, Belgium) was performed to quantitatively analyse the total porosity. This
system allows visualisation of 2D cross-sections and generates a complete 3D structure
reconstruction without any chemical fixation. The acquisition mode can be set at a
maximum current of 96 μA and voltage of 100 kV. Qualitative and quantitative analyses
were performed using a CT-analyser (1.7.0.0), after binarisation into black and white
𝑀𝑅 = 𝑀𝑐𝑑 (𝑡) − 𝑀𝑒𝑞
𝑀𝑐𝑜 − 𝑀𝑒𝑞

Investigation of freeze-dried gellan gum structure: effect of gel formulation
74
images, obtaining porosity information. The “sphere-fitting” algorithm was applied for the
structure porosity and pore-wall thickness calculations.
Scanning Electron Microscope (ESEM FEG, XL30, Philips, The Netherlands) was used to
collect high-quality micrographs of the dried gel/sugar structures. After cooling in liquid
nitrogen, the dried gels were cut in both vertical and horizontal direction. The maximum
voltage was set up to 10 kV and the magnification to x 150.
3.2.8 Static contact angle and wettability
Measurements were performed at room temperature (20 °C ± 1 °C) using the KRÜSS Drop
Shape Analyser (DSA 100, Germany). A 500 µL glass syringe with a 0.5 mm needle diameter
was used to deposit a 5 µl distilled water drop onto the dried gel. The freeze-dried samples
were previously compressed into circular tablets (10 mm in diameter and 3 mm in height)
to obtain a flat surface, applying 10 tons in a hydraulic press for 10 seconds.
The static sessile drop method was used to measure the distilled water contact angle. These
values were collected 2 seconds after the drop deposition.
3.2.9 Rehydration and swelling
The water uptake was evaluated by measuring the sample weight every 6 minutes for 30
minutes and after 24 h to determine the rehydration end point and swelling behaviour. The
gel samples, completely submerged in distilled water (100 ml) (Vergeldt et al., 2014) at
room temperature (20 °C ± 1 °C), were gently blotted before weighing. The NMC values
(Eq. 3.5) were adjusted taking into consideration the solid evolution over time, due to the
sugar release into water. In particular, Ms was re-calculated at each time: the amount of

Investigation of freeze-dried gellan gum structure: effect of gel formulation
75
sugar in solution was measured and subtracted from the initial solid content in the sample.
In Eq. 3.5, Md becomes Mr, function of time.
The rehydration behaviour was determined plotting NMC as a function of time. Swelling
capability was assessed by measuring the gel weight (Khare and Peppas, 1995) at the
rehydration plateau after 24 hours and was normalised with the original weight (before
drying).
3.2.10 Rehydration modelling
Regression analysis was carried out using both linear and polynomial fitting. The freeze-
dried gel system was further investigated by applying the Peleg model (Goula and
Adamopoulos, 2009) (Table 3.2).
Table 3.2: Peleg model for rehydration.
Peleg (Goula and
Adamopoulos, 2009)
𝑋(𝑡) = 𝑋0 + 𝑡
∝ +𝛽𝑡
𝑋𝑒𝑞 = 𝑋0 + 1
𝛽
X: Moisture content at time t
Xo: Initial moisture content
Xeq: Equilibrium moisture content
t: time
β: Peleg capacity constant
α: Peleg rate constant
3.2.11 Sugar release
Sugar release was evaluated by using a small-volume, temperature-controlled, automatic
refractometer (J357, Rudolph Research Analytical, USA). The dried samples were located in
100 ml of distilled water at room temperature (20 °C ± 1 °C), simulating sink conditions
Investigation of freeze-dried gellan gum structure: effect of gel formulation
76
(Petralito et al., 2012). The measurement was carried out on 0.5 ml of solution, withdrawn
every 3 minutes up to 30 minutes. The analysed solution was pipetted into the original
solution to avoid increasing the concentration as an artefact. The plotted graphs present
normalised curves expressed as Release Ratio (RT) on a scale from 0 to 1 (Eq. 3.7).
𝑅𝑒𝑙𝑒𝑎𝑠𝑒 𝑅𝑎𝑡𝑖𝑜 (𝑅𝑇) =
𝑔 𝑠𝑢𝑔𝑎𝑟
𝑔 𝑤𝑎𝑡𝑒𝑟(𝑡)
𝑔 𝑠𝑢𝑔𝑎𝑟 𝑚𝑎𝑥
𝑔 𝑤𝑎𝑡𝑒𝑟
(Eq. 3.7)
Where g sugar/g water is the experimental value as a function of time, while g sugar max/g
water represents the concentration of the amount of sugar constituting the dried sample.
3.2.12 Sugar release modelling
The gellan/solute system was further investigated by applying the simplified Higuchi model
(Eq. 3.8) and have a comparison with the theoretical behaviour of the gel in water
(Tongwen and Binglin, 1998, Costa and Lobo, 2001).
𝑓𝑡 = 𝐾𝐻𝑡0.5 (Eq. 3.8)
where ft is the amount of released sugar into the solution by surface unit and is KH stands
for the Higuchi dissolution constant.
Costa and Lobo (2001) suggested that the Higuchi model is particularly suitable to model
the release of active compounds from porous materials, applying the percolation theory to
the equation: the Higuchi dissolution constant can be derived taking into consideration the
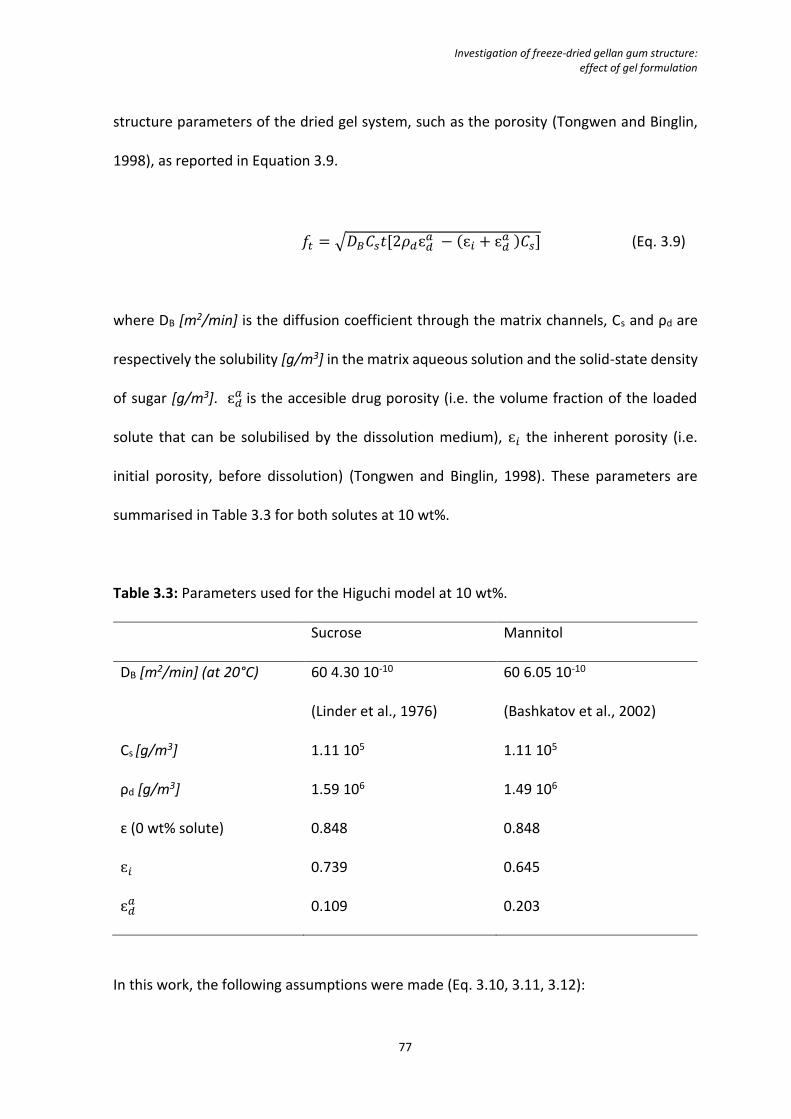
Investigation of freeze-dried gellan gum structure: effect of gel formulation
77
structure parameters of the dried gel system, such as the porosity (Tongwen and Binglin,
1998), as reported in Equation 3.9.
𝑓𝑡 = √𝐷𝐵𝐶𝑠𝑡[2𝜌𝑑ɛ𝑑𝑎 − (ɛ𝑖 + ɛ𝑑
𝑎 )𝐶𝑠] (Eq. 3.9)
where DB [m2/min] is the diffusion coefficient through the matrix channels, Cs and ρd are
respectively the solubility [g/m3] in the matrix aqueous solution and the solid-state density
of sugar [g/m3]. ɛ𝑑𝑎 is the accesible drug porosity (i.e. the volume fraction of the loaded
solute that can be solubilised by the dissolution medium), ɛ𝑖 the inherent porosity (i.e.
initial porosity, before dissolution) (Tongwen and Binglin, 1998). These parameters are
summarised in Table 3.3 for both solutes at 10 wt%.
Table 3.3: Parameters used for the Higuchi model at 10 wt%.
Sucrose Mannitol
DB [m2/min] (at 20°C)
60 4.30 10-10
(Linder et al., 1976)
60 6.05 10-10
(Bashkatov et al., 2002)
Cs [g/m3] 1.11 105 1.11 105
ρd [g/m3] 1.59 106 1.49 106
ɛ (0 wt% solute) 0.848 0.848
ɛ𝑖 0.739 0.645
ɛ𝑑𝑎 0.109 0.203
In this work, the following assumptions were made (Eq. 3.10, 3.11, 3.12):

Investigation of freeze-dried gellan gum structure: effect of gel formulation
78
DB ≅ D (Eq. 3.10)
𝜀 ≅ 𝜀𝑑 + 𝜀𝑖 (Eq. 3.11)
𝜀𝑑 = ɛ𝑑𝑎 + ɛ𝑑
𝑐 ≅ ɛ𝑑𝑎 (Eq. 3.12)
where D is the diffusion coefficient in the medium and ɛ𝑑𝑐 the non-accessible drug porosity
(Tongwen and Binglin, 1998).
In this work, this model was used only for gels with 10 wt% sucrose or mannitol. The control
was performed by using equivalent amount of sugar/water to measure the required time
to have complete solute solubilisation.
3.2.13 Statistical analysis
All the experiments were carried out in triplicate. Errors were expressed as plus/minus a
single standard deviation.
The drying/rehydration kinetics were investigated and modelled by using the experimental
average values.
3.3 Results and discussion
3.3.1 Investigation of LA/HA freeze-dried structure
3.3.1.1 Freeze-drying
A series of experiments was carried out to investigate the drying process in terms of water
activity as a function of time, highlighting the effect of the polymer content (1.5, 2, 2.5, 3
wt%) for both LA and HA gellan gum.

Investigation of freeze-dried gellan gum structure: effect of gel formulation
79
In general, it was confirmed that water activity was highly dependent on the material,
rather than the polymer content, since no specific trends were observed by changing the
solid mass percentage in the studied range.
The water activity decrease over time on freeze-drying was completely different between
LA and HA gellan gum, as shown in Fig. 3.1. The former reached a value below the microbial
growth threshold (0.6) faster than the latter. This means that at a given timescale, water
interacts with HA gellan gum less, resulting in a higher water activity value. The final values
of water activity (48 hours) were in agreement with those for a freeze-dried product
(Beuchat, 1981). For all drying time points, it is important to consider that the material can
easily re-adsorb moisture from the surroundings, affecting the water activity test reading.
In fact, a completely dried material would lead to a water activity value close to zero.

Investigation of freeze-dried gellan gum structure: effect of gel formulation
80
Time (h)
24 30 36 42 48
Wa
ter
activi
ty
0.0
0.2
0.4
0.6
0.8
1.0
LA Gellan gum 1.5%
LA Gellan gum 2%
LA Gellan gum 2.5%
LA Gellan gum 3%
Microbial growth threshold
(A)
Time (h)
24 30 36 42 48
Wa
ter
activi
ty
0.0
0.2
0.4
0.6
0.8
1.0
HA Gellan gum 1.5%
HA Gellan gum 2%
HA Gellan gum 2.5%
HA Gellan gum 3%
(B)
Microbial growth threshold
Figure 3.1: Water activity (aw) as a function of drying process time and LA (A), HA (B) gellan
gum content.

Investigation of freeze-dried gellan gum structure: effect of gel formulation
81
The different behaviour in gellan gum systems (Fig. 3.1) is related to the specific gel
microstructure and the different interaction between the polymer and water. What could
effectively change the water interaction and, therefore, aw are both the morphological and
the chemical aspects. Considering the former, the steric hindrance of acetyl groups along
the HA gellan chain, which are not present along the LA one, keep the polymer network
more open (Mao et al., 2000) and obstruct the aggregation of the double helices (Morris et
al., 2012). This may have an effect on the interaction of water molecules with the gel
network and, therefore, on the value of water activity. From a chemical point of view, the
glycerate substituents tend to stabilise the double helix aggregation, since more hydrogen
bonds are created within the strands and between the helices (Morris et al., 2012). This
suggests that more interactions with water are expected for the HA gellan gum gel. In fact,
from the water activity results reported in Fig. 3.1, the combination of these two factors
led to weaker interaction between water molecules and HA gellan gum network. To further
investigate this observation, wettability for both the gel types was assessed by measuring
the static contact angle with distilled water after two seconds after the drop deposition.
For LA gellan gum the value was 78.5° ± 1.2°, while HA gellan was less wettable, as the
contact angle is 97.2° ± 2.2°. In effect, as the carboxyl groups affect the polymer
hydrophilicity (Prezotti et al., 2014), the presence of the L-glyceryl groups, which change
their orientation, can be the reason for the reduced HA gellan gum wettability, indicating
that in general water interacts less with HA gellan gum. In fact, Abramovič and Klofutar
(2006) suggested that LA gellan gum “binds” in a dynamic equilibrium more water per gram
of material, 0.0683 g/g against 0.0594 g/g for HA gellan gum, since the number of available
active sites is larger, showing that water interacts more with LA gellan gum. Specifically,

Investigation of freeze-dried gellan gum structure: effect of gel formulation
82
this water monolayer in a dynamic equilibrium depends on the rapid interaction (less than
10-11 seconds) between the water molecules and the chemical substituents of the polymer
chains (Barbosa-Cánovas et al., 2008). Furthermore, Abramovič and Klofutar (2006)
reported that the area of the monomolecular layer per gram of LA gellan gum is 242 m2/g
against 211 m2/g for HA gellan gum.
In this study, it seems that the polymer content does not affect the results. It is well-known
that more polymer leads to the distance reduction between the helices, increasing the
possibility to have junction zones, and therefore increasing the mechanical properties
(Banerjee and Bhattacharya, 2011). However, in terms of freeze-drying this effect was
negligible in the range between 1.5 and 3 wt% (Fig. 3.1). Moreover, since the pH of the
polymeric solution is constant for both the materials as a function of the polymer amount,
the overall molecular charge density, which might affect the water activity within the
material, is likely to remain constant in this range (as further discussed in Chapter 4).
The freeze-drying process parameters influenced the drying rate, but they were kept
constant for all the experiments to highlight the effect of the material properties. After 48-
hour drying all the samples were below the moisture content limit (NMC < 0.1), set as a
reference (Brown et al., 2010a).
The collected water activity values for both the gels were used to model both the
desorption isotherms at 25 °C and the drying kinetics. For all the drying times, the gels were
placed in the water activity meter and the equilibrium at 25 °C was reached. The desorption
isotherms were found by using the Oswin model (Fig. 3.2). Since the water activity is not
dependent on the polymer content, the experimental values used in the model were the
aw related to 2 wt% gellan gum, assumed as a reference. From this comparison, at a given

Investigation of freeze-dried gellan gum structure: effect of gel formulation
83
generic equilibrium moisture content, the water activity was lower for LA than for HA gellan
(Fig. 3.2), in agreement with Abramovič and Klofutar (2006), especially in the linear region
of the isotherm, which describes water absorbed in multilayers (Mathlouthi, 2001). This is
likely to be due to the relatively weaker interaction between the HA gellan gum network
and water molecules, since the water content in the monolayer region (Mathlouthi, 2001)
is slightly higher for LA gellan due to the different molecular structure

Investigation of freeze-dried gellan gum structure: effect of gel formulation
84
Figure 3.2: Desorption isotherms at 25 °C: () LA gellan 2 wt% and () HA gellan 2 wt%.
Once the Meq and MR were worked out, the freeze-drying kinetics was found by fitting the
experimental data with the Newton and the Page models (Fig. 3.3 A-B). Interestingly, the
freeze-drying kinetics was not affected by the specific gel type, since the trends are similar.
For both materials, it was found that the Page model better fits the experimental points,
as the R2 is higher. It might suggest that a first-order kinetics model (Newton) is not the
most suitable to fit the experimental data for freeze-drying than an exponential model
(Page).
Water activity

Investigation of freeze-dried gellan gum structure: effect of gel formulation
85
Figure 3.3: Moisture content ratio (MR) for LA gellan gum (A) and HA gellan gum (B) both
at 2 wt% as a function of drying process time. Experimental average values are reported.
(A)
(B)

Investigation of freeze-dried gellan gum structure: effect of gel formulation
86
Polymer content should affect the drying kinetics, increasing the product resistance to the
water vapour flow, since a more packed and entangled three-dimensional network is
expected as the mass fraction rises. However, no significant discrepancies were noted as a
function of the contents, as discussed for water activity. It suggests that the relative
increase in the polymer mass is negligible in terms of drying kinetics and change of water
activity.
In Fig. 3.4, the MR values as a function of water activity are shown (HA and LA gellan gum
at 2 wt%). As discussed in Fig. 3.1, there is a considerable gap between HA and LA gellan
gum in terms of water activity, especially at low moisture content values, suggesting that
water interacts more with LA gellan gum.
Water activity
Figure 3.4: Moisture ratio (MR) vs water activity for LA (blue stars) and HA (red circles) gellan
gum. Mass fraction at 2 wt%.

Investigation of freeze-dried gellan gum structure: effect of gel formulation
87
The experimental data were fitted with a two-term exponential function. R2 is 0.999 and
0.992 respectively for LA and HA gellan gum.
3.3.1.2 Freeze-dried structure
The freeze-dried gel structure is deeply affected by the crystal nucleation and growth
during the freezing step, resulting in a highly porous structure (Roos, 2012). Therefore, the
freezing rate was kept constant throughout the experiments and the final temperature was
set at -18 °C.
Ice crystal size and shape are related to the gel formulation and material properties. The
latter, such as mechanical properties, can affect the ice crystal growth and lead to a
different freeze-dried structure (Voitkovskii, 1962, Caldwell et al., 1992, Regand and Goff,
2003): a softer material, able to support more stretch, might more easily accommodate the
ice crystals, without breaking the material membrane along the ice crystal edges (Scherer,
1990).
In this context, the generated freeze-dried gel structure was investigated by micro
computed tomography (Fig. 3.5). These micrographs suggest that the produced pores
during the ice crystal sublimation are interconnected, forming paths for water to be
reabsorbed in the following rehydration process, as the calculated total porosity
corresponded entirely to the open porosity and the close porosity was negligible: for 2 wt%
LA gellan the total porosity was 84.8% ± 4.2% (Fig. 3.5 A), while for HA gellan there was a
slight increase up to 90.9% ± 1.9% (Fig. 3.5 B).

Investigation of freeze-dried gellan gum structure: effect of gel formulation
88
Figure 3.5: Microstructures by µCT: 2 wt% LA gellan gum (A) and HA gellan gum (B).
Polymer content affects the freeze-dried structure, reducing the total porosity. In fact, a
reduction to 74.7% ± 0.8% for LA gellan gum and to 84.3% ± 0.4% for HA gellan gum was
observed at 3 wt%.
The collected results show larger pores for the freeze-dried HA gellan. Since it is softer and
less rigid than LA gellan (Phillips and Williams, 2000), the lower mechanical resistance can
encourage the ice crystal growth. Moreover, the slightly higher monovalent and divalent
ion concentration (Na+, K+, Mg2+, Ca2+) in the gel formulation for LA gellan, ~5 wt% (Amici
et al., 2000) compared to ~3 wt% for HA gellan (Huang et al., 2004), may affect both the ice
crystal nucleation and growth. These cations are mainly added as chlorides (CPKelco, 2007).
The pore size distribution is shown in Fig. 3.6 and it is related to the total amount of pores
within the gel structure, expressed as the total porosity. It indicates that for HA gellan gum
the void mean size was shifted towards larger values. Tiwari et al. (2015) reported similar
results for LA gellan gum, reporting a pore size range between 219 and 600 µm.

Investigation of freeze-dried gellan gum structure: effect of gel formulation
89
Pore size (µm)
0 200 400 600 800 1000 1200 1400
Po
rosity
%
0
2
4
6
8
10
12
14HA gellan gum 2 wt%
LA gellan gum 2 wt%
Figure 3.6: Pore distribution after freeze-drying. Percentage is referred to the total pore
volume.
The optical microscope observations (Fig. 3.7 A-B) show larger pores in agreement with the
values collected by µCT.

Investigation of freeze-dried gellan gum structure: effect of gel formulation
90
Figure 3.7: Microstructures by optical microscope: 2 wt% LA gellan gum (A) and HA gellan
gum (B).
The resulting freeze-dried HA and LA gellan gum gels (Fig 3.5 and Fig 3.7) are defined as
“cryogels” (Pajonk et al., 1990, Tamon et al., 2000, Job et al., 2005). They are a macroporous
material and they can be considered like a sponge (Lozinsky et al., 2003, Kumar et al., 2010),
A
B

Investigation of freeze-dried gellan gum structure: effect of gel formulation
91
where the solvent, such as water, can penetrate and fill the structure. If rehydrated, these
cryogels are comparable to the gel structures obtained by freezing and thawing weak gels
(Richardson and Norton, 1998, Giannouli and Morris, 2003), such as the xanthan gum
cryogelation. For these hydrogels, the polymer chains are forced to align and to associate
along the ice crystals edges in a so-called side-by-side mechanism, potentially forming
junction zones during the freezing step (Zhang et al., 2013).
3.3.1.3 Rehydration and swelling
Both gel type samples in different solid contents were left to rehydrate up to 24 hours and
values were monitored at regular intervals up to 30 minutes (Fig. 3.8). In particular, for LA
gellan it was shown that increasing the polymer content, and therefore having a more
packed and entangled structure, the rehydration was slower.

Investigation of freeze-dried gellan gum structure: effect of gel formulation
92
Rehydration time (min)
0 6 12 18 24 30 36
NM
C
0.0
0.2
0.4
0.6
0.8
1.0
LA Gellan gum 1.5% (0.84 ± 0.01)
LA Gellan gum 2% (0.91 ± 0.00)
LA Gellan gum 2.5% (0.89 ± 0.02)
LA Gellan gum 3% (0.88 ± 0.01)
(A)
Rehydration time (min)
0 6 12 18 24 30 36
NM
C
0.0
0.2
0.4
0.6
0.8
1.0
HA Gellan gum 1.5% (2.54 ± 0.87)
HA Gellan gum 2% (2.92 ± 0.21)
HA Gellan gum 2.5% (2.52 ± 0.13)
HA Gellan gum 3% (2.20 ± 0.28)
(B)
Figure 3.8: Rehydration expressed as NMC as a function of rehydration time and LA (A), HA
(B) gellan gum content. The final value of rehydration, after 24 hours, is expressed in the
legend.

Investigation of freeze-dried gellan gum structure: effect of gel formulation
93
By contrast to the drying results, this observation suggests that rehydration of LA gellan
gum was sensitive to the polymer content. On the other hand, HA gellan shows overlapping
rehydration curves. Furthermore, for the former it was possible to distinguish two main
rehydration rates, corresponding to the first period (up to 6 minutes) and the second period
(from 6 to 30 minutes). Specifically, a fast water uptake was noticeable at short timescale.
For 2 wt% LA gellan gum the initial rate is 0.110 min-1, while the second rate for longer
periods decreases to 0.006 min-1. This last value is constant for all the contents, equal to
0.006 ± 0.001 min-1. On the other hand, HA gellan gum did not present a faster initial step
and the second rate is slightly higher, equal to 0.012 ± 0.001 min-1.
In terms of trend, a polynomial fitting was more suitable for HA gellan gum, since R2 is 0.989
using a parabolic fitting, while a linear regression gives R2 equal to 0.942. This confirms that
the overall water uptake tends to slow down over time. Similarly, a parabolic fitting was
suitable for LA gellan gum in the second period (R2 equal to 0.996). However, LA gellan gum
in the entire measured range, from 0 to 30 minutes, is better fitted by the Peleg model
(Goula and Adamopoulos, 2009), which takes into consideration an initial quicker step (Fig.
3.9).
The collected data suggest that this model will reproduce the LA gellan gum behaviour (R2=
0.99), while it is not ideal for HA, with R2 = 0.54 (Fig. 3.9).

Investigation of freeze-dried gellan gum structure: effect of gel formulation
94
Time (min)
Figure 3.9: Rehydration expressed as NMC (X(t) in Table 3.2) as a function of rehydration
time for HA and LA gellan gum 2 wt%. The model used is Peleg.
Rehydration is essentially affected by two main factors: surface and bulk structure (Aguilera
and Stanley, 1999). The molecular configuration and three-dimensional network of the gel
are correlated to these factors, raising the discrepancies noted during the water uptake.
Rehydration for LA gellan is firstly governed by a quicker water uptake, mainly due to the
affinity with water (higher wettability), which makes the penetration into the porous
structure faster. The first rate is highly dependent on the polymer content, while the
second rate was considerably lower, since most of the water is already absorbed. For HA
gellan there was not the initial quick uptake, since the walls around the voids in the dried
structure were thicker and less hydrophilic. However, the rate was slightly higher compared

Investigation of freeze-dried gellan gum structure: effect of gel formulation
95
to the second rate for LA gellan, as the porosity was higher with bigger voids. Overall, it
seems that HA gellan is considerably less sensitive to the variation in polymer content
compared to LA gellan.
In terms of swelling, HA gellan dramatically increases its weight after 24-hour rehydration
(around 192% its original weight before drying), mainly due to its softer and more flexible
mechanical behaviour and different molecular properties (Tanaka and Fillmore, 1979,
Aguilera and Stanley, 1999), as shown in Fig. 3.10.
Figure 3.10: HA and LA gellan gum gels before drying, freeze-dried gels and after 30-
minute/24 hour rehydration.
It is noteworthy to mention that the initial gel properties, especially for LA gellan, cannot
be recovered after rehydration, offering limited-resistance to compression, as shown in Fig.
3.11.

Investigation of freeze-dried gellan gum structure: effect of gel formulation
96
LA Gellan gum wt%
1.5 2.0 2.5 3.0
Fo
rce
(N
)
0
10
20
30
40
50
Before freeze drying
After 24 hours rehydration
(A)
HA Gellan gum wt%
1.5 2.0 2.5 3.0
Fo
rce
(N
)
0
2
4
6
8
10
Before freeze drying
After 24 hours rehydration
(B)
Figure 3.11: Peak force for LA (A) and HA (B) gellan gum gels as a function of polymer
content.

Investigation of freeze-dried gellan gum structure: effect of gel formulation
97
Although the formation of ice crystals during the freezing step aligns and aggregates the
polymeric gellan gum chains along the ice crystal edges, the freeze-dried process generates
large pores that behave like cracks within the material. This behaviour was observed to be
independent of the ice crystal size, especially for LA gellan gum, and, therefore, the freezing
rate. Specifically, the influence of the ice crystals on the gel structure was measured in
terms of mechanical properties by gel compression after freezing and thawing the LA and
HA gellan gels at 2 wt%. Two freezing rates were applied by putting the samples in a freezer
(-18 °C) and using liquid nitrogen. The freezing rate of the former method was around 0.2
°C/min, whereas the samples in liquid nitrogen required less than one minute to be
completely frozen. A slower freezing rate induces larger crystals (Rey and May, 2010),
leaving larger pores once the freeze-drying occurs compared to a faster freezing rate, as
Fig. 3.12 shows in comparison with Fig. 3.6.

Investigation of freeze-dried gellan gum structure: effect of gel formulation
98
Pore size (µm)
0 50 100 150 200 250 300 350 400
Po
rosity
%
0
20
40
60
80
HA gellan gum 2 wt%
LA gellan gum 2 wt%
Figure 3.12 Pore distribution after freezing the gels in liquid nitrogen and freeze-drying.
Percentage is referred to the total pore volume.
For both gel types, the use of the freezer and liquid nitrogen reduced the peak load, as
shown in Table 3.4.
Table 3.4: Difference in peak load after freezing and thawing compared to the gels before
drying.
Freezing method LA gellan gum 2 wt% HA gellan gum 2 wt%
Freezing in liquid nitrogen -92.5% -6.2%
Freezing in at 0.2 °C/min -83.1% -20.9%

Investigation of freeze-dried gellan gum structure: effect of gel formulation
99
3.3.4 HA/LA gellan mixture
The understanding of the freeze-drying and rehydration allows the prediction and design
of new dried structures made from a mixture of the single gels. The 1:1 HA/LA blend at 2
wt% was chosen as a model system. Fig. 3.13 A-B show the desorption isotherm and the
freeze-drying kinetics.

Investigation of freeze-dried gellan gum structure: effect of gel formulation
100
Time (h)
20 30 40 50 60
Wa
ter
activi
ty
0.0
0.2
0.4
0.6
0.8
1.0
1:1 LA/HA gellan gum at 2 wt%
LA gellan gum at 2 wt%
HA gellan gum at 2 wt%
Figure 3.13: 1:1 HA/LA mixture at 2 wt%: water activity vs time (A), drying kinetics (B).
(B)
(A)

Investigation of freeze-dried gellan gum structure: effect of gel formulation
101
In terms of drying, the results were closer to the LA gellan behaviour. On the other hand,
the rehydration results (Fig. 3.14) showed an evident drop in rehydration rate, especially if
they are compared to the rehydration curves with 2 wt% for the single gels.
Rehydration time (min)
0 12 24 36
NM
C
0.0
0.2
0.4
0.6
0.8
1.0
LA Gellan gum 2% (0.91 ± 0.00)
HA Gellan gum 2% (2.92 ± 0.21)
HA Gellan 1% + LA Gellan 1% (1.64 ± 0.04)
Figure 3.14: Rehydration expressed as NMC as a function of rehydration time. LA gellan 2
wt% (), HA gellan 2 wt% (), LA + HA 1:1 2 wt% (). The final value of rehydration, after
24 hours, is expressed in the legend.
As previously discussed, both surface and bulk properties need to be considered. In this
case, the total porosity was 84.8% ± 4.2%, closer to LA gellan gum. Considering the presence
of the acyl substituents along the HA gellan chains, the material becomes less wettable.
These two parameters together decrease the rehydration rate of the mixture.

Investigation of freeze-dried gellan gum structure: effect of gel formulation
102
The gel-system mixing/phase separation may affect these mechanisms. For LA and HA
gellan it has been reported that double helices do not include strands of the two gel types
(Morris et al., 2012), as the DSC peaks show separate thermal transitions for the mixture
(Kasapis et al., 1999). Fig. 3.15 confirms these results, since for the μDSC curve for the
mixture both peaks are noticeable.
Temperature (°C)
20 30 40 50 60 70 80
He
at F
low
(m
W)
LA gellan 2 wt%
HA gellan 2 wt%
1:1 HA/LA gellan 2 wt% Exo
0.5 mW
Figure 3.15: μDSC curves for LA, HA gellan and 1:1 mixture at 2 wt%. The μDSC curves are
plotted as an average of the first cycles in triplicate. Peak temperatures and enthalpy values
are reported in Table 3.5. The individual μDSC curves have been offset on the y-axis.

Investigation of freeze-dried gellan gum structure: effect of gel formulation
103
In particular, the peak temperatures of the gellan mixture are similar to the values of the
single components and the enthalpies related to the thermal transitions are almost halved
compared to values of pure HA or LA gellan gum, as reported in Table 3.5.
Table 3.5: Peak temperatures and enthalpies of thermal transitions on cooling for LA gellan
gum 2 wt%, HA gellan gum 2 wt% and their mixture (1:1) at 2 wt%. These values were
calculated from Fig. 3.15.
LA gellan gum 2 wt% HA gellan gum 2 wt% 1:1 HA/LA blend at 2 wt%
Temperature (°C) 32.7 ± 0.1 71.8 ± 0.3 32.0 ± 0.4 73.7 ± 1.6
ΔH (J g-1) -0.200 ± 0.005 -0.219 ± 0.036 -0.088 ± 0.008 -0.087 ± 0.001
From a macroscopic perspective, µCT micrographs did not show any bulk phase-separation,
since areas with different density (noticeable at the µCT as darker or brighter regions) were
not present for both the pre-dried (before freeze-drying) and dried gels (Fig. 3.16). This can
suggest an interpenetrating three-dimensional gel network (Mao et al., 2000).

Investigation of freeze-dried gellan gum structure: effect of gel formulation
104
Figure 3.16: Microstructure by µCT: 1:1 HA/LA mixture at 2 wt%. Gel before drying (A),
freeze-dried gel (B).
Interestingly, the swelling mechanism was intermediate (Table 3.6), since the final weight,
after leaving the gel 24 hours in water, was around 64% greater than the gel weight before
drying. By contrast, in terms of weight LA gellan showed a decrease of around 9%, while
HA gellan a gain of 192%, likely due to the presence of acetyl groups (Wareing, 1997).
Table 3.6: Gel swelling (weight) after 24 hours in distilled water. Values are compared to
the initial gel weight, before freeze-drying.
Gel system Swelling
LA gellan gum 2 wt% -9%
HA gellan gum 2 wt% +192%
1:1 HA/LA blend at 2 wt% +64%

Investigation of freeze-dried gellan gum structure: effect of gel formulation
105
It seems that LA and HA gellan form two networks, more rigid for the former. On
rehydration HA gellan swells, yet the swelling is limited by the presence of the stiffer LA
gellan network. Presumably, on swelling, the LA gellan network was broken, allowing some
expansion, but not to the same extent as a pure HA gellan sample of equivalent solid
content.
3.3.2 Investigation of freeze-dried structure with mannitol or sucrose
3.3.2.1 Gels before freeze-drying
The presence of additional solutes, such as sugars, can lead to different gel structures based
on the solute physical/chemical properties and its content in the system. It can result in the
alteration of the interaction between water/polymer and polymer/polymer and, therefore,
the behaviour on drying and rehydration.
Hence, it was investigated how LA gellan gum gel was dried in the presence of either
sucrose or mannitol.
Fig. 3.17 shows the mechanical properties of the gels as a function of the sugar type and
content. The peak force generated by a 50% strain compression increased with the sugar
content, especially from 10 wt% up, whereas only a slight increase was observed for
Young’s modulus.

Investigation of freeze-dried gellan gum structure: effect of gel formulation
106
Sugar content wt%
0 5 10 15 20
Fo
rce
(N
)
0
10
20
30
40
50
2% LA gellan gum
2% LA gellan gum with sucrose
2% LA gellan gum with mannitol
(A)
Sugar content wt%
0 5 10 15 20
Yo
ung
's M
od
ulu
s, E
(kP
a)
10
15
20
25
30
35
40
2% LA gellan gum
2% LA gellan gum with sucrose
2% LA gellan gum with mannitol
(B)
Figure 3.17: Peak force (A) and Young’s modulus (B) as a function of sugar type ( sucrose,
mannitol) and content. Gellan gum without sugars ().

Investigation of freeze-dried gellan gum structure: effect of gel formulation
107
The peak force increases as the solvent is reduced by replacement with solid content. This
leads to a higher polymer chain aggregation. The slight elastic modulus increase may
suggest that the number of effective junction zones does not increase, although the
polymer is more packed.
In Fig. 3.17, it is possible to observe that the mechanical responses are different depending
on the sugar type. Specifically, mannitol shows less resistance to compression, as the load
to failure is lower than the gellan/sucrose system (Fig. 3.17 A). This might be related to an
improved network lubrication compared to sucrose (Hodge et al., 1996, Cao et al., 2009).
Depending on the size of the sugar molecule, the polymer chains can move differently
(Vieira et al., 2011). Since the molecular weight of mannitol (182.2 g mol-1) is lower than
sucrose (342.3 g mol-1), it might penetrate more the interstices of the gel network,
lubricating it. However, the extent in gel network lubrication is dependent also on other
parameters related to the co-solute, such as hydrogen bonding, solubility, polarity and
dialectric constant (Vieira et al., 2011).
The molecular structure was further investigated with μDSC, shown in Fig. 3.18, to correlate
the gel structure order/aggregation with the mechanical properties.

Investigation of freeze-dried gellan gum structure: effect of gel formulation
108
Figure 3.18: μDSC curves on cooling for gellan/sucrose (A) and gellan/mannitol (B). The
μDSC curves are plotted as an average of the first cycles in triplicate. Peak temperatures
and enthalpy values are reported in Table 3.7. The individual μDSC curves have been offset
on the y-axis.

Investigation of freeze-dried gellan gum structure: effect of gel formulation
109
The reduction in the amount of water by adding both sucrose and mannitol leads to an
increase in the transition peak temperature (Fig. 3.19).
Sugar content wt%
0 5 10 15 20
Te
mp
era
ture
(°C
)
33
34
35
36
37
38 2 % LA gellan gum
2 % LA gellan gum with sucrose
2 % LA gellan gum with mannitol
Figure 3.19: Peak temperature as a function of sugar type ( sucrose, mannitol) and
content. Gellan gum without sugars ().
It was found that the gel network order decreases as sugar increases, since there is a less
pronounced reduction in entropy ΔS on cooling, compared to the value for 0 wt% sugar
(Fig. 3.20). This thermal transition is referred to the gellan gum coil-helix and sol-gel
transitions (Picone and Cunha, 2011). ΔS was estimated as ΔH/Tp, where Tp stands for the
peak temperature, balancing the enthalpic interactions and the entropic value at the
equilibrium (Table 3.7), where ΔG=0=ΔH-TpΔS (Deszczynski et al., 2003).

Investigation of freeze-dried gellan gum structure: effect of gel formulation
110
Sugar content wt%
0 5 10 15 20
S (
Entr
op
y) J
/(g
°C
)
-0.008
-0.006
-0.004
-0.002
0.000
LA gelllan gum 2 wt% + sucrose LA gelllan gum 2 wt% + mannitol
Figure 3.20: Entropy difference (ΔS) as a function of sugar type ( sucrose, mannitol)
and content. Data are referred on cooling and are related to the μDSC curves in Fig 3.18 A-
B.

Investigation of freeze-dried gellan gum structure: effect of gel formulation
111
Table 3.7: Peak temperatures, enthalpies and entropies measured on cooling as a function
of mannitol or sucrose content. These values were calculated from Fig. 3.19.
Tp (°C) ΔH (J g-1) ΔS (J g-1 °C -1) * 10-3
Gellan gum 2 wt% 32.7 ± 0.1 -0.200 ± 0.005 -6.1 ± 0.1
+ Sucrose 5 wt% 33.8 ± 0.2 -0.158 ± 0.030 -4.6 ± 0.1
+ Sucrose 10 wt% 34.4 ± 0.3
-0.126 ± 0.008 -3.6 ± 0.2
+ Sucrose 15 wt% 35.2 ± 0.7
-0.113 ± 0.008 -3.2 ± 0.2
+ Sucrose 20 wt% 36.1 ± 0.6
-0.098 ± 0.002 -2.7 ± 0.1
+ Mannitol 5 wt% 33.9 ± 0.6
-0.195 ± 0.003 -5.7 ± 0.2
+ Mannitol 10 wt% 34.8 ± 0.9
-0.173 ± 0.016 -4.9 ± 0.4
+ Mannitol 15 wt% 35.6 ± 0.7
-0.160 ± 0.025 -4.5 ± 0.7
+ Mannitol 20 wt% 37.5 ± 0.3
-0.158 ± 0.004 -4.2 ± 0.1
Although there are more interactions between the polymer chains and between the
polymer and sugar due to the solvent reduction by solute replacement and a more packed
structure is formed, these chains are more disordered. Specifically, mannitol less affects
the structure order, since the entropy remains closer to the system at 0 wt% sugar (Fig.
3.20). It might be related to the smaller molecular size for mannitol, which could less affect
the network order.
The molecular interaction of the sugars with the gel polymer is confirmed by the FTIR (Fig.
3.21). In fact, the characteristic sucrose bands are shifted from 1145, 980 and 903 cm-1 to
1157, 995 and 930 cm-1 respectively. Noor et al. (2012) reported similar considerations in

Investigation of freeze-dried gellan gum structure: effect of gel formulation
112
gellan gum-LiCF3SO3. However, the formation of a new complex was not observed, since
there were no different peaks in the mixed system.
Mannitol generates similar interactions, since the peaks at 1278 and 1014 cm-1 are shifted
to higher wave numbers, specifically 1310 and 1043 cm-1.

Investigation of freeze-dried gellan gum structure: effect of gel formulation
113
Figure 3.21: FTIR spectra for gellan/sucrose (A) and gellan/mannitol (B). Red line is related
to LA gellan gum gel, green to pure sucrose or mannitol, blue to LA gellan gum + 20 wt%
sugar. The peak wave numbers are referred to gellan/sucrose and gellan/mannitol.
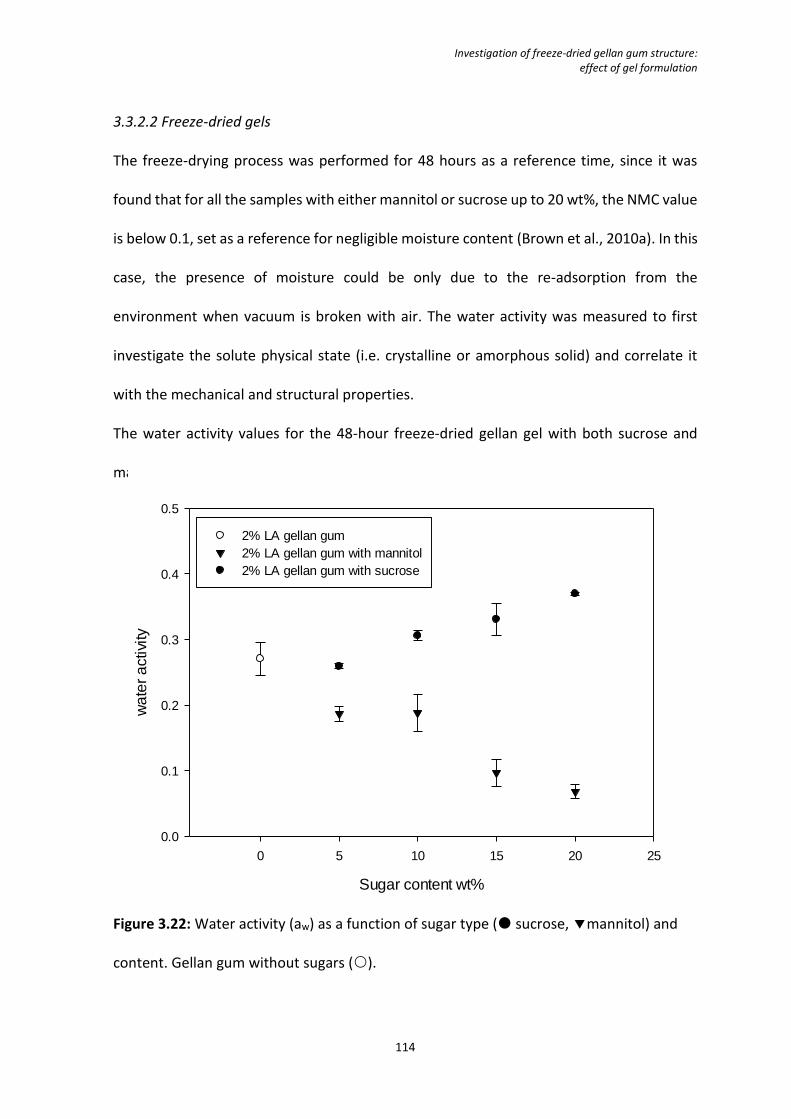
Investigation of freeze-dried gellan gum structure: effect of gel formulation
114
3.3.2.2 Freeze-dried gels
The freeze-drying process was performed for 48 hours as a reference time, since it was
found that for all the samples with either mannitol or sucrose up to 20 wt%, the NMC value
is below 0.1, set as a reference for negligible moisture content (Brown et al., 2010a). In this
case, the presence of moisture could be only due to the re-adsorption from the
environment when vacuum is broken with air. The water activity was measured to first
investigate the solute physical state (i.e. crystalline or amorphous solid) and correlate it
with the mechanical and structural properties.
The water activity values for the 48-hour freeze-dried gellan gel with both sucrose and
mannitol are shown in Fig. 3.22.
Sugar content wt%
0 5 10 15 20 25
wa
ter
activi
ty
0.0
0.1
0.2
0.3
0.4
0.5
2% LA gellan gum
2% LA gellan gum with mannitol
2% LA gellan gum with sucrose
Figure 3.22: Water activity (aw) as a function of sugar type ( sucrose, mannitol) and
content. Gellan gum without sugars ().

Investigation of freeze-dried gellan gum structure: effect of gel formulation
115
As the mannitol content increases, aw decreases, whereas the trend for sucrose is
completely different. This behaviour is related to the solute physical state (ChinachotiI and
Steinberg, 1986, Barbosa-Cánovas et al., 2008). The water molecules form hydrogen bonds
and are localised in the crystal lattice (Stephenson et al., 1998). Therefore, by increasing
the mannitol content, the percentage of crystalline material rises and, as a result, the
overall amount of water that strongly interacts within the product is expected to increase.
On the other hand, the amount of water acting as plasticiser in amorphous substances,
such as sucrose in freeze-dried products, can be substantially higher (Katz and Labuza,
1981). Water can enhance the time-dependent recrystallization process (Barbosa-Cánovas
et al., 2008), leading to the water desorption from the material (Jouppila et al., 1997, Haque
and Roos, 2004) and to the increase of apparent water activity, if moisture is not removed
from the product (Katz and Labuza, 1981). Therefore, since water activity can change as a
function of time during storage (Jouppila et al., 1997, Barbosa-Cánovas et al., 2008), all the
dried gels are measured within a few hours after the end of the freeze-drying process.
The freeze-dried microstructure was initially analysed by µCT (Fig. 3.23). The total porosity
for the dried gel without sugar was 84.8% ± 4.2%. The sucrose addition at 10 wt% and 20
wt% led to a drop to 73.9% ± 0.5% and 48.6% ± 2.9% respectively, while the corresponding
values for mannitol/gellan system were 64.5% ± 0.4% (10 wt%) and 50.1% ± 1.8% (20 wt%).
The main difference between the two systems is that sucrose and mannitol lead to different
porosity characteristics. Specifically, the former produced small and circular voids within
the cross-section. The latter generated large and elongated pore clusters along a direction.

Investigation of freeze-dried gellan gum structure: effect of gel formulation
116
In effect, the micrographs in Fig. 3.23 suggest that the pore-wall thickness is considerably
different.
Figure 3.23: µCT, freeze-dried microstructures: 2 wt% LA gellan gum (A), 2 wt% LA gellan
gum + 20 wt% sucrose (B), 2 wt% LA gellan gum + 20 wt% mannitol (C). Gel before drying,
2 wt% LA gellan gum (D, reference).
Overall, the presence of sugar completely affected the dried structure, decreasing the final
porosity and shifting the pore average size towards smaller values (Fig. 3.24).

Investigation of freeze-dried gellan gum structure: effect of gel formulation
117
Mannitol generated slightly larger pores compared to sucrose (Fig. 3.24 A) and, at the same
time, pore clusters more separated by thicker solid walls, affecting the pore
interconnection (Fig. 3.24 B). The reason for this structure caused by the presence of
mannitol is related to a different supercooling compared to the gellan/sucrose system,
mannitol precipitation at high contents (above 10 wt%) as well as the solute physical state
in the frozen system.
Firstly, as the structure of freeze-dried materials is dependent on the freezing step, the
difference between gellan/mannitol and gellan/sucrose may be related to a different
supercooling (Rambhatla et al., 2004), since it is well-known that sugar alcohol compounds
depress the freezing point more than sucrose and other disaccharides (Sinha, 2007, Goff
and Hartel, 2013). Consequently, a higher degree of supercooling is expected for sucrose,
resulting in a reduction in the crystal growth rate.
Secondly, the pore-wall thickness results (Fig. 3.24 B) related to the system at 20 wt% are
likely to be related to the mannitol solubility in water, as mannitol can precipitate during
both the solution cooling and the freezing step, leading to the formation of agglomerates.
In effect, the mannitol solubility in water at around 10 °C is ~13 wt% (van der Sman, 2017),
while at 80 °C it is above 45 wt% (Mitchell, 2008, van der Sman, 2017). Therefore, mannitol
contents above 10 wt% tend to form pore clusters more separated by solid walls and less
interconnected. On the other hand, sucrose does not precipitate in this range of contents,
resulting in a pore-wall thickness distribution more similar to the freeze-dried gellan
without additives. Interestingly, both the pore and wall thickness distributions were more
comparable between the two systems if the sugar content was 10 wt%, as mannitol did not
precipitate.

Investigation of freeze-dried gellan gum structure: effect of gel formulation
118
Thirdly, mannitol tends to form a crystalline matrix upon slow freezing, especially as a
mixture of α and β polymorphs (Kim et al., 1998, Yu et al., 1999). These crystals can have a
length up to 6-7 mm (Kim et al., 1998) and can potentially interfere with the ice crystal
growth, which occurs at similar temperature. The mannitol crystals formed on freezing,
along with the mannitol agglomerates resulting from its precipitation, can lead to higher
values of pore-wall thickness as well as a specific direction of the pore clusters.

Investigation of freeze-dried gellan gum structure: effect of gel formulation
119
Pore size (µm)
0 200 400 600 800 1000
Po
rosity
%
0
10
20
30
40
2 wt% LA gellan gum
2 wt% LA gellan gum + 20 wt% sucrose
2 wt% LA gellan gum + 20 wt% mannitol
Pore-wall thickness (µm)
0 200 400 600 800 1000
Vo
lum
e %
0
10
20
30
40
50
60
70
2 wt% LA gellan gum
2 wt% LA gellan gum + 20 wt% sucrose
2 wt% LA gellan gum + 20 wt% manntiol
Figure 3.24: Pore size distribution (A) and pore-wall thickness distribution (B) for freeze-
dried LA gellan gum + 20 wt% sugar (grey-sucrose, black-mannitol). Freeze-dried LA gellan
gum is in red.
(A)
(B)

Investigation of freeze-dried gellan gum structure: effect of gel formulation
120
In Fig. 3.25, the ESEM results provided additional information about the dried material. The
gellan/sucrose dried gel showed a homogeneous matrix (Fig. 3.25 B-C). Devi and Williams
(2013) reported SEM micrographs for a freeze-dried sucrose solution (~5 wt%) with similar
solid dried pore walls, suggesting that sucrose formed an amorphous phase. On the other
hand, mannitol formed crystals around the pores (Fig. 3.25 D-E). The shape of these
mannitol crystals after a freeze-drying process was in agreement with the current literature
(Kim et al., 1998, Cares-Pacheco et al., 2014).
Interestingly, it was observed that the freeze-dried structure did not collapse, although the
drying process was carried out at a temperature higher than the collapse temperature for
pure sucrose (Tc ~-32 °C) (Fonseca et al., 2004). In effect, Fig. 3.25 B-C shows a
homogeneous structure, without domains with different density in the solid material, as
Rey and May (2010) reported for the system glucose/mannitol, or with a small scale
collapse (Abdelwahed et al., 2006a). Thus, it indicates that the interaction of gellan-sucrose
did not lead to the structure collapse during freeze-drying.

Investigation of freeze-dried gellan gum structure: effect of gel formulation
121
Figure 3.25: ESEM, freeze-dried microstructures: 2 wt% LA gellan gum (A), 2 wt% LA gellan
gum + 20 wt% sucrose (B, C), 2 wt% LA gellan gum + 20 wt% mannitol (D, E).
These dried structures generated completely different mechanical properties as shown in
Fig. 3.26, in agreement with Devi and Williams (2013). It is noticed that the deformation

Investigation of freeze-dried gellan gum structure: effect of gel formulation
122
mechanism occurs through a succession of abrupt fractures during compression (Devi and
Williams, 2013). After the initial linear elastic behaviour, a sharp drop in the applied force
follows each brittle cracking, especially evident for the gellan-sucrose system.
It seems that the mechanical properties of the dried material depend on both the
formulation, as noticed for the samples before drying, and the different microstructure,
namely porosity, void location and wall thickness (Deng et al., 2004, Leguillon and Piat,
2008). Moreover, the particular physical state of the sugar might contribute to the overall
mechanical behaviour. In this context, the SEM micrographs may suggest that a structure
formed by more fibre-like crystals, as the case of mannitol/gellan, can be deformed more
easily under an applied stress, caused by the slide between these crystals.
Distance (mm)
0 1 2 3 4 5
Fo
rce
(N
)
0
200
400
600
LA gellan gum 2 wt%
LA gellan gum 2 wt% + sucrose 5 wt%
LA gellan gum 2 wt% + sucrose 10 wt%
LA gellan gum 2 wt% + mannitol 5 wt%
LA gellan gum 2 wt% + mannitol 10 wt%
Figure 3.26: Force (N) vs distance (mm) for dried gellan/sucrose (blue) and gellan/mannitol
(green). Red solid line refers to the dried gel without sugars.

Investigation of freeze-dried gellan gum structure: effect of gel formulation
123
3.3.2.3 Rehydration and leaching
Fig. 3.27 shows the rehydration curves for gellan-sucrose and gellan-mannitol. Sucrose
presented a slightly quicker water uptake over time compared to mannitol, especially at
sugar contents up to 10 wt%. However, at 20 wt%, this difference was negligible. In both
cases, there was an increase in rehydration rate and extent as a function of sugar amount.
However, at a content equal or above 10 wt%, the water uptake kinetics sharply dropped.

Investigation of freeze-dried gellan gum structure: effect of gel formulation
124
(A)
time (min)
0 3 6 9 12 15 18 21 24 27 30
NM
C
0.0
0.2
0.4
0.6
0.8
1.0
2 wt% LA gellan gum
+5% sucrose
+10% sucrose
+15% sucrose
+20% sucrose
(B)
time (min)
0 3 6 9 12 15 18 21 24 27 30
NM
C
0.0
0.2
0.4
0.6
0.8
1.0
2 wt% LA gellan gum
+5% mannitol
+10% mannitol
+15% mannitol
+ 20% mannitol
Figure 3.27: Rehydration expressed as NMC over time as a function of sucrose (A) or
mannitol (B) and content.

Investigation of freeze-dried gellan gum structure: effect of gel formulation
125
The surface properties were assessed in terms of material wettability by measuring the
static contact angle. As the sugar content increases, the average wettability becomes
higher (Table 3.8) and, consequently, the rehydration rate is expected to rise as sugar
increases.
Table 3.8: Contact angle as a function of sucrose and mannitol contents. LA gellan gum is
kept at 2 wt%.
Contact angle [°]
LA gellan gum 2% 78.5 ± 1.2
+ Sucrose (wt%)
5
10
20
60.4 ± 0.6
47.5 ± 2.4
28.0 ± 3.3
+ Mannitol (wt%)
5
10
20
62.4. ± 2.3
52.7 ± 3.8
11.5 ± 3.1
In terms of bulk properties, the total porosity and pore size distribution were not
significantly different between gellan gum with sucrose or mannitol, although the average
pore volume was slightly lower for the latter. A possible reason for sucrose/gellan to
rehydrate slightly more quickly over time especially at a low solute content can lie in the
pore-wall thickness, since it is found to be considerably thinner for sucrose/gellan (Fig. 3.24
B). Water can penetrate into the structure more easily, passing through a thinner wall that
separates two non-connected pores. As a result, this offers less resistance to the water

Investigation of freeze-dried gellan gum structure: effect of gel formulation
126
absorption. The decrease in rehydration rate for both systems, above 10 wt%, may be due
to an enhanced structure packing, with thicker walls.
Finally, the medium properties evolve over time, as the viscosity increased as sugar was
released. The viscosity values of the aqueous solution with either sucrose or mannitol were
similar at a given concentration, within the employed range of solute contents (Mathpal et
al., 2006, Jiang et al., 2013). After the initial sugar dissolution and release at the interface
between the sample and the solution, both mannitol and sucrose should diffuse through
the rehydrated structure into the aqueous solution by the gradient of concentration. The
normalised sugar release curves are shown in Fig. 3.28. It seems that the dissolution rate
for mannitol (Fig. 3.28 B) was slightly higher compared to sucrose (Fig. 3.28 A).
Interestingly, after 30 minutes the amount of sugar in solution was not equal to the initial
solute mass of the dried sample, as the release value did not reach 1 ((Fig. 3.28 A-B). It
suggests that the sugar in the core of the sample required more time to diffuse out. In
effect, since the rehydrated mannitol/gellan structure became visually less compacted over
time, due to the solid leaching, and more solute was released from the inner parts of the
gel, a change in slope at longer time scales was observed (Fig. 3.28 B). That can also explain
why the errors related to mannitol/gellan are larger than the system with sucrose. To
support this theory, the gels with both the solutes were squashed to encourage a complete
solute dissolution. In this case, the release ratio was close to 1.

Investigation of freeze-dried gellan gum structure: effect of gel formulation
127
time (min)
0 5 10 15 20 25 30
Re
lea
se
Ra
tio
(R
T)
0.0
0.1
0.2
0.3
0.4
0.5
0.6
2% LA gellan gum w ith 5% sucrose
2% LA gellan gum w ith 10% sucrose
2% LA gellan gum w ith 15% sucrose
2% LA gellan gum w ith 20% sucrose
(A)
time (min)
0 5 10 15 20 25 30
Re
lea
se
Ra
tio
(R
T)
0.0
0.1
0.2
0.3
0.4
0.5
0.6
2%LA gellan gum w ith 5% mannitol
2%LA gellan gum w ith 10% mannitol
2%LA gellan gum w ith 15% mannitol
2%LA gellan gum w ith 20% mannitol
(B)
Figure 3.28: Sugar release over time as a function of sucrose (A) or mannitol (B) and
content.

Investigation of freeze-dried gellan gum structure: effect of gel formulation
128
From these results on the sugar release, it was observed that the gel structure delayed the
solute dissolution, since both sucrose and mannitol reached a complete solubilisation after
4.0 ± 0.8 min and 2.6 ± 0.4 min respectively.
In Fig. 3.29, the dissolution process for both 10 wt% gellan/sucrose and gellan/mannitol
was fitted by the Higuchi model (Eq. 3.9), adapted for a porous matrix (Tongwen and
Binglin, 1998, Costa and Lobo, 2001). It has been suggested that this model, based on the
Fickian diffusion in a square-root time dependence (Siepmann and Peppas, 2011), is
appropriate to describe release phenomena (Costa and Lobo, 2001).
However, it seems that the Higuchi model overestimates the material release rate with
respect to the experimental points, especially for short timescales. It may be due to the
assumptions made in this work to model the system with the Higuchi model, together with
the ones discussed in Section 3.10. It is accurate only with steady-state systems with
stationary boundary conditions that do not undergo considerable alterations due to the
presence of water (i.e. expansion due to swelling or contraction due to dissolution)
(Tongwen and Binglin, 1998, Costa and Lobo, 2001, Siepmann and Peppas, 2011). In reality,
the system is actually non-planar and the sample shape slightly evolves over time. In
addition, being the model characterised by a one-dimension equation, the effect of the
lateral area is neglected.

Investigation of freeze-dried gellan gum structure: effect of gel formulation
129
Figure 3.29: Dissolution process: Higuchi model (Eq. 3.9) for both 10 wt% gellan/sucrose
and gellan/mannitol.
By contrast, a linear fitting is more accurate, with the R2 of 0.983 and 0.987 respectively for
the gellan/sucrose and gellan/mannitol systems. This relatively slow release is likely to be
due to the progressively thicker external layer of the sample that forms over time.
From the previous considerations, both the material and medium properties are likely to
affect the rehydration process. A larger sugar amount should enhance the wettability, yet
make the structure more packed, with thicker walls and less pores.

Investigation of freeze-dried gellan gum structure: effect of gel formulation
130
In terms of mechanical properties, similar behaviour to the gels without sugars (Fig. 3.11
A) was observed after rehydration. Moreover, during rehydration the solute release occurs,
leaving a less compacted material with a lower solid content.
3.4 Conclusions
In this study, the role of both molecular and macroscopic structures for HA and LA gellan
gum on freeze-drying and rehydration were investigated. After focusing on the single gellan
gum gel type, the properties of their mixture were assessed. Similarly, the results on freeze-
dried low-acyl gellan gum gels with sucrose or mannitol are shown.
It was reported for the first time that the water activity decrease during freeze-drying was
considerably larger for LA gellan, since the molecular structure more effectively binds water
molecules due to the absence of acyl groups. On the other hand, drying kinetics in terms
of moisture content is similar between the gels.
The dried structure for LA and HA gellan had comparable porosity, with slightly higher
values for the latter. In addition, the pore size distribution for HA gellan was moderately
shifted towards larger values. Nevertheless, the rehydration was considerably higher for LA
gellan, since it was found to be more hydrophilic. Designing the gel formulation, it would
be possible to predict and modulate the water uptake rate, accordingly to the specific
application.
Understanding a more complex system, such as a mixture of the two polymer types,
provides a further method to modulate the dried-gel properties. In this context, it has not
yet been reported in the literature to date the properties of the HA/LA gellan blends on
freeze-drying and rehydration. Specifically, it was shown that the mixture has an

Investigation of freeze-dried gellan gum structure: effect of gel formulation
131
intermediate behaviour in some properties, such as swelling capability, while others are
more similar to either HA gellan (rehydration) or to LA gellan (water activity reduction).
Considering the presence of either mannitol or sucrose, gel aggregation is observed before
freeze-drying, due to the solvent replacement with solute, and, at the same time, a less
ordered gel network is present. This gel structure aggregation produces stronger gels, as
the polymer chains are closer and more entangled. Specifically, the gellan/sucrose system
shows higher values of peak load, probably due to the different molecular steric hindrance
and gel network lubrication compared to mannitol.
The generated gel structure after freeze-drying has a considerable effect on the mechanical
properties, as the specific additive type generates a different porosity as well as pore/pore-
wall thickness distributions. Specifically, mannitol generates thicker walls around the pores,
whereas sucrose leads to smaller pores and thinner walls. These structural parameters
affected the rehydration rate/extent as well as the solute release from the dried gel
network. Both gellan/mannitol and gellan/sucrose systems showed an initial increase in
rehydration rate, followed by a considerable drop to higher solute contents.

132
Chapter 4
Acidified/basified gellan gum gels: the role of the structure in
drying/rehydration
This work is published as follows:
Cassanelli, M., Prosapio, V., Norton, I., & Mills, T. (2018). Acidified/basified gellan gum gels:
the role of the structure in drying/rehydration mechanisms. Food Hydrocolloids, 82, 346-
354.

Acidified/basified gellan gum gels: the role of the structure in drying/rehydration
133
4.1 Introduction
In the food industry, the texture of the gel is a key parameter for the design of the food
formulation and control the product characteristics (Bourne, 2002). One of the main
parameters that affects the gel structure is the pH of the system: the attractive and
repulsive forces between the polymer chains, as well as the interactions with the water
molecules, change with it, resulting in the formation of different gel networks (Norton et
al., 2011, Banerjee and Bhattacharya, 2012).
Picone and Cunha (Picone and Cunha, 2011) studied the effect of pH on the properties of
gellan gum gels using rheological and calorimetric techniques: they found that an increase
in pH resulted in a more fragile and deformable gel due to a decrease in molecular
aggregation and an increase in the mobility of the strands. However, their experiments
were restricted to limited pH conditions (3.5 for acid, 5.3 for neutral and 7 for basic). The
gel properties at pH < 3.5, 3.5< pH < 5.3 and 5.3 < pH < 7 were not investigated, nor was
the behaviour of gels exposed to different environments (acid and/or basic). Norton et al.
(2011) and Bradbeer et al. (2014) studied the textural properties of acidified gellan gum
gels, observing that lowering the pH from 5 to 3 caused an increase in strength, whereas
with a further reduction to pH 2, the structure became very weak, assuming a sponge-like
behaviour. However, the gellan gum gels were not characterised from a molecular point of
view.
If used as food additives (de Vries, 2002, Norton and Foster, 2002, Renard et al., 2006), gels
may be subjected to drying to extend the product shelf-life (Mothibe et al., 2011). Drying
implies water removal to inhibit microorganisms' growth and enzyme activity, but can
seriously damage the food microstructure with consequent change of properties, especially

Acidified/basified gellan gum gels: the role of the structure in drying/rehydration
134
the texture (de Bruijn and Bórquez, 2014, Vega-Gálvez et al., 2015, Prosapio and Norton,
2017a). Among the drying processes proposed in literature, air-drying and freeze-drying
are the most commonly used. Air-drying involves moisture removal by evaporation. It is a
very simple technique, but it may cause several adverse effects on food attributes such as
case hardening, shrinkage, poor rehydration and the alteration of colour, flavour and
texture (Nijhuis et al., 1998b, Maskan, 2000, Ratti, 2001). Freeze-drying consists of the
freezing of the product followed by water removal through sublimation at reduced
pressure. It better preserves the food structure, but is characterised by long processing
time and high-energy consumption (Reyes et al., 2015, Karam et al., 2016). Drying of gellan
gum gels has been studied by some authors (Silva‐Correia et al., 2011, Tiwari et al., 2015,
Bonifacio et al., 2017, Chang et al., 2017, Ciurzyńska et al., 2017, Evageliou and Saliari,
2017), but the effect of the gel pH on the drying and rehydration kinetics has not yet been
investigated.
The aim of the present work is to investigate the behaviour of the gels prepared, not only
in acid conditions, but also in a basic environment, providing a chemical interpretation of
the mechanisms involved. The textural properties of the acidified/basified gels will be
studied after acid or basic exposure in order to provide a method for the design of the gel
mechanics and, therefore, the food properties. The molecular interpretation of the pH
effect on the gel structure is carried out by both thermal (DSC) and structural (FT-IR)
analyses. In addition, for each pH, the effect of the drying technique on the gel
microstructure will be evaluated, with a study of the drying and rehydration kinetics of
oven and freeze-dried samples. Also, the rehydrated gel textures are investigated in
comparison with the mechanical properties before drying.

Acidified/basified gellan gum gels: the role of the structure in drying/rehydration
135
4.1 Materials and methods
4.2.1 Gel preparation
Low acyl gellan gum powder (Kelcogel F) was provided by CPKelco (UK). Citric acid (purity
99%) and sodium hydroxide (purity 98%) were supplied by Sigma-Aldrich (UK). All materials
were used as received and further discussed in Section 3.2.1.
A solution of 2% (w/w) was prepared by dissolving the gellan powder in distilled water and
stirring at 85 °C for 2 hours to ensure a complete powder hydration and dissolution. The
pH of the solution was measured using a pH meter (Seven compact, Mettler Toledo, UK)
and was found to be equal to 5.2. For the acidified gels, the pH of the solution was adjusted
by adding citric acid 0.3 M at the same temperature, whereas for basified gels sodium
hydroxide (NaOH) 0.25 M was added. The solution was then placed into cylindrical moulds
and, after gelation, the samples were 10 mm high with a 22 mm diameter.
4.2.2 Zeta potential and electrophoretic mobility
Zeta potential of gellan gum was measured in a Zetasizer Nano-ZS (Malvern Instrument,
UK) using the acid-base titration method (Quast, 2016). Solutions of gellan gum were
prepared with a concentration equal to 0.1% (w/w) to avoid gelation, yet a sufficient
polymer concentration to perform the analysis. The pH of the solution (from 2 to 10.5) was
adjusted by adding 0.25 M HCl or NaOH 0.25 M. For each solution, the electrophoretic
mobility was measured at 25 °C and plotted as a function of the pH in order to
experimentally calculate the pKa of gellan gum (Quast, 2016).

Acidified/basified gellan gum gels: the role of the structure in drying/rehydration
136
4.2.3 Texture analysis
The mechanical properties of the gels were characterised by uniaxial compression as
discussed in Section 3.2.3.
4.2.4 Post-gelation exposure
All the gels prepared at different pH were placed in different environments for 24 hours at
20 °C: acid medium at pH 2.5 was formed by 0.3 M citric acid dissolved in distilled water;
neutral medium was formed by distilled water; basic medium at pH 11.5 was formed by
NaOH 0.25 M dissolved in distilled water. Later in the process, the samples were
characterised again to highlight possible changes in the gel structure.
4.2.5 Molecular interactions: μDSC and FTIR
All the μDSC experiments were carried out from 10 °C to 90 °C with a scan rate of 1 °C min-
1, applying a single heating/cooling cycle. Further details are reported in Section 3.2.2.
The Fourier transform infrared spectroscopy method is provided in Section 3.2.2.
4.2.6 Freeze-drying
The procedure details for the freeze-drying process are provided in Section 3.2.4.
4.2.7 Oven-drying
Conventional drying tests were carried out introducing the wet gels in an oven (Fistreem
International Co. Ltd, UK) with no flow air, at 40, 50 and 60°C, room pressure and a constant
relative humidity (RH) about 20%.

Acidified/basified gellan gum gels: the role of the structure in drying/rehydration
137
4.2.8 Normalised Moisture Content (NMC) and moisture content analysis
Normalised Moisture Content was measured as specified in Section 3.2.5.
The content of citric acid present in each gel (added to adjust the pH) was calculated
subtracting the weight of the polymer (2% w/w) and the weight of the water from the total
weight of the gel. The water amount was determined using a moisture analyser (model MB
25, OHAUS, Nanikon, Switzerland). Two grams of sample were placed within the aluminium
pans and located over the pan support of moisture meter. A halogen element inside the
moisture meter provides uniform infrared heating. It heats the sample at a set temperature
of 120 °C until the sample weight becomes constant. Moisture percentage as a function of
weight change was recorded and displayed.
4.2.9 Micro computed microscopy (μCT)
Dried gels were analysed by X-ray micro-computed tomography using the Skyscan 1172
(Bruker, Belgium). Further details are discussed in Section 3.2.7.
4.2.10 Rehydration
Details for the method of rehydration are reported in Section 3.2.9.
At regular intervals (30, 120, 1440 min) the solid content was measured by using the
moisture analyser. It was observed that the evolution of the solid material, due to the
solubilisation of citric acid in water, was less than 1%.

Acidified/basified gellan gum gels: the role of the structure in drying/rehydration
138
4.2.11 Statistical analysis
All the experiments were performed in triplicate. Errors were expressed as plus/minus a
single standard deviation.
4.3 Results and discussion
4.3.1 Effect of pH on gel structure and mechanical properties
The investigation of the pH effect on the mechanical and physical properties of LA gellan
gum gels was carried out by texture analysis. In Fig. 4.1 the peak load and the Young’s
modulus are reported as a function of the gel pH.
It is shown that increasing the H+ concentration of the hot solution by citric acid addition
the peak load to reach a 50% strain on compression initially rises up to the maximum of
87.7 N ± 5.0 N at pH 3.5.

Acidified/basified gellan gum gels: the role of the structure in drying/rehydration
139
pH
2 3 4 5 6 7
Fo
rce
(N
)
0
20
40
60
80
100
Acidified/basified LA gellan gum
pH
2 3 4 5 6 7
Yo
ung
's M
od
ulu
s (
kP
a)
0
100
200
300
400
500
Acidified/basified LA gellan gum
Figure 4.1: Peak force (A) and elastic modulus (B) as a function of LA gellan gum (2% w/w) gel pH.
(A)
(B)

Acidified/basified gellan gum gels: the role of the structure in drying/rehydration
140
A further decrease in pH leads to a considerable drop in strength with an evident loss in
transparency (Bradbeer et al., 2014), as shown in Fig. 4.2, and a sponge-like behaviour
(Norton et al., 2011). A similar trend was observed for the elastic modulus with the highest
gel stiffness at pH 3.5. All the compressed gels failed after a 50% deformation. The basified
gels showed a textural behaviour similar to the gel in natural conditions, since a difference
less than 5 N and 2 kPa was observed for the peak load and elastic modulus, respectively.
Figure 4.2: Acidified/basified LA gellan gum gels (2% w/w).
In agreement with Norton et al. (2011), the gels that require the highest force were the
ones produced at the pH around the gellan gum pKa. Fasolin et al. (2013) reported a pKa
around 3.5 for low-acyl gellan gum (Kelcogel®F) by measuring the zeta potential as a
function of pH. This value is in agreement with the experimental pKa, obtained by
measuring the electrophoretic mobility (Fig. 4.3).

Acidified/basified gellan gum gels: the role of the structure in drying/rehydration
141
pH
2 4 6 8 10
Mo
bili
ty (
µm
cm
/V s
)
-3.0
-2.5
-2.0
-1.5
-1.0
-0.5
0.0
0.1% w/w gellan gum
Figure 4.3: Electrophoretic mobility of LA gellan gum at 0.1% w/w as a function of gel
solution pH.
This method follows the procedure proposed by Quast (2016) and Mehrishi and Seaman
(1968): at high pH the mobility tends to reach a plateau because the polymer chain might
be fully ionised. On pH reduction, the polymer becomes less negatively charged. The pKa is
considered as being the specific pH at which the electrophoretic mobility is half of the
plateau value.
The reason for the increase in the load to failure by pH reduction down to 3.5, followed by
the decrease in mechanical properties on further pH reduction (Fig. 4.1), might be related
to the negative charge percentage on the polymer chains. The Henderson-Hasselbach
equation (Eq. 4.1) correlates the solution pH and the compound pKa and shows that the
ionisable solute is half dissociated for pH=pKa.

Acidified/basified gellan gum gels: the role of the structure in drying/rehydration
142
𝑝𝐻 = 𝑝𝐾𝑎 + 𝑙𝑜𝑔[𝐴−]
[𝐻𝐴] (Eq. 4.1)
where [HA] is the molar concentration of the weak acid and [A-] the molarity of the
conjugate base of the acid. From this equation, it is deduced that the highest dissociation
is for pH higher than the pKa. In other words, the gellan gum system evolves as a function
of the pH, not only in terms of available cations, but also in terms of polymer ionisation.
During the gel preparation, the hot solutions at natural or higher pH contain highly ionised
polymer chains. In effect, the gellan gum zeta potential at natural pH (5.2) is equal to -20.3
mV ± 1.1 mV, whereas at pH 3.5 is -12.2 mV ± 0.8 mV. In order to form the gel network,
cations are required, interacting with the negative charges and forming aggregated regions,
the so-called junction zones (Morris et al., 2012). In the Kelcogel®F formulation, both
monovalent (Na+ and K+) and divalent (Ca2+ and Mg2+) cations are present, added as
chlorides up to around 5% w/w (Amici et al., 2000, CPKelco, 2007). The gel in this condition
can set, if the gel concentration is above the critical one (Phillips and Williams, 2000),
although it may result in a weak gel in terms of mechanics (Norton et al., 2011). The gel
formed at high pH has a high percentage of negative charges and part of them interacts
with the cations already present in the gellan gum formulation. However, the overall
amount of positive charges is not sufficient to balance the negative charges of the polymer,
thus leading the formation of a less aggregated gel.
It has been observed that the linear charge density (Morris et al., 2012) of the polyanion
decreases as the pH of the aqueous solution becomes lower (Rizwan et al., 2017), by
protonation of the carboxylate groups (Bradbeer, 2014). This consideration is in agreement
with the zeta potential and electrophoretic mobility results (Fig. 4.3), which indicate that

Acidified/basified gellan gum gels: the role of the structure in drying/rehydration
143
the overall polymer charge changes as a function of the pH. The gel chains at natural pH
have a high linear charge density, which in the presence of cations form junction zones.
The dimensions of these highly ordered domains do not cause scattering, as the gels are
transparent (Norton et al., 2011). When the pH is decreased, the linear charge density on
the gellan gum molecules is reduced, whereas the amount of cations available in the
medium is raised by the acid addition. The junction zones reduce in number, yet the
interaction between the chains increases due to the presence of more cations. However,
when the pH equates the pKa or it is below this value, the polymer becomes nearly neutral,
as the cations (provided by salt addition in the initial formulation or upon acidification) can
balance the negative charge of the carboxylate groups of the polymer. Moreover, the
excess of positive charges may induce local chain repulsion and further weaken the gel
network. As the gel is more turbid for low pHs (Fig. 4.2), this suggests that the polymer is
more aggregated, with packed domains of gellan gum chains. The low electrostatic
interaction leads to phase separation between the polymer and solvent (Morris et al.,
2012, Bradbeer et al., 2014). This can explain why the gel assumes a sponge-like behaviour
with a low capability to hold water, especially under stress (Norton et al., 2011). Similar
behaviour but due to a different principle is the sponge-like structure of cryogels (Lozinsky
et al., 2003, Kumar et al., 2010). In these systems, water can more easily move through the
large channels of the highly porous structure and can be removed during compression.
The trend of the mechanical properties for the acidified gels was preserved, even if they
were submerged in distilled water (pH-neutral environment) for 24 hours (Fig. 4.4). Once
the H+ cations electrostatically interacted with the polymer, it seems that they were
minimally released from the structure, since the peak load decreased only slightly. This

Acidified/basified gellan gum gels: the role of the structure in drying/rehydration
144
reduction might be due to the moderate LA gellan gum gel swelling and subsequent
network expansion, which made the structure softer, as Cassanelli et al. (2017a) showed.
pH
2 3 4 5 6 7 8
Fo
rce
(N
)
0
100
200
300
400
Acidified/basified gels
Acidified/basified gels in solution (pH 2.5)
Acidified/basified gels in solution (pH 11.5)
Acidified/basified gels in distilled water
(A)
pH
2 3 4 5 6 7 8
Yo
ung
's M
od
ulu
s (
kP
a)
0
200
400
600
800
Acidified/basified gels
Acidified/basified gels in solution (pH 2.5)
Acidified/basified gels in solution (pH 11.5)
Acidified/basified gels in distilled water
(B)
Figure 4.4: Peak force (A) and elastic modulus (B) as a function of LA gellan gum (2% w/w)
gel pH and exposure to distilled water, acid (pH 2.5) or basic (pH 11.5) solutions for 24 h.

Acidified/basified gellan gum gels: the role of the structure in drying/rehydration
145
The results obtained after acid/basic exposure (Fig. 4.4 A-B) confirmed that the load to
failure is strictly related to the presence of junction zones and the interaction of the chains
within them, as the linear charge density may vary (Morris et al., 2012).
The acidified/basified gels were then placed in water with citric acid at pH 2.5 or NaOH at
pH 11.5 for 24 hours. For the acid solution exposure, it was evident that gels formed at
relatively high pH could generate a considerably stronger structure, around 15 times the
initial peak force, while at low pH this effect was negligible. It is believed that this is related
to the fact that the high-pH polymer is highly ionised and the subsequent addition of H+
leads to larger and more compacted junction zones by saturating the negative charges. It
seems that the hydrogen ions interact with these available negative charges, after
penetrating the structure. At the same time, the extent of disordered domains decreases,
resulting in considerably stronger gels (Morris et al., 2012). Upon soaking the low-pH gels
in the acid solution, this effect became less evident, as the initial negative charges were
already reduced, as shown for pH 3 and 2.5. Since the peak load at pH 3.5 slightly increased,
it suggests that at this pH the polymer was not completely neutral and the negative charges
were not yet saturated by cations. Similarly, the acid exposure affected the elastic
properties of the gels, as the Young’s modulus increased (Fig. 4.4 B). Interestingly, none of
the gels showed signs of failure during compression to 50% strain, yet they could not
recover the initial height when the stress was removed. For the basic solution exposure,
the peak load and elastic modulus did not increase. The slight decrease in the peak force
suggests that water might swell the structure, making it weaker, as well as the high OH-
concentration that might influence the junction zone size by neutralising cations.

Acidified/basified gellan gum gels: the role of the structure in drying/rehydration
146
In order to investigate further the influence of the acid solution exposure, gels at natural
pH (5.2) were treated for 24 hours in solutions at different pH, as shown in Fig. 4.5.
pH
2 4 6 8 10 12
Fo
rce
(N
)
0
50
100
150
200
250
300
LA gellan gum gel at natural pH in acid/basic solutions for 24 h
Figure 4.5: Peak force of 2% w/w LA gellan gum (natural pH) as a function of the exposure
medium pH.
It seems that the amount of H+ required to interact with all the negative charges on the
polymer is pH 3 or less. Above pH 3, the amount of cations provided is not sufficient to
make the junction zones larger. In addition, when the gels were soaked in aqueous solution,
a decrease in load to failure was observed at pH higher than 3, mainly due to the network
expansion, as shown in Fig 4.4.
At pH 3.5 the effect of the polymer concentration on the gel peak force was evaluated and
compared to the natural-pH gel (Fig. 4.6).

Acidified/basified gellan gum gels: the role of the structure in drying/rehydration
147
It was observed that at pH 3.5 a gel can set even at very low gellan gum concentration
(0.25% w/w). Interestingly, 0.5% w/w generates a gel as strong as the 2% w/w gel at natural
pH. On the other hand, the gel at the natural conditions at 0.5% w/w cannot form a firm
sample with a cylindrical shape. This behaviour might be particularly beneficial for food
formulation design to achieve comparable mechanical properties with a reduced
concentration in gelling agent.
Gellan gum concentration (% w/w)
0.0 0.5 1.0 1.5 2.0 2.5 3.0
Fo
rce
(N
)
0
20
40
60
80
100
120
Acidified gel (pH 3.5)
Natural gels (pH 5.2)
Figure 4.6: Peak force as a function of LA gellan gum concentration at natural pH (5.2) and
pH 3.5.
Acidified/basified gellan gum gels: the role of the structure in drying/rehydration
148
As the gels formed a continuous network, they were further investigated at the molecular
level with both μDSC and FT-IR techniques.
In Fig. 4.7 the μDSC thermograms for the acidified/basified gels on cooling (A) and heating
(B) are reported. At the natural pH (5.2) a single exothermic peak was noted (Fig. 4.7 A),
suggesting that the formation and aggregation of double helices take place at very close
temperatures, as Picone and Cunha (2011) reported. It seems that two peaks are
overlapping. On the other hand, the endothermic peak at ~30 °C is likely to be related to
the melting of non-aggregated gellan gum helices (Fig. 4.7 B), while other transitions at
higher temperatures lead to the complete gel melting (Picone and Cunha, 2011).

Acidified/basified gellan gum gels: the role of the structure in drying/rehydration
149
Figure 4.7: μDSC thermograms for acidified/basified gels (2% w/w) on cooling (A) and
heating (B). A magnification of the curve on heating related to gel at pH 5.2 is reported (B).
The μDSC curves are plotted as an average of the first cycles in triplicate and offset on the
y-axis. Peak temperatures and enthalpy values are reported in Table 4.1.
(A)
(B)
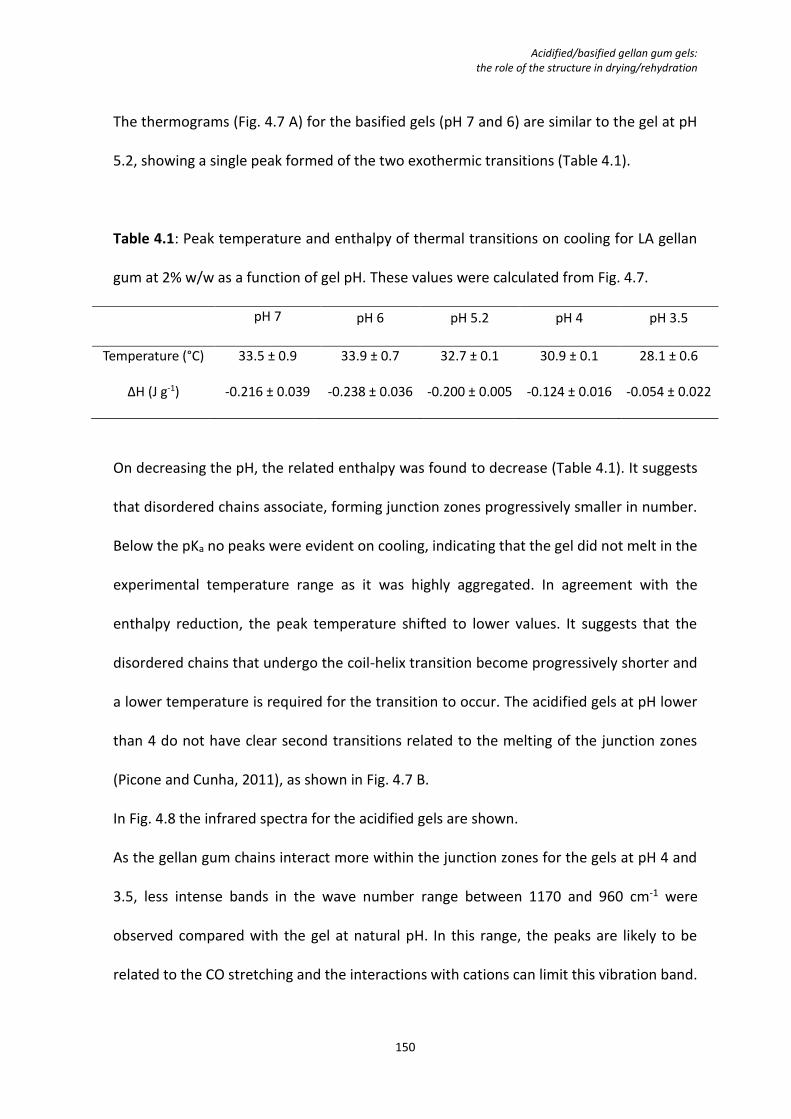
Acidified/basified gellan gum gels: the role of the structure in drying/rehydration
150
The thermograms (Fig. 4.7 A) for the basified gels (pH 7 and 6) are similar to the gel at pH
5.2, showing a single peak formed of the two exothermic transitions (Table 4.1).
Table 4.1: Peak temperature and enthalpy of thermal transitions on cooling for LA gellan
gum at 2% w/w as a function of gel pH. These values were calculated from Fig. 4.7.
pH 7 pH 6 pH 5.2 pH 4 pH 3.5
Temperature (°C) 33.5 ± 0.9 33.9 ± 0.7 32.7 ± 0.1 30.9 ± 0.1 28.1 ± 0.6
ΔH (J g‐1) ‐0.216 ± 0.039 ‐0.238 ± 0.036 ‐0.200 ± 0.005 ‐0.124 ± 0.016 ‐0.054 ± 0.022
On decreasing the pH, the related enthalpy was found to decrease (Table 4.1). It suggests
that disordered chains associate, forming junction zones progressively smaller in number.
Below the pKa no peaks were evident on cooling, indicating that the gel did not melt in the
experimental temperature range as it was highly aggregated. In agreement with the
enthalpy reduction, the peak temperature shifted to lower values. It suggests that the
disordered chains that undergo the coil-helix transition become progressively shorter and
a lower temperature is required for the transition to occur. The acidified gels at pH lower
than 4 do not have clear second transitions related to the melting of the junction zones
(Picone and Cunha, 2011), as shown in Fig. 4.7 B.
In Fig. 4.8 the infrared spectra for the acidified gels are shown.
As the gellan gum chains interact more within the junction zones for the gels at pH 4 and
3.5, less intense bands in the wave number range between 1170 and 960 cm-1 were
observed compared with the gel at natural pH. In this range, the peaks are likely to be
related to the CO stretching and the interactions with cations can limit this vibration band.

Acidified/basified gellan gum gels: the role of the structure in drying/rehydration
151
On the other hand, on further pH decrease there are more intense peaks, suggesting that
the polymer chains electrostatically interact to a lesser extent.
Figure 4.8: FT-IR spectra for acidified gels (2% w/w).
This work shows that the mechanical properties are highly affected if the gels were
acidified/basified before gelation or after gel setting. If the acid/base is added into the hot
solution, it is important to consider that the charges on the polymer change and, therefore,
their interaction with the cations. On the other hand, if it is added after gelation, the gel
might become considerably stronger if initially produced at pH above the pKa. As a food
engineering application, the product stability and thickness might be controlled and
tailored to the final application by modulation of pH

Acidified/basified gellan gum gels: the role of the structure in drying/rehydration
152
4.3.2 Gel drying and rehydration
The gellan gum gels prepared in acid/basic conditions were studied in terms of drying and
rehydration kinetics. Specifically, the samples were initially freeze-dried or oven-dried,
followed by rehydration in distilled water up to 24 hours. Fig. 4.9 shows the freeze-drying
(A) and oven-drying (B) kinetics curves.
As expected, the drying rate was considerably higher for the oven-drying, since it is based
on the evaporation at relatively high temperatures. From the microstructural point of view,
no differences were observed within the oven-drying temperature range investigated.
However, the pH did not affect the water removal rate, as the drying kinetics curves tended
to overlap in both processes.

Acidified/basified gellan gum gels: the role of the structure in drying/rehydration
153
Time (h)
0 10 20 30 40 50
NM
C
0.0
0.2
0.4
0.6
0.8
1.0
pH 7
pH 6
ph 5.2
pH 4
pH 3.5
pH 3
pH 2.5
(A)
Time (h)
0 5 10 20 25
NM
C
0.0
0.2
0.4
0.6
0.8
1.0
pH 7
pH 6
pH 5.2
pH 4
pH 3.5
pH 3
pH 2.5
(B)
Figure 4.9: Drying kinetics curves for 2% w/w LA gellan gum expressed as NMC over time:
(A) freeze-drying; (B) oven-drying at 50 °C.

Acidified/basified gellan gum gels: the role of the structure in drying/rehydration
154
Contrary to the drying kinetics, the rehydration rate was influenced by the pH of the
solution, as shown in Fig. 4.10. Overall, the freeze-dried gels show a quicker water uptake,
especially for short timescales, while the oven-dried ones tend to rehydrate more slowly.
The reason lies in the microstructural differences between the two sample types. Freeze-
drying generates relatively large pores due to the formation of ice crystals during the
freezing step and, therefore, a highly porous material (Rey and May, 2010). On the other
hand, water removal through evaporation leads to the collapse of gel structure, increasing
the material bulk density and thus making the rehydration process slower.

Acidified/basified gellan gum gels: the role of the structure in drying/rehydration
155
Time (min)
0 40 80 120 1440 1480
NM
C
0.0
0.2
0.4
0.6
0.8
1.0
pH 7
pH 6
pH 5.2
pH 4
pH 3.5
pH 3
pH 2.5
(A)
Time (min)
0 40 80 120 1440 1480
NM
C
0.0
0.2
0.4
0.6
0.8
1.0
pH 7
pH 6
pH 5.2
pH 4.0
pH 3.5
pH 3.0
pH 2.5
(B)
Figure 4.10: Rehydration curves for 2% w/w LA gellan gum expressed as NMC over time.
The dried samples were placed in distilled water after freeze-drying (A) and oven-drying
(B).

Acidified/basified gellan gum gels: the role of the structure in drying/rehydration
156
The pH affected the extent of rehydration and rehydration rate of both freeze-dried and
oven-dried gels. Specifically, in Fig. 4.10 A it is shown that, by decreasing the pH down to
the pKa, the initial water uptake of freeze-dried samples decreases. It is likely to be related
to the formation of smaller pores due to the citric acid addition during the gel preparation,
which should enhance the ice crystal nucleation rate rather than their growth (Petzold and
Aguilera, 2009). In effect, the total porosity, embedding both open (interconnected) and
closed (non-interconnected) pores, moved from 84.8% ± 4.2% (natural pH) to 55.2% ± 5.2%
(pH 2.5). A more rigid material, due to the polymer chain aggregation, may influence more
the crystal expansion, compared to a softer gel (Scherer, 1990). By further decreasing the
gel pH (2.5 and 3), the initial water uptake became slightly higher. The curves related to pH
2.5 and 3 are close to each other, at slightly lower values for the former. As shown in Table
4.2, by decreasing the pH of the solution, the solid content of the gel increases, achieving
about 4.1% at pH 3 and 8.5% at pH 2.5. As a consequence, a more aggregated and
compacted material is obtained, which may obstruct the water uptake.
Table 4.2: Water content percentage before drying for acidified LA gellan gum gels at 2%
w/w. The gel pH was adjusted by adding citric acid.
pH Water content %
4 97.0 ± 0.6
3.5 96.9 ± 0.5
3 95.9 ± 0.5
2.5 91.5 ± 0.7

Acidified/basified gellan gum gels: the role of the structure in drying/rehydration
157
The oven-dried gels tended to rehydrate more slowly and to a smaller extent as the pH
decreased (Fig. 4.10 B). A rigid-collapsed network, generated by decreasing the pH to 3.5,
might re-absorb less water over a longer timescale, since the more aggregated structure
resists expansion of the gel. At low pH, the rehydration rate is even lower, due to the
structure packing. This may be related to the higher solid content percentage, which is
likely to decrease the material porosity (from 7.1% ± 0.9% at natural pH to 4.6% ± 3.3% at
pH 2.5) and increase the pore-wall thickness.
In terms of shape and volume retention as well as mechanical properties in comparison
with the gels before drying, it is interesting to observe that the acidification at pH 4 led to
a relatively higher appearance in quality for both the drying methods (Fig. 4.11). At the end
of the 24-hour rehydration in distilled water the gels were visually similar to the ones
before drying and an increased turbidity by decreasing the pH was observed after
rehydration, as the case before drying (Fig. 4.11 A-B). Freeze-dried gels showed some
shrinkage, probably due to the presence of gaps in the polymer network during water
removal.

Acidified/basified gellan gum gels: the role of the structure in drying/rehydration
158
Figure 4.11: 24-hour rehydrated samples (2% w/w) after freeze-drying (A) and oven-drying
(B). Gel comparison (pH 4) on rehydration after freeze-drying (C) and oven-drying (D).
(A)
(B)
(C)
(D)
Acidified/basified gellan gum gels: the role of the structure in drying/rehydration
159
In Fig. 4.12, the mechanical properties for the rehydrated gels are reported in comparison
with the gels before drying.
The freeze-dried and rehydrated gels at higher and lower pH than 4 became less strong. At
pH 3.5 a drop in load to failure is shown (Fig. 4.12 A). Since the gel network is more rigid
and stronger because of the junction zones formed at this pH, the ice crystals might be less
accommodated. Below the pKa the gel did not recover the initial properties before freeze-
drying, having a peak force after 50% strain between 0 and 1 N. However, it is important to
mention that the final mechanical properties are lower for each pH. In effect, although a
polymer chain alignment occurs due to the ice crystal formation, the freeze-dried material
has large pores that behave like cracks, resulting in a peak load decrease, in addition to the
effect of distilled water, as previously discussed (Fig. 4.4 A-B). It seems that pH 4 generates
the optimum junction zone formation, leading to an intermediate behaviour in terms of
strength and elasticity, which appears to preserve more the mechanical properties after
freeze-drying and rehydration. Similarly, the oven-dried and rehydrated gels showed that
the gel mechanics and geometry were minimally affected in the case of the gels at pH 4. In
this context, the gel pH decrease is necessary to enhance the polymer network rigidity and
avoid that the gel become too soft after rehydration. However, if the aggregation level is
further increased, the recovery of gel shape and mechanics is obstructed, similarly to the
freeze-dried and rehydrated samples. Below the pKa the gel might start to have a more
disordered structure which might make the gel shape/volume recovery more difficult (Fig.
4.11 A-B). However, especially the gel at pH 2.5 did not recover the initial shape, influencing
the texture measurement, as it was collapsed and compacted even after rehydration.

Acidified/basified gellan gum gels: the role of the structure in drying/rehydration
160
pH
2 3 4 5 6 7 8
Fo
rce
(N
)
0
20
40
60
80
100
Before drying
Freeze drying + rehydration
Oven drying + rehydration
(A)
pH
2 3 4 5 6 7 8
Yo
ung
's M
od
ulu
s (
kP
a)
0
100
200
300
400
500
Before drying
Freeze drying + rehydration
Oven drying + rehydration
(B)
Figure 4.12: Peak force (A) and elastic modulus (B) of dried and rehydrated gels (2% w/w)
as a function of their pH.

Acidified/basified gellan gum gels: the role of the structure in drying/rehydration
161
The freeze- and oven-dried gels at pH 4 were then rehydrated in both acid (pH 2.5) and
basic (pH 11.5) solutions to evaluate the effect on the dried and rehydrated gel structure.
For the freeze-dried samples, it was noted that the peak force reached 7.40 ± 1.76 N, a
value comparable to 8.11 ± 4.22 N for the rehydration in distilled water. It seems that
during the water uptake the gels did not become stronger. However, it is difficult to predict
if larger and stronger junction zones are formed on rehydration in acid solution, since the
system was highly affected by the presence of large pores formed after freeze-drying. In
the basic solution, the gels became softer, showing a peak force equal to 0.70 ± 0.11 N, due
to the effect of the high OH- concentration, as discussed in the Section 4.3.1 about the gel
exposure to the basic solution.
The initial cylindrical shape of the air-dried gels, lost after the structure collapse, was not
recovered if an acid solution was used. It is likely to be related to the change in gel network
throughout the rehydration. As a result, the load to failure was affected by the irregular
shape and compacted material and was equal to 1.94 ± 0.18 N. On the other hand, the
effect of the basic solution generated rehydrated gels with a less defined shape as well as
a lower peak force (3.05 ± 1.52 N), similarly to the freeze-drying case.
Overall, it seems that the rehydration in a neutral environment is more suitable to recover
the geometrical properties of the gel and have a relatively stronger material for the gels
previously freeze- and oven-dried.
4.4 Conclusions
It has been demonstrated that it is possible to modulate the mechanical properties of gellan
gum gels by adjusting the pH of the solution during gelation and by acid/basic environment

Acidified/basified gellan gum gels: the role of the structure in drying/rehydration
162
exposition. The gel structure aggregation and the formation of junction zones have been
correlated to the electrostatic interactions and cation condensation that take place
according to the gelation conditions. It results in changes in load to failure and in elastic
modulus.
Both the freeze- and oven-drying of gels are not pH sensitive in terms of drying kinetics.
However, the rate and the extent of the gel rehydration depends on the structure
aggregation/junction zones and porosity and, therefore, on the gel pH. Regardless of the
drying method, a drop in the rehydration rate was observed at pH close to the gellan pKa,
in occurrence of the formation of larger and stronger junction zones.
This study can be particularly useful for the design of the food formulation and to predict
possible changes in food additives when subjected to different environments and/or
drying.
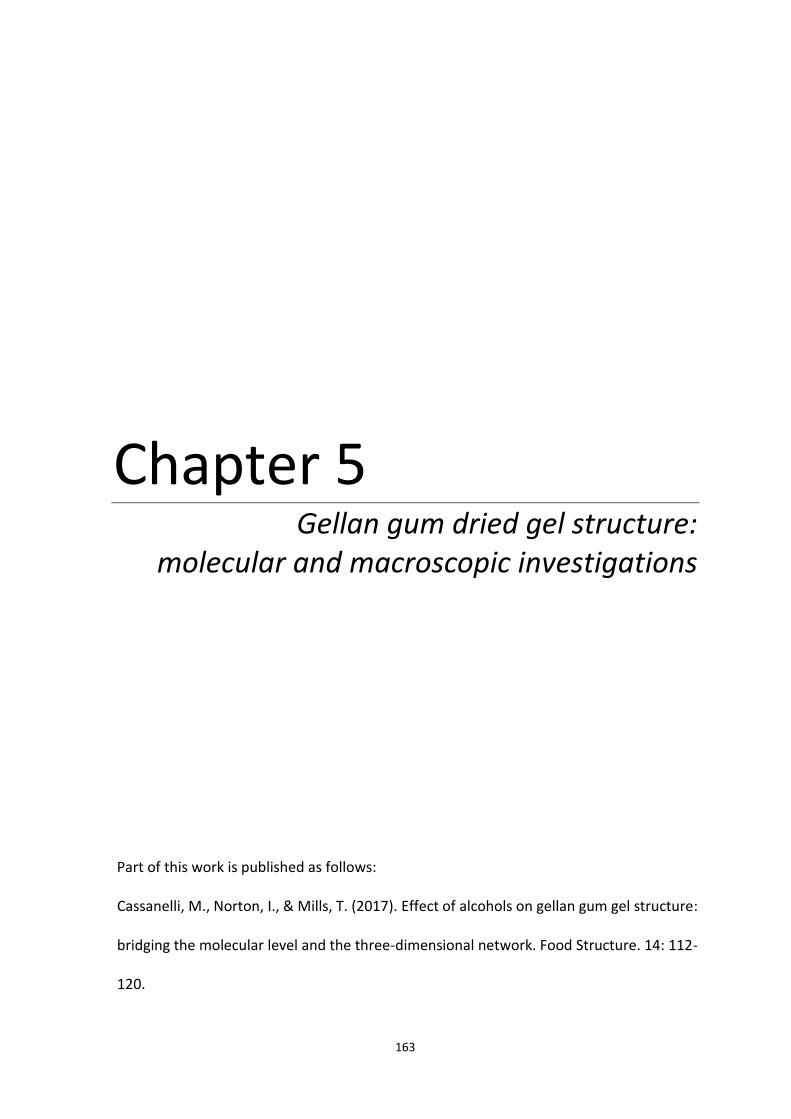
163
Chapter 5
Gellan gum dried gel structure: molecular and macroscopic investigations
Part of this work is published as follows:
Cassanelli, M., Norton, I., & Mills, T. (2017). Effect of alcohols on gellan gum gel structure:
bridging the molecular level and the three-dimensional network. Food Structure. 14: 112-
120.

Gellan gum dried gel structure: molecular and macroscopic investigations
164
5.1 Introduction
Dried hydrocolloids are common in complex food products, such as dairy or instant food,
to modulate and enhance their mouthfeel and textural properties (Rolin, 1993, de Vries,
2002, Norton and Foster, 2002, Renard et al., 2006). Dried food products can be consumed
as they are, but they often need to be rehydrated before consumption (Marabi et al., 2006,
Joardder et al., 2015). As the speed of this process can vary according to the specific
application, both the properties and the structure of the dried gel contained in the product
formulation may affect the water uptake. Thus, the rehydration rate, strictly dependent on
the drying process, of both the gel, and, therefore, the final product, can be modulated
(Marabi et al., 2004).
Dried gel systems are of interest not only in the food industry, but also in nutraceutics and
biomedicine. For example, they are often used as a carrier for the release of active
ingredients (e.g. drugs, bioactive molecules or sugars) (Hoffman, 1987, Tønnesen and
Karlsen, 2002, Lin and Metters, 2006, Nishinari and Fang, 2016) and for the design and
modulation of biopolymeric dried scaffolds to provide specific mechanical and chemical-
responsive properties (Sachlos and Czernuszka, 2003).
Among the drying techniques in the food industry, freeze-drying is widely used since it
preserves (Krokida et al., 1998, Evans, 2008) the food structure and nutrients (Avila and
Silva, 1999), as the process occurs at low temperatures. By contrast, air-drying generates a
compacted structure (Krokida and Maroulis, 1997, Joardder et al., 2015), since local
stresses within the material are generated on evaporation (Scherer, 1990). This mechanism
is affected by the surface tension of the liquid (Deshpande et al., 1992), which is relatively
high for water. Supercritical fluid (SCF) assisted techniques have recently been proposed in

Gellan gum dried gel structure: molecular and macroscopic investigations
165
the food industry (Brown et al., 2008, Brown et al., 2010a), as they are generally used for
other food applications, such as extraction (Peker et al., 1992), isoelectric precipitation of
proteins (Hofland et al., 2000), micronisation (Prosapio et al., 2016c) and substrate
impregnation (De Marco and Reverchon, 2017b).
The supercritical-fluid drying of both gel systems (Scherer, 1990, Tkalec et al., 2015,
Ubeyitogullari and Ciftci, 2016) and entire food products (Garcia-Gonzalez et al., 2007,
Brown et al., 2008) often requires the use of alcohols. They can be used as co-antisolvents
during the scCO2 -drying process or in a material pre-treatment before drying (hydrogel-
alcogel transition) (Tkalec et al., 2015, Ulker and Erkey, 2017).
The interaction between alcohol and gel can have an impact on the gel properties, such as
shape, shrinkage, transparency and texture (Buesa, 2008). Some hydrocolloids (e.g. pectin
and guar gum) can still form a gel network if alcohols are added to the hot solution during
the preparation stage (Oakenfull and Scott, 1984, Phillips and Williams, 2000, Tkalec et al.,
2015). However, the alcohol percentage depends on the specific gelling agent and can be
limited. For instance, hydroxypropyl cellulose (HPC) is soluble in aqueous solution with an
ethanol concentration around 50%, while xanthan gum water-solution can contain up to
60% in ethanol (Phillips and Williams, 2000). Furthermore, the ethanol addition can affect
some gel properties, like transparency, and promote gelation at lower temperatures
(Yamanaka et al., 2000).
In terms of produced dried-gel gellan gum structure, the aforementioned drying techniques
have already been investigated. Silva‐Correia et al. (2011) and Tiwari et al. (2015) reported
information about freeze-drying in gellan gum systems. However, their analyses were
based only on Scanning Electron Microscopy observations, lacking data about porosity

Gellan gum dried gel structure: molecular and macroscopic investigations
166
throughout the whole dried-gel volume. In order to have a 3D sample reconstruction, micro
CT microscopy can be a useful method to complete the freeze-dried microstructure
understanding. Ratti (2001) accurately compared freeze-drying with air-drying, suggesting
that the former is more suitable to achieve a high quality product although it is more
expensive. The effect of air-drying on the material structure has been deeply explained and
rationalised by Joardder et al. (2015). The drying kinetics and the effect of the different
drying processes on the dried-gel macrostructure were reported by Sundaram and Durance
(2008). However, in that work locust bean gum, pectin and starch were the hydrocolloids
investigated and they were mixed to form a single gel system, which is considerably more
complex and different from LA gellan gum in terms of gelation mechanism and molecular
configuration. Brown et al. (2010a) studied the effect of the supercritical CO2 (scCO2) drying
on agar gels in comparison with both oven and freeze-drying processes. However, this
system was characterised only at the macroscopic scale by µCT microscopy, without
providing information on the effect on the molecular and network level. Furthermore, the
collected data on agar are significant only for gelling agents with comparable gelation
mechanism and molecular structure, unlike gellan gum.
In this work, for the first time the effect of freeze, oven and scCO2-drying on gel
microstructure at both the molecular and macroscopic levels was investigated. Precisely,
the role of the physical mechanism of water removal for the specific drying method is
highlighted (i.e. sublimation, evaporation and solvent replacement/extraction), rather than
the drying kinetics. LA gellan gum was used as a model gelling agent in a quiescent form,
yet other hydrocolloids are expected to behave similarly, especially if they present a similar
gelation mechanism, based on the physical interactions of the polymer chains (Gulrez et

Gellan gum dried gel structure: molecular and macroscopic investigations
167
al., 2011), such as k-carrageenan (Aguilera and Stanley, 1999). This study proposes μDSC
analysis as a method to investigate the role of the drying technique on the gel network,
characterising the molecular aggregation extent and structure order. In fact, although μDSC
has already been used for gellan gum investigations (Sudhamani et al., 2003), it has never
proposed for dried gellan gum gels to show the presence of possible changes in the dried
sample thermal behaviour. After drying, the samples were rehydrated to study how the
structure affects the water uptake into the material.
To further investigate scCO2-drying, the alcohol pre-treatment to obtain alcogel was
studied, assessing the alcohol-hydrocolloid interactions once the gel was produced. The
characterisation of quiescent gels at the molecular scale was performed by μDSC and FTIR,
as Sudhamani et al. (2003) reported for the gellan gum gels without alcohols, whereas the
mechanical properties were investigated by texture analysis.
5.2 Materials and Methods
5.2.1 Gel preparation and solvent pre-treatment for sCO2-drying
Low acyl gellan gum gels (Kelcogel F, CPKelco, UK) at natural pH were prepared following
the method discuss in Section 4.2.1, obtaining samples of 10 mm in height and 13.5 mm in
diameter.
Similarly, 2% w/w gelatin (from porcine skin, Sigma-Aldrich, UK) and 2% w/w k-carrageenan
(Sigma-Aldrich, UK) were prepared to compare the solvent quality with LA gellan gum.
Once the gels were formed, different alcohols were separately used to assess their effect
on the gel properties. Ethanol (EtOH), 1-Propanol (1-PrOH) and 2-Propanol/Isopropanol (2-
PrOH) (AnalaR NORMAPUR, VWR, UK) were used as pure solvents or diluted in different

Gellan gum dried gel structure: molecular and macroscopic investigations
168
concentrations with distilled water to perform a gradual alcohol treatment. In this specific
case, solutions at 25, 50 and 80 wt% were prepared. When a gradual treatment was
applied, the gel samples were left, stepwise, in the alcoholic solution for 6 hours. Finally,
the treated gels were submerged in the pure solvent. The last step of the gradual treatment
was 24-hour long. On the other hand, if the treatment was not gradual, the samples were
directly left for 24 hours in the specific alcoholic solution/pure alcohol.
All the materials were used with no further treatment or purification.
5.2.2 Freeze-drying
The freeze-drying process is discussed in detail in Section 3.2.4.
5.2.3 Oven-drying
Oven-drying was performed in a Fistreem Vacuum oven at 20 °C, 40 °C and 60 °C under
static air, room pressure and a constant relative humidity (RH) of 20%. Since oven-drying
kinetics depends on the temperature, the process time was set accordingly to reach the
specific moisture content value (NMC below 0.1) (Brown et al., 2010a).
5.2.4 scCO2-drying
Carbon dioxide was supplied from BOC (Guildford, UK).Before drying using scCO2, an
ethanol (purity 99.9%, AnalaR NORMAPUR, VWR, UK) pre-treatment was performed to
replace water, while the supercritical CO2-drying was carried out to remove the liquid
ethanol from the sample and, therefore, to obtain a solid dried matrix (NMC below 0.1).

Gellan gum dried gel structure: molecular and macroscopic investigations
169
The gel samples were left, stepwise, in the alcoholic solutions at 25, 50 and 80 % wt%. Each
step was carried out for 6 hours, before using absolute ethanol for 24 hours.
The supercritical drying process necessary to remove ethanol was carried out in two
different configurations: batch and semi-continuous. In the batch configuration, alcogels
were placed into the vessel and then it was pressurised with CO2 and heated until the
desired operating conditions were achieved. The effects of temperature (40-50 °C) and
pressure (85-100 bar) were investigated. In the semi-continuous configuration, alcogels
were placed in the high-pressure vessel, which was pressurised applying a continuous CO2
flow at 2.5 L/min throughout the experiment using an air-driven liquid pump (MS-71,
Haskel, USA). The same conditions of pressure and temperature were tested.
In both configurations, temperature was controlled by a thermostatic water bath, in which
the rig is submerged. Pressure was monitored by using a manometer, while the CO2 flow
rate was read by a digital mass flow meter (RHE08, Rheonik, Germany) and adjusted by
opening the metering valve downstream, since steady state conditions are applied.
All the experiments in the batch configuration were carried out for 12 hours, followed by a
20-minute depressurisation. If the forced flow was applied, a 3-hour process was
performed.
5.2.5 Moisture content and water activity
Drying was assessed by measuring both the sample moisture content and water activity.
Further details are reported in Section 3.2.5.

Gellan gum dried gel structure: molecular and macroscopic investigations
170
5.2.6 Microstructure characterisation
The dried gel microstructures were analysed by X-ray micro computed tomography (μCT,
Skyscan 1172, Bruker, Belgium) and Scanning Electron Microscopy (ESEM FEG, Philips XL30,
The Netherlands), in conjunction with the analysis of physical/geometrical properties such
as density, shrinkage and shape.
High-resolution micro computed tomography and scanning electron microscopy were
performed following the method proposed in Section 3.2.7. In the specific case of the
ESEM, the maximum voltage was set up to 10 kV and the magnification up to x 1500.
The absolute (true) density of LA gellan gum was measured by using the AccyPyc II 1340
pycnometer, using helium as a displacement medium.
The gel shrinkage was determined by using the paraffin oil (Sigma‐Aldrich) liquid
displacement method (Del Valle et al., 1998, Yan et al., 2008a). This oil is particularly
suitable for this application since it is highly hydrophobic, by contrast with the hydrophilic
gel structure. The method used is based on the liquid displacement (Fig. 5.1) (Yan et al.,
2008a).

Gellan gum dried gel structure: molecular and macroscopic investigations
171
%𝑉𝑜𝑙𝑢𝑚𝑒 =𝜌𝑙
𝜌𝑙
𝑀′−𝑀𝑑∗
𝑀′−𝑀𝑜∗100 (Eq. 5.1)
Figure 5.1: Shrinkage measurement method: formula (Eq. 5.1) on the top.
Where M’ is the mass of the chamber filled with oil, Md* the mass of oil with the dried
sample, Mo* the oil mass with the non-treated sample. The experimental oil density ρl was
found to be 0.871 g mL-1, while the theoretical value lies in the range of 0.827 g ml-1 and
0.890 g mL-1.
Once the sample volume was calculated, the bulk density of the sample was measured as
the mass was known.

Gellan gum dried gel structure: molecular and macroscopic investigations
172
5.2.7 Molecular interactions: μDSC and FTIR
Thermal transitions were investigated by using a μDSC 3 evo (Seteram Instrumentation,
France). The sample was placed in the “close batch cell” (0.6 g ± 0.1 g). The reference cell
was filled with an equal mass of distilled water. Two sets of analyses were carried out on
LA gellan gum gel before drying, from 5 °C to 80 °C and from 5 °C to 55 °C, applying a scan
rate of 1 °C /min. The latter temperature range was used to isolate the melting of the
disordered chains and avoid the “second” thermal transitions, that depict the disruption of
the junction zones (Picone and Cunha, 2011).
The dried samples were rehydrated for six hours in 100 mL distilled water to enhance the
mobility of the polymer disorder chains and observe the thermal event on cooling. In this
case, thermal cycles were applied from 5 °C to 55 °C.
For the investigation of the effect of solvent on the gel structure, all the experiments with
LA gellan gum and k-carrageenan were carried out from 5 °C to 80 °C with a scan rate of 1
°C /min and in each experiment two heating/cooling cycles were applied. For gelatin, the
maximum temperature was set at 60 °C. The reference cell was filled with an equivalent
amount of alcohol or alcoholic solution.
In all these experiments, the μDSC curves were presented as an average of the first cycles
in triplicate, while the values of transition temperature, enthalpy and entropy were
expressed with plus/minus a single standard deviation.
Molecular interactions between the hydrocolloid and alcohols were evaluated by Fourier
Transform Infrared Spectroscopy (Spectrum Two IR Spectrometer, Perkin Elmer) in
reflection configuration. Spectra were collected for gels, gels with solvents (alcogels), and
alcohols with a resolution of 4 cm-1.

Gellan gum dried gel structure: molecular and macroscopic investigations
173
The selected scanning range was 600–4000 cm−1 wave numbers and 16 scans were applied
to each sample.
5.2.8 Texture analysis
In Section 3.2.3 the details about the texture analysis methods are reported.
5.2.9 Gel rehydration
The gel rehydration method is reported in Section 3.2.9.
5.2.10 Statistical analysis
All the experiments were performed in triplicate. Results were reported as an average and
plus/minus a single standard deviation.
5.3. Results and discussion
5.3.1 Role of the drying technique on the low-acyl gellan gum gel structure
5.3.1.1 Drying
In order to highlight the effect of the drying process on gel structure, the gel formulation
was kept constant throughout the experiments. The gel composition may lead to a different
drying kinetics and final microstructure, due to a different crystal distribution in the case
of freeze-drying (Tiwari et al., 2015), case hardening for air-drying (Joardder et al., 2015)
and different CO2 penetration for SCF assisted technology. The drying efficacy of the three
techniques was evaluated in terms of normalised moisture content (NMC) and water
activity (aw) (Barbosa-Cánovas et al., 2008). At the end of the drying processes (time

Gellan gum dried gel structure: molecular and macroscopic investigations
174
specified in the Material and methods), the former was below 0.1. Water activity was in all
cases in the range 0.2-0.3, considerably lower than the threshold of 0.6, below which
bacteria and microorganisms cannot grow and proliferate (Barbosa-Cánovas et al., 2008,
Rahman, 2009). The difference between the drying processes was negligible, within a
standard deviation. For all drying methods, it is important to consider that moisture can be
re-adsorbed by the dried material. This can affect the results of moisture content and water
activity.
5.3.1.2 Dried microstructure: Effect of the water removal
The visual appearance of the gels before and after drying is reported in Figure 5.2.
Figure 5.2: LA gellan gum 2 % w/w, visual comparison: freeze-dried (A), oven-dried (60 °C)
(B), scCO2-dried (50 °C and 100 bar, no flow) (C), hydrogel before drying (reference, D).

Gellan gum dried gel structure: molecular and macroscopic investigations
175
At a first glance, it is possible to observe that the only drying technique that caused a loss
in the cylindrical shape was oven-drying, while the other two methods preserved the
geometrical features, although some shrinkage occurred. Water evaporation causes the
collapse of the material, especially considering that the gel network becomes less rigid at
relatively high temperatures (i.e. in oven-drying). On the other hand, sublimation of ice
crystals into vapour and the solvent extraction at supercritical conditions alter the three-
dimensional macrostructure less and, therefore, better maintain the cylindrical shape.
The absence of liquid and, therefore, capillary stress during the sublimation of ice crystals
plays an important role in the structure preservation (Scherer, 1990) (Fig. 5.2 A). Similarly,
this collapse does not occur with supercritical fluid drying due to the absence of the liquid-
gas interface passing from the supercritical state to gas on depressurisation (Abbas et al.,
2008). More shrinkage was observed for the sCO2-dried gel compared to freeze-dried one.
The reason for that can be related to the higher polymer flexibility during drying due to the
relatively higher process temperatures in sCO2-drying. On the other hand, in oven-drying
the capillary hydrostatic stress due to the surface tension of the receding water menisci
causes a collapse of the structure (Fig. 5.2 B) (Snoeck et al., 2014).
The gel microstructure was assessed by µCT to investigate different cross-sections and to
obtain quantitative porosity values for the entire bulk volume (Fig. 5.3).

Gellan gum dried gel structure: molecular and macroscopic investigations
176
Figure 5.3: LA gellan gum 2 % w/w, µCT: freeze-dried (A), oven-dried (60 °C) (B), scCO2-
dried (50 °C and 100 bar, batch) (C), hydrogel before drying (reference, D).
Considerable differences in the dried structure were found among the three drying
processes.
The µCT analyses revealed that freeze-drying results in a homogeneous and symmetrical
structure, with a well preserved cylindrical shape due to the absence of material collapse
(Fig. 5.3 A). Oven-dried samples, showed an irregular structure formed by thick layers of
overlapping material (Fig. 5.3 B). With scCO2-drying the cylindrical shape was retained,
although some shrinkage occurred and the internal structure was not completely

Gellan gum dried gel structure: molecular and macroscopic investigations
177
homogeneous (Fig. 5.3 C). Some larger pores randomly distributed and localised in different
regions were observed. This behaviour might be related to the effect of ethanol during the
pre-treatment, leading to a stiffer gel structure (Eltoum et al., 2001, Buesa, 2008). The use
of alcohols can slightly deform the gel, locally modifying the stress generated, especially
during the gel shrinkage on drying. The ethanol pre-treatment is likely to remove all the
water from the sample, since the possible presence of liquid water, poorly soluble in
supercritical CO2, would generate a local collapse due to unbalanced capillary forces in the
gel network (Scherer, 1990). A heterogeneous structure can be detected with brighter and
darker regions in the µCT micrographs. The quantitative µCT analysis highlighted the
presence of these larger pores for scCO2-drying. Specifically, for freeze-drying the porosity
counts as 84.8% ± 4.2%, 7.1% ± 0.9% for oven-drying and 20.5 %± 8.4% for supercritical
carbon dioxide drying.
From the ESEM micrographs reported in Figure 5.4, it was possible to qualitatively gain
information regarding both the pore size and their distribution.

Gellan gum dried gel structure: molecular and macroscopic investigations
178
Figure 5.4: LA gellan gum 2 % w/w, ESEM images: freeze-dried (A, D), oven-dried (60 °C) (B,
E), scCO2-dried (50 °C and 100 bar, batch) (C,F).

Gellan gum dried gel structure: molecular and macroscopic investigations
179
In terms of pore size and shape, the freeze-drying results, dependent on the ice crystal size,
were in agreement with the current literature on gellan (Silva‐Correia et al., 2011). It seems
that for freeze-drying the structure is more stretched (Fig. 5.4 A-D), forming a material
membrane (Fig. 5.4 D), while the evaporation at high temperatures during oven-drying
induces a structure packing. On the other hand, carbon dioxide in a supercritical state does
not lead to the structure collapse (Scherer, 1990), despite a homogenous shrinkage, as
previously discussed. In this case, the ethanol pre-treatment needs to be considered in the
gel shrinkage measurement. In effect, the ethanol pre-treatment can affect both the shape
and volume retention (Eltoum et al., 2001, Buesa, 2008). Specifically, before scCO2-drying,
the direct use of pure ethanol led to more significant shrinkage, up to 50.2% ± 0.6%, while
a gradual treatment can limit this effect, reaching a value of 13.1% ± 0.2% (Cassanelli et al.,
2017b). Obviously, the material shrinkage percentage after scCO2-drying needs to take this
pre-treatment into consideration, especially if compared with the other techniques (Table
5.1).
Table 5.1: Bulk densities and shrinkage values.
Freeze drying Oven-drying Gradual EtOH pre-treatment +
scCO2-drying (batch)
Bulk density (g/cm3) 0.03 ± 0.01 0.17 ± 0.01 0.05 ± 0.01
Shrinkage % 26.20 ± 1.69 82.55 ± 0.12 54.65 ± 1.00
The shrinkage extent defines the bulk sample density after drying. The freeze-dried sample
had the lowest density, being highly porous. The density for the oven-dried structure was

Gellan gum dried gel structure: molecular and macroscopic investigations
180
the highest due to its collapse during the drying process. For supercritical CO2-drying, the
final product was homogeneously shrunk, yet not collapsed.
On the other hand, the absolute density was not dependent on the drying process and, in
fact, it was found to be 1.7 g/cm3 by using the pycnometer, close to the value reported in
Upstill et al. (1986).
5.3.1.3 Dried microstructure: Effect of the process parameters
In addition to the effect of the water removal on the gel network, the influence of the
process parameters was investigated in terms of the produced dried structure.
Considering freeze-drying, process parameters such as the pressure chamber and product
temperature could likely affect the drying rate (Chang and Patro, 2004), rather than the
material structure, which is, by contrast, strongly dependent on the gel formulation. Hence,
in this work all these variables were kept constant. The collapse temperature (Tc) in the
freeze-drying application is specific for each substance and is the temperature above which
the collapse of the frozen structure occurs. This irreversibly leads to the failure of the
material and to defect formation (Bellows and King, 1972, Kett et al., 2005, Abdelwahed et
al., 2006b). During gelation, hydrocolloids generate a network, specific for each gelling
agent, in which water is embedded. Specifically, the sol-gel temperature of gellan gum is
around 30 °C. As the material temperature in the freeze-dryer is low, at around -18 °C, the
structure is likely to be sufficiently rigid to ensure stability and avoid its collapse (Fig. 5.2A
and Fig. 5.3 A). To and Flink (1978) firstly reported that the collapse is noticeable as a non-
uniform radial shrinkage, which is absent after freeze-drying for LA gellan gum.

Gellan gum dried gel structure: molecular and macroscopic investigations
181
Oven-drying was performed at room pressure and 20 °C, 40 °C and 60 °C. Similar to freeze-
drying, it has been reported that both the material formulation and the drying process
parameters may contribute to a variation in structure, in terms of porosity, shrinkage and
shape retention (Joardder et al., 2015). Focusing on the process variables, temperature
should affect the drying rate and consequently the moisture gradient along the material
(Joardder et al., 2015). Low temperatures reduce the drying rate and as a consequence the
surface evaporation rate is approximately close to the diffusion moisture transfer rate
(Mayor and Sereno, 2004). On the other hand, higher drying rates may lead to the
formation of a rigid crust on the surface, since the moisture content starts to rapidly
decrease (Wang and Brennan, 1995). It leads to the generation of internal stress, affecting
both shrinkage and porosity. This phenomenon is known as case hardening (Joardder et al.,
2015).
Since oven-drying was not vacuum assisted in this work, the main process parameter was
temperature, which was set at 20°C, 40 °C and 60 °C.
The obtained dried microstructure did not show considerable differences in porosity,
shrinkage and bulk density within this temperature range (Fig. 5.5). The total porosity for
all these samples was less than 10%. However, the cross-section of the oven-dried structure
at 20 °C (Fig. 5.5 A) seemed to have less irregular sample edges. It may be related to a
slower water removal (Maskan, 2001), inducing less stress and distortion to the material
(Joardder et al., 2015).

Gellan gum dried gel structure: molecular and macroscopic investigations
182
Figure 5.5: µCT: 2% w/w LA gellan gum after oven-drying at 20 °C (A) and 60 °C (B).
The research into supercritical CO2-drying has shown that both temperature and pressure
may lead to different material structures. However, in this study, the micrographs referred
to a process pressure of 85 bar or 100 bar and a set temperature of 40 °C or 50 °C did not
show structural differences between the samples. It is likely that this temperature/pressure
window is too small to generate differences in the dried structure.
On the other hand, variations were notable by changing the process configuration, applying
a CO2 flow rate (Fig. 5.6).

Gellan gum dried gel structure: molecular and macroscopic investigations
183
Figure 5.6: µCT: 2% w/w LA gellan gum after process in semi-continuous configuration
applying 1 mL/min (A) and 2.5 L/min flow (B). Temperature was set at 50 °C and pressure
at 100 bar.
Specifically, from the µCT micrographs it is possible to observe that the cylindrical section
tended to be less defined. Compared to the batch configuration, very large pores were
formed. Denser areas were created, since brighter parts were evident, especially on the
sample surface. It seems that in some parts of the sample there was a local collapse due to
the applied scCO2 flow. Furthermore, this flow makes the overall ethanol removal process
faster, since after 3 hours the samples were completely dried. The quicker solvent
displacement might result in a heterogeneous shrinkage (loss in cylindrical shape) and in a
local material densification.
5.3.1.4 Gel rehydration
The water uptake and its diffusion into the material were affected by both the surface and
bulk properties (Aguilera and Stanley, 1999). The former is more likely influenced by the

Gellan gum dried gel structure: molecular and macroscopic investigations
184
chemical properties of the gel type and its formulation. On the other hand, the latter
considers the mechanical, morphological and physical properties.
The dried structures were expected to rehydrate differently, based on the porosity
distribution, void size and interconnection, shrinkage and consequently bulk density. In Fig.
5.7, the rehydration curves are shown.
Rehydration time (min)
0 6 12 18 24 30
NM
C
0.0
0.2
0.4
0.6
0.8
1.0
Freeze drying
scCO2 drying
Oven drying
Figure 5.7: Rehydration curves after different drying processes () freeze-drying, ()
oven-dried (60 °C), () scCO2-dried (50 °C and 100 bar, batch).
Freeze-drying resulted in a product that can easily and quickly reabsorb water. This is due
to the high porosity and to the presence of large pores, which are a preferential path for
water to penetrate. Oven-dried samples rehydrated slowly, since the structure was

Gellan gum dried gel structure: molecular and macroscopic investigations
185
completely collapsed. No macropores were present and the produced shrinkage was much
higher, consequently affecting the water uptake rate. Supercritical carbon dioxide in
combination with the ethanol pre-treatment generated an intermediate rehydration rate
and water uptake.
Figure 5.7 suggests that for freeze-drying two different rehydration rates, expressed as
NMC over time, describe the water uptake. After 6 min the rate was 0.110 min-1, while for
longer timescales the rehydration slowed down to 0.006 min-1. This trend became less
evident for the other drying techniques. For scCO2-drying, this rate passed from 0.15 min-1
to 0.04 min-1, while for oven-drying it became negligible.
These results suggest that freeze-drying is suitable for applications where a fast rehydration
is required, while oven-dried and scCO2-dried structures are more appropriate for
applications where the rehydration rate should be slower.
5.3.1.5 Effect on gellan gel molecular structure
After drying, the structure needs to be rehydrated with distilled water to enhance the
polymer chain mobility and distinguish clear thermal transitions on cooling. Otherwise, flat
thermal events would be recorded. For this reason, six-hour-rehydrated samples were
analysed with μDSC to assess the effect of the drying process on the gel network.
For the dried gels, the maximum temperature was set at 55 °C with the aim to highlight the
effect of the gellan gum disordered domains on cooling (Picone and Cunha, 2011). The idea
was to induce the helix-coil transition to the disordered chains on heating, without melting
the junction zones. In effect, if the junction zones were completely melted (Fig. 5.8 A), the
enthalpy ΔH on cooling was -0.200 ± 0.005 J g-1. Instead, if the gel was heated only up to 55

Gellan gum dried gel structure: molecular and macroscopic investigations
186
°C, ΔH was -0.167 ± 0.007 J g-1, suggesting that only the disordered chain domains were
melted (Fig. 5.8 B). If the gels were completely melted, the shape of the following gelation
peak seemed to embed the two transitions (Fig. 5.8 A), namely the coil-helix transition and
the chain aggregation in junction zones.
Figure 5.8: μDSC curves for the gellan gum hydrogel before drying. Heating/cooling cycles
were applied from 5 °C to 80 °C (A) and from 5 °C to 60 °C (B).

Gellan gum dried gel structure: molecular and macroscopic investigations
187
In Fig. 5.9, μDSC curves on cooling of samples dried using the different techniques are
reported. They suggest that the drying process differently alter the gel structure, since the
peak related to the cooling of the disordered chain domains shifted to higher or lower
temperatures in comparison to the LA gellan gum hydrogel.
It is evident that oven-drying sharply increased the thermal transition temperature to 38.9
± 0.4 °C, compared to the gel before drying (32.7 ± 0.1 °C).
Figure 5.9: μDSC curves after drying process on cooling. The μDSC curves are plotted as an
average of the first cycles in triplicate. Peak temperatures and enthalpy values are reported
in Table 5.2. The individual μDSC curves have been offset on the y-axis.

Gellan gum dried gel structure: molecular and macroscopic investigations
188
The higher peak temperature compared to the gel before drying is related to the dried gel’s
inability to completely re-absorb water because of structure collapse. In effect, the NMC
value for these samples was around 0.5 even after 24 h rehydration in distilled water. The
oven-dried sample showed that the enthalpy ΔH, which is related only to the mobility of
the disordered chains if the gel is heated up to 55 °C, as previously discussed, decreased
from -0.167 ± 0.007 J g-1 to -0.070 ± 0.017 J g-1 (Table 5.2). It suggests that disordered chains
involved in the coil-helix transition are fewer as a result of a more aggregated structure due
to the structure collapse and the water removal by evaporation. In terms of entropy
difference, ΔS, calculated as ΔH/T at the equilibrium (Deszczynski et al., 2003) on cooling,
a reduction was observed, as shown in Table 5.2. It indicates that, after gel cooling, the
system was less ordered, probably due to the relatively high drying temperature, compared
to the gel before drying.
Freeze-drying was expected to force the alignment of the polymer chains during the
freezing step along the ice crystal edges, similarly to what occurs during cryogel formation
(e.g xanthan). The reduction in enthalpy to -0.084 ± 0.029 J g-1 compared to the gel before
drying suggests that fewer disordered chains are involved in the thermal transition. The
peak temperature reduction (27.0 ± 2.5 °C) indicates that the chains should be more
aggregated due to the previous formation of ice crystals. However, the overall order of the
system slightly decreased, as the entropy was reduced to -3.0 10-3 ± 0.7 10-3 J g-1 °C -1. This
can suggest that the polymer chains in this structure were less ordered although more
packed.

Gellan gum dried gel structure: molecular and macroscopic investigations
189
Supercritical CO2-drying in batch configuration is a gentle process since the capillary stress
suppressed. However, the need to perform an ethanol pre-treatment tends to irreversibly
influence the polymer conformation, hardening the material (Eltoum et al., 2001, Buesa,
2008, Cassanelli et al., 2017a). A significant drop to 24.1 ± 0.8 °C in transition temperature
was observed, likely due to the presence of ethanol that altered the water network around
the polymer, which obstructs polymer rearrangement (Cassanelli et al., 2017a). More time
was required for the exothermic transition to happen, in comparison with the gel before
drying. Similar considerations were applied to the scCO2 process in the presence of a
continuous flow.
In Table 5.2 the values of peak temperatures, enthalpies and entropies are summarised.
Table 5.2: Peak temperatures, enthalpies and entropies for the gel before drying and after
the drying process, followed by rehydration for 6 hours.
Hydrogel Freeze-dried Oven-dried Gradual EtOH pre-treatment
+ scCO2-dried (batch)
Temperature (°C) 32.6 ± 0.1 27.0 ± 2.5 38.9 ± 0.4 24.1 ± 0.8
ΔH (J g-1) -0.167 ± 0.007 -0.084 ± 0.029 -0.070 ± 0.017 -0.047 ± 0.007
ΔS (J g-1 °C -1)*10-3 -5.1 ± 0.2 -3.0 ± 0.7 -1.8 ± 0.4 -1.9 ± 0.2
On a second thermal cycle, these dried and rehydrated gels showed a similar thermal
behaviour recorded on the first cycle.

Gellan gum dried gel structure: molecular and macroscopic investigations
190
5.3.2 Effect of alcohols quality on gellan gum gel structure
In this work, the production of aerogels required the use of ethanol to pre-treat the gel
samples and prepare them for supercritical CO2-drying, as water is not soluble in the scCO2
at the employed conditions (Sabirzyanov et al., 2002). The effect of ethanol and other
alcohols on the LA gellan gel structure on three different scales was therefore investigated.
Specifically, the chemical and physical properties of both the constitutive polymer molecule
and gel network as well as the mechanics of the gel at a macroscopic level were considered.
5.3.2.1 Alcoholic pre-treatment on gellan molecular level
In order to characterise the interaction of the solvent with the gellan gum chains and the
effect on the gel network, infrared spectroscopy was performed (Brown et al., 2008). The
peaks and intensity information is dependent on the macromolecule conformation and,
therefore, the system is sensitive to the specific solvent (Pawde and Deshmukh, 2008).
Figure 5.10 shows the collected spectra for pure ethanol, LA gellan gum hydrogel and
alcogel. Results for LA gellan gum gel were in agreement with the current literature (Pikal
and Shah, 1990, Sudhamani et al., 2003, Coutinho et al., 2010).

Gellan gum dried gel structure: molecular and macroscopic investigations
191
Wave number (cm-1
)
1000200030004000
% T
20
40
60
80
100
LA gellan gum 2 % w/w
LA gellan gum 2 % w/w + EtOH
Ethanol
A
Wave number (cm-1
)
600800100012001400160018002000
% T
20
40
60
80
100
LA gellan gum 2 % w/w
LA gellan gum 2 % w/w + EtOH
Ethanol
1605
1037
1075
B
Figure 5.10: FT-IR spectra for LA Gellan gum and ethanol: (A) (4000-600 cm-1), (B) (2000-
600 cm-1). The peaks values are related to the alcogel.

Gellan gum dried gel structure: molecular and macroscopic investigations
192
After the gel dehydration by ethanol treatment, a decrease in OH peak (between 3400 and
3200 cm-1) was noticed (Fig. 5.10 A), mainly due to the water removal and replacement
with the alcohol.
At the same time, in the alcogel the typical ethanol bands in the fingerprint region were
evident, between 1100 cm-1 and 1000 cm-1. In the alcogel, the characteristic ethanol peaks
for the C-O stretch were shifted from 1095 cm-1 and 1048 cm-1 to 1075 cm-1 and 1037 cm-1
respectively, suggesting that the interaction between ethanol and the polymer chains
occurred. Similar considerations were reported for the gellan gum-LiCF3SO3 system (Noor
et al., 2012). Therefore, since ethanol is polar with a strong hydrogen-bond donor group (-
OH) (Roberts and Caserio, 1977, Antoniou et al., 2010), it seemed that it effectively
interacts with the polymer at the molecular level, leaving an imprint on the gel structure.
The EtOH presence affected the typical gellan gum peak at 1637 cm-1 related to the
glycosidic bond (Sudhamani et al., 2003, Noor et al., 2012). In effect, the alcolgel showed a
peak shift to 1605 cm-1, suggesting that the solvent was effectively interacting.
In addition, the EtOH alcogel peak at 1037 cm-1 is slightly more intense than pure ethanol.
This may indicate that more contributions were present, namely the C-O-C stretches along
the polymer chain and C-O stretch in the ethanol molecule (Fig. 5.10 B).
A deeper investigation of the ethanol/gellan gum interaction was carried out by analysing
the μDSC thermographs (Fig. 5.11).

Gellan gum dried gel structure: molecular and macroscopic investigations
193
Figure 5.11: DSC curves: LA gellan gum on heating (A) and cooling (B). The μDSC curves are
plotted as an average of the first cycles in triplicate. The individual μDSC curves have been
offset on the y-axis.
Specifically, the effect of ethanol on the gel structure could be assessed by the evaluation
of the thermal transitions that were involved during the gel cooling and heating.
Since the thermal events were nearly flat when ethanol was used, it is clear that the
molecular thermal transitions were affected (Fig. 5.11). Particularly, both the endothermic
and exothermic peaks are not present, probably due to the higher polymer chain packing
induced by ethanol. This experiment suggests that the thermoreversible behaviour was lost
when ethanol was added, replacing water as a solvent. From this result, it is likely that an
alteration of the gellan network occurs, namely due to the effect of ethanol on the
structure.
Water in the three dimensional structure is plays a key role in the formation of crystalline
regions (Hatakeyama and Hatakeyama, 1998). In a true-quiescent gel, in parallel to the
water movement in the gel network, water molecules can move between the junction

Gellan gum dried gel structure: molecular and macroscopic investigations
194
zones (Ohtsuka and Watanabe, 1996), hydrating the double helices (Ohtsuka and
Watanabe, 1996). If salts are added to the gel solution, metal ions tend to replace water
molecules between the helices (Ohtsuka and Watanabe, 1996), affecting as a consequence
the stability of the junction zones (Morris et al., 2012). The addition of alcohols tends to
alter the water network (Nose and Hojo, 2006), likely affecting the stabilising interactions
and therefore the gel structure stability (Hui, 2006, Antoniou et al., 2010), decreasing the
network order. Specifically, the water molecules removal by alcohols tends to destabilise
the hydrogen bonds especially in the hydrophilic portions (Eltoum et al., 2001).
Additionally, this effect may result in a different mobility of the polymer chains when a
stress is applied in alcohols rather than in water. In other words, the chain movement is
more likely to be hindered by changing the solvent due to the molecular and network
configuration in alcohols compared to water.
In this light, Figure 5.12 A shows the μDSC curves during cooling as a function of ethanol
concentration in the aqueous solution.

Gellan gum dried gel structure: molecular and macroscopic investigations
195
Figure 5.12: DSC curves: LA gellan gum treated with different ethanol concentrations. The
μDSC curves are plotted as an average of the first cycles in triplicate. The individual μDSC
curves have been offset on the y-axis.
At 25 wt% EtOH, a reduction in the endothermic peak and a shift to a lower temperature
were observed. More time was required for the exothermic transition to happen, by
comparison with the non-treated gel. This is ascribed to the formation of a more
aggregated structure. However, the resulting structure was more disordered as an entropy
reduction was quantitatively calculated. In effect, by using the alcoholic solution at 25 wt%
EtOH, the ΔS value changed, calculated on cooling as ΔH/T at the equilibrium, from -6.1 10-
3 ± 0.1 10-3 J g-1 °C-1, in the non-treated gel, to -4.7 10-3 ± 0.9 10-3 J g-1 °C-1. This means that
after the treatment the entropy reduction related to the main thermal transition was
lower.
In Fig. 5.12 B the thermographs on heating are reported. The peak loss on heating at 25
wt% is caused by polymer aggregation and the reduction in the non-aggregated domains
that undergo the coil-helix transition.

Gellan gum dried gel structure: molecular and macroscopic investigations
196
A further increase in ethanol percentage led to a complete disappearance of the thermal
transition, as concluded for the use of pure ethanol. The applied thermal cycles on μDSC
analysis were within the temperature range of the gellan solid-state for both the untreated
and treated samples.
The effect of the solvent molecule length and the OH position on the gel network were
assessed. For this purpose, both isopropanol and 1-propanol were used.
In terms of μDSC analysis, these alcohols led to a flat thermal event within the same
temperature range, following a trend similar to pure ethanol. Likewise, the collected
infrared spectra show that the interaction between alcohols and the gellan gum network
occurred. In effect, the typical gellan peak referred to the glycosidic bond at 1637 cm-1 shifts
to 1611 cm-1 for 1-PrOH and to 1620 cm-1 for 2-PrOH (Fig. 5.13).
Interestingly, peaks were noticed within the wave number range between 1100 cm-1 and
1000 cm-1 for 2-PrOH (Fig. 5.13 B). Specifically, intense new peaks were found at 1069 cm-
1, 1055 cm-1. Moreover, a shift from 950 cm-1 to 970 cm-1 was noticed. It may indicate that
there is an effective interaction between LA gellan gum and isopropanol.

Gellan gum dried gel structure: molecular and macroscopic investigations
197
Figure 5.13: FT-IR spectra for LA Gellan gum with 1-propanol (A) and isopropanol (B). The
peaks values are related to the alcogel.

Gellan gum dried gel structure: molecular and macroscopic investigations
198
5.3.2.2 Alcoholic pre-treatment on gellan macroscopic level
Both the material texture and shrinkage were evaluated in order to link them to the
smaller-scale level. In particular, two different routes were undertaken, namely directly
using a specific concentration of solvent or gradually adding it. In terms of shrinkage, it was
measured that a gradual treatment was more suitable to better retain both the initial shape
and volume, as it is shown in Fig. 5.14.
It was evident that a gradual treatment led to a shrinkage of 13.1% ± 0.2%, while the direct
use of pure ethanol increased it up to 50.2% ± 0.6%. It is likely that the diffusion currents
during the solvent exchange from outside inwards the material resulted in a gel network
distortion (Bancroft and Gamble, 2008). Similar effects were noticed for isopropanol and
1-propanol.
Ethanol wt%
25 50 75 100
Ge
l shri
nka
ge
%
-20
-10
0
10
20
30
40
50
60
Ethanol (wt%)
Ethanol gradient (wt%)
Figure 5.14: Ethanol treatment: directly by using a specific concentration (wt%) (black bars)
and through ethanol gradient (grey bars).

Gellan gum dried gel structure: molecular and macroscopic investigations
199
Mechanical properties were clearly influenced by the solvent quality. Figure 5.15 shows
how the peak load increases as the solvent concentration was raised. In addition, the true
fracture strain moved from 35.3% ± 1.7% for non-treated gel to 42.7% ± 2.9% for the alcogel
treated with an ethanol gradient up to 100 wt%.
A microstructural explanation of the shrinkage and load to failure increase may be related
to an increment in network packing and chain entanglement (Tkalec et al., 2015). However,
it was found that the non-treated gels with the equivalent polymer density of the gradually
treated alcogels (13.1% shrinkage) showed a strength only equal to 23.9 ± 1.5 N, well below
the value referred to the alcogels (Fig. 5.15). The considerable strength increase might be
due to the fact that alcohols act as fixatives, producing material hardening and shrinkage
(Titford and Horenstein, 2005, Buesa, 2008).
On the other hand, this mechanical behaviour is likely not to be related to a more ordered
structure, as previously discussed in the μDSC section. Specifically, these results may
indicate that the slight alcogel turbidity observed in Fig. 5.15 might be dependent on a
more packed network, rather than an increase in junction zones size (Banerjee and
Bhattacharya, 2011), which means a more ordered system.
It is noteworthy to mention that the peak force drop for direct use of solutions at ethanol
concentrations greater than 50 wt% was likely to be related to both the shrinkage and
cylindrical shape distortion, when the gradual solvent treatment was not applied (Fig. 5.15).
This was obviously an artefact for the measurement. This geometrical distortion was mainly
due to the high solvent exchange through a stiffer outer portion of material caused by a
high concentrated alcoholic solution that rapidly fixed the polymer chains (Titford and
Horenstein, 2005, Buesa, 2008).

Gellan gum dried gel structure: molecular and macroscopic investigations
200
Ethanol wt%
0 20 40 60 80 100
Fo
rce
(N
)
0
40
80
120
160
200
240
Directly in Ethanol
Gradual increase in Ethanol
Figure 5.15: Peak force for LA Gellan gum treated with ethanol.
Increasing the solvent molecular length, the gel hardening was still evident, yet a slight
decrease in the peak load was noticed compared to ethanol, as it was possible to see when
a gradient up to 100% isopropanol/1-propanol was used (Fig. 5.16). Similarly, the measured
fracture true strain was 40.4% ± 2.8% for the alcogel treated with a 1-propanol gradient up
to 100 wt% and 39.5% ± 3.2% for isopropanol.
Since the gel shrinkage for isopropanol (13.9% ± 0.3%) and 1-propanol (15.7% ± 2.5%) was
comparable with gradual treatment with ethanol (13.1% ± 0.2%), the slight strength
decrease compared to the case with ethanol might be dependent on the different alcohol-
polymer interaction and gellan chain mobility in isopropanol and 1-propanol.. Moreover,

Gellan gum dried gel structure: molecular and macroscopic investigations
201
the different solvent viscosity (Spiro et al., 1990) might have a role in the gel mechanical
properties.
1-Propanol % w/w
0 20 40 60 80 100
Fo
rce
(N
)
0
40
80
120
160
200
240
Directly in 1-Propanol
Gradual increase in 1-Propanol
2-Propanol % w/w
0 20 40 60 80 100
Fo
rce
(N
)
0
40
80
120
160
200
240
Directly in 2-Propanol
Gradual increase in 2-Propanol
Figure 5.16: Peak force for LA Gellan gum treated with 1-propanol and 2-propanol.

Gellan gum dried gel structure: molecular and macroscopic investigations
202
In agreement with the previous results, Fig. 5.17 compares the true stress and true strain
as a function of the employed solvent after complete (up to 100 wt% alcohol) gradual
solvent treatment. The mechanical properties results for the untreated LA gellan gum were
in agreement with Norton et al. (2011). It was noticed that at around 10% true strain the
EtOH alcogel started to considerably increase the resistance to the compression, since
there was an increment in true stress. On the other hand, this stress increase was slightly
shifted to higher strain values for both 1-PrOH and 2-PrOH alcogels.
In Fig. 5.17, the curve related to gellan/water is also reported: the gel samples were
submerged in pure water for 24 hours before the texture analysis. A slight decrease in true
stress was measured in comparison with the untreated gel. Combining this consideration
to the slight volume expansion when more water was added during the treatment (25%
ethanol + 75% water) (Fig. 5.14), it seemed that water tended to open the gel structure.
More free water led to a gel softening, as shown in Fig. 5.17, in a sort of “network dilution”.
It is noteworthy to mention that the error bars are collapsed to the experimental points
due to the wide experimental range of true stress.

Gellan gum dried gel structure: molecular and macroscopic investigations
203
True strain %
0 10 20 30 40 50
Tru
e s
tre
ss (
MP
a)
0.0
0.5
1.0
1.5
2.0
2 % w/w LA gellan 2 % w/w LA gellan + water 2 % w/w LA gellan + EtOH 2 % w/w LA gellan + 1 PrOH 2 % w/w LA gellan + 2 PrOH
Figure 5.17: True stress vs true strain for LA gellan gum as a function of solvent quality after
complete gradual treatment.
The increase in true stress as well as the Young’s modulus (Fig. 5.18) with the solvent
concentration suggested an entangled and packed structure when solvents were gradually
used, raising the final stiffness value. Nevertheless, the network was less ordered, as
discussed in Section 5.3.2.2.
The error bars (plus/minus a single standard deviation) in Fig. 5.18 become more evident
increasing the solvent concentration. Although the effect of the solvents on the quiescent
gel shape distortion was considerably less pronounced if compared with the non-gradually-
treated alcogel shape, it could affect the texture results.

Gellan gum dried gel structure: molecular and macroscopic investigations
204
Solvent % w/w
0 20 40 60 80 100
Yo
ung
's M
od
ulu
s (
kP
a)
0
200
400
600
800
2 % w/w LA gellan + EtOH
2 % w/w LA gellan + 1 PrOH
2 % w/w LA gellan + 2 PrOH
Figure 5.18: Young’s modulus for LA gellan gum as a function of the solvent concentration.
The collected data are related to a gradual solvent treatment up to the specific
concentration.
In general, the load to failure increased as a function of the solvent concentration due to
the molecular interactions between the alcohol and polymer, as the FTIR analysis
suggested. It seems that alcohols do not affect the M+ site available along the gellan gum
chain (Fig. 2.6), since it is in contrast to the HA gellan gum mechanical properties. The acyl
substituents (glycerate and acetate) (Fig. 2.6) are well-known to lead to a softer and more
flexible gel (Phillips and Williams, 2000). Specifically, the glycerate provides stabilisation by
adding new hydrogen bonds, yet disrupting of the binding site for cations by orientation

Gellan gum dried gel structure: molecular and macroscopic investigations
205
change of the adjacent carboxyl group (Chandrasekaran and Thailambal, 1990, Morris et
al., 2012) and consequently the junction zone alteration. On the other hand, the acetate
hinders the helix aggregation (Morris et al., 2012, McClements, 2015). However, the acetyl
groups do not modify the overall molecular network and the double helix structure
(Chandrasekaran and Thailambal, 1990), unlike the alcohol case.
5.3.2.3 Comparison with gelatin and k-carrageenan
As an evidence and to further validate the considerations on the molecular level of LA
gellan gum, a μDSC evaluation on k-carrageenan and gelatin was performed. These
hydrocolloids were investigated as additional models, since they are respectively similar
and different to LA gellan gum in terms of gelation and molecular configuration.
The collected μDSC results (Fig. 5.19) suggested that k-carrageenan had a similar behaviour
to LA gellan gum, as it is shown in the thermographs, whereas gelatin preserves the thermal
peaks. This trend was expected for k-carrageenan, considering that the polymer gelation is
equivalent.

Gellan gum dried gel structure: molecular and macroscopic investigations
206
Figure 5.19: DSC curves: gelatin (top) and k-carrageenan (bottom) on heating and cooling. The
μDSC curves are plotted as an average of the first cycles in triplicate. The individual μDSC
curves have been offset on the y-axis.
5.4 Conclusion
The present work shows for the first time the effect of freeze, oven and scCO2-drying on
low-acyl gellan gum gels systems. All the techniques successfully reduced the water activity
below the microbial growth threshold. The drying process influenced the dried gel
structure. Specifically, the freeze-drying generated a highly porous material with more
aggregated polymer chains. By contrast, the oven-dried gel was completely collapsed and

Gellan gum dried gel structure: molecular and macroscopic investigations
207
highly aggregated, resulting in a gel that slowly and partially re-absorbs water. The scCO2-
drying did not induce the structure collapse and only partially shrank the material, leading
to a slower water uptake than the freeze-dried gel, yet quicker than the oven-dried gel.
However, the necessity to perform an alcoholic pre-treatment made the material harder,
changing the polymer network order and increasing the aggregation extent. In particular,
the alcohol addition to gels led to water network alteration, which irreversibly affected the
gel properties at both the molecular and macroscopic scales, depending on the solvent type
and concentration. The reason for this behaviour is likely to be related to the interaction
between the gel network and the solvent molecules.
From a macroscopic level, the presence of alcohols increased the compression strength and
stiffness due to the network fixation. Furthermore, depending on the alcoholic molecule
length, the mechanical properties slightly changed, likely due to a different polymer
interaction with alcohols.
A gradual treatment allowed a more successful retention of both the volume and shape
with respect to the direct use of solutions at high alcohol content. Therefore, it is
recommended when gelling agents are combined with alcohols.
Finally, it seems that the pre-treatment study can be extended to other gelling agents and
it is likely to expect similar results if the gels are comparable to gellan gum, like k-
carrageenan, or different results if the polymer and its gelation are dissimilar, such as
gelatin. In effect, similar thermal behaviour on cooling and heating was observed in
presence of ethanol for k-carrageenan, characterised by analogous gelation mechanism,
whereas, gelatin behaved differently than gellan gum.

Gellan gum dried gel structure: molecular and macroscopic investigations
208
The understanding of the relationship between the drying techniques and the produced
dried structure can help to design both food products with gelling agent in their
formulation and gel agents alone, in either quiescent form or gel particle suspension,
throughout the whole production process.

209
Chapter 6
Design of a cost-reduced flexible plant for supercritical-fluid-assisted applications
This work is published as follows:
Cassanelli, M., Prosapio, V., Norton, I., & Mills, T. (2018). Design of a cost-reduced flexible
plant for supercritical-fluid-assisted applications. Chemical engineering and technology,
DOI: 10.1002/ceat.201700487.

Design of a cost-reduced flexible plant for supercritical-fluid-assisted applications
210
6.1 Introduction
Supercritical fluids assisted techniques have gained interest due to the unique properties
of supercritical fluids (SCFs). SCFs show, at the same time, liquid-like properties and gas-
like properties which can be tuned according to the employed pressure and the
temperature (Tabernero et al., 2012b, Prosapio et al., 2016a), as further discussed in
Section 2.3.3. Carbon dioxide (CO2) is the most commonly used fluid because it has a
relatively accessible critical point, 31.1 °C and 73.8 bar, which makes it useful for the
processing of thermo-sensitive compounds. Supercritical CO2 (scCO2) assisted processes
have been successfully applied to several fields, e.g. aerogel drying, impregnation and
extraction.
Traditional gel drying techniques, i.e. freeze-drying and air-drying, are characterised by
high energy consumption, long processing times and/or can cause the collapse of the gel
structure with consequent low porosity (Brown et al., 2010b). In this field, an innovative
method consists of a hydrogel-alcogel transition, followed by solvent removal using scCO2
(Ulker and Erkey, 2017); this process is faster, allows a better retention of the gel structure
and a good control over the porosity and pore size distribution (Brown et al., 2010b).
Conventional techniques for the impregnation of active compounds in a porous substrate
involve organic solvent evaporation; however, high residual solvent and decomposition of
thermo-labile molecules may occur (Yokozaki et al., 2015). These problems are avoided in
supercritical impregnation because organic solvents are not used, mild temperatures are
employed and at the end of the process, CO2 is completely removed from the product by
depressurisation.

Design of a cost-reduced flexible plant for supercritical-fluid-assisted applications
211
Traditional solid-liquid extraction requires the use of expensive and hazardous organic
solvents, harmful both for living beings and the environment (Baiano and Del Nobile, 2016).
Supercritical CO2 extraction overcomes this obstacle providing high quality extracts, whilst
reducing the toxicity associated with the solvents and shortening the processing time
(Machmudah et al., 2011).
However, supercritical fluids assisted techniques also show some limitations, such as the
need of specialised and expensive equipment and high-energy costs mainly related to the
fluid compression (Singh et al., Walters et al., 2014, He and Chen, 2017). Therefore, in the
last few years, their application has been restricted mainly to high-added value products
(Domingo, 2015). In order to extend the use of these technologies to other industrial fields
and to reduce their environmental impact, strategies aimed to overcome the above
reported limitations should be suggested. Many studies involving the use of scCO2 have
been proposed for different applications (Golubovic et al., 2007, Perrut, 2012, Pantić et al.,
2016, Prosapio et al., 2016c, Prosapio et al., 2016b, De Marco and Reverchon, 2017a,
López-Domínguez et al., 2017, Villanueva-Bermejo et al., 2017), but, so far, there have been
no published papers regarding the design of a high-pressure plant which is able to be
adapted to different processes, with reduced set-up and running costs.
In this work, a novel flexible batch plant for supercritical-fluid-assisted processes is
proposed. The aforementioned restrictions are minimised by the absence of pumps, which
are expensive for high-pressure applications and require high-energy consumption. The
employed vessel is not equipped with transparent windows that are used by some authors
to visually observe the transition from liquid to supercritical conditions in absence of pumps
(Maiwald and Schneider, 1995, Zera, 2016) or to study the vapour-liquid equilibria (VLE) of

Design of a cost-reduced flexible plant for supercritical-fluid-assisted applications
212
the systems solvent/antisolvent and solvent/antisolvent/solute (Campardelli et al., 2017,
Lee et al., 2017). In order to work at high pressure values, these windows are usually made
of quartz which is an expensive material (Sevilla and Hussain, 2017). In the present work,
the supercritical conditions are attained by taking advantage of the thermodynamics of the
system formed by CO2, solute and solvent (e.g. ethanol if present): the process is designed
to achieve a specific pressure at the working temperature by calculating and weighing the
precise amount of CO2. The rig can be adapted for different applications; in particular, in
the present study, it has been tested for gel drying, impregnation of a porous substrate
with α-tocopherol and extraction of caffeine from green coffee beans and tea leaves. The
operating principle of the designed rig will be described more in detail and its applicability
will be assessed; for each application, the thermodynamics of the involved system will be
studied and some preliminary experiments will be performed. Finally, a set-up and running
cost analysis will be discussed to verify the convenience of the proposed plant compared
with the classic batch and the semi-continuous ones.
6.2 Materials and methods
6.2.1 Materials
The proposed rig was built with piping, valves and joints purchased from Swagelok©
(Manchester, UK).
Pure CO2 cylinder in a dipped-tube configuration was used to withdraw liquid carbon
dioxide (BOC, Guildford, UK) for all the experiments in this work.
For the gel drying experiments, gels were made by dissolving 2% w/w low acyl gellan gum
(Kelcogel F, CPKelco, UK) in distilled water and stirring at 85 °C for 2 hours. The solution

Design of a cost-reduced flexible plant for supercritical-fluid-assisted applications
213
was then placed into cylindrical moulds and, after gelation on cooling at 20 °C, samples
were 10 mm high with a 13 mm diameter. Absolute ethanol (EtOH, purity 99.9%) supplied
by AnalaR NORMAPUR (VWR, UK) was used as a pre-treatment agent.
For the impregnation process, a freeze-dried gel, made of a mixture of low (LA) and high
acyl (HA) gellan gum (1:1) at 2% w/w, was used as a porous substrate. The dimensions of
the dried gel were the same as mentioned for the gel drying process. Vitamin E (α-
tocopherol, purity > 95.5%), provided by Sigma-Aldrich (UK), was loaded into the dried gel
during the scCO2 adsorption.
The caffeine extraction process was performed on both coffee beans (green robusta coffee
beans) and black tea leaves. Pure caffeine (purity 99%), supplied by Sigma-Aldrich (UK) was
used as a reference standard.
6.2.2 Rig description and procedure
The outline of the proposed rig is shown in Fig. 6.1.

Design of a cost-reduced flexible plant for supercritical-fluid-assisted applications
214
Figure 6.1: Schematic representation of the designed rig. The pressure vessel (PV)
geometry is highlighted on the right. Solvents or active compounds are placed below the
sample.
Section 1 consists of the CO2 cylinder, a pressure gauge (M1), a non-return valve (NRV), a
metering valve (MV1) and a pressure relief valve (PRV) set at 150 bar for this series of
experiments. This rig part is connected by a metal hose to the main section (Section 2). The
pressure vessel (PV), highlighted on the right of Fig. 6.1, consists of an upper stainless steel
sample cylinder and a lower short pipe, the external diameter is 4.8 cm for the former and
2.5 cm for the latter. After the vessel is separately cooled down in a freezer at -20 °C, the

Design of a cost-reduced flexible plant for supercritical-fluid-assisted applications
215
sample is placed in it and vertically connected to the rig. The vessel is assembled in a
heating copper coil (HEC), in which a heating liquid circulator (LC) pumps a mixture of
water/glycol. After the liquid CO2 is weighed, the upper and lower parts of the metal coil
with the vessel are insulated. It is important to note that this coil does not affect the weight
measurement, since it does not touch the vessel.
In Fig. 6.2 the process is shown on the CO2 phase diagram.
Figure 6.2: Process steps reported on the CO2 phase diagram: (1a) CO2 cylinder in vapour-
liquid equilibrium; (1b) vessel filled with CO2; (2) CO2 critical point; (3) working condition.
Liquid CO2 flows from the cylinder (1a) to the vessel due to the pressure difference caused
by the temperature gradient. After the filling (1b), the pressure vessel is heated following

Design of a cost-reduced flexible plant for supercritical-fluid-assisted applications
216
the vapour-liquid equilibrium, passing the critical point (2), up to the working conditions in
the supercritical region (3).
The total amount of CO2 inside the vessel can be controlled by a high resolution hanging
scale (HS, resolution ± 1 g), since all the main parts are connected to it (delimited by the
dashed line in Fig. 6.1) and isolated from the first part by the flexible metal hose. The
system weight (constituted by the weight of the vessel, valves, gauge, heating coil and
piping) is zeroed in order to accurately measure the weight of CO2. The maximum quantity
that can be filled depends on the vessel capacity, which for the proposed rig is 0.15 L. At
this stage, the metering valves MV2 and MV3 are closed. MV1 is kept open until the desired
amount of liquid is weighed. Afterwards, the heat provided by the copper coil increases the
temperature in the vessel and, therefore, the fluid pressure, monitored by the pressure
gauge M2. Using this method, the maximum pressure that can be reached in the
temperature range of this work is about 200 bar. The heating of section 2 is remotely
controlled to match the set temperature with the value measured by the thermocouple
(Tc) located inside the vessel.
6.2.3 Thermodynamics
6.2.2.1 Equation of state (EOS)
In this work the equation of state used to calculate the properties of the involved systems
is the ‘Soave-Redlich-Kwong’ (SRK) equation (Eq. 6.1), widely accepted for supercritical fluid
applications (Brunner, 1994, Sabirzyanov et al., 2002).
𝑃 =𝑅𝑇
𝑉−𝑏−
𝑎(𝑇)
𝑉(𝑉+𝑏) (Eq. 6.1)

Design of a cost-reduced flexible plant for supercritical-fluid-assisted applications
217
Where temperature (T), pressure (P) and molar volume (V) are expressed in K, bar and L
mol-1 respectively. R is the gas constant expressed in L bar K−1 mol−1. Here, the interaction
factor a(T) depends on temperature:
𝑎(𝑇) = 𝑎′(𝑇𝑐)𝛼(𝑇) (Eq. 6.2)
where:
𝑎′(𝑇𝑐) = 0.42748𝑅2𝑇𝑐
2
𝑃𝑐 (Eq. 6.3)
𝛼(𝑇) = [1 + (0.480 + 1.574𝜔 − 0.176𝜔2) (1 − √𝑇
𝑇𝑐)]
2
(Eq. 6.4)
The co-volume b can be calculated as:
𝑏 = 0.08664𝑅𝑇𝑐
𝑃𝑐 (Eq. 6.5)
In these formulas the subscript “c” means that it is related to the critical point and ω is the
acentric factor. For this EOS the acentric factor ω is 0.239, Tc is 31.1 °C and Pc equal to 73.77
bar (Brunner, 1994).
Brunner (1994) discussed different equations of state, suggesting that both the ‘Ideal Gas’
and the ‘Van der Waals’ equations are not accurate for supercritical fluid applications. In
effect, both equations oversimplify the system, leading to an incorrect estimation of the
PVT behaviour. Specifically, the Ideal Gas equation is well applicable only at high

Design of a cost-reduced flexible plant for supercritical-fluid-assisted applications
218
temperatures and low pressures, while the Van der Waals equation of state is not adequate
for practical applications for most substances (Brunner, 1994).
The SRK equation of state can still be used for the calculations even if the system is not a
pure substance. In this case, the EOS is modified (Eq. 6.6), combining the mixture
parameters am(T) and b, which can be defined by the quadratic mixing rules for a generic
binary system (Eq. 6.7 and 6.8) (Brunner, 1994). The subscript “m” means “modified”.
𝑃 =𝑅𝑇
𝑉−𝑏𝑚−
𝑎𝑚(𝑇)
𝑉(𝑉+𝑏𝑚) (Eq. 6.6)
𝑎𝑚(𝑇) = 𝑥12𝑎11(𝑇) + 2𝑥1𝑥2𝑎12(𝑇) + 𝑥2
2𝑎22(𝑇) (Eq. 6.7)
𝑏𝑚 = 𝑥12𝑏11 + 2𝑥1𝑥2𝑏12 + 𝑥2
2𝑏22 (Eq. 6.8)
Where xi is the molar fraction in one phase, while both aii and bii are related to the pure
components.
The binary parameters a12(T) and b12 are expressed in Eq. 6.9 and 6.10:
𝑎12(𝑇) = √𝑎11(𝑇)𝑎22(𝑇) (1 − 𝑘12) (Eq. 6.9)
𝑏12 = 0.5(𝑏11 + 𝑏22)(1 − 𝑙12) (Eq. 6.10)
Both k12 and l12 are relatively smaller than 1. If both a12(T) and b12 are not known, they can
be neglected (Brunner, 1994).

Design of a cost-reduced flexible plant for supercritical-fluid-assisted applications
219
Since ethanol is used in this work, the acentric factor ω and the critical
temperature/pressure related to EtOH must be used to calculate both aii and bii.
Specifically, the acentric factor is 0.644, Tc is 240.7 °C and Pc is 61.4 bar. Both a12(T) and b12
have been set to zero to simplify the calculation method.
6.2.3.2 Method for calculation of CO2 amount
Depending on the solute type and amount to solubilise, the quantity of CO2 can require
specific constraints to reach a homogeneous supercritical phase. Specifically, based on the
solute volume, the process has to be designed calculating the minimum temperature and
pressure. If the amount of solute is negligible, the simplest way is to directly use the
suggested EOS. However, some solutes form a mixture with CO2 with critical properties
considerably different from those of the pure CO2, especially higher critical pressure and
temperature. In this case, the calculation needs specific thermodynamic restrictions.
For both cases, the initial step is the sample volume calculation to find the net free volume
inside the vessel. The use of a pycnometer to measure the material density might simplify
this estimation. If the system does not require specific constraints, the CO2 mass can be
worked out from Eq. 6.1. On the other hand, other substances soluble in CO2 may interact
with it, forming a mixture with a different critical point. For example, ethanol is used in this
study to displace water from the wet gels because it is poorly soluble in scCO2 (Brunner,
2005). As a consequence, the critical point of the CO2/EtOH system is higher than pure CO2
(Yeo et al., 2000, Furlong, 2011). In this case, the critical temperature and pressure of the
CO2/EtOH system have to be lower than the working conditions in order to operate in
completely developed supercritical conditions. In Fig. 6.3, the generic binary system
Design of a cost-reduced flexible plant for supercritical-fluid-assisted applications
220
CO2/solvent (Akien and Poliakoff, 2009) shows that to work in the supercritical state, the
operating point should be located at a pressure value above the mixture critical point (MCP)
of the binary system at a given temperature (P > Pc) and at a CO2 molar fraction located on
the right of the MCP (X1 > Xc).
Figure 6.3: Generic isotherm phase diagram for a binary system CO2/solvent adapted from
(Akien and Poliakoff, 2009).
In order to calculate the amount of CO2 needed to solubilise ethanol, an iterative procedure
was used, as shown in Figure 6.4.

Design of a cost-reduced flexible plant for supercritical-fluid-assisted applications
221
Figure 6.4: Proposed method for CO2 calculation. The constraints are represented by “ >”.
The subscript 1 is referred to CO2, whereas 2 is referred to EtOH.
First, the working temperature (Tw) and pressure (Pw) were fixed. Since the moles of ethanol
to be removed (n2) are known, it is necessary to hypothesise a value for CO2 molar fraction
(X1). Therefore, the moles of CO2 (n1) can be obtained from Eq. 6.11:
𝑛1 = 𝑛2𝑥1
(1−𝑥1) (Eq. 6.11)
Then, once calculated the total moles have been calculated (n1+n2), it is possible to work
out the molar volume Vm and the parameters am and bm from Eq. 6.7 and 6.8, respectively.

Design of a cost-reduced flexible plant for supercritical-fluid-assisted applications
222
Afterwards, from Eq. 6.6 it is possible to calculate P: if this value corresponds to the working
pressure (P = Pw), x1 hypothesised is correct, otherwise a new value has to be fixed and the
calculation process reiterated until convergence.
For safety considerations, the maximum amount of liquid CO2 should be lower than the
total available volume in the vessel, to avoid an uncontrolled increase in pressure. The
safety valve (PRV) prevents the rig from overpressurisation.
6.2.4 Experimental procedures
6.2.4.1 Gel drying
Gel samples were treated stepwise with alcoholic solutions at 25, 50 and 80 wt% and left
in each concentration for 6 hours. Finally, the samples were soaked in absolute ethanol for
24 hours. The volume of the treated gel was measured in parallel by using the paraffin oil
displacement method (Del Valle et al., 1998, Yan et al., 2008b) to precisely calculate both
the net available volume in the vessel and the ethanol percentage. Further details are
reported in Section 5.2.6. Afterwards, the amount of CO2 can be obtained by the SRK
equation of state and applying the thermodynamic constraints previously discussed.
The effect of the temperature was investigated at 40 °C and 50 °C, while the working
pressure was constantly at 100 bar. After the system was heated, a drying time of 8 hours
was applied to promote the ethanol solubilisation into the scCO2. The venting stage was
carried out opening MV3 at the bottom of the vessel and ensuring a low flow rate, less than
1 bar min-1, to maintain the temperature above the critical temperature and avoid the
collapse of the material. Furthermore, the slow depressurisation was carried out to limit
the bubbling effect, since the system becomes thermodynamically unstable (Mayinger,

Design of a cost-reduced flexible plant for supercritical-fluid-assisted applications
223
1988). At the end of the experiments, the produced aerogels were stored in a low-vacuum
desiccator till characterisation.
6.2.4.2 Freeze-dried gel impregnation with vitamin E
The freeze-dried gel consisting of HA/LA gellan gum mixture (1:1) at 2% w/w was placed in
the vessel with 0.4 g of α-tocopherol on the bottom of the vessel. During this stage, the
dried gel and the vitamin were not in direct contact. Two experiments were performed at
120 bar and 140 bar, chosen as reference conditions (Gupta and Shim, 2006). The working
temperature was fixed at 60 °C for both experiments. After 24 hours (chosen as the
reference time), the vessel was vented at a rate lower than 1 bar min-1. The sample was
analysed after complete depressurisation.
6.2.4.3 Caffeine extraction
In the case of the coffee beans, they needed to be pre-treated with water, as suggested in
literature (Peker et al., 1992). Firstly, a saturated caffeine solution was prepared by leaving
the green Robusta coffee raw beans in water (1 g coffee for 2 g water) for 24 hours in an
ultrasonic bath to promote the mass transfer. The maximum amount of extracted caffeine
was then calculated by UV-VIS spectrophotometer, taking pure caffeine as a reference at a
wavelength equal to 296 nm. Afterwards, the coffee beans to be processed were soaked
for 1 hour in this saturated solution to allow water to penetrate into the structure, yet
limiting the caffeine lost by osmosis. The scCO2 extraction was carried out at 40 °C and 110
bar (milder conditions (Gupta and Shim, 2006) than those generally used in industrial
processes (De Marco et al., 2018)), partially filling the bottom of the vessel with 4 ml of

Design of a cost-reduced flexible plant for supercritical-fluid-assisted applications
224
distilled water, separated by the sample by a metal grid. The same conditions were applied
to black tea leaves, although no pre-treatment was necessary. Both the processes were
performed for 8 hours, followed by depressurisation at the rate lower than 1 bar min-1.
6.2.5 Characterisation methods
6.2.5.1 Gel drying
The aerogel microstructure was analysed by X-ray micro-computed tomography (μCT).
High-resolution micro computed tomography was performed by using the Skyscan 1172
(Bruker, Belgium). Without any chemical fixation or sample preparation, this system
provides a complete 3D bulk reconstruction. The acquisition mode can be set at a maximum
current of 96 μA and voltage of 100 kV. The CT-analyser (1.7.0.0) was used to obtain both
a qualitative and quantitative analysis. After 2D cross-section binarisation into black and
white images, the overall porosity and the pore size distribution can be measured.
6.2.5.2 Freeze-dried gel impregnation with vitamin E
The amount of α-tocopherol adsorbed in the substrate was calculated by weighing the
sample before and after the process. As a further method of validation, the UV-VIS
spectrophotometer (Orion AquaMate, Thermoscientific, UK) was used, after calibration at
292 nm, placing the sample in an aqueous medium and measuring the concentration of the
released vitamin (De Marco and Reverchon, 2017a). The loading was calculated according
to the following Eq. 6.12:

Design of a cost-reduced flexible plant for supercritical-fluid-assisted applications
225
𝐿𝑜𝑎𝑑𝑖𝑛𝑔% = 𝑚𝑎𝑠𝑠 𝛼−𝑡𝑜𝑐𝑜𝑝ℎ𝑒𝑟𝑜𝑙 𝑎𝑏𝑠𝑜𝑟𝑏𝑒𝑑
𝑡𝑜𝑡𝑎𝑙 𝑚𝑎𝑠𝑠 ∙ 100 (Eq. 6.12)
Fourier transform infrared (FT-IR) spectra were obtained via the Spectrum Two IR
Spectrometer (Perkin Elmer, UK) in reflection mode at a resolution of 4 cm−1. The scan
wavenumber range was 4000–500 cm−1, and 16 scan signals were averaged to reduce the
noise.
6.2.5.3 Caffeine extraction
The concentration of caffeine in the obtained solution was analysed by using the UV-VIS
spectrophotometer, selecting the wavelength at 296 nm. The collected results were
compared with data from literature (Gupta and Shim, 2006).
2.6 Cost analysis
A qualitative analysis was carried out to compare the set-up and running costs of the
proposed rig with a semi-continuous and a classic batch rigs, using 0.15 L as a reference for
the vessel capacity. The set-up costs were estimated on the basis of current quotations,
while the running costs were calculated considering the average energy requirements for
each configuration and the amount of CO2 employed during the processes.

Design of a cost-reduced flexible plant for supercritical-fluid-assisted applications
226
6.3. Results and discussion
6.3.1 Gel drying
The CO2 amount was calculated using the proposed method in Fig. 6.4. Before drying using
scCO2, the ethanol pre-treatment was performed, leading to the sample dehydration
before the actual process. The supercritical fluid technology was used to remove the liquid
from the sample to obtain a solid matrix, avoiding its collapse, which usually occurs with
traditional drying because of the capillary induced tensile stresses (Scherer, 1990). In effect,
the photograph in Fig. 6.5 shows that later in the drying process the cylindrical shape was
preserved.
Figure 6.5: Photo of LA gellan gum gel (left) and aerogel produced at 50 °C (right).
Although the gel partially shrank, the structure did not collapse. Furthermore, from a
microstructural point of view, it seems that no considerable differences rose within the
working temperature range, since both the shape and the shrinkage were comparable. The
quantitative analysis provided a total porosity value equal to 27.1% ± 6.5% at 50 °C. The
considerable standard deviation was dependent on the large random pores generated

Design of a cost-reduced flexible plant for supercritical-fluid-assisted applications
227
during the drying process, as it was possible to notice from the pore size distribution (Fig.
6.6).
Pore size (µm)
0 200 400 600 800
Po
rosity
%
0
2
4
6
8
10
50 °C, 100 bar
Figure 6.6: Pore distribution after scCO2-drying (at 50 °C and 100 bar).
6.3.2 Freeze-dried gel impregnation with vitamin E
Solubility data allow determining the saturation conditions at fixed temperature and
pressure. In particular, at 60 °C and 120 bar the molar solubility of α-tocopherol in scCO2 is
equal to 200·10-6, whereas at 60 °C and 140 bar is equal to 300·10-6 (Chen et al., 2000).
In order to assess the effectiveness of the designed rig for supercritical impregnation,
experiments of α-tocopherol adsorption in a porous gellan substrate were performed at 60
°C and the effect of the operating pressure was investigated.

Design of a cost-reduced flexible plant for supercritical-fluid-assisted applications
228
When the operating pressure was fixed at 120 bar α-tocopherol was impregnated, with a
mean loading equal to 16.7%. As expected from the solubility data, increasing the pressure
at 140 bar, the amount of adsorbed vitamin increased, with a mean loading equal to 17.7%.
Fourier transform infrared (FT-IR) analyses were performed to identify possible interactions
between α-tocopherol and the hydrocolloid in the loaded gels. FT-IR spectra of the
unprocessed vitamin and gellan and processed α-tocopherol/gellan are reported in Fig. 6.7.
Figure 6.7: FT-IR spectra of HA/LA gellan, α-tocopherol and HA/LA gellan+α-tocopherol.
The spectrum of unprocessed α-tocopherol shows absorption bands at: 917 cm−1 OH
bending, 1087 cm−1 in-plane bending of phenyl, 1158 cm−1 CH2 wag, 1369 cm−1 CH3 bending,
1465 cm−1 the C–C stretching and in the range 2800–3000 cm−1 stretching vibration of the
C–H groups (De Marco and Reverchon, 2017a, Prosapio et al., 2017). HA/LA gellan gum
spectrum shows absorption bands at: 1017 cm-1 C=O stretching, 1413 cm-1 symmetric COO-
stretching, 1613 cm-1 asymmetric COO- stretching, 2917 cm-1 C–H stretching and in the

Design of a cost-reduced flexible plant for supercritical-fluid-assisted applications
229
range 3020-3660 cm-1 OH stretching (Silva‐Correia et al., 2011). The spectrum of the loaded
gel confirms the occurred impregnation and indicates the presence of HA/LA gellan gum
and α-tocopherol since the characteristic peaks of both the compounds are present.
6.3.3 Caffeine extraction
The extraction of caffeine from green coffee beans and black tea leaves was carried out in
the presence of water (Stahl et al., 2012). In this case, it was not necessary to reach a
homogeneous supercritical phase and, therefore, the SRK equation was used without
applying any constraints.
After the process at 40 °C and 110 bar, the collected solution was analysed to calculate the
amount of solubilised caffeine, as reported in Table 6.1.
Table 6.1: Experimental caffeine concentration expressed as a molar fraction after
extraction in supercritical CO2.
Material y·10-6
Green coffee beans 36.2
Black tea leaves 56.9
These values are in agreement with the literature data on caffeine solubilisation in scCO2
(Li et al., 1991, Burgos-Solórzano et al., 2004), within the same order of magnitude.
Interestingly, the amount of caffeine from green coffee beans is slightly lower than the
quantity collected from black tea leaves. This was likely to be related to the different
material morphology and structure. In effect, the rigid matrix of the coffee beans might
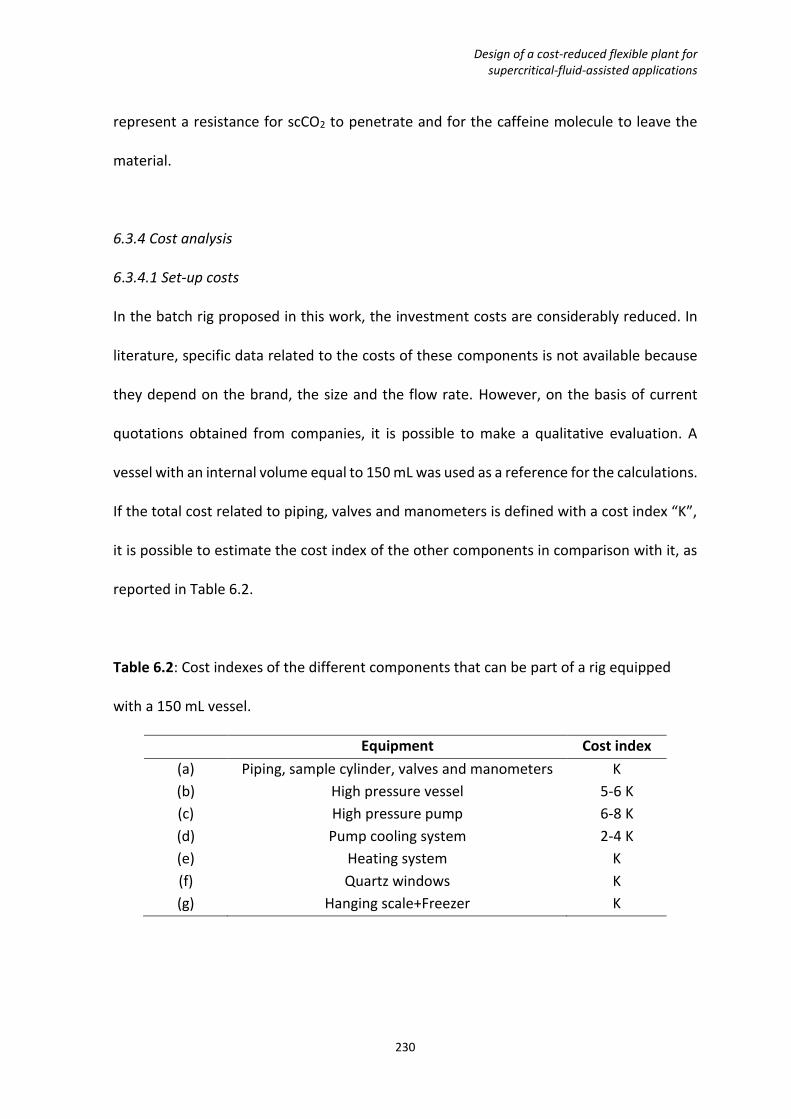
Design of a cost-reduced flexible plant for supercritical-fluid-assisted applications
230
represent a resistance for scCO2 to penetrate and for the caffeine molecule to leave the
material.
6.3.4 Cost analysis
6.3.4.1 Set-up costs
In the batch rig proposed in this work, the investment costs are considerably reduced. In
literature, specific data related to the costs of these components is not available because
they depend on the brand, the size and the flow rate. However, on the basis of current
quotations obtained from companies, it is possible to make a qualitative evaluation. A
vessel with an internal volume equal to 150 mL was used as a reference for the calculations.
If the total cost related to piping, valves and manometers is defined with a cost index “K”,
it is possible to estimate the cost index of the other components in comparison with it, as
reported in Table 6.2.
Table 6.2: Cost indexes of the different components that can be part of a rig equipped
with a 150 mL vessel.
Equipment Cost index (a) Piping, sample cylinder, valves and manometers K (b) High pressure vessel 5-6 K (c) High pressure pump 6-8 K (d) Pump cooling system 2-4 K (e) Heating system K (f) Quartz windows K (g) Hanging scale+Freezer K

Design of a cost-reduced flexible plant for supercritical-fluid-assisted applications
231
From these approximate data it is possible to assess that: the cost of the batch rig proposed
in this work is about 3 K (a+e+g), while the cost of a semi-continuous rig and a classic batch
rig is about 10-14 K (a+c+d+e). These estimations considered the use of a stainless steel
sample cylinder and a short pipe as a pressure vessel (Section 6.2.2). The cost of a batch rig
without pumps, but equipped with quartz windows (which needs to be fitted in a high
pressure vessel) is about 8-9 K (a+b+e+f). Therefore, the cost of the proposed rig is about
3-5 times lower than a semi-continuous and a classic batch rigs, and about 3 times lower
than a batch rig with quartz windows.
6.3.4.2 Running costs
In order to have a general overview about the energy saving related to the proposed rig, a
quantitative evaluation of the energetic costs was carried out in comparison with the classic
batch rig and a semi-continuous rig (both equipped with a pump and a chiller). For this
purpose, scCO2 gel drying was considered as a reference process using a 150 mL vessel for
the calculations. Usually, a semi-continuous process consists of the following steps:
preliminary cooling to reach the chiller set-point; pressurisation of the vessel pumping
scCO2; stabilisation of the operating conditions (pressure, temperature and CO2 flow rate);
drying; depressurisation (no electric energy involved). In the classic batch process, the step
related to the stabilisation is missing, since once the operating pressure is reached, the
pump is switched off. In the proposed batch process, the pressurisation step is performed
without the use of pumps and the preliminary cooling of the vessel is carried out by using
a dedicated freezer
In Table 6.3 the average power requirements of the main rig devices are reported.

Design of a cost-reduced flexible plant for supercritical-fluid-assisted applications
232
Table 6.3: Current power requirements of the rig devices.
Equipment Power consumption [W]
High pressure pump 180-750
Pump cooling system 200-1500
Freezer 25-40
Heating system 85-1100
In order to estimate the energy consumption required by each configuration (proposed,
classic batch and semi-continuous rigs), the average times of each process step are
reported in Table 6.4; these data were taken from the literature related to gel drying
(Dowson et al., 2012, De Marco et al., 2016, Ciftci et al., 2017).
Table 6.4: Average process step times needed for a rig equipped with a 150 mL vessel.
Process steps Novel batch rig Classic batch rig Semi-continuous rig
Preliminary cooling [min] 120 120 120
Pressurisation [min] 20 5-10 5-10
Stabilisation [min] 0 0 15
Drying [min] 480 480 240-300
The energy consumptions of the three configurations are summarised in Table 6.5. The
calculations were carried out considering the lowest energy requirement for each device
from the ranges reported in Table 6.3. Similarly, for the semi-continuous rig, the lower
pressurisation and drying times were considered (Table 6.4).

Design of a cost-reduced flexible plant for supercritical-fluid-assisted applications
233
Table 6.5: Energy consumption calculation for each process step for a rig equipped with a 150 mL vessel.
Novel batch
rig
Classic batch
rig
Semi-continuous
rig
Cooling [kJ] 180 1500 5280
Heating [kJ] 2550 2474 1632
Pumping [kJ] 0 54 2808
Total energy consumption [kJ] 2730 4078 9720
The comparison of the total energy consumption of the three configurations shows that
the proposed rig allows a cost reduction of about 72% with respect to the semi-continuous
rig and about 33% compared to the classic batch. Consequently, considering an average
aerogel weight equal to 50 mg, it is possible to assess that the energy demand to produce
the same amount of final product is 55 kJ/mg for the proposed rig; 82 kJ/mg for the classic
batch rig and 194 kJ/mg for the semi-continuous rig.
Another important factor to take into account is the amount of CO2 employed during the
process. Using the average process step times reported in Table 6.4, it is possible to
calculate the total quantity of CO2 required producing an aerogel. Specifically, for both
batch rigs the required CO2 mass is the same, while for the semi-continuous one is
considerably higher. As evidence, the drying working conditions of this study involve 50-80
g of CO2 per process for both the proposed and classic batch rigs, whereas for the semi-
continuous rig, supposing an average flow rate of 10-20 g/min (Brown et al., 2010b, De
Marco and Reverchon, 2017a), the CO2 quantity is about 2500-5000 g.

Design of a cost-reduced flexible plant for supercritical-fluid-assisted applications
234
6.4 Conclusions
In this work, a cost-reduced batch plant for supercritical assisted processes was proposed.
It has been demonstrated that the designed plant is characterised by high flexibility, since
it is able to adapt to different supercritical CO2 applications, such as gel drying,
impregnation and extraction. It has been evaluated that the present rig allows a
considerable reduction in both the set-up and running costs.
On the basis of these results, which are in agreement with the literature to date, it is
possible to assess that the designed plant can be very useful on laboratory scale to produce
several products through different techniques but using the same rig and with reduced
costs.

235
Chapter 7
Conclusions and suggestions for future work

Conclusions and suggestions for future work
236
This research aimed to investigate the drying and rehydration for hydrocolloids commonly
used in the food industry. Freeze-, air- and supercritical fluid- drying processes were
considered and applied to gellan gum gels, chosen as model hydrocolloid.
The main findings of this thesis can be summarised and divided into three key parts as
follows:
7.1 Investigation of freeze-dried gellan gum structure: effect of gel formulation
This study focused on the effect of the gellan gum gel formulation on the generated freeze-
dried structure. In the first part, HA and LA gellan gum were investigated and mixed in
order to understand the behaviour upon freeze-drying and the structural properties of the
dried gel. In the second part, only LA gellan gum was used as a gelling agent, while the
formulation was changed by adding sucrose or mannitol.
It is knows that the textural properties of a gel system can change based on the gelling
agent mixture and their ratio. This thesis shows that also the properties of the gel upon
drying and rehydration can be modulated based on the final application. If the mixture
contains a higher percentage of LA gellan gum, the water activity of the system will be
lower at a given freeze-drying time. On the other hand, the HA gellan gum addition to the
mixture increases the swelling capability and the rehydration extent, yet the water re-
absorption rate is lower.
Gelling agents are often combined with sugars and polyols in real products and in such
complex formulations the presence of these additional ingredients can have an effect on
the gel properties. The sucrose addition leads to a stronger freeze-dried gel and, therefore,
if the dried product needs to have this texture on biting, sucrose is preferred, whereas

Conclusions and suggestions for future work
237
mannitol increases less the material strength. The different dried gel structure containing
either sucrose or mannitol not only changes the material mechanical properties, but also
the rehydration rate and extent. If the product needs to be rehydrated before
consumption, the water re-absorption rate can be increased by adding up to 10 wt% in
solid content of either sugar/polyol. However, the mechanical properties of the
rehydrated gel will be considerably lower, as the compounds are leached from the
structure on rehydration.
As there are a lot of applications of fluid gels in the food industry, a future
recommendation is the investigation of freeze-dried gel particles made of HA/LA gellan
gum mixtures. This work would consist in scaling down the findings on quiescent gels to
smaller aggregates in a continuous aqueous medium. In addition, a further investigation
on hydrocolloids with similar and different molecular structure and gelation mechanism,
such as k-carrageenan or gelatin, may be useful to understand the general gel behaviour
on freeze-drying.
A future recommendation is the use of a Freeze-drying Microscope (FDM) to complete the
characterisation of the freeze-dried material. This analysis will accurately identify the
material collapse temperature, which is key to avoid the structure collapse after freeze-
drying. In parallel, the thermal behaviour of the material can be further investigated by
electrical impedance analysis, which can detect softening events in the frozen state and
show potential micro-collapses. Considering fluid gels, Freeze-drying Microscopy would
help detecting particle aggregation (clumping) and loss of shape due to the ice crystal
formation.

Conclusions and suggestions for future work
238
In addition, X-Ray Diffraction (XRD) analysis can provide more details about the physical
state of sugars in these dried gels and, therefore, their interaction with water.
Nuclear Magnetic Resonance (NMR) is recommended to measure the water mobility in
these gel systems before drying and after rehydration. By measuring the relaxation time
rate of the water protons, especially applying a CPMG sequence, it will be possible to have
more information about the interaction of water with the polymer chains and sugars by
comparison with the water interaction in the gel without additional solutes.
Additional information about the interaction between the gel network and water can be
obtained by carrying out a Dynamic Vapour Sorption (DVS) analysis. This gravimetric
technique shows how the rate and extent of vapour absorption/desorption occur in the
dried material upon exposure to a broad range of humidity, typically from 0% to 90% RH.
7.2 Acidified/basified gellan gum gels: the role of the structure in drying/rehydration
To further investigate the effect of the gel formulation on the drying process, the LA gellan
gum hot solution was acidified/basified before gel forming. Gel texture and appearance,
before and after drying, as well as the rehydration rate and extent are highly sensitive to
gel pH and they can be modulated by changing it. The gel acidification/basification changes
the properties not only on freeze-drying, but also on oven-drying.
This investigation could be supportive to the product formulation design. For example,
food products, such as dairy or meat substitutes, that contain gelling agents could have
different textural properties as a function of their pH. In particular, the mechanical
properties of quiescent gels or fluid gels can be adjusted according to the customer
requirements. For this reason, the study of different hydrocolloids (polyanions and

Conclusions and suggestions for future work
239
polycations), whose gelation mechanism is also dependent on the pH, can be useful to
control the product properties at different pHs.
In conjunction with the effect on the gel rehydration rate and extent, the pH modulation
can be used to design the release of substances from the gel matrix for oral applications.
A future recommendation is the study of acidified/basified gels in simulated
gastric/intestine fluids to replicate the release of compounds (e.g. vitamins) in the body.
For this purpose, the active compound to load into the gel should be added directly to the
hot polymeric solution or after gel setting, depending on the compound thermo-
sensitivity. The in-vitro release tests by using UV spectroscopy/chromatography can be
performed to analyse the release rate of the active compounds.
7.3 Gellan gum dried gel structure: molecular and macroscopic investigations
The findings of this thesis suggest that not only the macrostructure, but also the molecular
network of the gellan gum gels was affected by the drying method and water removal
process. The highly porous dried gel generated by freeze-drying suggests that this
technique is more suitable than oven-drying, which leads to the gel network collapse,
when the product application requires high rehydration rate and extent, although the
drying time is considerably longer. In addition to the conclusions on the gel structure, it is
important to consider that the thermal treatment, needed for oven-drying, can cause a
product deterioration from a chemical point of view. Similarly, scCO2-drying may degrade
the chemical properties of the product, since ethanol is required for the alcoholic pre-
treatment before drying. However, from a microstructural perspective, the absence of
capillarity passing from the supercritical state directly into gas on depressurisation avoids

Conclusions and suggestions for future work
240
the gel collapse. The scCO2-drying is preferred to freeze-drying when other processes are
combined, for example drying with extraction or impregnation: for example, the gel can
be placed in the pressurised vessel, dried with scCO2 and then loaded with specific
compounds.
The SCF dried gels had a different microstructure depending on the presence or not of CO2
flow. A batch configuration led to a more gentle solvent displacement process. A novel
batch-rig for lab-scale was designed and developed, especially for aerogel applications. For
the first time, it has been proposed the use of a hanging scale to weigh the amount of CO2
required for the experiment and the use of the thermodynamics to reach the working
conditions. The SCF dried samples processed in this rig were very structurally similar. This
new rig is, therefore, recommended for laboratory scale applications.
The effect of pre-treatments could be further investigated in conjunction with drying
methods, such as osmotic dehydration or by using firming agents. The use of hypertonic
solutions containing either sugars or salts can be used to have an impact on both the
material structure and process efficiency. The drying time can be reduced, reaching a low
value of water activity in a shorter period. Also, the moisture content can be relatively
higher at a given water activity value, having a potential consequence on the subsequent
rehydration.
Firming agents, such as calcium carbonate, can harden the material without necessarily
changing the polymer configuration, as happens with alcohols. They can reduce the
collapse of the structure, especially for oven-drying, and after rehydration, the structure
can be stronger, limiting the texture deterioration that generally occurs during drying.

Conclusions and suggestions for future work
241
In this thesis, the drying and rehydration of gel systems only were investigated. A
recommended future work is the study of more complex food products, containing
hydrocolloids in the formulation, to assess the interaction of the ingredients and the
overall behaviour on drying. For example, this research can be considered the starting
point to design and optimise both the product quality and the production process of
freeze-dried ice cream and dairy, dried meet substitutes, ready meals and beverages.

242
Chapter 8
References
References
243
ABBAS, K. A., MOHAMED, A., ABDULAMIR, A. S. & ABAS, H. A. 2008. A Review on Supercritical Fluid
Extraction as New Analytical Method. American Journal of Biochemistry and Biotechnology,
4, 345-353.
ABDEL-HALEEM, A. M. & OMRAN, A. A. 2014. Preparation of dried vegetarian soup supplemented
with some legumes. Food and Nutrition Sciences, 5, 2274.
ABDELWAHED, W., DEGOBERT, G. & FESSI, H. 2006a. Investigation of nanocapsules stabilization by
amorphous excipients during freeze-drying and storage. European Journal of
Pharmaceutics and Biopharmaceutics, 63, 87-94.
ABDELWAHED, W., DEGOBERT, G., STAINMESSE, S. & FESSI, H. 2006b. Freeze-drying of
nanoparticles: formulation, process and storage considerations. Advanced Drug Delivery
Reviews, 58, 1688-1713.
ABRAMOVIČ, H. & KLOFUTAR, C. 2006. Water adsorption isotherms of some gellan gum samples.
Journal of Food Engineering, 77, 514-520.
AGUILERA, J. M. & STANLEY, D. W. 1999. Microstructural Principles of Food Processing and
Engineering, ASPEN.
AKIEN, G. R. & POLIAKOFF, M. 2009. A critical look at reactions in class I and II gas-expanded liquids
using CO2 and other gases. Green Chemistry, 11, 1083-1100.
AKPINAR, E. K. 2006. Determination of suitable thin layer drying curve model for some vegetables
and fruits. Journal of Food Engineering, 73, 75-84.
AMICI, E., CLARK, A., NORMAND, V. & JOHNSON, N. 2000. Interpenetrating Network Formation in
Gellan− Agarose Gel Composites. Biomacromolecules, 1, 721-729.
ANTONIOU, E., BUITRAGO, C. F., TSIANOU, M. & ALEXANDRIDIS, P. 2010. Solvent effects on
polysaccharide conformation. Carbohydrate Polymers, 79, 380-390.
ARIYAWANSA, S. 2000. The evaluation of functional properties of fish meal. United Nations
University, Fisheries Training Programme, Project Final, Sri Lanka, 125.
AVILA, I. & SILVA, C. 1999. Modelling kinetics of thermal degradation of colour in peach puree.
Journal of Food Engineering, 39, 161-166.
BAGLEY, E., WOLF, W. & CHRISTIANSON, D. 1985. Effect of sample dimensions, lubrication and
deformation rate on uniaxial compression of gelatin gels. Rheologica acta, 24, 265-271.
BAIANO, A. & DEL NOBILE, M. A. 2016. Antioxidant Compounds from Vegetable Matrices:
Biosynthesis, Occurrence, and Extraction Systems. Critical Reviews in Food Science and
Nutrition, 56, 2053-2068.

References
244
BAJAJ, I. B., SURVASE, S. A., SAUDAGAR, P. S. & SINGHAL, R. S. 2007. Gellan gum: fermentative
production, downstream processing and applications. Food Technology and Biotechnology,
45, 341.
BAKALIS, S. & KARATHANOS, V. 2005. Study of Rehydration of Osmotically Pretreated Dried Fruit
Samples. Drying Technology, 23, 533-549.
BANCROFT, J. D. & GAMBLE, M. 2008. Theory and practice of histological techniques, Elsevier Health
Sciences.
BANERJEE, S. & BHATTACHARYA, S. 2011. Compressive textural attributes, opacity and syneresis of
gels prepared from gellan, agar and their mixtures. Journal of Food Engineering, 102, 287-
292.
BANERJEE, S. & BHATTACHARYA, S. 2012. Food gels: gelling process and new applications. Critical
Reviews in Food Science and Nutrition, 52, 334-346.
BARBOSA-CÁNOVAS, G. V., FONTANA JR, A. J., SCHMIDT, S. J. & LABUZA, T. P. 2008. Water activity
in foods: fundamentals and applications, John Wiley & Sons.
BARBOSA-CÁNOVAS, G. V. & VEGA-MERCADO, H. 1996. Dehydration of foods, Springer Science &
Business Media.
BASHKATOV, A. N., GENINA, E. A. & TUCHIN, V. V. 2002. Optical immersion as a tool for tissue
scattering properties control. Anita Publications, New Delhi, India.
BELGHITH, A., AZZOUZ, S. & ELCAFSI, A. 2016. Desorption isotherms and mathematical modeling of
thin layer drying kinetics of tomato. Heat and Mass Transfer, 52, 407-419.
BELLOWS, R. J. & KING, C. J. 1972. Freeze-drying of aqueous solutions: Maximum allowable
operating temperature. Cryobiology, 9, 559-561.
BERMAN, H., JEFFREY, G. T. & ROSENSTEIN, R. 1968. The crystal structures of the α'and β forms of
D-mannitol. Acta Crystallographica Section B: Structural Crystallography and Crystal
Chemistry, 24, 442-449.
BEUCHAT, L. R. 1981. Microbial stability as affected by water activity. Cereal Foods World, 26, 345-
349.
BHANDARI, B. 2012. Food materials science and engineering, John Wiley & Sons.
BONIFACIO, M. A., GENTILE, P., FERREIRA, A. M., COMETA, S. & DE GIGLIO, E. 2017. Insight into
halloysite nanotubes-loaded gellan gum hydrogels for soft tissue engineering applications.
Carbohydrate Polymers, 163, 280-291.

References
245
BOUCHAOUR, M., DIAF, N., OULD-ABBAS, A., BENOSMAN, M., MERAD, L. & CHABANE-SARI, N.
2003. The Role of Supercritical CO2 in the Drying of Porous Silicon. Revue des énergies
renouvelables, 99-102.
BOURNE, M. 2002. Food texture and viscosity: concept and measurement, Academic press.
BRADBEER, J. F. 2014. Self-structuring foods based on acid-sensitive gellan gum systems to impact
on satiety. University of Birmingham.
BRADBEER, J. F., HANCOCKS, R., SPYROPOULOS, F. & NORTON, I. T. 2014. Self-structuring foods
based on acid-sensitive low and high acyl mixed gellan systems to impact on satiety. Food
Hydrocolloids, 35, 522-530.
BROWN, Z. 2010. The drying of foods using supercritical carbon dioxide.
BROWN, Z. K., FRYER, P. J., NORTON, I. T., BAKALIS, S. & BRIDSON, R. H. 2008. Drying of foods using
supercritical carbon dioxide - Investigations with carrot. Innovative Food Science and
Emerging Technologies, 9, Numb 3, 280-289.
BROWN, Z. K., FRYER, P. J., NORTON, I. T. & BRIDSON, R. H. 2010a. Drying of agar gels using
supercritical carbon dioxide. Journal of Supercritical Fluids, 54, Numb 1, 89-95.
BROWN, Z. K., FRYER, P. J., NORTON, I. T. & BRIDSON, R. H. 2010b. Drying of agar gels using
supercritical carbon dioxide. The Journal of Supercritical Fluids, 54, 89-95.
BRUNNER, G. 1994. Gas extraction. Darmstadt : New York: Steinkopff, Springer.
BRUNNER, G. 2005. Supercritical fluids: technology and application to food processing. Journal of
Food Engineering, 67, 21-33.
BUESA, R. J. 2008. Histology without formalin? Annals of Diagnostic Pathology, 12, 387-396.
BURGOS-SOLÓRZANO, G. I., BRENNECKE, J. F. & STADTHERR, M. A. 2004. Solubility measurements
and modeling of molecules of biological and pharmaceutical interest with supercritical CO
2. Fluid Phase Equilibria, 220, 55-67.
CALDWELL, K., GOFF, H. & STANLEY, D. 1992. A low-temperature scanning electron microscopy
study of ice cream. II. Influence of selected ingredients and processes. Food Structure, 11,
2.
CAMPARDELLI, R., REVERCHON, E. & DE MARCO, I. 2017. Dependence of SAS particle morphologies
on the ternary phase equilibria. The Journal of Supercritical Fluids, 130, 273-281.
CAO, N., YANG, X. & FU, Y. 2009. Effects of various plasticizers on mechanical and water vapor
barrier properties of gelatin films. Food Hydrocolloids, 23, 729-735.
CAPRON, I., COSTEUX, S. & DJABOUROV, M. 2001. Water in water emulsions: phase separation and
rheology of biopolymer solutions. Rheologica Acta, 40, 441-456.

References
246
CARES-PACHECO, M., VACA-MEDINA, G., CALVET, R., ESPITALIER, F., LETOURNEAU, J. J., ROUILLY,
A. & RODIER, E. 2014. Physicochemical characterization of d-mannitol polymorphs: The
challenging surface energy determination by inverse gas chromatography in the infinite
dilution region. International Journal of Pharmaceutics, 475, 69-81.
CARSTENSEN, J. T. & VAN SCOIK, K. 1990. Amorphous-to-crystalline transformation of sucrose.
Pharmaceutical Research, 7, 1278-1281.
CASSANELLI, M., NORTON, I. & MILLS, T. 2017a. Effect of alcohols on gellan gum gel structure:
bridging the molecular level and the three-dimensional network. Food Structure.
CASSANELLI, M., NORTON, I. & MILLS, T. 2017b. Effect of alcohols on gellan gum gel structure:
Bridging the molecular level and the three-dimensional network. Food Structure, 14, 112-
120.
CASSANELLI, M., NORTON, I. & MILLS, T. 2017c. Role of gellan gum microstructure in freeze drying
and rehydration mechanisms. Food Hydrocolloids.
CHANDRASEKARAN, R. & THAILAMBAL, V. 1990. The influence of calcium ions, acetate and L-
glycerate groups on the gellan double-helix. Carbohydrate Polymers, 12, 431-442.
CHANG, B. S. & PATRO, S. Y. 2004. Freeze-drying process development for protein pharmaceuticals.
COSTANTINO., HR & PIKAL, MJ (eds.) Lyophilization of Biopharmaceuticals, 2.
CHANG, I., IM, J., LEE, S.-W. & CHO, G.-C. 2017. Strength durability of gellan gum biopolymer-
treated Korean sand with cyclic wetting and drying. Construction and Building Materials,
143, 210-221.
CHASSAGNE-BERCES, S., POIRIER, C., DEVAUX, M.-F., FONSECA, F., LAHAYE, M., PIGORINI, G.,
GIRAULT, C., MARIN, M. & GUILLON, F. 2009. Changes in texture, cellular structure and cell
wall composition in apple tissue as a result of freezing. Food Research International, 42,
788-797.
CHEN, C.-C., CHANG, C.-M. J. & YANG, P.-W. 2000. Vapor–liquid equilibria of carbon dioxide with
linoleic acid, α-tocopherol and triolein at elevated pressures. Fluid Phase Equilibria, 175,
107-115.
CHIMOWITZ, E. & PENNISI, K. 1986. Process synthesis concepts for supercritical gas extraction in
the crossover region. AIChE Journal, 32, 1665-1676.
CHINACHOTII, P. & STEINBERG, M. 1986. Crystallinity of Sucrose by X‐ray Diffraction as Influenced
by Absorption versus Desorption, Waxy Maize Starch Content, and Water Activity. Journal
of Food Science, 51, 456-459.

References
247
CIFTCI, D., UBEYITOGULLARI, A., HUERTA, R. R., CIFTCI, O. N., FLORES, R. A. & SALDAÑA, M. D. A.
2017. Lupin hull cellulose nanofiber aerogel preparation by supercritical CO2 and freeze
drying. The Journal of Supercritical Fluids, 127, 137-145.
CIURZYŃSKA, A., MARZEC, A., MIESZKOWSKA, A. & LENART, A. 2017. Structure influence on
mechanical and acoustic properties of freeze-dried gels obtained with the use of
hydrocolloids. Journal of Texture Studies, 48, 131-142.
COOK, I. 2009. Why, What and How? Understanding the Freeze Drying Process.
http://www.biopharma.co.uk/wp-‐content/uploads/2010/07/Why_What_How.pdf.
COSTA, P. & LOBO, J. M. S. 2001. Modeling and comparison of dissolution profiles. European Journal
of Pharmaceutical Sciences, 13, 123-133.
COUTINHO, D. F., SANT, S. V., SHIN, H., OLIVEIRA, J. T., GOMES, M. E., NEVES, N. M.,
KHADEMHOSSEINI, A. & REIS, R. L. 2010. Modified Gellan Gum hydrogels with tunable
physical and mechanical properties. Biomaterials, 31, 7494-7502.
CPKELCO 2007. KELCOGEL Gellan Gum Book 5th Edition ed.: www.cpkelco.com.
DARVISHI, H., ASL, A. R., ASGHARI, A., AZADBAKHT, M., NAJAFI, G. & KHODAEI, J. 2014. Study of the
drying kinetics of pepper. Journal of the Saudi Society of Agricultural Sciences, 13, 130-138.
DE BRUIJN, J. & BÓRQUEZ, R. 2014. Quality retention in strawberries dried by emerging dehydration
methods. Food Research International, 63, Part A, 42-48.
DE MARCO, I., MIRANDA, S., RIEMMA, S. & IANNONE, R. 2016. LCA of starch aerogels for biomedical
applications. Chemical Engineering Transactions.
DE MARCO, I. & REVERCHON, E. 2012. Supercritical carbon dioxide+ ethanol mixtures for the
antisolvent micronization of hydrosoluble materials. Chemical Engineering Journal, 187,
401-409.
DE MARCO, I. & REVERCHON, E. 2017a. Starch aerogel loaded with poorly water-soluble vitamins
through supercritical CO2 adsorption. Chemical Engineering Research and Design, 119, 221-
230.
DE MARCO, I. & REVERCHON, E. 2017b. Starch aerogel loaded with poorly water-soluble vitamins
through supercritical CO 2 adsorption. Chemical Engineering Research and Design, 119,
221-230.
DE MARCO, I., RIEMMA, S. & IANNONE, R. 2018. Life cycle assessment of supercritical CO2
extraction of caffeine from coffee beans. The Journal of Supercritical Fluids, 133, 393-400.
DE VRIES, J. 2002. Interaction of carrageenan with other ingredients in dairy dessert gels. Special
publication - Royal Society of Chemistry, 278, 201-210.

References
248
DEL VALLE, J., CUADROS, T. & AGUILERA, J. 1998. Glass transitions and shrinkage during drying and
storage of osmosed apple pieces. Food Research International, 31, 191-204.
DENG, Z.-Y., SHE, J., INAGAKI, Y., YANG, J.-F., OHJI, T. & TANAKA, Y. 2004. Reinforcement by crack-
tip blunting in porous ceramics. Journal of the European Ceramic Society, 24, 2055-2059.
DESHPANDE, R., HUA, D.-W., SMITH, D. M. & BRINKER, C. J. 1992. Pore structure evolution in silica
gel during aging/drying. III. Effects of surface tension. Journal of Non-Crystalline Solids, 144,
32-44.
DESZCZYNSKI, M., KASAPIS, S., MACNAUGHTON, W. & MITCHELL, J. R. 2003. Effect of sugars on the
mechanical and thermal properties of agarose gels. Food Hydrocolloids, 17, 793-799.
DEVI, S. & WILLIAMS, D. 2013. Morphological and Compressional Mechanical Properties of Freeze‐
Dried Mannitol, Sucrose, and Trehalose Cakes. Journal of Pharmaceutical Sciences, 102,
4246-4255.
DICKINSON, E. 1991. Food polymers, gels and colloids, Elsevier.
DOMINGO, C. 2015. Sustainable Processing and Nanomanufacturing. Supercritical Fluid
Nanotechnology. Pan Stanford.
DOWSON, M., GROGAN, M., BIRKS, T., HARRISON, D. & CRAIG, S. 2012. Streamlined life cycle
assessment of transparent silica aerogel made by supercritical drying. Applied Energy, 97,
396-404.
EDWARDS, W. P. 2007. The science of sugar confectionery, Royal Society of Chemistry.
ELTOUM, I., FREDENBURGH, J., MYERS, R. B. & GRIZZLE, W. E. 2001. Introduction to the theory and
practice of fixation of tissues. Journal of Histotechnology, 24, 173-190.
ERBAY, Z. & ICIER, F. 2010. A Review of Thin Layer Drying of Foods: Theory, Modeling, and
Experimental Results. Critical Reviews in Food Science and Nutrition, 50, 441-464.
ESTELLA, J., ECHEVERRÍA, J. C., LAGUNA, M. & GARRIDO, J. J. 2007. Effects of aging and drying
conditions on the structural and textural properties of silica gels. Microporous and
Mesoporous Materials, 102, 274-282.
EVAGELIOU, V. & SALIARI, D. 2017. Limonene encapsulation in freeze dried gellan systems. Food
Chemistry, 223, 72-75.
EVANS, J. A. 2008. Frozen Food Science and Technology Blackwell.
FAIRCLOUGH, J. P. A., YU, H., KELLY, O., RYAN, A. J., SAMMLER, R. L. & RADLER, M. 2012. Interplay
between gelation and phase separation in aqueous solutions of methylcellulose and
hydroxypropylmethylcellulose. Langmuir, 28, 10551-10557.
References
249
FASOLIN, L., PICONE, C., SANTANA, R. & CUNHA, R. 2013. Production of hybrid gels from
polysorbate and gellan gum. Food Research International, 54, 501-507.
FELLOWS, P. J. 2009. Food processing technology: principles and practice, Elsevier.
FLORJANCIC, U., ZUPANCIC, A. & ZUMER, M. 2002. Rheological characterization of aqueous
polysaccharide mixtures undergoing shear. Chemical and Biochemical Engineering
Quarterly, 16, 105-118.
FONSECA, F., PASSOT, S., CUNIN, O. & MARIN, M. 2004. Collapse Temperature of Freeze‐Dried
Lactobacillus bulgaricusSuspensions and Protective Media. Biotechnology Progress, 20,
229-238.
FURLONG, T. W. 2011. A Computational Simulation of Supercritical Carbon Dioxide and Ethanol
Capillary Flow.
GANTAR, A., DA SILVA, L. P., OLIVEIRA, J. M., MARQUES, A. P., CORRELO, V. M., NOVAK, S. & REIS,
R. L. 2014. Nanoparticulate bioactive-glass-reinforced gellan-gum hydrogels for bone-tissue
engineering. Materials Science and Engineering: C, 43, 27-36.
GARCIA-GONZALEZ, L., GEERAERD, A., SPILIMBERGO, S., ELST, K., VAN GINNEKEN, L., DEBEVERE, J.,
VAN IMPE, J. & DEVLIEGHERE, F. 2007. High pressure carbon dioxide inactivation of
microorganisms in foods: the past, the present and the future. International Journal of Food
Microbiology, 117, 1-28.
GEKKO, K. & KASUYA, K. 1985. Effect of pressure on the sol-gel transition of carrageenans.
International Journal of Biological Macromolecules, 7, 299-306.
GHAFAR, A., GURIKOV, P., SUBRAHMANYAM, R., PARIKKA, K., TENKANEN, M., SMIRNOVA, I. &
MIKKONEN, K. S. 2017. Mesoporous guar galactomannan based biocomposite aerogels
through enzymatic crosslinking. Composites Part A: Applied Science and Manufacturing, 94,
93-103.
GIANNOULI, P. & MORRIS, E. 2003. Cryogelation of xanthan. Food Hydrocolloids, 17, 495-501.
GOFF, H. D. & HARTEL, R. W. 2013. Ice cream, Springer Science & Business Media.
GOLUBOVIC, M., VAN HATEREN, S. H., OTTENS, M., WITKAMP, G. J. & VAN DER WIELEN, L. A. M.
2007. A method for lipase co-precipitation in a biodegradable protein matrix. Biotechnology
and Bioengineering, 98, 1209-1218.
GOULA, A. M. & ADAMOPOULOS, K. G. 2009. Modeling the rehydration process of dried tomato.
Drying Technology, 27, 1078-1088.
GULREZ, S. K., PHILLIPS, G. O. & AL-ASSAF, S. 2011. Hydrogels: methods of preparation,
characterisation and applications, INTECH Open Access Publisher.

References
250
GUPTA, R. B. & SHIM, J.-J. 2006. Solubility in supercritical carbon dioxide, CRC press.
HANSEN, C. M. 1967. The three dimensional solubility parameter. Journal of Paint Technology, 39,
104.
HAQUE, M. K. & ROOS, Y. 2004. Water plasticization and crystallization of lactose in spray‐dried
lactose/protein mixtures. Journal of Food Science, 69.
HATAKEYAMA, H. & HATAKEYAMA, T. 1998. Interaction between water and hydrophilic polymers.
Thermochimica Acta, 308, 3-22.
HE, S. & CHEN, X. 2017. Flexible silica aerogel based on methyltrimethoxysilane with improved
mechanical property. Journal of Non-Crystalline Solids, 463, 6-11.
HODGE, R., BASTOW, T., EDWARD, G., SIMON, G. & HILL, A. 1996. Free volume and the mechanism
of plasticization in water-swollen poly (vinyl alcohol). Macromolecules, 29, 8137-8143.
HOFFMAN, A. S. 1987. Applications of thermally reversible polymers and hydrogels in therapeutics
and diagnostics. Journal of Controlled Release, 6, 297-305.
HOFLAND, G. W., DE RIJKE, A., THIERING, R., VAN DER WIELEN, L. A. & WITKAMP, G.-J. 2000.
Isoelectric precipitation of soybean protein using carbon dioxide as a volatile acid. Journal
of Chromatography B: Biomedical Sciences and Applications, 743, 357-368.
HOGEKAMP, S. & SCHUBERT, H. 2003. Rehydration of food powders. Revista de Agaroquimica y
Tecnologia de Alimentos, 9, 223-235.
HUANG, Y., SINGH, P. P., TANG, J. & SWANSON, B. G. 2004. Gelling temperatures of high acyl gellan
as affected by monovalent and divalent cations with dynamic rheological analysis.
Carbohydrate Polymers, 56, 27-33.
HUI, Y. H. 2006. Handbook of food science, technology, and engineering, CRC press.
IMESON, A. 2011. Food stabilisers, thickeners and gelling agents, John Wiley & Sons.
ISLESIAS, H. A. & CHIRIFE, J. 1978. Delayed crystallization of amorphous sucrose in humidified freeze
dried model systems. International Journal of Food Science & Technology, 13, 137-144.
JAIN, D. & PATHARE, P. B. 2004. Selection and evaluation of thin layer drying models for infrared
radiative and convective drying of onion slices. Biosystems Engineering, 89, 289-296.
JAY, J. M., LOESSNER, M. J. & GOLDEN, D. A. 2008. Modern food microbiology, Springer Science &
Business Media.
JIANG, X., ZHU, C. & MA, Y. 2013. Densities and viscosities of erythritol, xylitol, and mannitol in L-
ascorbic acid aqueous solutions at T=(293.15 to 323.15) K. Journal of Chemical &
Engineering Data, 58, 2970-2978.

References
251
JIANG, Y., ZHANG, T., WANG, K. & YANG, J. 2017. Synthesis and characterization of rigid and
thermostable polyimide aerogel crosslinked with tri(3-aminophenyl)phosphine oxide.
Journal of Porous Materials, 1-10.
JOARDDER, M. U., KARIM, A., KUMAR, C. & BROWN, R. J. 2015. Porosity: Establishing the
Relationship Between Drying Parameters and Dried Food Quality, Springer.
JOB, N., THÉRY, A., PIRARD, R., MARIEN, J., KOCON, L., ROUZAUD, J.-N., BÉGUIN, F. & PIRARD, J.-P.
2005. Carbon aerogels, cryogels and xerogels: influence of the drying method on the
textural properties of porous carbon materials. Carbon, 43, 2481-2494.
JOUPPILA, K., KANSIKAS, J. & ROOS, Y. 1997. Glass transition, water plasticization, and lactose
crystallization in skim milk powder. Journal of Dairy Science, 80, 3152-3160.
KARAM, M. C., PETIT, J., ZIMMER, D., BAUDELAIRE DJANTOU, E. & SCHER, J. 2016. Effects of drying
and grinding in production of fruit and vegetable powders: a review. Journal of Food
Engineering, 188, 32-49.
KAREL, M. 1997. The history and future of food engineering. Food Engineering 2000, 3-19.
KASAPIS, S., GIANNOULI, P., HEMBER, M. W., EVAGELIOU, V., POULARD, C., TORT-BOURGEOIS, B. &
SWORN, G. 1999. Structural aspects and phase behaviour in deacylated and high acyl gellan
systems. Carbohydrate Polymers, 38, 145-154.
KATZ, E. & LABUZA, T. 1981. Effect of water activity on the sensory crispness and mechanical
deformation of snack food products. Journal of Food Science, 46, 403-409.
KAUSHIK, V. & ROOS, Y. H. 2007. Limonene encapsulation in freeze-drying of gum Arabic–sucrose–
gelatin systems. LWT-Food Science and Technology, 40, 1381-1391.
KAWAI, S., NITTA, Y. & NISHINARI, K. 2008. Model study for large deformation of physical polymeric
gels. The Journal of Chemical Physics, 128, 134903.
KETT, V., MCMAHON, D. & WARD, K. 2005. Thermoanalytical techniques for the investigation of the
freeze drying process and freeze-dried products. Current Pharmaceutical Biotechnology, 6,
239-250.
KHARE, A. R. & PEPPAS, N. A. 1995. Swelling/deswelling of anionic copolymer gels. Biomaterials, 16,
559-567.
KILIC, A. 2009. Low temperature and high velocity (LTHV) application in drying: Characteristics and
effects on the fish quality. Journal of Food Engineering, 91, 173-182.
KIM, A. I., AKERS, M. J. & NAIL, S. L. 1998. The physical state of mannitol after freeze‐drying: Effects
of mannitol concentration, freezing rate, and a noncrystallizing cosolute. Journal of
Pharmaceutical Sciences, 87, 931-935.

References
252
KIRCHMAJER, D. M., STEINHOFF, B., WARREN, H., CLARK, R. & IN HET PANHUIS, M. 2014. Enhanced
gelation properties of purified gellan gum. Carbohydrate Research, 388, 125-129.
KOPCAK, U. & MOHAMED, R. S. 2005. Caffeine solubility in supercritical carbon dioxide/co-solvent
mixtures. The Journal of Supercritical Fluids, 34, 209-214.
KROKIDA, M., KARATHANOS, V. & MAROULIS, Z. 1998. Effect of freeze-drying conditions on
shrinkage and porosity of dehydrated agricultural products. Journal of Food Engineering,
35, 369-380.
KROKIDA, M. & MARINOS-KOURIS, D. 2003. Rehydration kinetics of dehydrated products. Journal
of Food Engineering, 57, 1-7.
KROKIDA, M. & MAROULIS, Z. 1997. Effect of drying method on shrinkage and porosity. Drying
Technology, 15, 2441-2458.
KUMAR, A., MISHRA, R., REINWALD, Y. & BHAT, S. 2010. Cryogels: Freezing unveiled by thawing.
Materials Today, 13, 42-44.
LABUZA, T. P. 1975. Sorption phenomena in foods: theoretical and practical aspects. Theory,
determination and control of physical properties of food materials. Springer.
LEE, J. H. & KIM, H. J. 2009. Vacuum drying kinetics of Asian white radish (Raphanus sativus L.) slices.
LWT-Food Science and Technology, 42, 180-186.
LEE, J. K., YAO, S. X., LI, G., JUN, M. B. & LEE, P. C. 2017. Measurement Methods for Solubility and
Diffusivity of Gases and Supercritical Fluids in Polymers and Its Applications. Polymer
Reviews, 57, 695-747.
LEGUILLON, D. & PIAT, R. 2008. Fracture of porous materials–Influence of the pore size. Engineering
Fracture Mechanics, 75, 1840-1853.
LEVENSON, D. & HARTEL, R. 2005. Nucleation of amorphous sucrose–corn syrup mixtures. Journal
of Food Engineering, 69, 9-15.
LI, S., VARADARAJAN, G. & HARTLAND, S. 1991. Solubilities of theobromine and caffeine in
supercritical carbon dioxide: correlation with density-based models. Fluid Phase Equilibria,
68, 263-280.
LIN, C. C. & METTERS, A. T. 2006. Hydrogels in controlled release formulations: network design and
mathematical modeling. Advanced Drug Delivery Reviews, 58, 1379-1408.
LINDER, P. W., NASSIMBENI, L. R., POLSON, A. & RODGERS, A. L. 1976. The diffusion coefficient of
sucrose in water. A physical chemistry experiment. Journal of Chemical education, 53, 330.

References
253
LIU, J., HAN, B., WANG, Z., ZHANG, J., LI, G. & YANG, G. 2002. Solubility of Ls-36 and Ls-45 surfactants
in supercritical CO2 and loading water in the CO2/water/surfactant systems. Langmuir, 18,
3086-3089.
LIU, L., LIU, Z.-T., LIU, Z.-W. & XUE, D. 2010. L-Proline catalyzed aldol reactions between acetone
and aldehydes in supercritical fluids: An environmentally friendly reaction procedure.
Science China Chemistry, 53, 1586-1591.
LÓPEZ-DOMÍNGUEZ, P., LÓPEZ-PERIAGO, A. M., FERNÁNDEZ-PORRAS, F. J., FRAILE, J., TOBIAS, G. &
DOMINGO, C. 2017. Supercritical CO2 for the synthesis of nanometric ZIF-8 and loading
with hyperbranched aminopolymers. Applications in CO2 capture. Journal of CO2
Utilization, 18.
LOZINSKY, V. I., GALAEV, I. Y., PLIEVA, F. M., SAVINA, I. N., JUNGVID, H. & MATTIASSON, B. 2003.
Polymeric cryogels as promising materials of biotechnological interest. Trends in
Biotechnology, 21, 445-451.
MACHMUDAH, S., KITADA, K., SASAKI, M., GOTO, M., MUNEMASA, J. & YAMAGATA, M. 2011.
Simultaneous Extraction and Separation Process for Coffee Beans with Supercritical CO2
and Water. Industrial & Engineering Chemistry Research, 50, 2227-2235.
MAHDI, M. H., CONWAY, B. R. & SMITH, A. M. 2015. Development of mucoadhesive sprayable
gellan gum fluid gels. International Journal of Pharmaceutics, 488, 12-19.
MAIWALD, M. & SCHNEIDER, G. M. 1995. Near-infrared spectroscopic investigations on phase
behavior and hydrogen-bonding of ω-heptanolactam in supercritical
chlorotrifluoromethane. The Journal of Supercritical Fluids, 8, 25-29.
MAO, R., TANG, J. & SWANSON, B. G. 2000. Texture properties of high and low acyl mixed gellan
gels. Carbohydrate Polymers, 41, 331-338.
MARABI, A., DILAK, C., SHAH, J. & SAGUY, I. 2004. Kinetics of solids leaching during rehydration of
particulate dry vegetables. Journal of Food Science, 69.
MARABI, A., THIEME, U., JACOBSON, M. & SAGUY, I. 2006. Influence of drying method and
rehydration time on sensory evaluation of rehydrated carrot particulates. Journal of Food
Engineering, 72, 211-217.
MARTIN, L., LIPAROTI, S., DELLA PORTA, G., ADAMI, R., MARQUÉS, J., URIETA, J., MAINAR, A. &
REVERCHON, E. 2013. Rotenone coprecipitation with biodegradable polymers by
supercritical assisted atomization. The Journal of Supercritical Fluids, 81, 48-54.
MASKAN, M. 2000. Microwave/air and microwave finish drying of banana. Journal of Food
Engineering, 44, 71-78.

References
254
MASKAN, M. 2001. Drying, shrinkage and rehydration characteristics of kiwifruits during hot air and
microwave drying. Journal of Food Engineering, 48, 177-182.
MATHLOUTHI, M. 2001. Water content, water activity, water structure and the stability of
foodstuffs. Food Control, 12, 409-417.
MATHLOUTHI, M. & REISER, P. 1995. Sucrose: properties and applications, Springer Science &
Business Media.
MATHPAL, R., JOSHI, B., JOSHI, S. & KANDPAL, N. 2006. Intermolecular forces of sugars in water.
Monatshefte für Chemie/Chemical Monthly, 137, 375-379.
MAYINGER, F. 1988. Two-phase flow phenomena with depressurization—consequences for the
design and layout of safety and pressure relief valves. Chemical Engineering and Processing:
Process Intensification, 23, 1-11.
MAYOR, L. & SERENO, A. 2004. Modelling shrinkage during convective drying of food materials: a
review. Journal of Food Engineering, 61, 373-386.
MCCLEMENTS, D. J. 2015. Food emulsions: principles, practices, and techniques, CRC press.
MEDEIROS, G. R., FERREIRA, S. R. S. & CARCIOFI, B. A. M. 2017. High pressure carbon dioxide for
impregnation of clove essential oil in LLDPE films. Innovative Food Science and Emerging
Technologies, 41, 206-215.
MEHRISHI, J. N. & SEAMAN, G. V. F. 1968. Electrokinetic properties of dispersions of model
compounds of biological interest. Transactions of the Faraday Society, 64, 3152-3157.
MILANI, J. & MALEKI, G. 2012. Hydrocolloids in food industry, INTECH Open Access Publisher.
MILAS, M. & RINAUDO, M. 1996. The gellan sol-gel transition. Carbohydrate Polymers, 30, 177-184.
MILLS, T., KOAY, A. & NORTON, I. T. 2013. Fluid gel lubrication as a function of solvent quality. Food
Hydrocolloids, 32, 172-177.
MITCHELL, H. 2008. Sweeteners and sugar alternatives in food technology, John Wiley & Sons.
MIYOSHI, E. & NISHINARI, K. 1999a. Effects of sugar on the sol-gel transition in gellan gum aqueous
solutions. Physical Chemistry and Industrial Application of Gellan Gum, 83-91.
MIYOSHI, E. & NISHINARI, K. 1999b. Rheological and thermal properties near the sol-gel transition
of gellan gum aqueous solutions. Physical Chemistry and Industrial Application of Gellan
Gum, 68-82.
MIYOSHI, E., TAKAYA, T. & NISHINARI, K. 1998. Effects of glucose, mannose and konjac
glucomannan on the gel–sol transition in gellan gum aqueous solutions by rheology and
DSC. Polymer Gels and Networks, 6, 273-290.

References
255
MORRIS, E. R., NISHINARI, K. & RINAUDO, M. 2012. Gelation of gellan – A review. Food
Hydrocolloids, 28, 373-411.
MORRIS, E. R., REES, D. A. & ROBINSON, G. 1980. Cation-specific aggregation of carrageenan helices:
domain model of polymer gel structure. Journal of Molecular Biology, 138, 349-362.
MOTHIBE, K. J., ZHANG, M., NSOR-ATINDANA, J. & WANG, Y.-C. 2011. Use of ultrasound
pretreatment in drying of fruits: Drying rates, quality attributes, and shelf life extension.
Drying Technology, 29, 1611-1621.
MUJUMDAR, A. S. 2014. Handbook of industrial drying, CRC press.
NALAWADE, S. P., PICCHIONI, F. & JANSSEN, L. 2006. Supercritical carbon dioxide as a green solvent
for processing polymer melts: processing aspects and applications. Progress in Polymer
Science, 31, 19-43.
NAMATSU, H., YAMAZAKI, K. & KURIHARA, K. 1999. Supercritical drying for nanostructure
fabrication without pattern collapse. Microelectronic Engineering, 46, 129-132.
NICKERSON, M., PAULSON, A. & SPEERS, R. 2004. Time–temperature studies of gellan
polysaccharide gelation in the presence of low, intermediate and high levels of co-solutes.
Food Hydrocolloids, 18, 783-794.
NIJHUIS, H., TORRINGA, H., MURESAN, S., YUKSEL, D., LEGUIJT, C. & KLOEK, W. 1998a. Approaches
to improving the quality of dried fruit and vegetables. Trends in Food Science & Technology,
9, 13-20.
NIJHUIS, H. H., TORRINGA, H. M., MURESAN, S., YUKSEL, D., LEGUIJT, C. & KLOEK, W. 1998b.
Approaches to improving the quality of dried fruit and vegetables. Trends in Food Science
& Technology, 9, 13-20.
NIRANJAN, K. 2016. A possible reconceptualization of food engineering discipline. Food and
Bioproducts Processing, 99, 78-89.
NIREESHA, G., DIVYA, L., SOWMYA, C., VENKATESHAN, N., BABU, M. N. & LAVAKUMAR, V. 2013.
Lyophilization/freeze drying—an review. International Journal of Novel Trends in
Pharmaceutical Sciences, 3, 87-98.
NISHINARI, K. & FANG, Y. 2016. Sucrose release from polysaccharide gels. Food & Function, 7, 2130-
2146.
NISHINARI, K. & WATASE, M. 1992. Effects of sugars and polyols on the gel-sol transition of kappa-
carrageenan gels. Thermochimica Acta, 206, 149-162.
NISHINARI, K., ZHANG, H. & IKEDA, S. 2000. Hydrocolloid gels of polysaccharides and proteins.
Current Opinion in Colloid & Interface Science, 5, 195-201.

References
256
NOOR, I., MAJID, S., AROF, A., DJURADO, D., NETO, S. C. & PAWLICKA, A. 2012. Characteristics of
gellan gum–LiCF 3 SO 3 polymer electrolytes. Solid State Ionics, 225, 649-653.
NORTON, A. B., COX, P. W. & SPYROPOULOS, F. 2011. Acid gelation of low acyl gellan gum relevant
to self-structuring in the human stomach. Food Hydrocolloids, 25, 1105-1111.
NORTON, I. & FOSTER, T. 2002. Hydrocolloids in real food systems. Special publication - Royal
Society of Chemistry, 278, 187-200.
NORTON, I. T., FRITH, W. J. & ABLETT, S. 2006. Fluid gels, mixed fluid gels and satiety. Food
Hydrocolloids, 20, 229-239.
NOSE, A. & HOJO, M. 2006. Hydrogen bonding of water–ethanol in alcoholic beverages. Journal of
Bioscience and Bioengineering, 102, 269-280.
NUSSINOVITCH, A., CORRADINI, M. G., NORMAND, M. D. & PELEG, M. 2000. Effect of sucrose on
the mechanical and acoustic properties of freeze-dried agar, k-carrageenan and gellan gels.
Journal of Texture Studies, 31, 205-223.
OAKENFULL, D. & SCOTT, A. 1984. Hydrophobic interaction in the gelation of high methoxyl pectins.
Journal of Food Science, 49, 1093-1098.
OGAWA, T., HASEGAWA, A. & ADACHI, S. 2014. Effects of relaxation of gluten network on
rehydration kinetics of pasta. Bioscience, Biotechnology, and Biochemistry, 78, 1930-1934.
OHTSUKA, A. & WATANABE, T. 1996. The network structure of gellan gum hydrogels based on the
structural parameters by the analysis of the restricted diffusion of water. Carbohydrate
Polymers, 30, 135-140.
PAESCHKE, T. & AIMUTIS, W. 2008. The effect of hydrocolloids on satiety, and weight loss: a review.
Gums and Stabilisers for the Food Industry 14.
PAJONK, G., REPELLIN-LACROIX, M., ABOUARNADASSE, S., CHAOUKI, J. & KLAVANA, D. 1990. From
sol-gel to aerogels and cryogels. Journal of Non-Crystalline Solids, 121, 66-67.
PANTIĆ, M., KOTNIK, P., KNEZ, Ž. & NOVAK, Z. 2016. High pressure impregnation of vitamin D3 into
polysaccharide aerogels using moderate and low temperatures. Journal of Supercritical
Fluids, 118, 171-177.
PAWDE, S. & DESHMUKH, K. 2008. Characterization of polyvinyl alcohol/gelatin blend hydrogel
films for biomedical applications. Journal of Applied Polymer Science, 109, 3431-3437.
PEACH, J. & EASTOE, J. 2014. Supercritical carbon dioxide: a solvent like no other. Beilstein journal
of organic chemistry, 10, 1878-1895.
PEKER, H., SRINIVASAN, M., SMITH, J. & MCCOY, B. J. 1992. Caffeine extraction rates from coffee
beans with supercritical carbon dioxide. AIChE Journal, 38, 761-770.

References
257
PERRUT, M. 2012. Sterilization and virus inactivation by supercritical fluids (a review). The Journal
of Supercritical Fluids, 66, 359-371.
PERRY, R. H. & GREEN, D. W. 1999. Perry's chemical engineers' handbook, McGraw-Hill Professional.
PETRALITO, S., ZANARDI, I., MEMOLI, A., ANNESINI, C., MILLUCCI, V. & TRAVAGLI, V. 2012. Apparent
solubility and dissolution profile at non-sink conditions as quality improvement tools.
Promising Pharmaceuticals. InTech.
PETZOLD, G. & AGUILERA, J. M. 2009. Ice Morphology: Fundamentals and Technological
Applications in Foods. Food Biophysics, 4, 378-396.
PHILLIPS, G. O. & WILLIAMS, P. A. 2000. Handbook of Hydrocolloids, Woodhead Publishing Limited.
PICCONE, P., RASTELLI, S. L. & PITTIA, P. 2011. Aroma release and sensory perception of fruit candies
model systems. Procedia Food Science, 1, 1509-1515.
PICONE, C. S. F. & CUNHA, R. L. 2011. Influence of pH on formation and properties of gellan gels.
Carbohydrate Polymers, 84, 662-668.
PIKAL, M. J. & SHAH, S. 1990. The collapse temperature in freeze drying: Dependence on
measurement methodology and rate of water removal from the glassy phase. International
Journal of Pharmaceutics, 62, 165-186.
PONGSAWATMANIT, R., IKEDA, S. & MIYAWAKI, O. 1999. Effect of sucrose on physical properties
of alginate dispersed aqueous systems. Food Science and Technology Research, 5, 183-187.
PREZOTTI, F. G., CURY, B. S. F. & EVANGELISTA, R. C. 2014. Mucoadhesive beads of gellan
gum/pectin intended to controlled delivery of drugs. Carbohydrate Polymers, 113, 286-295.
PRIETO, C., CALVO, L. & DUARTE, C. M. M. 2017. Continuous supercritical fluid extraction of
emulsions to produce nanocapsules of vitamin E in polycaprolactone. Journal of
Supercritical Fluids, 124, 72-79.
PROSAPIO, V., DE MARCO, I. & REVERCHON, E. 2016a. PVP/corticosteroid microspheres produced
by supercritical antisolvent coprecipitation. Chemical Engineering Journal, 292, 264-275.
PROSAPIO, V. & NORTON, I. 2017a. Influence of osmotic dehydration pre-treatment on oven drying
and freeze drying performance. LWT - Food Science and Technology, 80, 401-408.
PROSAPIO, V. & NORTON, I. 2017b. Influence of osmotic dehydration pre-treatment on oven drying
and freeze drying performance. LWT-Food Science and Technology, 80, 401-408.
PROSAPIO, V., REVERCHON, E. & DE MARCO, I. 2016b. Formation of PVP/nimesulide microspheres
by supercritical antisolvent coprecipitation. The Journal of Supercritical Fluids, 118, 19-26.

References
258
PROSAPIO, V., REVERCHON, E. & DE MARCO, I. 2016c. Polymers' ultrafine particles for drug delivery
systems precipitated by supercritical carbon dioxide + organic solvent mixtures. Powder
Technology, 292, 140-148.
PROSAPIO, V., REVERCHON, E. & DE MARCO, I. 2017. Incorporation of liposoluble vitamins within
PVP microparticles using supercritical antisolvent precipitation. Journal of CO2 Utilization,
19, 230-237.
QUAST, K. 2016. The use of zeta potential to investigate the pKa of saturated fatty acids. Advanced
Powder Technology, 27, 207-214.
RAHMAN, M. S. 2009. Food stability beyond water activity and glass transtion: macro-micro region
concept in the state diagram. International Journal of Food Properties, 12, 726-740.
RAKESH, V. & DATTA, A. K. 2011. Microwave puffing: Determination of optimal conditions using a
coupled multiphase porous media–Large deformation model. Journal of Food Engineering,
107, 152-163.
RAMBHATLA, S., RAMOT, R., BHUGRA, C. & PIKAL, M. J. 2004. Heat and mass transfer scale-up issues
during freeze drying: II. Control and characterization of the degree of supercooling. Aaps
Pharmscitech, 5, 54-62.
RANGARAJAN, B. & LIRA, C. 1991. Production of aerogels. The Journal of Supercritical Fluids, 4, 1-6.
RATTI, C. 2001. Hot air and freeze-drying of high-value foods: a review. Journal of Food Engineering,
49, 311-319.
REGAND, A. & GOFF, H. D. 2003. Structure and ice recrystallization in frozen stabilized ice cream
model systems. Food Hydrocolloids, 17, 95-102.
REID, R. C., PRAUSNITZ, J. M. & POLING, B. E. 1987. The properties of gases and liquids, New York,
McGraw-Hill.
REIGHARD, T. S. & OLESIK, S. V. 1996. Comparison of supercritical fluids and enhanced-fluidity
liquids for the extraction of phenolic pollutants from house dust. Analytical Chemistry, 68,
3612-3621.
RENARD, D., VAN DE VELDE, F. & VISSCHERS, R. W. 2006. The gap between food gel structure,
texture and perception. Food Hydrocolloids, 20, 423-431.
REY, L. & MAY, J. C. 2010. Freeze-drying/lyophilization of pharmaceutical and biological products,
CRC Press.
REYES, A., MAHN, A. & CARES, V. 2015. Analysis of dried onions in a hybrid solar dryer, freeze dryer
and tunnel dryer. Chemical Engineering Transactions.

References
259
RICHARD, B., LE PAGE, J.-F., SCHUCK, P., ANDRÉ, C., JEANTET, R. & DELAPLACE, G. 2013. Towards a
better control of dairy powder rehydration processes. International Dairy Journal, 31, 18-
28.
RICHARDSON, P. & NORTON, I. 1998. Gelation behavior of concentrated locust bean gum solutions.
Macromolecules, 31, 1575-1583.
RIZWAN, M., YAHYA, R., HASSAN, A., YAR, M., AZZAHARI, A. D., SELVANATHAN, V., SONSUDIN, F. &
ABOULOULA, C. N. 2017. pH Sensitive hydrogels in drug delivery: Brief history, properties,
swelling, and release mechanism, material selection and applications. Polymers, 9, 137.
ROBERTS, J. D. & CASERIO, M. C. 1977. Basic principles of organic chemistry, WA Benjamin, Inc.
ROBINSON, G. & MANNING, C. E. 1991. Conformation and Physical Properties of the Bacterial
Polysaccharides Gellan, Welan, and. Food polymers, Gels and Colloids, 22.
ROLIN, C. 1993. Pectin. Industrial Gums-Polysaccharides and their derivatives. RL Whistler and JN
BeMiller. London, Academic Press, Inc.
ROLISON, D. R. & DUNN, B. 2001. Electrically conductive oxide aerogels: new materials in
electrochemistry. Journal of Materials Chemistry, 11, 963-980.
ROOS, Y. 2010. Crystallization, Collapse, and Glass Transition in Low-Water Food Systems. Water
Properties in Food, Health, Pharmaceutical and Biological Systems: ISOPOW 10, 335.
ROOS, Y. H. 2012. Materials science of freezing and frozen foods. Food Materials Science and
Engineering, 373-386.
ROSA, A., MAXIA, A., PUTZU, D., ATZERI, A., ERA, B., FAIS, A., SANNA, C. & PIRAS, A. 2017. Chemical
composition of Lycium europaeum fruit oil obtained by supercritical CO2 extraction and
evaluation of its antioxidant activity, cytotoxicity and cell absorption. Food Chemistry, 230,
82-90.
SABIRZYANOV, A., IL'IN, A., AKHUNOV, A. & GUMEROV, F. 2002. Solubility of Water in Supercritical
Carbon Dioxide. High Temperature, 40, 203-206.
SACHLOS, E. & CZERNUSZKA, J. 2003. Making tissue engineering scaffolds work. Review: the
application of solid freeform fabrication technology to the production of tissue engineering
scaffolds. Eur Cell Mater, 5, 39-40.
SAGUY, I. S., MARABI, A. & WALLACH, R. 2005. Liquid imbibition during rehydration of dry porous
foods. Innovative Food Science & Emerging Technologies, 6, 37-43.
SAGUY, I. S., SINGH, R. P., JOHNSON, T., FRYER, P. J. & SASTRY, S. K. 2013. Challenges facing food
engineering. Journal of Food Engineering, 119, 332-342.

References
260
SAHA, D. & BHATTACHARYA, S. 2010. Hydrocolloids as thickening and gelling agents in food: a
critical review. Journal of Food Science and Technology, 47, 587-597.
SAWADA, K., TERADA, D., YAMAOKA, T., KITAMURA, S. & FUJISATO, T. 2008. Cell removal with
supercritical carbon dioxide for acellular artificial tissue. Journal of Chemical Technology
and Biotechnology, 83, 943-949.
SCHERER, G. W. 1990. Theory of Drying. Journal of the American Ceramic Society, 73, 3-14.
SEVILLA, G. A. T. & HUSSAIN, M. M. 2017. Printed Organic and Inorganic Electronics: Devices To
Systems. IEEE Journal on Emerging and Selected Topics in Circuits and Systems, 7, 147-160.
SIEPMANN, J. & PEPPAS, N. A. 2011. Higuchi equation: derivation, applications, use and misuse.
International Journal of Pharmaceutics, 418, 6-12.
SIEVERS, U. & EGGERS, R. 1996. Heat recovery in supercritical fluid extraction process with
separation at subcritical pressure. Chemical Engineering and Processing: Process
Intensification, 35, 239-246.
SILVA‐CORREIA, J., OLIVEIRA, J. M., CARIDADE, S., OLIVEIRA, J. T., SOUSA, R., MANO, J. & REIS, R.
2011. Gellan gum‐based hydrogels for intervertebral disc tissue‐engineering applications.
Journal of Tissue Engineering and Regenerative Medicine, 5, 97-107.
SINGH, R., SINGH, M. K., BHARTIYA, S., SINGH, A., KOHLI, D. K., GHOSH, P. C., MEENAKSHI, S. &
GUPTA, P. K. Facile synthesis of highly conducting and mesoporous carbon aerogel as
platinum support for PEM fuel cells. International Journal of Hydrogen Energy.
SINHA, N. 2007. Handbook of food products manufacturing, 2 volume set, John Wiley & Sons.
SNOECK, D., VELASCO, L. F., MIGNON, A., VAN VLIERBERGHE, S., DUBRUEL, P., LODEWYCKX, P. & DE
BELIE, N. 2014. The influence of different drying techniques on the water sorption
properties of cement-based materials. Cement and Concrete Research, 64, 54-62.
SPIRO, M., KANDIAH, M. & PRICE, W. 1990. Extraction of ginger rhizome: kinetic studies with
dichloromethane, ethanol, 2‐propanol and an acetone—water mixture. International
Journal of Food Science & Technology, 25, 157-167.
STAHL, E., QUIRIN, K.-W. & GERARD, D. 2012. Dense gases for extraction and refining, Springer
Science & Business Media.
STEPHENSON, G. A., GROLEAU, E. G., KLEEMANN, R. L., XU, W. & RIGSBEE, D. R. 1998. Formation of
isomorphic desolvates: creating a molecular vacuum. Journal of Pharmaceutical Sciences,
87, 536-542.
SUDHAMANI, S. R., PRASAD, M. S. & UDAYA SANKAR, K. 2003. DSC and FTIR studies on Gellan and
Polyvinyl alcohol (PVA) blend films. Food Hydrocolloids, 17, 245-250.

References
261
SUN, Y.-P. 2002. Supercritical Fluid Technology in Materials Science and Engineering: Syntheses:
Properties, and Applications, CRC Press.
SUNDAR RAJ, A., RUBILA, S., JAYABALAN, R. & RANGANATHAN, T. 2012. A review on pectin:
Chemistry due to general properties of pectin and its pharmaceutical uses. Scientific
Reports, 1, 550-1.
SUNDARAM, J. & DURANCE, T. D. 2008. Water sorption and physical properties of locust bean gum–
pectin–starch composite gel dried using different drying methods. Food Hydrocolloids, 22,
1352-1361.
SWORN, G. 2009. Gellan gum. In: G. O. Phillips, P. A. Williams (Eds.), Handbook of Hydrocolloids.
Woodhead Publishing Limited: Cambridge, pp. 204 – 227.
SWORN, G. & KASAPIS, S. 1998. Effect of conformation and molecular weight of co-solute on the
mechanical properties of gellan gum gels. Food Hydrocolloids, 12, 283-290.
TABERNERO, A., DEL VALLE, E. M. M. & GALÁN, M. A. 2012a. Supercritical fluids for pharmaceutical
particle engineering: methods, basic fundamentals and modelling. Chemical Engineering
and Processing: Process Intensification, 60, 9-25.
TABERNERO, A., MARTÍN DEL VALLE, E. M. & GALÁN, M. A. 2012b. Supercritical fluids for
pharmaceutical particle engineering: Methods, basic fundamentals and modelling.
Chemical Engineering and Processing: Process Intensification, 60, 9-25.
TAKENOUCHI, S. & KENNEDY, G. C. 1964. The binary system H 2 O-CO 2 at high temperatures and
pressures. American Journal of Science, 262, 1055-1074.
TAMON, H., ISHIZAKA, H., MIKAMI, M. & OKAZAKI, M. 1997. Porous structure of organic and carbon
aerogels synthesized by sol-gel polycondensation of resorcinol with formaldehyde. Carbon,
35, 791-796.
TAMON, H., ISHIZAKA, H., YAMAMOTO, T. & SUZUKI, T. 2000. Influence of freeze-drying conditions
on the mesoporosity of organic gels as carbon precursors. Carbon, 38, 1099-1105.
TANAKA, T. & FILLMORE, D. J. 1979. Kinetics of swelling of gels. The Journal of Chemical Physics, 70,
1214-1218.
TANG, J., TUNG, M. A. & ZENG, Y. 1996. Compression strength and deformation of gellan gels
formed with mono-and divalent cations. Carbohydrate Polymers, 29, 11-16.
TANG, X. C. & PIKAL, M. J. 2004. Design of freeze-drying processes for pharmaceuticals: practical
advice. Pharmaceutical Research, 21, 191-200.

References
262
TITFORD, M. E. & HORENSTEIN, M. G. 2005. Histomorphologic assessment of formalin substitute
fixatives for diagnostic surgical pathology. Archives of Pathology & Laboratory Medicine,
129, 502-506.
TIWARI, S., CHAKKARAVARTHI, A. & BHATTACHARYA, S. 2015. Imaging and image analysis of freeze-
dried cellular solids of gellan and agar gels. Journal of Food Engineering, 165, 60-65.
TKALEC, G., KNEZ, Ž. & NOVAK, Z. 2015. Formation of polysaccharide aerogels in ethanol. RSC
Advances, 5, 77362-77371.
TO, E. C. & FLINK, J. M. 1978. ‘Collapse’, a structural transition in freeze dried carbohydrates.
International Journal of Food Science & Technology, 13, 567-581.
TONGWEN, X. & BINGLIN, H. 1998. Mechanism of sustained drug release in diffusion-controlled
polymer matrix-application of percolation theory. International Journal of Pharmaceutics,
170, 139-149.
TØNNESEN, H. H. & KARLSEN, J. 2002. Alginate in drug delivery systems. Drug Development and
Industrial Pharmacy, 28, 621-630.
UBEYITOGULLARI, A. & CIFTCI, O. N. 2016. Formation of nanoporous aerogels from wheat starch.
Carbohydrate Polymers, 147, 125-132.
ULKER, Z. & ERKEY, C. 2017. An advantageous technique to load drugs into aerogels: Gas antisolvent
crystallization inside the pores. The Journal of Supercritical Fluids, 120, Part 2, 310-319.
UPSTILL, C., ATKINS, E. & ATTWOOL, P. 1986. Helical conformations of gellan gum. International
Journal of Biological Macromolecules, 8, 275-288.
VAN DER SMAN, R. 2017. Predicting the solubility of mixtures of sugars and their replacers using
the Flory–Huggins theory. Food & Function, 8, 360-371.
VEGA-GÁLVEZ, A., ZURA-BRAVO, L., LEMUS-MONDACA, R., MARTINEZ-MONZÓ, J., QUISPE-
FUENTES, I., PUENTE, L. & DI SCALA, K. 2015. Influence of drying temperature on dietary
fibre, rehydration properties, texture and microstructure of cape gooseberry (physalis
peruviana l.). Journal of Food Science and Technology, 52, 2304-2311.
VERGELDT, F., VAN DALEN, G., DUIJSTER, A., VODA, A., KHALLOUFI, S., VAN VLIET, L., VAN AS, H.,
VAN DUYNHOVEN, J. & VAN DER SMAN, R. 2014. Rehydration kinetics of freeze-dried
carrots. Innovative Food Science & Emerging Technologies, 24, 40-47.
VIEIRA, M. G. A., DA SILVA, M. A., DOS SANTOS, L. O. & BEPPU, M. M. 2011. Natural-based
plasticizers and biopolymer films: A review. European Polymer Journal, 47, 254-263.

References
263
VILLANUEVA-BERMEJO, D., REGLERO, G. & FORNARI, T. 2017. Recent advances in the processing of
green tea biomolecules using ethyl lactate. A review. Trends in Food Science and
Technology, 62, 1-12.
VOITKOVSKII, K. 1962. The mechanical properties of ice. DTIC Document.
WALTERS, R. H., BHATNAGAR, B., TCHESSALOV, S., IZUTSU, K.-I., TSUMOTO, K. & OHTAKE, S. 2014.
Next Generation Drying Technologies for Pharmaceutical Applications. Journal of
Pharmaceutical Sciences, 103, 2673-2695.
WANG, D., HEY, J. & NAIL, S. 2004. Effect of collapse on the stability of freeze‐dried recombinant
factor VIII and α‐amylase. Journal of Pharmaceutical Sciences, 93, 1253-1263.
WANG, J. & XI, Y. 2005. Drying characteristics and drying quality of carrot using a two-stage
microwave process. Journal of Food Engineering, 68, 505-511.
WANG, L. 2008. Energy efficiency and management in food processing facilities, CRC press.
WANG, N. & BRENNAN, J. 1995. Changes in structure, density and porosity of potato during
dehydration. Journal of Food Engineering, 24, 61-76.
WAREING, M. 1997. Exudate gums. Thickening and gelling agents for food. Springer.
WILLIAMS, P. A. & PHILLIPS, G. O. 2002. Gums and stabilisers for the food industry 11, Royal Society
of Chemistry.
WISSELINK, H., WEUSTHUIS, R., EGGINK, G., HUGENHOLTZ, J. & GROBBEN, G. 2002. Mannitol
production by lactic acid bacteria: a review. International Dairy Journal, 12, 151-161.
YAMANAKA, S., YUGUCHI, Y., URAKAWA, H., KAJIWARA, K., SHIRAKAWA, M. & YAMATOYA, K. 2000.
Gelation of tamarind seed polysaccharide xyloglucan in the presence of ethanol. Food
Hydrocolloids, 14, 125-128.
YAN, Z., SOUSA-GALLAGHER, M. J. & OLIVEIRA, F. A. 2008a. Shrinkage and porosity of banana,
pineapple and mango slices during air-drying. Journal of Food Engineering, 84, 430-440.
YAN, Z., SOUSA-GALLAGHER, M. J. & OLIVEIRA, F. A. R. 2008b. Shrinkage and porosity of banana,
pineapple and mango slices during air-drying. Journal of Food Engineering, 84, 430-440.
YEO, S.-D., PARK, S.-J., KIM, J.-W. & KIM, J.-C. 2000. Critical properties of carbon dioxide+
methanol,+ ethanol,+ 1-propanol, and+ 1-butanol. Journal of Chemical & Engineering Data,
45, 932-935.
YOKOZAKI, Y., SAKABE, J., NG, B. & SHIMOYAMA, Y. 2015. Effect of temperature, pressure and
depressurization rate on release profile of salicylic acid from contact lenses prepared by
supercritical carbon dioxide impregnation. Chemical Engineering Research and Design, 100,
89-94.

References
264
YOSHINARI, T., FORBES, R. T., YORK, P. & KAWASHIMA, Y. 2002. Moisture induced polymorphic
transition of mannitol and its morphological transformation. International Journal of
Pharmaceutics, 247, 69-77.
YU, L., MILTON, N., GROLEAU, E. G., MISHRA, D. S. & VANSICKLE, R. E. 1999. Existence of a mannitol
hydrate during freeze‐drying and practical implications. Journal of Pharmaceutical Sciences,
88, 196-198.
ZERA, E. 2016. Ceramic aerogels of the Si-CNO system from pre-ceramic polymer. University of
Trento.
ZERA, E., CAMPOSTRINI, R., ARAVIND, P. R., BLUM, Y. & SORARÙ, G. D. 2014. Novel SiC/C Aerogels
Through Pyrolysis of Polycarbosilane Precursors. Advanced Engineering Materials, 16, 814-
819.
ZHANG, H., ZHANG, F. & WU, J. 2013. Physically crosslinked hydrogels from polysaccharides
prepared by freeze–thaw technique. Reactive and Functional Polymers, 73, 923-928.
Copyright © 2022 FDOKUMEN