GUM ARABIC AND CONSTITUENT SUGARS STUDIED BY ...
232
GUM ARABIC AND CONSTITUENT SUGARSSTUDIED BY ELECTRON SPIN RESONANCE By AHMAD BENAHMAD SALEM MASMAS B. Sc. King Saud University, 1975 This thesis Is submitted to the Department of Physics, Brunei University, Uxbridge, Middlesex, U. K., In partial fulfilment of the requirements for the degree of Doctor of Philosophy. 1991
-
Upload
khangminh22 -
Category
Documents
-
view
1 -
download
0
Transcript of GUM ARABIC AND CONSTITUENT SUGARS STUDIED BY ...

GUM ARABIC AND CONSTITUENT SUGARS STUDIED BY ELECTRON SPIN RESONANCE
By
AHMAD BEN AHMAD SALEM MASMAS B. Sc. King Saud University, 1975
This thesis Is submitted to the Department
of Physics, Brunei University, Uxbridge, Middlesex, U. K., In partial fulfilment of the requirements for the degree of Doctor of
Philosophy.
1991

This thesis is dedicated with my deepest thanks to my father, mother, Wife, and children for their patience, encouragment and understanding during the course of this work.

i
ACKNOWLEDGMENTS
I would like to express my deep appreciation and gratitude to my supervisors Professor C. A. Hogarth and Dr. Adil M. Hassib for their constant encouragement and guidance throughout the course of this work.
I would like to thank Dr. M. A. A. Issa of the Physics Department, King Saud university for his help in using the facilities in the ESR and x-ray laboratories and useful discussions.
We would like to express our thanks to Saudan gum arabic company (Ltd. ) for generously supplying all the gum that has been used in this study.
I would like to thank Professor Abdulah Hijazi of the Chemistry Department, King Saud university, for his help and discussions in the field of chemistry.
I would like to thank Dr. D. N. Waters of the chemistry Department, Brunel university for his help in the measurements of optical absorption.
I would like to thank very much Mr. Lutfur Rahman for his help in x-irradiation of the samples. I would also like to thank Dr. Maraji of the Physics Department in Brunel university for his help in gamma-irradiation of the samples.
I would like to thank Mr. Hassan al Ammari and Dr. Ahmad F. Mera for them help in computer area..

ii
CONTENTS: RIM
Acknowledgments ............................. Summary .....................................
CHAPTER ONE: General Introduction to the gums and gum arabic ...........................
I 1.1 Gums ....................... 1 1.2 Gum Arabic ............... 2 1.2.1 Countries of production of
gum arabic. 2 1.3 Physical properties ........
3 1.4 Chemical properties ........ 6 1.5 Enzymes .................... 7 1.6 Industrial uses ............ 7 1.7 Composition and structure.
of gum arabic .............. 12
1.7.1 Introduction. 12 1.7.2 Compos tion and Structure.. 12 1.8 The present investigation.. 14
HAI? TER TWO: Irradiation studies on carbohydrates ........
16 2.1 Introduction ...............
16 2.2 Irradiation of monosaochadeds 17 2.3 Irradiated Carbohydrates
containing glycosidic, bonds ... 23
2.4 Irradiated polysacchaddes .... 24

iii
CHAPTER THREE: Generation of free radicals by Irradiation and Electron spin resonance (ESR) ............
28 3.1 The nature of ionizing radiation .... 28 3.1.1 Interaction of ionization radiation
with matter ........................ 28
3.1.2 Radical formation .................. 30 3.2 Electron Spin Resonance Theory ......
31 3.2.1 Introduction .......................
31 3.2.2 Quantization of angular momen- 33
tum.... 3.2.3 Relations between magnetic mo-
ments 34 and angular momentum ...............
3.2.4 Nuclear hyperfine interaction ...... 36 3.2.5 Line width and the broadening .......
38
CHA? j-E-R FOUR: Experimental Techniques and Method. 42 4.1.0 Experimental techniques ............
42 4.1.1 The ESR spectrometer ..............
42 4.1.2 The microwave source ..............
42 4.1.3 The cavity system .................
43 4.1.4 Magnetic field .....................
44 4.1.5 Modulation and phase sensitive
detection .......................... 44
4.1.6 Temperature variation setup ........ 44
4.1.7 Radiation source ................... 45
4.2.0 The experimental method ............ 46

iv
4.2.1.0 Materials .......................... 46 4.2.1.1 The origin of the samples .......... 46 4.2.2 Preparation of the samples for
the irradiation and ESR measurements ...................... 46
4.2.3 The ESR measurement ............... 47 4.2.4 The variation of the irradiation
time .............................. 47 4.2.5 Time dependent decay ............... 47 4.2.6 Microwave power variation ......... 48 4.2.7 Temperature variation .............. 48 4.2.8 The effect of light on irradiated
gum arabic ........................ 48
CHAPTER FIVE Formation and Decay of the Radicals In
49 Gum Arabic ............................... 5.1 The effect of microwave power
variation on the general form of the ESR spectrum of gum arabic .................... 49
5.2 The variation of the microwave power intensity at room temperature ..................
50 5.2.1 Results and discussion .......... 50 5.2.2 The effect of the microwave
intensity variation on the line width of the ESR spectra of gum arabic .............. 51

V
5.2.3 The effect of the microwave power variation on the line shape of the ESR spectrum of gum arabic ........ 51
5.3 The variation of the microwave power intensity at liquid nitrogen temperature .......................
51 5.4.0 Radical formation on gum arabic ... 52 5.4.1 Possible events on irradiation
time variation ................. 52
5.4.2 Variation of irradiation time ... 56
5.4.3 Introduction ..................... 56
5.4.4 Result and discussion ............. 58
5.4.5 The effect of irradiation time on the line-width of spectral group (1) and (2) ......................
58 5.4.6 The effect of irradiation time on
the g-value of spectral group (1) and (2) ....................
59 5.4.7 The effect of the variation of
irradiation time on the line shape of the ESR spectra of gum arabic.. 59
5.5.0 Decay of the ESR spectra of gum arabic at room temperature .......
59 5.5.1 The decay of the radicals ........
59 5.5.2 Results and discussion ..........
61 5.5.3 The effect of the decay time on
the line shape ................. 62
5.5.4 The effect of the decay of the radicals on the line-width of the two spectral group in gum arabic ESR spectra ..............
65

VI
5.5.5 The effect of the decay of the radicals on the g-výlue of the two spectral group in gum arabic ESR spectra ..................... 65
5.6.0 The decay of the radicals formed on gum arabic with variation of temperature ..................... 65
5.6.1 Introduction ................... 65 5.6.2 Results and discussion ........ 66 5.6.3 The effect of the decay of the
radicals with the elevation of temperature, on the line-width of the spectral group (1) and (2). 67
5.6.4 The effect of the decay of the radicals with the elevation of temperature on the g-value of the spectral group (1) and(2).... 67
5.7 The effect of mercury light on x-irradiated gum arabic ESR spectra ......................... 68
5.8.0 Generation of free radicals in gum arabiC by mercury lamp and ultraviolet source ..............
70 5.8.1 Results and discussion ........... 70 5.9.0 Generation of free radicals in
gum arabic by heat treatment ..... 72
5.9.1 Introduction ..................... 72
5.9.2 Pýeparation of the samples and ESR measurements .................. 73
5.9.3 Results and discussion ........... 73 5.10.1 Optical absorption of gum arabic.. 75 5.10.2 Introduction ...................... 75

vii
5.10.3 Methods ........................... 76 5.10.3.1 Preparation and irradiation of gum
arabic films ..................... 76 5.10.3.2 Ultraviolet absorption
measurements ...................... 77
5.10.4 Results and discussion ............ 77
CHAPTER M& Irradiation of the components of gum arabic. 79 6.1.1 Results and discussion ............ 79 6.1.2 D-galactose .......................
79 6.1.3 D-glucuronic acid ................. 80 6.1.4 L-arabinose .......................
80 6.1.5 L-rhamnose ........................ 80 6.2 Simulation of the ESR spectrum
of gum arabic by mixing the constituent sugars ................
81 6.2.1 Construction of the synthetic
gum arabic and ESH measure- 81 ments....
6.2.2 Results and discussion ............. 82
!; HAPTER. $EVEN: General Discussion ..........................
84 7.1 Interpretation of the ESR spectra
of x-irradiated gum arabic ....... 84
7.2 Irradiation of gum arabic with ultraviolet and mercury light.... 91
7.3 The effect of heat on natural gum as studied by ESR .................
93

viii
7.4 The variation of the line-width of the signals with the variation of irradiation time, decay time, exposure to heat and ultraviolet radiation .........................
94 7.5 Saturation due to microwave power
variation of the gum arabic ESR spectra ........................... 100
7.6 Optical absorption of gum arabic.. 101
CHAPTER EIG-HT- Summary and Conclusions ..................... 102
References .................................. 108

i, x
SUMMARY
In the present work free radicals were generated in gum arabic and its
constituents D-galactose, L-arabinose, L-rhamnose and D-glucuronic acid
using x-irradiation, UV irradiation, and heat treatment. Electron Spin Reso-
nance (ESR) techniques were used, mainly, to detect and study the behavior
of the generated free radicals. The study of the effects of irradiation time
(dose), the decay of the ESR spectra and the effect of the microwave power
helped to distinguish two spectral groups. These were labled spectral group
(1) and spectral groups (2).
The ESR spectra of x-irradiated gum arabic have been measured under
various microwave power at room temperature and at liquid nitrogen
temperatures. Spectral group (1) showed ESR saturation at around 37.5 mW
and the ESR of spectral group (2) showed a saturation at 16.2 mW.
The growth of the free radicals in gum arabic has been studied for various
x-ray irradiation doses. Spectral group (1) showed a saturation after 90
minutes and spectral group (2) show a saturation after 120 minutes
The decay of the ESR spectra at room temperature of x-irradiated gum arabic
shows distinctive behaviour of the two spectral groups (1) and (2). Relative
spin density of spectral group (1) and spectral group (2) as a function of
decay time showed exponential decay with three different zones of decay for
each one.
The decay of the ESR spectra by the elevation of temperature of x-irradiated
gum arabic has also been studied. Spectral group (1) showed rapid decay

x
between 317 to 327 K. This has been interpreted as due to the transition of
gum arabic from high to low viscosity. The ESR spectra of irradiated gum
arabic disappeared beyond 373 K.
ESR spectra of x-irradiated gum arabic which has also been exposed to
mercury light has shown growth of spectral group (1) without affecting
spectral group (2). When natural gum arabic was exposed to UV, the ESR
spectra showed a singlet signal with a line-width of 13.3 gauss and g-value of 2.0046.
Free radicals in gum arabic could also be generated by heat treatment under
vacuum. The ESR spectra showed a singlet signal with a line-width which
varied between 8 and 5 gauss depending on the temperature and the time of heating. The g-value of this singlet is 2.0032.
Constituent sugars of gum arabic were x-irradiated individually and the ESR
spectra were measured and analyzed. These were used to simulate the ESR
spectra of natural gum. Proportional components of gum arabic has been
irradiated and added gradually to each other. The spectral groups (1) and (2)
were found to exist in the synthetic gum.
Analysis shows that the spectral group (1) consists of a singlet signal. This
singlet is of the form C-0-0. and it may have been created by the reaction of
the C. radical and 0, Spectral group (2) consists of a singlet signal plus a doublet signal. The singlet signal is due to a radical of the form C-O., where
the doublet signal is of the form (C. ).
Line-widths of the spectral group (1) and (2) have been studied as a function
of irradiation time, decay time, temperature, and UV exposure time. The

xi
results has been interpreted by the application of the spin-spin theory and
motional narrowing. Also the variation of the line-width of the singlet signal
generated by heat has been discussed using the motional narrowing theory.
Uftraviolet absorption spectra have been measured for gum arabic before and
after gamma irradiation. The results show an absorption peak at 276 nm before and after irradiation. The intensity of this peak increased after irradiation. The absorption at this position is known to be due to the carbonyl
group or acetal group.
The results of this work may be related to studies on food irradiation and
could help to asses effects of radiations and thermal treatment on gum arabic
used in food manufacture and drugs.

1
CHAPTER ONE
GENERAL INTRODUCTION TO THE GUMS AND GUM ARABIC
1.1 GUMS
Gums in the natural form are often polysaccharides or modified polysaccharides
with high molecular weights. Usually gums have colloidal properties and may
produce gels when dissolved in suitable solvents. Commonly, the term gum was
applied to the polysaccharide exudates from various plants, which produce
viscous mixtures when dissolved in cold or hot water.
Three-quarters of the weight of the dry plants consists of polysaccharldes, but
the difficulties in separating the polysaccharides from the plant tissues causes us
to look for plants which are rich in polysaccharidesv). Exudate gums, seaweed
gums, seed gums, starch, and cellulose derivatives are all good sources of
polysaccharides. Exudate gums are exuded from most plants, but generally only
in a small amounts, but there are special trees which we choose to produce
commercial gums. Gums flow from incisions in the plant as a vermiform or tear
shape to form thickened layers.
Starches and cellulose are available polysaccharides and are excellent materials
to produce gum; starches and cellulose can be modified to gum by chemical
transformation processes. Natural polysaccharides are found in linear and
branch forms and some of them include carboxyl groups. Some polysaccharides
contain strong acid groups while others contain basic groups0).

2
1.2 GUM ARABIC
Gum arabic is an exudate natural gum. It is an important commercial polysaccha-
ride which was used at least 4000 years ago. The term gum was applied because the material has gummy characteristics, and the name "gum arabic" because the origin of export was an Arab area, and the Arabs in early history
were the important traders and vendors of this material. The name Turkey gum
was also used for this material during the Turkish Empire. More than 80 names have been used for the material, depending on the local area where it was
collected and on its colour and gradem.
Gum arabic is usually produced from trees which belong to the genus acacia,
subfamily mimosoidea and family leguminosea. There are more than 500 species belonging to this family, distributed over the tropical and subtropical areas of Africa, India, Australia, Central America, and South West North America.
Some authors mentioned that gum is only exuded when the tree is in an
unhealthy condition and will never be produced if the tree is in a healthy
condition. The gum may be obtained by making an incision in the bark of such
trees, or it may exude naturally. Formation of the gum by unhealthy trees is a
pathological condition resulting from a bacterial or fungal infection of the injured
treesM.
1.2.1 COUNTRIES -QF
PRODUCTION OF GUM ARABIC
The republic of Sudan is one of the most important countries producing gum.
Senegal, Mauritania, France Sudan, Nigeria, Tanzania, Morocco, Ethiopia, and Somalia also produce significant quantities of gum. It is also produced in South
Africa, India and Australiam.

3
Most of the gum produced in the Sudan comes from acacia Senegal which growth to about 15-20 ft. tall and has a life of about 25-30 years. It grows in poor,
sandy, reddish soil. It is found particularly in the district of Kordofan. The best
quality of gum comes from acacia Senegal and is known as Hashab in the Sudan
and also known as Kordofan gurnao.
90% of the gum produced in the Sudan is from these kinds of trees and about 10% of the gum comes from the Seyal variety of acacia which is known in the Sudan western part of the country and in the Nile region. The gum from Seyal
trees is exuded naturally without tappingm.
During the rainy season, no gum is formed by the trees. So, the gum is collected during the dry season between October and May or June. A suitable age for
trees which can be tapped is 6-7 years. Attempts to extract gum from trees
younger than this causes death of the trees. After a few weeks, the gum form in
the cuts which is depending on the weather conditions is collected every 10 days
during the seasono).
West Afdca is the second most important area producing gum arabic. The gum
produced in that area is acacia senegal which is known as gum senegal. In
comparison of the Senegal gum produced in French West Africa with that from
Sudan, the Senegal gum is more yellow or reddish. is not as clean as Sudan
gum and it is more bdftle.
1.3 PHYSICAL PROPERTIES
Gum arabic is an amber, amorphous, highly viscous material when it is in fresh
form and it is solid after contact with the atmosphere, it is light in colour with
shades of yellow, red or brown, depending on the sort of acacia trees, the
4
countries of origin and the condition of storage. It is nontoxic, odourless, tasteless, soluble in water giving a homogeneous colloidal and colourless
systemV).
Molecular weight: The molecular weight of gum arabic differs from sample to
sample but also depends upon the method of estimation. Anderson and co
workers(m reported the average molecular weight to lie between 260,000 and 1,160,000.
Melting point., The melting point, measured by TAFT and MALMO), lies between
190-20C.
Solubility: Gum arabic is completely soluble in cold or in hot water and in some
oils, but it is insoluble in most of the well known organic solvents. TAFT and MALMO) studied the solubility of gum arabic in organic solvents. The solubility of the gum was tested in aliphatic and aromatic alcohols, ketones, ethers, esters, halogen derivatives, glycols, pyridine, hydrocarbons, and liquid ammonia. It is
only dissolved in ethylene glycols and glycerol with low-viscosity. Some slight solubility was observed with acetate esters and acetate alcohol mixtures and was
also soluble in aqueous ethanol containing 60% of alcohol
Freezing point., TAFT and MALM(4) found that the freezing point of a gum arabic
solution decreases as the concentration of gum arabic increases, as shown in
figure(I. 1).
Viscosity., It is important to give some details about the viscosity of a material
not only because it gives information about the utilization of the material but also
5
it gives an idea about the molecular structure of the substance used. For this
case the viscosity of gum arabic is studied carefully by varying different factors
such as concentration, temperature, electrolytes, pH, solvents other than water, the time of measuring the viscosity, mechanical treatment, and the effects of
ultrasonic vibrations and ultraviolet irradiation on viscosity. TAFT and MALM(4)
studied the effect of concentration on the viscosity and density at 30o C
(pH=7.14) the results are shown in figure (1.2).
TAFT and MALM(4) also studied the effect of temperature on gum arabic viscosity
and found an inverse proportionality between the viscosity and the temperature
(as the temperature increased, the viscosity of the gum decreased) a result
which was confirmed by OSBORNE and LEE(6). GABELm, MOORJANI and NARWANIm show that the viscosity of gum arabic can be increased by heating of
the dry material. The results of MOORJANI and NARWANI are shown in figure
(1.3). CLARRK and MANNO studied the effect of electrolytes on the viscosity and found that all electrolytes lowered the viscosity of gum arabic. TAFT and MALM(4)
also studied the effect of the single electrolyte calcium chloride over a wide range
of concentrations and they found that the addition of some calcium chloride lowered the viscosity of gum arabic. But, they observed that as the concentration
of the calcium chloride increased the relative viscosity increasedV).
pH. - The pH of the solution of the gum arabic has been studied by THOMAS and
MURRY (Im. Figure (1.4) shows the maximum value of relative viscosity to fie
between 4.58 and 6.30 after which the viscosity started to decrease gradually in
between pH values of 5 to 10. TAFT and MALMW also found a change of
viscosity with pH and found the maximum viscosity to lie between 6 and 7. Gum
arabic is a suitable medium for microorganism growing. Taft and Malmo) found
that the growth of bacteria on gum arabic changed its viscosity.

6
The effect of n7schanical stress, and of ultraviolet Irradiation: TAFT and MALM(4) have studied the effect of the mechanical treatment on the viscosity of
gum arabic. TRAGER(, ') has been studied ultrasonic vibrations to produce
colloidal dispersions. He found that the colloidal system is easily broken and irradiation of the solution by ultrasonic vibration lowers the viscosity. SZALAY(12)
showed that the gum arabic solution depolymerized by ultrasonic waves and the
viscosity is lowered by these vibrations. LAURENT03) has found that the
ultraviolet radiation reduced the viscosity of gum arabic. Gum arabic has
maximum absorption at 2650 A.
Surface tension: The surface tension of the liquid of gum arabic was studied at different temperatures and concentrations by BANERJI(14), where he showed the
decrease of the surface tension by increasing the temperature, and a decrease
of the surface tension by increasing the concentration.
Electrical conductance: TAFT and MALM4) studied the effect of the concentra-
tion on the electrical conductance of gum arabic - water solution. The graphs between logarithms of volume and equivalent conductance show that the gum
arabic solutions are actually mixtures of calcium arabate and magnesium
arabate.
1.4 CHEMICAL PROPERTIES
Gum arabic as a calcium, magnesium, and potassurn salt of arabic acid, react
with many reagents. A solution of gum arabic will give precipitates or heavy gels if it is treated with the following reagents: borax, ferric chloride, basic lead
acetate, mercuric nitrate, gelatine, potassium silicate, sodium silicate, Millons
reagent. In general trivalent metallic safts will cause precipitation with gum
arabic"O.
7
A solution of gum arabic can be coagulated by ruthenium red, hexol nitrate, or
desogen Geigy. Gum arabic can be hydrolized when it is treated with dilute acids
to give a mixture of L-arabinose, L-rhamnose, D-galactose, and D-glucuronic
acid. It also reacts with nitric acid to give mucic, saccharic and oxalic acids. OSBORN and LEEn studied the solubility of the acacia mucilage solution with
concentrated and dilute hydrochloric acid, concentrated and dilute acetic acid,
concentrated and dilute ammonium hydroxide and dilute sodium hydroxide. The
acacia mucilage is solubles in all these reagents. Also it is soluble in 10%
solutions of sodium chloride, mercuric chloride, bismuth chloride, and silver
nitrate, but it is not soluble in a 10% solution of ferTic chloride and concentrated
sodium hydroxide(l).
1.5 ENZYMES
Oxidases and peroxidases are found in gum arabic and are both inactivated by
the heating of the gum to 800 C for 1 houre). Diastases and pectinoses are also
found in the gum arabic(17).
1.6 INDUSTRIAL YM
Food Industty: A large amount of gum arabic production is used in the food
industry. It is used in the food industry because of its inherent stability and
because it is non-toxic, odourless, colour less, tasteless, and completely
water-soluble. It does not effect the flavor, odour, or colour of the food
ingredients(Ilo.
Confectionety: Because gum arabic has an ability to prevent the crystallization
of the sugars and the thickening the aqueous media. it is used as a glaze in
candy products and as a component of chewing gum, cough drops, and candy

8
lozenges. Also, gum arabic plays a role as an emulsifier, keeping the fat
uniformly distributed and preventing the floating of the fat on the surface and
forming easily oxidizable, greasy filmo).
Dalty products: Gum arabic has been used as a stabilizer in frozen products,
such as ice cream, ices, and sherbets, because it absorbs the water, and it
prevents the growth of ice crystals. It also produces a fine texture from these
products. SCHOLD'o has patented a method using gum arabic for the prepara-
tion of packageable milk or cream. WALDERrA used gum arabic to protect the
formation of colloids during the preparation of baby food.
Baking Industry., Gum arabic is widely used in the baking industry because of
its viscosity and its adhesive property. It is used in glazes and topping and it also
gives a smoothness when it is used as an emulsion stabilizer. Also, when it is
used in a bun glaze, gum arabic gives stability in conjunction with its free-flowing
and adhesive characteristics(le).
Flavour fixative: The spray-dried technique is used to add different kinds of
flavours which may be oxidized or volatile. The gum arabic forms a thin film
around the flavour particle and protects them from oxidation, evaporation and from absorption of moisture from the airv). The tests on spray dried emulsions of
aldehydes showed that the colloidal film protected them from oxidation for years,
while the unprotected materials oxidized in seconds(21).
Flavour emulsifier. JOHNSTONE= has mixed a gum arabic with many flavour
emulsions such as orange, lemon, lime, root beer, and cola. The addition of gum
arabic to these materials gave them the required properties and provided a
smoothness. Citrus oil emulsions consisting of citric acid, lemon oil, glycerol,
water, and colouring matter, take on the most convenient properties when mixed
with gum arabic-gum karaya mixtures.

9
Pharmaceuticals: Because the gum arabic has inherent emulsifying and demulcent and emollient characteristics, it is used in many applications in the
pharmaceuticals area, from the stabilization of emulsions to the formation of tablets. Also, because the solution of gum arabic can retain its viscosity over a
wide range of PHO-18) values it is useful in this field.
In the United States Pharmacopeiamm there is a list of preparation using gum
arabic:
1.350g of gum arabic and 2g of benzoic acid added to purified water to make 1000 ml, this mucilage solution performed to aid in the suspension of insoluble
drugs and also to prevent the precipitation of heavy metals from solution.
2. Acacia syrup. Gum arabic is mixed with sodium benzoate, vanillin tincture and
sucrose for use as a flavour vehicle because of its demulcent affect and its
protective colloid action. A good syrup of diabetic foods is prepared from gum
arabic, saccharin, methyl-p-hydroxybenzoate, and, water. ,
3. Suspending agent. OSBORN and DEKAY04) found that gum arabic is a
convenient emulsifier and suspender for calamine suspensions, kaolin suspen-
sions, liquid petroleum emulsions and cod liver oil emulsions. It has been found
that it is an excellent medium for preparing a stable, nonsetting magnesia
suspension.
Poorly soluble medicinal substances, such as steroids, fat-soluble vitamins, and
barbitureates, that are suspended in gum arabic can be facilited by the
incorporation of wetting agents or other emulsifiers('-18).

10
4. Antiseptic preparation has been made with a mixture of colloidal silver bromide
and gum arabion. Silver arabate has antiseptic properties which is suitable for
use as a substitute for silver nitrate and organic silver compounds in the
treatment of ophthalmic infections. Silver compounds for the internal treatment
of mucous membranes have been patented by VON NEERGAARDM. These
compounds swell and liquefy in contact with moist tissues and are prepared from
water-soluble silver compounds such as the nitrate.
Medicine: In 1920 gum arabic was used for the treatment of low blood pressure
caused by haemorrhage or surgical shock. Intravenous saline injection was not
successful because the salt escaped rapidly, so the addition of 7% gum arabic
solution reduced the dissipation rate of the sodium chloridev-110. In 1933,
intravenous injections of gum arabic solution were used for the treatment of
nephritic edema. In plastic surgery, a 50% gum arabic adhesive has been used
successfully in grafting destroyed peripheral nerves0).
Cosmetics: In cosmetics gum arabic is found in a wide range of applications. In
lotions and protective creams, it stabilizes the emulsion, increases the Viscosity,
and assists in making a homogenous mixture. It forms a protective coating and it
give the skin a smooth feel. It is also used as a binder in the formulation of the
compact cakes, rouges, and as an adhesive in the preparation of facial masks. Also, gum arabic is used as a foam stabilizer in the production of liquid soapm.
Gum arabic has also entered the prescriptions which are used in hair creams and
fixatives and as a binder in face powder compact. In protective creams, gum
arabic can be used as a stabilizer and film-former(U.
Adhesives: Gum arabic is generally used in a wide range of the adhesives
industry. It is mixed with water to form an adhesive solution, and it is sold in
powder to make a safe solution for miscellaneous paper products. WOLFEM
11
employed gum arabic with sodium hydroxide as an adhesive agent for paper
products. The glue of gum arabic is deslraWe because one finds it easy to
prepare, light in colour, odourles and very stable. These glues can be improved
by the addition of metal safts such as calcium nitrate and aluminum sulphate, but
they have the shortcoming that they will be degraded when heated and the
colourless of the glue will change to bronze and related colours. Gum arabic is
also used as a glue for cellophane. Also, a good transparent cement can be
made with gum arabic. Wall paper paste has been based on a mixture of gum
arabic, bentonite, and starch. Sometime gum arabic is used as a binder for
water cements such as gray and iron cementso-m
Inks: Gum arabic is an important constituent of many special purpose inks because it has an excellent protective colloid action. Gum arabic and lampblack
mixed together to form a suitable ink stick which was used in the same process for over 3000 yearsom).
Many of the inks use gum arabic in the formula, including record ink, which Is
used in government writings. Soluble inks, used just to mark the cloth in the
textile area. Gum arabic is a suitable binder for water colour inks because it has
excellent suspending properties where this kind of ink must remain In suspen-
sion.
Gum arabic is used with ethanol as a thickener and suspension agent in fast
drying inks, also it is used in fabric and laundry marking inks. In typographic ink
gum arabic is used as a binder to keep the ink out of separation. the
Conductive inks have a range of application in the electronic area. The most

12
important use of this Ink is In preparing printed circuits. The most conductive Inks
are based on carbon black, powdered graphite. Powdered silver or copper are used and the suspension agent can be a lacquer or gum arabic(l).
Lithography: Gums are used as sensitizers for lithography plates. A solution
consists of gum arabic and dichmmates and can form water-insoluble sub-
stances by the effect of the light. A layer of this mixture can be formed on plastic,
paper, metallic and stone surfaces and unexposed material can be removed
easily by water or dilute acids. Gum arabic for this use must be of the best
quality and be prepared in a special way for this purposeM.
1.7 COMPOSITION AM STRUCTURF. -QEfi=
ARABIC.
1.7.1 INTRODUCTION.
Gum arabic Is in essence a carbohydrate. The carbohydrates or saocharides are
most simply defined as polytrydroxy aldehydes or ketones and their derlatives.
Carbohydrates or sugars are found in nature as monosaochaddes, oligosaocha-
rides which contain from two to ten monosacchaddes, and polysaochaddes
which contains more than ten units of monosaccharides. Connections between
the units of ollgo and polysaccharides are called glycosidic linkagesom.
Polysaccharides contain many monosacchadde, units joined In long linear or branched chains. it may be divided into two kinds, namely homopolysaccharides
which contain only one type of monosaochadde and hetropolysaccharldes which
contains two or more different monomeric units.
1.7.2 COMPOSITION AM STRUCTURE.
Gum arabic is the saft of an organic acid, arabic acid, with metals such as
calcium, magnesium, and potassiumm. The hydrolysis of the gum has been
shown by many authors including HAWORTH et al. (21), HOTCHKISS and
GEOBEL=m, SCHEIBLER(34, SULLIVAN(3%, BUTLER and CRETCHER(3%, KIL-

13
IAN107-n and CLAESSONPR. These authors show that gum amble consists of D-galactose, L-arabinose, L-rhamnose, and D-glucuronic add. ANDERSON and HIRST(" showed that a sample of acacia Senegal gum (gum amble) had the following approximate percentages for its various constituents. D-galactose 39%, L-arabinose 28%, L-rhamnose 14%, D-glucuronic add 17% and 4-0-methyl-D-glucmnic acid 1.5%. In addition ANDERSON and MC-
DOUGALL(41, m mentioned that gum amble contalnes 2.3 to 30/6 of proteinaceous;
material. SMITH(" has shown that gum amble does not only consist of different
monosacchadde components, but these components are joined by no less than
three different types of linkages. SMITHm has proved the presence of a 1,3 link
between the units of gum amble by the autohydrolysis of amble add, which
produces degraded amble add and a mixture of three reducing sugars.
a) 3-galactosido-L-arabinose(o.
b) prolonged autohydrolysis of the degraded amble add produces the disaccha-
rlde, 3-galactosido-galactoseom.
c) 2,5-dimethyl-L-arabinose is Identified as one of the hydrolysis products of
methylated amble add(". From the hydrolytic product of methylated degraded and methylated amble add,
the presence of 2,4-dimethyl galactose proved that 1,3 and 1A links are
presentedm.
ANDERSON et. al. "q have shown that gum amble contains a fundamental chain
of D-galactose units, exclusively involving 1,3 linkages. the presence of In-
creased proportions of 2,4,6-tri-0-methyl-D-galactose in the methylated autohy-
drolysed gum suggests that some of the residues in the chains of beta 1,3 linked
galactose units are 6-0 substituted with add labile arabino-fumnose unitsm. The
isolation of 2,3-dimethyl-glucuronic add can suggest the presence of 1,4 links In

14
arabic acicP*. The isolation and characterisation after deacetylation of 4-0-a
-L-rhamnopyranoseyl-D-glucose from acetolysis of diborane-reduced acetylated
gum established that some L-rhamnopyranose residues are glyWsldcally Inked
to C-4 bonds of D-glucuronlc acid(". The 1,6-type of linkage in arabic acid has
been established by the following way.
a) By the Isolation of the 6-"Iucuronosidogalactose from arabic acklm. b) By the formation of the hexamethyl 6-p-glucuronoisidogalWose by graded hydrolysis of methylated arabic acielm.
c) By the isolation of 2,3,4-trymethyl-galactose from the methylated degraded
arabic acid"4.
From the above studies and others. SMITHtm proposed a possible structure for
an arabic acid which may be shown in structure [I. I].
ANDERSON et al. to have degraded acacia Senegal gum through seven
successive SMITH degradation processes. The study of the O-methyl derivatives
of each of the polysaccharldes obtained from the first five degradations and the
study of the methylated polysaccharides after the fifth degradation together with the partial acid hydrolysis of the methylated polysaccharldes and the degmdation
of the gum by autohydrolysis and the methylation of the autohydrolysed gum all lead to a modified structure of gum arabic, which is shown in structure [1.21
STREET and ANDERSON(" provide more calculations and studies on the
seventh Smith degradation which are mentioned by ANDERSON and HIRSTM
These authors modified a model of the gum arabic molecule. This model could be shown in structure [1.3].
1.8 THE PRESENT INVESTIGATION.
Ionizing radiation has been used widely to sterilize food and medical materials
by destroying the microorganisms which may grow on the materials. The
application of ionizaing radiation to organic materials leads to destruction of
t

15
some centres; and to change particularly the chemical structure of these
materials. The presence of the damaged centres In the molecule means there
are chemical active centres produced by the interaction of the Ionizing radiation
with the material. These centres are usually free radicals.
The study of free radicals gives information about the molecular structure of the
compounds. Also, we may obtain information about the weaker bond In the
compound which leads us to understand the mechanism by which the chemical
reactions take place. The best technique used to observe the free radicals Is the
Electron Spin Resonance (ESR) technique, which can give us directly informa-
tion about the free radical and the interaction of the free radical with its
environment.
In this thesis a general discussion of the structure and composition of gum arabic
is given. A series of investigations on the electron spin resonance (ESR) in a
variety of x-irradlated samples of gum arabic and of mixtures of the main
components of gum aralAc, to simulate the natural material, are reported. The
study of the paramagnetic centres provides further information which can be
related to the structure of the material.

16
CHAPTER WRO
IRRADIATION STUDIES ON CARBOHYDRATES
2.1 INTRODUCTION
To our knowledge, gum arabic has not been studied by ESR spectrosoopy after
x-ray irradiation. The complexity of the material merits a detailed survey of the
effect of the radiation on carbohydrates, from monosacchaddes to disacchaddes
and polysaochaddes. In monosaccharldes we should take units other than the
components of gum arabic because most of the monosaccharldes have a
pyranose ring which Is present in monomers of gum arbic. Also, the presence of
some chemical group in the monosaccharidGS cause some signals to be present in the ESR spectra of different sugars.
A survey of the work on the irradiation of the carbohydrates which contains a
glycosidic linkage, present in gum arabic. will be presented here to provide a background on the effect of the ionizing radiation on the polyseocharldes.
Starch which is composed, of 1-4 linkage a-D- glucopyranose and Cellulose
which is composed of P -D- glucopyranose are selected to summarise the
previous work of the ESR studies of irradiated polysaccharlde materials. The
selection of these two materials is due to the fact that there are similarities
between these materials and gum arabic. That is the 1-4 linkage between the
monomers and the chemical group -CH20H is found in galactose which Is a
monomer in gum arabic and glucose which is monomer in starch and cellulose

17
2.2 IRRADIATION QF MON! DSACCHARIEDS
COLLINS(47) has studied the ESR signals of gamma irradiated polycrystaline D-glucose, D-xylose, and D-galacturonic acid at room temperature. The ESR
spectra of D-glucose structure [2.1] obtained by COLLINS showed two radicals,
one of which consists of three lines and the other has one line. From the study of the chemical structure of D-glucose he postulated the formation of a stable
radical at C(l) to form the singlet signal, and at C(5) to form the triplet signal,
where a small amount of delocalization energy is available from the neighboring
oxygen atom. The postulated locations of the radicals are as shown in structure [2.2 and 2.3].
In D-galacturonic acid structure [2.4], COLLINS(47) has detected a singlet signal in the ESR spectrum. he proposed a model for this signal as shown in structure
(2.5 or 2.6] where no hyperfine interaction is to be expected.
DILLI and GARNETTA have gamma irradiated polycrystaline monosaccharides
at room temperature. The ESR signals which has been detected for monosac-
charides, ( such as glucose, structure (2.11, galactose, structure (2.7] , mannose,
structure [2-8], and arabinose, structure (2.9] ), consist of two lines. The location
of the free electron suggested by these authors to form a signal with two lines (a
doublet ) is at C(I) or C(6) of the pyranose ring. In lyxose structure [2.101 four
line spectra were detected. They interpreted these lines by assuming the
interaction of the free electron with three protons. This situation may occur if the
free electron is localized at C(4) and it interacts with the three protons of C(3)
and C(5).
UEDA(4% has studied two patterns of hexose monosaccharides, fructose structure
[2.111 and sorbose structure [2.121. An irradiated single crystal of these two

18
sugars has been studied by ESR spectroscopy at 77 K and 293 K. At 77 K The
signal which has been detected for the two sugars was a doublet with 18 gauss isotropic hyperfine splitting. At 293 K fructose shows a quartet signal, but in
sorbose the spectrum shows a quartet and a doublet signal. The hyperfine
splitting of the quartet signal is 15 gauss. This splitting is isotropic. UEDA has
proposed a model by which he interpreted the formation of these radicals in
sorbose and fractose. In this model, structure [2.13], the quartet signal could be
formed if the free electron at C(4) interacted equally with two protons at C(5) and
a proton (1-13) at C(3). This could happen if C(3), C(4), C(5) are in the same
plane. The doublet signal is formed by the interaction of the electron at C(4) with
an axial H5 where the P, orbital of the unpaired electron is nearly parallel to the
axial bond of H5. this could be happen if C(3), C(4), C(5) are not in the same
plane. and this is the case for C(3), C(4), C(5). However, the doublet which was
obsarved at 77 K in the crystals of fructose and sorbose and also in sorbose at 293 K could be explained if C(3), C(4), C(S) are not in the same plane.
BALAZS et al. (" studied the ESR spectra of irradiated glucuronic add structure [2.14]. In this study they found a singlet signal with g- value = 2.00124. The line
width of this signal is 20 gauss. The location of the radical is proposed to be at C5 as in structure [2.15], where the radical would be stabilized by resonance
interaction with the carboxylic gmup(-c=o I Un
The ESR spectra of gamma irradiated polycrystaline monosacchadde such as
pentoses ( P-L-arabinose structure [2.91, a-D-xylose structure [2.161, P-D-ribose
structure [2.171 ) and hexoses ( (x-D-galactose structure [2.7], a-D-glucose
structure [2.1], PýD-mannose structure [2-8] ), were studied by NIKITIN etal(61).
These materials were irradiated at 77 K. The ESR spectra were recorded over

19
the range of temperature of 77 to 300 K. The signals recorded at 77 K were a doublet signal for all sugars. Triplet signal were detected for xylose, ribose,
glucose and mannose and a quartet in arabinose. The triplet signals were found
in monosaccharides which have a steric interaction of the hydroxyl groups at
alternate carbons with the same configuration(m . Structure [2.18] shows the
interaction between the hydroxyl and the C-H bond (steric interaction). Steric
interaction phenomena have been found in the sugars ( xylose, ribose, glucose )
where a weakened bond is located at C3. In mannose the weakened bond is
located at C2. It is suggested that the doublet signal is due to cleavage of the
C-H bond in C1 where this bond is weakened by the drawing of an electron by
the cyclic and hydroxy oxygen atom wA7). The quartet signal which was found in
arabinose (splitting =15 gauss ) is due to interaction between a free electron at
04 with three beta protons ( two protons on C5 and one proton on C3 )(41". The
cleavage of the C-H bond at C4 is due to the weakening of this bond by an
equatorial hydroxyl group(54). At room temperature NIKITIN(51) found a doublet
signal in all monosaocharides, a singlet was found in xylose, a triplet in mannose,
and triplet - quadruplet in arabinose. The stable radicals at room temperature are
determined by the presence of conjugated bonds. These bonds are produced by
dehydration with the loss of one or more water molecules. Structure [2.191
illustrates the role of the loss of the water molecule in producing a stable radical.
BAUGH etal(M studied the ESR spectra of irradiated frozen aqueous solutions of
D-glucose structure [2.1]. This material was irradiated at 80 K. The ESR spectra
were recorded covering the range between 80 K to 213 K. The study of the ESR
spectra during the warming process, indicated different sources of ESR signals.
(1) A broad anisotropic doublet 43 gauss splitting ) due to a hydroxyl radical
present in ice. (2) A singlet (g2.0014, AH = 14.5 gauss ) which disappeared

20
on photobleaching with light ( from 540 to 580 nm ) and which due to a trapped
electron, (3) A broad poorly resolved absorption signal arising from the
carbohydrate. The signals due to trapped electrons and OH radicals disappear
with the rise of the temperature to 140 K. The best resolved signal due to the
carbohydrate has been obtained at 193 K. this is assumed to be due to
increased rotation of the protons that are responsible for the hyperfine splitting.
The signals which were detected at 190 K are interpreted as a superposition of
two different radicals. One is a doublet with 20 gauss hyperfine splitting and g=
2.0030 and the other is a triplet with 29.5 gauss hyperfine splitting and g=
2.0025. In glucose ice, the triplet is due to the precence of the free electron at
C(5) as C(5)-C(6)HOH radical. The doublet is due to a free electron localized at
Cl.
NIKITINE eta](5%. studied monosaocharides such as pentoses ( D-L-arabinose, a
-D-xylose, A-D-ribose ) and hexoses ( a-D-galactose, (x-D-glucose, fý-D-mannose
) while dissolved in water. The materials were irradiated at 77 K. They found that
the ESR spectra which were recorded at 77 K gave a signal due to trapped
electrons, and signals due to the dissolved material ( monosaccharides ). The
latter signal was a doublet for all monosaccharides with a hyperfine splitting of 30
gauss for arabinose and from 18 gauss to 20 gauss for the other monosaccha-
rides. The triplet signal is found in all of the studied monosaccharides except
arabinose, and has a hyperfine splitting of 25 gauss. A quadruplet was found
only in arabinose with hyperfine splitting of 15 gauss .A triplet of doublet signal
was found only in xylose with hyperfine splitting of 30 gauss and 10 gauss. The
triplet signal was interpreted by these authors as due to steric interaction of
hydroxyls ( 1-3 or 2-4 ) at alternate asymmetric carbon atoms with the same
configurationsm. This interaction leads to weakened C-H bonds at C2 and C3.
21
So the unpaired electron is localized at C2 in mannose and at C3 in the case of
xylose, ribose, and glucose. The quadruplet signal which is found in arabinose is
due to location of the free electron at C4 which interacts with three equivalent beta - protons (one proton at H3 and two protons at C5). The weakening of the
C-H bond at C4 in arabinose is due to the presence of the axial hydroxyl on the
C(4) carbon atomrA). This fact can be applied to interpret the triplet signal which is
found in galactose, where the axial hydroxyl is located at C4, so the free electron
at C(4) will interact with equivalent axial p- protons (H3 and 1-15). The triplet of
doublet signal which was detected in xylose is due to location of free electron on
C4 which interact with two axial beta - protons H3 and H5 and one equatorial
beta proton H5.
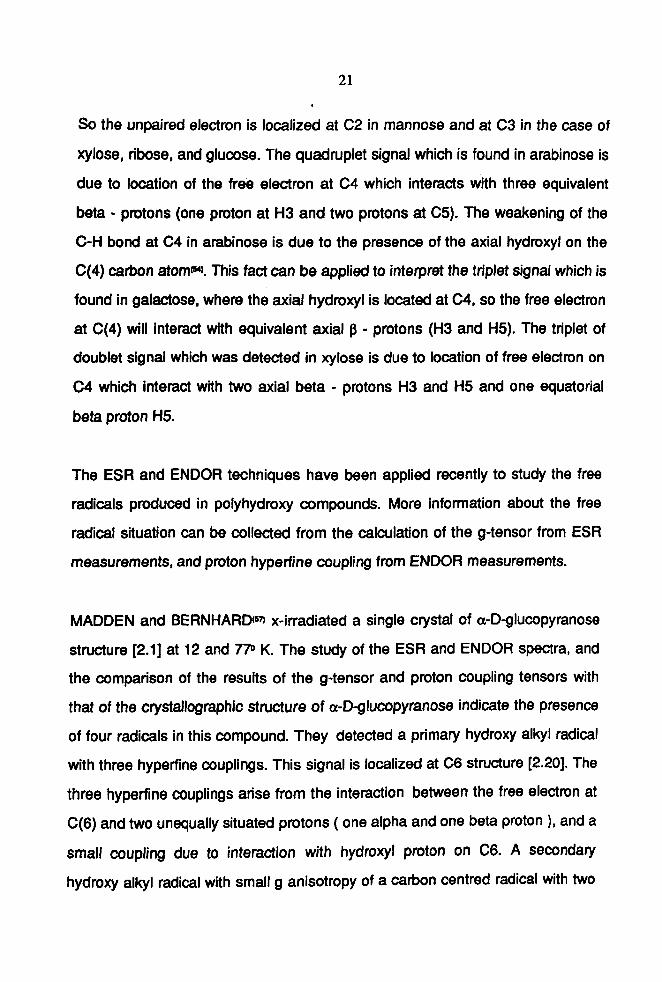
The ESR and ENDOR techniques have been applied recently to study the free
radicals produced in polyhydroxy compounds. More information about the free
radical situation can be collected from the calculation of the g-tensor from ESR
measurements, and proton hyperfine coupling from ENDOR measurements.
MADDEN and BERNHARD(" x-irradiated a single crystal of a-D-glucopyranose
structure [2.1] at 12 and 770 K. The study of the ESR and ENDOR spectra, and
the comparison of the results of the g-tensor and proton coupling tensors with
that of the crystallographic structure of a-D-glucopyranose indicate the presence
of four radicals in this compound. They detected a primary hydroxy alkyl radical
with three hyperfine couplings. This signal is localized at C6 structure [2-201. The
three hyperfine couplings arise from the interaction between the free electron at
C(6) and two unequally situated protons ( one alpha and one beta proton ), and a
small coupling due to interaction with hydroxyl proton on C6. A secondary
hydroxy alkyl radical with small g anisotropy of a carbon centred radical with two

22
large isotropic hyperfine couplings and one small anisotropic coupling was
detected. The ENDOR data explain the presence of the free electron at C3
structure [2.21] where this electron interact with beta-proton on C2 and beta
proton on C4, they also suggest a weak coupling with the proton of hydroxyl
group on C3. Two signals of g-factor anisotropy were identified as secondary
alkoxy radicals. These two signals arise from one centre but have variable
hyperfine interaction with the environment. They suggest that the location of
these two radicals is C(2)-O. as in structure [2.22].
ESR spectra of gamma irradiated single crystal of rhamnose structure [2.23]
were studied by SAMSKOG et al. mw, PANASYUK and YUDIN(am. At 670 Ka
trapped electron radical was detected by SAMSKOG(m, and a signal due to
alkoxy radical was found with a large g- factor. This signal was also reported at
770 K by SAMSKOG(" and PANASYUK(m. It consists of 4 lines arising from the
location of the free electron at 04 as in structure [2.241. A doublet of doublet
signal was detected by PANASYUK(m and SAMSKOG(R. This radical is identified
as a hydroxy alkyl radical, it arises from abstraction of hydrogen from C2, C3, or
C4 , and an interaction with two beta protons one of them is the proton of OH,
and the other is the beta proton. At 77 Ka doublet radical was obtained by
SAMSKOG(". This radical is assumed to be located on C1, C2, C3, or C4 and it
could arise from the coupling of the free electron with one beta proton. Another
radical was observecim with doublet - quadruplet hyperfine lines. They suggests
that this radical arises from the interaction of a free electron at C5 with one beta
pmton at C4 and three beta protons of the methyl group as in structure [2.251.
The doublet, doublet of doublet and doublet of quartet radicals are found as
stable radicals in rhamnose single crystals at mom temperature(OD).

23
2.3 IRRADIATED, CARBOHYDRATES
CONTAINING GLYCOSIDIC BONDS.
DILLI and GARNETT(" have gamma irradiated polycrystaline disaocharides such as sucrose structure [2.261 and cellobiose structure [2.27]. The ESR spectra of these materials consist of two lines. They suggest CI or C4 to localize the free
electron to form a doublet. ESR spectra of lactose structure [2-28] consist of four
lines. They suggest localization of the free electron at C5 to form these four lines
where the free electron on this atom interacts with three protons at C4 and C6
The ESR and ENDOR spectra of an irradiated single crystal of a-methyl-glucopy-
ranoside structure [2.291 have been studied at 770 K by MADDEN and BERRHARDPI). Five paramagnetic centres were assigned by the study of the
ESR spectra of this material. A primary alkoxy radical with anisotropic g-factor
and isotropic hyperfine splitting was identified to be localized on 06 as in
structure [2.30]. A secondary alkoxy radical with one hyperfine splitting is
assumed to be localized at 02 as in structure [2.31]. A hydroxy alkyl radical
showing hyperfine coupling is localized at C6 as in structure [2.321. Another
radical identified from ESR and ENDOR spectra may be located at CS as in
structure [2.33]. A strong ENDOR signal with an isotropic component with beta
proton was observed. The possible structure of this radical is as in structure
[2.341.
ESR and ENDOR spectra of irradiated single crystal of glucose- I -phosphate dipotassiurn saft structure [2.351 have been studied by LOCHER and BOX(M at
4.20 K. The alkoxy radical which gives rise to a quartet of hyperfine lines was
observed at a g-factor, g=2.0254. This radical is identified as a radical centred
at 06 as in structure [2.36]. R arises from an interaction of the free electron with

24
two beta protons. Another alkoxy radical is found at g=2.0470. This radical
arises from an interaction between the free electron and one beta proton. This
radical could be localized at 02,03,04. The study of the g-tensors showed that
another alkoxy radical could have given the resonance at g=2.0086. This
radical is located at 02,03,04. A hydroxy radical gives rise to a signal at g= 2.0023 structure [2.37]. This radical is attributed to the location of the free
electron at C6.
2.4 IRRADIATED POLYSACCHARIDES
The study of the ESR spectra of several irradiated powder starches structure
[2.38] has been carried out by ADAMIC and BLINC(m. The spectra of irradiated
starches at 770 K and at room temperature show more than one radical
composed the spectra. The spectra which have been recorded at room
temperature show a doublet signal with hyperfine splitting of about 15 gauss.
Annealing at room temperature, gave a singlet signal after several days. The
irradiation of the starches at 771, K showed a triplet signal with 18 gauss hyperfine
splitting. The variation of the temperature from 77o K to room temperature varied
the triplet signal to a doublet. The triplet signal was interpreted by ADAMIC as a free radical arising from the breaking of the C--O bond on C6 as in structure
[2.39], so this electron is assumed to produce a triplet by interaction with two
alpha protons on C6. This hypothesis interprets the transformation of the triplet
signal to a doublet by migration of radiation damage from C6 to C5, which
causes the separation of the -CH20H gmup to localize the unpaired electron at
C5 to yield a doublet signal by interaction of the free electron with H5 as in
structure [2.40]. The singlet signal which is found after annealing at room

25
temperature has a poorly resolved hyperfine interaction, so this signal may be a doublet arising from the cleavage of the C--H bond on carbon C(I). The doublet
is arises from the interaction of the free electron on C(1) with one proton at C(2).
RAM and AGNEL*q have studied the kinetics of the free radicals produced from
irradiated starches. The decay of the spectrum during several months caused the
lineshape to change from a shape indicating several radicals immediately after
irradiation to a shape consisting of single line after several months of decay. The
study of the kinetics of the singlet signal shape ( relation between decay time and
logarithmic of relative concentration of radicals) by RAM shows four zones
through which the radical decayed. During the first zone (several days storage
after irradiation) the radicals decayed rapidly, in zone 11 (from several days to 2
weeks). In this zone they found the decay rate to depend on water content, in
zone III it was found that the decay rate of this zone is independent of the water
content. An attempt to advance a model to interpret the two species before and
after annealing has been suggested by RAFFI. The model shown in structure
[2.41] proposed a species consisting of a doublet signal which detected
immediately after irradiation and arising from the abstraction of the hydrogen
atom from C1 where the free electron on C1 will interact with beta proton on C2.
The singlet signal produced after annealing is interpreted as due to the action of
oxygen traces on the radicals of the glycosidic bond deriving from the break of
the glycosidic link as shown in structure [2.42].
In earlier times the effect of ionizing radiation on the texture of fruits and
vegetables has been studied by GLEGG and KERTESZ(O). From the measure-
ments of the viscosity before and after irradiation, they found a decrease of the
viscosity after irradiation. They interpret this phenomena as due to a degradation

26
of the cellulose component of the cell wall. FLORIN and WALL(" have studied
the ESR of irradiated purified cellulose. The ESR spectra observed is asymmetric
with five partially resolved peaks. The change of the microwave power and the
effect of the thermal annealing shows saturation and modification of some
radicals before another which means that more than one radical is present in the
spectra. The addition of water and the exposure of the material to oxygen did not
affect the peak location but it affected the intensity of the signals. An interpreta-
tion of the ESR spectra of the irradiated cellulose has been proposed by these
authors as follows. The high intensity signal of three lines is due to a hyperfine
splitting of 20 gauss. GIBSON et al. "m has interpreted this signal as a signal due
to the interaction of the free electron with 2a or 0 protons. The other radical
giving rise to a doublet with g- value less than the DPPH by 0.002 to 0.003
indicated more spin-orbital interaction. The small shifts in this direction are found
when the free electrons are located at oxygen atoms, so the radical may be due
to cleavage of a C-0 or 0--H bond, so the radical may be of the type shown in
structure (2.44 and 2.45].
The ESR spectra of irradiated dry and wet cellulose of type I and 11, which have
the same unit cell but differ in the dimensions of the unit cell, have been studied
by BAUGH et alm. Dry cellulose I and If gave an ESR signal with three lines, but
the wet cellulose 11 gave five lines, whereas wet cellulose I still gave three lines.
This change of the ESR spectrum by addition of the moisture to cellulose 11 may
be due to the difference in the dimension of the unit cell between the two
cellulose samples used. The three line signal has been interpreted by these
authors as due to localization of the free electron at C5, that is because the
delocalizaition energy is available from the oxygen attached to C5. Then the
three lines arise from the interaction of the free electron at C5 with two 0 protons

27
on C6 as in structure [2.46]. The five line signal may be due to summation of two
radicals localized at C5 and C6 with two three lines which have nearly the same
g- value with different hyperfine splitting constant aC5--H and aC6-H. The
singlet signal which is found in the two celluloses is due to cleavage of the
glycosidic link between the monomers as in structure [2.471.
ARTHUR et al. (" studied the effects of the different order of crystallinity of
cellulose and of the water on the ESR spectra generated by free radicals due to
the interaction of gamma rays and the cellulose molecule. From this work they
concluded that the addition of water to the amorphous and less ordered
crystallinity causes the free radical to react with water and get easily destroyed.
The high order crystallinity of cellulose shows stable free radicals toward the
addition of solvent or water. By the addition of water the line shape of the ESR
spectra were changed, the change depending on the crystalline structure and
degree of crystallinity of cellulose.

28
CHAPTER THREE
GENERATION QF FREE RADICALS AY IRRADIATION AND
ELECTRON SPIN RESONANCE (ESR)
3.1 THE NATURE QE ION123NG RADIATION
The radiations which are of interest in our investigation are those which have
sufficent energy for ionization, and can produce ions by ejecting an electmn from
its orbit into another state. The ionizaing radiation can be divided into two groups:
1- Particulate radiation, such as alpha particles, electrons, protons and neutrons.
2- Electromagnetic radiations such as UV, x-rays and gamma rays.
Ultraviolet radiation is electmmagnetic radiation of wave length from 10 to 4000
AO and is an important radiation in some biological processes. The effect of
ultraviolet radiation in matter is generally that of an exciting radiation, but
sometimes the effect is as an ionizing radiation.
x-rays and gamma rays are electromagnetic radiations with wavelengths
between I 0-3and 10 A& Gamma rays are emitted from the nucleus, but x-rays are
emitted by the electronic processes. The x and gamma radiations interact with
matter depending on the energy of the incident photon which is proportional to
the frequency(m.
3.1.1 INTERACTION OF IONIZATION RADIATION WITH MATTER
Ionizing radiation interaction with matter depends on the photon energy of the
incident radiation. The low energy ionizing radiation interacts with the electron
cloud of the atom or molecule, where the high energy photons interact with the
nucleus of the atoms. The interaction between the incident radiation and matter
occurs via five mechanisms, which are (1) classical scattering, (2) Compton

29
effect, (3) photoelectric effect, (4) pair production, (5) photodisintegration(71). When the energy of the incident photon is below 10 keV the photon will interact
with matter by classical scattering in which the target atom become excited, and
subsequently will release this excess energy as a secondary photon with the
same wavelength of the incident photon. In the Compton effect the incident
photon interacts with an outer shell electron and ejects it from the atom. The
result of the Compton interaction is an ionized electron and a scattered photon. The scattered photon and the scattered electron may have sufficent energy to
cause further ionizations. In the photoelectric effect the incident photon must have an energy sufficent to release an electron from an inner shell (K-shell). The
result of the photoelectric effect is a photoelectron. The photoelectron will carry a kinetic energy that depends on the binding energy of the K-shell electron and the
energy of the incident photon. When the incident photon have an energy more
than 1.02 MeV pair production will occur; the photon will penetrate the electron
cloud to interact with the nuclear field. The results will be two particles: an
electron and a positron. Photodisintegration occurs when the incident photon
have energy greater than 10 MeV, so the photon will penetrate the electron
clouds and nuclear force field to interact directly with the nucleus and emit a
nuclear fragment(71).
Ionization or excitation of the molecule can be caused directly when it receives
the incident radiation and that is called a direct effect of radiation, or by transfer
of energy from another molecule, which is known as the indirect effect of
radiation(M.
The mechanism by which the energy of an electron may be transferred to matter
is as follows.
If the energy of an electron E, is greater than the energy of excitation E... , the
energy will be used to ionize or to excite the electron.

30
If E. ý,. 2t E, 2- E,,. where E,,. is the energy of the electron vibration, then the energy
of the electron will be used in the vibrational excitation of molecules.
if EO. ? E, a E, where E,, is the kinetic energy of the electron. the electron energy
decreases to thermal energy(m.
3.1.2 RADICAL FORMATION
When the electron is ejected from the molecule the result is a positive ion A+ and
a negative electron e- Both the positive ion and the electron may have a great
deal of energy
A ---->A'+ e----(1)
The electron will be captured by another molecule
e-+B ---->B----(2) The result of these two processes is two ions one negative and the other is
positive.
A +B ---->A++B----(3) Sometimes the negative and the positive ions are formed as ion pairs by
radiation.
Sometimes an electron will be neutralized by the positive ion from which the
electron is ejected but that is the unusual case. The molecule formed in this way
A* has more energy than that associated with normal stability.
A'+e--ýA* (4)
This molecule tends to dissociate immediately, and the result of the dissociation
is a free radical.
31
A'-- --ý CO+DO --- (5)
Also an ion pair EF- may dissociate to form a free radical:
EF- -- ---> E- + Fo
where E- is an ion which does not contain an excess of energy, but the free
radical FO contains a great deal of energym.
3.2 ELECTRON SPIN RESONANCE TNEORY
3.2.1 INTRODUCIION
Determination of the energy levels of molecules, atoms and nuclei is the
fundamental object of the various forms of the spectroscopy. The energy levels
can be created by the interaction between matter and radiation. The lines or the
bands in a spectrum represent transitions between energy levels of molecules
and hence the frequency of each line or band measures the energy separation of the two levels(m74).
Paramagnetic resonance is a form of spectroscopy in which an oscillating
magnetic field of the incident electromagnetic radiation (microwave) induces
magnetic dipole transitions between the energy levels of a system of paramag-
nets which has a net magnetic dipole moment, assosiated with the motion of the
electrons within it.
In general, any system with free radicals or any compound containing transition
elements which contain unpaired electrons, can be studied by electron spin
resonance spectroscopy. Naturally free radicals are found in a large number of
metabolic processes of biological systems or any organic reactions, particularly
in metabolic processes of cells, enzymatic reactions, oxidation - reduction
reactions, intermediate of the action of the drugs and in any pathological

32
processes, the damage of the biological molecules by ionizaing radiation, and
photosynthetic processesm. Electron spin resonance (ESR) spectroscopy is a
physical technique designed to detect species with unpaired electrons . The
systems which contain unpaired electrons can be summarized as follows:
1. Free radicals which are found in a molecules having one unpaired electron.
2. Biradicals which are found in molecules with two unpaired electrons.
3. Any system with three or more unpaired electrons.
4. Point defects in solids.
S. Most transition metal ions and rare - earth ions.
An electron has orbital and spin angular momentum due to orbital and spin
motion and the result of the spin and the orbital angular momentum of the
electron is a magnetic dipole moment. If the molecule which has a net magnetic
moment is placed in a static magnetic field, the dipole will interact with the
magnetic field component of the incident electromagnetic wave and absorption
will take place.
When a molecule with a magnetic moment is situated in a magnetic field, the
energy W of the magnetic dipole g in the field H is equal to
W=-R-H=-g-Hcos(p, H) ------ (3-1)
where (pH) is the angle between g and H. This expression show that the energy of the dipole w is a minimum if g is positive
and the angle (pH) is zero, as shown in figure (3-1)a. The energy will be a
maximum W. = +JL -H when the angle is equal to x, which mean that the dipole
is antiparallel to the direction Of H as shown in figure (3-1 c)(74).

33
3. Z2 QUANTIZATION QF ANGULAR MOMENTUM
Simple theory shows that any particle of mass m undergoing orbital motion, has
an angular momentum. If the linear momentum of this particle is given by the equation p= m-v then the particle has an associated de Broglie wavelength:
X=h ------------- (3-2) P
In the propagation of the wave around the orbital, it must not interfere destructively with itself. This requires the orbital to be an integral M of the de
Broglie wavelength, so, assuming a circular orbit:
27ir M. =Mh ---------- (3-3) p
i. e. the angular momentum p. r is given by
P*: -- h=
MT ---------- (3-4) 27c
where p, is the magnitude of the angular momentum of the particle. p. is
required to be an integral multiple of h. For this case M will take the values 0,1,
2,3 . ...... etc. In the z- direction the angular momentum is symbolized by Pý'.
when m=0 the electron is said to be in aa orbital, when M=I it is said to be in a
x orbital. for most of free radicals, the unpaired electrons resides in n orbitals.
Quantum mechanical analysis of the motion shows that the expectation values of the z-component of the orbital angular momentum for a single electron is of the
I form [I(I+ 1)35. h where I takes the values 0,1,2,3 . ........... etc. These values can represented for atomic spectra by the spectroscopic symbols

34
s, p, d, f......... etc. for the total angular momentum . For the quantum number L=
0,1,2,3 . ....... etc. is represented by S, P, D, F............ etc. The expectation
value of the z-component of the orbital angular momentum I W. is MX. For a particle in a ring. M, can take the integral
values between -i, and +i.
-1: 5M1<1 There are 21+1 allowed values of m,. The spin angular momentum expectation
values are [S(S + where s represents the spin quantum
number. The components of the spin angular momentum can take M, -T values.
For a single electron s can take the value!. For systems that have more than one 2
electron, the M, values are , .............. etc. The allowed values of M, are -s up to 222
+s. there are 2s +I allowed values of M, For a free radical =*I the nuclear spin 2
angular momentum is also quantized. The nuclear spin quantum number is
denoted by I(M. M.
3.2.3 RELATIONS BETWEEN MAGNETIC MQMENTS AND ANGULAR
MOMENTUM.
The magnetic dipole moment g of a particle of mass m and charge q moving in a
circular orbital is g=i. 4. The time required for the particle to complete one orbit
(one oscillation) is: 21rr t,
Therefore the magnitude of the current i is :
Thus.
dq q. u i== ýý- gr dt nr
LA = q. v. nr 2=q. r. v--------- (3-5) ilrr 2

35
If we multiply by the factor m up and down in equation (3 - 5) we get
q- po ---------- (3-6) 2m
In the z-direction
q= ypo = YMh ------------------ (3-7) 2mc PO-
where: Y_ q is called the gyromagnetic ratio in general: 2 mc
y-
For an electron: c? h -- is represented by which is called the 4 it mc
Bohr magneton. The component of electron spin magnetic moment R, along the direction of the magnetic field H is thus
P, = YMW = -g OM -------------- (3-8)
The negative sign arises because of the negative charge of the electron. The quantization of spin angular momentum in a specified direction leads to the
quantization of the energy levels of a system of magnetic dipoles P, in a magnetic field. If we applied the expression W= --A,. H to a (spin only system and substitute
p, = -g PM, we obtain a set of energies.
W=gPHM ------------------- (3-9)
If the possible values of M, are md -, ' there are two possible values of W. 2
gp
W=± I
gpH ------------------- (3-10) 2

36
Equation (3 - 10) is sometimes called the electron Zeeman energy. The transition
between the two Zeeman levels needs an appropriate frequency of an electro-
magnetic field, so, if the photon energy hv matches the energy - level separation
AW then:
AW=hv=gpH ----------------- (3-11)
where v is expressed in hertz ( Hz ), H, is the magnetic field at which the
resonance condition is met.
Figure (3 - 2) shows the energy - levels scheme, for the ESR absorption, where
W, and WO represents the energies of the m, =+jI and the m, =-jI states, respecti- 22
ValyV4,7M.
3.2.4 NUCLEAR HYPERFINE INTERACTION
Some of the nuclei exhibit a magnetic moment associated with the nuclear spin
angular momentum. The interaction between an unpaired electron and a
magnetic nucleus is called the hyperfine interaction. The energy of the dipole - dipole interaction W,,,,,,. between an electron and a nucleus is derived clasically
1-3 COS2 ()
r3 ----------
where g.., k. are the components of the electron and nuclear dipole moments
respectively along a magnetic field (z-directon), r is the distance between the
dipoles, 0 is the angle between the magnetic field direction and a line joining the
two dipoles, figure (3 - 3) shows the interaction between the two dipoles. since
the electron is not localized at one position in space. The interaction energy H,..,
must be averaged over the electron probability distributions, so the average local
field is obtained by inserting the value of coee averaged over the sphere(74).

37
Fermi has shown that for a system with one electron the isotropic interaction
energy is given approximately by:
87c Wi.
31 V(O) 12 9,, k
----------- (3-13)
where 4Ko) represents the wave function evaluated at the nucleus. The energy levels of a system with one unpaired electron s=j' and one nucleus
with i=,, can be derived using equation (3 - 13) by replacing the magnetic
moments by their corresponding operators
-g 092 AN, ý'- gnONfz
A 8n -9 ß9NßN 1 V(O) 12 ýz I�-------(3-14)a 3
hA09 Z Iz ------------- (3 - 14)b
where AO is called the isotropic hyperfine coupling constant Since the eigenvalues m, of S. are : t! and 1, are m, =i! , there will be four possible 22
spin states of the system with one electron and one The four spin states are.
a., (x. > cc"P. > O. 'a. > p"O. >
Then the energies of these states are:
nucleus (hydrogen atom).

38
wa, lax =I gpH +1 hAo ---------- (3 - 15)a
24
+ig PH -4 hAo ---------- (3 - 15)b
-1 gpH +I hAo ---------- (3 - 15)c 24
=-IgPH-! hAo ---------- (3 - 15)d wp. lcý. 24
using the selection rules for the electron spin transitions Am, =±I and ", = 0. We
can draw the states and possible transitions as shown in figure (3 - 4)(74).
3.2.5 LINE WIDTH AND ! HE BROADENING
The line width of the ESR spectra is affected by variouse parameters. Mainly
these are:
a- Parameters due to relaxation time interaction.
1- Spin-lattice interaction.
2- Spin-spin interaction.
3- Spin orbital interaction.
b- Broadening due to microwave power saturation.
c- Broadening due to exchange narrowing.
a. PARAMETERS DUE TO LIFEnME INTERACTION
11- SPIN LA7TICE 112TERACTION
As a qonsequence of the Heisenberg uncertainity principle, the energy levels of
the electron should have a finite width (AE), which can be represented by

39
AEAt_ h-----------
(3-16) 27c
AE- IF hI
---------- (3-17) At 27c At
but:
h- Av = gpAH = AE ---------- (3-18)
thus:
90AH- IT
---------- (3-19) At
, 6H- -I ---------- (3-20) g At yAt
where y, is the electron magnetogyric ratio. Any processes that increase the rate of transition between the two electron spin
states will decrease At and then will increase the line width At is related to time T, and which is called spin relaxation time. T, represent the
coupling of the spin system with its surrounding (lattice) through the random
motion of the moleculesrm.
2- SPIN - SPIN INTERACTION
Spin spin interaction is the measure of the dipole - dipole interaction between
one electron magnetic moment and another electron. The dynamic effect of the dipoler interaction between spins is to cause flipping of the spin. The life time of a
spin in the upper state is controlled by the spin-spin interaction. Spin - spin
interaction alleviates saturation, but it contributes to the life time broadning of the
line(75).

40
3- SPIN - ORBITAL COUPLING
The motion of the electron about the nucleus of an atom creates a magnetic
dipole. This interaction is called spin-orbital coupling and is strongly affected by
the spin-lattice relaxtion time TI. T, is found to be very short in transition metal ions where the spin-orbital coupling is very strong and the line width is very
wide(m.
b- BROADENING 12LM TO MICROWAVE POWER SATURATION
The distribution of electrons between two energy states in thermal equilibrium at
a certain temperature depends on the relaxation values of the average thermal
energy, kj and the energy gap, gpH between the two levels. This distribution
follows the Boltzmann equation :
N' Er N- -
Jý
---------- (3-21)
Where k is the Boltzmann constant and T is the absolute temperature. At room temperature.
0.9984
When the microwave intensity increased the pumping of the electrons from lower
state will increase the quantity 0': and that will affected the spin - lattice Ar
relaxation time(75).
EXCHANGE NARROWING
Exchange interaction occurs when the electrons are exchanged between the
orbitals of different molecules. This phenomenon is a direct consequence of the
Heisenberg uncertainty principle. If there are two species of radicals with two
ESR lines and the electron - spin exchange rate is increased the ESIR lines
41
broaden and finally overiap to become one One. The electron spin exchange rate
is increased proportional to the free radical concentration, The broadening of the
Ines will lead to a single line and to narrowing of the final One. This phenomenon
may occur In Iliquids and in sollids, where the strong electmn exchange In the
solids arises from the overlapping of molecular wave functions. Une narrowing
also occurs, due to delocalization of the unpalred electrons In a molecular orbital.
In a free radical the unpalred electron moves through several atoms in Its
orbitals. This motion will pmduce an averaging of the dipolar interactions and a
One narrowing.
ANDERSON and WEISS atempled to derive a detailed One shape In the case of
strong exchange by using a model of random frequency modulation. This work
predicted a One of LORENTZIAN shape in the centre, falling off more rapidly in
the wings. The change of the line shape from GAUSSIAN to LORENMAN Is
good evidence that exchange narrowing has taken placem.

42
CHAPTER FOUR
EXPERIMENTAL TECHNIQUES AND METHOD
4.1.0 EXPERIMENTAL TECHNIQUES.
4.1.1 311L M SPECTROMETER
In simple terms an ESR spectrometer consists as does any spectrometer, of a
radiation source, sample absorption cell and a detector (M'M. Figure (4.1) shows
a full diagram of the ESR spectrometer. There are two main differences between
the ESR spectrometer and other absorption spectrometers:
I- In ESR spectrometers the radiation source (microwave source) emits
monochromatic radiation with a certain microwave frequency.
2- In an ESR spectrometer the microwave frequency Is fixed and the value of the
applied magnetic field Is sweptrm.
The main Idea of the operation of the ESR spectrometer Is that the, absorption
lines are observed In the spectrum when the separation of the two energy levels
In a given magnetic field Is equal to the quantum energy hv of the Incident
microwave photon. The main parts of the ESR spectrometer are described In the
following sections.
4.1.2 THE MICROWAVE SOURCE
The equation hV =9 Off suggests that any region of the electromagnetic spectrum
can be used, but we want to use the best frequency that can give us a high
resolution and which is practically available. For these reasons microwave
radiation is used in the ESR spectrometers in the x-band range of microwaves
v=9.5GHr and 0-band v= 35GHz cm. The source of the microwave radiation Is the

43
klystron which is a vacuum tube that produce microwave oscillations with a narrow range of frequency. The klystron can be operated In several modes. The
particular mode selected depends on the frequency cavity where the klystron Is tuned so that the ma)dmum absorption of the cavity occurs at the centre of the
mode. For practical purposes the microwave frequency and power need to vary. The frequency of the microwaves produced from the klystron can be varied by the variation of the v ottage applied to the klystron. The frequency of the radiation must be stabilized and for that purpose an automatic frequency control system Is
used. The amount of the microwave power Is controlled by an aftenuator which contains an absorptive elemeW4). The frequency of the microwave oscillation
may be perturbed by the reflected radiation from the system which Is fed by the klystron, So the klystron is fitted with an Isolator which makes the reflected
microwave energy pass only in the forward direction(m.
4.1.3 ItMCAVrrY SYSTEM
The cavity is a box positioned in the gap between the two poles of the magnet, In
which the sample Is fixed. The cavity which Is used In the ESR spectrometers
must be tuned to the klystron frequency. The main use of the cavity Is to
concentrate the microwave power and to separate the two components of the
microwave radiation, electric and magnetic fields since it is needed to put the
sample In the magnetic region, where the interaction between the paramagnetic
samples and the radiation will occur(mm. The cavities which are used in ESR
study may be designed as rectangular or cylindrical shapes. Figure (4.2) shows
the region where the concentration of the magnetic field component of the
microwave radiation is localized. In the ESR system there are reflection and
transmission cavities, The reflection cavities are often used because of their
superior ability to discriminate against klystron noise.

44
4.1.4 MAQNETIC FIELD
The magnetic field which Is used in ESR spedrometry must be very accurate and homogeneous. The high accuracy of the magnetic field require the use of very
sensitive stabilizers with the power supply and highly polished and parallel magnet pole plecesmm.
4.1.5 MODULATION AM PHASE SENSMVE DETECTION
When the magnetic field is scanned through the region of the resonance, the spin
system will absorb a small amount of the microwave energy. The change of
power can be detected by changing the detector output signal. This sensitivity
can be increased by a multistage DC amplifier. Two types of modulation are
employed in the detection of the microwaves. These are (1) source modulation in
which the signal Is amplified and detected at the modulation frequency, where
the amplitude and the frequency of the microwave are modulated; (the modula-
tion amplitude which Is used must be small with respect to the line widthj (2)
magnetic field modulation, Is achieved by two small coils mounted Inside the
cavity and supplied by a 100 kHz wave. The result of the modulation Is a
modulated magnetic field which is superimposed on the static magnetic field (DC
field). when the sample is near or at resonance, a detected signal will be
modulated at 100 kHz. Figure (4.3) shows that as the field varies between H. and
Hbthe detector current varies between 1. and ý The result of this process is that
the first derivative of the signal is obtained as shown In figure (4.4b) and (4.5c)
(M74. M
4.1.6 TEMPERATURE VARIA71ON SETUP
The system which was used to control the temperature of the sample in the ESR
spectrometer is as shown in figure (4.6), it consists of:
I-A liquid nitrogen evaporating circuit.

45
2- A controller and temperature system. The liquid nitrogen Is evaporated with an internally positioned heater. The heater is fixed at the end of a silica tube and the operation Is controlled by an electric circuit and manometer. The temperature variation system Is controlled by a VARIAN variable tempera- ture controller which uses a thermocouple to scan the temperature between 77 K
and 573 K The temperature can be controlled manually and there Is a sensor to
control the temperature to a fixed setting. The evaporated nitrogen gas passes through this controller, first passing through an exchange loop which Is Immersed
in a liquid nitrogen dewar, and then passes over the sample where its
temperature is controlled by the heater and the sensor.
4.1.7 RADIATIQN SOUR E
In this Investigation we have used the following sources for sample Irradiation.
a- X-ray source
b- Mercury tube 150 waft (UV and visible light). The wave length emitted Is
above 300 nm.
c- Mercury tube with hard ultraviolet path filter (5 watt). The fifter path radiation Is
between 300 and 400 nm.
a- X-RAY SOURCE
In our investigation the X- ray source which Is used to irradiate the samples is
made by PHILIPS (no. PW 1050) and can operate with different X-ray tubes, with different excitation voltage and with different target currents. All the samples
where irradiated by X-rays through a rectangular window of dimensions I Omm x 6mm without any fitters. The samples were fixed as near as possible. to the
window, where the distance between the sample and the wall of the X-ray tube Is
5mm.
b- ULTRA VIOL SOURCES.
The ultra violet source used here Is a 5watt mercury lamp using a hard ultra violet path fifter. It Is produced by ULTRA - VIOLET PRODUCTS, SAN GABRIEL, CALIFORNIA The visible and UV source is a 150 waft mercury lamp
connected to a power supply. The lamp Is surrounded by a metal cylinder designed to absorb the heat of the lamp and hence to decrease the heat around the lamp.
4.10 JUE EXPERIMENTAL METHOD
4.11.0 MATERIALS
4. Zl. l ItM ORIGIN. QfjtM SAMPLES
The gum arabic material was collected from HASHAB trees (acacia SENEGAL)
from the KORDOFAN area of SUDAN. The basic constituent components of gum
arabic: D-galactose, L-arabinose, L-rhamnose, and D-glucuronic add have been
obtained from RIEDEL DE HEAN COMPANY, HANOVER, WEST GERMANY,
and WINLABE, UX
4.12 PREPARATION Qf M SAMPLES fo JUE IRRADIATION AM
= MEASUREMENTS
The natural samples of homogeneous colour were selected and were crushed
carefully by mortar and pestle to a fine powder. This powder was then dried in a
vacuum desiccator for several days.
The powder of the material is prepared for X- ray irradiation in a thin transparent
plastic tube of dimensions 12 mm in diameter, 25 mm in length, and 0.5 mm in
thickness. The approximate weight of the irradiated material was about 0.3
grams. The material occupied about 4 mm of the tube height. The residual space
of the tube was filled with paper tissue.

47
The tube containing the material. was fixed directly In front of the vAndow of the X
- ray source. The irradiated material was stirred gently before the ESR
measurements to got a homogeneous irradiated material.
4.2.3 IM FM MEASUREME
The ESR measurements were carried out using an ESR spectrometer (E - One)
manufactured by VARIAN ASSOCIATES. This spectrometer Is controlled by a HP - 9835B computer, a HP 1350A graphics translator, and a VARIAN EPR data
acquisition system. The range of the microwave frequency used was x- band. All
the measurements of the ESR spectra were obtained as first derivatives of the
signal using a 100 kHz modulation frequency. The modulation field used for all the measurements was 2 gauss. The ESR spectra were recorded on tape
cassette. The ESR measurements were carried out on powder samples In high
purtty silica tubes of dimensions 20 cm in length and 3 mm In diameter. For most
of our measurements the tubes were filled up to 3 cm of the tube.
4.2.4 TIM VARIATION Qf IM IRRADIATION IUML
Dry powder of the gum arabic was Irradiated using an X- ray cobalt tube, with 20
mA filament current and 30 W excitation voltage. The same amount of gum was
exposed to the X- ray source for different times running from two minutes to 180
minutes. The powder was gently mixed to distribute the Irradiated material evenly in the powder. The irradiated powder was then transferred to the ESR sample
tube which was carefully marked to locate the material at a given position in the
cavity. The same amount of the powder was used every time for the ESR
measurements.
4.15 JIM DEPENDENT DCCAY.

48
The material which was X- Irradiated for three hours was left In the cavity at
room temperature, to study the decay of signal with the time. The spectra were
recorded several times during 667.5 hours.
4. Z6 MICROWAVE POWER VARIATION.
Samples of gum amble powder were irradiated with an X- ray source using a Co
tube for 10 minutes with 20 mA filament current and 30 I(V excitation voltage. The ESR spectra were recorded at different microwave powers that varied from 0.5 mW to 60 mW.
4.17 TEMPERATURE, VARIATION.
The variation of the material temperature was measured In the range just above
room temperature. The samples under study were irradiated for 10 minutes using
an X-ray source Co tube with 20 mA filament current and 30 W excitation
voltage. The ESR spectra were recorded between room temperature and 120 C.
4.2.8 ItM EFFECT QE UG ON ISHADIATEDIGM ARABIC
The gum arabic material was irradiated with an x-ray source of Co target for 10
minutes using 20 mA filament current and 30 W excitation voltage. The
x-irradiated sample was studied with and without exposure to the mercury lamp.
In the case of the exposed sample, the powder of gum is spread on a sheet of
white paper and placed at a distance of 10 cm from a mercury lamp emit a
radiation with a wave length above 300nm for a time between 0 and 355 minutes. The ESR measurements were made immediately after exposing the material to
the light. The materials were always at the same position, at the same height of
cavity and the same amount of material. Another sample of the gum was
exposed to the mercury lamp for 24 hours with out x-irradiation to find out any
effect of such light on the gum.

49
CHAPTER FIVE
FORMATION AND DECAY QF THE RADICALS LN GUM ARABIC
5.1 THEEFFE IQIE
MICROWAVE POWER VARIATION QMIHE GENERAL
FORM JQF
THE ESR SPECTRUM 9? f jGUM
ARABIC.
The microwave power causes the amplitude of a signal to increase with increase
of the microwave power up to a certain level, after which the amplitude behaves
in one of two ways:
I- The amplitude decreases rapidly and the resonance is said to be homoge-
neously broadened.
2- The amplitude is still nearly in the same level and the signal is said to be
inhomogeneously broadened.
The saturation of various paramagnetic centres giving rise to ESR spectra are
not necessarily the same and depend on the structure. So, the use of different
microwave power levels causes some of the centres to saturate before the
others. So, in this way, we could assign the signal to particular centres(75.7M. A
study of the effect of variation of microwave power, during the measurements of
ESR spectra of x-irradiated powder of gum arabic assists in the analysis of the
spectra. The ESR spectra of gum arabic are very complex, and rather poorly
resolved.

50
5.2 THE VARIATION OF THE MICROWAVE POWER INTENSI &T ROOM
TEMPERATURE.
5.2.1 RESULTS AND DISCUSSION
The relative spin density of the two paramagnetic centres spectral group (1) and (2), has been plotted as a function of the square root of the microwave power as
shown in figure (5.11). Saturation is obtained for the total spin, the spin of the
spectral group (1) and the spin of spectral group (2) at microwave powers of 21.2,37.5,16.2 mW (see table 5.1) respectively. From these results we note that
the saturation of the total spin takes place at an intermediate level to the
saturation of the spectral group (1) and (2). The comparison of the saturation behaviour of the two paramagnetic centres shown for spectral group (1) and (2)
with total relative spin is given in figure (5.1), where the three curves are in a
normalized condition. A similar behaviour is shown by the total relative spin curve
and spectral group (2), but spectral group (1) does not follow the same pattern. An attempt to simulate the total spin With summation of the spectral group (1) and
(2) is undertaken, to see it the spins of these two centres are the only centres
responsible for the total spin or whether there are any other centres. The
normalization of summation of the relative spin for the spectral group (1) and (2)
and the normalization of the total relative spin have been drawn versus the
square root of the microwave power as shown in figure (5.2). The saturation
points are 21.2 and 31.4 mW for the normalization of the total relative spin and
for the normalization of the summation of the relative spins for the spectral group
(1) and (2) respectively. From the saturation condition results, we could see that
the two normalized curves are not the same, so, we conclude that there may be
other centres which we did not to take into account.

51
5.2.2 THE EFFECT QF THE MICROWAVE INTENSI VARIATION
QN THE LINE WIDTH -OF
THE ESR SPECTRA QF GUM ARABIC.
A plot of microwave power variation and line width of the two resolved
paramagnetic centres, spectral groups (1) and (2) is shown in figure (5.3). The line width of spectral group (1) varied from 11.2 to 13.4 gauss. The line width of
spectral group (2) shows a slight change from 22.1 to 22.8 gauss during the
change of the microwave power from zero to 100 mW-
5.2.3 THE EFFE Q_F THE MICROWAVE POWER VARIATION _QN
THE
LINE HAPE OF THE ESR SPECTRUM -QF.
QIM ARABIC.
Figure (5.4) shows various ESR spectra wich are recorded at different mi-
crowave power figure (5.5) shows three different ESR spectra which are
recorded at different microwave powers in order to study how the spectra behave during the variation of the microwave power During the variation of the
microwave power, there is a general observation on the resolution of peaks in the
spectrum, namely at low microwave power all the peaks are better resolved than
at high microwave power. All the peaks still appear for all values of microwave
power used and there is no absence of any peak.
5.3 THE VARIATION QF THE MICROWAVE POWER INTENSITY AT
LIQUID ITROGEN TEMPERATURE
The gum arabic material was irradiated at room temperature. The ESR spectra of
the material have been recorded at liquid nitrogen temperature covering the
microwave power range from 0.7 to 60 mW. Figure (5.6) shows the ESR spectra
of gum arabic recorded at liquid nitrogen temperature. These spectra show a
single broad line in all the microwave ranges studied. This line does not exhibit
enough resolution to explain the presence of more than one line observed at

52
room temperature.
The total relative spin density versus the square root of the microwave power is
as shown in figure (5.7). This plot exhibits a homogeneous bro adening of the
signals which constitute the spectra recorded at liquide nitrogen. The microwave
power intensity at which the signals saturated at liquid nitrogen is about 1.5 mW.
(see table S. I).
5.4.0 RADICAL FORMATION ON GUM ARABIC
5.4.1 POSSIBLE EVE DR IRRA121ATION"nME VARIATION
The possible effect of ionizing radiation on gum arabic may identified from the
work carried out on the component of gum arabic and from studies of the
substances that have the glycosidic link between monomers. The signals which
may be present in the ESR spectra of the monomers of gum arabic may be
present in gum arabic spectra itself. Also, the presence of the 1-3,1-4, and 1-6
glycosidic linkages make possible the scission of these linkages by ionizing
radiation which is followed by radical formation at the scission position. Many
workers have studied the ESR signals of irradiated components of gum arabic:
D-galactose, L-arabinose, L-rhamnose, and D-glucuronic acid.
Dilli and GARNETTm studied the ESR signals of irradiated galactose at room
temperature. They found a doublet signal with 18 gauss splitting and attributed
this signal to the presence of a free electron at C1 or C6. CAVATORTA(M
detected two ESR signals when he irradiated a solid form of galactose at room
temperature in the presence of air. One of them is a doublet which may be
attributed to the presence of a free electron at CI (w, the other radical is a triplet
signal, which may be interpreted by location of the free electron at C5 (N).
NIKITINE(si) has found a doublet ESR signal when he irradiated a polycrystallne

53
galactose at 77 K. This doublet is present when galactose is warmed to room temperature and is attributed to the presence of a free electron at C1. NIKITINE(" has studied the ESR spectra of an irradiated aqueous solution of D-galactose at 77 K and found two signals, one a doublet and the other a triplet. The triplet signal is attributed to the presence of the free electron at C4.
DILLI and GARNIETT(4e) have detected an ESR signal from irradiated polycrystal- ine arabinose at room temperature; a doublet signal with a 17 gauss splitting. This signal is attributed to the presence of a free electron at C1 or C6 of the
pyranose ring. NADZHIMIDDINOVA and SHARPATYIPP detected a doublet ESR
signal when they irradiated an aqueous solution of arabinose. They attributed this
doublet to the presence of a free electron at C1. BALEY(81) detected a doublet
ESR signal in irradiated polycrystaline arabinose. He attributed the doublet to the
presence of the free electron at C1, C2, C3, or C4. NIKITINE(51) also found two
ESR signals in irradiated polycrystaline arabinose at 77 K. One of them is a doublet and the other is a quadruplet. The doublet is attributed to the presence of the free electron on C1 and the quadruplet to the presence of the free electron at C4. The ESR signals detected in arabinose at room temperature are a doublet
and a triplet of quadruplet with hyperfine splitting for the latter signal is 27,13
gauss. The study of the ESR signals of irradiated frozen aqueous solution of
arabinose at 77 k by NIKITIN(5m, shows a doublet signal with hyperfine splitting
equal to 31 gauss and a quadruplet with hyperfine splitting of 15 gauss.
BAILLY(81) has found a doublet signal in irradiated polycrystallne L-rhamnose at
room temperature and attributes this signal to the presence of the free electron at
C1,2,3, or 4. SAMSKOG(w found an ESR signal consisting of four lines when he
irradiated a single crystal of rhamnose at 67 K. This signal was also detected by
SAMSKOG(m) and PANASYUK(em who attributed this signal to the presence of a
free electron at 04. A doublet of doublet signal has been detected by

54
PANASYUK(" and SAMSKOG(50. They interpret this signal as due to the
presence of the free electron at C2, C3, or C4 and arises from the interaction of the free electron with two beta protons one of them is the proton of OH group. A
doublet signal is detected by SAMSKOGM at 77 K and this radical is assumed to be located on CI, C2, C3, or C4. Another radical was detected at 77 K, that is a doublet of quadruplet(". This radical is attributed to the presence of the free
electron at C5. The doublet, doublet of doublet and doublet of quartet signals are found as stable signals in rhamnose single crystal at room temperature.
BALAZS et. AL. rA, NOZAWA et al. (m irradiated D-glucuronic acid at room
temperature. The ESR spectrum of this material shows a singlet signal. BALAZS
et al. (m attribute this signal to the presence of the free electron at C5, where the
radical would be stabilize by resonance interaction with the carboxylic group.
The effect of ionizing radiation on carbohydrates which have glycosidic linkages
between the monomers has been studied by many authors. PHILLIPS(84) in his
study of the solid carbohydrates with a glycosidic link, has found the dominant
scissions are in the glycosidic linkages. FRITSCH(") and WAHBAM studied the
effect of ionizing radiation on pectine powder (which consists of polygalacturonic
acid) and found a scission of the glycosidic bond. LOFROTN(97) has mentioned
that the major part of the radiation damage in molecules of sucrose, maltose and
trehalose is in the glycosidic bonds. GLEGG(65) and DZIEDZIELAPIO) found a
scission of the cellulose chain when it is irradiated by ionizing radiation. BAUGH(w, ARTHURm, and CHIDAMBARESWARAN(8% studied the ESR spectra
of irradiated cellulose with different levels of crystalline order and found a triplet
in dry cellulose and a triplet and two triplets (signal with five lines ) in others
which contain moisture. They attribute the triplet to the abstraction of the
hydrogen from C5 where the free electron will interact equally with the two
55
beta-protons on C6. The five line signal is attributed to the presence of the free
electron at C5 and C6 at the same time where each one will interact with the two
protons located on C6 to give two triplet signals with the same g-value and different hyperfine splitting. BAUGHow has also found a singlet signal additional to the triplet and two triplets. He attributed this singlet signal to the presence of the free electron on the oxygen atom in the cellulose chain attached either to a C1 or C4 atom.
The study of the ESR signals of the irradiated starches by ADAMIC" at room temperature shows a doublet signal immediately after irradiation. The annealing
of the signal at room temperature gave a singlet. The doublet signal is interpreted
by adamic as the location of the free electron at C5 by the cleavage of CHOH
from C5. The singlet signal is interpreted as a signal with unknown hyperfine
interaction where no stable radical is to be suggested in the starch molecule.
RAFI(") and HENDERSON(" interpret the signal detected immediately after irradiation of starch as a doublet that arises from the interaction of the free
electron on C1 with a beta proton on C2. The singlet signal which was detected
after annealing is attributed to the formation of the radical presented in structure
[2.421.
From the above investigation one can predict the possible ESR signals which
may arise in the ESR spectrum of irradiated gum arabic.
A doublet signal is present in galactose at room temperature (48,11-70 and at 77 K(51.5m and it is present in arabinose at room temperature (91.4a. rl) and 77 K(51.5M. It is
also present in rhamnose at room temperature(al). At 77 K(N) a doublet signal is
also detected in irradiated starch at room temperature (03.84.9M. A triplet signal was
found in galactose at room temperaturerm and at 77 K(&%. The triplet signal was
also detected in cellulose at room temperature (0,09,89). A quadruplet signal was
found in arabinose (4&51). A quadruplet signal also was detected in rhamnose at 67

56
K and at room temperatureomm. A doublet of a doublet signal were found in
rhamnose at 67 K and at room temperaturem. A doublet of a quadruplet signal
was found in rhamnose at 77 K(". Superimposed signals consisting of five lines
were found in cellulose at room temperature (wee. ". A triplet of a quadruplet signal
was found in arabinose at room temperature(51). A singlet signal was found in
glucuronic acid at room temperaturem-em in cellulose(" and in starch at room
temperaturem").
From these investigations one can suggest the total signals which may be
present in the ESR spectra of irradiated gum arabic at room temperature. A
doublet signal is found in all monosaccharides at any temperature. A triplet signal
is also found at room temperature. A doublet of doublet and doublet of quartet
may also found at room temperature. A triplet of a quadruplet may also be
present. Two triplets with different splitting may also be found. A singlet signal
may also be present in the ESR spectra of gum arabic. From the above studies
one can suggest a very complex ESR spectrum of gum arabic that has been
irradiated at room temperature.
5.4.2 TARIATION OF IRRADIATION -T-IME
5.4.3 INTROLDUCTION
The free radical concentration is not a linear function of dose. SNIPES(911,
ROTBLANT(m, MULLER P&94), and CONGER(w, have shown that for many
organic solids, the dose response curves are often be described satisfactorily by
the equation:
dC ai = kC--kC -----

57
where C is the radical concentration, D is the dose, k is the rate constant of the
radical formation, and C- is the saturation radical concentration. The integration
of equation (1) yields the expression:
C= C_(I -e -")
SNIPES(91) explained this equation in one of two ways. (1) The radicals are
produced at a rate that decreases with increased concentration, (2) Radicals are
produced at a constant rate and are simultaneously destroyed at a rate increasing with increased concentration, where at saturation the formation and destruction of the radicals are at the same rate. MAGEW and SAMUEL("
proposed a non random distribution of radicals in irradiated water. They
proposed that these radicals are formed in small increments of volume called
spurs which are isolated one from another. The concentration of the radicals
within a given spur decreases with time as a result of two processes,
recombination and diffusion. SMITH and JACOBS(w have proposed that the
radicals which are formed in irradiated polyethylene are formed in isolated
spherical spurs. They assumed that the concentration of the radicals within the
spurs are decreased with time due to diffusion-like expansion of the spur. DZIEDZIELAW attributed the decrease of the radical concentration during the
irradiation to the recombination of the radicals. PSHEZHETSKII et al. vow
summarize the possible reasons why the trapped radical concentration decreas-
es with time in the steady state as follows: (1) recombination of the radical, (2)
capture of electrons by radicals and other charge transfer and charge recombina-
tion processes and (3) transfer of excitation energy from the environment
resulting from the desiccation of radicals. WAITEVOI) has stated that two particles

58
captured one another when they have approached a distance such that their
Coulombic binding energy exceeds kT, where k is the BOLTZMANN constant
and T is the temperature of the media.
5.4.4 RESUL AND DIASCUSION
The ESR spectra of x-irradiated gum arabic have been studied at various doses
in relation to the irradiation time which varied between zero and 180 minutes. The spectra recorded at different doses are as shown in figure (5.8). The
measured total relative spin with respect to irradiation time is as shown in figure
(5.9). This relation shows a slight tendency to a saturation condition after 120
minutes of irradiation (see table 5.2).
A study of the behaviour of the radical formation of spectral group (1) and (2)
which could be assigned from the decay studies is presented. A relation for
relative spin for spectral group (1) and (2) and the irradiation time are shown in
figure (5.10). where spectral group (1) showed a saturation which started after
approximately 90 minutes. spectral group (2) shows an obvious saturation which
started after 120 minutes irradiation time (see table 5-2).
5.4.5 TUZ EFFECT QF THE IRRADIATION71ME -Q-N-
THE LINE-WIDTH
Q-F SPECTRAL GROUP LU AM 0
A relation between line width and irradiation time of the two spectral group (1)
and (2) may be seen in figure (5.11). This relation shows a slight increase in the
line width for the two radicals. The line width of spectral group (1) has varied from
11.5 to 14 gauss and the line width of spectral group (2) has varied between 22
to 24 gauss, during the same interval, from 2 to 180 minutes (see table 5.3).

59
5.4.6TMEFFE OF IRRADIATION IM ON TIZ 9-VALUE OF
SPECTRAL ROUP W AM 0
A relation between g-value and irradiation time of the two spectral group (1) and (2) may be seen in figure (5.12). This relation shows a steady g-value during the
increase of irradiatin time. g-values of the spectral groups (1) and (2) are 2.0064
and 2.0054 respectively (see table 5.3).
5.4.7 THE EFFEC OF THE VARIATION _QE
IRRADIATION: [Mg QN
THE LINE SHAPE. Qf THE M SPECTRA OF Gum ARABIC,
figure (5.13) shows various spectra of irradiated gum arabic, recorded at various
times of irradiation. These spectra are modified in the y-direction. The formation
of all the different peaks which comprise the ESR spectrum of gum arabic can be
observed at low irradiation time (2 minutes). Those peaks which were observed
at low doses show better resolution than the others which were observed at
higher doses. During the increase of irradiation time from 2 minutes to 90
minutes figure (5.8), the peaks could still be definitely assigned but after longer
times of irradiation the peaks started to be overlapping.
-QL 5.5 DECAY
JQEF THE EM SPECTRA OF W ARABIC AT ROOM
TEMPERATURE.
5.5.1 THE DECAY. Qf THE RADI!; ALS
LOFROTH(100 and HERAK et al. vom have mentioned that the transformation of the
radicals by migration or by recombination due to diffusion of the radicals are the
main processes by which the ESR signals of the radicals decay. FLORIN and
WALL(sm mentioned that oxygen will react practically with any organic radical and
form a non radical product and the presence of moisture usually facilitates

60
diffusion, which accelerates the decay of radicals. The transformation of the
radicals induced by irradiation of cycloamylose has been studied by
PHILLIPS(104.104. He attributed the decay of the radical formed on the oxygen of the glycosidic linkage -C-0. to the oxidation processes, in the presence of water, to form a gluconic acid. BAUGH(loe) studied the radical-radical reaction mecha-
nisms in irradiated polycrystallne cycloamylose hydrates. The study of the end
product of carbohydrates obtained after hydrolysis led them to propose that the
migration of the CI, C4, C5, and C6 radicals to more stable radicals are the main
processes in radical transformation. MADDEN and BERNHARD(, " studied the
thermally induced free-radical reactions in alpha-D-glucopyranose single crystal. By considering the two main end products, arabinose and 2-deoxydbose they
propose a radical reaction by which the C6 radical (detected at 77 K) migrates to
the CI radical at room temperature. The annealing of the material for 24 h at
room temperature leads to migration of the CI radical to C2 radical directly
without scission of the pyranose ring. They proposed another mechanism by
which the CO group is abstracted from the pyranose ring. The loss of H20lead to
migration of the C2 radical to C3. MADDEN and BERNHARD(lom have studied the
reaction mechanisms of free radicals formed in irradiated methyl-alpha-D-glu-
copyranoside single crystals after warming from 77 K to 320 K. Upon warming
the material, three kind of free radical reactions have been observed. At 190 K
the primary hydroxy alkyl radical located at C6, migrate to a CS secondary
oxyalkyl radical. Further warming to 230 K causes the migration of a C5 radical to
a primary hydroxyalkyl radical located at C2 opening the pyranose ring. The C2
radical at 320 K, abstract a hydrogen from C5, reforming the C5 secondary
oxyalkyl radical. Another possible route for the migration of the C2 radical at 320
K is to migrate to C3 by the loss of H2frorn C2 and C3. KOROTCHENKO et al. ('00)
and SULTANKHODZHAEVA et al. (,, O) have studied the conversion of the ESR

61
spectra of irradiated dry starch and dextrane at different temperature. They have
suggested that the conversion of primary radicals at CI may occur with either a
break in the C2--C3 bond and forming the radical at C3 or by breaking the C5-0
bond and forming the radical at C5. HON(111) has found that in the presence of
oxygen, cellulose carbon free radicals will react with oxygen to produce peroxide
radicals which are stable at 273 K. He also mentioned that the peroxide radicals
have an ability to abstract hydrogen from cellulose molecules to produce polymer
hydroperoxide at 273 K. HON(1,2) has also proposed at room temperature a
migration of the radical formed by irradiation at C4 in cellulose to CI to form a
double bond at C4. HON(113) has proposed a possible radical-radical reaction of
the stable radicals in irradiated cellulose as follows:
R02- + R02* ---- -ý inert product
R02. + R. ---- -+ inert product
R. + R. ---- -+ inert product
5.5.2 RESULTS AND DISCUSSION
The material which was irradiated as described in the latter section was fixed at
the same position of the cavity of the spectrometer, throughout the decay time
measurements were carried out. The spectra were recorded several time during
a total period of 667.5 hours. Figure (5.14) shows a sequence of the ESR
spectra of gum arabic recorded at different times during the decay of the spectra
at room temperature.

62
The total number of free radicals is proportional to the area under the absorption
curve. The total relative spin density has been calculated, using a software
program, devloped by the VARIAN company. As proposed by RAM and AGNEL(") that the decay of the radicals in irradiated starch following an
exponential equation.
C= C-e-'
InC-InC_=-4a
where k is the decay rate constant.
t is the decay time. Figure (5.15) shows a plot of relative spin density and decay time measured in
hours. The curves show an exponential decay process. The time at which the
relative spin density decreases to I /e of its original value is 27.1 hours.
A relation between the decay time and the logarithm of the total relative spin
density is shown in figure (5.16). This graph shows three zones of different
decay rate constant. Zone (1) include the region between 0 and 25.2 hours. The
decay constant rate in Zone (1) is 41.24xlO-3hours-1. The decay constant rate in
zone (11) is 5.3x I 0-3hours-1, which covers the region between 25.2 h and 158.0
h. The decay constant rate in zone (111) is 2.034xl 0-3 hours-', which covers the
region between 158.6h and above.
5.5.3 THE EFFECT -Q-F
THE DECA lImE oN THE LINE SHAPE
Figure (5.17) shows the different ESR spectra recorded at different decay times.

63
These spectra are modified in the y direction to show clearly how the signals behave
. During the annealing of the irradiated gum arabic at room temperature
and after 19 hours from the starting decay time, some of the peaks were lost
from the ESR spectrum. The initial peak positions are seen in figure (5.18).
Position (1) (2), (5) and (6) were missing from the latter spectra; positions(7) and (8) overlapped and became one peak; (9) and (10) also overlaped. If we follow
the change of spectra in the decay process, we may see that positions (4) and(7)
are-following the same behaviour during the annealing processes; also (3) and (9) follow the same behaviour during the annealing processes. All these two
groups (4), (7) and (3), (9) failed to follow the same situation during the decay
processes. The positions (1), (2), (5), (6), (8) and (10) appeared to be due to
other paramagnetic centres. Also we note that the peak in position (3) became
wider during the annealing time, and this could be observed after 19 hours of
decay time, so, it could be that position (3) overlapped with one or more than one
peak.
To assign and to specify these two radicals, spectral group (2) is identified by
positions (3) and (9); and spectral group (1) is identified at positions (4) and (7).
Properties of the spectra such as amplitude, relative spin density , line width,
and g-value, as a function of decay, have been studied.
A relation between the peak-to-peak amplitude as a function of the decay time is
shown in figure (5.19). From the two curves shown in this figure we deduce that
the functions for the two spectral group (1) and (2) are in the form of an
exponential decay. The two amplitudes become equal after 187.4 hours decay
time and then the amplitude of (1) becomes bigger than the amplitude of (2) at
subsequent times.

64
The relative spin density as a function of decay time was studied, for spectral
group (1) and (2) as shown in figure (5-20). The relative spin density for the two
spectral group was calculated using an approximate expression.
I =A (AH)
where I is the approximate relative spin density, A is the peak-to-peak amplitude divided by 2. and Aff is the peak to peak line width. The two relations show an exponential decay, but spectral group (2) shows a
more rapid decay than spectral group (1). This could be verified from the
calculation of the time at which the intensity of the two spectral group is reduced
to I /e of its initial value, where it is 37.5 and 25 hours for the spectral group (1)
and (2) respectively.
Figure (5.21) show a relation between the logarithms of relative spin density as
a function of decay time measured in hours, for the spectral group (1) and (2)
respectively. The decay rate constants for the different zones were calculated for
the two spectral group. The decay rate constant of spectral group (1) in zones (1), (2), and (3) are 51.97xl(Y& 8.16xlO-& and 1.65x10⁻³ hours-, respectively. The
decay rate constants of spectral group (2) in zones (1), (2) and (3) are 40.600-3,
7.3xl 0-3 and 2.6600-3 hour&' respectively (see table 5.4). Of these decay rate
constants one can infer that spectral group (1) decay faster than the decay of
spectral group (2) in zones (1) and (2), but in zone (3) spectral group (2) decay
faster than spectral group (I).

65
5.5.4THEEFFEC QfTHEDECA OFIM RADICALS Qh THE
LINE-WIDTH QF TH TWO SPECTRAL GROUP 2130MM
ARABIC FM BEECTRA.
During the annealing of the irradiated gum arabic at room temperature, the line
width of the two spectral group was measured and a plot between line width and decay time is shown in figure (5.22). The graph shows a decrease of the line
width for the two spectral group. The line width for spectral group (1) was decreasing from 13.5 gauss to 9 gauss during the decay interval 0 to 667.5 hours. The line width of spectral group (2) decreased from 23 gauss to 16 gauss during the same interval (see table 5.5).
5.5.5 THE EFFEC Qf THE DECA OF THE RADICALS -QN
THE G-VALUE
OF THE TWO SPECTRAL GROUP IN! MIM ARABIC F. BB SPECTRA.
A relation between g-value and decay time of the spectral groups (1) and (2) may be seen in figure (5.23). This relation shows a decrease of the g-value of the
spectral group (1) and (2) during the variation of decay time (see table 5.5).
5.6 THE DECAY. QF THE RADICALS FORMED QN gM ARABIC 3M
VARIATION -Of
IRMPERATURE
5.6.1 INTRUIDUCTION
The effect of temperature on the decay of the radicals has been studied by many
authers. KURI(114) studied the effect of the temperature on the radical concentra-
tion of several materials, irradiated in powder state, such as cellulose, starch,
arabinose, dbose, xylose, glucose, fructose, sorbose, galactose, sucrose,
cellobose, and lactose, The radicals in all these materials were found to decay
sharply near the melting point. Polyvinyl alcohol shows a rapid decay above the

66
glass transition temperature. For several polymers it was found that the decay
region of the radicals lies around the phase transition region. KURI(115) found that the decay of the polyvinyl chloride radical occurs between 80 and 106() C. UEDA(116) has found that the acrylamide radical decays in the same region. UEDA
atributeed the decay in this region to the approach of a phase transition region. TAMURA017) showed that all radicals in irradiated polytetrafluoroethylene de-
cayed at the melting point of the crystalline region of the polymer. In a number of
amorphous polymers, such as polyisobutylene, natural rubber and synthetic isoprene rubber, polydimethylsiloxane and polypropylene, radicals disappear in
the temperature region of the transition of the polymer from the glassy state to
the highly lowered viscosity(imile).
5.6.2 RESULTS AND DISSCUSION
The ESR spectra of x-irradiated gum arabic at room temperature were measured
at different temperatures. The spectra recorded at different temperatures are as
shown in figure (5.24). The ESR spectra of x-irradiated gum arabic recorded at
various temperatures may be seen in figure (5.25). The spectra in this figure are
modified in y direction. A plot of temperature versus normalized relative spin for
the total spin, and the spectral group (1) and (2) have been drawn in figure
(5.26). From this relation we can note that spectral group (1) decays rapidly between 317 and 327 K. Spectral group (2) shows a gradual decay with temperature that started at room temperature up to 323 K. After this temperature
spectral group (2) decays rapidly. The relative spin density for all curves remain
constant up to 331 K. Beyond this temperature the signal was unmeasurable.
The decay of the total spin is similar to the decay of the radicals in spectral group
(2). After allowing the sample to cool down to room temperature the ESR spectra

67
were recorded and it was found that the signal intensity remained at the same
level observed at 331 K. On raising the temperature again to 373 K the signal
was destryoed completely (see table 5.6).
5.6.3 J±M EFFECT 2E THE DECAY QE ItM RADICALS MM TIM
ELEVATION _Qf
TEMPERATURE. QN M LINE-WIDTH _QE
THE
SPECTRAL GROUP LUAMI&
The line-widths of the spectral group (1) and (2) as a function of temperature has
drown in figure (5.27). The line-width of spectral group (1) kept unchanged at 10
gauss after temperature of 321 K, beyong this temperature the line-width
changed rapidly to 8 gauss. The line width of spectral group (2) is decreased
gradually with temperature. A plot between relative spin density and the
line-width of spectral group (1) and (2) may be seen in figures (5.28), (5.29)
respectively.
5.6.4 THE EFFEC SO
THE DECA OF THE RADICALS WATH THE
ELEVATION OF TEMPERATURE QM THE g-VALUE 9)f THE
SPECTRA GROUP fli AND M
g-values of spectral group (1) and (2) as a function of temperature were drawn in
figure (5.30). The 9-value of spectral group (1) was still unchanged until 324 K
beyond that temperature the g-value dropped suddenly. The g-value of spectral
group (2) decreased gradually with the variation of temperature.

68
5.7 THE EFFIE -Q-F-
MERCURY LIG QN X-IRRADIATED GUM ARABIC
ESR SPECTRA.
Powder of X-irradiated gum arabic was exposed to the light of a (150-waft)
mercury lamp, for different periods of time (doses). The ESR spectra were measured as a function of the light dose, which varied between 0 and 355
minutes of exposing . The line shape of the ESR spectra of the x-irradiated gum
arabic was studied before and after exposure to mercury light.
Figure (5.31) shows the different ESR spectra of x-irradiated gum arabic
recorded after different UV exposure time. Figure (5.32) shows three ESR
spectra recorded for different UV exposure times. These spectra are modified in
the y direction to assist in comparison of the signals. After 85 minutes exposure
time, positions (5) and (6) in figure (5.18) overlapped and became very weak;
positions (9) and (10) also overlapped. If we follow the spectra to the end of the
exposure processes (355 minutes), we note that the positions (5) and (6)
vanished completely. Positions (9) and (10) still appear but in one position, these
peaks were widened.
To study the effect of the mercury light on radical components of the spectrum of
gum arabic, a relation between the amplitudes of spectral group (1) which covers the positions (4) and (7) and spectral group (2) which covers the positions (3)
and (9) as a function of exposure time has been drawn in figure (5.33). The
amplitude of the spectral group (1) is increased as the UV exposure time is
increased, whereas the amplitude of the spectral group (2) is decreased as the
exposure time is increased.
A plot of relative spin density as a function of exposure time has been drawn in
figure (5.34). This plot shows that the relative spin density of the spectral group
(1) is increased as the UV exposure is increased, whereas the relative spin

69
density of the spectral group (2) is decreased as the UV exposure time is
increased. A relation between relative spin density and the decay time at room temperature of the spectral group (1) and (2) was drawn in figure (5.35). Figure
(5-36) and figure (5.37) show a relation between the relative spin density as a function of decay time and UV exposure time of spectral groups (1) and (2)
respectively. A relationship between exposure time and (Al/A2)% (where A is the amplitude),
also, a relation between exposing time and (11/12)% (where I is the relative spin density), in figure (5.38) show that the amplitude and the intensity of the spectral
group (1) has increased linearty, with respect to the amplitude and intensity of the
spectral group (2).
The line width of the ESR spectra of spectral group (1) and (2) has been studied,
as a function of the exposure to mercury light. Figure (5-39) shows the relation between the exposure time measured in minutes and the line width. The relation
shows a steady line width for the two spectral group as the UV exposure time is
increased (see table 5.7).
From the above, we could conclude that the exposure of the x-irradiated gum
arabic to the mercury light could be a useful subsidary technique for distin-
guishing between the different radicals contributing to the ESR spectra of
irradiated gum arabic since the effect of light caused more damage for ESR
signals of spectral group (1) than spectral group (2).

70
5.8 GENERATION -QE
FREE RADICALS &I GUM ARA131C BY MERCURY
LAMP AND ULTRAVIOL SOURCE.
The first law of photochemistry states that. for light to be effective in promoting a
photochemical reaction, it must be absorbed. The low of GROTTHUSS and DRAPEW-un states that only that part of radiation which is absorbed by the
reacting medium can produce a physical or chemical effect. Thus the reactions
based on the absorption of radiation by the organic molecule are of prime
importance in photochemistry of the molecule. When the molecule absorb
energy, the energy of the molecule is raised by a quantity equal to the absorbed
photon energy. By this interaction between the radiation and the molecule, the
molecule will be in the excited state and electrons from bonding and nonbonding
molecular orbital changed to antibonding orbital, and free radical may formed.
Bond dissocation energy of some bonds in carbohydrates are between 4.42 eV
which corresponds to O-H bond and 3.59 eV which coresponds to C-C bonds.
This amount of energy cover the wave length between 2800 to 3446 Ao. (": "
5.8.1 RESULTS AND DISCUSSION.
Gum arabic powder samples have been irradiated at room temperature by a 5W
ultraviolet source. The wave lengths emitted from this source are between 3000
and 3800 AL The ESR measrements carried out at room temperature gave a
singlet signal of 13 gauss line-width and 2.0046 g-value. Figure (5.40) shows an
ESR spectrum of a gum arabic sample irradiated by UV irradiation for 24 hours.
Figure (5.41) shows an ESR spectrum of gum arabic powder irradiated at room

71
temperature by mercury light of wave length above 3000 At The irradiation time
was 4 hours. The ESR spedrum shows a singlet signal with a line-width of 9
gauss and g-value equal to 2.0046.

72
5.9.0 GENERATION OF FREE RADICALS lb! GUM ARABIC BY HEA TREATMENT
5.9.1 INTRODUCTION
It is known that when heat is applied to an organic material, decomposition of the
material occurs and part of the material is converted to char, which is associated with the presence of a free radical. INGRAM and TAPLEYOm has studied the formation of the radicals in a series of carbonized coals. BENNETT(121) has
studied also the radical formation in charred carbohydrates. AUSTEN et al. (124
studied the formation of the free radicals in charred sucrose. These authors have
found that the concentration of the free radical in the above materials is
increased with the increase of the charring temperature up to a temperature
between 793 - 823 K beyond which the free radicals decrease rapidly. They have
also found that the free radical concentration increases with the increase of the
carbon content. HOLA(12* has studied the ESR spectra of charred compounds of
many mono - oligo - and polysaocharides. He found that the concentration of the
free radicals increased with the temperature up to a temperature at which the
free radical concentration dropped rapidly. The temperature at which the
concentration of the free radical reached a maximum is between 773 and 793 K.
All the investigations which studied the free radical formation in carbonized
organic materials indicated the presence of a singlet signal with g-value near that
of the free electron. This value is fixed with the variation of the free radical
concentration. BENNETT(120 and HOLA(in reported a 2.003 g-value for the
charred carbohydrates. The line-width for charred carbohydrates as reported by
BENNETT(12m is 8±2 gauss. HOLA(12m reported a line width for mono-oligo and
polysaccharides between 4 and 7.2 gauss. The line width reported by HINO-
JOSA(124) for charred cellulose is between 6 and 9 gauss and depends inversely
on the temperature of chaning. The formation and the stablization of the free

73
radicals formed by heat at low temperature has been reported by many authors. INGRAM and TAPLEYon, BENNETT et al. (121). COLLINS et al. 025). reported that
the formation of the free radical is associated with the broken bond in the
condensed carbon ring. HIRSCH(12% has shown by x-ray measLftnents that it is in
the region where the radical concentration is growing rapidly that the carbon
atoms begin to cluster in a condensed Ong system. AUSTEN et al-m suggested that the essential mechanism in trapping and stabilization of the unpaired
electrons is the existence of ring clusters containing more than a certain number
of carbon atoms where the ring clusters will possess a high degree of resonance
energy available for the stabilization of the electrons. Also he assumed that the
radicals formed by breakage of bonds round the edge of the carbon clusters or
possibly the radicals originated in the formation of defects in the ring packing.
5.9.2 PREPERATION OF IUJE SAMPLE AND M MEASURMENTS
Dry gum arabic: powder in ESR silica tubes was sealed under vacuum. All the
samples, measured at different temperatures, were the same in weight and
volume. The microwave power which was used was 2 mW and the modulation
amplitude was 2 gauss. All the samples were heated in the ESR cavity during the
ESR measurements.
5.9.3 RESULTS AND DISCUSSION.
The generation of free radicals by heat in gum arabic has been carded out at
different temperatures. Figure (5.42) shows various ESR spectra recorded at
various temperatures and various times of heating. All the spectra show a singlet
signal with g-value of 2.0032 close to that mentioned by Benneft(121) and Hola(12%.
The relative spin density as a function of heating time at different temperatures is
shown in figure (5.43). This shows low relative spin density at temperatures 373,

74
423,473 K and a rapid increase of relative spin density at the temperatures 483,
493,503 K. These temperatures are near the melting point of gum arabic. The
free radicals which are generated at low temperatures remain fixed and steady
when the temperature is returned to room temperature. At higher temperatures
the materials meft for a certain time on heating.
The line width of the signal was measured for various heating times and various
temperatures. A relation between heating time at a given temperature and the
line width of the singlet signal generated by heat may be shown in Figure (5.44).
This figure shows the inverse relation proportion between the line-width and the
heating time at temperatures 483,493,503 K, At low temperature 373,423,473
K it shows nearly constant line-widths. Also these curves shows that the
line-width decreased as the temperature increased. The behaviour of the
line-width with temperature in this case resembles the result obtained by
HINOJOSA(, a, ) who studied the effect of temperature on the line width of a signal
generated in heated cellulose.

75
5.10.1 OPTICAL ABSORPJJON QF -QW
ARABIC
5.10.2 INTRODUC110N.
When an organic molecule is irradiated with electromagnetic waves, the
radiations may be absorbed by the compound; depending on the energy of the incident photon and the energy separation between the ground and the excited state of the molecule. When organic molecules absorb energy in the ultraviolet and visible regions, electron in ((; ), (z) or nonbonding (n) orbitals undergo
promotion from the ground state to higher state, antibonding levels. The
antibonding orbital related to the (a) and (z) bonds are called (CY*) wd (Z*)
respectively. There are no antibonding orbitals associated with the nonbonding
electron. In general a -+ cr* transitions need high energy and shows absorption in
the far ultraviolet between 100 and 200 nm. ic-+n* transition and n-->K* transition absorb in the region of 200 to 700 nm wave length.
Free sugars are not normally found in the aidehydo or keto forms to any
appreciable extent, but exist mainly in cyclic hemiacetal forms, which do not have
(n) electrons. Free sugars are not expected to show absorption beyond 190 nm. The common chromophores encountered in carbohydrate derivatives are the
C=C, C=N, N=N, C=O, C=S, S=Oov). Reducing sugars are difficult to purify and
often contain contaminants and degradation products possessing strong ab-
sorbancies. The only possible chromophore in polysaccharides like gum arabic is
the hydroxy group and carboxyl group of gum arabic, or impurities of carboxyl
and carbonyl group. Hydroxyl and carboxyl groups would have to be ruled out
because they absorb near 200 nm or shorter wave-length(, 21). The carbonyl group
absorbs near 280 nm(129) so it could be responsible for the absorption in gum
arabic. HON(111) mentioned that aldehyds and ketones show relatively weak
absorption band with a maximum between 270 and 290 nm. BEELIK and

76
HAMILTON(m) mentioned that carbonyl groups which are present at C(1) in each
reducing D-glucose unit, or carbonyl groups which are present in D-glucose unit
as a result of oxidative damage, may initiate absorption near 280 nm. Also he
postulated that the glycosidic (acetal) linkages groups at C(1) of nonreducing D-glucose units act as weak chromophores by absorbing near 265 nm. BOS(120) in
his study of glucose, oligomers and polymers of glucose suggested that the
acetal linkages do not contribute significantly to the absorption peak at 265 nm. He proposed that ketonic carbonyl groups are a more likely cause of this
absorption. PHILLIPS(131) showed that irradiated solutions of carbohydrates have
similar, characteristic ultraviolet absorption spectra. A broad absorption occurs in
the region of 240 to 300 nm. The maxima, which may vary for individual
carbohydrates, fall in the region of 260 to 290 nm. LAURENT and WERTHEIKOW
irradiated some polysacchaddes such as dextrin, gum arabic, hyaluronic acid
and pectin. An absorption maximum appeared at 265 nm. HOW") has measured
ultraviolet absorption of cellulose films before and after irradiation, with and
without oxygen. Cellulose films show an ultraviolet absorption at 270 nm.
Irradiated cellulose In vacuum shows the increase of the intensity at this region of
absorption. After irradiation in oxygen UV absorption shows a change of
absorption between 240 and 300 nm and shows an absorption peak at 260 nrn.
This absorption at 260 nm is attributed to the acetal groups(M) or ketonic carbonyl
groupsom.
5.10.3 METHODS.
5.10.3.1 PREPARATION AND IRRADIATION OF GUM ARABIC FILMS.
A highly viscous aqueous gum solution is poured on a plastic sheet to form a
spot of about 5 cm diameter. The material is left to dry in air for a few days. After
the film was dry it could be easily removed from the plastic sheet. The film was

77
put between two stainless steel sheets and transferred on a covered hot water bath and left for a few minutes and at the same time gradual pressure was
applied carefully to obtain a flat film. After that the system was transferred from
the bath and left to cool. The ultraviolet spectrometer sample holder has
dimensions of 50x13 mm with a window of 15x7 mm. A holder was made of thick
card paper. The gum film was fixed on the window of the UV absorption holder
with gum arabic glue. A knife immersed in hot water was used to cut the edges of
the film since the films are brittle and very delicate.
The gum arabic films were irradiated with gamma rays emited from a Cow source
of 5 Ci. The samples were kept in front of the source, normal to the incident
beam, for a specified time. The distance between the sample and the source was
7 cm. The irradiations were carried out at mom temperature in air.
5.10.3.2 ULTRAVIOLE ABSORP11ON MEASUREMENTS.
The ultraviolet spectrphotometer used for measurements on the films was a
PERKIN-ELMER, (model lambda 9) UVNIS/NIR spectrophotometer. The spec-
trophotometer was used to measure absorbence and in the wavelength range
between 200 to 700 nm. The reference was a similar holder without a sample
which had been exposed to gamma rays simultaneously with the sample.
5.10.4 RESULTS AND DISCUSSION.
Ultraviolet absorptions of gum arabic films were measured before and after
gamma irradiation at room temperature. These spectra may be seen in figure
(5.45) Both spectra show an absorption that starts below 200 nm to above 400
nm. There is an absorption peak at 276 nm. This peak shows an increase of
intensity after irradiation. The centres which cause the absorption in the

78
unirradiated gum films could have grown in number after irradiation. It is known
that the groups which may absorb near the region of 276 nrn are the carbonyl
groupsomn" or the glycosidic (acetal) groups.

79
CHAPTER SIX
6.1 IRRADIAIION -OF
THE COMPONENTS -Q-F-.
QLM ARABIC
6.1.1 -RESULTS
AND DISCUSSION
6.1.2 D-GALACTOSE
Figure (6.1) shows the ESR spectra of irradiated D-galactose, recorded at
various microwave powers. During the recording of the spectra we got the best
resolution of the spectra at low microwave power equal to 0.5 mW which may be
seen in figure (6.2). The higher intensity and better resolution signal shown in
the spectrum show a triplet signal of intensity ratio (1: 21). The hyperfine splitting
of this signal is 21 gauss; and located at a g-value equal to 2.0032.
The spectrum obtained at 10 mW microwave power as shown in figure (6.3)
shows the higher intensity spectrum is a doublet signal. This signal shows a hyperfine splitting of 17 gauss and g-value equal to 2.0037. This spectrum
obtained at 10 mW resembles the spectrum obtained by CAVATORTA et al. (M
where he analyzed the spectrum by two signals, doublet and triplet. The doublet
and triplet signals have been found in many monosacchaddes. It is found in
glucose as obtained by BAUGH et al. (w, where the doublet has a hyperfine
splitting of 20.5 gauss and g-value equal to 2.003, where the triplet has a
hyperfine splitting of 29.5 gauss and g-value equal to 2.0025. NIKITIN(51) has
reported that the monosaccharides which he has studied such as glucose,
galactose, ribose, mannose, and rhamnose, have a doublet signal with hyperfine
splitting equal to 15 gauss.

80
6.1.3 D-GLUCURONIC ACID
Figure (&4) shows the spectra of irradiated D-glucuronic acid recorded at different microwave powers. These spectra show more than one radical exists in
the spectrum. The best resolved and highest intensity signal can be seen in figure (6.5) where the spectrum recorded at 0.5 mW microwave power consists of a single line with 9 gauss line-width and g-value equal to 2.0042.
6.1.4 LARABINOSE
Figure (6.6) shows the ESR spectra of irradiated L-arabinose measured at different microwave power. During the variation of the microwave power the best
resolved spectrum is measured at 0.5 mW microwave power as can be seen in
figure (6.7) and is a complex spectrum. On comparison of our spectra with those studied previously we note that the closest observation to ours is that
which is given by NIKITIN et al. (51) who measured ESR at room temperature.
NIKITIN(w) has proposed two radicals in arabinose at room temperature, One of them is a doublet signal with 15 gauss hyperfine splitting and triplet-quadruplet
has a hyperfine splitting of 26 and 13 gauss for the first and the second splitting
respectively. We obtained the doublet signal with hyperfine splitting of 14.5 gauss
and g-value is 2.0057. From the triplet-quadruplet signal we could distinguish the
triplet splitting of 33. gauss.
6.1.5 L-RHAMMOSE
The ESR spectra of irradiated L-rhamnose at different microwave power are
shown in figure (6.8). The measurements showed a best resolved spectrum at
microwave power 0.5 mW as may be shown in figure (6.9). On comparison of
our spectra with that recorded for a single crystal of irradiated rhamnose in
SAMSKOG(" and PANASYUK(" we could distinguish three different radicals.

81
Two of them are well resolved and the third one is weakly resolved. Radical (1) doublet with hyperfine splitting of 11 gauss may be compared with 10.5 gauss measured by SAMSKOG(w, and II gauss. as is recorded by PANASYUKMM. Radical (2) doublet with hypeffine splitting of 33.5 gauss may be compared with 35 gauss as it is recorded by SAMSKOG(", and 38 gauss as it measured by PANASYUK"m. The g-value for the radicals (1) and (2) equals 2.0037. The third radical which consists of doublet-quadruplet as detected by PANASYUK(M is not measurable in our case.
6.2 SIMULAInON QIF THE ESR, SPECTRUM. QF AM ARABIC BY MIXING
THE CCMSTITUEbIT SUGAR : In this section we intend to simulate the ESR spectrum of natural gum by mixing
of the material constituents of the natural gum.
6.2.1 CONSTRUCTION, QF THE SYNTHETIC QM ARABIC AND RM
MEASUREMENTS
A 0.35 gram powder sample of each component of gum arabic ( arabinose, D-gallactose, rhamnose, and D-glucuronic acid) was irradiated individually by
x-ray from a Co-tube source for 10 minutes (using a 20 mA filament current and 30 W excitation voltage). The same proportion of each material as reported in
natural gum was added successively to simulate the natural gum. ESR
measurements have been carried out on arabinose sugar first. After the addition
of galactose to arabinose the ESR spectrum was recorded again, after that
rhamnose was added to the mixture and again the ESR spectrum was recorded. In the final stage D-glucuronic acid was added to the latter mixture and ESR
spectra recorded. The ESR spectra of galactose, rhamnose, and D-glucuronic
acid individually have been found by subtraction of each of the two spectra of the

82
mixtures using computer facilities. Under the same conditions, natural gum
arabic was irradiated and the ESR spectrum was recorded in order to compare
with the spectrum of the mixture.
6.2.2 RESULT AND DISCUSSION
Figures (6.10), (6.11), (6.12), and (6.13) represent the ESR spectra of the
individual components and the spectra resulting from successive mixing of the
components of gum arabic. Positions 3 and 9 in the ESR spectrum of the natural
gum arabic in figure (6.13)b show the resonance lines ascribed to spectral group
(2) as has been identified in chapter five. In comparison between the two spectra
(natural and synthetic) in this figure we can see that the two positions 3 and 9 are
observable in the synthetic gum spectrum within the limits of errors. These two
positions in the synthetic gum spectrum have originated from the doublet signal
of the arabinose spectrum. The overall line-width of this signal as measured in
figure (6.13)a is 24 gauss where it is 22.5 in the natural material and has the
same g-value of spectral group (2). It is obvious that the height of position (3) in
the synthetic gum spectrum is relatively lower than that in the natural one. That
may be due to the absence of the singlet signal from the synthetic spectrum.
Since there are no glycosidic linkages between the mixed materials in the
synthetic spectrum there cannot be any free radicals resulting from the cleavage
of the glycosidic linkages. Additional signal in the natural gum spectrum may be
due to the rupture by irradiation of these bonds.
Positions (4) and (7) in the ESR spectra of the natural gum figure (6.13)b
represents spectral group (1) as identified in chapter five. In comparing these two
positions (4 and 7) in natural and synthetic spectra we find that the line-width is
the same in both cases and is equal to 12 gauss, but the g-value of the synthetic

83
spectrum line is shifted to lower g-value by 0.0018. It is obvious that the addition
of the irradiated D-glucuronic acid to the arabinose, galactose, and rharnnose
mixture resulted in the lines at the positions 4 and 7 as can be seen in figure
(6.12). So the signal which is represented by these positions could be ascribed to
the singlet of D-glucuronic acid.
Spectral lines at positions 5 and 6 in the ESR spectrum of natural gum are very
weak in the synthetic gum spectrum. By following these two positions from the
beginning of the addition of the material, we may infer that the line at position 5
resulted from irradiation of arabinose and it belongs to the first line of the doublet
signal of arabinose. Une position 6 belongs to the second line of the same
radical. Thus positions 3,5,6,9, belong to the same signal which is probably the
doublet which we identified as spectral group (2).

84
QIAPTER SEVEN.
GENERAL DISCUSSION
7.1 INTERPRETATION _Qf
THE ESR SPECTRA OF X-IRRADIATED GUM
ARABIC.
Through the study of the rate of growth of the ESR signals versus irradiation
dose and by following the decay of the ESR signals at room temperature and decay via elevation of temperature we infer the presence of two distinct centres. We have labeled these as spectral group (1) and spectral group (2). The study of the ESIR signals of UV exposed x-irradiated gum arabic and the spectra of UV
exposed natural gum arabic indicates that UV irradiation stimulated the growth of the signal which is labeled as spectral group (1).
Gum arabic as reported by many authors consists mainly of four major
components: D-galactose, L-arabinose, L-rhamnose and D-glucuronic acid. These four major components during this study have been irradiated separately. The free radicals responsible for the ESR signals in these components have
been carefully studied by us and by others(47-400,111,50 -So, am. Our finding are discussed
in the following.
L. D-galactosO: The ESR spectra of x-irradiated D-galactose powder show two
signals, a triplet signal of hyperfine splitting of 21 gauss and g-value of 2.0032.
The second signal is a doublet of 17 gauss hyperfine splitting and 2.0037
g-value. These two signals were observed by Covatorta et al. (") in irradiated
D-galactose. The doublet signal is attributed to the presence of a free electron at C(1) as mentioned by Baugh et al. (w The doublet and triplet signals were found in
glucose sugar by BAUGH et al. (55). The doublet signal has a hyperfine splitting of

85
20.5 gauss and g-value equal to 2.003. The triplet has a hyperfine splitting of 29.5 gauss and g-value equal to 2.0025 which is attributed to the presence of the
free electron on C(5) by scession of the hydrogen atom and the equal interaction
of the free electron with two protons on C(6). NIKITINSI) has reported that the
monosaccharides. which he has studied (such as glucose, galactose, ribose.
mannose, and rhamnose) has a doublet signal with hyperfine splitting equal to 15
gauss. He attributed a doublet signal to the presence of the free electron on C(l).
2 jgM The ESR spectra of x-irradiated L-arabinose show a doublet , L-arablno
signal of 14.5 gauss hyperfine splitting and 2.0057 g-value. NIKITIN151) has found
the doublet signal and a triplet-quadruplet signal in irradiated L-arabinose at
room temperature. The doublet signal has a hyperfine splitting of 15 gauss which
he attributed to the presence of the free electron on C(1) which interacts with
beta proton of C(2). The triplet of quadruplet has a hyperfine splitting of 26, and
13 gauss for the first and second splitting respectivly. In our case the triplet of
quadruplet signal is unmeasurable.
3, L-rhamnose: The ESR spectra obtained by us on x-irradlated L-rhamnose
powder show two well resolved signals labeled as radical (1) and radical (2).
Radical (1) is a doublet of 11 gauss hyperfine splitting which may be compared
with the 10.5 gauss splitting measured by SAMSKOG(n) and the 11 gauss
recorded by PANASYUK(" for the same sugar. This signal is attributed to the
presence of the free electron at C(l), C(2), C(3), or C(4) and the interactin of the
free electron with the beta proton. Radical (2) is also a doublet with hyperfine
splitting of 33.5 gauss which may be compared with the 35 gauss obtained by
SAMSKOG(a), and 38 gauss obtained by PANSYUK(". The g-value of the two
radicals (1) and (2) is the same and equal to 2.0037.

86
A-. D-glucuronic A"l . On irradiation of D-glucuronic acid, ESR spectra showing one singlet signal of 9 gauss line-width and 2.0042 g-value are obtained. The
singlet signal of the D-galacturonic acid has been interpreted by WILLEMS(M) as due to the cleavage of the C(6)-OH bond or the C(5)-H bond where no hyperfine interaction is to be expected.
The comparison of the ESR spectra of irradiated natural and synthetic gum, made of proportional components of gum arabic shows that the spectral peaks in the synthetic spectrum include lines that resemble the peaks of spectral group (2)
of the natural gum spectrum. The lines attributed to spectral group (2) in natural gum spectra are similar to those of arabinose, particularly the doublet signal In
arabinose which is attributed to the presence of the free electron at C(l)(4k 51). The
spectral peaks of spectral group (1) in natural gum resembles the peaks originating from glucuronic acid, particularly the singlet signal, observable in the
synthetic spectrum.
The work of SMITH(4v, ANDERSON at al. (, m and STEEL and ANDERSON(440
suggests that the constituent gum arabic molecules are connected together with 1-3,1-4, and 1-6 glycosidic linkages. These linkages are distributed between the
gum components as in structures frome 7.1 to 7.8.
X-ray irradiation emitted from a cobalt target has a wave length between 1.7928
to 214 Ao which corresponds to 6915.3 and 58 eV respectively. This amount of
energy is sufficent to break any bond in carbohydrates (see table 7-1).
From the above we conclude that spectral group (1) is a singlet signal. spectral
group (2) consists of a singlet and a doublet. So, there are two singlet signals

87
one of them is spectral group (1) and the other is superimposed with a doublet
signal to form spectral group (2). The interaction of ionizing radiation particularly
x-radiation with gum arabic molecules may break any bond and lead to many
possibilities for radical formation. The possible scessions of the glycosidic linkages in the gum arabic molecule which may give rise to a singlet, doublet,
and triplet signal may be summarized as in reactions from 7.1 to 7.8.
From reaction (7.1) to reaction (7.8), the presence of the free electron on 0. lead
to the formation of a single line where no hyperfine interaction is to be expected
with the neighboring atoms. Also the scession of the C(5)--H bond or the
scession of the C(6)--OH in D-glucuronic acid molecule may give rise to a singlet
signal where no hyperfine interaction takes place with the neighboring atoms. So,
the free radical giving rise to the singlet signal may be attributed in the gum
arabic molecule to a C(1)-O. of galactose, C(3)-O. of galactose as in reaction
(7-1), C(1)-O. of galactose, C(6)-O. of galactose as in reaction (7.2), C(1)-O. of
glucuronic acid, C(6)-O. of galactose as in reaction (7.3), C(1)-O. of rhamnose,
C(4)-O. of glucuronic acid as in reaction (7.4), C(1)-O. of arabinose, C(3)-O. of
galactose as in reaction (7.5), C(1)-O- of galactose , C(3)-O. of arabinose as in
reaction (7.6), C(1)-O. of arabinose, C(6)-O. of galactose as in reaction (7.7) and
C(l)-O., C(3)-O. of arabinose as in reaction 7.8.
Irradiation has been applied to sugars which have the glycosidic linkages such as
starches, cellulose, and other oligomers. The ESR studies have been reported by
many authors. ADAMIC and BLINKm found a singlet signal in gamma irradiated
starch after a long annealing at room temperature. He assumed this signal to be
a doublet with unknown hyperfine splitting. RAM and AGNEL(a). RAM et al. (133)
gamma irradiated starches and many glucose oligomers, and they found two
singlet signals. One of them is obtained immediately after irradiation at room

88
temperature and has a line-width from 24.9 to 26.1 gauss and a g-value between 2.0044 to 2.0050. The other radical is obtained after annealing the material for a few months at room temperature and has a line-width between 8.4 and 9.3 gauss
and g-value between 2.0048 and 2.0061. RAFFI and AGNEL("' attributed the latter radical to the transformation of the C(l). radical to pyroxy radical C(l)-O-O.
OGIWARA(130 has found a singlet signal when he irradiated cellulose material at 77 K and measured the ESR spectra at 77 K and room temperature. This signal has a line-width of 25 to 28 gauss and g-value of 2.003. BAUGH et al. (U) found a
singlet signal after gamma irradiation and ESR measurement of the spectra of
cellulose at room temperature. They attributed this signal to the scession of the
glycosidic bonds between the monomers and the presence of the free electron
on 0 atom of C(l)-O. or C(4)-O. HON(I" found a singlet signal In the UV
irradiated cellulose when the ESR spectra were recorded at room temperature.
This signal has a line-width of 16 gauss and is attributed to the presence of the
free electron on C(l)-O. or C(4)-O. HON(Im has found a singlet signal in UV
irradiated cellulose at 45 C. This signal has a line-width of 16 gauss and g-value
of 2.003. DILLI(13B) has gamma irradiated cellulose and measured the ESR
spectra at room temperature and found a singlet signal. He attributed this signal
to the broadening dipole-dipole interaction between the free electron and proton. HON(111- 11% 139) attributed the singlet signal with 16 gauss line-width to the presence
of the free electron at C(l)-O. or C(4)-O. BALAZS et al. vmo and NOZAWA et al. (=)
irradiated D-glucuronic acid at room temperature. They detected a singlet signal
and attributed this signal to the presence of the free electron at C(5) by scession
of C(5)-H bond or as suggested by WILLIAMSO") to the presence of the free
electron at C(6) by the scession of the OH group from COOH group.

89
The doublet and triplet signals which may be created by the scession of
glycosidic linkages can be followed by the study of reactions (7.1) to (7.8). In
reaction (7.1) the presence of the free electron at C(1) of galactose or C(3) of
galactose leads to the formation of the doublet signal by interaction of the free
electron with the proton of the H atom bonded to the same carbon atom. In
reactions (7.2) and (7.3) the presence of the free electron on C(6) galactose leads to the formation of the triplet signal by interaction of the free electron with two protons located at the same carbon atom, whereas the presence of the free
electron on C(1) of galactose in the reactions (7.2) and and C(1) of glucuronic
acid in the reaction (7.3) lead to the formation of a doublet signal. The scession
of the glycosidic linkages in reaction (7.4) leads to the formation of a doublet
signal due to the presence of the free electron at C(1) of rhamnose or C(4) of
glucuronic: acid. In reaction (7.5) the scession of the glycosidic linkages leads to
the formation of a free electron on C(1) of arabinose or C(3) of galactose which
gives a doublet signal. Also in reaction (7.6) the scession of the glycosidic
linkage leads to a doublet signal due to the presence of the free electron at C(1)
of galactose or C(3) of arabinose. In reaction 7.7 the scession of the glycosidic
linkages leads to the formation of the triplet signal due to the presence of the free
electron at C(6) of galactose and doublet signal due to the presence of the free
electron at C(1) of arabinose. In reaction 7.8 the C(3) and C(1) radical of
arabinose lead to the formation of the doublet signal.
As a comparison between our results and the results on irradiated starches
which were carried out by RAFF103v we note that spectral group (1) in our results
has a line width of 13.5 to 9 gauss during the decay processes while for the
same spectral group, as reported by RAFFI, the line width is between 9.3 to 8.4

90
for different starches. This spectral group is assumed by RAFFI(64) to be a radical located at C-0-0. due to the interaction between the 0. and the C. radical as follows:
C. ---- 02----
C-0-0. (peroxy radical)
Our results show that the line-width of spectral group (2) has decreased from 23 to 16 gauss during the decay processes. As recorded by RAFFP"$) this spectral
group has line-widths of 26.1 to 24.9 gauss and g-values between 2.0050 and 2.0044 for irradiated different starches. HENDERSON(", and RAFFI(") interpret-
ed this spectral group as a doublet signal that arises from the location of the free
electron at C(l) of the starch molecule due to scession of the glycosidic linkages.
The comparison between the doublet of gum arabic and the doublet spectral
group of arabinose during the simulation of ESR spectra of gum arabic by
gradual addition indicate that this spectral group is similar to the doublet of
arabinose. The decay of the ESR spectra of gum arabic at room temperature, or
with the variation of temperature indecates that spectral group (2) is converted to
a pure singlet. The relative intensity of spectral group (2) in the simulated ESA
spectrum compared with the relative imtensity of the ESR spectra of natural gum
show lower intensity of the synthetic spectra of spectral group (2) than that of the
natural spectra. This may be attributed to the location of the free electron on an
oxygen atom due to scessin of a glycosidic bonds. The observations that the
synthetic spectra have no signals due to the glycosidic scession is due to the fact
that glycosidic linkages are not found in the synthetic spectrum. This analysis
supports the hypothesis that spectral group (2) is composed of two superim-
posed signals of a doublet and a singlet. This singlet may be attributed to the
presence of a free electron at C-0. due to scsession of glycosidic linkages.

91
7.2 18RADIATION OF GUM ARA131C WITH ULTRA VIQLEI AND
MERCURY LiGmT.
The exposure of natural gum to ultra violet radiation in the range of 3000 to 3800
As lead to form an ESR singlet signal of 13 gauSS line-width and 2.0046 g-value . The characteristics of this singlet and the singlet identified in x-irradiated natural
gum arabic as spectral group (1) indicate that these two singlets belong to the
same centre. The exposure of x-irradlated gum arabic to mercury light of wave length above 3000 AD showed the increase of the amplitude of spectral group (1)
and slight decrease of the amplitude of the spectral group (2), with relevant
increase of the spin density of spectral group (1) and decrease of the spin
density of spectral group (2). This indicates that mercury light affects favourably
the centre giving rise to spectral group (1) which is already created by
x-irradiation. The slight decay of spectral group (2) may be attributed to a thermal
process. The exposure of gum arabic to mercury light gave a signal of 9 gauss
line-width and 2.0046 g-value. The exposure of natural gum to an ultra violet
source (of wave length between 3000 and 3800 AO) and expos of x-irradiated
gum arabic to mercury light (of wave length above 3000 AO) indicates that the
radiations affected the same centre. The UV with wavelength less than 3446 AO
as well as x-rays carry sufficent energy to dissociate bonds in gum arabic and
c reate free radicals. Visible radiations in the mercury source do not carry enough
energy that may break any bond in gum arabic. The maximum energy in the UV
light source is about 4.14 eV which correspond to 3000 AO. This amount of
energy is sufficent to break the C-C and the C-0 bonds. The C-C bond in gum
arabic molecule is present in the pyranose ring of all sugars. HON(I 121 has
mentioned that scession of C-C bonds in the ring of sugars is not stable, due to
strong and extensive hydrogen bonding in the sugars which will hold both

92
radicals. in close proximity, leading to rapid recombination . The C-C bond is
present in galactose as -C(5)-C(6)H20H, in rhamnose as -C(5)-C(6)H, and in D-glucuronic acid as -C(5)-C(6)OOH which may give rise to free radicals located
at C(5). In all these three sugars a doublet signal due to the interaction of the free
electron on C(5) with one proton of C(5) may take place. The C-0 bond in gum arabic is present in glycosidic linkages between the different monomers which need 4.03 eV to dissociate . This bond may give a singlet and doublet when it is broken. The highest energy of UV light source used is about 4.14 eV. Our
observations show a singlet signal of 13 gauss line-width. The mercury light
which is used here has a wave length above 3000 As which corresponds to 4.14
eV. This ammount of energy can break the bond of the C-C or the C-0 bonds.
The detection of a singlet signal in the UV irradiated gum, and mercury light irradiated gum, lead us to suggest that the stable free radical in these cases is a singlet signal which may be attributed to the presence of the free electron on C(l)-O. of galactose, C(3)-O. of galactose as in reaction (7.1), C(l)-O. of galactose, C(6)-O. of galactose as in reaction (7.2), C(l)-O. of glucuronic acid , C(6)-O. of galactose as in reaction (7-3), C(l)-O. of rhamnose, C(4)-O. of glucuronic acid as in reaction (7.4), C(l)-O. of arabinose, C(3)-O. of galactose as in reaction (7.5), C(l)-O. of galactose, C(3)-O. of arabinose as in reaction (7.6), C(l)-O. of arabinose and C(6)-O. of galactose as in reaction 7.7 and C(l)-o.,
C(3)-O. in arabinose as in reaction 7.8. Also it may lead to the scission of C(5)-H
or C(6)-OH in D-glucuronlc acid as proposed by WILLIAMS084). All these
possibilities lead to the formation of a singlet signal. As mentioned by HOW"
and RAFFI and AGNEL(") the doublet signal which is formed in UV irradiated
cellulose and gamma irradiated starches are converted to peroxy radical (C-0-0. ). In a similar manner the doublet signal which may be formed by ultra
violet irradiation is supposed to interact with an oxygen molecule to form a

93
peroxy radical. According to the above findings it could be assumed that the ESR
singlet signal generated by UV, and mercury light irradiated gum arabic Can be
attributed to the presence of the free electron on the alkoxy radical (C-0. ). This has been proposed by HONVII- 'is. 13" for irradiated cellulose. Another possiblity is the presence of the free electron on the peroxy radical (C-0-0. ). The signal can also be assigned to the presence of the free electron on C(5) of D-glucuronic
acid due to the scession of the C(5)-H bond or to the scession of the C(6)-OH bond of D-glucuronlc acid, where no hyperfine structure would be expected. We favour the proposal of HON (13m and RAFFi and AGNELP4) by which they suppose that the free electron is present on peroxy radical, since exposure of x-irradiated gum arabic to UV light enhance the singlet signal labeled as spectral group (1).
7.3 THE EFFEC Qf HEA QN NATURAL JGUM
Afi STUDIED AY M&
When gum arabic was heated between temperatures 373 to 503 K for various time the observed ESR spectra showed a singlet signal. This signal has a
g-value of 2.0032 close to that observed by BENNETT(121) and HOLP" in heated
charred carbohydrates. The line-width of this singlet varies between 8 and 5
gauss as shown in figure (5.44) and depends on the temperature and length of heat treatment. The value of this line width is in the range of the line widths
reported by BENNET(121), HOLA(123) and HINOJOSA(124) whose results show that
the line-width varies from one material to another and depends on the
temperature at which the material is charried. As we have observed HINO-
JOSA(124) found that the line width of the signal of heated cellulose depends
inversely on the temperature of charring. When the temperature is increased or
the time of heating is increased at a given temperature the carbonization of the
material is increased. INGRAM and TAPLEY(Im, BENNETT(, 2, ) and AUSTEN et

94
al. ('2n have mentioned that the free radical concentration increased with the increase of carbon content. Here are two parameters that affect the line-width,
the free radical concentration and the nature of the material for which the signal is recorded. Our results showed that the spin density increased slowly in the temperatures between 373 to 473 K, whereas at temperatures between 483 to 503 K the spin density increased at a fast rate. This show that above 473 K gum
arabic starts to form radicals rapidly. The formation of free radicals by heat has
been interpreted by INGRAM and TAPLEY(12%, BENNETT et al. (121), and COLLINS
et al-025) as being associated with the break of the bonds in the condensed
carbon rings. HIRSCH(Im has shown via x-ray measrements; that in the region of
rapid growth of the radical concentration the carbon atoms begin to cluster in the
condensed ring system. AUSTEN et al. (, = suggested that the essential mecha-
nism in trapping and stabilization of the unpaired electrons is the existance of
ring clusters containing more than a certain number of carbon atoms where the
ring clusters will possess a high degree of resonance energy avaliable for the
stablization of the electrons.
7.4 THE VARIATION OF THE LINE-WIDTH OF T±M SIGNAL WITH
THE VARIATION QF IRRADIATIQM nM-L DECAY MM
EXPOSURE M HE AND LLL-TR"IOLET RADIATION.
On increasing the irradiation time from 2 minutes to 180 minutes the spin density
of spectral group (1) increased 44 times. At the same time the line-width also
increased from 11.5 to 14 gauss. The spin density of the spectral group (2) also
increased to 44 times during this irradiation period and the line-width increased
from 22 to 24 gauss. The intensity of spectral group (1) kept at 19.3% of the
intensity of the spectral group (2) subsequent to all irradiations. On observing the

95
intensity of spectral group (1) and (2) during a decay period of 188 hours the intensity of spectral group (1) decreased to 1/6 of its original value and the line-width decreased from 13.5 to 10 gauss. When the intensity decreased to
1/13 of its original value the line-width decreased to 9 gauss. The intensity of the
spectral group (2) decreased to 1/9.7 of its original value during the decay time of 188 hours. During this interval the line-width decreased from 23 to 17 gauss,
whereas the line-width decreased to 16 gauss when the intensity of spectral
group (2) decreased to 1/29 times of its original value. The percentage of the
intensity of spectral group (1) to the intensity of the spectral group (2) during the
decay processes was 19.4%, 33.2%, and 42% at 0,188 and 667.5 hours
respectively. The exposure of x-irradiated gum arabic to mercury light led to the
increase of the intensity of spectral group (1) by 1 .1 times during an exposure of
355 minutes. During this interval the line-width stayed fixed at 14 gauss. During
the exposure of gum to UV for the same interval spectral group (2) decreased to
0.72 of its original value and the line-width stayed constant at 22 gauss. The
relative intensity of spectral group (1) to the intensity of spectral group (2) is
20.6% and 31.5% at 0 and 355 minutes UV exposure times respectively. From
the above discussion we can conclude that with the variation of irradiation time
the increase of the intensity of the spectral group (1) and (2) led to a
corresponding slight increase in the line-width. During the decay processes the
decrease of the intensity of spectral group (1) and (2) show also a corresponding
decrease of the line-width. The UV exposure of x-irradiated gum arabic did not
effect the line-width when the intensity of spectral group (1) with respect to the
intensity of the spectral group (2) increased. From the above it is inferred that the
increase of the free radical concentration during the variation of dose gives a little
change in the line-widths of the signals. On the other hand during the decay of
the signals the line-widths clearly decreased, the increase of the intensity of the

96
spectral group (1) with respect to the intensity of the spectral group (2) during the
variation of the UV exposure time did not affect the line-width. MAGE(W and SAMUELPrn have proposed a nonrandorn distribution of radicals in irradiated ice.
They proposed that these radicals are formed in small increments of volume (called spurs) which are isolated one from another. SMITH and JACOBS(") also have proposed that the radicals which are formed in irradiated polyethylene are formed in isolated spherical spurs. The above behaviour of gum arabic under x-
and UV-irradiation may be interpreted in accordance with what has been
assumed by these authors and we may assume the free radicals are formed as
spurs in gum arabic. These spurs are formed such that they are isolated from
each other. The decay of the free radicals occurs within the spurs, so the
line-width changes with the variation of the free radical concentration within the
spurs.
We have three cases for change of line-widths. Case 1: On increasing the
irradiation dose the spin density of spectral group (1) and (2) increased and the
line-widths of the two spectral groups has increased slightly. Case 2: The decay
of the two spectral group led to a decrease in the spin density and led to a decrease in the line-widths of the two spectral group . Case 3: On exposure of
x-irradiated gum arabic to UV, the spin density of spectral group (1) is riased
slightly, but the line width remained unchanged. Spectral group (2) shows a slight
decrease and the line-width kept unchanged. The theory of spin-spin interaction
has been treated by VAN VLECK(14m and by PRYCE and STEVENS(141). The
expresion for the mean square width of the line can be written for the electronic
cases as:
. 0)2 3cos' S(S + I) gB3 r
97
For powder the only parameter in this expression to consider is the mean distance (r), So when the spin density is increased the mean distanse between
the free radicals will decrease and the line-width ( Aff ) will increase. So there is
according to the above equation the spin density as a function of the line-width.
MILLER and ADAMS044 have studied the effect of spin density on the line-width
broadening of the nitroxide radical. They found that with the increase of spin
density the lines broadened and became narrower at even higher spin concentra-
tion. They explain this broadening to electron spin exchange, where at higher
concentration the electron spin exchange is so fast that the time average of the
hyperfine field is close to zem. In our first case when the dose has increased the
line-width has also increased. This increase can be attributed to the increase of
the spin density when no other parameters were involved. In the second case
when the ESR signals intensity decreased at room temperature and the
line-width decreased, the decrease of the line-width may be attributed to the
decrease of the spin density, since there is no any other parameter change
excapt spin density. In the third case when x-irradlated gum arabic was exposed
to UV light the line-width kept without any change since there was no appreciable
change in the spin density. In the case of the effect of temperature on the
spectral group (1) and (2) the line-width of spectral group (1) is decreased rapidly
at the temperature at which the spin density shows a rapid decrease. The
line-width of the spectral group (2) is decreased gradually with the temperature
as the spin density is decreased. The relation between relative spin density and
the line-width of the spectral group (1) and (2) shows non linear relation. This
means that the line-width may be affected by other parameters. These parame-
ters are probably related to the rise of the temperature and the change of the
viscosity of the material. The nature of gum arabic is a glassy materialo).
OSBORN and LEE(G) has studied the viscosity of gum arabic solutions as a

98
function of temperature. They found that the viscosity is inversely proportional to
temperature. They observe the loss of the free radical in the region at which the
glasses material changed to lower ViscoslVek u). From these facts one can
conclude that the rise of the temperature lowers the viscosity of gum arabic and
consequently affects the measruable intensity and line-width of gum arabic ESH
spectra during thermal decay. In the temperature range between 317 to 327 Ka
rapid decrease of intensity and line width has been observed and could be
accounted for by a change in viscosity which takes place rapidly at these
temperature.
In the case of generation of free radicals in gum arabic by heat. The results show
that at low temperatures 373,423K the line-width stay unchanged at values of
7.7 and 7.5 respectively. At 473 the line width is about 8 gauss after 60 minutes
of heating time, beyond that time the line-width starts to decrease. At these three
temperaturs 373,423,473K the spin density shows little response to heat. At the
same time the decrease of the spin density does not make the line width change
by change of the viscosity of the material. At temperaturs 483,493,503K the
line-width shows an inverse relation with heating time and the line-width
decreased as the temperature increased. In the case of generation of free
radicals by heat, the line-width is affected by many parameters. Three parame-
ters changed during the measurements, the spin density, temperature, and the
phase transition of the material. As mentioned above the spin-spin dipole
interaction for the electron and the exchange due to higher spin density may
affect the line-width and broadening may occur. In the case of temperature
increase, the spin lattice relaxation time is expected to decrease as the
expression of KRONIG(143) and the line-width may be broadened also:
99
From this expression and the effect of temperature and spin-spin interaction on relaxation time T1 and T2 respectively, the absorption lines expected to broaden due to higher temperature and higher spin density. The decrease of the line width with the increase of the temperature or the increase of the heating time may be then attributed to motional narrowing. Motional narrowing versus the viscosity of the material has been studied by GRIFFITH et al. 0"), KNOWLIES(145) and also SIMATOS et al. "m have studied the effect of the viscosity on the ESR spectra of nitroxide radical, and they found that the powder form gave broad three lines
which become narrower as the viscosity is decreased. In solids g-factors and hyperfine couplings can be orientation dependent. The powder spectrum is
obtained when the spins are randomly oriented and anisotropic in nature. The
principal axis of the radical assumes all possible angles relative to the magnetic field. The ESR spectrum is expected to be a superposition of all the spectra corresponding to all possible orientations. When a powder or a glassy material has changed to a lower viscosity, the motional rate or tumbHng rate will increase. The rate of tumbling is measred by the correlation time (t), which can be thought
of as being the average time for which the molecule moves in any one given direction. When the viscosity is lowered, the tumbling rate will increase and the
correlation time will decrease and the ESR spectrum become narrwer and better
resolution of the lines will be expected. We may say for our results that when the ESR spectra are recorded at higher temperatures and for longer times of heating,
the viscosity of gum arabic becomes lower and narrowing due to transition of the
material from high viscosity molecular orientations to faster tumbling rate at lower
viscosities will be expected.

100
7.5 SATURATION DUE TO MICROWAVE POWER VARIATION OF THE
2M ARABIC ESR SPECTRA
The ESR spectra of x-irradiated gum arabic recorded at room temperature at different microwave powers ranging from 0.5 mW to 100 mW show that the best
resolved spectra are obtainable at low microwave powers. Line-width broadening
and saturation behaviour at higher microwave power can lead to broadening of the ESR lines. A relation between the square root of the microwave power and the relative spin density of the total spin density and the spectral group (1) and (2) shows different microwave power saturation responses. Spectral group (1) is
saturated at 37.5 mW while spectral group (2) is saturated at 16.2 mW. The
saturation of the total spin is at 20.2 mW. The shape of the curve for microwave
power versus the intensity of the spectra have been compared with the
theoretical ideal homogeneous and inhomogeneous curves given by SIM-
MONS(147) and ZIMBRICK and KEVAN(, "). Our curves show little decrease of the
intensity beyomd the saturation point which indicates that the saturation curve of the total spin density and the spectral groups (1) and (2) follows the inhomoge-
neous broadening. The ESR spectra measured at liquid nitrogen of x-irradiated
gum arabic at room temperature, show a single broad line which indicate the
overlap of all peaks detected at room temperature. This convergence of the lines
may due to higher immobilization of the molecules at liquid nitrogen which leads
to broadening of the signals. Another possibility of the overlap of the signals is
the saturation of some signals at lower microwave power measured at liquid
nitrogen. The saturation at low temperature easily occurs as a result of increase
of lattice relaxation time which also give rise to broader lines. The relation

101
between square root of microwave power ( -TP) and total relative spin density at liquid nitrogen indicates that the saturation occurs at 1.5 mW and the resonance
line are homogeneously broadened.
7.6 OPIICAL ABSORPTION QF GUM ARABIC.
An ultraviolet and visible light absorption has been measred of gum arabic film
before and after gamma irradiation. The results show an absorption at 276 nm,
before and after irradiation. An increase of the intensity at 276 nm has been
shown after gamma irradiatins. The groups which which absorb near the region
of 278 nm are the carbonyl groups('A, 20) or the glycosidic (acetal) groups.

102
CHAPTER EIGHT.
SUMMARY AND CONCLUSIONS.
Gum arabic is being used extensively as a constituent of drugs and food stuffs. This study outlines certain aspects of effects of irradiation and thermal treatment
on such a material. In the present work free radicals have been generated in gum arabic and its four
major components D-galactose, L-arabinose, L-rhamnose and D-glucuronic acid
powders using x-irradiation, UV irradiation and heat treatment. ESR techniques
have been used mainly to detect and study the behaviour of the generated free
radicals. Application of different radiation doses, decay of the ESR spectra, and
the effect of the microwave power suggested the presence of two distinct
individual spectral groups in a complex spectrum of gum arabic.
X-irradiation was used to generate free radicals at various doses up to 180
minutes of irradiation. A relation between irradiation time and spin density of the
total spins for spectral group (1) and spectral group(2) showed an exponential
relation which resembles what has been proposed by SNIPESah), ROTBLANTM,
MULLER(^04), and CONGER(w. Irradiation time versus spin density curves for
spectral group (1) and spectral group (2) showed saturation at 90 and 120
minutes of irradiation time respectively. The general shape of the ESR spectra of
gum arabic show better resolved peaks at lower doses. Above 90 minutes of
irradiation the peaks start to overlap. Overlap of the peaks at higher doses has
been attributed to the higher spin density, where the spin-spin interaction and
spin exchange may take place and may thus lead to a difference in saturation
dose for different signals of the spectrum.

103
The decay of the ESR spectra at room temperature of x-irradiated gum arabic shows two distinct spectral group of radicals (1) and (2) and shows the
transformation of the spectral group (2) to a singlet. The decay of the spectral
groups (1) and (2) follow an exponential equation, which has been proposed for
the decay of starches by RAM and AGNEL(84). The decay of the two spectral
groups (1) and (2) exhibited three different zones of different decay rate
constants. The decay rate constants of spectral group (1) in zones (1), (2) and (3) are 51-97x10-3,8.16xI0-3and 1.65xI 0-3 hours-1 respectively. The decay rate
constants of spectral group (2) in zones (1), (2) and (3) are 40.6xl 0-3 , 7.3x10⁻³
and 2.66xl 0-3 hours-, respectively. Of these constant rates one can infer that
spectral group (1) decay faster than the decay of the spectral group (2) in zones
(1) and (2), but in zone (3) spectral group (2) decays faster than spectral group M.
The decay of the radicals formed on x-irradiated gum arabic with the variation of
temperatures shows two different behaviours of the two spectral groups (1) and (2). A plot of temperature versus relative spin density of spectral group (1) and (2) shows that spectral group (1) decays rapidly between 317 and 327 K.
Spectral group (2) decay gradually between room temperature and 323 K;
beyond this temperature spectral group (2) decays rapidly. The spectrum
becomes very weak between 353 and 373 K and the signals are destroyed
above 373 K.
Mercury light was applied to x-irradiated gum arabic. ESR spectra and depen-
dence of the spin density on UV exposure showed that mercury light affected

104
spectral group (1) and increased the spin density of this spectral group, which reflects that the signal created by UV radiation is of the same nature of spectral
group (1) created by x-rays.
The exposure of gum arabic to mercury light of wave lengths above 3000 Ao
created a singlet signal of 9 gauss line-width and g-value of 2.0046. The
exposure of gum arabic to UV light of wave length above 3000 AO also created a singlat signal of line width of 13.3 gauss and g-value of 2.0046.
Natural gum was heated under vacuum at various temperatures between 373
and 503 K for various times of heating. This resulted in a singlet ESR signal with
a g-vlue of 2.0032 close to that mentioned for heated charred carbohydrates. The
line-width of this signal varied between 8 and 5 gauss depending on the
temperature and length of heating time. The spin density at temperatures 373,
423,473 K show little increase with the increase of heating time. At temperatures
483,493,503 K the spin density increased at a fast rate. The nature of this
radical has been interpreted as due to carbon atoms clustering in condensed
ring systems. and free radical formation when the bond in the condensed carbon
ring is broken.
The ESR spectra of x-irradiated D-galactose, D-glucuronic acid, L-arabinose and L-rhamnose have been studied with the variation of the microwave power. Results obtained were as follows:
2aa-Imctose: The ESR spectra of x-irradiated D-galactose show two signals, a
triplet signal of hyperfine splitting 21 gauss and g-value of 2.0032. The triplet
signal has been attributed to the presence of the free electron at C(5) which

105
interact equally with two protons on C(6) to form a triplet signal. The second signal is a doublet of 17 gauss hyperfine splitting and g-value of 2.0037. The doublet signal is attributed to the presence of a free electron at C(I).
LnenWimoSO: The ESR spectra of x-irradiated L-arabinose show an intense doublet signal of 14.5 gauss hyperfine splitting and g-value of 2.0057. This signal is attributed to the presence of the free electron at C(1) which interact with the beta proton of C(2).
LnMem--nose: The ESR spectra of x-Irradiated L-rhamnose show two well resolved signals labeled as radical (1) and radical (2). Radical (1) is a doublet
with 11 gauss hyperfine splitting and has been attributed to the presence of the free electron at C(l), C(2), C(3), or C(4) and the interaction of the free electron with the beta proton. Radical (2) is a doublet with hyperfine splitting of 33.5
gauss. The g-value of the two radicals is the same and equal to 2.0037.
Pz9fouronic jeW X-irradiated D-glucuronic acid shows an ESR spectrum with
a singlet signal. This signal has a line-width of 9 gauss and 2.0042 g-value. This
signal has been attributed to the scession of C(6)-OH or C(5)-H bond where no hyperfine interaction is to be expected.
In order to simulate the natural gum, components of gum arabic of the right
proportions have been irradiated and added gradually. The ESR spectra were recorded after each addition. A comparison between the ESR spectra of natural
and synthetic gum showed that the lines belonging to spectral group (2) in the
natural gum spectrum are similar to those of araabinose, particularly the doublet
signal in arabinose. The relative intensity of the spectrum of spectral group (2) in

106
the ESR spectrum of synthetic gum is lower than that in the natural one. The fact
that the synthetic gum has no glyoosidic bonds between the monomers has led
us to infer that this singlet may be due to scession of glycosidic bonds and may be of the form C-0. The spectral peaks of spectral group (1) in natural gum
resemble the peaks originating from glucuronic acid, which appear as the singlet
signal observable in the synthetic spectrum.
The decay of the ESR spectrum of irradiated natural gum shows that spectral
group (2) is converted from a doublet immediately after irradiation to a singlet
after annealing at room temperature or during the elevation of the temperature.
From this result and from the comparison between the ESR spectra of synthetic
and natural gum, one can infer that spectral group (2) consists of a singlet and
doublet signals. The doublet signal of spectral group (2) may be converted to the
singlet signal of spectral group (1) by the reaction of the C. radical with the
oxygen molecule (02)
c
------ 21 --- C-0-0.
doublet singlet
The singlet signal of spectral group (2) may be attributed to the presence of the free electron on the 0. atom due to scession of glycosidic linkages. The possible distribution of the free radical in gum arabic molecules to give rise to a singlet is
as follows: C(I)-O., C(3)-O., C(6)-O. of galactose, C(3)-O. of arabinose, C(l)-O.
of rhamnose and C(l)-O., C(4)-O. of glucuronic acid.
The doublet signal of the spectral group (2) may be attributed to the presence of
the free electron on a carbon atom which may interact with the alpha proton to

IM
form a doublet signal. The possible distribution of the free radical in gum arabic
molecule that may give a doublet signal is as in C(I). C(3). of galactose, C(I).,
C(3). of arabinose, C(l). of rhamnose and C(I)., C(4). of glucuronic acid.
Distribution of the free radicals in gum arabic can take the form of isolated spurs. This is suggested thrgh the study of the behaviour of the free radicals during the increase and decrease of the spin density.
The line-widths of spectral group (1) and (2) have been studied during the
variation of the irradiation dose, the decay of the radicals at room temperature
and with the elevation of temperature. The increase of the line-width during the
increase of irradiation dose and the decrease of the line-width with the decay of the spectra at room temperature can be interpreted by the theory of spin-spin
interaction of the electrons and the hypothesis of the distribution of the free
radicls within the isolated spurs. The decrease of the line-width, during the
elevation of the temperature can be attributed to the spin-spin interaction and
motional narrowing. Decrease of th line-width of the signal generated by heat
during elevated temperature or during the variation of the heating time at certain
temperature can be attributed to the motional narrowing.
Ultraviolet and visible light absorption has been measured of gum arabic film. An
absorption has been observed at 276 nm before and after irradiation. The
intensity has increased at this region after irradiatins has been applied.

108
REFERENCES
1 Roy Lester whistler, "Industrial gums", (Academic Prss,
London, 1959).
2 H. S. Blunt, "Gum arabic" (Oxford University Press,
London, 1926).
3 D. M. W. Anderson, 1. C. M. Dea, and K. A. Karamalla,
Carbohydr. Res., 6,97 (1968).
4 R. Taft and L. E. Maim, J. Phys. Chem. 35,874 (1931).
5 R. Taft and L. E. Malm, Tras. Kansas Acad. Sci-, 34,116
(1931).
6 G. E. Osbome and C. 0. Lee, Drug Standards, 19,13(1951).
7 L. F. Gabel, J. Am. Pharm. Assoc., Sci. Ed. 19,838 (1930).
8 M. N. Mooqani and C. S. Narwani, J. Indian Chem. Soc. 25,
503(1948).
9 G. L. Clark and W. A. Mann, J. Biol. Chem., 52,157 (1922).
10 A. W. Thomas and H. A. Murray, J. Phys. Chem. 32,676 (1928).
11 G. Troger, Angew. Chem., 62,42 (1950).
12 A. Szalay, Z. Physik. Chem. 164A, 234 (1933).
13 T. C. Laurent and E. M. Wertheim, Acta Chem. Scand., 6,
678(1952).
14 S. N. Banerji, J. Indian Chem. Soc., 29,270 (1952).
15 C. L. Mantell, "The water-soluble gums" (4pinhold
Publishing Corp., New York, N. Y., (1947).

109
16 J. P. Kieft, Pharm. Weekblad 76,1133 (1939).
17 H. T. Leo, C. C. Taylor, and J. W. Lindsey, U. S. Patent 2,
380,115 (1945).
18 Ropert L., "Handbook of water-soluble gums and resins",
(Mg Graw Hill book company, (1980).
19 L. A. Scholz, U. S. Patent 2,568,369 (1951).
20 W. 0. Walder, Food, 18,86 (1949).
21 J. M. Wenneis, Proce. Flavering Extract Mfrs. Assoc., 47,
91 (1956).
22 C. Johnstone, Mfg. Confection., 19,14 (1939).
23 "The United statesPharmacopla" (Mack Publishing Co.,
Easton, Pa., Vol. 15, P. 13, (1955).
24 G. E. Osborn and H. G. Dekay, J Am. Pharm. Assoc. Pract.
Pharm. Ed. 2,420 (1941).
25 M. T. Leffler, Canadian Patent 401,754 0941).
26 K. Von Neergaared, British Patent 218,323 (1923)
27 P. 1. Smith, Am. Perfumer Aromat., 67,67 (1956).
28 H. F. Wolfe, U. S. Patent 1,983,650 (1934).
29 A. L. Lehninger, "Biochemistry " (Worth publisher, Inc.,
New York 1970).
30 C. Neubauer, J. Prakt Chem., 62,193 (1894).
31 Hawarth, Hirst and Challinor, J Chem. Soc., 258 (1931)

110
32 R. D. Hotchkiss and W. F. Geobel, J. Amer. Chem. Soc., 58, 858(1936).
33 R. D. Hotchkiss and W. F. Geobel, J. Biol. Chem., 115,
285(1936).
34 C. Scheibler, Ber., 6,614 (1873).
35 C. 0 Sullivan, J. of Chem. Soc., 45,41 (1884).
36 C. L. Butler and L. H. Cretcher, J. Amer. Chem. Soc., 51,
519(1929).
37 H. Kiliani, Ber. 13,2304 (1880).
38 H. Kiliani, Ber., 15,34 (1882).
39 P. Claesson, Ibid., 14,1270 (1881).
40 D. M. W. Anderson, and Hirst, J Chem. Soc. (c) 1959(1966).
41 D. M. W. Anderson and F. J. Mcdougall, Food additives and
contaminants 4,2,125 (1987).
42 D. M. W. Anderson and F. J. Mcdougall, Food additives and
contaminants 4,3,247 (1987).
43 F. Smith, J. Chem. Soc. P. 1035 (1940).
44 G. 0. Aspinall, A. J. Charlson, E. L. Hirst, and R. Young,
J. Chem. Soc., P. 1696 (1963).
45 S. R. Challinor, W. N. Haworth, and E. L. Hirst, J. Chem.
Soc. P 258 (1931)
46 C. A. Street, and D. M. W. Anderson, Talanta, vol. 30, NO 1.,
887(1983).
47 M. A. Collins, Nature, 193,1061 (1961).

III
48 S. Dilli and J. L. Garnett, Nature 198,984 (1963).
49 Hisashi Ueda, J. Phys. Chem., 67,966 (1962).
50 E. A. Balazs, J. V. Davies, G. 0. Phillips and M. D. Young, Radiation research, 31,243 (1967).
51 1, V. Nikitin, 1. V. Miroshnichenko, L. 1. Kudryashov, M. E. Dyatkina, and N. K. Kochetkov, Doklady Akademii Nauk SSSR, 206, No. 4,880 (1972).
52 G. A Jeffrey and H. S. Kim., Carbohyd. Res. 14,207 (1970).
53 1. V. Nikitin 1. V. Miroshnichenko, L. 1. Kudryashov, M. E.
Dyatldna, and N. K. Kochetkove, Doklady Akademii Nauk SSSR,
Vol. 207, No. 5,1125 (1972).
54 R. 0. C. Norman and R. J. Pritchett, J. Chem. Soc., B, 1329
(1967).
55 P. J. Baugh, K. Kershaw, and G. 0. Phillips, Nature, 221,
1138 (1969).
57 K. P. Madden and W. A. Bernhard, J. Phys. Chem., Vol. 83,
No. 20,2643 (1979).
58 P. 0. Samskog and A. Lund, Chemical Physics letter, Vol. 75,
No. 3,525 (1980).
59 P. 0. Samskog, A. Lund. J Chem. Phys., Vol. 73, No. 10,4862
(1980).
60 S. L. Panasyuk and 1. V. Yudin, Khim. Vys. Energ., Vol. 18,
Part 5,418 (1984)
61 K. P. Madden and W. A. Bernhard, J. Chem. Phys. 70,2431 (1979).

112
62 Sarah E. Locher, and H. C. Box, J. Chem. Phys., Vol. 72,
No. 2,829 (1980).
63 K. Adamic and R. Blinc, Proc. Colloq. Ampere, 14,780 (1967).
64 Jacques J. Raffij and Jean-Pierre L. Agnel, J. Phys. Chem.,
87,2369(1983).
65 R. E. Glegg and Z. 1. Kertesz, J. Polmer Science, Vol. xxvi, 289(1957).
66 Roland E. Florin and Leo A. Wall, J. of Polymer Science,
Vol. 1, Part 4,1163 (1963).
67 J. F. Gibson, D. J. E. Ingram, M. C. R. Symons and M. G.
Townsend, Trans. Faraday Soc. 53,914 (1957).
68 P. J. Baugh, Oscan Hinojosa and J. C. Arther., J. of Applied Polmer. Scj. Vol. 11,1139 (1967).
69 J. C. Arthur, JR., Oscar Hinojosa, and Verne W. Tdpp, J.
Applied Polym. Sci. Vol. 13,1497 (1969).
70 Alison P. Casarett, "Radiation Biology", (Prentice-Hall,
Inc., (London, 1968)
71 Stewart C. Bushong, "Radiologic Science for Technologists",
(the C. V. Mosby Company, Toronto 1984).
72 S. Ya. Pshezhetskii, A. G. Kotov, V. K. Milinchuk, V. A.
Rogirskii, and V. 1. Tupikov. "EPR of Free Radicals in
Radiation Chemistry,
73 H. M. Assenheim, "Introduction to Electron Spin Resonance",
(Hilger and Wafts LTD, London, 1966).

113
74 J. E. Wertz and J. R. Bolton, "Electron Spin Resonance",
(McGraw-Hill, Inc., 1972).
75 H. M. Swartz,, J. R. Bolton, and D. C. Borg, "Biological
Applications of Electron Spin Resonance", John Wiley and
Sons, 1976).
76 Klaus Ziock, "Basic Ouanturn Mechanics", (John Wiley and
Sons, Inc. j (1969).
77 P. F. Knoles, D. March and H. W. E. Raffle, "Magnetic
resonance of Biomolecules", John Wiley and Sons, (1976).
78 N. K. Kochetkov and M. A. Chlenov, "Radiation Chemistry of
Carbohydrates" Pergamon Press, (1979).
79 P. Cavatorta, P. R. Cdppa and A. Vecli, Int. J. Radiat.
Phys. Chem. 3,483 (1971).
80 M. T. Nadzhimiddinova and V. A. sharpatyi, Dokl. Akad.
Nauk., Vol. 189,909(1968)
81 A. J. Bailey, S. A. Barker, J. S. Brimacombe, D. Pooley and
D. H. Spence, Nature, Vol. 190,259(1961)
82 Y. Nozawa, M. Suzzuki and F. Higashide, Nippon Kagaku
Kaishi, Vol. 1 1,2043(1973).
83 G. 0. Phillips and N. W. Worthington, Radiation Res., Vol.
43,34(970).
84 G. 0. Phillips, F. A. Blouin and J. C. Arthur, Radiation
Res., Vol. 23,527(1964).
85 G. Fdtsch and D. Reymond, Int. J. Appl. Radiat. IsotoP.
Vol. 21,329(1970).

114
86 1. J. Wahba and L. M. Massey, J. Polym. Sci. Vol. 4,
1759(1966).
87 G. Lofroth, and T. Gejvall, Acta Chem. Scand. B Vol. 28,
829(1974).
88 W. M. Dziedziela, J. Rosiak, Proc. rihanySymposumon
Iradiation Chemistry, Vol. 4,439(1977).
89 P. K. Chiclambareswaran, V. Sundaram, and J. Prakash, J.
Polymer Sci.: Part A-1, Vol. 9,2651(1971).
90 Alex M. Henderson and Alfred rudin, Journal of polymer
Science, 19,1721 (1981).
91 W. Snipes and P. K. Horan, Radiation Res., Vol. 30,
307(1967).
92 J. Rotblant and J. A. Simmons, Phys. Med. Biol. Vol. 7,
489(1962).
93 A. Muller and W. Kohnlein, Intern. J. Radiation Biol.,
Vol. 8,121(1965).
94 A. Muller, Intern. J. Radiation Biol., Vol. 8,131(1965).
95 A. D. Conger and M. L. Randolph, Radiation Res., Vol. 11,
54(1959).
96 J. L. Magee, J. Am. Chem. Soc., Vol. 73,3270(1951).
97 A. H. Samuel and J. L. Magee, J. Am. Chem. Soc., Vol. 21,
1080(1953).
98 W. V. Smith and B. E. Jacobs, J. Chem. Phys., Vol. 37,
141(1962).

115
99 W. M. Dzieddziela and J. Rosiak, Cellulose Chem. Technol.,
Vol. 11,261(1977)
100 S. Ya. Pshezhetski!, A. G. Kotov, V. K. Milinchuk, V. A.
Roginskii and V. I. Tupikov, "EPR of free radicals in
radiation chemistry", (1974).
101 T. R. Waite, J. Chem. Phys., Vol. 28,103(1958).
102 G. Lofroth, Acta Chem. Scand. Vol. 121,1997(1967).
103 J. N. Herak, K. Adamic and R. Bline, J. Chem. Phys., Vol.
42,2388(1965).
104 G. 0. Phillips and P. J. Baugh, J. Chem. Soc. (A),
383(1966).
105 G. 0. Phillips and P. J. Baugh, J. Chem. Soc. (A), 387(1966).
106 P. J. Bough, J. 1. Goodall, G. 0. Phillips, C. V. Sonntag
and M. Dizaroglu, Carbohydrate Res., Vol. 49,315(1976).
107 K. P. Madden and W. A. Bernhard, J. Phys. Chem., Vol-86,
4033(1982).
108 K. P. Madden and W. A. Bernhard, J. Phys. Chem., Vol. 84,
1712(1980).
109 K. A. Korotchinko, M. A. Nadzhafova and V. A. Sharpatyi,
Radioblologiya, Vol. 18, No. 5,661(1978).
110 M. N. Sultankhodzhaeva, K. A. Korotchenko, M. A. Yakubova,
V. A. Sharpatyi and P. K. Khabibullaev, PrOc. Tihany Symp.
Radiation Chem., Vol. 5,1079(1983).

116
Ill D. N. S. Hon, J. Polym. Sci.: Polym. Chem. Ed., Vol. 17,
441(1979).
112 N. S. Hon, j. Polym. Sci.: Polym. Chem. Ed., Vol. 14,
2497(1976).
113 N. S. Hon, J. Polym. Sci.: Polym. Chem. Ed., Vol. 13,
2641(1975).
114 Z. Kuri, Y. Fujiwara, H. Udea and S. Shido, J. Chem. Phys.,
Vol. 33,1884(1960).
115 Z. Kuri, Y. Fujiwara, H. Udea, and S. Shido, J. Chem. Phys.,
Vol. 32,371(1960).
116 H. Udea and Z. Kud, J. Polym. Sci., Vol. 61,333(1962).
117 N. Tamura, J. Phys. Soc. Japan, Vol. 15,943(1960).
118 S. Nara, H. Kashiwabara and J. Sohma, J. Polym. Sci.
Part A-2, Vol. 5,929(1967).
119 J. D. Coyle, "Introduction to Organic Photochemistry", P. 3,
John Wiley and Sons, (1986)
120 D. J. E. Ingram, J. G. Tapley, Nature, Vol. 174,797(1954).
121 J. E. Benneft, D. J. E. Ingram, and J. G. Tapley, J. Chem.
Phys., Vol. 23,215(1955).
122 D. E. G. Austen, D. J. E. Ingram, J. G. Tapley, Farad.
Soc. Trans., Vol. 54,400(1958).
123 Olga Hola, Acta Phys. Slov., Vol. 24, Part 2,94(1974).
124 0. Hinojosa, J. C. Arthur, and T. Mares, Text. Res. J. Vol.
43, Part 10,609(1973).
117
125 R. L. Collins, M. D. Bell and G. Kraus, J. Appl. Phs., Vol.
30,56(1958).
126 P. B. Hirsch, Proc. Roy. Soc. A, 1954,226,143 ; Diamond, Thesis
(University of Cambridge).
127 W. Pigman and D. Horton, "The Carbohydrates, Chemistry
and Biochemistry" P. 1378, Academic Press, (1980)
128 A. Beelik and J. K. Harnifton, J. Org. Chem. Vol. 26,
5074(1961).
129 N. S. Hon, J. polym. Sci.: polym. Chem. Ed., Vol.
131317(1975).
130 A. Bos, J. Appl. Polym. Sci., Vol. 16,2567(1972).
131 G. 0. Phillips, Adv. carbohy. Chem. Vol- 16,13(1961).
132 T. C. Laurent and E. M. Wertheim, Acta Chem. Scand-Vol. 6,
678(1952).
133 J. Raffi, J. P. Agnel, C. Bolzot, C. Thiery and P. Vincent,
Starch/starke, Vol. 37,228(1985).
134 D. Williams, J. E. Geusic, M. 1. Wolfram, and L. J. McCabe,
Proc. U. S. Nat. Acad. Sci., Vol. 44,1128(1958)
135 Y. Ogiwara and H. Kubota, J. Polym. Sci.: Polym. Chem. Ed.,
Vol. 11,3243(1973).
136 N. S. Hon, J. Macromol. Sci. -Chem., A Vol. 10,1175(1976).
137 N. S. Hon, J. Polym. Sci.: Polym. Chem. Ed., Vol. 13,
2363(1975).

118
138 S. Dilli, 1. T. Ernst and J. L. Garneft, Aust. J. Chem.,
Vol. 20,911(1967).
139 N. S. Hon, J. Polym. Sci.: Polym. Chem. Ed., Vol. 13,
2653(1975).
140 J. H. Van Vieck, Phys. Rev. Vol. 74,1168(1948).
141 M. H. L. Pryce and K. W. H. Stevens, Proc. Phys. Soc. A
Vol. 63,36(1950).
142 T. A. Miller, and R. N. Adams, J. Am. Chem. Soc., Vol. 88,
5713(1960)
143 R. D. L. Kronig, Physica, Vol. 6,330939).
144 0. H. Gdffith, D. W. Cornell, and H. M. McConnell, J.
Chern. Phys., Vol. 43,2909(1965).
145 P. F. Knowles, D. Marsh and H. W. E. Raffle, "Magnetic
Resonance of Biornolecules", P. 192, John Willey and
Sons(l 976).
146 D. Simatos, M. Le Meste, D. Petroff, and B. Halphen,
"Use for electron spin resonance for the study of solute
mobility in relation to moisture content in model food
systems" P. 319, Academic press (1981)
147 J. A. Simmons, J. Chem. Phys., Vol. 36,469(1962).
148 J. Zimbrick and L. Kevan, J. Chem. Phy., Vol. 47
2364(1967).

Table (5.1): Mcrowave power variation.
Spectral group
Saturation con- dition at
R. T. (mW)
Saturation condi- tion at
L. N. T. (mW)
Total spin 21.2 1.5
T
1 37.5 unineasumble
2 16.2 measurable un

Table (5.2): Irradiation time variation.
Spectral group Saturation con- didbn(minutes)
Total spin 120
1 90
2 120

Table (5.3): Irradiation tim variation.
Spectral group In-ddiation time (minutes)
Line-width (gauss)
g-vaIue
2-180 11.5--14 2.0064
1
2 2-180 22 ---- 24 2.0054

Table (5.4): Decay time variation.
Spectral group
zone ý Decay time interval (h)
Decay rate constant (h-1)
0 ----- 18 51.97xla3 18-----115 8.16xlO-l
m 115----667.5 1.65xlO-3
1 0 ------ 32.5 40.6xlO-3 2 11 32.5--144 7.3xlO-3
1111 144 ---- 667.5 2.66xlO-3

Table (5.5): Decay finx variation.
Spectral group Decay time (hours)
l
Line-width (gauss)
g-value
1 mmý
0--667.5 13.5--9 2.0062-2.0040
1
2 0--667.5 23 --- 16 2.0052-2.0030

tble (5.6): Temperature elevation.
Spectral group Decay temperature
interval (K) Situation
1 317 --- 327 Rapid decay
2 R. T. --323 gradual decay
T
Note: Spectral group (1) and (2) are destroyed completely after 373 K

Table (5.7): Exposing of x-imdiated gum arabic to mercury Ught
Spectral group Exposing time to
mmcury light (minutes)
Line-width (guss)
I 0-355 14
21 0-355 1 22

Table (6.1): ESR signals of sugar component of gum arabic
Hyperfine Material ESR signal splitting g-value
(gauss)
doublet 17 2.0037 D-galactose
triplet 21 2.0032
D-glucuronic singlet (line-width) 2.0042 acid 9
doublet 14.5 2.0057
L-arabinose triplet of quar- 33 gauss of tet triplet splitting
unmeasurable doublet 2.0037
L-rhamnose doublet 33.5 2.0037

Table (7.1): Approximate bond dissociation energy of chemical bonds in som carbohydrates
Bond dissocia- tion EneW (eV) Wavelength
(A*)
0--H 4.42 2800
C--H 4.29 2889
C__O 4.03 3075
C__C 3.59 3446
I

-0000 I I
CONCENTRATION (% BY WT )
I
35
I
40.
I
45 50,
Figure (1.1) Freezing point of gum arabic solutions as a function of concentration. (TAFT and MALM). (4)

26
24
20
Is
14
0L 0
I III II IIII
22
iz
10 0 6
4
IIIIt1 -1
111 46a 10 12 14 16 111 20 22 24 26
CONCENTRATION (9. /IOOcC. )
Figure (1.2) Relative viscosity as a function of concentration (TAFT and MALM). (A)

0 U
>
�a >
A -a �a
CONCENTRATION OF GUM ARA81C SOLUTION (Y)
Figure (1.3) Effect of heating dry gum arabic on the relative viscosity Of its solution (MOORJANI and NARWANI). (8)

PH
260
2 10 12
L' ,,,,,,,,,,,,
170[- w 0 u 4n 5
140
110 I In
8192
0-0-EFFECT OF PH 0-6-EFFECT OF SODIUM CHLORIDE
-1 1111111111 n, maM
1024 128 16 2
CONCENTRATION OF SALT
I
Figure (1.4) viscosity of gum arabic solutions as a function of pH and salts (THOMAS and MURRAY). (10)

ý/ýHx 07 -ox% 0-
1-0 --G/" s --0----G, /
a ý 0 COSH 0 COSH HS 0 rOH HS
L-o -0 I/i IIMII va ýo Aýý R/ R/
0
H0HH -0 R= ýý ný "RH --H
HO-11, C iI if F-i If OH OH Oll
Ho CHZ-OH
HZ0. \
0 >< 0
H H HO-11, c H OH H OH
[Structure 1.1] Possible structure of a fragment of gum arabic (SMITH). (43)

I:. 14 R- -o-GaIp
R
aa ......... -ø---- . n-GpA . i- e-L-Khafr
P-D-Glip 30 N
13 t': - I- ft-D-Calp
t,
. o-GaIp It
H -a-
I ::.. va IS -- II(; IIp . ____ -nG*tp -- g-II. (: t - -- -
II
IC -. ----- R
A I
II
ft.. (; /. A 4-(flk--o. Cp.
f, �I
"L- I(ha
[Structure 1.21 Possible structure, fragment of Sum arabic (ANDERSON). (401

R-*U-G
R 11 uýGý T
AW-A--» G A-A
uR6G G-U*« - G-A-A G-G-UC-R 6.. 4.1
ýI 1
1'* A1
'A-A-G uG G-G--GýG 1R
AW-A G-G G --6 G6AGA u-%9-U«-R 1111
AAI JU 11
RA G-A A-A G-A U4F-- R A-u výN
U-G-G A U-G-G A, G--G-A-A-A, G-G--A-A-A,
GG --U. GA G-U tI-I
Ut Al. UA 11 1t
i f- iII-Itt AA fj AAUAU I
Ao R II AA I A,
[Structure 1.31 Possible structure of gum arabic (STREET and ANDERSON). ('6)
L-arabino, 3% D-. Sgactxlsa L-rhauncise. ,U,
D--glucurcmdic acid,
-= beta 1,3; -> = beta 1,6; ->> = alpha 1,4

Istructmv
Istrvctwv
I **rvc. 2.71
fwuý=' Z. Sl
retr, wtwu 2.31
rfftýtý 2.01
(strioctwe 3.33
catrmccwo 2.61
fsgcýcý 2.91
(structure 2.101 (structure 2.1t) (structure 2.121

(strectwo 2.133
HH
lognmtom 2.161
tmtýtlý 2.191
Eutýtý 2.211
* (strvctww 2.141
Istructwv 3.171
Istrwetur. 2.72)
fxuvctý 2,131
, ---* e-ý%
HO- H* -OH 111 c-c- c-
facr"Cewu 2.14j
(Btr=twm 2.303
(str-t-m 2.231

H
HO
H
OH
2.263
OH
H
H
OH
H
(strwi. c. 2.291
(Utrvctý 7.271
H
OH
H-f' OH OH
lstrwtawo 2.231
OH
H

fwtrvccý 2.291
("Croctwo a. "I
O-CH3
tstrýtý 2ý303
H
fwtýtý 2.331
HO H
tatr-tw. m z. 3t)
H
fatrwtwv 2ý34)
(»tructýwo 2.13) Ist, -t. re 2.361 f. t-t. - 2.371

H
H
H
jmtrýlwv 2.39)
latrw Lure 2.41)
Istrmt. m 2.40)
H
(structure 2.421

H
H
H
tslýlký 2.431
H
Istrectore 2. &4)
And
H
HO--row, - OH H
H,
HO--r OH
(fttrýt. rw 2. "1
H
H
tfttýýtw. 2.471

2
W---, PH
Flaure
4ý
/4
()a ()
(a)
W---. "HCOTO
0
(b)
H
1)1
14
$
I
Ga 1800
(c)
(3.1) Energy of classical magnetic dipole In a magnetic field as a function of the angle 0 between the magnetic field and the axice of the dipole. (a) 0-0 (b) e=any angle between 0 and 180 (c) 0- ISO,

= -L 29AH
]Figure (3.2) Energy level scheme for the simplest system showing ESR absorption W. and Wo represents the energy of the m. -. 5' and m. --'; states respectively.

NO
0
Figure (3.3) Interaction of dipoles arising from electron (id. ) and from nuclear spin (i,,, ) . where a is the angle between the vector r and the applied field H.

IVS I
II*
%I 'I %I 'S
-k'-t-< iz
iT
Figure (3.4) Energy levels of the hydrogen atom at constant magnetic field. The doted lines showes the transitions without hyperfine interaction, where the solid lines shows the allowed transitions corresponding to hyperfine interaction.

iF r -. 1
I:., T-C
NJ
jig I do
LL

()
(b)
(r)
i
11111111 - -� 11111
'Ii 1111111 1 �. '-. ------' I lUll IIIII-III 11111 1111-IIII It
111"liffW9Hý JJJJ FI2!
(41)
(E)
(I)
Figure (4.2) (a) A rectangular microwave cavity. (b) The electric field in yz plane in rectangular
cavity. (c) Magnetic field contours in the xz plane in
rectangular cavity. (d) The cylindrical cavity. (e) Electric field contours on cylindrical cross
section. (f) Magnetic field contours along a vertical cross
section.

. 14! ýw ourput
H
o oi -el H. MA
Figure (4.3) Effect of small amplitude 100 k Hz field modulation on the detector output current.

Lor4ntzian l, n4 shcpes
Hý
Figure (4.4) Lorentzian line shapes. (a) Absorption spectrum. (b) first derivative spectrum.

Go, slion loo shGOOI
(0)
All
, Y-
Figure (4.5) Gaussian line shapes. (a) Absorption spectrum. (b) First derivative spectrum.

Gý
6-
4L
L
U
-a -a
0 �S
0 LP 91, A« lý >
C �I. ' 0. -
- -W Lll-E-: C
Z. w
t Z, W
in
I II I, 1 II 'I
F,
C, 4
r= c l-;
44
rq Z
>4
9 I-
Wo? (U
bp
0
0
44
0 0 iw 00 to -4 10
3: 0
a, L

�-I
0
0w cr -
in 44 "r3 L. 0 rý 4-3
r_ Q) 0U
. r_ u 0)
V) 0
+ Zm 4ý L-,
-ý - (1) cu E CL N
:rS. U) o0
, \Tl r- a r. a) a lio. a a) r. -ý ý03
f/) >- 4J "
0 a) 0) 1- 41
41 U 4j
-- 0- 4ý E (a U
a) 4- (1) 1- 0 cl 0 V) V)
0 0 :3 "u
00
(: I! un uyds aAflelad

44 U) 0 (1)
> "0
0 :3- U)
- () 41 4-$
u (1) C i-- C- F4 0 U) C
(1) 3: C (1) r4 (0 00>
a- C- > 41 - 4j "0
tD - ý; 0- (ö ov 4j ýý 7; S. a)- (0 41
tö ., tý m5 121
In 90 C 3ý- 0) 0 (V .. i
C- 0-4j a .-E r_ 4-) :1 c6 ic C. 0 U) 4. -0 L-
t0 r- 0) c)c " r_
0) to a (0 r. >N (n r to
ý, ZBý ia fu V, (n U) -ý u) a)O+ - 4J (1) L.
Q) 44 30
r"
:3
rý.
CD rl cy) aq r-ý Lq tQ N0
CD C) 0 CD 0C CD 0
0
(Ijun Aje-1'4! q-ie) UTdG 8AT1210H

0
+
+
+
N
ix, 1111-imi --- T--, --r
Go tD ri ri
(ssne2) q: Ipim aulrl
11
D
F]
11
r?
0
a)
0 L U E
a) 4-,
44 .. 0 t-% eý 1-4 (14
0
00
:3 00 00 (4.
(a (a S. L. 41 41 u
'i
04 r- ý V) U) Cl +
a) a)
Ln
00 P4

v- 9. S12 GHz
0.45 mW
1 mw
mw
5 mW
10 mw
20 mW
40 mW
80 mW
100 mw
3388 G II
DPPH
20G
Figure (5.4) ESR spectra of x-irradiated gum arabic. The spectra were recorded at various microwave power. The irradiation and the measurements were caried out at room temperature.

3388
I 1ý
H
v-9.,, i I 2G I/
(a)
(1)
(2)
(b)
(1)
(2)
(c)
(1. )
(2)
i
I -j
-
-
L 10G
Figure (5.5) ESR spectra of x-irradiated gum arabic, recorded at different microwave power. The irradiation and the measurements were carried out at room temperature. (a) measured at 0.45 mW, (b) measured at 10 mW, (c) measured at 100 mW.

3246 G
OPPH
CNs
mw
0.7 mw
5 mW
40 mw
I ioG I
Figure (5.6) ESR spectra of x-irradiated gum arabic. The upper one irradiated and recorded at room temperature with 2 mW microwave power. The other three spectra irradiated at room temperature and recorded at liquid nitrogen temperature at different microwave power,

44 0
0
- 0) 41 E
u ltý
0
00C 014)
00 U) 0
lu 0) S. > 4-J to -ý
>ý 3: XA 4J 0
U) U
a) cr (L) -0 - S. Lcý
0
V) 0 a) E 0 L. a) " ý; 41
a) 0) 0
4») &. rm 0
.2 tö L. Z; cr +
oý U) tö
N
I'.;
w 00
rl (n Go Uýj d C5 C0C0
0
'I ol (Ijun ulds OA! lr'18

3385.5 G,,
v-9.503 GH
2 min.
DPPH
5 min.
10 min.
20 min.
30 min.
ý5 min.
60 min. __j
min.
I 100 minL. -. r r
180 min.
L-20 9
Figure (5-8) ESR spectra of x-irradiated gum arabic. The spectra were recorded at room temperature for different times.

44 ü) rm 0 J., 0
E- 0 0
4. tu 0
(I) (1) V) 00 41
a c 9: 0 (U U
15 S.
E S 41 r. r- W
tu 00
4) 4J 4J 4J L. tz (o to
0 -'
Gu to - -V uw tu tö tu ci
m 4j "" tu
0 CD
(Ijun A-xpj-Ajq-m, ) UldS DATIP13-1 PýI'l
0
0)
. o0 w

8 f1l
+ 4. 0
r-
(0
ul to A 41 -
P4
.- (I a V) :: 3 :ý r. 00
CWO 00
r- -- (a M - ý, " S.
r. uu 0 a) a) .-aa
c .9 (D 41 (1) 0 rn ID 113
41 "ö
0
rZ4
ri
ID III
LD r) ri
(ýpTlesnoll-L)
(I! un A-jejl! qje) Al! su3P uTds 8ATIPI-Od
CD

k0 LO
L F2 r- r- LL7
0
0 �-IC'4 - 41 u 06 a
00
4) el -
(n
4ý 41 Uu M (1)
0 .= -6 EL EL Go
0 to
ý cIr
C flA
0 0 GO F It fn rl 4 rl ri
0 co ID r rl --
00 ID *
ýI . 2-
-4 -4
I..
00
(ssneg ) qlplm au"I

0 0 N
+ I a) a)
V)
0S z
-ý-) -- T
-u w tu E
V) w
0 a)
-a
-a rm c0 (0 0
c3 0 11
tu -z 0
(f) 2 4-, )
00 (U «o 0
1
(0 t (1) ý_ -0
I 0 ýr- in - lýH
LO
4+1 ,II -ý 0 13
M E3. N ro N
NNN
(r -l? , pul 1 vapodkl anivA

338 5.5 G IDIPH,
v-9. SO3 GHz
(a)
(1)
(2)
(b)
(1)
(2) '- --
(c)
I-
(1) 4---J- (2) -
--jo
-- ----0
-, - 4d
L lOG j
Figure (5.13) ESR spectra of x-irradiated gum, irradiated at various irradiation time. The irradiation and the measurements were carried out at room temperature. The three spectra are modified in y direction. (a) 2 min. (b) 30 min., (c) 180 min.
14--

3385.5 I
v- 9-S03 GHz
Oh
19 h
23.50 h
44.50 h
67.5 h
9 5.5 h
163.50 h
188 h
238 h
331.50 h
523.50 h
66 7.50 h
DPPH
20G
Figure (5.14) ESR spectra of irradiated gum arabic recorded at various decay timesat room temperature.

4ý
U
Cl) tu >1 4J
eý (0
0) ý. ' 41
p 41 u 0w
p. '
w I.. 00
4-4
r- cr, 40 1 LD Lri Ir I T
cl I +- 0
co
(Ijun A-zei, 41q-m) A: t! SUOP ulds aAlIP10-1 JR-401

a 0
ý9
CD E
a) 41
00 0
I
M
(a
0 T;
.1
0u (0
.a
-
%D
00
U) v C., rq
(j! un A-it--ij! q-ip) ujdý-, It101 JO u'lll! -"20rT
0 0

3385.5
v-9.503 CH z DPPH
(ci)
(1) *----1
(2), (-- - ---- - --lo
(b)
(1) 4---
(2) -- -1p
C
(1) t- --I. IOG
(2) LL----I.
Figure (5.17) ESR spectra of x-irradiated gum arabic, recorded at various decay time at room temperature. The spectra are modified in y direction (a) recorded immediately after irradiation, (b) recorded after 95.5 hours of irradiation, (c) recorded after 667.5 hours of irradiation.

V-1
ý, - T-
L. 0
lr--ý r-- a, HO
u 3:
0 93 :ý r= Z 000
a
0) -X 41
(0 Q) 41 1- Cu
10 U)
0 (D 4J
0
0 (1) u
.0 =e a) V) m L. w C: rl
00
LO
00 44
CY)

>1 tu u W "0
0
0
4) U
(C
U) -.
00
00 00
to 4ý 4, (1) uu
0) (1)
o (f, En
-14 a) m r= El (1)
. - M41
0' '-4
w L
00
F-Moo 1- rl cn ro i- Lo Lf) * r) r'l -
(ITun A-xe-ijTq-ip) apnITidwe )jr? ad-oj->[eOd

(puesnoq. 1) (I! un Al! suap uyds aAjjPj3'tl

W 0
2 9)
r. 0
to
(n tö
a. Erj eý ý
00 Lý Lý
00 00
41 4ý Euu
4-1
00 L) Cl +
N
CD
uids aAllela-I JO "MIll"Ol

10
to
4.
C 1-1 0 1(14
.- 1-1 ý 41 u cl a r- =) :; :300
U) 4. " L.
00 00
0 U) tu tu
41 4J L) u
E 41 Q) Q) 10 r- 06
41 3 V) U)
I %-4
0)
IIII. III. =0 LTý Lo *(q Fq 0 cn 00
(ssneg) qIPP"

0 +
0) E
r- ID Cl c q CD NN
+
0+
+
+
"1-
0 0
cö
4. M c0 (ö
4 -Z r= 0 zi "
0 () w zi c3
41 ý le ,? -,
(Z
0
+
T---T---T--T--l 2gaN CD 0q NNN
0
a) " r=
ý! -, o" 0x
t00 (a
0
00
OOIVA-lf

3246 G
v-9.093 GHz DPPH
29S K-
30ý K
31T K
317ý*K
32f K
32f K
325N
32f K
32T K
33f K
20G i
Figure (5.24) ESR spectra of x-irradiated gi-im arabic at rof)m temperature. recorded at variotis temperattire,

3246 G
. -9 003 cm.
29i X
(1)
OPPH
lb. - (2) '-----
317 K
(1)
(2)
32! ý K
(1) &-AL-v (2)
331 K
ý-- -- -ý- - ---w
(1) ff-- (2) v. ----- "---"
Figure (5.25) ESR spectra of x-irradiated gum arabic, recorded at variouse temperatures. The spectra are modefied in y direction.
1. IOG
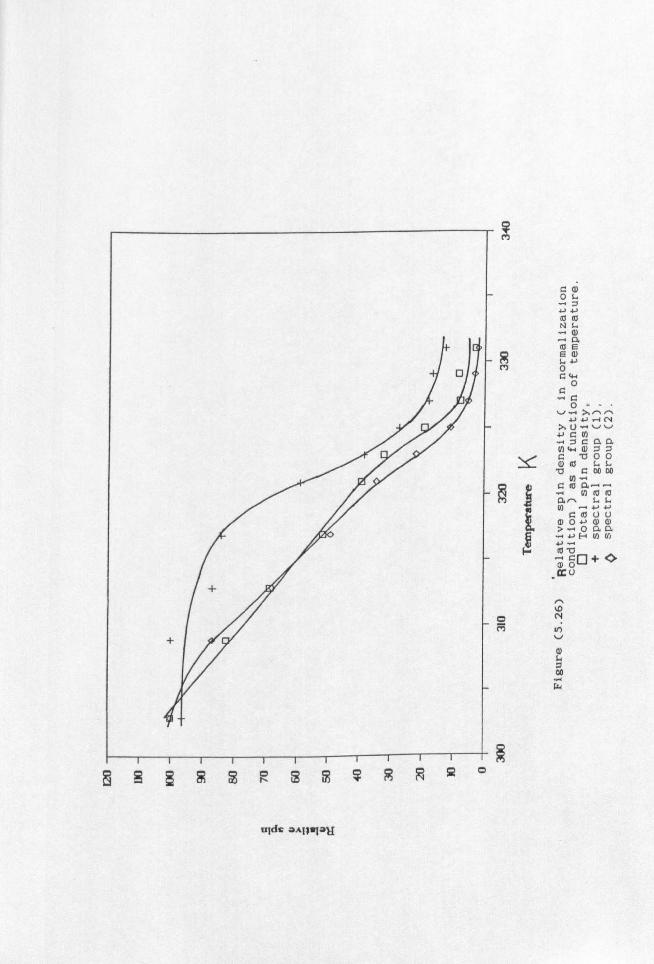
C: a) 0 Sý :5 41 4j (a to
OR, Q) 41
0
0--" N
'0 '-' -'
- U) 44 WZ:: I
13 00
-0 a: 00 DO U)
r. (a U) (a
06 -"L. U) "
r- 0u0 a) 0 4j a) CD 0aa Fý U) ui
CO + a) 0
it
rN %D
0 1ý LO
a) 00
III
5sE F9R8 5ý 7 r- II i- ý 9 pq 2 c:
ulde oAlplall

I
0u
-2ýý "l c4 0 tö
E00 Z :Z" tý
(. oo W 00
(0 V -ý -ý
tö 4. ) 41
41 tu c4 CL
(V x
ý5,0,
III --T-- III
a] (11
-R
r1l 0
00 rZ
(-Id? ) lopl- -1-1

(0 ý
0 0 00 r- -
(a
U)
41 ,ar. .- a)
a) r_
/-N
a)
(-'&) mpl-091-1

0
-o o C
E C
w
94
IIIIII , q, F3 gi
(%Tnv&)q; PjAk--Quj-j

aniv. &-W

3396.5G DPPH
v-9.522 Cliz
min.
5 min.
10 min.
20 min.
40 min.
85 min
175 min.
265 min.
335 min.
1 20 C; I
Figure (5.31) ESR spectra of x-irradiated gum arabic, exposed to mercury light with variotis times Of irradiation.

33965G
v-9.522 CH
(a)
(1)
(2)
(b)
(1) I- (2)
(c)
(1)
(2)
DPPfrj
L --v
lOG J
Figure (5.32) ESR spectra of x-irradiated gum arabic, recorded with various exposing time to mercury light. (a) without exposing to mercury Ii gh t, (b) 175 mi nu tes expos i ng to the mercury light, (c) 355 minutes exposing to the mercury light. (All the spectra are modefied in y direction.

0
0
U 0
tö 4-. )
(I)
r-4 CN
oE 00
0 S. I-
CL E co (K;
-P 4J uu
N G) Q) C6
-- U) V) V) 0
04
Cl)
LO
(D
-4 40
ý2
(Ijun
cn
Ajp-jjlqjp) al)nl! idu'V
GO I,, LD

(4ý 0
r_ 0
u
4-4
V)
C
F
0) E
U, 0 0.
=E::; :ý a) 00
10 0 1.1- 4-) CO 00
C (0--
-- E (a m
Uu
>c
.- vi W V) C. CL D
0) x+
dc 0)
CY)
%. W
(1)
1" i
ki) ri
r)
(put-,. z; noqj, ) A-11cmap uldq aAjjVj--)8
Lr) N
rl kfý kb
C)
CD

13
it)
4ý
n tu
00 U) I S. I-
>t 00 00
E-= uu U) a) a)
0. C. V) 11)
>1 ý (13 a
", U
-1 + r
C. -.
00
11
0
C
III
11)
(D
In
U) (13 U) r4 Ul uý CD HN -i CD
0 (ö C
DC 0 It) t')
It
a) L
00
ýk
(apuac"Oql) Illun xicuap uldc 2AI)III-OJ

+
+
+ II
(ý=85ý7 FEE Rsý
A
C
'-I
0a - :: I r- a) 0 0 1- " ::, 00 41
4ý a 41 U
E U- (1) G). o
ra
Ef) (0
00E G :3 I- - 00
.1 a) 1; 1 1 -E '00) -0 a) 0)
E
cri 0 L.
(a (1) x 0
(1) a) > > c: ) ;D0
El e-s
ko Cl)
LO '-I
L
Uý
j; 1un (j, j; lqj, ) Xilcuap Ulcic 2AIM214

A
U) 0
ao E= L) - Q) 0) -0
tu 4, CL iu Vi -
(13 ME4.
00 r=
.- rm lu (f) -ý .- 0) r- tö 41 4' (D tö
v 0) ü) . - EH 1- -C5 - Z) tö
0
U) x1 Q) x
a) Q) > >
Z
Cl)
Lo
ý22E2ý25s8a92R 51 5ý !ýR9 52 0
(; Iun Ajltjllqjg) jCjIsu4pp uldo 2AII61OU

L :3
tu L) L. (V
"E
N (D
0 00 610, 4-ý -'\ -'\
(14 CN
E
00
r. U) c (o 0--
" rl Aj xE r- (1) <
A, '-I
- 4-4
00 cl 0
E (T S- -
T 2
1
+
II
8 5ý Gý 8 I
8
0 0
rN 00 Cl)
LO
%-0
CV
X(7)., U, /(, ), Iuj pup X(Z)-dwY/(T)'dmy

(1) E
4j
til
a]
m
11 I
iII I-F-I III 7-7 T--7-T- It
S2 ri
ý4
8
0 CD
E
0 OL x
LQ
(I) 0
Q)
0
r- 0
--
4-J
4-4 :: 3 00
U)
41 uu
4-J >, (V (L) " Cl a :3 V) V)
3u
Cl +
ON cn
44
(ssneg) 41PTm aul'i


323 7.5 I
DPPH
v-9.086C /I z
(d)
(c)
(
493 K
473 K
423 K
(a) I, / %^, 1 373 K
I IOG I
Figure (5.42) ESR specLr, i of heated gum. (a) recorded at. 373 K for 120 minutes of ll(.
-, cAt - rece i ver gain 5xI04. (b) recorded at. 423 K for 115 minutes of heat
. receiver gain 4xJ04. (C) recorded aL 473 K foi- 110 lllilllltcýý ()f licil Il (ý i vol - ga in -S, 2x I f)4 . ((I)
recorded at 493 K fijr 48 minutos of heat. receiver gain 4x10³

IIII fl) 00 Ln Ir
NNH
CY)
I
ý2
T---T r1l N rý
III -T- 1
I
9
III IF- CD crj L: ) 1: N
C5 d06
(ii AuRiiIq. rn) k)PUaP uit. F . Af1t'I{
(a to
00
4. 0
>, 0) ý) E
'ý z 10 (a
U) 0
(D r. >0
4J
(a u
1-1 (1)
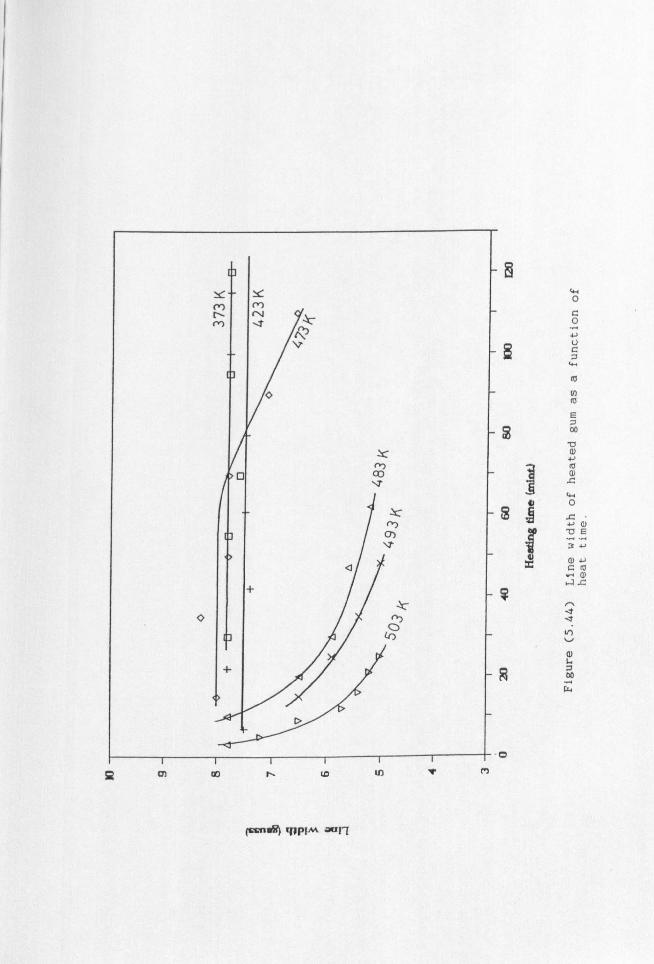
(Wnwsý qlpl- --11-1

a, ) u x) qjosq 0

3399.5 G
Figure (6.1) ESR spectra of x-ii-radjat. ed D-galact-ose recorded at, different microwave powei- at temperature.

a) V) E 00 0
41 tu tu
0
13 (1) 0) ý, (C
1 : 3: XE
(- LO 0
2
a) a) " ID zuE
a) Q)
1-1 C14
CL)
00
04

0 40 IT
a
(1) V'l 0E 4ý 0 u0 (a - (u ý, 00 (a
(1) (1) 4.1 >
4ý 00
a) (1) m r4"a " V) -I (D
0 L)
vi (1) Q) W"4,
1ý Cl)
r14

3389 G
v-9. S2SCHz
I
DPPH
0.5 mW
1 mw
10 mw
20 mW
40 mw
60 mW
4OG
Figure (6.4) ESR spect. ra of x-irradiated D-S I Ilcul-on i acid recorded at djff even t mict-owave at room tt ur e.

7ý E 0
()0 tu --
(30
u
0 u (D
0 00 r- I
cz (0
IID tu
90 E
x LO L14 -
00 tic 4j a)
tu U T3 41
0 0. muE
V) 0) a) w 1. -1
1-1
CD

v-9.525 C
1
0.5 mW
3393 G
v-9.525 GHz I JDPPH
mw
10 mw
20 mW
40 mW
60 mW
1 40G I
Figure (6.6) ESR spectra of x-irradiated L-al-abinose j-ecm-ded at different microwave powei- at room tempei-atui-e.

0 a)
, C) ,
(o C. 0
(M
71 :ý (U C.
> x (a
: 1: 0
0
L)
ý: 6 Ln
V)
C-. N
'-I
00

3401.5 G
v=9.532 GHz
0.5
DPPH I
mw
10 mw
20 mW
40
60 mW 1 40 Gj
Figure (6.8) ESR spect-i-a of x-iri-adiated L-i-hamnose recorded at diffei-ent microwave pc-)wei- at room ternpei-ature.

1ý
I a) 0 u
M
0E
(a
10 . -I I-
-0 ý 4) 41
(U
(U 0
.- a) >
0 0 1-
u E
UE a) 06
0 C4 V)
"N
00

v= 9.131 GHz
(a)
(b)
i L 3
DPPH
. -1, ' i
i 5
II II
II II
II ii
3257 ýG I
9 I
I 20G i
Figure (6.10) ESR spectra of x-Irradiated . (a) Arabinose. (b) Galactose. (c) Arabinose + Calactose.

Figure (6.11) ESR spectra of x-irradiated (a) Arabinose + Calactose. (b) Rhamnose. (c) mixture of (arabinose + galactose + rhamnose).

1
(b)
56 7
345.6
9
20G i
Figure (6.12) ESR spectra of x-irradiated. (a) mixture of arabinose + galactose + rhamnose. (b) D-Clucuronic acid. (c) Synthetic gum (mixture of four sugars).

Figure (6.13) ESR zpectra of. (a) Synthetic gum. (b) natural gum.
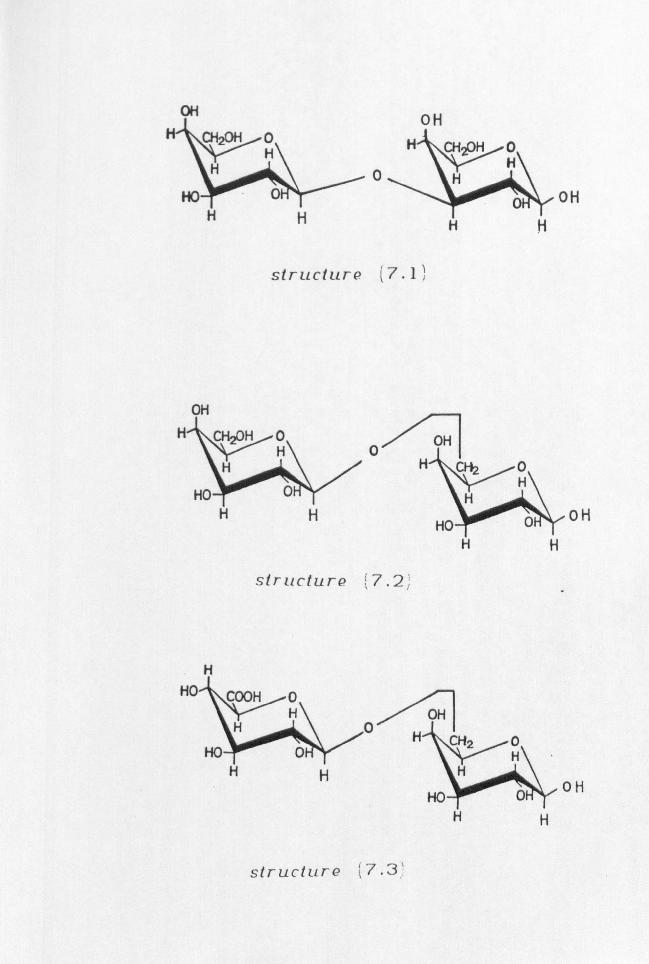
OH
strUcturo (7-I ýi
of-i
structurv
HO H
H H
OH
StrUCILLro ý17.3ý'

OH H
OH
structure
H
OH
structurp (7.5)
H
oH
structure (7.6ý

OH
struciure (7.7)
H
H
0, -I
H
OH
struclure

0
0
0
+ 0
I
Z
0
0
L- 0
0
r 0
0
+
0
L

m 0
+ L..
0
0
0
x 0 m
M: 0
Z

0 Z
0
7ý6
+
0
0
x 0
x 0
N
C
L
m 0 I

x 0
-Z_-
0
+
0
L- 0
x:
2: 0
C
L
L

6
x 0
21
x 0
0 0
D
0+ +
-r, 0
0
7: 0
N-
C

x: 0
2: 0
x
x
-r- 0
+ 0 0
A
= 0
0
L- 0
1: 0
, 7- 0
0
10

m 0
X 0
+ 0
--z
x 0
m 0
N
Z

m 0
:r 0
-s
0
0
0
+ . 0
a
m 0
0
L- 0
x 0
m 0
0
0
+
)c
I-
0