Fast chromatography for anhydro-sugars _acp-2009-761 - EPA
22
1 2 3 4 5 Technical Note: Fast two-dimensional GC-MS with thermal extraction for anhydro- 6 sugars in fine aerosols 7 8 9 10 Yilin Ma 1† , Michael D. Hays 1 *, Christopher D. Geron 1 , John T. Walker 1 , Michael J. Gatari Gichuru 2 11 12 13 1 National Risk Management Research Laboratory, United States Environmental Protection Agency, Research 14 Triangle Park, North Carolina 27711, USA 15 2 Institute of Nuclear Science & Technology, College of Architecture and Engineering, University of Nairobi, 16 Nairobi, Kenya 17 18 19 20 21 22 23 24 25 † Current affiliation: California Air Resources Board, 9528 Telstar Avenue, El Monte, CA 91731 26 27 *To whom correspondence should be addressed. E-mail: [email protected] , phone 919-541-3984; fax 919- 28 685-3346 29 30
-
Upload
khangminh22 -
Category
Documents
-
view
2 -
download
0
Transcript of Fast chromatography for anhydro-sugars _acp-2009-761 - EPA
1 2 3 4 5
Technical Note: Fast two-dimensional GC-MS with thermal extraction for anhydro-6 sugars in fine aerosols 7
8
9
10
Yilin Ma1†, Michael D. Hays1*, Christopher D. Geron1, John T. Walker1, Michael J. Gatari Gichuru2 11
12 13
1National Risk Management Research Laboratory, United States Environmental Protection Agency, Research 14
Triangle Park, North Carolina 27711, USA 15 2Institute of Nuclear Science & Technology, College of Architecture and Engineering, University of Nairobi, 16
Nairobi, Kenya 17
18
19
20
21
22
23
24
25 †Current affiliation: California Air Resources Board, 9528 Telstar Avenue, El Monte, CA 91731 26 27 *To whom correspondence should be addressed. E-mail: [email protected], phone 919-541-3984; fax 919-28 685-3346 29
30
2
31 Abstract: A fast two-dimensional gas chromatography (GC-MS) method that uses heart-cutting and thermal 32
extraction (TE) and requires no chemical derivatization was developed for the determination of anhydro-sugars 33
in fine aerosols. Evaluation of the TE-GC-GC-MS method shows high average relative accuracy (≥ 90%), 34
reproducibility (≤ 10% relative standard deviation), detection limits of less than 3 ng/µL, and negligible 35
carryover for levoglucosan, mannosan, and galactosan markers. TE-GC-GC-MS- and solvent extraction (SE)-36
GC-MS-measured levoglucosan concentrations correlate across several diverse types of biomass burning 37
aerosols. Because the SE-GC-MS measurements were taken 8 years prior to the TE-GC-GC-MS ones, the 38
stability of levoglucosan is established for quartz filter-collected biomass burning aerosol samples stored at ultra-39
low temperature (-50 °C). Levoglucosan concentrations (w/w) in aerosols collected following atmospheric 40
dilution near open fires of varying intensity are similar to those in biomass burning aerosols produced in a 41
laboratory enclosure. An average levoglucosan-mannosan-galactosan ratio of 15:2:1 is observed for these two 42
aerosol sets. TE-GC-GC-MS analysis of atmospheric aerosols from the U.S. and Africa produced levoglucosan 43
concentrations (0.01–1.6 µg/m3) well within those reported for aerosols collected globally and examined using 44
different analytical techniques (0.004 –7.6 µg/m3). Further comparisons among techniques suggest that fast TE-45
GC-GC-MS is among the most sensitive, accurate, and precise methods for compound-specific quantification of 46
anhydro-sugars. In addition, an approximately twofold increase in anhydro-sugar determination may be realized 47
when combining TE with fast chromatography. 48
49 50
51
3
1 Introduction 52 53 Levoglucosan (LG, 1,6-anhydro-β-D-glucopyranose) is an important organic marker for biomass burning. 54
Characterizaion of LG has contributed much to our understanding of the global atmosphere. Biomass fires 55
produce relatively high quantities of LG with minor amounts of other anhydro-sugars or monosaccharide 56
anhydrides [e.g., mannosan (MAN) and galactosan (GAL)]. These compounds form at fire temperatures greater 57
than 300 °C as plant cellulose and hemicellulose decomposes and molecular bonds cleave via transglycosylation, 58
fission, and disproportionation reactions (Shafidazeh et al., 1984). LG partitions exclusively to a submicrometer 59
liquid or solid aerosol phase (Kleeman et al., 2008), and is stable in the atmosphere during long-range transport 60
(Fraser et al., 2000). Thus, once formed as a pyrolysis product of biomass combustion, it is used as an organic 61
marker in atmospheric modeling studies (Fraser et al., 2000; Simoneit et al., 2001; Simoneit et al., 1999a; Simoneit 62
et al., 1999b; Elias et al., 2001), in sediment and Antarctic ice cores for understanding the paleorecord (Gambaro 63
et al., 2008), in liquid biofuel synthesis (Branca et al., 2003; Gravitis et al., 2004), and as a urinary biomarker for 64
approximating animal and human exposures to biomass smoke (Migliaccio et al., 2009). For these reasons, there 65
is high demand for quantitative analytical data for LG. 66
The excellent review by Schkolnik and Rudich (2006) summarizes the quantitative analytical methods for LG 67
in atmospheric aerosols. It separates techniques for LG measurement into two general categories: gas 68
chromatography (GC) methods (Simoneit et al., 2001; Zdrahal et al., 2002; Pashynska et al., 2002; Otto et al., 69
2006) and aqueous-phase methods. Aqueous-phase methods are applied less frequently to study LG in aerosols 70
but are emerging due to their speed and lack of a chemical derivatization requirement. For example, Gao et al. 71
(2003) paired IC with electrospray ionization (ESI)-ion-trap MS to directly examine LG and carbohydrates in 72
African biomass fire plumes. Others subsequently investigated the anhydro-sugars with LC-MS, developing 73
methods for time-of-flight (TOF) (Dye et al., 2005), quadrupole (q) (Wan et al., 2007) and triple quadrupole 74
(qqq) MS systems (Gambaro et al., 2008). For these studies, LC-MS sensitivity for LG was shown to be 0.014 75
ng/µL or less (Wan et al., 2007). Additional water-based techniques that have successfully measured LG in 76
aerosols include capillary electrophoresis (CE)−pulsed amperometric detection (PAD)—which measures LG in 77
as little as 2 min (Garcia et al., 2005)—and high-performance anion-exchange chromatography with PAD 78
(HPACE-PAD) which detects LG at concentrations above 0.002 ng/µL (Engling et al., 2006). 79
Despite the emergence of LC-MS and other aqueous phase techniques, GC-MS techniques are more routinely 80
applied to quantify LG in aerosols (Schkolnik et al., 2006). These GC-MS methods can detect LG as a tri-methyl 81
silyl analogue with nanogram or better sensitivity. However, aerosol sample preparation for GC-MS analysis can 82
require multiple solvent extraction (SE), concentration, and chemical derivatization (i.e., silyation) steps, which 83
are labor-intensive, time-demanding, reagent-consuming and usually environmentally unfriendly (Schkolnik et 84
al., 2006). Moreover, silylated LG is susceptible to hydrolysis, expiring within 24 hours (Wan et al., 2007). 85
Attempts to detect LG on certain GC column stationary phases without chemical derivatization using GC-MS 86
4
can result in a lower response due to peak spreading (Fraser et al., 2000; Williams et al., 2006; Fine et al., 2001). 87
And while faster, the increased detection limits resulting from this practice may preclude the use of LG as a 88
biomass burning marker in the highly time-resolved atmospheric samples needed for coupling source-receptor 89
models and epidemiological studies (Williams et al., 2006). 90
Thermal extraction (TE) methods have quantitatively determined organic aerosol composition and are simpler 91
than and as accurate as traditional SE methods for many analyses (Hays et al., 2003; Falkovich et al., 2001; Chow 92
et al., 2007; Lin et al., 2007). They require less sample preparation than SE, minimize parasite peaks caused by 93
solvent and laboratory contamination, and are more sensitive (Chow et al., 2007; Lin et al., 2007). However, the 94
quantification of polar organic compounds has challenged single dimension TE-GC-MS techniques; whereas, 95
two-dimensional GC systems [GC×GC (comprehensive) or GC-GC (heart-cutting)] have improved the 96
separation of complex aerosol mixtures (Welthagen et al., 2003; Kallio et al., 2003; Hamilton et al., 2004; Ma et 97
al., 2008). Further, GC×GC TOF-MS has tentatively identified highly polar sugar substituents in biomass 98
samples (Hope et al., 2005). In fact, we recently produced qualitative evidence showing how TE combined with 99
GC-GC-MS sharply resolved polar organic analytes in biomass smoke without chemical derivatization (Ma et al., 100
2008). For the present study, the focus is on the accurate and reproducible quantification of underivatized LG 101
and other anhydro-sugar molecules in biomass burning and atmospheric aerosols using TE-GC-GC-MS. 102
Application of this method to aerosols is verified through proficiency testing and by comparing results for 103
samples also analyzed by SE-GC-MS following silyation. In the interest of reducing the long analysis times 104
typically associated with GC-MS, the TE-GC-GC-MS method is modified to include fast chromatography via 105
modular accelerated column heating (MACH). The combination of MACH with TE requires less total sample 106
preparation and analysis time than most chromatographic methods available currently. Following method 107
development, anhydro-sugar concentrations for a variety of biomass burning aerosols and atmospheric 108
environments impacted by fires of varying intensity are reported. Finally, we offer evidence that LG in biomass 109
burning aerosol stored at ultra-low temperatures (-50 °C) is stable for nearly a decade. 110
111 2 Experimental 112 113 2.1 Chemicals 114 115 Authentic anhydro-sugar standards were used without further purification. LG (1,6-anhydro-β-D-116
glucopyranose), MAN (1,6-anhydro-β-D-mannopyranose), GAL (1,6-anhydro-β-D-galactopyranose) were 117
obtained from Sigma-Aldrich Co. (St. Louis, MO), Advance Scientific & Chemical Inc. (Fort Lauderdale, FL), 118
and from a source at Colorado State University. Deuterated LG (Cambridge Isotope Laboratories) was used as 119
the internal standard. Methanol (Sigma-Aldrich) was used to dissolve target and internal standard compounds. 120
121
5
122 2.2 Aerosol samples 123 124 A total of eight particulate matter (PM) samples collected on pre-fired (550 ºC, 12 hr) quartz fiber filters (47 mm, 125
67 mm, and hi-vol filters with 432 µm thickness Pallflex®, Pall Corporation) were selected for examination. Of 126
these, three were collected from biomass burning simulations conducted in an enclosure. Extensive details about 127
the enclosure, sample collection, and fire regimes can be found in Hays et al. (2002; 2005). Briefly, mixed forest 128
floor debris dominated by loblolly pine (Pinus taeda) needles (collected from Duke University Forest, Durham, 129
NC) and post-harvest agricultural crop residue from rice and wheat fields (Sutter County, CA, USA; and Lind, 130
WA, USA respectively) were gathered and burned in the enclosure. The fine aerosol (< 2.5µm mean 131
aerodynamic diameter) emissions were cooled (~25°C), diluted (~1:50), and collected using a custom-fabricated 132
stainless steel dilution sampler outfitted with sampling arrays that housed the quartz filters being examined here. 133
Additionally, fine aerosol emissions from two biomass burning events were collected using the PM2.5 cuts 134
from a high-volume dichotomous sampler (MSP Corporation, MN). The first event was a 2006 prescribed fire at 135
Croatan National Forest [CNF, (35.92ºN, 77.07ºW)], New Bern, NC, USA. Here, the fuel was primarily 136
indigenous shrubs and mixed forest litter dominated by loblolly pine with less than 20% hardwood in the 137
overstory. The 2.5 km2 fire consumed roughly 200-500 g of fuel per m2 and took place 2 days after a 20 mm 138
rainfall. Ignition was under low ventilation, high humidity conditions shortly after fog had lifted. Although the 139
fire was not highly energetic, the flaming stage was well sampled over two 37 min and 70 min periods. The 140
second sampling event occurred in September 2007 immediately following a North Carolina-Piedmont region 141
(35.98ºN, 79.09ºW) wildfire that had earlier consumed approximately 0.01 km2 (1 ha) of pine litter and mixed 142
hardwood forest biomass. A 14 hr PM2.5 sample (PMT) was collected at night during the low intensity residual 143
smoldering of heavy fuels. (The smoldering was mostly organic soils, stump, and large diameter fuels.) For the 144
most part, sampling took place under low- or intermittent-smoke or smoke-free conditions. A beta gauge 145
indicated a 15-200 µg m-3 PM2.5 mass range. 146
Two PM samples were collected from an urban atmosphere in Nairobi, Kenya influenced by biomass burning. 147
In Kenya, biomass is used for cooking and heating (Kituyi et al., 2001). Industrial and domestic wastes that 148
contain cellulose-based products are also burned for warmth. Two ambient samples (KNY01 and KNY02) were 149
taken in August and October 2006 at an urban field site near the city center of Nairobi, Kenya (University of 150
Nairobi, 1.3ºS, 36.8ºE). Particles with aerodynamic diameters of approximately 35 µm or less were collected 151
using a high volume sampler (MSP) positioned 20 m above ground. These samples were expected to contain 152
more dust due to the supercoarse diameter cut-off. A third atmospheric aerosol sample (KSV) was collected (270 153
L/min) over roughly 24 hr in November, 2006 at Kenansville, NC, USA. The rural Kenansville site was in close 154
proximity to a number of animal production facilities but was not significantly impacted by biomass fire. Filter 155
samples were stored in pre-fired aluminum foil and stored at -50°C in a low-temperature freezer prior to analysis. 156
6
2.3 TE-GC-GC-MS analysis 157 158 A schematic diagram (Supporting Information, Figure S1) and detailed description of the TE-GC-GC-MS 159
system and extraction procedure used for the present study can be found elsewhere (Ma et al., 2008). Briefly, a 160
small 0.02–0.1 cm2 section of each quartz filter sample was inserted into a concentric glass liner, spiked with 161
deuterated levoglucosan internal standard (6.1 ng), and loaded into the TE unit [TDU, Gerstel Inc., Baltimore, 162
MD]. The sample was heated [over He (50 mL/min)] from 25 ºC to 300 ºC at 20 ºC/min and held for 10 min. 163
The TE unit was interfaced directly to the GC-MS (Model 6890-5973; Agilent Technologies) without a transfer 164
line. So, thermally extracted sample was directed to and trapped in a cryo-cooled (-30 ºC) programmable 165
temperature vaporization (PTV) inlet (Model CIS4; Gerstel Inc., Baltimore, MD). Following extraction, the inlet 166
was flash heated (720 ºC/min) to 300 ºC transferring sample to the first dimension column (HP5-MS; 30 m 167
length; 0.25 µm film thickness; 0.25 mm i.d.; Agilent Technologies, Santa Clara, CA), which separated 168
compounds by their volatility. In 2.4 min, this column was heated to 300 °C (100 °C/min) and held for 7.5 169
minutes. The He carrier gas flow rate was 1.5 mL/min. A 5% v/v fraction of this chromatographed sample was 170
continuously routed to a flame ionization detector (FID). The FID chromatogram was used to plan the sample 171
heart-cutting events. A multi-column switching system (MCS; Gerstel Inc.) comprising a 5-way proportional 172
valve and a cryogenic cooling and heating system (CTS) afforded computer-controlled, selective heart-cutting 173
and trapping of the first dimension eluate. In this case, all GC-GC conditions were optimized for the rapid 174
separation of the anhydro-sugar peaks of interest. The anhydro-sugars were thus sent to the second dimension 175
column within 4 min of the beginning of the chromatographic run. Heart-cut eluate was trapped in a pre-column 176
retention gap (deactivated fused silica capillary), which was connected to the proportional valve and passed 177
through the cryo-cooled (-50 ºC) CTS. Subsequent ballistic heating (300 °C at 20 °C/s) of the CTS directed the 178
cut eluate to the shorter second dimension column (SolGel-Wax; 10 m length; 0.25 µm film thickness; 0.25 mm 179
i.d.; SGE Co., Austin, TX), which separated compounds by polarity. The temperature of the second column was 180
fixed at 65 °C for 4 min, raised to 225 °C at 160 °C/min, and then to 275 °C at 40 °C/min and held for 3.75 181
min. The He carrier gas flow rate through the second dimension column was 1.0 mL/min. Two modular 182
accelerated column heaters (MACH, Gerstel Inc.) attached to the GC oven door provided the independent 183
temperature control for each column with a maximum heating rate of 1800 °C/min. The columns were wrapped 184
in insulated heating tape with a temperature sensor wire. Integrated cooling fans ensured efficient air circulation 185
and quick cooling. Compounds eluting from the second column were subject to electron ionization and 186
measured with a qMS operating in scan mode. Several experiments were also performed in single ion monitoring 187
mode (SIM) to examine the possibility of enhancing method sensitivity. 188
Standard mixtures containing the LG, MAN, GAL, and isotopically-labeled LG were prepared, subsequently 189
diluted five times over a concentration range of 1 ng/µL – 200 ng/µL, and used for TE-GC-GC-MS instrument 190
calibration. These diluted mixtures were also used to determine method detection and quantification limits (LOD 191
7
and LOQ), reproducibility, recovery, linear dynamic range and carryover. Instrument calibration was performed 192
in an empty glass extraction tube. A group of control tests indicated no significant difference between 193
experiments conducted in the empty tube and those conducted in the presence of blank, pre-fired quartz fiber 194
filters. 195
196 3 Results and Discussion 197 198 3.1 Evaluation of TE-GC-GC-MS for fast, direct determination of anhydro-sugars 199 200 Results of the TE-GC-GC-MS proficiency testing for the fast and direct quantification of anhydro-sugars are 201
summarized in Table 1. Method recoveries of the anhydrous sugar compounds from the pre-conditioned quartz 202
fiber filters spiked with 100 ng of each authentic standard are consistently 90% or greater. In other words, there 203
is less than 10% difference between the known target and method-determined concentrations, indicating high 204
accuracy. Examination of chromatograms acquired immediately following the recovery analysis indicates 205
negligible carryover. Over a 9-hr period, replicate 1µL injections (n = 5) of the 100 ng/µL MA standards onto 206
quartz filters resulted in a TE-GC-GC-MS method precision of 3.0% - 7.0% RSD. An error propagation analysis 207
that included the recovery, carryover, and reproducibility uncertainties shows an overall method precision of 8%-208
11% for anhydro-sugar concentrations measured above the limits of quantification (LOQ). 209
The LOQ is defined here as five times the limit of detection (LOD). The LOD is being defined as the 210
minimum concentration of analyte that is measured and reported with 99% confidence at a concentration greater 211
than zero. The LODs were determined using multiple 1 µL injections of solutions containing 25 ng/µL MAN and GAL 212
and 1 ng/µL LG. TE-GC-GC-MS produces a lower LOD for LG (0.56 ng/µL) than for either MAN (2.7 ng/µL) 213
or GAL (2.2 ng/µL). With single ion monitoring, a roughly twofold increase in anhydro-sugar response is 214
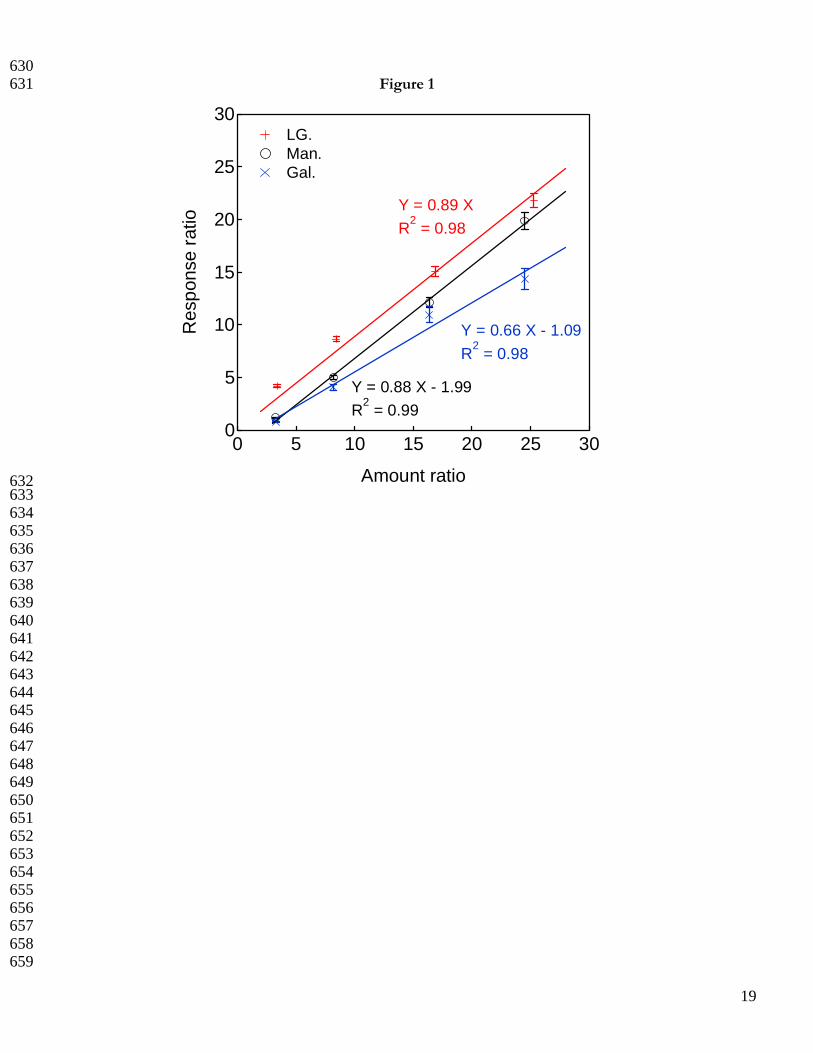
observed. The calibration data given in Figure 1 confirm the method’s heightened response for LG and illustrate 215
the linear working ranges adequate for measuring the anhydro-sugars in the biomass burning and atmospheric 216
aerosols examined in the present study. The absolute linear dynamic range (r2 ≥ 0.99) for LG spans 217
approximately two orders of magnitude. Despite a relatively lower TE-GC-GC-MS response for MAN and 218
GAL, higher maxima in the calibration interval are possible for these compounds, Table 1. Finally, we note that 219
the anhydro-sugars were below detection limits on multiple analytical laboratory blanks. Further discussion about 220
how the method accuracy, precision, and sensitivity compare to established methods will be provided later. 221
222 3.2 TE-GC-GC-MS application to PM samples 223 224 Following validation, the TE-GC-GC-MS method was applied to biomass burning and atmospheric aerosol 225
samples. As indicated, the biomass burning aerosol samples were collected from both live and simulated fires of 226
differing intensity, using various field sampling techniques. The atmospheric aerosols were taken from 227
independent geographic locations, expected to be impacted variously by biomass burning, and represented 228
8
different PM size fractions. The samples were selected for the purpose of evaluating the TE-GC-GC-MS 229
method capability over a wide range of representative anhydro-sugar concentrations in aerosol matrixes 230
important to air pollution studies. 231
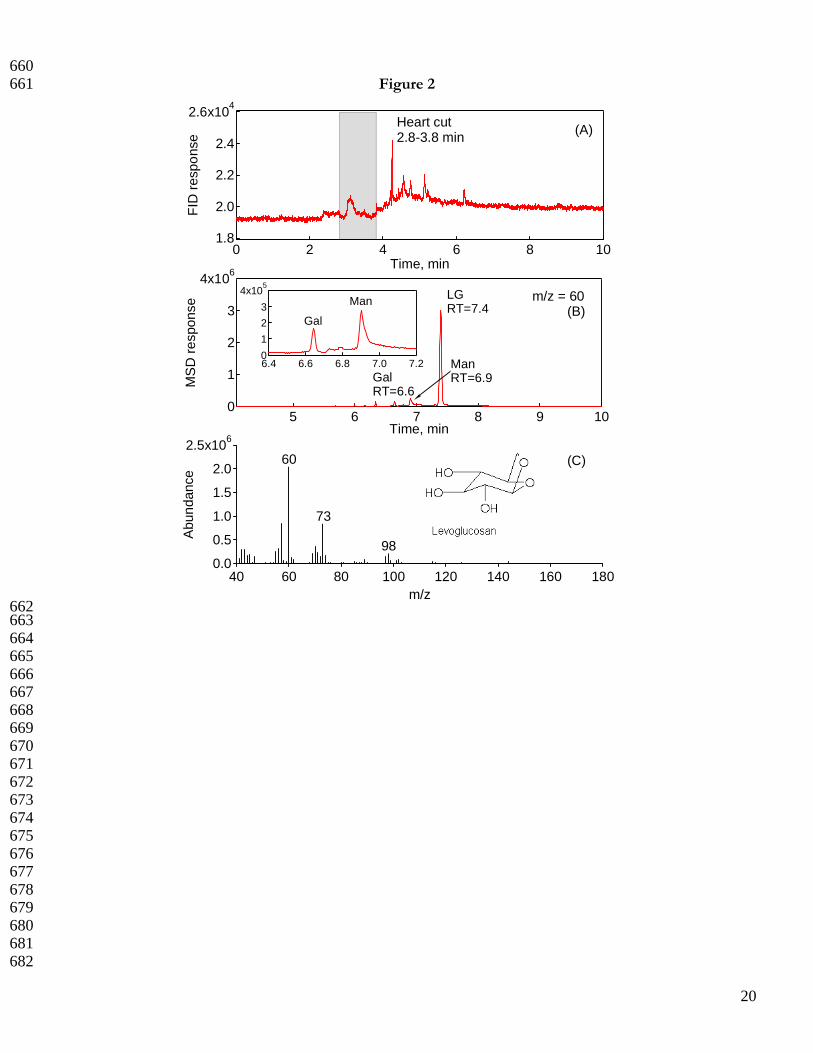
232 3.2.1 Representative TE-GC-GC-MS heart-cutting 233 234 Figure 2 exhibits a typical TE-GC-GC-MS analysis using the PMT sample. Panel A in the figure shows the flame 235
ionization detector (FID) response following the first dimension separation; the grey reference area indicates the 236
1 min heart-cut region (2.8 min - 3.8 min) over which the anhydro-sugars are targeted for transfer to the second 237
dimension column. Narrower heart-cut transfers are not possible due to observed loss of target compound mass. 238
Panel B shows the second dimension ion chromatogram at m/z = 60, the target ion for the anhydro-sugars. 239
Underivatized LG appears as a narrow Gaussian peak at retention time (RT) 7.4 min in the 2-D chromatogram, 240
fully separated from the minor MAN (RT = 6.6 min) and GAL (RT = 6.9 min) isomers (C6H10O5) in the 241
complex fire sample in a chromatographic run time of less than 10 min. The LG mass spectrum obtained from 242
PMT (Figure 2, panel C) was positively confirmed against the National Institute of Standards and Technology 243
spectral library. 244
245 3.2.2 Comparison of SE-GC-MS and TE-GC-GC-MS results for LG in biomass burning aerosols 246 247 Of the eight aerosol samples examined in the present study, four (Pinus taeda, Oryza sativa, Triticum aestivium, and 248
CNF) also underwent GC-MS analysis following the trimethylsilyl derivatization of solvent-extract (Hays et al., 249
2002; Hays et al., 2005). Archived filter samples from these earlier tests presented a unique opportunity to 250
contrast the current TE-GC-GC-MS method with a more conventional SE-GC-MS analysis being widely used 251
for organic marker speciation. Authentic GAL and MAN standards were unavailable at the time the SE-GC-MS 252
method was applied to the biomass burning samples (Pinus taeda, Oryza sativa, and Triticum aestivium) collected 253
from the enclosure (2000-2001); thus, only LG results are presented. 254
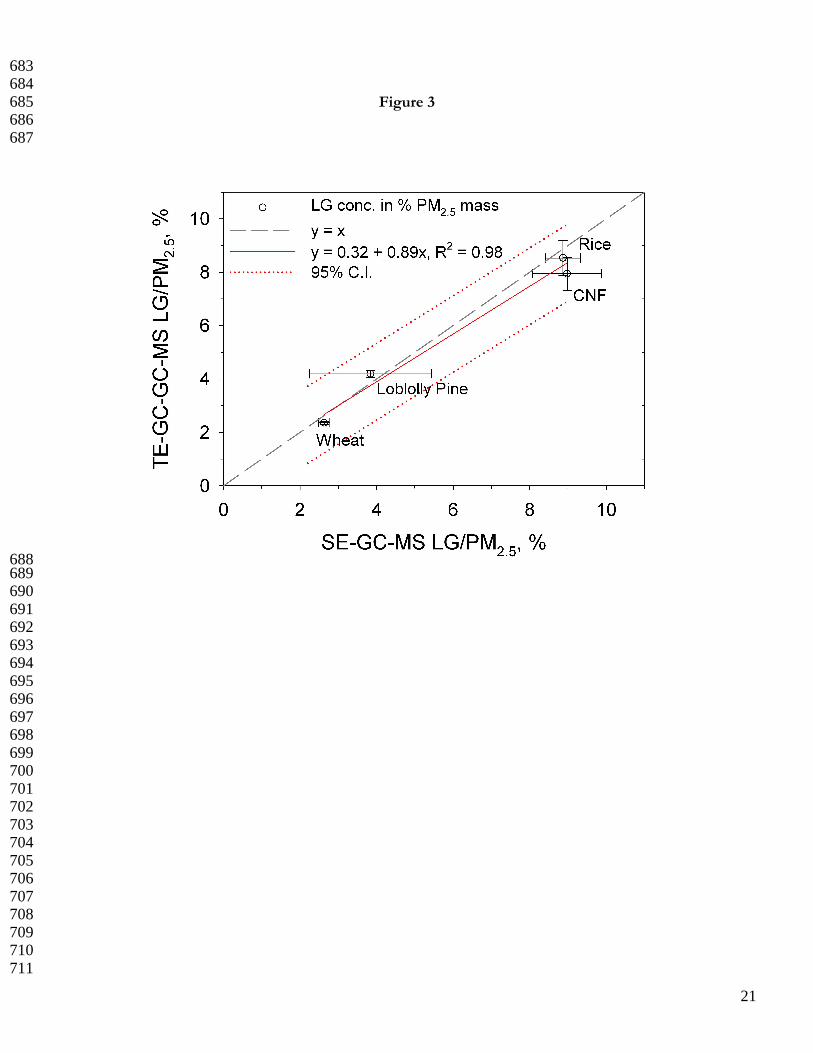
Figure 3 shows TE-GC-GC-MS and SE-GC-MS LG concentrations normalized to fine PM mass; for the four 255
biomass burning samples, the LG levels range from 3% - 9% of the PM (Table 2). The error bars reflect one 256
standard deviation based on triplicate analyses. We can only speculate on why the error for loblolly pine is 257
greater. We have no knowledge of an interfering matrix compound per se. However, silyated LG at high 258
concentrations can cause interference at m/z 206, which is the base peak target assigned to the silyated 13C-LG 259
internal standard for this test. Checks with standards indicated that this was a nearly negligible issue for our 260
instrument within our calibration range at the time the loblolly pine analysis was conducted. Perhaps the biomass 261
burning matrix was inadequately modeled by checking only standards. We also note that the solvent extraction-262
GC-MS analysis of the loblolly pine and CNF fire emissions, which show higher error, did occur in a different 263
analytical laboratory than the wheat and the rice straw burns. The TE error is lower due to the automated nature 264
9
of the procedure, and for TE, MS peak integration and quantification is confirmed with both primary base peak 265
and secondary qualifier ions, which removes this interference from LG. Finally, TE replicates use small filter 266
pieces from the same filter while trials for SE include different filters collected in parallel; thus, filter sample 267
inhomogeneities and differences in how the filters are used are other variables that can contribute to differences 268
in error among these samples and methods. In the figure, the data are fit using a reduced major axis linear 269
regression to account for the fact that both the X and Y variables contain error. The result is a TE/SE LG 270
concentration ratio near unity, m = 0.89 ± 0.09 and r2 = 0.98. Implicit from the slightly negative TE bias is the 271
adsorption of the more polar untreated LG onto the TE hardware, GC inlet or column surfaces. Moreover, 272
minor thermal alteration of LG to further dehydrated levoglucosenone may be possible. However, the TE/SE 273
LG concentration ratio among the samples is 0.96 ± 0.09 on average, Table 2, and the emissions data are well 274
within the demarcated linear confidence interval at α = 0.05. This agreement is remarkable considering the TE-275
GC-GC-MS and SE-GC-MS analyses took place nearly one decade apart with different instruments, 276
chromatographic techniques, chemical standards, and analysts. The agreement also further verifies the relative 277
accuracy of the TE-GC-GC-MS method in the presence of the biomass burning matrix. Finally, these data 278
strongly suggest that LG in filter-collected biomass burning aerosols is stable for up to 8 yr in ultra-low 279
temperature (-40 to -50 °C) storage. 280
281
3.2.3 Anhydro-sugar concentrations in simulated and near-source biomass burning samples 282 283 Table 3 presents the TE-GC-GC-MS-determined anhydrous sugar concentrations in three simulated (Pinus taeda, 284
Oryza sativa, and Triticum aestivium) and two near-source (CNF and PMT) biomass burning samples. The 285
LG:MAN:GAL ratio in the PM mixture is roughly 15:2:1 on average. This ratio should directly reflect the 286
proportion of D-glucose and mannose and galactose precursor residues in the plant cellulose and hemicellulose, 287
respectively, although plant hemicellulose does contain some glucose. Schmidl et al. (2009) recently alluded to 288
the use of the relative proportion of the anhydro-sugars for differentiating hard- and soft-wood emissions using 289
commonly burned tree species native to mid-European alpine regions. The results for Pinus taeda (3.7), CNF (4.6), 290
and PMT (4.6) samples support their conclusion that Gymnosperm species produce relatively lower LG to MAN 291
ratios between 3.6-3.9. Angiosperm trees interspersed throughout pine forests likely partly explain the slightly 292
higher ratios observed for the CNF and PMT samples. Moreover, the hemicellulose polysaccharides generally 293
degrade at a faster rate, and decaying plant matter on the forest surface burned during the CNF and PMT tests 294
(McLaren et al., 1967). The substantially higher values of 20.8 and 15.6 corresponding to the combustion of 295
Oryza sativa, and Triticum aestivium may also indicate the degradation of hemicellulose matter as these biomass 296
samples were dry stored prior to burning (Hays et al., 2005). The proportion of cellulose to hemicellulose also 297
changes with plant species as does the galactose to mannose ratio contained in hemicellulose; thus, care must be 298
10
taken when interpreting anhydro-sugar marker ratios in atmospheres impacted by forest fires that consume a 299
mixture of fresh and aged vegetational species. 300
As expected, the near-source CNF and PMT samples that underwent atmospheric dilution show lower PM 301
and anhydro-sugar mass per unit volume of air sampled than those from the enclosure fires. However, these 302
different sampling and burn modes return a comparable fraction of LG in PM (6-8% versus 2-9%). Although 303
not the focus here, this result suggests that dilution sampling from a combustion experiment within an enclosure 304
can adequately mimic near-source sampling with atmospheric dilution for LG measurement. In addition, the 305
5.8% w/w LG in the PMT aerosol shows that despite its low intensity, the fire was the major PM2.5 contributor 306
to this sample. Overall, the anhydro-sugar concentration range being reported here on a PM mass basis (w/w) is 307
well within that reported for biomass burning to date as evidenced by panel A in Figure 4 (Caseiro et al., 2009). 308
309 3.2.4 Anhydro-sugar concentrations in atmospheric aerosols 310 311 Table 3 provides the TE-GC-GC-MS determined anhydro-sugar concentrations in the three atmospheric aerosol 312
samples – KNY01, KNY02, and KSV. The absence of MAN and GAL and scant LG (0.01 µg m-3) in the 24 hr 313
KSV aerosol is consistent with a rural North Carolina agricultural area where burning activity was limited. 314
Relatively speaking, African aerosols KNY01 and KNY02 comprise both MAN and GAL and at least an order 315
of magnitude more LG. As discussed, Figure 4, panel B compares our LG concentrations to those measured 316
previously in a variety of aerosols collected globally using different analysis techniques. Although the 317
concentration of LG in atmospheric PM can vary with many factors including meteorology, geographic region, 318
and monitoring site proximity to biomass burning sources, LG concentrations in the atmospheric aerosols 319
examined for the present study are well within range of published values (0.004 – 7.6 µg/m3). LG enrichment 320
over the accumulation mode in biomass burning PM2.5 is expected (Fine et al., 2004). For KNY01 and KNY02, 321
Table 3 gives PM35 enrichment (w/w) that would substantially increase if only PM2.5 mass were being considered, 322
suggesting a substantial contribution from the domestic burning of biomass and waste in urban Nairobi. In sum, 323
TE-GC-GC-MS is also suitable for anhydro-sugar determination in atmospheric aerosol matrixes containing 324
different particle size distributions and variably impacted by biomass smoke. Note for the Kenyan aerosols that 325
visual inspection of spent filters following thermo-chemical measurements revealed a substantial crustal or dust 326
component commonly assigned to a coarse mode. 327
328 3.3 Comparisons with other analytical methods 329 330 Next, the advantages and disadvantages of these methods are briefly discussed with regard to practical TE-GC-331
GC-MS application. As with Figure 4, this discussion is confined primarily to LG as it is a leading focus of 332
biomass burning related air quality studies currently. 333
334 335

11
3.3.1 Overall method analysis times 336 337 Retention times for LG with conventional GC-MS methods normally exceed 20 minutes (Zdrahal et al., 2002; 338
Wan et al., 2007; Williams et al., 2006). HPLC and IC analyses are generally more rapid (Dye et al., 2005; Engling 339
et al., 2006; Engling et al., 2006; Schkolnik et al., 2005). LG elutes in less than 2 min with some HPLC tandem 340
MS and CE-PAD methods (Gambaro et al., 2008; Garcia et al., 2005). The use of flow injection to directly 341
introduce sample to an MS detector is even faster but the lack of selectivity confounds identification of the 342
anhydro-sugar isomers and can complicate experimental MS-MS results (Gao et al., 2003). While fast, aerosol 343
sample handling and pretreatment for these techniques typically require a minimum of 1 hr and often as much as 344
24 hr depending on the exact extraction, filtration, or derivatization procedures being utilized. On the other 345
hand, the TE step requires 25 minutes or less, and the anhydro-sugars elute within 7.4 minutes using fast 346
chromatography. This 32 min run time may be decreased even further by shortening first and second dimension 347
column lengths or changing the TE temperature program. Contingent on the number of samples, and sample 348
preparation steps and analysis times, the TE-GC-GC-MS method affords up to an approximately two-fold 349
increase in laboratory throughput over most currently available methods that speciate LG in aerosols. Of course, 350
as the ability to perform batch solvent extractions in parallel increases, the throughput advantage of TE may 351
lessen depending on the exact instrumental approach being taken. 352
353 3.3.2 Extraction and recovery efficiency 354 355 Method recovery or relative accuracy is defined here as the difference between a known, fixed concentration of 356
target analyte spiked onto a blank filter and the analytical method-determined concentration. The TE-GC-GC-357
MS method LG recovery is ≥ 90%, which is at the top-end of the performance range for accuracy presently. In 358
the literature, analytical-chemical method recoveries for LG generally vary from 69% to 99% (Gambaro et al., 359
2008; Zdrahal et al., 2002; Pashynska et al., 2002; Dye et al., 2005; Simpson et al., 2004; Schkolnik et al., 2005). 360
Sample filtration, concentration, and derivatization steps appear common to chromatography studies that report 361
high recoveries (Schkolnik et al., 2006; Pashynska et al., 2002); although, the choice of solvent mixture and 362
internal standard may influence these values. For example, dichloromethane-acetic acid extracts evaporated to 363
dryness and reconstituted and derivatized in pyridine without an isotopically-labelled anhydro-sugar internal 364
standard tended to yield low recoveries for LG (Zdrahal et al., 2002). Low recoveries were also observed 365
following the GC-MS analysis of ethylacetate-triethylamine extracts despite them containing a 1,5-anhydro-D-366
mannitol internal standard and being derivatized (Simpson et al., 2004). In contrast, extractions with water, 367
tetrahydrofuran, or a dichloromethane-methanol mixture (80:20, v/v) recover greater than 90% LG when using 368
ion-exclusion chromatography (IEC) – HPLC –photodiode array (PDA) (Schkolnik et al., 2005), HPLC-ESI-369
high resolution MS (Dye et al., 2005), and GC-MS-MS (Pashynska et al., 2002) instrumentation, respectively. 370
371

12
3.3.3 Sensitivity Instrumental limit of detection (LOD) is an important factor used to assess method 372
sensitivity. For comparison purposes, the authors explored the possibility of reporting sensitivity for all methods 373
as a function of total extracted and injected analyte or aerosol mass. However, a literature inspection revealed 374
that many of the studies being compared did not always provide the total aerosol mass or LG extracted, injection 375
volume, or final concentrated volume values needed to perform the conversion. LOD units of ng/µL or similar 376
were most frequently available; thus, these units are used here for comparison purposes in an effort to be 377
consistent. For GC-qMS, the LOD for LG is typically 0.1 ng/µL or less (Simpson et al., 2004). LC-MS methods 378
typically achieve low picogram LODs. For example, Dye and Yittry (2005) observe 0.03 ng/µL using LC-ESI-379
TOF-MS technique, Wan and Yu (2007) use LC-qMS with post-column chlorine addition for enhanced analyte-380
adduct formation and report 0.014 ng/µL, while Gambaro et al. (2008) with LC-qqqMS see an LOD of 0.003 381
ng/µL albeit with comparatively low precisions of 20% to 50% RSD. Among the fastest for LG, high-382
performance anion-exchange chromatography with PAD is also quite responsive showing a LOD of 0.002 383
ng/µL (Engling et al., 2006). At first glance, TE-GC-GC-MS appears somewhat less sensitive for LG (Table 1, 384
LOD = 0.6 ng/µL). However, a fair comparison among techniques should also consider that TE is a whole-385
sampling method. In contrast, most IC, LC, and SE-GC-MS methods inject a 1-25 µL aliquot that is only a 386
fraction of the total PM in the liquid extract (which is typically 250 µL or more for GC-MS methods, for 387
example), reducing the effective sensitivity of these methods. Many solvents are not concentrated below these 388
levels due to background and contamination issues. Considering this factor, the effective TE-GC-GC-MS 389
sensitivity for LG in aerosol matter improves by as much as two orders of magnitude, which places TE-GC-GC-390
MS among the most sensitive methods for LG in aerosol matter. 391
392 3.3.4 Precision 393 394 Differences in precision or reproducibility among methods are evaluated here using relative standard deviation, 395
which is the standard deviation of a measurement set (n ≥ 3) divided by the mean and multiplied by 100%. This 396
value includes method uncertainty and contributions to variability such as inconsistencies in internal and 397
calibration standard spike and injection volumes, instrumentation and peak integration error, and filter sample 398
inhomogeneities. For matrix blank spikes and most biomass burning and atmospheric aerosol samples, the TE-399
GC-GC-MS precision varied from 3% to 8% RSD. As expected, this value is inversely proportional to the 400
anhydro-sugar concentration in the aerosol. Literature values of LG measurement precision depend on the 401
method applied. For example, the range of reproducibility values reported for GC-MS studies (most with 402
derivatization) is consistently 2%-20% RSD (Graham et al., 2003; Simpson et al., 2004; Graham et al., 2002). For 403
HPAEC-PAD, and HPLC- aerosol charge detection (ACD), corresponding precisions of 5.3% and 6.7% RSD 404
are observed (Engling et al., 2006; Dixon et al, 2006). Generally, the lower reported RSDs are due to replicate 405
(same sample) extract injections as opposed to different extraction trials. Elimination of sample loss and 406
13
automation of the direct thermal extraction step potentially explain the high precisions observed for TE-GC-407
GC-MS. In addition, further separation of narrow heart-cut sections of the aerosol sample reduces on-column 408
sample load, matrix background, and the probability of co-detection, all of which are likely to improve peak 409
shape, resolution, and stabilize the MS detector response. 410
411 4 Conclusions 412 413 A fast two-dimensional GC-MS method with thermal extraction was developed for trace quantification of 414
anhydro-sugars in biomass burning and atmospheric aerosols. Anhydro-sugar stereoisomers were fully extracted 415
and resolved within 30 min. Using m/z 60 as the target quantification ion, high average relative accuracies and 416
precisions for the anhydro-sugars were achieved. A comparative analysis across a limited set of biomass burning 417
aerosols showed that TE-GC-GC-MS results compared well to those obtained using conventional SE-GC-MS 418
and that LG is stable in ultra-low temperature storage for at least 8 years. The method can be successfully applied 419
to aerosol matrixes characterizing background air, weak or intensive biomass burning, or heavily polluted urban 420
environments. Saccharides and other polar organic constituents can also be identified and quantified with the 421
same technique (Ma et al., 2008); only slight changes in the TE-GC-GC-MS heart-cut intervals are likely to 422
produce additional information about n-alkanoic acids, substituted phenols, and nitrogen-bearing heterocyclics in 423
biomass burning aerosols. Finally, we anticipate that this method is likely to even further enhance the sample 424
throughput and thus temporal resolution of aerosol marker chemistry for improved source apportionment and 425
understanding of epidemiological and health effects data. 426
427 428
Acknowledgement This project was supported in part by Dr. Yilin Ma’s appointment to the Research 429
Participation Program at the U.S. Environmental Protection Agency, administered by the Oak Ridge Institute for 430
Science and Education through an interagency agreement between the U.S. Department of Energy and EPA. 431
International Programs in the Physical Sciences (IPPS) at Uppsala University, Sweden, supported the field 432
sampling campaigns in Nairobi, Kenya through the support program for INST, University of Nairobi. The 433
authors also thank Dr. Jeff Collett’s research group at Colorado State University for supplying the galactosan 434
standard. The authors also acknowledge partial support by the Joint Fire Sciences Research Program. Bob 435
Mickler of Alion Science assisted in field sample collection. 436
437 438 References 439 Branca, C.; Giudicianni, P.; Di Blasi, C.: GC/MS characterization of liquids generated from low-temperature 440
pyrolysis of wood, Ind. Eng. Chem. Res., 42, (14), 3190–3202, 2003. 441 Caseiro, A.; Bauer, H.; Schmidl, C.; Pio, C. A.; Puxbaum, H.: Wood burning impact on PM10 in three Austrian 442
regions, Atmos. Environ., 43, (13), 2186-2195, 2009. 443

14
Chow, J. C.; Yu, J. Z.; Watson, J. G.; Ho, S. S. H.; Bohannan, T. L.; Hays, M. D.; Fung, K. K.: The application of 444 thermal methods for determining chemical composition of carbonaceous aerosols: A review, J. Environ. Sci. 445 & Health A., 42, (11), 1521-1541, 2007. 446
Dixon, R. W.; Baltzell, G.: Determination of levoglucosan in atmospheric aerosols using high performance liquid 447 chromatography with aerosol charge detection, J. Chromatogr. A, 1109, 214-221, 2006. 448
Dye, C.; Yttri, K. E.: Determination of monosaccharide anhydrides in atmospheric aerosols by use of high-449 performance liquid chromatography combined with high-resolution mass spectrometry, Anal. Chem., 77, 450 1853-1858, 2005. 451
Elias, V.; Simoneit, B.; Cordeiro, R.; Turcq, B.: Evaluating levoglucosan as an indicator of biomass burning in 452 Carajas, Amazonia: A comparison to the charcoal record, Geochim. Cosmochim. Acta, 65, 267–272, 2001. 453
Engling, G.; Carrico, C. M.; Kreidenweis, S. M.; Jeffrey L. Collett, J.; Day, D. E.; Malm, W. C.; Lincoln, E.; Hao, 454 W. M.; Iinuma, Y.; Herrmann, H.: Determination of levoglucosan in biomass combustion aerosol by high-455 performance anion-exchange chromatography with pulsed amperometric detection, Atmos. Environ., 40, 456 S299-311, 2006. 457
Falkovich, A. H.; Rudich, Y.: Analysis of semivolatile organic compounds in atmospheric aerosols by direct 458 sample introduction thermal desorption GC/MS, Environ. Sci. Technol., 35, (11), 2326-2333, 2001. 459
Fine, P. M.; Cass, G. R.; Simoneit, B. R. T.: Chemical Characterization of Fine Particle Emissions from Fireplace 460 Combustion of Woods Grown in the Northeastern United States, Environ. Sci. Technol., 35, (13), 2665-461 2675, 2001. 462
Fine, P. M.; Cass, G. R.; and Simoneit, B. R. T.: Chemical characterization of fine particulate emissions from the 463 fireplace combustion of woods grown in the southern United States, Environ. Sci. Technol., 36, 1442–1451, 464 2002. 465
Fine, P. M.; Cass, G. R.; Simoneit, B. R. T.: Chemical characterization of fine particulate emissions from the 466 fireplace combustion of woods grown in the midwestern and western United States, Environ. Eng. Sci., 21, 467 387–409, 2004a. 468
Fine, P. M.; Cass, G. R.; Simoneit, B. R. T.: Chemical characterisation of fine particle emissions from the wood 469 stove combustion of prevalent United States tree species, Environ. Eng. Sci., 21, 705–721, 2004b. 470
Fine, P. M.; Chakrabarti, B.; Krudysz, M.; Schauer, J. J.; Sioutas, C.: Diurnal variations of individual organic 471 compound constituents of ultrafine and accumulation mode particulate matter in the Los Angeles basin, 472 Environ. Sci. Technol., 38, 1296-1304, 2004c. 473
Fraser, M.; Lakshmanan, K.: Using levoglucosan as a molecular marker for the long-range transport of biomass 474 combustion aerosols, Environ. Sci. Technol., 34, (21), 4560–4564, 2000. 475
Gambaro, A.; Zangrando, R.; Gabrielli, P.; Barbante, C.; Cescon, P.: Direct Determination of Levoglucosan at 476 the Picogram per Milliliter Level in Antarctic Ice by High-Performance Liquid Chromatography/ 477 Electrospray Ionization Triple Quadrupole Mass Spectrometry, Anal. Chem., 80, (5), 1649-1655, 2008. 478
Gao, S.; Hegg, D. A.; Hobbs, P. V.; Kirchstetter, T. W.; Magi, B. I.; and Sadilek, M.: Water-soluble organic 479 components in aerosols associated with savanna fires in southern Africa: identification, evolution, and 480 distribution, J. Geophys. Res., 108, (D13), 8491, 2003. 481
Garcia, C. D.; Engling, G.; Herckes, P.; Collett, J. L.; Henry, C. S.: Determination of levoglucosan from smoke 482 samples using microchip capillary electrophoresis with pulsed amperometric detection, Environ. Sci. 483 Technol., 39, 618–623, 2005. 484
Graham, B.; Guyon, P.; Taylor, P.; Artaxo, P.; Maenhaut, W.; Glovsky, M.; Flagan, R.; Andreae, M.: Organic 485 compounds present in the natural Amazonian aerosol: Characterization by gas chromatography-mass 486 spectrometry, J. Geophys. Res. Atmos., 108, (D24), 4677, doi:10.1029/2003JD003990, AAC 6–1, 2003. 487
Graham, B.; Mayol-Bracero, O.; Guyon, P.; Roberts, G.; Decesari, S.; Facchini, M.; Artaxo, P.; Maenhaut, W.; 488 Koll, P.; Andreae, M.: Water-soluble organic compounds in biomass burning aerosols over Amazonia 1. 489 Characterization by NMR and GC-MS, J. Geophys. Res., 107, (D20), 8047, doi:10.1029/2001JD000336, 490 2002. 491
Gravitis, J.; Zandersons, J.; Vedernikov, N.; Kruma, I.; Ozols-Kalnins, V.: Clustering of bio-products 492 technologies for zero emissions and eco-efficiency, Ind. Crops Products, 20, 169–180, 2004. 493
15
Hamilton, J. F.; Webb, P. J.; Lewis, A. C.; Hopkins, J. R.; Smith, S.; Davy, P.: Partially oxidised organic 494 components in urban aerosol using GCXGC-TOF/MS, Atmos. Chem. Phys., 4, 1279-1290, 2004. 495
Hays, M. D.; Fine, P. M.; Geron, C. D.; Kleeman, M. J.; Gullett, B. K.: Open burning of agricultural biomass: 496 Physical and chemical properties of particle-phase emissions, Atmos. Environ., 39, 6747-6764, 2005. 497
Hays, M. D.; Geron, C. D.; Linna, K. J.; Smith, N. D.; Schauer, J. J.: Speciation of gas-phase and fine particle 498 emissions from burning of foliar fuels, Environ. Sci. Technol., 36, (11), 2281-2295, 2002. 499
Hays, M. D., N. D. Smith, J. Kinsey, Y. Dong, P. H. Kariher: Polycyclic aromatic hydrocarbon size distribution 500 in aerosols from appliances of residential wood combustion as dertermined by direct thermal desorption-501 GC/MS, J. Aerosol Sci., 34, 1061-1084, 2003. 502
Hildemann, L. M.; Cass, G. R.; Markowski, G. R.: A dilution stack sampler for collection of organic aerosol 503 emissions: design, characterization and field tests, Aerosol Sci. Technol., 10, 193–204, 1989. 504
Hope, J. L.; Prazen, B. J.; Nilsson, E. J.; Lidstrom, M. E.; Synovec, R. E.: Comprehensive two-dimensional gas 505 chromatography with time-of-flight mass spectrometry detection: analysis of amino acid and organic acid 506 trimethylsilyl derivatives, with application to the analysis of metabolites in rye grass samples, Talanta, 65, (2), 507 380-388, 2005. 508
Iinuma, Y.; Brueggemann, E.; Gnauk, T.; Mueller, K.; Andreae, M. O.; Helas, G.; Parmar R.; Herrmann, H.: 509 Source characterization of biomass burning particles: the combustion of selected European conifers, African 510 hardwood, savanna grass, and German and Indonesian peat, J Geophys. Res., 112 (D8) D08209/1–511 D08209/26, 2007. 512
Kallio, M.; Hyötyläinen, T.; Lehtonen, M.; Jussila, M.; Hartonen, K.; Shimmo, M.; Riekkola, M.-L.: 513 Comprehensive two-dimensional gas chromatography in the analysis of urban aerosols, J. Chromatogr. A, 514 1019, 251-260, 2003. 515
Kituyi, E.; Marufu, L.; Huber, B.; Wandiga, S. O.; Jumba, I. O.; Andreae, M. O.; Helas, G.: Biofuel consumption 516 rates and patterns in Kenya, Biomass and Bioenergy, 20, 83-99, 2001. 517
Kleeman, M. J.; Robert, M. A.; Riddle, S. G.; Fine, P. M.; Hays, M. D.; Schauer, J. J.; Hannigan, M. P.: Size 518 distribution of trace organic species emitted from biomass combustion and meat charbroiling, Atmos. 519 Environ., 42, (13), 3059-3075, 2008. 520
Lin, L.; Lee, M. L.; Eatough, D. J.: Gas chromatographic analysis of organic marker compounds in fine 521 particulate matter using solid-phase microextraction, J. Air & Waste Manage. Assoc., 57, 53-58, 2007. 522
Ma, Y.; Hays, M. D.: Thermal extraction-two-dimensional gas chromatography-mass spectrometry with heart-523 cutting for nitrogen heterocyclics in biomass burning aerosols, J. Chromatogr. A, 1200, (2), 228-234, 2008. 524
McLaren, A. D.; Peterson, G. H. Eds.: Soil Biochemistry, Dekker, New York, 1967. 525 Migliaccio, C. T.; Bergauff, M. A.; Palmer, C. P.; Jessop, F.; Noonan, C. W.; Ward, T. J.: Urinary levoglucosan as 526
a biomarker of wood smoke exposure: observations in a mouse model and in children, Environ. Health 527 Perspect., 117, (1), 74-79, 2009. 528
Nolte, C. G.; Schauer, J. J. ; Cass, G. R.; Simoneit, B. R. T.: Trimethylsilyl Derivatives of organic compounds in 529 source samples and in atmospheric fine particulate matter, Environ. Sci. Technol., 35, 1912-1919, 2001. 530
Otto, A.; Gondokusumo, R.; Simpson, M. J.: Characterization and quantification of biomarkers from biomass 531 burning at a recent wildfire site in Northern Alberta, Canada. Appl. Geochem., 21, (1), 166-183, 2006. 532
Pashynska, V.; Vermeylen, R.; Vas, G.; Maenhaut, W.; Claeys, M.: Development of a gas chromatographic/ion 533 trap mass spectrometric method for the determination of levoglucosan and saccharidic compounds in 534 atmospheric aerosols. Application to urban aerosols, J. Mass Spectrom., 37, 1249–1257, 2002. 535
Poore, M. W.: Levoglucosan in PM2.5 at the fresno supersite, J. Air & Waste Manage. Assoc., 52, 3-4, 2002. 536 Schauer, J. J.; Cass, G. R.: Source apportionment of wintertime gas-phase and particle-phase air pollutants using 537
organic compounds as tracers, Environ. Sci. Technol., 34, 1821-1832, 2000. 538 Schauer, J. J.; Kleeman, M. J.; Cass, G. R.; and Simoneit, B. R. T.: Measurement of emissions from air pollution 539
sources. 3. C1–C29 organic compounds from fireplace combustion of wood, Environ. Sci. Technol., 35, 540 1716–1728, 2001. 541
Schkolnik, G.; Falkovich, A. H.; Rudich, Y.; Maenhaut, W.; Artaxo, P.: New analytical method for the 542 determination of levoglucosan, polyhydroxy compounds, and 2-methylerythritol and its application to smoke 543 and rainwater samples, Environ. Sci. Technol., 39, (8), 2744-2752, 2005. 544
16
Schkolnik, G.; Rudich, Y.: Detection and quantification of levoglucosan in atmospheric aerosols: A review, Anal. 545 Bioanal. Chem., 385, (1), 26-33, 2006. 546
Schmidl, C.; Bauer, H.; Dattler, A.; Hitzenberger, R.; Weissenboeck, G.; Marr, I. L.; Puxbaum, H.: Chemical 547 characterisation of particle emissions from burning leaves, Atmos. Environ., 42, 9070-9079, 2008. 548
Schmidl, C.; Marr, I. L.; Caseiro, A.; Kotianova, P.; Berner, A.; Bauer, H.; Kasper-Giebl, A.; and Puxbaum, H.: 549 Chemical characterization of fine particle emissions from wood stove combustion of common woods 550 growing in mid-European Alpine regions, Atmos. Environ., 42, 126–141, 2009. 551
Shafidazeh, F.: The chemistry of pyrolysis and combustion, Adv. Chem. Ser., 207, 489–529, 1984. 552 Sheesley, R. J.; Schauer, J. J.; Chowdhury, Z.; Cass, G. R.; and Simoneit, B. R. T.: Characterization of organic 553
aerosols emitted from the combustion of biomass indigenous to South Asia, J. Geophys. Res., 108 (D9), 554 4285, doi:10.1029/2002JD002981, 2003. 555
Simoneit, B.: A review of biomarker compounds as source indicators and tracers for air pollution, Environ. Sci. 556 Pollut. Res., 6, 159–169, 1999a. 557
Simoneit, B.; Schauer, J.; Nolte, C.; Oros, D.; Elias, V.; Fraser, M.; Rogge, W.; Cass, G.: Levoglucosan, a tracer 558 for cellulose in biomass burning and atmospheric particles, Atmos. Environ., 33, 173–182, 1999b. 559
Simoneit, B.; Elias, V.: Detecting organic tracers from biomass burning in the atmosphere, Mar. Pollut. Bull., 42, 560 805–810, 2001. 561
Simpson, C. D.; Dills, R. L.; Katz, B. S.; Kalman, D. A.: Determination of levoglucosan in atmospheric fine 562 particulate matter, J. Air & Waste Manage. Assoc., 54, 689-694, 2004. 563
Wan, E. C. H.; Yu, J. Z.: Analysis of sugars and sugar polyols in atmospheric aerosols by chloride attachment in 564 liquid chromatography /negative ion electrospray mass spectrometry, Environ. Sci. Technol., 41, 2459–2466, 565 2007. 566
Welthagen, W.; Schnelle-Kreis, J.; Zimmermann, R.: Search criteria and rules for comprehensive two-567 dimensional gas chromatography-time-of-flight mass spectrometry analysis of airborne particulate matter, J. 568 Chromatogr. A, 1019, (1-2), 233-249, 2003. 569
Williams, B.; Goldstein, A.; Kreisberg, N.; Herring, S.: An in-situ instrument for speciated organic composition 570 of atmospheric aerosols: Thermal Desorption Aerosol GC/MS-FID (TAG), Aerosol Sci. Technol., 40, 627-571 638, 2006. 572
Yttri, K. E.; Dye, C.; Slordal, L. H.; Braathen, O.-A.: Quantification of monosaccharide anhydrides by liquid 573 chromatography combined with mass spectrometry: Application to aerosol samples from an urban and a 574 suburban site influenced by small-scale wood burning, J. Air & Waste Manage. Assoc., 55, 1169-1177, 2005. 575
Zdrahal, Z.; Oliveira, J.; Vermeylen, R.; Claeys, M.; Maenhaut, W.: Improved method for quantifying 576 levoglucosan and related monosaccharide anhydrides in atmospheric aerosols and application to samples 577 from urban and tropical locations, Environ. Sci. Technol., 36, 747–753, 2002. 578
Zheng, M.; Cass, G. R.; Schauer, J. J.; Edgerton, E. S.: Source apportionment of PM2.5 in the southeastern 579 United States using solvent-extractable organic compounds as tracers, Environ. Sci. Technol., 36, 2361-2371, 580 2002. 581
582 583
584
17
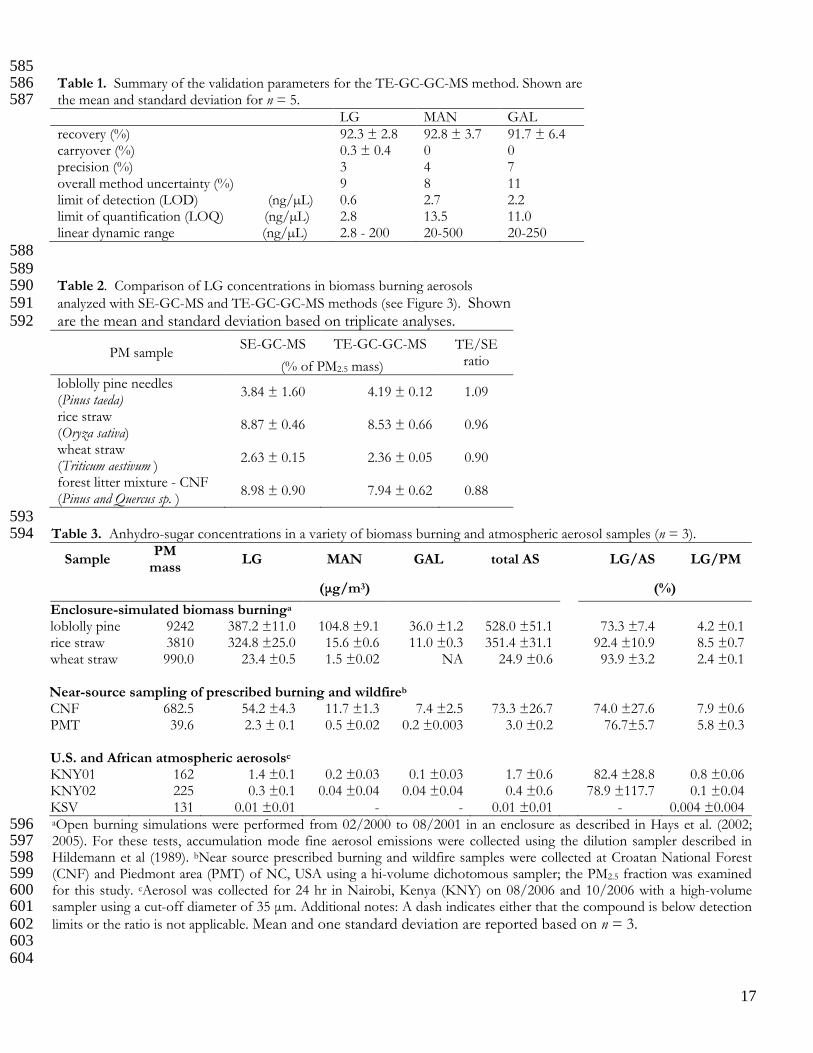
585 Table 1. Summary of the validation parameters for the TE-GC-GC-MS method. Shown are 586 the mean and standard deviation for n = 5. 587 LG MAN GAL recovery (%) 92.3 ± 2.8 92.8 ± 3.7 91.7 ± 6.4 carryover (%) 0.3 ± 0.4 0 0 precision (%) 3 4 7 overall method uncertainty (%) 9 8 11 limit of detection (LOD) (ng/µL) 0.6 2.7 2.2 limit of quantification (LOQ) (ng/µL) 2.8 13.5 11.0 linear dynamic range (ng/µL) 2.8 - 200 20-500 20-250
588 589 Table 2. Comparison of LG concentrations in biomass burning aerosols 590 analyzed with SE-GC-MS and TE-GC-GC-MS methods (see Figure 3). Shown 591 are the mean and standard deviation based on triplicate analyses. 592
PM sample SE-GC-MS TE-GC-GC-MS TE/SE
ratio (% of PM2.5 mass) loblolly pine needles (Pinus taeda)
3.84 ± 1.60 4.19 ± 0.12 1.09
rice straw (Oryza sativa)
8.87 ± 0.46 8.53 ± 0.66 0.96
wheat straw (Triticum aestivum )
2.63 ± 0.15 2.36 ± 0.05 0.90
forest litter mixture - CNF (Pinus and Quercus sp. )
8.98 ± 0.90 7.94 ± 0.62 0.88
593 Table 3. Anhydro-sugar concentrations in a variety of biomass burning and atmospheric aerosol samples (n = 3). 594
Sample PM mass
LG MAN GAL total AS LG/AS LG/PM
(µg/m3) (%)
Enclosure-simulated biomass burninga loblolly pine 9242 387.2 ±11.0 104.8 ±9.1 36.0 ±1.2 528.0 ±51.1 73.3 ±7.4 4.2 ±0.1 rice straw 3810 324.8 ±25.0 15.6 ±0.6 11.0 ±0.3 351.4 ±31.1 92.4 ±10.9 8.5 ±0.7 wheat straw 990.0 23.4 ±0.5 1.5 ±0.02 NA 24.9 ±0.6 93.9 ±3.2 2.4 ±0.1 Near-source sampling of prescribed burning and wildfireb CNF 682.5 54.2 ±4.3 11.7 ±1.3 7.4 ±2.5 73.3 ±26.7 74.0 ±27.6 7.9 ±0.6 PMT 39.6 2.3 ± 0.1 0.5 ±0.02 0.2 ±0.003 3.0 ±0.2 76.7±5.7 5.8 ±0.3 U.S. and African atmospheric aerosolsc KNY01 162 1.4 ±0.1 0.2 ±0.03 0.1 ±0.03 1.7 ±0.6 82.4 ±28.8 0.8 ±0.06 KNY02 225 0.3 ±0.1 0.04 ±0.04 0.04 ±0.04 0.4 ±0.6 78.9 ±117.7 0.1 ±0.04 KSV 131 0.01 ±0.01 - - 0.01 ±0.01 - 0.004 ±0.004 aOpen burning simulations were performed from 02/2000 to 08/2001 in an enclosure as described in Hays et al. (2002; 596 2005). For these tests, accumulation mode fine aerosol emissions were collected using the dilution sampler described in 597 Hildemann et al (1989). bNear source prescribed burning and wildfire samples were collected at Croatan National Forest 598 (CNF) and Piedmont area (PMT) of NC, USA using a hi-volume dichotomous sampler; the PM2.5 fraction was examined 599 for this study. cAerosol was collected for 24 hr in Nairobi, Kenya (KNY) on 08/2006 and 10/2006 with a high-volume 600 sampler using a cut-off diameter of 35 µm. Additional notes: A dash indicates either that the compound is below detection 601 limits or the ratio is not applicable. Mean and one standard deviation are reported based on n = 3. 602 603
604
18
605 Figure captions 606 607 Figure 1. Multi-level LG (+), MAN (○), and GAL (X) calibration data with linear fit. All responses are 608 normalized to deuterated LG internal standard (6.1 ng/µL). 609 610 Figure 2. TE-GC-GC-MS analysis of PM2.5 filter sample collected in NC piedmont region (PMT). (A) FID 611 response and selected 1 min (2.8-3.8 min) heart-cut region in grey. (B) Extracted ion chromatogram at m/z = 60 612 following the second dimension separation. Retention times of each anhydro-sugar are labeled. Inset shows the 613 mannosan and galactosan at a resolution (Rs) > 3; Rs values >1.5 indicate full resolution. (C) Mass spectrum of 614 LG obtained at a retention time of 7.4 min. 615 616 Figure 3. Comparison of SE-GC-MS and TE-GC-GC-MS-determined LG concentrations [LG/PM2.5 mass 617 (w/w)] in four unique biomass burning aerosols. The reduced major axis linear fit (solid line), 95% confidence 618 band (dotted lines), and 1:1 line (long dashed line forced through (0,0) are shown. The error bars reflect one 619 standard deviation based on triplicate analyses. 620 621 Figure 4. Literature-reported LG concentrations compared to those of the present study. (A) LG concentrations 622 measured during biomass burning source tests with variable biomass fuel types and analytical techniques (% PM 623 mass). The bottom, middle, and top of the box plots correspond to the 25, 50, and 75 percentile of each data set; 624 the bottom and top of the whiskers indicate the 10 and 90 percentiles, respectively. (B) Analytical method-based 625 LG concentrations (µg/m3) in ambient atmospheric aerosols collected globally. Studies with limited data sets 626 precluding box plot creation are indicated by X symbols, which are the data points available for that particular 627 study. 628
629
19
630 Figure 1 631
30
25
20
15
10
5
0
Res
pons
e ra
tio
302520151050
Amount ratio
Y = 0.89 X
R2 = 0.98
Y = 0.88 X - 1.99
R2 = 0.99
Y = 0.66 X - 1.09
R2 = 0.98
LG. Man. Gal.
632 633
634 635 636
637 638 639 640 641 642 643 644 645 646 647 648 649 650 651 652 653 654 655 656 657 658 659
20
660 Figure 2 661
4x10⁶
3
2
1
0
MS
D r
espo
nse
1098765Time, min
LGRT=7.4
ManRT=6.9Gal
RT=6.6
m/z = 60(B)
2.5x10⁶
2.0
1.5
1.0
0.5
0.0
Abu
ndan
ce
180160140120100806040m/z
60
73
98
(C)
2.6x10⁴
2.4
2.2
2.0
1.8
FID
res
pons
e
1086420Time, min
Heart cut 2.8-3.8 min (A)
4x10⁵
3
2
1
07.27.06.86.66.4
Gal
Man
662 663 664 665 666 667 668 669 670 671 672 673 674 675 676 677 678 679 680 681 682
21
683 684
Figure 3 685 686
687
688 689 690 691 692 693 694 695 696 697 698 699 700 701 702 703 704 705 706 707 708 709 710 711

22
Figure 4 712 713
30
20
10
0LG, %
of P
M m
ass
Hay
s et
al.,
200
2
She
esle
y et
al.,
200
3
Fin
e et
al.,
200
2
Fin
e et
al.,
200
1
Sch
auer
et a
l., 2
001
Fin
e et
al.,
200
4a
Fin
e et
al.,
200
4b
Sch
mid
l et a
l., 2
008
Sch
mid
l et a
l., 2
009
Iinum
a et
al.
2007
this work
GC
-MS
HP
LC
HP
LC-E
SI-
MS
TE
-GC
-GC
-MS
HP
LC
(A)
GC
-MS
GC
-MS
GC
-MS
GC
-MS
GC
-MS
GC
-MS
Thi
s st
udy
714 715
8
6
4
2
0Am
bien
t con
c., µ
g/m
3
Gra
ham
et a
l., 2
003
Fin
e et
al.,
200
4c
Zhe
ng e
t al.,
200
2
Wan
et a
l., 2
007
Dix
on e
t al.,
200
6
Sim
pson
et a
l., 2
004
Yttr
i et a
l., 2
005
Gao
et a
l., 2
003
Fra
ser
et a
l., 2
000
Gra
ham
et a
l., 2
002
Gra
ham
et a
l., 2
002
Nol
te e
t al.,
200
1
Poo
re e
t al.,
200
2
Zdr
ahal
et a
l., 2
002
Sch
koln
ik e
t al.,
200
5
Sch
auer
et a
l., 2
000
Thi
s st
udy
GC
-MS
GC
-MS
GC
-MS
LC-M
S
GC
-MS
IEC
-HP
LC-P
DA
HP
LC-A
CD
GC
-MS
HP
LC-H
RM
S-T
OF
ES
I-M
S
GC
-MS
GC
-MS
GC
-MS
GC
-FID
NM
R
GC
-MS
TE
-GC
-GC
-MS
(B)
716 717 718 719
720 721