Aerated Wastewater Lagoon Troubleshooting - EPA
300
Aerated Wastewater Lagoon Troubleshooting • Steven M Harris • President • H&S Environmental, LLC • www.lagoonops.com
-
Upload
khangminh22 -
Category
Documents
-
view
2 -
download
0
Transcript of Aerated Wastewater Lagoon Troubleshooting - EPA

Aerated Wastewater
Lagoon Troubleshooting
• Steven M Harris
• President
• H&S Environmental, LLC
• www.lagoonops.com


What we will do today:
•Make introductions
•Describe the general principals behind aerated lagoon troubleshooting
•Go through case studies


ObjectivesIntroduce you to our protocol for optimizing and troubleshooting
aerated wastewater lagoon systems
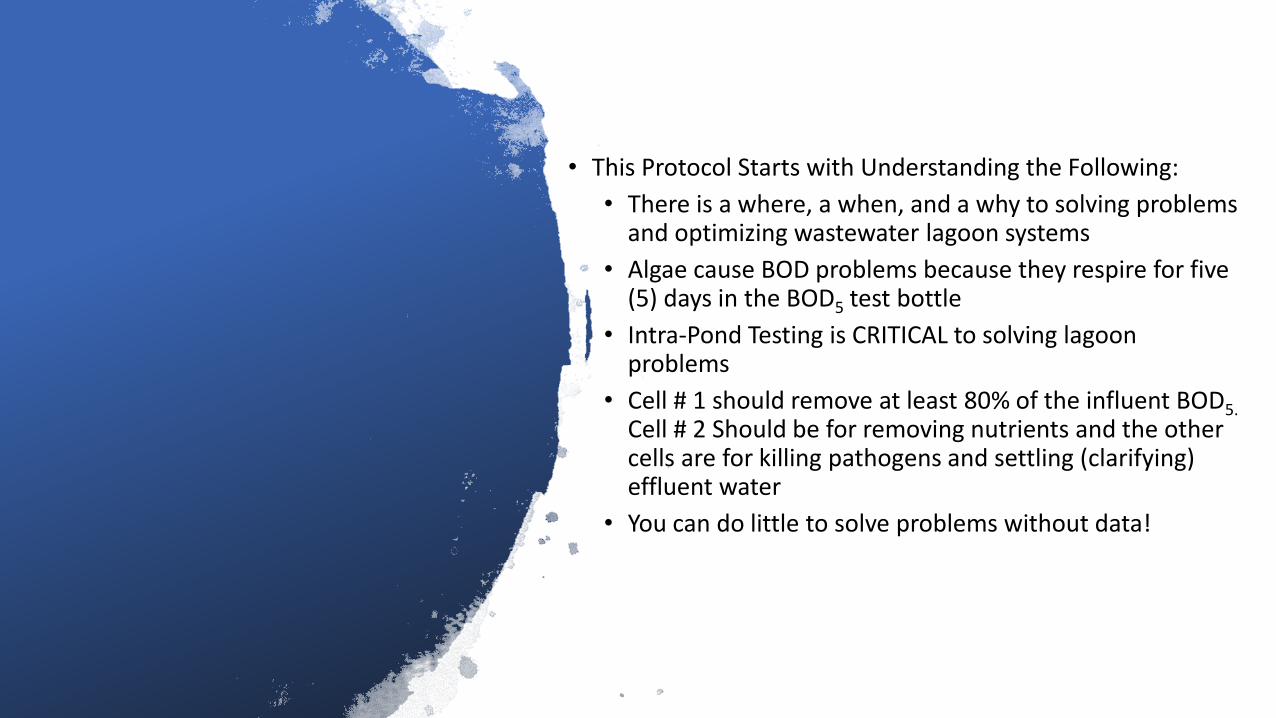
• This Protocol Starts with Understanding the Following:
• There is a where, a when, and a why to solving problems and optimizing wastewater lagoon systems
• Algae cause BOD problems because they respire for five (5) days in the BOD5 test bottle
• Intra-Pond Testing is CRITICAL to solving lagoon problems
• Cell # 1 should remove at least 80% of the influent BOD5.
Cell # 2 Should be for removing nutrients and the other cells are for killing pathogens and settling (clarifying) effluent water
• You can do little to solve problems without data!

• Wastewater lagoons fail for about six (6) main reasons, but they fail largely fail because of two (2) main reasons;
1) Sort-circuiting, and 2) Sludge accumulation
• When and how you test is very important. Composite sampling is the best
• The collection system should be considered as part of your pond system

The Protocol


1) This testing protocol is the basis for understanding what is happening biologically and biochemically in your lagoon, so you can make decisions to optimize a system to meet permit limits.
2) Pinpointing the source and location of a lagoon system’s inefficiencies saves time and money by selecting the right troubleshooting or optimization course of action. It also provides a greater understanding of how and where lagoon systems work and why a system performs the way it does.
3) We combine at least five (5) years of historical data with field grab sample data taken onsite and perform statistical analysis on DMR and system data sets to find correlations leading to the direction optimization and or troubleshooting should take.
4) Field data and historical data are then combined to understand why things are happening in the system, where things are happening, and when it is happening. In this way, we can pinpoint the source of the problem or find the place to focus optimization efforts to meet treatment objectives.

Here is how the optimization/troubleshooting process works; the primary treatment cell is responsible for removing up to eighty percent (80%) of a system’s influent BOD. If the Primary treatment cell is not accomplishing this goal, it tells us that there is:
• Short-circuiting• Too much sludge accumulation• Too little air for the load• A need for pre-treatment (toxicity / loading control)• A need for headworks modification or maintenance• Too great of a load (septage waste, portable toilet waste, vault
waste, illegal drug waste or industrial waste)

If the primary treatment cell can remove 80% of the influent BOD5, then other cells are free to effectively remove nitrogen, settle solids, and kill pathogens.
Not removing 80% of the influent BOD “pushes” the job of BOD removal to subsequent treatment cells. Getting the primary treatment cell to do its job, for example, is critical to successful ammonia removal in wastewater lagoon systems.
This allows the lagoon system to accomplish what the engineer designed the system to do

Cases

Diffused Air System With Too Much Sludge and Too Little Ammonia Removal
Case 1


Number of Exceedances, BOD, 5-day, 20 deg. C MO AVG & MX WK Ave, 6, 5%
Number of Exceedances, Solids, total suspended MO
AVG & MX WK AV, & %
Removal, 6, 6%
Number of Exceedances, Nitrogen, ammonia total (as N) DAILY MX & MO Ave, 84, 78%
Number of Exceedances, Aluminum, dissolved (as Al) DAILY MX & MO Ave, 4,
4%
Number of Exceedances, E. coli, MTEC-MF MAXIMUM, 3,
3%
Number of Exceedances, Chlorine, total residual
MAXIMUM, 4, 4%
Six Years of Permit Exceedances for the XXXX Aerated Wastewater Pond System
BOD, 5-day, 20 deg. C MO AVG & MX WK Ave Solids, total suspended MO AVG & MX WK AV, & % Removal
Nitrogen, ammonia total (as N) DAILY MX & MO Ave Aluminum, dissolved (as Al) DAILY MX & MO Ave
E. coli, MTEC-MF MAXIMUM Chlorine, total residual MAXIMUM

0.00
5.00
10.00
15.00
20.00
25.00
30.00
Jan Feb Mar Apr May Jun Jul Aug Sep Oct Nov Dec
27.0428.12
22.53
20.0919.08
27.77
23.75
21.57
18.98
15.03
18.22
26.05
Six Years of Effluent Ammonia Concentrations Grouped by Month You know you have too much
sludge when your system can’t reduce ammonia to below 1 mg/l
during the summer


Cell # 1 Sludge Blanket Thickness Locations


Effluent pH is Around Neutral

Poor BOD5 Removal…too Much Ammonia is Leaving the Plant
30.6 % BOD Removal in Cell # 1(Should be 80%)67.3% BOD Removal by the Final Cell
42% of the final effluent BOD is caused by nitrification in the BOD5 test bottle
This means more air must be added up front to removal ammonia in the pond system itself. Too much ammonia is getting into the BOD5 test bottle


The saving grace for this system. A clarifier. This is why TSS and even BOD is so low

Low Dissolved OxygenThis lagoon system runs anoxic both day and night, has very poor ammonia removal, poor Cell # 1 BOD5 removal
efficiency, smells, and pops sludge in the final treatment cell.
Case # 2


Poor BOD5 and Ammonia removal can be seen to occur in the XXX system. Poor Cell # 1 BOD5 and effluent ammonia removal efficiency result from too little dissolved oxygen delivered to the microbes required to remove these pollutants.
Lesser treatment facilities across the USA remove ammonia down to 0.5 mg/l during the summer.


1. Strive to maintain a two (2) mg/l dissolved oxygen level in each treatment cell at all
times.
2. Continue to clean and replace diffuser sleeves for better oxygen transfer from the
diffusers
3. Consider adding a headworks to the system to remove the profound amount of trash
entering the pond system every day
4. Consider adding an effluent multiple-level draw-off to pull fewer algae cells and
popped up floating sludge into the effluent
5. Add about five (5) horsepower of mixing to Cell # 3 to drive off CO2 for reduced algae
growth
6. Smoke test the collection system to discover the sources of infiltration and inflow due
to storm events and runoff. Controlling I&I can be one of the best lagoon upgrades
7. Quarterly perform diagnostic BOD and TSS sampling to understand the nature of the
TSS in the effluent. Focus maximizing BOD and ammonia removal from the effluent
of Cell # 1

This is why it is important to take samples, record the data and then trend the data to see if things are getting better or worse after making changes

Case # 3

Balancing Aeration Cells

Final Effluent that Has Been allowed to Sit Fallow for Months

Pulling Samples Between Treatment Cells to Isolate the Problem

Lots of Sludge Trapped in the Effluent Wet Well


Intra-Pond Testing


Maintenance and operational items that need to be addressed as listed below:
• 1) Replace or repair blowers and motors. Completely replace the control panel
• 2) Replace UV bulbs
• 3) Repair diffusers after blowers are replaced or repaired to correctly assess the magnitude of diffuser failure
• 4) Adjust Cell # 4 discharge piping to draw effluent from the lowest to the middle discharge pipe. Cease discharging from Cell # 3 to the effluent and direct all effluent flow to Cell # 4.
• 5) Purchase a DO/pH meter. A dissolved oxygen/pH meter is essential to running the xxxx pond system. A DO meter will help balance air delivery to the system and help Tanner know from which pipe to discharge. A pH meter will help meet pH permit limits as adjustments are made to the valving of the effluent discharge
• 6) Run all treatment cells at a uniform depth…fifteen (15) feet or greater.
• 7) Adjust valving to split flow evenly when running Cells 1 & 2 in parallel. Stop discharge to the effluent of Cell # 3 water! Discharge through Cell # 4 exclusively! Cell # 4 is where the water quality can be controlled through the multiple level piping configurations.
• 8) Begin recording lift station run times to calculate influent flow and loading.
• 9) Begin to sample routinely as outlined in the XXXXX discharge permit
• 10) Test again after ninety (90) days to measure the success of operational changes that have been made

Sludge at the Effluent Structure


This is what 30-year-old sludge looks like

Sludge at the Effluent Structure
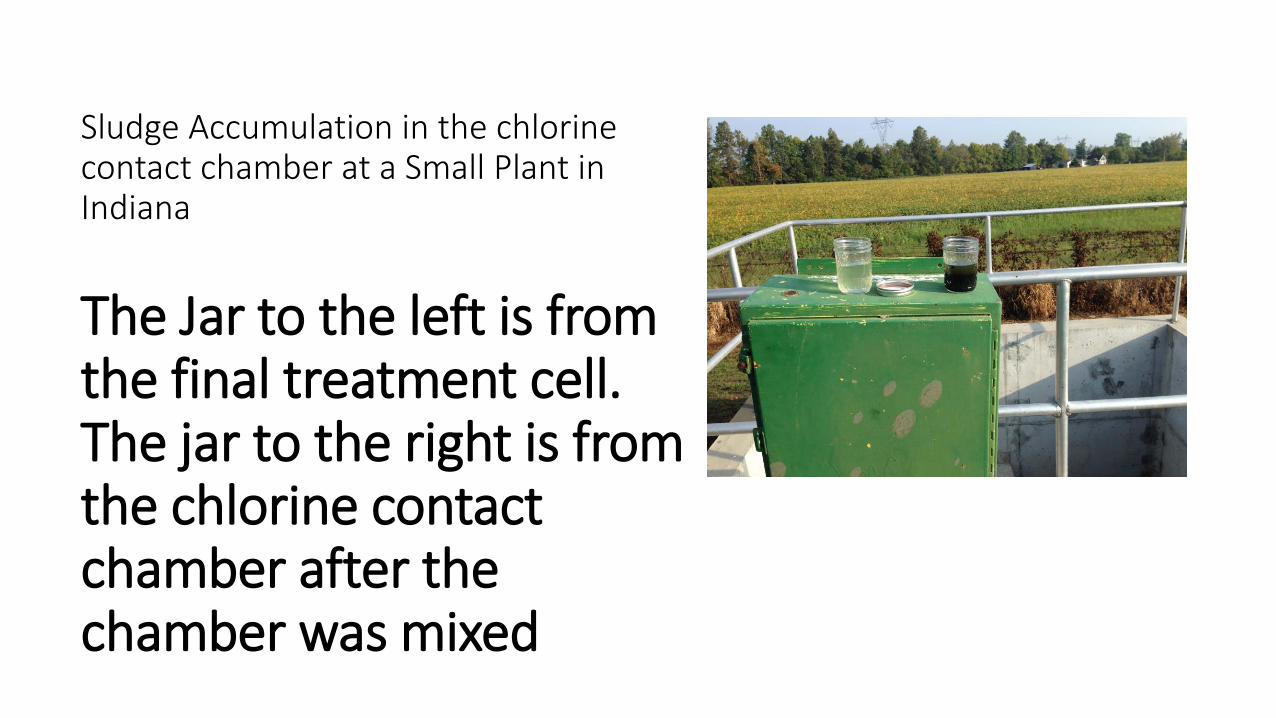
Sludge Accumulation in the chlorine contact chamber at a Small Plant in Indiana
The Jar to the left is from the final treatment cell. The jar to the right is from the chlorine contact chamber after the chamber was mixed

Three Feet of Sludge at the Effluent Structure

sludge accumulation at the effluent structure

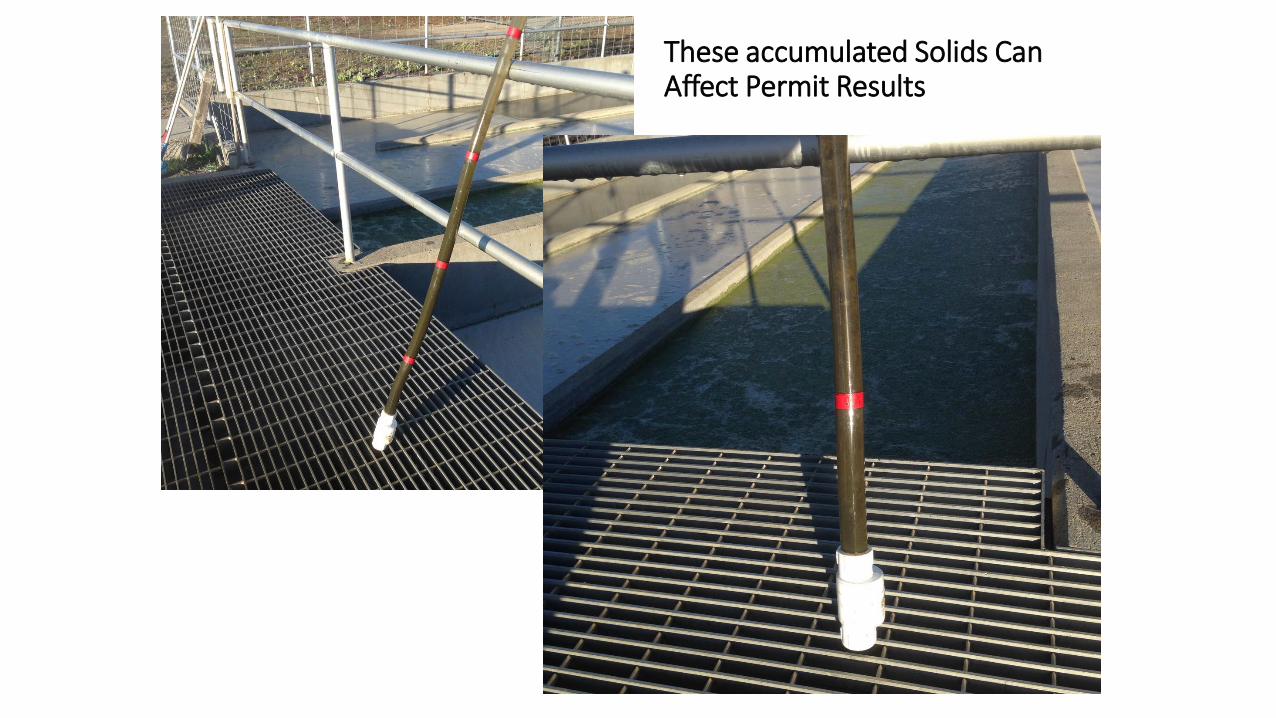
These accumulated Solids Can Affect Permit Results


Solids at the effluent can cause sporadic test results as sludge “burps” up whenever


Discharge Cell

Sludge in the Discharge Well

Sludge in the UV Tank

A Word About SludgeIts impact on pond systems

This is what benthal feedback looks like
0
5
10
15
20
25
30
35
40
Ammonia Nitrate Ortho Phos
35.9
1.383.28
11.44
2.07
6.2
1.099
3.98
7.45
Field Nutrient Sampling Results on
January 24, 2020
Influent Cell # 1 Effluent Final EffluentTested Using a Portable HACH DR 1900
Spectrophotometer

0
10
20
30
40
50
60
70
80
BOD5 CBOD5 SBOD5 TSS Ammonia OrthoPhosphate
79
62
30.8
2.1
35
20
53
16 14
51
1513
7
1
6.9
Intra-Pond BOD5 Laboratory Results for the XXXX Wastewater Pond System
Influent Cell # 1 Effluent Cell # 2 Effluent Final EffluentSampled by XXXX

Sludge accumulation like this is common in diffused air systems

Solids Accumulate Where There is Not Enough Mixing Energy to Suspend solids

Here is what accumulated sludge looks like over time:
53.953.8
31.1
69
58.956.7
69.968.6
48.4
41.344.5
56.7
52.2
66.7
48.4
43.9
75.5
64.4
36.737.8
44 42.8
51.153.9
47.6
60
83.6
78
130
65.863.4
51.1
37.8
18.9
27.2
53.8
6061.7
71.6
96.1
68.966.7
54.556
49.548.952
57.8
8076.9
91.1
70.572
67.2
39.5
55.6
41.1
0
20
40
60
80
100
120
140
Efflfuent TSS MO Ave


24.
30.
25.
20.
28.
13.12.
51.
32.
26.430.
21.3
7.3
17.
32.5
52.
40.
30.
23.3
28.
12.
24.
15.
50.
41.
19.
32.5
19.
55.
22.
34.
46.
53.
69.
106.
62.
74.
2.6
51.
42.
77.77.
18.
59.
41.
30.
76.72.
48.
55.
45.43.
10.
16.
47.
20.
43.
48.
69.
.
20.
40.
60.
80.
100.
120.
.
100.
200.
300.
400.
500.
600.
700.
800.
900.
1000.
02/0
1/20
01
07/0
1/20
01
12/0
1/20
01
05/0
1/20
02
10/0
1/20
02
03/0
1/20
03
08/0
1/20
03
01/0
1/20
04
06/0
1/20
04
11/0
1/20
04
04/0
1/20
05
09/0
1/20
05
02/0
1/20
06
07/0
1/20
06
12/0
1/20
06
05/0
1/20
07
10/0
1/20
07
03/0
1/20
08
08/0
1/20
08
01/0
1/20
09
06/0
1/20
09
11/0
1/20
09
04/0
1/20
10
09/0
1/20
10
02/0
1/20
11
07/0
1/20
11
12/0
1/20
11
05/0
1/20
12
10/0
1/20
12
03/0
1/20
13
08/0
1/20
13
01/0
1/20
14
06/0
1/20
14
11/0
1/20
14
04/0
1/20
15
09/0
1/20
15
02/0
1/20
16
07/0
1/20
16
12/0
1/20
16
05/0
1/20
17
10/0
1/20
17
03/0
1/20
18
08/0
1/20
18
01/0
1/20
19
06/0
1/20
19
11/0
1/20
19
Twenty Years of Influent and Effluent Total Suspended Solids
Influent TSS Effluent TSS, mg/l, MO Ave Linear (Influent TSS) Linear (Effluent TSS, mg/l, MO Ave)


0
10
20
30
40
50
60
70
80
BOD5 CBOD5 SBOD5 TSS Ammonia OrthoPhosphate
79
62
30.8
2.1
35
20
53
16 14
51
1513
7
1
6.9
Intra-Pond BOD5 Laboratory Results for the XXXX Wastewater Pond System
Influent Cell # 1 Effluent Cell # 2 Effluent Final EffluentSampled by XXXX
Here is an example of benthal feedback…nutrient release from the sludge blanket.
This system has a severe effluent TSS problem.
Sampled last month. Temperatures 5.5 degrees C

Diagnostic BODs

BOD5 CBOD5SBOD5 SCBOD5
TSS Filter
1 – 1.5 umTSS Filter
1 – 1.5 um
Regular BOD5 Carbonaceous
BOD5
Soluble
BOD5
Soluble
Carbonaceous BOD5
Diagnostic BOD5 Tests

Diagnostic BOD5 Tests
BOD5 CBOD5 SBOD5SCBOD5
TSS Filter
1 – 1.5 umTSS Filter
1 – 1.5 um
Regular BOD5
Carbonaceous BOD5
Soluble BOD5
Soluble
Carbonaceous BOD5
Nitrification Algae Sludge, Benthal
Feedback


0
10
20
30
40
50
60
70
80
BOD5 CBOD5 SBOD5 TSS Ammonia OrthoPhosphate
79
62
30.8
2.1
35
20
53
16 14
51
1513
7
1
6.9
Intra-Pond BOD5 Laboratory Results for the XXXX Wastewater Pond System
Influent Cell # 1 Effluent Cell # 2 Effluent Final EffluentSampled by XXXX

It is Important to know Where the Problem is Occurring
270
44
63
45
224
110
3.4
2028
0
50
100
150
200
250
300
BOD (mg/l)
Influent Pond # 1 Pond # 2 Pond # 3 Pond # 4 Effluent Soluble
Effluent
Effluent TSS Effluent
CBOD
BOD Analysis for Nipomo CSD, Southland Plant
BOD
Samples taken
on 11/23/2005
84%BOD Removal


What do you suppose the difference in pH would be? BOD5? TSS?
Picture Courtesy of Mark Court, Wyoming Rural Water Association

6 mg/l
100 mg/l
Both Pond # 3 Discharges!!!
94 mg/l caused by algae consuming oxygen in the BOD5 test bottle for 5 days

Diagnostic TSS

Diagnostic TSS
•TSS = BTSS + ATSS + MTSS
•BTSS is suspended bacterial solids
•ATSS is the algal component of
TSS
•MTSS is silt, clay, cell debris,
bottom
solids


Solids Types Lost to the Effluent
• Raw Wastewater Solids - Short Circuiting or
Poor aeration
• Old Sludge Particles - Sludge buildup
• Treatment Solids (bacterial flocs)organic overload or sludge accumulation
• Filamentous Bacteria - indicates low D.O. or septicity
• Sulfur Bacteria - anoxic conditions and sulfides forming
• Algae or Protozoa

This is an effluent structure

What would Sludge Look Like on a TSS Filter Under the Microscope?

Hydraulics


Drogues set at influent of Cell # 1 and traveled to the effluent of Cell # 1 in 45 minutes!

“Short-circuiting is the greatest deterrent to successful pond performance, barring any toxic effects. The importance of the hydraulic design of a pond system cannot be overemphasized”
- Middlebrooks


The Hydraulic Difference Between Types of Aeration

The Effect of Switching Aerator Types at the Wasco State Prison

BOD5 (mg/l)TSS (mg/l)
BOD Violations
TSS Violations
62
52
100 %Improvement
89 %Improvement
1424
01
0
10
20
30
40
50
60
70
80
90
100
Performance of New Lagoon System Since Upgrade to
Dual Power Multi-Cell System
New Dual Powered Upgrade Lagoon Effluent
Percent Reductiton (%)
Saves $110,000/year in energy costs using 8 less aerators
Total Construction Cost Including stabilizing lagoon embankments: $650,000


Notice the Dead Zones

Warm Streak Right
Down the Center of
the Lagoon


Center of Pond Influent Structure

Spatial Changes in D.O. Measurements at Bishop, CA

Spatial Changes in D.O. Measurements at Bishop, CA

XXXX Pond Hydraulics
Repositioning Aerators for Enhanced Hydraulics Performance

XXXX Cell # 1
Influent

• XXX the plant operator floated lemon drogues to observe the path of the flow.
• Lemon drogues floated south along the dike and out with the effluent in just six (6) hours!
• The engineers designed the cell to operate with a twelve (12) day retention time

• Moving aerators southward caused the influent flow to move north, around the aerator.
• Now it takes nine (9) days for a lemon to reach the effluent

Aerators Moved South Now Flow Follows a more Plug-Flow Pattern

Picture Taken 3.15.2013


An aerator creates a momentum force pushing water in all directions. Notice
how the flow moves north

Observe the waves caused by the aerator


The Momentum Force Reaches Out

Notice the flow of the influent mass


Old Configuration
New Configuration
New Aerator Configuration Places Aerator Closer to Influent and in a position to Direct the Flow Path for Optimized Retention

Diagnostic Tools

5/1/2007, 29.00
BOD5, 3/1/2013, 29.00BOD5, 11/1/2013, 30.00
BOD5, 05/27/14, 27.00
5/1/2007, 8.00
TSS, 3/1/2013, 23.00
TSS, 11/1/2013, 6.00
TSS, 05/27/14, 8.00
0.00
10.00
20.00
30.00
40.00
50.00
60.00
1/1/2007 1/1/2008 1/1/2009 1/1/2010 1/1/2011 1/1/2012 1/1/2013 1/1/2014
Effluent TSS and BOD5 on the Same ScaleShowing Signs of Nitrification
BOD5
TSS
Typically Effluent TSS is 1.5 times Greater than the Effluent BOD5. When Effluent BOD5 is Greater than Effluent TSS in the Same Sample, on the Same Day, Nitrification in the BOD5 Test Bottle is Indicated

4.0
9.0
6.0 6.0
3.0
6.0
5/1/2007, 18.0
8.0
4.0
11.010.0
3.5 4.0
0.9
6.0
3.02.0
3.0
4/1/2010, 15.0
0.9
8.0
6/3/2011, 11.0
5.0
1.0
27.0
6.0
4.0
16.0
3.0
8.0
1.01.0 1.0
7.0
1.0
3.03.0
4
13
47
10
16
3
10
22
5
19
15
3 3 2.9
8
2.9 3 3 3
6
56
8
25
42
11
4
32
76 6 6
15
6 6
88
0
5
10
15
20
25
30
35
40
45
50
10/1/2005 10/1/2006 10/1/2007 10/1/2008 10/1/2009 10/1/2010 10/1/2011 10/1/2012 10/1/2013 10/1/2014
Beau Chene's Effluent TSS and BOD Charted on the Same Scale
BOD5
TSS
Possible Occurances of Nitrification when the Vegitative Cover was Off and Dissolved Oxygen Presnet

BOD can Also Be Greater Than TSS During the Winter

3/1/2013, 33.88
3/1/2014, 47.83
2/1/2015, 37.18
2/1/2016, 57.58
3/1/2017, 45.10
3/1/2018, 55.90
4/1/2018, 57.05
0.00
10.00
20.00
30.00
40.00
50.00
60.00
70.00
80.00
90.00
100.00Chart Title
BOD, 5-day, 20 deg. C MO AVE mg/l TSS mg/l MO Ave
On those days when BOD Exceeds TSS it is an indication of ice cover and lack of
treatment / short-circuiting or Nitrification in the BOD test bottle

Case for Solving an Overloading Problem
Case # 4

0
20
40
60
80
100
120
140 135
102104
68
49
38
73 73
2724
14
26
36
20
44
32
53.6
46.6
27.930.6 33.6 35.6
26.1 26.7
18.715.9 17.9
14.7
28.6
22.6
13.1 15.2
TSS & CBOD Improvement from 2012 to 2013 After Adding Aeration
TSS CBOD

0
10
20
30
40
50
60
70
TSS CBOD
68.34
32.9229.6
20.01
Changes in BOD and TSS From May 2012 to May 2013 after adding Aeration
Average May 2012 Results Average May 2013 Results
57% Improvement in TSS Results
39% Improvement in CBOD Results

0
20
40
60
80
100
120
140
Effluent CBOD for Ft Recovery after Adding Aeration and the Cessation of Added Industrial Food Processing Waste
TSS BOD
Linear (TSS) Linear (BOD)

USEPA ECHO Charts


Coliform ViolationCase Study # 5

230587
Coliform CFU/100 ml, 8/15/12, 15600
6601000
19802300
1038
2500
8401160
24040024028016975210
Coliform CFU/100 ml, 12/11/13, 7300
830
1483
37088131156125330156156
5471100
1340
600200220
500
1600
63250
Coliform CFU/100 ml, 9/23/15, 8000
Coliform CFU/100 ml, 10/14/15, 3600
250175240
Coliform CFU/100 ml, 2/10/16, 3900
690370
50 2000
2000
4000
6000
8000
10000
12000
14000
16000
18000
6/1
3/1
2
8/1
3/1
2
10
/13
/12
12
/13
/12
2/1
3/1
3
4/1
3/1
3
6/1
3/1
3
8/1
3/1
3
10
/13
/13
12
/13
/13
2/1
3/1
4
4/1
3/1
4
6/1
3/1
4
8/1
3/1
4
10
/13
/14
12
/13
/14
2/1
3/1
5
4/1
3/1
5
6/1
3/1
5
8/1
3/1
5
10
/13
/15
12
/13
/15
2/1
3/1
6
4/1
3/1
6
6/1
3/1
6
Coliform CFU/100 ml
Coliform CFU/100 ml
Linear (Coliform CFU/100 ml)


1.6
7/11/12, 0.734
8/15/12, 4.34
4.03
2.32
3.94
12/12/12, 6.16
1/9/13, 6.64
3.55 3.56
4/10/13, 4.58
2.38
1.55
7/17/13, 0.998
2.192.17
2.25
3.12
12/11/13, 4.89
3.14
3.21
2.99
4/23/14, 5.15
2.99
1.3
1.13
8/20/14, 0.599
9/17/14, 6
2.02
2.9
3.6
3.023.13
3/11/15, 3.78
2.97
1.74
6/10/15, 0.2187/22/15, 0.317
1.16
9/23/15, 3.07
1.59
1.79
2.39
1.54
1.92
2.044/13/16, 2.15
1.69
6/15/16, 0.3
0
1
2
3
4
5
6
7
NO2 NO3 eff
NO2 NO3…

11
24.5
28.5
6.29
18.2
28.5
22.7
35.1
13.9
27.5
35.6
24.5
37.5
20.721.5
11.3
7.18
3.54
8.3510.1
8.3510
8.2
30.9
9.28
18.9
14.2
10.712.4
13.9
6.115.586.71
13.3
16.1
78.878.7
31.230.2
13.4
9 7.937.11
1.88
6.03
10.8
78.4
29.2
15.5
0
10
20
30
40
50
60
70
80
90
BOD eff
BOD eff
Linear (BOD eff)

6/13/12, 23.17/11/12, 20.9
8/15/12, 29.2
9/12/12, 6.3
10/17/12, 15.3
11/14/12, 8.5
12/12/12, 21.1
1/9/13, 40.5
2/14/13, 213/13/13, 21.3
4/10/13, 67
5/22/13, 28.4
6/12/13, 54.6
7/17/13, 33.4
8/14/13, 28
9/18/13, 910/23/13, 7.1
11/13/13, 3.5 12/11/13, 3.11/22/14, 3.5
2/26/14, 6.43/12/14, 7.24/23/14, 8.38
5/21/14, 5.8
6/18/14, 20.5
7/23/14, 32.4
8/20/14, 29.6
9/17/14, 15.6
10/22/14, 13
11/12/14, 7.73
12/10/14, 4.71/14/15, 4
2/25/15, 10.2
3/11/15, 17.24/15/15, 16.6
5/13/15, 28
6/10/15, 72
7/22/15, 34
8/24/15, 25.6
9/23/15, 10
10/14/15, 6.2
11/11/15, 2
12/9/15, 13.5
1/20/16, 2.9
2/10/16, 12.7
3/9/16, 4.8
4/13/16, 75
5/11/16, 13.2
6/15/16, 17.1
0
10
20
30
40
50
60
70
80
TSS eff
TSS eff
Linear (TSS eff)


0
50
100
150
200
250
300
350
400
Influent Cell 1 effluent Cell 2 effluent Cell 3 & 4 effluent Surface of Cell 3 Surface of Cell 4
2.59
30.112.92 1.58 2 2
0.53 0.63 2.86 1.14 0.27 1.05
294
400
311
400
372
400
Intra-Pond Ammonia, Nitrate, and Alkalinity
Ammonia Nitrate Alkalinity


Item Units Cell 1 Cell 2 Cell 3 Cell 4 Total
Bottom Length feet 80 80 45 45
Bottom Width feet 80 80 41 41
Side Slopes 1 to 3 3 3 3
Average Sludge Depth feet 1.08 0.1 0.4 0.29
As-Built Bottom Elevation feet 4901.00 4899.50 4899.00 4899.00
As-Built Top-of-Bank Elevation feet 4914.00 4912.50 4911.00 4914.00
Bottom Area sq ft 6,400 6,400 1,845 1,845
Top of Sludge Length feet 86.48 80.6 47.4 46.74
Top of Sludge Width feet 86.48 80.6 43.4 42.74
Top of Sludge Area sq ft 7,479 6,496 2,057 1,998
Sludge Volume cu ft 7,495 645 780 557
Sludge Volume gallons 56,059 4,823 5,838 4,168 70,888 Sludge Mass dry tons
Embankment Height feet 4914.00 4912.50 4911.00 4914.00
Freeboard Required feet 3 4 4 4
Useable Remaining Lagoon Depth feet 8.75 10.07 9.52 9.63
Top of Water Max Length feet 158 158 123 123
Top of Water Max Width feet 158 158 123 123
Top of Water Max Area sq ft 24,964 24,964 15,129 15,129
Lagoon Volume cu ft 137,218 157,918 80,796 81,730
Current Usable Lagoon Volume
using Actual Water Depths gallons 1,026,387 1,181,225 604,356 611,339 Flow 25,000 gpd
Retention Time at 25,000 gpd days 41.1 47.2 24.2 24.5 137


So, Why do you think there was a coliform problem?• Clear water
• NO sludge in Cells 3 & 4 that discharge to the final effluent structure
• High pH…over 9
• Dissolved Oxygen at 11 mg/l

How Could You Confirm it Was Accumulated Sludge in the Transfer Wells?

Every time you measure coliform from the transfer structure also measure from the surface of Cell # 4Compare the two. Your chances of finding high coliforms are high from 9/2016 to 2/2017

Ammonia RemovalCase # 6


0 5 10 15 20 25
0.5
1
2
3
0.19
0.1
0.09
0.09
7
7.2
7.2
7.2
24.9
24.2
22.8
23.7
Cell 1 DO Profile at the XXX Wastewater Pond System
Dissolved Oxygen (mg/l) pH Temperature (oC)Sampled on 9/25/2017 at 1:00 PM
Depth (ft)


0 5 10 15 20 25 30 35
0.5
1
2
3
4
0.25
0.24
0.18
0.12
0.08
7.9
7.8
7.7
7.7
7.5
25.4
22.7
33.3
22.2
21.7
Dissolved Oxygen Profile of Cell # 3 of the XXX Wastewater Pond System
Dissolved Oxygen (mg/l) pH Temperature (oC)

0
5000000
10000000
15000000
20000000
25000000
Acres Sq ft Depth Volume Estimated Days ofRetention Time
8.18
356,292
3.82
10,180,544
45.97.3
317,781 3.75
8,913,757
40.22.18
95,1434.5
3,202,513
14.617.66
769,216
22,296,814
100.7
Estimated Retention Time for the XXX Wastewater Pond System Assuming No Sludge Accumulation
Cell 1 Cell 2 Cell 3 Total
These are rough estimates only. All Cells are irregularly shapped and Cell # 3 has a sloped bottom ranging from 3.5 to 12 feet

0
5000000
10000000
15000000
20000000
25000000
Acres Sq ft Depth Volume Estimated Days ofRetention Time
EstimatedRetention Time
with AccumulatedSludge
8.18
356,292
3.82
10,180,544
45.9
277.3
317,781
3.75
8,913,757
40.2262.18
95,1434.5
3,202,513
14.6 4
Total, 17.66
Total, 769,216
22,296,814
100.7 57
XXXX Wastewater Lagoon System Estimated Volumes and Retention Times
Cell 1 Cell 2 Cell 3 TotalThese are estimates only as the ponds are irregular in shape, have uneven pond bottoms, and Cell # 3 has a sloped bottom rtanging from 3.5 tpm 12 feet deep

0
20
40
60
80
100
120
Raw InfluentBOD
Leaving Cell #1CBOD
Leaving Cell #1BOD
Leaving Cell #2CBOD
Leaving Cell #2BOD
Leaving Cell #3SCBOD
Leaving Cell #3SBOD
Leaving Cell #3CBOD
Leaving Cell #3BOD
119
17.2
52
8.67
24.9
0.402 0.2673.03 3.37
BOD and CBOD from XXX Lab Showing the Presence of Nitrifying Bacteria at Workin the Pond System to Remove Ammonia
34.8 mg/l of oxygen demand is caused by nitrification in the Albany System
Cell # 1 has an 85.5% CBOD removal efficiency
System continues to nitrify in Cell # 2 Ammonia removed so little
difference between CBOD and BOD
Tested in 9/2017

0
50
100
150
200
250
300
350
400
Influent Cell # 1 effluent Cell # 2 Effluent Cell # 3 Effluent
4722.68
5.66
0.7490.69
0.64 1.17
2.77
400 400
240.8255.3
Intra-Pond Ammonia, Nitrate and Alkalinity Grab Sample Results for the XXXX Wastewater Pond System
NH4 NO3 AlkalinitySampled and Tested on 9/25/2017
The production of nitrate along with the reduction in alkalinity and ammonia is a sign that ammonia is being removed through nitrification

0
5
10
15
20
25
30
Influent NH3 byElement Labs
Pond #3 EffluentNH3 by Element
Labs
Influent NH3 Effluent Pond #1NH3
Effluent Pond #2NH3
Effluent Pond #3NH3
26.3
9.9
23.3
11.1
13
8.1
Intra-Pond Ammonia as Sampled by Element Labs and the XXXX Staff
Sampled on 9/22/2016

Effluent Pond #3 TSS, 3/3/2016, 74
Effluent Pond #3 TSS, 2/23/2017, 65.5
Effluent CBOD Pond #3, 3/17/2016, 27.6
Effluent CBOD Pond #3, 2/9/2017, 21.4
0
5
10
15
20
25
30
0
10
20
30
40
50
60
70
80
Effluent TSS and CBOD5 for the XXXX Wastewater Pond System
Effluent Pond #3 TSS Effluent CBOD Pond #3

0
5
10
15
20
25
Influent NH3 byelement Labs
Pond #3 EffluentNH3 by element
Influent NH3 byAlbion Staff
Effluent Pond #1NH3 by Staff
Effluent Pond #2NH3 by Staff
Effluent Pond #3NH3 by Staff
20.5
0.16
17.716.6
3.9
0.2
Intra Pond Ammonia Results by Element Labs and the Staff at XXXX
Tested on 9/7/2017
Only 1.1 mg/l of ammonia removal occuring in Cell # 1 in this grab sample


0
2
4
6
8
10
12
14
16
18
20
Jan Feb Mar Apr May Jun Jul Aug
15.74
18.24
16.81
8.13
2.91
1.79
4.314.75
Five Years of Monthly Average Effluent Ammonia Concentrations

Popping sludge is a sign of denitrification as a result of low dissolved oxygen concentrations

Aeration/Mixing Power
Case # 7

0 2 4 6 8 10 12
8
7
6
5
4
3
2
1
0.5
5.7
5.7
5.7
5.7
5.8
5.8
5.8
5.9
6
11.9
11.9
11.9
12
12
11.8
11.6
11.6
11.8
Dissolved Oxygen Profile for Cell # 1 at the Blackwater WWTF
D.O. at 12:00:00 PM
D.O. at 6:30 AM
0 2 4 6 8 10 12 14
9
8
7
6
5
4
3
2
1
0.5
7.6
7.6
7.6
7.6
7.6
7.6
7.6
7.7
7.7
7.7
12.5
12.5
12.3
12.4
12.4
12.4
12.4
12.5
12.5
12.6
Dissolved Oxygen Profile for Cell # 2 of the Blackwater WWTF
D.O. at 11:55 PM
D.O. at 6:25 AM
D.O. taken under dark conditions before sunrise.
Solar Noon for Blackwater at 12:33 PM
0 5 10 15 20 25
10
9
8
7
6
5
4
3
2
1
0.5
0.2
0.2
0.2
0.2
0.3
0.3
0.7
6.9
16.8
16.6
16.3
0.4
0.4
0.5
0.7
1.2
4.1
16.8
20.3
19.8
19.5
19.5
Dissolved Oxygen Profile of Cell # 3 of the Blackwater Lagoon System
D.O. at 11:50 PM
D.O. at 6:00 AM
D.O. taken under dark conditions before sunrise.
Solar Noon for Blackwater at 12:33 PM
Pond Depth (ft)

The uniformity of these numbers across the pond and at depth tells us there is good mixing in this
pond
0 2 4 6 8 10 12
8
7
6
5
4
3
2
1
0.5
5.7
5.7
5.7
5.7
5.8
5.8
5.8
5.9
6
11.9
11.9
11.9
12
12
11.8
11.6
11.6
11.8
Dissolved Oxygen Profile for Cell # 1 at the Blackwater WWTF
D.O. at 12:00:00 PM
D.O. at 6:30 AM

0 2 4 6 8 10 12 14
9
8
7
6
5
4
3
2
1
0.5
7.6
7.6
7.6
7.6
7.6
7.6
7.6
7.7
7.7
7.7
12.5
12.5
12.3
12.4
12.4
12.4
12.4
12.5
12.5
12.6
Dissolved Oxygen Profile for Cell # 2 of the Blackwater WWTF
D.O. at 11:55 PM
D.O. at 6:25 AM
D.O. taken under dark conditions before sunrise.
Solar Noon for Blackwater at 12:33 PM

Notice the Stratification in this Non-aerated Polishing Pond
0 5 10 15 20 25
10
9
8
7
6
5
4
3
2
1
0.5
0.2
0.2
0.2
0.2
0.3
0.3
0.7
6.9
16.8
16.6
16.3
0.4
0.4
0.5
0.7
1.2
4.1
16.8
20.3
19.8
19.5
19.5
Dissolved Oxygen Profile of Cell # 3 of the Blackwater Lagoon System
D.O. at 11:50 PM
D.O. at 6:00 AM
D.O. taken under dark conditions before sunrise.
Solar Noon for Blackwater at 12:33 PM
Pond Depth (ft)

Could Aeration be Cut Back?
• How would you know if you could cut aerator run times?
• What measurements would you take?
• What precautions would you take in cutting aerator run times?

Pond # 1

Pond # 2

Pond # 3

Pond # 3

Pond # 3 Influent Pipe

Pond # 3 Influent Pipe

Low Air Case


0.00
1.00
2.00
3.00
4.00
5.00
6.00
7.00
8.00
9.00
10.00
1 2 3 4 5 6 7 8 9 10 11 12 13 14 15 16 17 18 19 20
2.92
2.50
3.92
3.08 3.17
1.58
0.75 0.75
1.92
2.92
2.33
2.75
0.58
1.83
2.17
3.33
2.502.75
1.83
3.08
Cell # 1 Sludge Blanket Thickness Profile for the xxxxx Wastewater Pond System
Sludge Blanket Thickness (ft)
Average Sludge Blanket Thickness: 2.33 ftAverage Water Depth 9.99 ftSludge Volume: 1,020,484 gallons

0.00
1.00
2.00
3.00
4.00
5.00
6.00
7.00
8.00
9.00
10.00
1 2 3 4 5 6 7 8 9 10 11 12 13 14 15 16 17 18 19 20
1.331.67
1.501.83
2.50
0.42 0.33
1.67 1.671.50
0.830.50 0.50
2.17
1.67 1.92
3.00
2.33
1.50
2.00
Cell # 2 Sludge Blanket Thickness Profile for the XXXXXX Wastewater Pond System
Sludge Blanket Thickness (ft)
Average Sludge Thickness: 1.54 feetAverage WaterDepth: 10.02 ftSludge Volume: 660,745 gallons

0
20
40
60
80
100
120
140
160
180
200
BOD CBOD SBOD TSS Phosphorous
200
179
7.01
49
3939
178 5 3.8
18
6
Intra-Pond BOD, CBOD, & TSS for the XXXXXXWastewater Pond System
Influent
Cell # 1 Effluent
Cell # 2 Effluent
Cell # 3 Effluent

0
50
100
150
200
250
Cell # 1 Influent Cell # 1 Effluent Cell # 2 Influent Cell # 2 effluent Cell # 3 Influent Cell # 3 Effluent
6 60 0 0 00 0
20 20
5 50 0 3 3 1 1.5
240 240 240 240 240 240
Intra-Pond Test Strip Nutrient Results for the Pond System atXXXXXX
NH4
NO3
NO2
Alkalinity

0
5
10
15
20
25
30
35
40
45
50
Cell # 1 Influent Cell # 1 Effluent Cell # 2 Influent Cell # 2 effluent Cell # 3 Influent Cell # 3 Effluent
47 47
1.54 12.4 2.8
0.5 0.5
14.215.5
5.4 5.6
0.6 0.6
2.72 2.26
0.81 0.75
Intra-pond Ammonia, Nitrate, and Nitrite for the XXXXXX Wastewater Pond System
NH4
NO3
NO2
Sampled on
7/20/2016

0
50
100
150
200
250
300
350
400
Cell # 1 Influent Cell # 1 Effluent Cell # 2 Influent Cell # 2 effluent Cell # 3 Influent Cell # 3 Effluent
47 47
1.54 1 2.4 2.80.5 0.514.2 15.5
5.4 5.60.6 0.6 2.72 2.26 0.81 0.75
400 400
288
333326 327
Intra-Pond Ammonia, Nitrate, Nitrite, and Alkalinity for the XXXXX Wastewater Pond system
NH4
NO3
NO2
Alkalinity

0.35 0.23 0.26 0.23
0.941.11
0.94
0.41
0.820.65 0.8 0.79
3.6
2.14
6.49 6.57
3.45
8.9
5.59
8.47
3.13 2.973.31
9.26
0
1
2
3
4
5
6
7
8
9
10
Cell # 1
/point 1
Cell # 1/
Point 2
Cell # 1 /
point 3
Cell # 1 /
point 4
Cell # 2/
point 1
Cell # 2 /
point 2
Cell # 2 /
point 3
Cell # 2 /
point 4
Cell # 3 /
point 1
Cell # 3 /
point 2
Cell # 3 /
point 3
Cell # 3 /
point 4
Sunrise and Noon Hour Dissolved Oxygen Concentrations Across all Three Treatment Cells of the XXXXXX
Wastewater Pond System
DO AM/Sunrise
DO PM/Noon
Sampled on 7/20/2016

0 0.05 0.1 0.15 0.2 0.25 0.3 0.35 0.4
0.5
1
2
3
4
5
6
7
8
0.37
0.19
0.18
0.14
0.14
0.12
0.12
0.11
0.11
Dissolved Oxygen Profile for Cell # 1 at the XXXXXX Wastewater Pond System
Dissolved Oxygen (mg/l)
Sampled on 7/20/2016 at 7:40 AM
Depth (ft)

0 0.1 0.2 0.3 0.4 0.5 0.6
0.5
1
2
3
4
5
6
7
8
9
10
0.6
0.35
0.27
0.2
0.23
0.18
0.19
0.17
0.14
0.13
0.11
Dissolved Oxygen Profile for Cell # 2 at the XXXXXXXX Wastewater Pond System
Dissolved Oxygen (mg/l)
Sampled on 7/20/2016 at 8:19 AM

0 0.1 0.2 0.3 0.4 0.5 0.6
0.5
1
2
3
4
5
6
7
0.57
0.58
0.49
0.44
0.45
0.42
0.41
0.43
Dissolved Oxygen Profile for Cell # 3 at the XXXXXX Wastewater Pond System
Dissolved Oxygen (mg/l)
Sampled on 7/20/2016 at
8:52 AM


E. coli, MTEC-MF MO AVG, 13, 35%
E. coli, MTEC-MF WKLY AVG, 17, 46%
BOD, carbonaceous, 05 day, 20 C MO AVG,
2, 5%
BOD, carbonaceous, 05 day, 20 C WKLY AVG, 4, 11%
BOD, carbonaceous, percent removal MO AV MN, 1, 3%
Number of Exceedances From January 2000 to January 2020
E. coli, MTEC-MF MO AVG E. coli, MTEC-MF WKLY AVG
BOD, carbonaceous, 05 day, 20 C MO AVG BOD, carbonaceous, 05 day, 20 C WKLY AVG
BOD, carbonaceous, percent removal MO AV MN

A Word About Duckweed

Duckweed


A Word about Duckweed


TSS violations due to dilute influent and too much sludge
Case # 8


BOD5 MO Ave (mg/l), 2, 3%
BOD5 Percent Removal, 9, 13%
E. coli #/100, 6, 9%
Dissolved Oxygen (mg/l), 1, 2%
pH, 3, 4%
Total Suspended Solids Percent
Removal, 22, 32%
Total Suspended Solids (mg/l), 25,
37%
Number of Violations by Type Over the Past Five Years and Eight Months for the XXXX Wastewater Pond System
BOD5 MO Ave (mg/l) BOD5 Percent Removal E. coli #/100
Dissolved Oxygen (mg/l) pH Total Suspended Solids Percent Removal
Total Suspended Solids (mg/l)

0
20
40
60
80
100
120
Five Years and Eight Months of Permit Violations for the XXXXX Wastwater Pond system
The Last Eleven (11) Permit Vollations Since 9/30/2018 Were for Effluent TSS Exceedances
Sixty-Nine (69) Percent of the Time Springdale Violates its Permit limits Because of TSS Exceedances

24.
30.
25.
20.
28.
13.12.
51.
32.
26.430.
21.3
7.3
17.
32.5
52.
40.
30.
23.3
28.
12.
24.
15.
50.
41.
19. 19.22.
34.
46.
53.
69.
106.
62.
74.
2.6
51.
42.
77.77.
18.
59.
41.
30.
76.72.
48.
55.
45.43.
10.
16.
47.
20.
43.
48.
69.
.
20.
40.
60.
80.
100.
120.
.
100.
200.
300.
400.
500.
600.
700.
800.
900.
1000.
02
/01
/20
01
07
/01
/20
01
12
/01
/20
01
05
/01
/20
02
10
/01
/20
02
03
/01
/20
03
08
/01
/20
03
01
/01
/20
04
06
/01
/20
04
11
/01
/20
04
04
/01
/20
05
09
/01
/20
05
02
/01
/20
06
07
/01
/20
06
12
/01
/20
06
05
/01
/20
07
10
/01
/20
07
03
/01
/20
08
08
/01
/20
08
01
/01
/20
09
06
/01
/20
09
11
/01
/20
09
04
/01
/20
10
09
/01
/20
10
02
/01
/20
11
07
/01
/20
11
12
/01
/20
11
05
/01
/20
12
10
/01
/20
12
03
/01
/20
13
08
/01
/20
13
01
/01
/20
14
06
/01
/20
14
11
/01
/20
14
04
/01
/20
15
09
/01
/20
15
02
/01
/20
16
07
/01
/20
16
12
/01
/20
16
05
/01
/20
17
10
/01
/20
17
03
/01
/20
18
08
/01
/20
18
01
/01
/20
19
06
/01
/20
19
11
/01
/20
19
Twenty Years of Influent and Effluent Total Suspended Solids
Influent TSS Effluent TSS, mg/l, MO Ave Linear (Influent TSS) Linear (Effluent TSS, mg/l, MO Ave)


0.00
1.00
2.00
3.00
4.00
5.00
6.00
7.00
8.00
1 2 3 4 5 6 7 8 9 10 11 12 13 14 15 16 17 18 19 20 21 22 23 24 25 26 27 28 29 30 31 32 33 34 35 36 37 38 39 40 41 42 43 44 45 46 47 48 49 50 51
2.33 2.33
1.67
2.83
6.00
2.92
1.83
7.50
2.58
1.42
2.08 2.08
2.50
1.67
2.00 2.00
5.67
3.67
1.58
1.17
1.00
2.08
1.25
4.33
1.58
3.25
3.83
2.50
1.75
0.83
1.58
1.00
0.92
1.25
0.50
2.08
2.67
1.33
2.50
1.75
0.33
2.00
1.00 1.00
1.33
0.58
1.58
1.17
0.00
3.83
0.58
Sludge Blanket Thickness Relative to the Water Depth of Cell # 1 at the XXXXX Wastewater Pond System
Sample Points
Average Water Depth: 8.12 feetAverage Sludge Blanket Thickness: 2.10 feetVolume of Water: 20,313,776 gallonsVolume of Sludge: 7,124,938 gallonsWater Cap Remaining to Treat the Daily Load: 6.02 feet

1
2
3
4
5
0.00
1.00
2.00
3.00
4.00
5.00
6.00
7.00
8.00
ABCDEFGHIJK
2.332.33
1.67
2.83
6.00
2.92
1.83
7.50
1.422.08
2.082.50
1.672.00
5.67
3.67
3.40
0.33
2.00
1.001.001.330.58
1.581.17
0.00
3.83
0.58
Sludge Accumulation in Cell # 1 Relative to Water Depth
NORTH
East, Influent End of Cell West
SOUTH
0.00
1.00
2.00
3.00
4.00
5.00
6.00
7.00
8.00
9.00
10.00
1 2 3 4 5 6 7 8 9 10 11 12 13 14 15 16 17 18 19 20 21 22 23 24 25 26 27 28 29 30 31 32 33 34
0.670.50
0.420.67 0.67
0.58 0.580.42
2.42
0.67
0.420.50
0.42
0.75
0.33
0.75 0.67
0.000.50
1.00
0.42
0.670.250.17
0.00
0.67
0.250.00
1.000.67
0.500.33 0.42
0.33
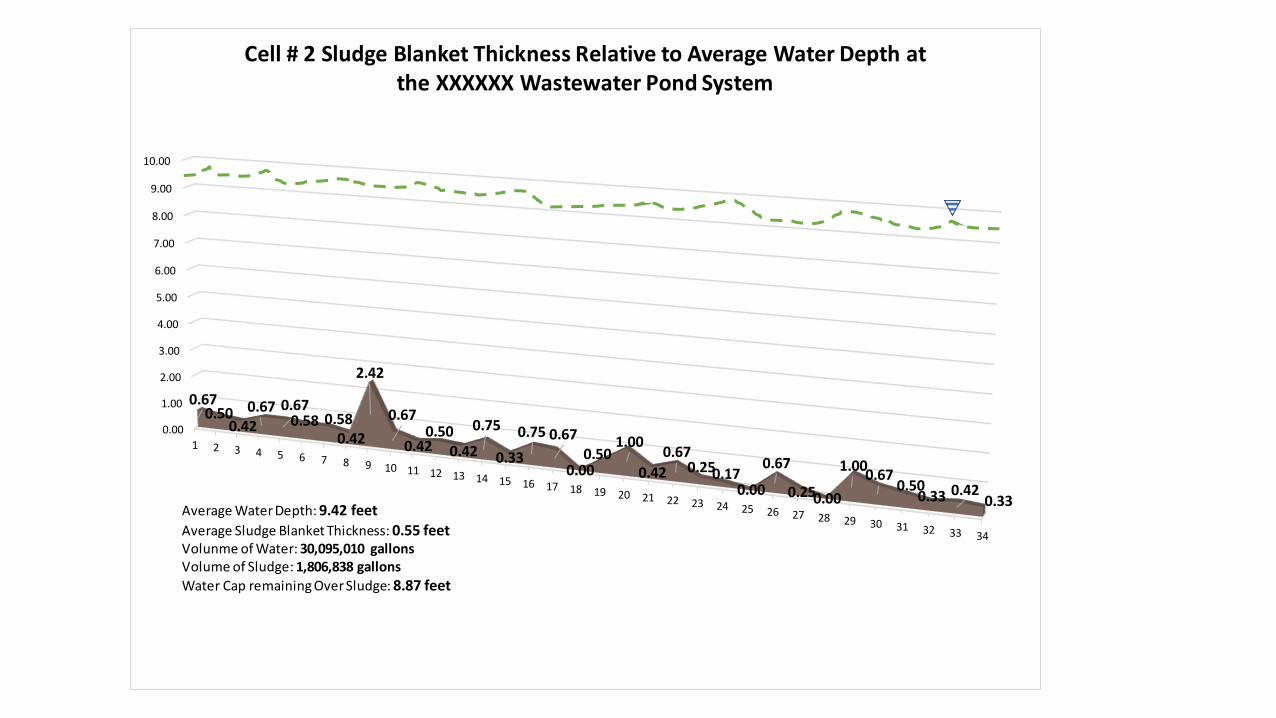
Cell # 2 Sludge Blanket Thickness Relative to Average Water Depth at the XXXXXX Wastewater Pond System
Average Water Depth: 9.42 feet
Average Sludge Blanket Thickness: 0.55 feetVolunme of Water: 30,095,010 gallonsVolume of Sludge: 1,806,838 gallons
Water Cap remaining Over Sludge: 8.87 feet

0
10
20
30
40
50
60
70
80
BOD5 CBOD5 SBOD5 TSS Ammonia OrthoPhosphate
79
62
30.8
2.1
35
20
53
16 14
51
1513
7
1
6.9
Intra-Pond BOD5 Laboratory Results for the XXXXX Wastewater Pond System
Influent Cell # 1 Effluent Cell # 2 Effluent Final EffluentSampled by xxxxxxx

0
5
10
15
20
25
30
35
40
Ammonia Nitrate Ortho Phos
35.9
1.383.28
11.44
2.07
6.2
1.099
3.98
7.45
Field Nutrient Sampling Results on
January 24, 2020
Influent Cell # 1 Effluent Final EffluentTested Using a Portable HACH DR 1900
Spectrophotometer

5.635.46
11.37
12.58
9.47
8.9
11.25
12.43
13.03
13.92
13.42
12.56
6.5
8.4 8.58.2
7.87.4
8.48.6
8.9 8.89 8.9
5
6
7
8
9
10
11
12
13
14
15
Cell # 1Sample Point
# 1
Cell # 1Sample Point
# 2
Cell # 1Sample Point
# 3
Cell # 1Sample Point
# 4
Cell # 1Sample Point
# 5
Cell # 1Sample Point
# 6
Cell # 2Sample Point
7
Cell # 2Sample Point
8
Cell # 2Sample Point
9
Cell # 2Sample Point
10
Cell # 2Sample Point
11
Cell # 2Sample Point
12
Pre-dawn Dissolved Oxygen Concentrations Spatially Across Cells # 1 and 2 at the XXXXX Wastewater Pond System
DO 7:00 - 7:45 AM (Sunrise) pHSampled from the Side of the Treatment Cell on
1/22/2020

0 1 2 3 4 5 6 7 8 9
0.5
1
2
3
4
5
6
8.52
8.34
8.27
8.09
7.92
7.84
0.37
8.3
8.3
8.3
8.3
8.3
8.3
7.9
5.4
5.4
5.4
5.3
5.4
5.3
5.3
Dissolved Oxygen Profile from the Surface to the Bottom of Cell # 1
DO 8:30 AM pH Temperature (oC)
Depth (ft)
Treatment Cell Surface
Floor of Treatment Cell
Sampled by Boat from the Middle of the Cell on 1/22/2020

6.5
8.48.5
8.2
7.8
7.4
8.4
8.6
8.98.8
98.9
6.5
7
7.5
8
8.5
9
9.5
Cell # 1
Sample
Point # 1
Cell # 1
Sample
Point # 2
Cell # 1
Sample
Point # 3
Cell # 1
Sample
Point # 4
Cell # 1
Sample
Point # 5
Cell # 1
Sample
Point # 6
Cell # 2
Sample
Point 7
Cell # 2
Sample
Point 8
Cell # 2
Sample
Point 9
Cell # 2
Sample
Point 10
Cell # 2
Sample
Point 11
Cell # 2
Sample
Point 12
pH Tested at the Surface of Cells 1 & 2 Before Sunrise


Headworks
• Will reduce influent BOD
• Extend the time between desludging
• Control vectors


Case # 9

Intra Pond Testing
The evidence of benthal feedback


0
50
100
150
200
250
300
350
400
450
Influent Cell # 1 effluent Cell # 2 effluent Cell # 4 Final Effluent
407
104
22
61
Intra-Pond TSS for the XXXX Wastewater Lagoon System
TSS
Sampled on 8/27/2015
Cell # 3 was taken offline to desludge

0
50
100
150
200
250
300
350
400
450
BOD5 TSS NH4 NO3 SBOD SCBOD CBOD
431
407
49.1
0.1
58
104
1
21.7 171222
1
13.5
4
69
812
61
1 0.18 8
11
Influent
Cell # 1 effluent
Cell # 2 effluent
Cell # 4 Final Effluent
Notice the increase in TSS, SBOD, and CBOD from Cell # 2 to Cell # 4

0
20
40
60
80
100
120
140
1 2 3 4 5 6 7 8 9 10 11 12 13 14 1516
13
3
0 0 0
24
0 0 2
9
0
85
01 3
Sludge Blanket Thickness Profile for the City of XXXX's Wastewater Lagoon Cell # 1
Sludge Depth (in)
Sludge Blanket Thickness: .34 feet (4.08 inches)Sludge Volume: 34,056 gallonsWater Depth at the Deepest Point: 12 feetEstimated Water Volume: 2,109,091 gallons
Sampled on August 25, 2015

0
0.5
1
1.5
2
2.5
3
3.5
4
1 2 3 4 56
78
910
1112
1314
1.67
1.08
2.00
1.75
1.58 1.581.50
1.17 1.25 1.25
0.83
1.331.58 1.50
XXXXX Wastewater Treatment lagoon Cell # 3 Sludge Blanket Thickness Profile
Sludge Blanket Thickness (ft)
Average Sludge Blanket Thickness: 1.43 feetSludge Volume: 1,943,138 gallons
Sampled on August 25, 2015

0.00
0.50
1.00
1.50
2.00
2.50
3.00
3.50
4.00
1 2 3 4 5 6 7 8 9 10 11 12 13 14 15 16 17 18 19 20 21 22 23 24 25 26
1.25
1.000.92
1.42
0.75
1.75
0.75 0.83
1.42
2.00
0.75
0.00
0.750.921.17
1.25
1.001.000.92
1.33
0.83
1.08
1.00
1.75 1.75
0.92
XXXX's Cell # 4 Sludge Blanket Thickness Profile
Sludge Blanket Thickness
Average Sluege Blanket Thickness: 1.10 feetSludge Blanket Volume: 1,347,420 gallonsAverage Water Depth: 3.81 feet
Sampled on August 25, 2015


0.0
50.0
100.0
150.0
200.0
250.0
4/3
0/20
12
5/3
1/20
12
6/3
0/20
12
7/3
1/20
12
8/3
1/20
12
9/3
0/20
12
10
/31
/20
…
11
/30
/20
…
12
/31
/20
…
1/3
1/20
13
2/2
8/20
13
3/3
1/20
13
4/3
0/20
13
5/3
1/20
13
6/3
0/20
13
7/3
1/20
13
8/3
1/20
13
9/3
0/20
13
10
/31
/20
…
11
/30
/20
…
12
/31
/20
…
1/3
1/20
14
2/2
8/20
14
3/3
1/20
14
4/3
0/20
14
5/3
1/20
14
6/3
0/20
14
7/3
1/20
14
8/3
1/20
14
9/3
0/20
14
10
/31
/20
…
11
/30
/20
…
12
/31
/20
…
1/3
1/20
15
2/2
8/20
15
3/3
1/20
15
4/3
0/20
15
5/3
1/20
15
6/3
0/20
15
7/3
1/20
15
Effluent TSS and BOD Graphed on the Same Scale
BOD, 5-day, 20 deg. C
Solids, total suspended

0
20
40
60
80
100
120
140
BOD eff
TSS eff

0
10
20
30
40
50
60
70
BOD5 TSS NH4 NO3 SBOD SCBOD CBOD
12
61
1 0.1
8 811
Water Quality Grab Sample Results from the Final Treatment Cell
Cell # 4 Final Effluent
Sampled on 8/27/2015

Permit Limits
• TSS 7 day Average Limit: 70 mg/l
• TSS 30 day Average Limit: 110
• BOD 7 day average limit: 45 mg/l
• BOD 30 day average Limit: 65


0
0.5
1
1.5
2
2.5
3
3.5
4
4.5
January February March April May June July August
1.361.20 1.17
1.50
2.38
4.08
3.18
3.75
0.95
0.67
1.38
4.08
4.42
1.29
3.93
1.53
0.46 0.52
1.37 1.31
2.16
3.133.02
3.16
TSS:BOD Ratio for Weston Missouri's Wastewater Treatment Lagoon System
2015 TSS:BOD Ratio
2014 TSS:BOD Ratio
2013 TSS:BOD Ratio
TSS:BOD Ratio > 1.5 typical of algae growth
TSS:BOD Ratio : > 1 < 1.5Typical of Untreated Wastewater. (Short circuit)
<1 TSS:BOD:
Soluble BOD in the effluent
Poor wastewater treatment
or Nitrification in the BOD
test bottle
TSS:BODRatio Key:

116.0
43.0
72.0
200.0
70.0
166.0
90.096.0
82.0
46.0
15.0
59.0
42.0
69.0
47.0
124.0117.0
166.0
64.0
33.0
20.0
42.0
29.0
72.0
98.0
84.0
53.0
Solids, total suspended,
7/31/2014, 118.0
58.0
39.0
48.0
18.0
5.0
15.018.0
7.0 6.0
38.0
49.054.0
45
30.0
0.0
50.0
100.0
150.0
200.0
250.0
4/30
/201
2
5/31
/201
2
6/30
/201
2
7/31
/201
2
8/31
/201
2
9/30
/201
2
10/3
1/20
…
11/3
0/20
…
12/3
1/20
…
1/31
/201
3
2/28
/201
3
3/31
/201
3
4/30
/201
3
5/31
/201
3
6/30
/201
3
7/31
/201
3
8/31
/201
3
9/30
/201
3
10/3
1/20
…
11/3
0/20
…
12/3
1/20
…
1/31
/201
4
2/28
/201
4
3/31
/201
4
4/30
/201
4
5/31
/201
4
6/30
/201
4
7/31
/201
4
8/31
/201
4
9/30
/201
4
10/3
1/20
…
11/3
0/20
…
12/3
1/20
…
1/31
/201
5
2/28
/201
5
3/31
/201
5
4/30
/201
5
5/31
/201
5
6/30
/201
5
7/31
/201
5
Solids, total suspended
Solids, total suspended
TSS Permit Limit: 70 mg/l


0
5
10
15
20
25
30
35
40
45
50
Influent Cell # 1 effluent Cell # 2 effluent Cell # 4 Final Effluent
49.1
1 1 10.1
21.7
13.5
0.1
Intra-Pond Ammonia and Nitrate Concentrations through the xxx Wastewater Lagoon system
NH4
NO3

101.0
33.0
65.0
60.0
33.0
36.0
76.0
23.0
51.0
100.0
29.0
43.0
32.0 32.0
15.0
41.0
37.036.0
21.0
18.0
33.0
44.043.0
52.0
24.0
19.0
41.0
30.0
38.0
BOD, 5-day, 20 deg. C,
9/30/2014, 52.0
31.0
12.0
4.6
11.0
15.0
6.04.0
16.0
12.0
17.0
20
8.0
0.0
20.0
40.0
60.0
80.0
100.0
120.0
4/3
0/20
12
5/3
1/20
12
6/3
0/20
12
7/3
1/20
12
8/3
1/20
12
9/3
0/20
12
10
/31
/20
…
11
/30
/20
…
12
/31
/20
…
1/3
1/20
13
2/2
8/20
13
3/3
1/20
13
4/3
0/20
13
5/3
1/20
13
6/3
0/20
13
7/3
1/20
13
8/3
1/20
13
9/3
0/20
13
10
/31
/20
…
11
/30
/20
…
12
/31
/20
…
1/3
1/20
14
2/2
8/20
14
3/3
1/20
14
4/3
0/20
14
5/3
1/20
14
6/3
0/20
14
7/3
1/20
14
8/3
1/20
14
9/3
0/20
14
10
/31
/20
…
11
/30
/20
…
12
/31
/20
…
1/3
1/20
15
2/2
8/20
15
3/3
1/20
15
4/3
0/20
15
5/3
1/20
15
6/3
0/20
15
7/3
1/20
15
Effluent BOD5 Over the Past Three Years for the XXXXX Wastewater Treatment Lagoon System
Permit Limit 45 mg/l

116.0
43.0
72.0
200.0
70.0
166.0
90.096.0
82.0
46.0
15.0
59.0
42.0
69.0
47.0
124.0117.0
166.0
64.0
33.0
20.0
42.0
29.0
72.0
98.0
84.0
53.0
Solids, total suspended,
7/31/2014, 118.0
58.0
39.0
48.0
18.0
5.0
15.018.0
7.0 6.0
38.0
49.054.0
45
30.0
0.0
50.0
100.0
150.0
200.0
250.0
4/3
0/20
12
5/3
1/20
12
6/3
0/20
12
7/3
1/20
12
8/3
1/20
12
9/3
0/20
12
10
/31
/20
…
11
/30
/20
…
12
/31
/20
…
1/3
1/20
13
2/2
8/20
13
3/3
1/20
13
4/3
0/20
13
5/3
1/20
13
6/3
0/20
13
7/3
1/20
13
8/3
1/20
13
9/3
0/20
13
10
/31
/20
…
11
/30
/20
…
12
/31
/20
…
1/3
1/20
14
2/2
8/20
14
3/3
1/20
14
4/3
0/20
14
5/3
1/20
14
6/3
0/20
14
7/3
1/20
14
8/3
1/20
14
9/3
0/20
14
10
/31
/20
…
11
/30
/20
…
12
/31
/20
…
1/3
1/20
15
2/2
8/20
15
3/3
1/20
15
4/3
0/20
15
5/3
1/20
15
6/3
0/20
15
7/3
1/20
15
Solids, total suspended
Solids, total suspended
TSS Permit Limit: 70 mg/l

0
50
100
150
200
250
300
350
400
450
Influent Cell # 1 effluent Cell # 2 effluent Cell # 4 Final Effluent
431
58
12 12
Intra-Pond BOD for a Small Town In Missouri
BOD5
Cell # 1 86.5 % BOD Removal
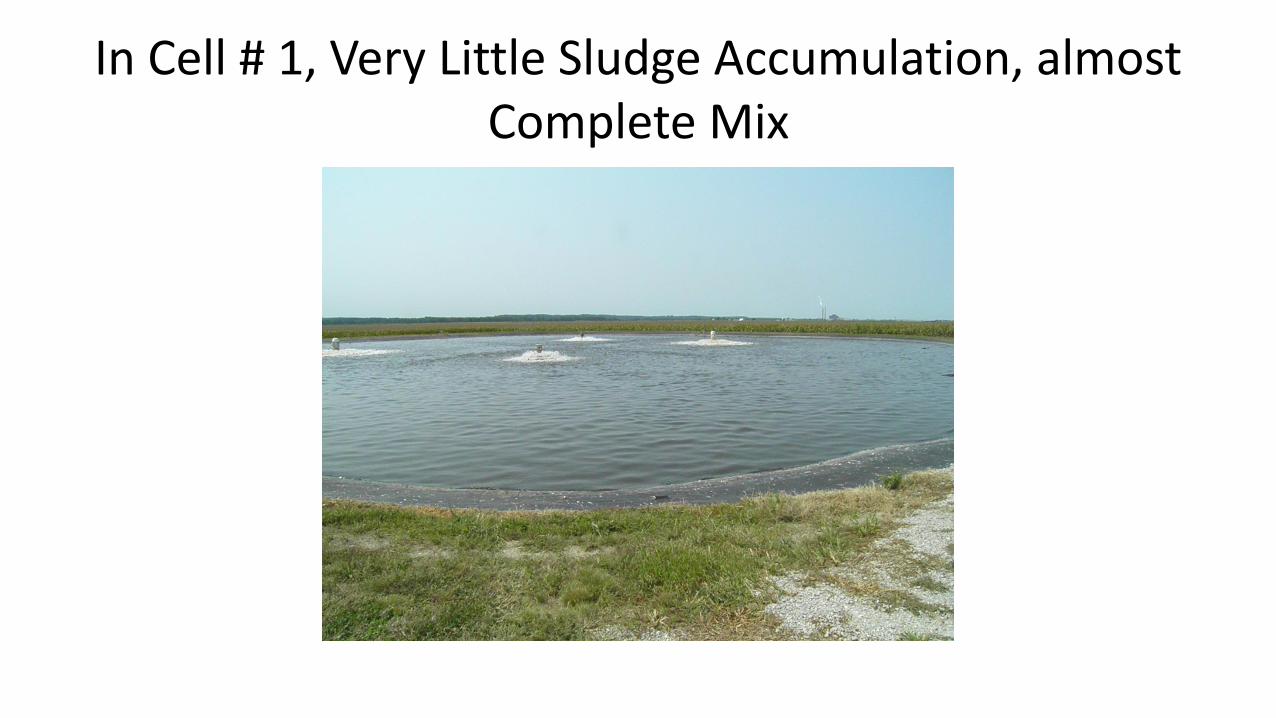
In Cell # 1, Very Little Sludge Accumulation, almost Complete Mix

NH3 Chart from USEPA ECHO

• Changes to the xxxx plant have continued. The effluent numbers are still coming down.

A Good Wastewater Lagoon Book

Steven M. HarrisH&S Environmental, [email protected] (480) 274-8410
Lagoon Troubleshooting book available at usabluebook.com Part # 43431, Page 1386 in Catalog
Online at: https://www.usabluebook.com/p-286936-wastewater-lagoon-troubleshooting.aspx

References:• Principles of Design and Operations of Wastewater Treatment Pond
Systems for Plant Operators, Engineers, and Managers https://www.epa.gov/nutrient-policy-data/principles-design-and-operations-wastewater-treatment-pond-systems-plant (see Appendix E for Troubleshooting)
• https://www.rcap.org/resource/wastewater-lagoon-basics/ (56 minutes webinar)
• https://www.rcap.org/resource/wastewater-lagoon-troubleshooting/ (61 minutes webinar)
• EPA - Wastewater Technology Fact Sheet Facultative Lagoons (4 pages)
• EPA - Wastewater Technology Fact Sheet Aerated, Partial Mix Lagoons (https://www3.epa.gov/npdes/pubs/apartlag.pdf) (5 pages)