Physical and Chemical Stability of Spray Dried Sugars and ...
326
Virginia Commonwealth University Virginia Commonwealth University VCU Scholars Compass VCU Scholars Compass Theses and Dissertations Graduate School 1996 Physical and Chemical Stability of Spray Dried Sugars and Physical and Chemical Stability of Spray Dried Sugars and Protein-Sugar MolecuIar Mixtures for Inhalation Protein-Sugar MolecuIar Mixtures for Inhalation Venkatesh Naini Follow this and additional works at: https://scholarscompass.vcu.edu/etd Part of the Pharmacy and Pharmaceutical Sciences Commons © The Author Downloaded from Downloaded from https://scholarscompass.vcu.edu/etd/4982 This Dissertation is brought to you for free and open access by the Graduate School at VCU Scholars Compass. It has been accepted for inclusion in Theses and Dissertations by an authorized administrator of VCU Scholars Compass. For more information, please contact [email protected].
-
Upload
khangminh22 -
Category
Documents
-
view
1 -
download
0
Transcript of Physical and Chemical Stability of Spray Dried Sugars and ...
Virginia Commonwealth University Virginia Commonwealth University
VCU Scholars Compass VCU Scholars Compass
Theses and Dissertations Graduate School
1996
Physical and Chemical Stability of Spray Dried Sugars and Physical and Chemical Stability of Spray Dried Sugars and
Protein-Sugar MolecuIar Mixtures for Inhalation Protein-Sugar MolecuIar Mixtures for Inhalation
Venkatesh Naini
Follow this and additional works at: https://scholarscompass.vcu.edu/etd
Part of the Pharmacy and Pharmaceutical Sciences Commons
© The Author
Downloaded from Downloaded from https://scholarscompass.vcu.edu/etd/4982
This Dissertation is brought to you for free and open access by the Graduate School at VCU Scholars Compass. It has been accepted for inclusion in Theses and Dissertations by an authorized administrator of VCU Scholars Compass. For more information, please contact [email protected].
Virginia Commonwealth University School of Pharmacy
This is to certify that the dissertation prepared by Venkatesh Naini entitled "Physical and Chemical Stability of Spray Dried Sugars and Protein-Sugar Molecular Mixtures for Inhalation" has been approved by his committee as satisfactory completion of the dissertation requirement for the degree of Doctor of Philosophy.
Pe ., Director of Dissertation
H. T omas Karnes . School of Ph rmacy

©Venkatesh Naini 1 996 All Rights Reserved

Physical and Chemical Stability of Spray Dried Sugars and Protein-Sugar MolecuIar Mixtures for Inhalation
A dissertation submitted in partial fulfillment of the requirements for the
degree of Doctor of Philosophy at Virginia Commonwealth University
By
Venkatesh Naini
B .Pharm. , BITS, Pilani, India, 1987
M.Pharm. , Jadavpur University, Calcutta, India, 1989
Director: Peter R. Byron, Ph.D.
Professor
Department of Pharmacy and Pharmaceutics
School of Pharmacy
Virginia Commonwealth University
Richmond, Virginia
August, 1996

ii
Acknowledgements
I am deeply indebted to my mentor and advisor Dr. Peter Byron for patiently guiding me through this research proj ect. He is an excellent scientist and teacher and always inculcated, in me, the ideas of independent thinking and problem solving. I would also like to thank Dr. Richard Dalby, who initiated me into research during the initial stages of my graduate career.
I sincerely thank my graduate research committee members : Drs. H. Thomas Kames, Jiirgen Venitz, Jan Chlebowski and William Soine for their help and guidance during various stages of this project.
I would also like to thank past and present graduate students and postdoctoral fellows at Virginia Commonwealth University, especially, Dilraj , Elaine, Frank, John, Jennifer, Mike, Raj , Rose and Roshni for their friendship and support. In addition, I would like to express my gratitude to the administrative staff of the department: Adrienne, Judy, Loretta, Mia and Sue.
My friends and family, here and in India, have been extremely supportive of my endeavors during the past few years. I would especially like to thank my cousin Kiron and her family, my sisters Arpita, Kavita and Rajita and their families, my mom and my wife Sandhya. This dissertation is dedicated to the memory of my late father, who always encouraged me to strive for and achieve the best in life.

iii
TABLE OF CONTENTS
Page
LIST OF TABLES .
LIST OF FIGURES.
ix
xi
LIST OF ABBREVIATIONS.
ABSTRACT.
xv:i
xx
CHAPTER
I . BACKGROUND AND INTRODUCTION.
I I . HYPOTHESES AND SPECIFIC AIMS .
1
18
I I I . PHYSICOCHEMICAL STABILITY OF CRYSTALLINE SUGARS AND THEIR SPRAY DRIED FORMS: DEPENDENCE ON RELATIVE HUMIDITY AND SUITABILITY IN POWDER INHALERS . .
I I I . a INTRODUCTION.
I I I . h MATERIALS AND METHODS.
21
21
2A
I I I . h . l Materials . . 2A I I I . h .2 Methods. . . . . . . . . 2A
I I I . h . 2 . 1 Sieve fractionation of sugars. . 2A III.h.2.2 Spray drying of sugars . a5 I I I . h . 2 . 3 Moisture sorption studies . . . . a5 I I I . h . 2 .4 Differential scanning calorimetry. Z1 I I I . h . 2 . 5 Thermogravimetric analysis . . Z1 I I I . h . 2 . 6 Particle size determination. 2B I I I . h . 2 . 7 Hot stage microscopy. . 2B I I I . h . 2 . 8 X-ray powder diffraction. 23 I I I . h . 2 . 9 Karl Fischer moisture
determination. 23
I I I . c RESULTS AND DISCUSSION . .

iv
I I I . c . I Chemistry and kinetics of mutarotation. 33 I I I . c . 2 Crystalline sieve fractions, A and B. :E
I I I . c . 2 . 1 Lactose. :E I I I . c . 2 . 2 Trehalose . . 42 I I I . c . 2 . 3 Sucrose . 49 I I I . c . 2 . 4 Mannitol . . 53
I I I . c . 3 Spray dried sugars, C . 55
I I I . d SUMMARY AND CONCLUSIONS. 62
I V . CHARACTERIZATION AND OPTIMIZATION OF SPRAY DRYING AND ELECTROSTATIC PRECIPITATION APPARATUS FOR COLLECTION OF INHALABLE MICROPARTICLES. to
IV . a INTRODUCTION. . to
IV.b MATERIALS AND METHODS. ffi IV.b . I Materials . . ffi IV.b .2 Methods. fJl
IV.b .2 . 1 Particle collection apparatus . . . fJl IV.b .2 .2 Effect of electrostatic precipitator (EP)
voltage, nebulized solution concentration and hot air gun voltage on collection efficiency . 72
IV .b . 2 . 3 Effect o f air flow and temperature on particle collection efficiency. . 73
IV.b .2 .4 Photomicrography and scanning electron microscopy of electrostatically precipitated particles. . 74
IV.b .2 . 5 Theoretical particle collection efficiencies during electrostatic precipitation. 75
I V . c RESULTS AND DISCUSSION. . 76 IV. c . I Spray drying and electrostatic precipitation. . 76
IV. c . l . I Effect of electrostatic precipitator (EP) voltage, nebulized solution concentration and hot air gun voltage on collection efficiency. . 78
IV. c . l . 2 Effect of drying air flow and temperature on particle collection efficiency. . . . . 88
IV. c . l . 3 Theoretical particle collection efficiencies during electrostatic

V .
V I .
precipitation.
I V . d SUMMARY AND CONCLUSIONS.
STABILITY OF SPRAY DRIED ALKALINE PHOSPHATASE DURING DRYING AND STORAGE: PROTECTION AFFORDED BY MOLECULAR DISPERSION IN LACTOSE, TREHALOSE, SUCROSE AND MANNITOL.
V . a INTRODUCTION . .
V .b MATERIALS AND METHODS.
V.b . l Nebulization, drying and electrostatic precipitation . . V.b. l . l Bacterial alkaline phosphatase. V.b . l .2 Bovine intestinal alkaline phosphatase .
V.b. 2 Solid state stability of dried protein and protein-sugar mixtures . .
V.b . 3 Solution degradation kinetics o f bovine intestinal alkaline phosphatase (BIAP) . .
V.b. 4 Effect o f droplet drying o n protein concentration determination by the method of Bradford.
V.b . 5 Scanning electron microscopy o f dried BAP and BAP-sugar mixtures . .
V.b .6 Statistical analyses . .
V . c RESULTS AND DISCUSSION . .
V. c . l Solution degradation kinetics of bovine intestinal alkaline phosphatase.
V . c . 2 Effect o f droplet drying o n protein content determination.
V. c. 3 Spray drying and electrostatic collection of bacterial alkaline phosphatase(BAP) .
V. c . 4 Spray drying and electrostatic collection o f bovine intestinal alkaline phosphatase (BIAP) .
V. c . 5 Stability o f dried protein and protein-sugar mixtures . .
V . d SUMMARY AND CONCLUSIONS.
DETERMINATION OF MOISTURE IN CRYSTALLINE AND SPRAY DRIED SUGARS USING ISOTHERMAL
v
1 00
102
1 05
1 05
108
1 09 113 116
118
118
119
120 121
123
123
129
131
148
159
163

vi
THERMOGRAVIMETRIC ANALYSIS (TGA) AND KARL FISCHER (KF) COULOMETRIC TITRATION. 166
VI . a INTRODUCTION. . 166
VI . b PRINCIPLE OF COULOMETRIC KARL FISCHER TITRATION. . 167
VI . c MATERIALS AND METHODS. 168
VI . c . l Materials . . 168 VI . c . 2 Methods. 169
VI . c . 2 . 1 Spray drying of sugars. . . 169 VI . c . 2 . 2 Sieve fractionation of sugars . . . 169 VI . c . 2 . 3 Thermogravimetric analysis (TGA). 169 VI . c . 2 . 4 Karl Fischer (KF) moisture
determination. . 170
VI . d RESULTS AND DISCUSSION. . 172
VI . e SUMMARY AND CONCLUSIONS. 182
V I I . DETERMINATION OF TOTAL PROTEIN CONTENT AND ALKALINE PHOSPHATASE ENZYME ACTIVITY IN SOLUTION. . 184
VI I . a INTRODUCTION. 184
VI I . b MATERIALS AND METHODS. 184
VII . b . l Protein content determination. . . 185 VI I . b . 2 Determination of alkaline phosphatase
activity. " . . . 187 VII.b.2.1 Calibration plot of paranitrophenol
in 1 .0 N NaOH solution. . 187 VII . b . 2 . 2 Limits of linearity for product
(p-nitrophenol) accumulation vs incubation time. . . . . 187
VII . b . 2 . 3 Limits of linearity for enzyme activity vs apparent protein concentration in enzyme solutions . . 189
VI I . c RESULTS AND DISCUSSION . .
VIl. c . l Protein content determination. 100

vii
VI I . c . 2 Determination of enzyme activity. 196 VII . c . 2 . 1 Calibration plot of product. . 196 VII . c . 2 . 2 Linearity of product released vs
incubation time . . . 196 VI I . c . 2 . 3 Linearity of enzyme activity vs
apparent protein concentration in the enzyme solution assayed. . . . 199
VII . c . 2.4 Estimation of enzyme specific activity in unknown solutions . 199
V I I I . OVERALL SUMMARY AND CONCLUSIONS . .
LIST OF REFERENCES.
APPENDICES
A I . CALCULATION OF THEORETICAL PARTICLE COLLECTION EFFICIENCIES INSIDE THE ELECTROSTATIC PRECIPITATOR
213
USING PARTICLE CHARGING THEORY. 226
A I . a INTRODUCTION. . . 226
Al .b THEORETICAL CALCULATION OF AEROSOL COLLECTION EFFICIENCY IN A WIRE-IN-TUBE ELECTROSTATIC PRECIPITATOR. . '2Zl
AI . c CALCULATION OF A TYPICAL THEORETICAL COLLECTION EFFICIENCY. . 230
A I I . DETERMINATION OF TOTAL VOLUMETRIC AIR FLOW THROUGH THE PARTICLE COLLECTION APPARATUS. 234
AI I . a INTRODUCTION. 234
AI I . b CALIBRATION OF THE PNEUMOTACHOGRAPH. 234
A I I . c MEASUREMENT O F VOLUMETRIC AIR FLOWS IN THE PARTICLE COLLECTION APPARATUS USING THE CALIBRATED PNEUMOTACHOGRAPH AND MICRO MANOMETER. . . . 238
Al I I . SUMMARY O F RAW DATA FOR ALKALINE PHOSPHATASE ENZYME ACTIVITIES AND PROTEIN CONCENTRATIONS (IN BSAE) USED IN CALCULATION OF ENZYME SPECIFIC

ACTIVITIES .
AIV. THERMAL ANALYSIS OF CRYSTALLINE SUGARS AND
Vlll
241
THEIR SPRAY DRIED FORMS. . . . . . . " 246
AV. PARTICLE SIZE DETERMINATION OF SPRAY DRIED SUGARS USING THE AEROSIZER® WITH THE AERODISPERSER®. . . . . . . . . . . . . . 2S3
A VI . PARTICLE SIZE MEASUREMENT OF CRYSTALLINE SIEVE FRACTIONS OF SUGARS USING SCANNING ELECTRON MICROSCOPY AND OPTICAL MICROSCOPY. . �
AVI I . X-RAY POWDER DIFFRACTION (XRPD) OF CRYSTALLINE SUGARS AND THEIR SPRAY DRIED FORMS. . . . 281
A VI I I . HOT STAGE MICROSCOPY OF SPRAY DRIED SUGARS
A I X .
VI TA.
OBSERVED UNDER CROSSED POLARS. . . . . . 286
INSTRUCTIONS MANUAL FOR THE SMALL PARTICLE AEROSOL GENERATOR (SPAG). . . . . . . . 291
�1

ix
LIST OF TABLES
Table Page
I I I. l Experimental conditions for spray drying sugars. 25
I I I. 2 Moisture contents of sugars determined by TGA. m
I I I. 3 Median aerodynamic diameters for spray dried sugars . 38
I I I. 4 Summary of DSC results for lactose . . ::B
I I I . 5. Summary of DSC results for trehalose. 44
I I I. 6 Summary of DSC results for sucrose. . 00
I I I . 7 Summary of DSC results for mannitol. 54
IV. l Percentage collection efficiencies in the particle collection apparatus as function of electrostatic precipitator voltage . 79
IV. 2 Percentage collection efficiencies in the particle collection apparatus as a function of nebulized solution concentration. . 82
IV. 3 Percentage collection efficiencies in the particle collection apparatus as a function of hot air gun voltage . . 85
IV. 4 Collection efficiencies at a drying temperature of 28.4 °C and volumetric air flow of 29. 1 liters/min. . 89
IV.5 Collection efficiencies at a drying temperature of 41.0 °C and volumetric air flow of 29. 1 liters/min. . 91
IV. 6 Collection efficiencies at a drying temperature of 26.8 °C and volumetric air flow of 50 .6 liters/min. . ffi
IV. 7 Collection efficiencies at a drying temperature of 39.5 °C and volumetric air flow of 50 .6 liters/min. . 9'5
V. l Summary of enzyme solutions spray dried.
V. 2 Solution degradation kinetics of bovine intestinal alkaline
110

phosphatase at 63 DC. .
V . 3 Effect of droplet drying on protein content determination by
x
124
method of Bradford. 130
V .4 Specific activity of bacterial alkaline phosphatase (BAP) following nebulization, drying and/or storage. . 133
V . 5 Summary o f ANOVA results for BAP enzyme activities. 134
V .6 Specific activity of bovine intestinal alkaline phosphatase (BIAP) following nebulization, drying and/or storage . . 150
V. 7 Summary of ANOVA results for BIAP enzyme activities. 151
V . S Summary of significance levels for ANOVA of BIAP activities . 152
VI . 1 Isothermal TGA of sugars . . 174
VI . 2 Moisture contents of sugars using KF analysis . . 181
VI I . 1 Summary of validation parameters for protein determination by the method of Bradford. . 191
AI . 1 Theoretical collection efficiencies inside the precipitator. . 233
AI! . 1 Volumetric flow rates at different settings of the hot air gun. 240
AIII . ISummary of raw data for BAP activity and protein contents. 242
AIII .2Summary of raw data for BIAP activity and protein contents. 244

Figure
I l L 1
I l L 2
I I l . 3
I I l . 4
I l L 5
IV. 1
IV. 2
IV. 3
IV .4
IV. 5
IV. 6
IV. 7
IV. 8
IV. 9
IV. 10
xi
LIST OF FIGURES
Page
M olecular structures of sugars. 31
X-ray diffractograms for lactose. 40
X-ray diffractograms for trehalose, sucrose and mannitol . 45
Typical TGA and DSC therm ograms for lactose before and after storage at different RHs. . 47
Typical TGA and DSC thermo grams for trehalose, sucrose and mannitol before and after storage at different RHs. 51
Schematic diagram of the particle collection apparatus. 68
Expl oded view of the secondary drying chamber with dimensions . . ffi
Exploded vi ew of the electrostatic precipitator column with dimensions . . 70
Effect of EP voltage on deposition in the apparatus. . EO
Effect of nebulized solution concentration on deposition in the apparatus. . 83
Effect of hot air gun voltage on deposition in the apparatus . 86 Photomicrographs of lactose particles collected inside the precipitator. . fr7
Deposition in the apparatus following spray drying at 28 DC and volumetric flow rate of 29. 1 liters/min. . ro
Deposition in the apparatus following spray drying at 4 1 DC and volumetric flow rate of 29. 1 liters/min. . 92
Deposition in the apparatus following spray drying at 27 DC and volumetric flow rate of 50 .6 liters/min. . 9:t

IV. l !
IV. 1 2
IV. 13
IV. 14
IV. 1 5
V. 1
V . 2
V . 3
xii
Deposition in the apparatus following spray drying at 40 °C and volumetric flow rate of 50.6 liters/min. . �
SEM of lactose and fluorescein particles dried at 29 °C and collected inside the precipitator. ffl
SEM of lactose and fluorescein particles dried at 4 1 °C and collected inside the precipitator. 93
SEM of lactose and fluorescein particles dried at 63 °C and collected inside the precipitator. ffi
Comparison of theoretical and experimental collection efficiencies in the electrostatic precipitator. . 101
Schematic diagram of the particle collection apparatus. 111
Log-linear plot of loss of detectable protein vs time for BIAP. . 125
Solution degradation kinetics of BIAP at 63 °C. . 126
V.4 Log-linear profiles of BIAP plotted as percentage activity remaining using Units/ml and specific activity(Unitsl).1 gBSAE)127
V . 5 Specific activities o f BAP i n initial solution and following spray drying and/or storage . 136
V . 6 A cartoon representation o f the monomer o f bacterial alkaline phosphatase. 137
V . 7 SEM of BAP spray dried from sugar-free solutions. 138
V . 8 SEM of BAP spray dried with lactose. . 139
V.9 SEM of BAP spray dried with trehalose. 140
V. 10 SEM of BAP spray dried with sucrose. 141
V. l ! SEM of BAP spray dried with mannitol. 142
V. 12 Specific activities of BIAP in initial solution and following spray
V. 13
VI . 1
drying and/or storage. 154
Molecular structures of sugars .
Schematic diagram of Mitsubishi moisture meter . .
157
173

VI . 2
VI . 3
Isothermal TGA of sodium tartrate dihydrate . .
Isothermal TGA of crystalline and spray dried forms of trehalose.
xiii
176
177
VI . 4 Isothermal TGA of crystalline and spray dried forms o f lactose 178
VI . 5 Isothermal TGA of crystalline and spray dried forms of
VII . 1
V I I . 2
V I I . 3
VI I . 4
VI I . 5
sucrose . .
Calibration curve for protein estimation by method of Bradford (Assay Lot # 5 1 143A) . .
Calibration curve for protein estimation by method of Bradford (Assay Lot # 5 1558A) . .
Calibration curve for p-nitrophenol in 1 . 0 N NaOH.
179
193
194
195
Plot of p-nitrophenol concentration vs incubation time for BAP. 197
Plot of p-nitrophenol concentration vs incubation time for BIAP198
V I I . 6 Plot of enzyme activity vs apparent protein concentration for BAP. . ax>
VI 1 . 7 Plot of enzyme activity vs apparent protein concentration for B IAP . aJ1
AI . 1 Exploded view of the precipitator column. 228
Al l . 1 Calibration of the pneumotachograph. 235
AI I . 2 Experimental set up for flow measurement in the apparatus . Z36
AIl.3 Calibration plot of apparent cumulative air volume entering the pneumotachograph vs air flow in liters/min. '1:37
AIV. 1 TGA and DSC for P.o, Bo and Aaoa b e d e and Bsoa b e d e for lactose . .
. . . . . . . . 247
AIV . 2 TGA and DSC for C o and CSOa for lactose. 248
AIV . 3 TGA and DSC for CSOb for lactose. . 249
AIV . 4 TGA and DSC for CSOc,d,e o f lactose. 250

AIV . 5
AIV . 6
AIV . 7
AIV. B
AIV . 9
AIV. I0
AIV. l l
AIV. 1 2
AIV. 1 3
AIV. 14
AIV. 15
AIV. 16
AV. l
TGA and DSC for � , Bo and AaOa,b,c,d,e and B30a,b,c,d,e for trehal ose.
TGA and DSC for Co and C30a for trehal ose . .
TGA and DSC for C30b for trehalose.
TGA and DSC for C30c,d,e of trehalose . .
TGA and DSC for Ao , Bo and AaOa,b,c,d and B30a,b,c,d for sucrose . .
TGA and DSC for Co and C30a for sucrose.
TGA and DSC for C30b for sucrose . .
TGA and DSC for C30c,d of sucrose.
TGA and DSC for � , Bo and AaOa,b,c,d,e and B30a,b,c,d,e for mannitol .
TGA and DSC for Co and C30a for mannitol . .
TGA and DSC for C30b for mannitol.
TGA and DSC for C30c,d,e of mannitol . .
Particle size distribution of spray dried lactose as measured by
xiv
251
252
253
254
255
256
257
258
259
�
a51
a52
Aerosizer. . a54
A V. 2 Particle size distribution of spray dried trehalose as measured by Aerosizer. a55
AV. 3 Particl e size distribution of spray dried sucrose a s measured by Aerosizer. a56
AV. 4 Particl e size distribution of spray dried mannitol a s measured by Aerosizer. a57
A VI . l SEM s of "coarse" and "fine" fractions of lactose. . a:;g
A VI . 2 SEM s of "coarse" and "fine" fractions of trehalose. ZlO
A V I . 3 SEM s of "coarse" and "fine" fractions of sucrose. Zll

xv
A VI . 4 SEMs of "coarse" and "fine" fractions of mannitol . . 'Zl2
A VI . 5 Particle size distribution of "coarse " lactose as measured by optical microscopy. 'Zl3
A VI . 6 Particle size distribution of "fine " lactose as measured by optical microscopy. 'Zl4
A VI . 7 Particle size distribution of "coarse " trehalose as measured by optical microscopy. 'Zl5
A VI . 8 Particle size distribution of "fine " trehalose as measured by optical microscopy. 'Zl6
A VI . 9 Particle size distribution of "coarse " sucrose as measured by optical microscopy. 'Zl7
A VI . 1 0 Particle size distribution of "fine " sucrose as measured by optical microscopy. 'Zl8
A VI . 1 1 Particle size distribution of "coarse " mannitol as measured by optical microscopy. 'Zl9
A VI . 1 2 Particle size distribution o f "fine " mannitol a s measured by optical microscopy. 280
A VI I . 1 XRPD patterns for lactose. 282
A VI I. 2 XRPD patterns for trehalose . 283
AVI I . 3 XRPD patterns for sucrose. . 284
A VI I . 4 XRPD patterns for mannitol. 285
AVII I .l Photomicrography of spray dried lactose under crossed polars at (a) 30 D C and (b) 140 D C . 287
AVI I I . 2 Photomicrography of spray dried lactose under crossed polars �wrn�����. . a
AVI I I . 3 Photomicrography of spray dried sucrose under crossed polars at (a) 30 D C and (b) 106 D C. 289
AVI I I . 4 Photomicrography of spray dried sucrose under crossed polars at (a) 151 DC and (b) 192 D C. . 290

A
A404
A595
ANOVA
· BAP
B IAP
BSA
BSAE
C
cal
CFC
c m
CV
d
DPI
DSC
e
E
E '
UST OF ABB�TIONS
Collection surface area in the electrostatic precipitator
Absorbance at 404 nm
Absorbance at 595 nm
Analysis of variance
Bacterial alkaline phosphatase
Bovine intestinal alkaline phosphatase
Bovine serum albumin
Protein content expressed in terms of BSA equivalents
Temperature in degree centigrade
Calories
Chlorofluorocarbon
Centimeter
Coefficient of variation
Diameter of an aerosol particle
Dry powder inhaler
Differential scanning calorimetry
Charge on an electron
Electric field strength
Collection efficiency in electrostatic precipitation
xvi

EP
FT-IR
g
J
JCPDS
KDa
kg
KF
kgf/cm2
kV
L
LOD
LOQ
M
m M
min
m g
MW
Ni
n
n m
P pMDI
Electrostatic precipitator
Fourier transformed infra red spectroscopy
gram
Joules
Joint Committee for Powder Diffraction Standards
Kilodaltons
Kilogram
Karl Fischer moisture analysis
Pressure expressed as kilogram force per square cm.
Kilovolts
Lactose
Loss on drying
Limit of quantitation
Mannitol
Millimolar
minute
milligram
Molecular weight
Ion number concentration
Number of charges acquired by a particle
Nanometer
Level of significance (in statistical analysis)
Pressurized metered dose inhaler
xvii

psig
Q rDNA
rhDNase
rhG-CSF
rConIFN
RH
S
s
SD
SDS
SEM
SPAG
T
Tg
TGA
Tris
UK
USA
USPfNF
Pounds per square inch, gauge
Volumetric flow rate
Recombinant deoxyribonucleic acid
Recombinant human deoxyribonuclease
xviii
Recombinant human granulocyte colony stimulating factor
Recombinant consensus interferon
Relative humidity
Revolutions per minute
Radius of tube of a wire-in-tube type precipitator
Radius of wire of a wire-in-tube type precipitator
Sucrose
second
Standard deviation
Sodium dodecyl sulfate
Scanning electron microscopy
Small Particle Aerosol Generator
Trehalose
Glass transition temperature
Thermogravimetric analysis
Tris(hyroxymethyl)-aminomethane
United Kingdom
United States of America
United States PharmacopeiaiNational Formulary

V
VTE
Wig
XRPD
Zj
a
% w/v
L'lH
o
!ll
!l m
!l
L'lW
min-1
r2
E
Volts
Terminal electrostatic velocity
Heat flow in watts/gram
X-ray powder diffraction
Mobility of ions in electrostatic precipitation
a anomer of lactose
P anomer of lactose
Percentage weight in volume
Enthalpy
X-ray diffraction angle
Microliter
Micrometer
Viscosity of air
Difference in voltage between wire and tube in an
electrostatic precipitator
Units for a first order rate constant
Coefficient of determination
Dielectric constant
xix

ABSTRACT
PHYSICAL AND CHEMICAL STABILITY OF SPRAY DRIED SUGARS AND PROTEIN-SUGAR MOLECULAR MIXTURES FOR INHALATION
BY Venkatesh Naini , M .Pharm.
A dissertation submitted in partial fulfillment of the requirements for the degree of Doctor of Philosophy at Virginia Commonwealth University.
Virginia Commonwealth University, 1996 .
Director: Peter R. Byron, Ph.D . Professor Department of Pharmacy and Pharmaceutics
The feasibility of producing inhalable microparticles of sugars and
protein-sugar molecular mixtures using spray drying was investigated as
an alternative to conventional micronization techniques . Four sugars ;
lactose (L) , trehalose (T) , sucrose (S) and mannitol (M) were spray dried
using a commercial bench-top spray dryer and their physicochemical
stability, with respect to particle size, moisture uptake and crystallinity
changes, investigated after storage at 23%, 52%, 75% and 93% relative
humidity (RH) and 25 °C for 30 days. Two crystalline size fractions ("coarse"
= 125-2 12 11m and "fine" = 44-74 11m) of each sugar, were also characterized,
as possible replacements for lactose as carriers for admixture with drugs
in dry powder inhalers (DPls). Sieve fractions of lactose , trehalose and
mannitol failed to show significant moisture uptake at RHs :5 93% and 25°C

xxi
indicating their thermodynamic stability under most realistic storage
conditions . While sucrose failed to show moisture uptake at:o; 75% RH, it
dissolved in sorbed moisture at 93% RH. Spray dried sugars were collected
successfully in particle sizes suitable for inhalation. Spray dried lactose,
trehalose and sucrose were amorphous and remained in this state after
storage at 23% RH. At higher RHs, however, they recrystallized completely
in :0; 30 days . Spray dried mannitol was completely crystalline after
collection from the spray dryer. It did not show moisture uptake or physical
state changes at all RHs.
A fine particle collection apparatus incorporating a nebulizer and a
wire-in-tube type electrostatic precipitator (EP), built and characterized for
particle collection efficiency, was used to review protein activity following
spray drying with or without the four sugars as stabilizers. Bacterial (BAP)
and bovine intestinal alkaline phosphatase (BIAP) were used as model
proteins . Sugar free BAP solutions (apparent protein concentration -120
Ilg/ml) lost 23% of initial enzyme specific activity after spray drying at -63
°C and collection in the EP. Protection offered by the sugars to BAP during
drying, was however statistically indistinguishable from the sugar-free
protein solution (dried from the same protein concentration solution) .
When BIAP was dried from sugar free solutions ( apparent protein
concentration -1 mg/mI) , it lost 3 1% of its initial specific activity; activity
which could be completely recovered when BIAP was co-dried with L, T or S
(ANOVA, p < 0 .05) . However, M which crystallized during spray drying

xxii
failed to protect the enzyme from this loss of activity. These results implied
that the physical state of sugar (amorphous or crystalline) in the final dried
product may be an important determinant for offering protection to proteins
during spray drying and storage . Even so, multiple factors could potentially
influence the selection of a sugar to form inhalable microparticles with a
protein. These factors are described and discussed in this thesis, whether
or not they appeared to be important with respect to the drying and stability
of particular proteins selected for experimental investigation.

I. BACKGROUND AND INTRODUCTION
Although inhalation of vapors and gases has been used since ancient
times for the treatment of a variety of respiratory disorders (Yernault,
1994), drug delivery by this route only became significant in the last 50
years . The first breakthrough to enable easy drug aerosol inhalation came
with the introduction of the pressurized metered dose inhaler (pMDl) in
1956 (Medihaler®, Riker) . Since then, there has been an increasing number
of drugs and devices that have been used for delivery to the lung. Three
main types of inhalation devices are presently used in therapy; the
pressurized metered dose inhaler (pMD l) , nebulizer (air-blast and
ultrasonic) and the dry powder inhaler (DPl) . pMDls usually consist of
drug suspended in liquefied propellant along with a surfactant ( Byron,
1990a) although solution systems are also possible . Although pMDls
currently garner the bulk of the inhalation market worldwide, their future
seems uncertain as a result of the impending ban on chlorofluorocarbon
(CFC) propellants which have been implicated in the depletion of the ozone
layer (Molina and Rowland, 1974; Dalby et aI . , 1990; Daly, 1993). As a result
there has been increased focus on formulation and development of
propellant free devices: nebulizers and dry powder inhalers (Martin et aI . ,
1994) . Nebulizers atomize aqueous solutions into fine droplets which are
1

2
then inhaled by the patient (Byron, 1990b) . DPIs either consist of the pure
drug or drug mixed with an inert carrier like lactose (Ganderton and
Kassem, 1992). In DPIs, the patient's respiratory effort usually provides the
energy to dislodge the drug from the carrier during inhalation ( Byron,
1990a).
The majority of inhalation drug delivery systems in the market today,
administer B-adrenergic bronchodilator or steroid drugs to the lungs for
treating bronchoconstriction or inflammation responses, associated with
airway diseases like asthma and bronchitis (Byron, 1990a and 1990b). These
compounds elicit their pharmacologic action in the lungs , and thus ,
inhalation delivery offers an excellent way of targeting these drugs to the
site of action (Gonda, 1992). However, there has also been a recent increase
in attempts to deliver drugs to the systemic circulation after aerosol delivery
via the lung (Byron and Patton, 1994; Adjei and Gupta, 1994; Niven, 1993;
Patton et ai . , 1994) . This increased interest has been in part due to the
biotechnology revolution (Wallace and Lasker, 1993 ; Eddington, 1 9 9 1 ) .
Recombinant DNA (rDNA) technology has made available a wide variety of
newer, high molecular weight biotherapeutics which can be potentially
administered to the lung for absorption into the systemic circulation (Byron
and Patton, 1994; Patton and Platz, 1992) . If this strategy is successful,
frequent injections of these drugs may be avoidable, since many of them
need to be administered in a pulsatile fashion more than once per day.
Drug delivery via the lungs also offers distinct advantages over other

3
alternative (to inj ections) routes of delivery, such as oral, nasal and
transdermal routes , for protein and peptide drugs (Patton et al . , 1994) .
These include, a relatively large absorptive area, avoidance of hepatic first
pass metabolism and possibly lowered enzymatic drug degradation (Patton
and Platz, 1992).
Many proteins and peptides have been investigated in animals and
humans for their potential absorption into the blood stream following lung
administration (Byron and Patton, 1994; Patton et al . , 1994 ; Niven, 1993;
Adjei and Gupta, 1994). Two peptides, insulin (for diabetes) and leuprolide
acetate (for endometriosis and prostatic carcinoma) have been extensively
studied for administration through the lung. Recently, Laube et al . ( 1993),
investigated the feasibility of aerosol insulin in humans and found that
after administering a 0 . 2 Unitslkg dose of regular insulin, by nebulizer,
resulted in an average maximum decrease of plasma glucose from baseline
by 55% compared to 13% for the placebo (Laube et al . , 1993) . Aerosol
leuprolide acetate, being developed by Abbott laboratories, is presently in
Phase III clinical trials (Niven, 1993 ) . Adjei and Garren, looked at
bioavailability of leuprolide acetate in human volunteers after
administration of the drug to the lungs as solution and suspension pMDI
formulations (Adjei and Garren, 1990) . They reported 3-4 fold higher
plasma levels of leuprolide for a pres surized suspension aerosol
formulation compared to the solution, with 14-18% absolute bioavailabilities
for the suspension formulation. If the < 20% lung deposition values (Gonda,

4
1992) reported for most pMDIs are taken into account, this corresponds to
almost quantitative (stoichiometric) absorption of drug actually deposited in
the lung. Besides these two peptides many other protein and peptide drugs
like human growth hormone, a-interferon, calcitonin, colony stimulating
factors (CSF) and parathyroid hormone are being investigated for
administration through the lung (Byron and Patton, 1994, Patton et a! . ,
1994, Adjei and Gupta, 1994).
In addition to the above mentioned examples for systemic delivery,
aerosol technology offers an excellent method for administering protein and
peptide drugs to the lungs for local action. Some of these drugs include
recombinant human DNase (rhDNase) for cystic fibrosis, 'Y-interferon for
Pneumocystis carinii in AIDS patients, cyclosporine for lung transplant
rejection and a-I-antitrypsin and a-I-protease inhibitors in emphysema.
DNase now forms a classic example of research and development of an
aerosol delivery system for a therapeutic protein for local activity in the
lung (Gonda et a! . , 1994; Cipolla et a! . , 1994a and 1994b) . An aqueous
solution formulation (Pulmozyme® Nebulizer Solution) of DNase is
currently approved by the FDA for administration to the lungs using a
nebulizer.
Although protein and peptide drugs have been formulated as
solutions for nebulization (DNase) and as pMDls Oeuprolide acetate) , DPIs
are also highly favored as delivery systems for such drugs . This

5
formulation strategy avoids dispersion of protein or peptide drugs in
hydrophobic propellants and avoids stability problems associated with
aqueous nebulizer solutions and processes (shear forces and exposure to a
large air-water interface in jet nebulizers and high temperatures in
ultrasonic nebulizers) provided the protein in question can be dried
successfully . In addition nebulizers are varied; their drug output and
operation are usually uncontrolled (Dalby and Tiano, 1994) . Moreover,
many nebulizers and their accessories are cumbersome to use which may
result in reduced patient compliance . In view of these problems with
pMDIs and nebulizers , it seems attractive to formulate proteins and
peptides as DPIs .
Successful respiratory drug delivery requires the production of fine
particles with aerodynamic diameters in the range of 1 to 10 �m. However,
particles with aerodynamic diameters less than 5 �m are considered
optimal for lung delivery of bronchodilators and steroids (Byron, 1990b) . To
reach the peripheral lung and to be most efficiently absorbed systemically,
particles of the order of 2 to 3 �m are required (Clark, 1995). Comminution
to produce such particles is usually accomplished by jet (gas impact)
milling or in some cases by ball milling in a low volatility propellant such
as CFC- l l ; and also by controlled microcrystallization ( Byron, 1990a) .
Milling in a liquid medium and controlled microcrystallization suffer from
several disadvantages such as contamination from the milling medium,
difficulty in controlling the nucleation rate and recovery of particles from

6
the medium. Hence , j et milling is usually the method of choice for
production of fine particles suitable for inhalation (Byron, 1990a; Parrott,
1974). In jet milling, the particulate material is suspended and conveyed at
high velocities by compressed gas and impacted against itself, causing the
break up as a result of attrition (Parrott, 1974). This method works well for
brittle crystalline materials with high melting points ( Byron, 1990) .
However, the recovery of small particles from the air stream, is difficult
and usually requires filtration through a fabric screen. Jet milling may not
be a suitable method for production of fine particles of protein and peptide
drugs for inhalation, because of their plastic (non brittle ) nature. This may
not be a problem if only large quantities of crystalline macromolecular
drugs could be produced reproducibly. Unfortunately, this problem is not
easily solved. In addition, administration of more potent protein and
peptide drugs via the lung may require tighter controls on the final particle
size (narrow particle size distribution) compared to traditional
bronchodilator drugs. This is fairly difficult to achieve by jet milling or
other existing techniques .
Alternative particulate process ing technologi e s are b e i ng
investigated for the production of fine particles for inhalation. Methods
cited in the literature which are generally suitable for pharmaceutical
materials are processing from supercritical fluids and spray drying.
Supercritical fluids have now been used to produce fine particles of small
molecules like lovastatin, B-estradiol and phenacetin and peptides like
7
insulin (Tom and Debendetti, 199 1 ; Phillips and Stella, 1993; Yeo et aI . ,
1993 ) . However, the application of this technique to pharmaceutical
materials is not well developed and involves expensive instrumentation.
On the other hand spray drying is a well established process in the
pharmaceutical industry for drying of tablet granulations and production of
particulate materials (Broadhead et aI . , 1992; Masters, 1991a; Fell and
Newton, 197 1) . Spray drying consists of four stages: 1) atomization of liquid
feed into a spray of fine droplets 2) spray-air contact resulting in the mixing
of droplets and air 3) drying of the droplets (solvent evaporation) and 4)
separation of the dried product from the air stream (Masters, 1991a) . Dry
powders of drugs for inhalation produced by spray drying may be mixed
with larger crystalline carriers like lactose or alternatively produced as
molecular mixtures with the carrier. In the latter case the carrier is
inhaled with the drug . . Spray drying has also been used to produce fine
particles for inhalation of the antiallergenic compound, disodium
cromoglycate (Vidgren et aI . , 198 7 ; Vidgren et aI . , 1989) and the
bronchodilator, albuterol (Chawla et aI . , 1994) . Vidgren and colleagues
compared the physical and inhalation properties of disodium cromoglycate
powders produced by spray drying and jet milling (Vidgren et aI . , 1987;
Vidgren et aI . , 1989) . They used 1 :1 drug/carrier (lactose) powder blends
consisting of either the spray dried or jet milled drug to study their
inhalation behavior using a cascade impactor as the size segregation
technique. Both formulations were similar when particles < 7 !lm were
8
considered, with spray dried and milled formulations producing 33% and
31 % of particles < 7 �m by mass respectively. However, when particles < 3
�m were considered they behaved quite differently. The spray dried
formulation produced 17% of particles < 3 �m by mass, compared to 8% for
the milled formulation (Vidgren et ai . , 1989). Results like these may not be
therapeutically signifi cant for drugs like albuterol or dis o dium
cromoglycate, but they become quite profound if the inhalation route is to be
used successfully for systemic delivery of proteins and peptides .
There have been several reports in the literature on spray drying of
proteins, although only a few studies have used the technique for
production of inhalable microparticles (Masters, 199 1b; Labrude et ai . , 1989;
Mumenthaler et ai . , 1994; Broadhead et ai . , 1994; Foster and Leatherman,
1995). Traditionally, enzymes have been spray dried as bulk powders for use
as detergents (lipase), in wound debridement (trypsin), in cheese making
(rennin) and ice-cream making (lactase) [Masters, 1991b). Reports on spray
drying of pharmaceutically relevant proteins like oxyhemoglobin (Labrude
et ai . , 1989), recombinant human growth hormone, tissue plasminogen
activator (Mumenthaler et ai . , 1994) and bovine somatotropin (Foster and
Leatherman, 1995) have also appeared only recently, but even these reports
do not deal with the unique problem of producing powders for inhalation.
Only two reports appeared in the literature dealing with spray drying
of proteins for inhalation purposes (Broadhead et ai., 1994; French et ai.,
1995) . The first study (Broadhead et ai . , 1994) used a model protein, 13-
9
galactosidase and the second report (French et ai . , 1995) utilized
therapeutic proteins ; recombinant human granulocyte colony stimulating
factor (rhG-CSF) and recombinant consensus interferon (rConIFN) .
However, proteins may be reversibly or irreversibly denatured and
chemically degraded due to high temperatures and desiccation during the
spray drying process (Masters, 1991b). Spray drying process may induce
increased aggregation of therapeutic proteins, which may have antigenicity
and toxicity potential . Spray drying of oxyhemoglobin at an inlet
temperature of 60 °C resulted in the retention of only 49% of the originally
active protein, the remaining 5 1% being the degradation product
methemoglobin (Labrude et al . , 1989). Broadhead et al . , report a residual
enzyme activity of 42% for B-galactosidase spray dried to a residual
moisture content of 4.5% at an inlet temperature of 105 °C (Broadhead et
ai., 1994).
Spray drying proteins with stabilizers has been suggested but not
thoroughly documented, as a method for preventing protein denaturation
during the drying process (Masters, 199 1b; Broadhead et al . , 1994; Labrude
et al . , 1989). Of several stabilizers investigated, some disaccharide sugars
seem to be very effective in imparting stability to proteins during drying and
storage of the dried powders (Labrude et al . , 1989; Broadhead et al . , 1994;
Carpenter, 1987). Sugars have been traditionally used as protein stabilizers
in aqueous solutions and are known to increase resistance of proteins to
denaturation by heat (Arakawa and Timasheff, 1982; Back et al . , 1979) and
10
also during freeze drying (Pikal, 1990; Franks and Berg, 1992; Izutsu et aI . ,
1993 ) . Protein stabilization by disaccharides i n solution has been explained
on the basis of "preferential hydration" mechanism proposed by Timasheff
(Timasheff and Arakawa, 1989). According to this hypothesis , stabilization
is attributed to preferential exclusion of sugar molecules (relative to the
bulk solution) in the immediate vicinity of the protein and thus, the protein
is preferentially hydrated. Thus, addition of sugar to a protein solution is
believed to increase the chemical potential of the protein in aqueous solution
and thus the free energy of the system (water + protein) . This i s
thermodynamically unfavorable for the unfolded state o f the protein ( since
unfolding increases the area of contact between protein and solvent) .
Therefore, in the presence of sugar, the equilibrium is shifted towards the
folded or native conformation, resulting in stabilization (Arakawa et aI . ,
199 1 ) . Although this mechanism may explain the stabilization of
macromolecules in solution prior to spray drying, air drying or freeze
drying, it does not explain the stability afforded during the end stages of
drying and during storage as dried powders, since under these processing
conditions, there is almost complete water removal from the system
(Carpenter et aI. , 1987).
Two additional hypotheses have been suggested to explain protein
stabilization by sugars during drying and storage of protein as dry powder.
According to the "water replacement" hypothesis suggested by Carpenter
and colleagues, during the end stages of drying, sugar molecules hydrogen

11
bond to polar residues on the protein, stabilizing the protein's conformation
and thus imparting stability (Carpenter et aI . , 1989; Carpenter et aI . , 1987;
Prestrelski et aI . , 1993) . In an elegant piece of work, Prestrelski and co
workers used Fourier-transform infrared spectroscopy (FT-IR) to study
conformational changes on several proteins on dehydration and their
inhibition by sugars (Prestrelski et aI . , 1993) . They showed that sugars
which stabilize lactate dehydrogenase (LDH) during freeze drying (sucrose
and lactose) give an identical FT-IR spectra for the dried powder compared
to the spectrum for the pre-dried protein solution (native conformation) in
the amide I region ( 1720 - 1610 cm-I ; corresponding to the peptide backbone);
this spectral match correlated well with enzyme activity retention. This
indicated that the sugars stabilized the native conformation in the dried
state.
However, the kind of structural explanation detailed in the last
paragraph is not fully consistent with the relative efficiency of different
sugars to stabilize proteins to varying degrees (Green and Angell , 1989) .
Hence, an alternative hypothesis based on the material science approach of
glass transition theory has been proposed (Green and Angell, 1989; Franks
et aI . , 1991; Levine and Slade, 1992). According to this hypothesis , during
drying of protein-sugar mixtures, the protein is entrapped in a glassy
amorphous matrix which immobilizes the protein, reducing long range
molecular motion and thus imparting stability (Green and Angell; 1989;
Levine and Slade, 1992). Glassy amorphous materials are usually obtained
12
by processes like spray drying and freeze drying which require high energy
input and completely destroy the crystalline structure (Matsuda et aI, 1992;
Saleki-Gerhardt et aI . , 1994) . Such materials exhibit a characteristic
temperature called the glass transition temperature (T g). This temperature
identifies the temperature of a critical event which determines physical
stability, chemical stability and viscoelastic properties, especially when this
temperature is approached or exceeded during processing , i . e . drying and
storage (Hancock and Zografi, 1994). At temperatures below the T g ' an
amorphous material, exists in the glassy state where molecular motion is
arrested. However, if processing or storage temperature exceeds Tg, the
material becomes rubbery and has increased molecular mobility. This
increased mobility increases the chance of degradative chemical reactions
(between sugar and protein) and physical instability like recrystallization
(Ahlneck and Zografi, 1990) . The Tg of a glassy material can be depressed by
many plasticizers, most important of which is water (Hancock and Zografi,
1994) . Hence , a metastable amorphous glass can remain stable for
pharmaceutically relevant time periods if the processing temperature
(drying and storage) is kept below the Tg of the material . There is some
consensus in the literature that the two hypotheses detailed above may not
be mutually exclusive, in that, although a glassy matrix is required for
stabilization, some non-specific bonding between the sugar and protein may
also be required.
Long term storage of dried protein-sugar mixtures can have unique

13
chemical stability problems (Hageman, 1988; Ford and Dawson, 1993;
Tarelli and Wood, 198 1) . In a series of papers , Tarelli and colleagues have
shown that proteins react with reducing sugars like glucose and lactose via
Maillard reactions whereby the aldehyde form of the sugar reacts with free
amino groups on the protein to form Schiff bases. These bases, in turn
undergo Amadori rearrangement, leading to irreversible loss of protein
activity (freeze dried protein-sugar mixtures; Tarelli and Wood, 198 1 ;
Tarelli and White, 1982; Tarelli e t aI . , 1987; Bristow e t aI . , 1988; Calam and
Tarelli, 1988) . They reported that a number of factors like temperature,
moisture content and pH influenced the reaction rate between protein and a
reducing sugar. They measured free lysine present in freeze dried bovine
serum albumin (BSA)-sugar mixtures after storage at 37 °C and 65% RH
for 26 weeks . In the presence of the non-reducing sugars like sucrose and
trehalose, lysine residues (with a free amino group) remained unaffected,
and these results were in parallel with retention of BSA antigenic activity
(bioassay), as measured by a radial diffusion assay. However, BSA dried
and stored with glucose and lactose (reducing sugars) showed that 85% and
70%, respectively, of the original lysine residues on the protein had
undergone modification, after identical storage conditions, and this was
also reflected by the loss of BSA antigenic activity (Tarelli and Wood, 1981) .
The amount of solids in an atomized droplet during spray drying is
dependent upon the concentration of solution sprayed. This , in turn,
determines the final particle size of the spray dried powder, with finer

14
particles being produced from lower concentration solutions. However, the
majority of commercially available bench top spray dryers have atomizer
technology which creates overly large droplets. These instruments also
have poor collection efficiencies for fine particles when spray drying low
concentration solutions (Broadhead, 1994).
The poor particle collection problem is addressed in this dissertation
by the use of a purpose designed electrostatic precipitator (Dalby et ai . ,
1992) . Electrostatic precipitation i s a particle charging technique employed
in pollution control, to limit particulate emissions in industrial exhausts
(White , 1963; Oglesby and Nichols, 1978) . It has been shown, at least in
theory to collect fine particles ($ 1 J.1m) with a high degree of efficiency
(Hinds, 1982). Collection efficiencies depend on the precipitator geometry,
electric field strength generated, volumetric air flow through the system
and particle size of material being charged and collected (Hinds , 1982) .
Atomization of low concentration (1% w/v) aqueous solutions followed by
droplet drying and electrostatic precipitation (laboratory scale model) was
shown to be capable of collecting fine particles suitable for inhalation (Dalby
et ai . , 1992; Naini et ai . , 1993) . Such a collection apparatus could then be
used to spray dry and collect small amounts of protein for evaluating
protein activity following spray drying in the presence and absence of
stabilizers . In the long term, it is certainly possible to scale the collection
device to deal with larger masses of materials (White, 1963) .
This dissertation is arranged to answer some of the questions

15
addressed in the paragraphs above . Chapter II cites the individual
hypotheses and specific aims to be addressed in the following chapters .
Each of the main chapters consists of an introduction, materials and
methods section, followed by a presentation and discussion of the
experimental results and an overall summary. Chapter III discusses
production and characterization of four spray dried sugars ; lactose ,
trehalose, sucrose and mannitol . These four sugars were chosen for their
different properties . Lactose, trehalose and sucrose are disaccharide s ,
while mannitol is a sugar alcohol . Lactose is a reducing sugar, while
trehalose, sucrose and mannitol are non-reducing. Trehalose, has received
a lot of attention lately for its excellent protein stabilizing properties (Colaco
at aI . , 1993; Levine and Slade ; 1993) . Although there are reports in the
literature detailing these features of trehalose, reports on physicochemical
characterization of spray dried amorphous trehalose are few. Comparison
of the physicochemical properties of spray dried sugars were made with
two crystalline sieve fractions of each sugar characterized in a similar
fashion; this because powder inhalers can be formulated with drug in
mole cular or particle s ize a s s ociations with sugar diluents .
Characterization of the sugars included particle size determinations ,
measurement of crystallinity changes using differential scanning
calorimetry (DSC) and X-ray powder diffraction (XRPD) after storage under
different relative humidity environments for 30 days at 25 °C (these
conditions are typical of those which formulations may experience in

16
different places in the USA). Moisture uptake at different storage conditions
was determined using thermogravimetric analysis (TGA) validated by Karl
Fischer analysis .
Chapter IV deals with the design and characterization of a particle
collection apparatus for fine particle collection. This chapter describes the
experiments performed to determine particle collection efficiencies inside
the electrostatic precipitator as a function of applied precipitator voltage,
volumetric air flow, temperature of drying and sprayed solution
concentration. Those experiments were performed primarily with lactose
using disodium fluorescein as a water soluble marker.
Chapter V describes the use of the particle collection apparatus
(Chapter IV) for the review of protein activity, following spray drying and
electrostatic precipitation. Spray drying and collection conditions validated
in Chapter IV were employed throughout. Two model proteins, bacterial
alkaline phosphatase (BAP) and bovine intestinal alkaline phosphatase
(BIAP) were selected for study. These protein solutions in 10 mM Tris
buffer pH 8.0 were sprayed, dried and electrostatically collected with or
without the addition of one of the four sugars (lactose, trehalose, sucrose
and mannitol ) , to the original solution. Collected and apparently dried
aerosols were either washed and reconstituted with 10 mM Tris buffer pH
8 .0 or stored in the dry state at 23% RH and 25 °C (conditions under which
amorphous sugars obtained by spray drying remained physically stable
without recrystallization; Chapter II!) , before washing and reconstitution

17
with buffer. The reconstituted solutions were then assayed for residual
enzyme activity and apparent protein content (in BSA equivalents - BSAE) .
Stabilizing properties of the four sugars during drying and storage of
alkaline phosphatase enzymes was rationalized based on their
physicochemical properties described in Chapter III .
Outside of the theme of the majority of this thesis (Chapters I to V),
Chapter VI describes the Karl Fischer moisture analysis of spray dried and
crystalline sugars using the coulometric method and compares these
results to those obtained by isothermal TGA. Chapter VII describes the
method development for assay of alkaline phosphatase enzyme activity in
solution and determination of protein contents (in terms of BSAE) using a
dye binding assay. These two chapters were included to attest to the validity
of those procedures which are used and quoted extensively in Chapters IV
and V. Chapter VIII provides an overall summary of the thesis, especially
as they relate to the original hypotheses.

rr. HYPOTHESES AND SPECDnC �
II.a HYPOTIIESES
1 . A commercial bench top spray dryer may be used to produce dry
respirably sized powders of four sugars; lactose, trehalose, sucrose and
mannitol , suitable for inhalation purposes. These spray dried sugars
may have different physicochemical stabilities at different relative
humidities (with respect to particle size and crystallinity) compared
to characterized sieve fractions of each sugar.
2. A novel particle collection apparatus may be designed, incorporating a
custom built wire-in-tube type electrostatic precipitator . Such an
apparatus, when coupled to a nebulizer, can be characterized with
respect to its operating variables, for particle collection efficiency, using
inert materials.
3 . Once characterized the particle generation and collection apparatus
assembly may be used to review the enzyme activities of two model
enzymes following spray drying and electrostatic collection; this to
assess the feasibility of stabilizing the model enzymes during drying and
in the dried state, following co-drying with each of the four sugars :
18

19
lactose, trehalose, sucrose and mannitol .
4. The ability of each of the four sugars : lactose, trehalose, sucrose and
mannitol to stabilize the model enzymes may be related to its capacity to
form an amorphous glass during spray drying.
II.b SPECIFIC AIMS
1. To prepare spray dried forms of lactose, trehalose, sucrose and mannitol
using a bench top laboratory spray dryer.
2. To prepare two size fractions (coarse and fine fractions) of the crystalline
form of each sugar using sieve fractionation.
3 . To characterize the particle size distribution of the spray dried sugars
using the Aerosizer® with Aerodisperser®.
4. To characterize the sieve fractions and spray dried form of each sugar
for moisture uptake and crystallinity changes using thermal
analysis (TGA, DSC and Hot Stage Microscopy) and X-ray powder
diffraction (XRPD).
5 . To validate moisture content analysis by thermogravimetric analysis
(TGA) using Karl Fischer analysis .
6 . To characterize particle deposition in a spray drying and electrostatic
precipitation apparatus, with respect to applied precipitator potential,
temperature of droplet drying, volumetric air flow rate and
concentration of the sprayed solution.
ID
7 . To spray dry and electrostatically collect bacterial alkaline phosphatase
(BAP) and bovine intestinal alkaline phosphatase (BIAP) with or
without the addition of four sugars; lactose, trehalose, sucrose and
mannitol and to evaluate resultant enzyme specific activities.
8 . To evaluate the storage stability of similarly spray dried enzyme-sugar
molecular mixtures at 23% RH and 25 °C for 14 days.
9 . To assess the ability of the four sugars to protect the enzymes during
drying and storage and correlate this with their physicochemical
properties in the spray dried form.
10. To evaluate the statistical significance of enzyme protection afforded by
the four sugars during drying and storage of each alkaline phosphatase
using analysis of variance .

III. PHYSICOCHEMICAL STABILITY OF CRYSTALLINE SUGARS
AND THEIR SPRAY DRIED FORMS: DEPENDENCE ON RELATIVE
HUMIDITY AND SUITABILITY IN POWDER INHALERS
I1I.a INTRODUCTION
Propellant-free , powder inhalers are being developed to avoid the
problems associated with the replacement of CFCs in pressurized metered
dose aerosols (Byron et ai . , 1994) . They also show promise for the delivery of
aerosolized peptides and proteins to the lung, prior to those compounds'
systemic absorption (Byron and Patton, 1994; Patton and Platz, 1992) . For
both conventional drugs and macromolecules , the active ingredient is
usually diluted with lactose (Ganderton and Kassem, 1992 ) . From a
toxicologic point of view however, most sugars are likely to be acceptable for
this purpose. Powder formulations for conventional small molecular
weight drugs, usually involve the preparation of an ordered mixture of a
micronized (jet milled to < 5 11m, and respirable) crystalline drug, with a
relatively free-flowing (larger particle sizes; > 40 11m) crystalline sugar, like
alpha lactose monohydrate . The flow characteristics of the sugar aid in
packaging, and emptying of the dosage form during use (Ganderton and
Kassem, 1992) . Ideally, drug particles should be attached to the surface of the larger carrier particles with forces of sufficient magnitude to prevent
21

de-segregation (during dosage form manufacture and storage) ; conversely,
these interparticulate adhesion forces must be small enough to enable drug
detachment from the carrier, in the turbulent airstream created by the
patient's inhalation (Staniforth, 1994). Because different drugs have
different adhesion properties, and these also depend on the excipient
chosen as carrier, a larger excipient menu would be clearly useful .
Powder formulations for proteins may require excipient dilution for
different reasons . Biological macromolecules can rarely be milled in
conventional ways (Niven, 1993) and, although spray drying may be used to
create respirable particulates (majority < 5 11m; Chawla et aI . , 1994 ; Naini
et aI . , 1992), proteins may denature during the process . Thus, sugar
diluents have been used to stabilize proteins, both during drying and
storage in the solid state (Carpenter et aI . , 198 7 ; Franks et aI . , 199 1 ;
Broadhead e t aI . , 1993; Labrude e t aI . , 1989; Mumenthaler e t aI . , 1994).
However, sugar selection and the concentration dependence of stabilization,
remain subjects for empirical review (Levine and Slade, 1992; Prestrelski et
aI . , 1993) . Similarly, because spray drying often leads to the formation of
metastable, high energy amorphous fOnTIS (Matsuda et aI . , 1992; Vidgren et
aI . , 1987) , which may recrystallize over time and render a formulation
"non-respirable" (Bystrom and Briggner, 1994), some sugars may be more
suitable than others as protein and peptide diluents in powder inhalers .
Ideally, formulations should be unaffected by storage or use in different
environmental conditions (Jashnani et aI. , 1995) .

This chapter reviews the suitability of four different sugars for use as
excipients in dry powder inhalers . Suitability of these sugars as carriers in
DPIs for the purposes of this study was defined in tenns of thennodynamic
stability; recrystallization from the amorphous state during storage has an
adverse effect on aerosolization behavior of DPI formulations . In addition,
RH of the air throughput through a DPI may affect the respirable fraction
of the dose emitted from the inhaler (Jashnani et aI, 1995) . Although this
factor was not investigated in this study, its effect on selection of a
particular sugar carrier is likely to be low. Each of the sugars : lactose ,
sucrose and mannitol are widely available in USP-NF pharmaceutical
grades . Trehalose is currently being considered as a new excipient, because
of its reported protein stabilization properties (Colaco et aI . , 1992 ) . All four
were assumed to be toxicologically acceptable for inhalation. Each sugar
was characterized as spray dried respirable particulates , and two typical
crystalline sieve fractions before and after 30 days storage at different
relative humidities . Their physicochemical behavior is discussed as it
relates to each sugar fonn's suitability as a powder inhaler excipient, along
with the need to protect formulations from humidity induced changes in
powder characteristics.

24
III.h MATERIALS AND METHODS
III.h. 1 MATERIALS
D-Mannitol, Sucrose and a,a-Trehalose dihydrate were obtained from
Sigma Chemical Company (St. Louis , MO) . a-Lactose monohydrate was
obtained from Foremost Ingredient Group (Baraboo, WI) . Karl Fischer
reagents Aquamicron-AS® and Aquamicron-CS® were obtained from Cosa
Instrument Corp . (Norwood, NJ) . All other chemicals used were obtained
from Fisher Scientific Company (Raleigh, NC) and were of reagent grade
quality.
III.h.2 METHODS
III. h.2. 1 Sieve fractionation of sugars
All sugars were sieved in a Cenco-Meinzer sieve shaker (Central
Scientific Co . , Chicago, IL) . Sucrose crystals were lightly crushed in a
mortar, to comminute and remove agglomerates , prior to sieving; other
sugars were sieved exactly as received. Sieve fractions, were retained
which were thought representative of those used in inhalation products .
These are designated "coarse fraction", A; 125-2 12 Jlm and "fine fraction",
B ; 44-74 Jlm, throughout this paper. After fractionation, A and B were
retained in tightly closed amber bottles and stored in desiccators over

Table III . l Experimental conditions for spray drying (Yamato ADL-3 1 ) of sugars from 10% w/v aqueous solutions
Condition
Inlet Temperature (Oc)· Outlet Temperature (Oc)· Atomizing pressure (kgf/cm2)a
Feed flow rate (mUmin)
Aspirator setting
Lactose
150 ( 147- 154)
70 (73-76)
3 .0 (2.8-3 .0)
10
4
a Values are instrument settings (recorded ranges)
Trehalose Sucrose
125b (122-132) 125b (1 18- 125)
70 (59-64) 70 (60-63)
3 .0 (2 .8-3.0) 2 .8 (2.8-3.0)
10 10
2c 4
b 125 °C was used, since a crusty product was obtained when 150 °C was employed
Mannitol
150 ( 142- 154)
70 (73-77)
3.0 (2.8-3.0)
10
4
c Aspirator setting was held at 2 to prevent powder loss from collection vessel into the air suction hose
�

phosphorous pentoxide prior to further study.
III.h.2.2 Spray drying of sugars
A 10% w/v aqueous solution of each sugar was spray dried using the
Yamato ADL-3 1 Mini-Spray Dryer (Yamato Scientific America Inc . ,
Orangeburg, NY). Inlet temperatures, atomizing pressure and other spray
drying conditions are summarized in Table I IL 1 . Spray dried sugars are
designated C, throughout this chapter. Immediately after their collection,
sugars were packed into tightly closed amber bottles and stored in
desiccators , over phosphorous pentoxide, prior to further study.
III.h.2.3 Moisture sorption studies
Approximately, 2 g samples of each sugar in forms A, B and C were
spread uniformly in open petri dishes (Cat. # 09-753-52A, Fisher Scientific
C o . , Raleigh, NC) . Each of these was immediately transferred to a
designated "desiccator vessel" (Cat # 08-595-2E, Fisher Scientific C o . ,
Raleigh, NC), with a saturated salt solution i n its base, for timed exposure
to a fixed relative humidity (RH) environment (Callahan et aI . , 1982). Salts
used, in excess at 25 cC, were potassium acetate (23% RH) , magnesium
chloride (52% RH), sodium chloride (75% RH) and potassium nitrate (93%
RH). The desiccator vessels were housed inside an environmental cabinet
(Model 4353 14, Hotpack, Philadelphia, PAl, maintained at 25 cC. Samples
were reanalyzed after 30 days storage.
III.h.2.4 Differential scanning calorimetry (DSC)
Samples of the crystalline coarse and fine sieve fractions (A and B) , and
the spray dried sugars (C; before and after 30 days storage at 25 °C and
different relative humidities), were studied using a DSC 7 (Perkin Elmer,
Norwalk, CT). Between 2 and 10 mg, accurately weighed in a crimp-sealed
(non-hermetic) aluminum sample pan, was scanned at a heating rate of 10
°C/min under a nitrogen gas purge . An empty crimped pan served as the
reference and all scans were performed in triplicate. The instrument was
calibrated prior to sample analysis , using an indium standard ( Perkin
Elmer; melting point = 156.6 °c, dHm = 28 .45 Jig).
I1I.h.2.5 Thermogravimetric analysis (TGA)
Thermogravimetric analysis was performed on sugar forms A, B and C
as defined above. Samples were weighed into open pans and studied in a
Perkin Elmer TGS2 with a System 4 microprocessor controller (Perkin
Elmer, Norwalk, CT). A heating rate of 10 °C/min was used at all times
with a nitrogen gas purge. All scans were performed in triplicate . The
instrument calibration check was performed using alumel (Perkin Elmer; magnetic transition temperature = 163 °C) . Mter confirmation by Karl
Fischer titration (below) the percentage of the initial weight which was lost
during the (non-isothermal) heating process from 3 1 °C (weights equivalent
to those determined under ambient conditions) to 160, 180 , 200 and 200 °C
(temperatures chosen as the midpoints of plateau regions) was ascribed to

28
the water content of sucrose, trehalose, mannitol and lactose respectively.
III.h.2.6 Particle size determination
Particle size distributions of spray dried sugars were determined using
an Aerosizer® , equipped with AeroDisperser™ (Amherst Process
Instruments, Inc . , Hadley, MA) as described previously by Hindle and
Byron ( 1995). Instrument settings were held constant with "shear force" =
0 .5 psi, "size limit" = 220 11m, "feed rate" = 1000 particle counts/s with "pin
vibration" activated and "de agglomeration" set to high. Size distributions
were displayed and calculated using API Aerosizer MACH2 software
V6 .02 .32 in terms of aerodynamic diameter. The values for true density
(employed in the calculation of aerodynamic size distributions ) were
determined by helium pycnometry on the spray dried materials
(Micromeritics Corporation, Norcross , Georgia) using an outgas sing
temperature of 27.7 °C .
III.h.2.7 Hot stage microscopy
Hot stage microscopy was performed as a diagnostic test on selected
samples, to better interpret DSC thermal events. A Mettler FP 82 Hot Stage
attached to a Mettler FP 80 Central Processor (Mettler Instrument Corp . ,
Hightstown, NJ) was employed with a scanning rate of 10 °Clmin and a
nitrogen purge. The hot stage furnace was cross calibrated with the DSC 7
under these conditions using stearic acid and indium melting transitions

!B
(69 . 1 and 156.6 cC, respectively) . Sample behavior was observed under
crossed polars using incident and transmitted light (Nikon Optiphot,
Nikon, Tokyo, Japan).
III.h.2.8 X-ray powder diffraction
This was performed on both sieved sugars, A and B, prior to humidity
testing . Spray dried sugars, C, were tested before and after 30 days
exposure to different RH environments . Each powder sample was loaded
into the sample holder of a Rigaku Geigerfiex, Model 2028 X-ray
diffractometer (Rigaku Denki Corp . , Tokyo, Japan) and depressed with a
glass slide, to produce a sample bed flush with the surface of the holder.
Sugars which had recrystallized to form a fused mass at higher humidities
were crushed to powder in a glass mortar prior to sample preparation. All
samples were scanned between 2 0 = 5 to 45° under the following
measurement conditions : target = Cu, filter = Ni, voltage = 35 kV and
current = 22.5 rnA. In preliminary experiments, angular positions of the
most intense peaks for several of the sugars were compared to JCPDS (Joint
Commission for Powder Diffraction Standards, 1974) data files to ensure
accurate angular calibration of the instrument.
III.h.2.9 Karl Fischer moisture determination
Karl Fischer analysis was performed on the fine sieve fractions of all
sugars prior to humidity testing, to confirm that the initial weight loss

recorded by TGA was due to dehydration. Analysis employed a Mitsubishi
Moisture Meter, Model CA-05 (Mitsubishi Kasei Corp . , Tokyo, Japan) .
Between 100 and 300 mg of each sugar was weighed accurately and
dissolved in 10 ml of formamide; 400 III of this solution was injected and
titrated for water, coulometrically. A blank formamide injection was
titrated prior to each sample injection. The water concentration of the blank
was subtracted from the water content of the sample. Reported values are
the mean of five such (sample - blank) determinations.
III.c RESULTS AND DISCUSSION
Much of the discussion to be centered around the physicochemical
stability of the various forms of these sugars will rest upon the structures
shown in Figure I lI . l and the data shown graphically in Figures 111 .2
through III .5 . Importantly, the X-ray powder diffraction patterns (Figures
I l I . 2 and I I l . 3 ) and thermograms (Figures I l I .4 and I I l . 5 ) are broad
summaries which enable a discussion of the maj or physical
transformations seen in these investigations . Tables IlI .2 through III . 7 , on
the other hand, are condensed forms of the data collected during the many
experiments performed in the study. They summarize , for lactose,
trehalose, sucrose and mannitol, the precision of the calorimetric and
thermogravimetric determinations and define, for future reference, ranges
of values for water content, dehydration, recrystallization and melting
temperatures and enthalpies, as functions of sample pretreatment and
31
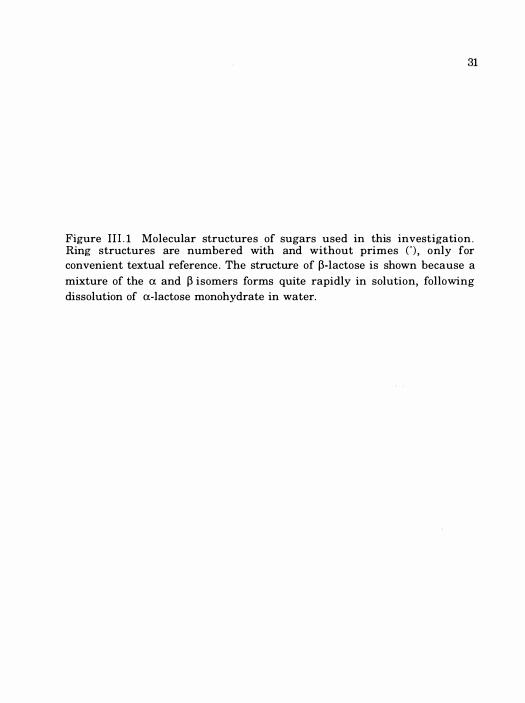
Figure II ! . 1 Molecular structures of sugars used in this investigation . Ring structures are numbered with and without primes C ) , only for convenient textual reference . The structure of �-lactose is shown because a
mixture of the a and � isomers forms quite rapidly in solution, following
dissolution of a-lactose monohydrate in water.

4-O-J3-D-Galactopyranosyl-D-glucopyranose 6' CH20H
6 H /,1--0 H CH20H 1/ H �I I' OH 1----0 � OH H I I/H �f1 �1-- 1 2' OH �OH H/H H OH H 1--- 1 2 a-lactose H OH 6' CH20H
6CH OH H ........ ;I--O�OH 2 / H I 0;/l l-o� oJ""OH H I I' k �H H /11 1-- 1 2 ' H H "I--I"f H H OH
H OH J3-lactose
a-D-Glucopyranosyl a-D-G1ucopyranoside HOH2C6 � OH H� /-O� H H/b-;----�" H I O� H/�O�� HOH2y�1 OH /--1 2 O--�
OH H OH a,a-trehalose
J3-D-Fructofuranosyl a-D-Glucopyranoside 6 CH20H I'
H )--0" H HOC�2 0........... H , ./ H " 1 2' ........... / 5 I�OH H /�� HI�lo/CH20H OH I--/� 6' H OH Sucrose OH H
l,2.3.4 .5 .6-Hexanehexol 1 CH20H
HO- �H HO-C-H H- {;-OH H-y60H
CH20H D-Mannitol
32

33
process variables. The data for water content for the various forms of each
sugar, before and after storage at different relative humidities (Table IIl .2 ) ,
is reported following thermogravimetric analysis for percent weight loss to
the midpoint of each sugar's TGA plateau region (upper curve of the left
frame for trehalose, Figure IlL5, for example) . These values were more
precise than, and correlated well with, Karl Fischer titrations for water, as
shown in footnote c of Table IIl .2 .
III.c .I Chemistry and kinetics of mutarotation
The chemistry involved in the transformation of alpha to beta lactose
(Figure III. 1 ; mutarotation requires ring opening at the ether linkage to
the l ' anomeric carbon, rotation of the l ' - 2 ' bond and subsequent ring
closure) is a prerequisite to the discussion of the chemical and physical
instability of this "reducing sugar" (Pine, 1987a) . Importantly, ex and 13
lactose are chemically distinct isomers ; they are not polymorphs or
different crystal forms . Understanding the essentials of this subject further
enables the selection of non-reducing sugars (eg. trehalose, sucrose and
mannitol ) which do not mutarotate significantly. Reducing sugars have
ketone or aldehyde groups in their straight chain forms and have been
shown to degrade freeze dried proteins in the solid state (Tarelli and Wood,
1981).
Sugars exist in both cyclic and straight chain forms in equilibrium,
although one of these forms invariably predominates . Mutarotation of

34
hexoses, at rates likely to cause problems to the formulation chemist, only
occurs when the straight chain form has an aldehyde or ketone at the C - 1 ,
anomeric carbon a n d an aliphatic alcohol at C-5 . Under thes e
circumstances, intramolecular alcohol addition occurs a t the C- 1 carbonyl
group (Pine, 1987b) to form the hemiacetal or hemiketal respectively (lactose
is a hemiacetal) . For lactose, this process is shown diagrammatically in
Scheme 1:
6' CH20H
[ /,/-- 0 X- H/ · H �H
�_ o�"'O/H . H/J� ---/ 2'
Scheme 1
H OH
a-lactose (hemiacetal)
In all cases, and thus, as a rule, the oxygen atom of the alcohol (on the 5'
carbon of lactose) forms a bond with the carbonyl carbon atom (on the l'
anomeric carbon of lactose) of the aldehyde or ketone (lactose has an
aldehyde in its straight chain form), and the hydroxy hydrogen atom (of the

35
alcohol) bonds to the carbonyl oxygen atom of the aldehyde or ketone (to
form the hemiacetal or hemiketal, respectively). In the case of lactose, the
ring opened, straight chain structure, has a l' - 2' bond which can rotate
freely. Ring closure , which is thermodynamically favored, thus forms a
mixture of a and � lactose which differ with respect to the positioning of the
1'-hydroxy group (Figure IlL l ) . Completing the story with respect to
lactose, at 20 °C in aqueous solution, the equilibrium favors �-lactose for
stereo-chemical reasons (62 .8% �; Pigman and Anet, 1972) . Thus during
production, the alpha monohydrate is isolated preferentially from aqueous
solutions by crystallization at cold temperatures, where its solubility is less
than that of the � form (Handbook, 1986) . However, when a-lactose is
dissolved in water at 20 °C, mutarotation commences immediately with a
half-life to equilibrium of 147 . 5 minutes (Pigman and Anet, 1972 ) .
Conversion of alpha lactose to the beta form has also been noted in the solid
state in the present study and elsewhere (Otsuka et aI . , 1992).
In order to generalize, and determine whether mutarotation is likely to
be a problem with other sugars, it is necessary to visualize the reaction,
shown in Scheme 1, and follow the rules for it, in both directions . When
sugars are shown in cyclic form (eg. sucrose and trehalose, Figure I lL 1) ,
the oxygen in the ring(s) must be linked to a carbon atom with a directly
attached hydroxyl group for ring opening (to produce a reactive aldehyde or
ketone) to be favored. This is not the case for any of the ring oxygens of

trehalose or sucrose (which are therefore non reducing sugars) ; nor is it
the case for lactose's second ring oxygen. Conversely, when sugars are
shown in straight chain fonn (eg. mannitol, Figure IIL 1) , they should not
cyclize, and thus mutarotate , unless they contain a carbonyl group which
can undergo alcohol addition. Thus mannitol is not a reducing sugar, nor
does it have mutarotation problems.
III.c.2 Crystalline sieve fractions, A and B
III.c.2 .1 Lactose
Usually isolated from cow's milk as a byproduct during cheese
manufacture , alpha lactose monohydrate i s readily obtainable in
crystalline form and was recently the subject of the first harmonized
pharmacopeial excipient monograph (USP23INF 18 , 1994a). The crystal
structure of alpha lactose monohydrate has been reported (Fries et al. , 197 1;
Beevers and Hansen, 197 1 ) . From suppliers such as DMV (Veghel, The
Netherlands) it is available in different particle size distributions (Hindle
and Byron, 1995), some of which are preferred for use as drug diluents and
carriers in powder inhalers . Both the coarse and fine sieve fractions
prepared from Foremost brand alpha lactose monohydrate in this study
behaved similarly. They were highly crystalline following sieve
fractionation (Figure IIL2, X-ray powder diffraction) and complied with
compendial specifications for water content (4.5 to 5 .5% by weight;
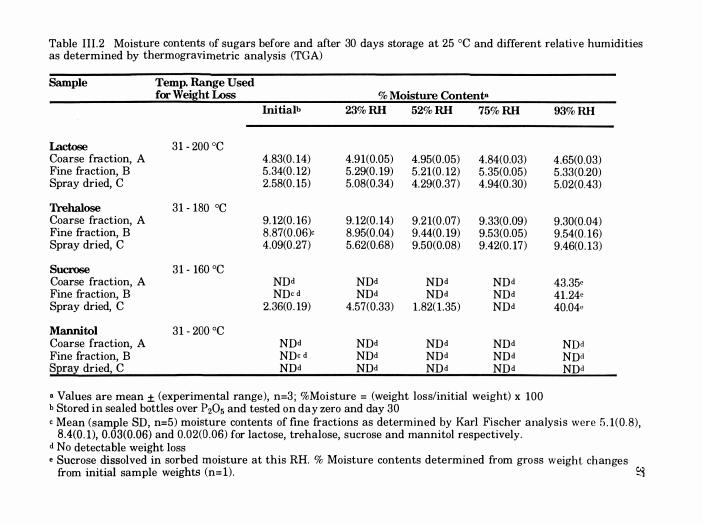
Table 1I 1 .2 Moisture contents of sugars before and after 30 days storage at 25 °C and different relative humidities as determined by thermogravimetric analysis (TGA)
Sample Temp. Range Used for Weight Loss % Moisture Contento
Initialb 23% RH 52% RH 75% RH
Lactose 31 - 200 °C Coarse fraction, A 4.83(0 . 14) 4.91(0.05) 4.95(0 .05) 4.84(0.03) Fine fraction, B 5.34(0 . 12) 5 .29(0 . 19) 5 .21(0 . 12) 5 .35(0.05) Spray dried, C 2.58(0 . 15) 5.08(0.34) 4.29(0.37) 4.94(0.30)
Trehalose 31 - 180 °C Coarse fraction, A 9. 12(0 . 16) 9. 12(0 . 14) 9.2 1(0 .07) 9.33(0 .09) Fine fraction, B 8.87(0 .06)<: 8.95(0 .04) 9.44(0 . 19) 9.53(0.05) Spray dried, C 4.09(0 .27) 5.62(0.68) 9.50(0.08) 9.42(0 . 17)
Sucrose 31 - 160 °C Coarse fraction, A NDd NDd NDd NDd Fine fraction, B NDc d NDd NDd NDd Spray dried, C 2.36(0 . 19) 4.57(0.33) 1 .82( 1 .35) NDd
Mannitol 31 - 200 °C Coarse fraction, A NDd NDd NDd NDd Fine fraction, B NDc d NDd NDd NDd Spray dried, C NDd NDd NDd NDd
• Values are mean ± (experimental range), n=3 ; %Moisture = (weight loss/initial weight) x 100 b Stored in sealed bottles over P205 and tested on day zero and day 30
93% RH
4.65(0 .03) 5 .33(0.20) 5.02(0.43)
9.30(0 .04) 9.54(0 . 16) 9.46(0 . 13)
43.35c 41 .24c 40.04"
NDd NDd NDd
c Mean (sample SD, n=5) moisture contents of fine fractions as determined by Karl Fischer analysi s were 5 . 1(0 . 8) , 8 .4(0 . 1), 0.03(0.06) and 0.02(0 .06) for lactose, trehalose, sucrose and mannitol respectively.
d No detectable weight loss e Sucrose dissolved in sorbed moisture at this RH. % Moisture contents determined from gross weight changes
from initial sample weights (n= l) . �

Table lII .3 Median aerodynamic diameters' for spray dried sugars based on volume distributions , as determined by Aerosizer® with Aerodisperser™
Sample
Lactose Trehalose Sucrose Mannitol
Median aerodynamic diameter (�m)
5.56 (0.25) 5.23 (0 .47) 12.53 (2.72) 4.79 (0 .09)
Geometric standard deviation
1 .64 (0.26) 1 .64 (0.39) 2 . 18 (0.34) 1.46 (0.02)
a Values are averages (experimental ranges) of two determinations of the median aerodynamic diameter, where aerodynamic diameter: [equivalent spherical diameter x (density)112] . Density was determined by helium pycnometry for spray dried lactose, trehalose, sucrose and mannitol as: 1 . 54, 1 .52, 1 .53 and 1 .43 g cm·3 respectively.
83
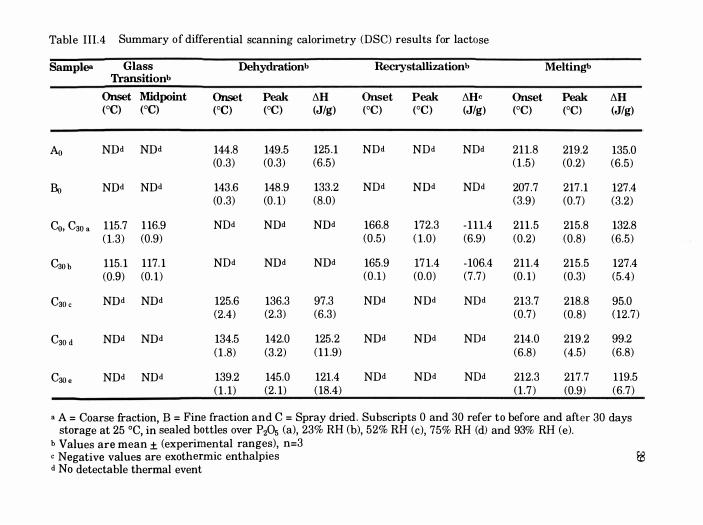
Table I l I .4 Summary of differential scanning calorimetry (DSC) results for lactose
Samplea Glass Dehydrationb Recrystallizationb Melting'> Transitionb
Onset Midpoint Onset Peak tlH Onset Peak tlHc Onset Peak tlH (OC) (OC) (OC) (OC) (JIg)
(OC) (OC) (JIg) (OC) (OC) (JIg)
Ao NDd NDd 144.8 149.5 125 . 1 NDd NDd NDd 211 .8 219.2 135.0 (0 .3) (0.3) (6.5) ( 1 .5) (0 .2) (6.5)
Eo NDd NDd 143.6 148.9 133.2 NDd NDd NDd 207 .7 217 . 1 127.4 (0 .3) (0 . 1) (8.0) (3.9) (0.7) (3 .2)
Co, C30 a 115.7 1 16.9 NDd NDd NDd 166.8 172.3 - 1 1 1.4 211 .5 215.8 132.8 ( 1.3) (0.9) (0.5) ( 1 .0) (6.9) (0 .2) (0 .8) (6.5)
COO b 115. 1 117. 1 NDd NDd NDd 165.9 17 1.4 - 106.4 211 .4 215 .5 127.4 (0.9) (0. 1 ) (0 .1 ) (0.0) (7 .7) (0 . 1) (0.3) (5.4)
C30 c NDd NDd 125.6 136.3 97.3 NDd NDd NDd 213.7 218.8 95.0 (2.4) (2.3) (6.3) (0 .7) (0 .8) ( 12.7)
C30 d NDd NDd 134.5 142.0 125.2 NDd NDd NDd 214.0 219.2 99.2 ( 1 .8) (3.2) ( 1 1 .9) (6.8) (4.5) (6.8)
Coo . NDd NDd 139.2 145.0 121.4 NDd NDd NDd 212.3 217.7 1 19.5 ( 1 . 1) (2 . 1) ( 18.4) ( 1 . 7 ) (0.9) (6 .7)
a A = Coarse fraction, B = Fine fraction and C = Spray dried . Subscripts 0 and 30 refer to before and after 30 days storage at 25 °C, in sealed bottles over PzOs (a), 23% RH (b), 52% RH (c), 75% RH (d) and 93% RH (e).
b Values are mean ± (experimental ranges), n=3 c Negative values are exothermic enthalpies E8 d No detectable thermal event
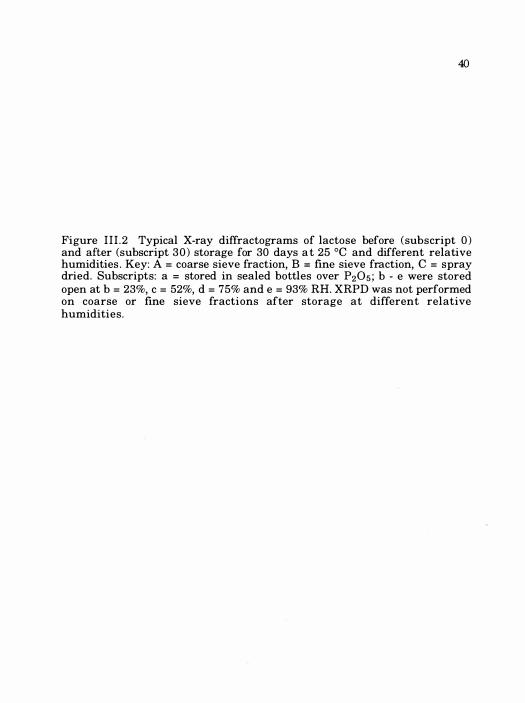
40
Figure I I I .2 Typical X-ray diffractograms of lactose before (subscript 0 ) and after (subscript 3 0 ) storage for 30 days a t 25 °C and different relative humidities . Key: A = coarse sieve fraction, B = fine sieve fraction, C = spray dried. Subscripts: a = stored in sealed bottles over P205 ; b - e were stored open at b = 23%, c = 52%, d = 75% and e = 93% RH. XRPD was not performed on coarse or fine sieve fractions after storage at different relative humidities .

41
5 15 25 35 45 28 DEGREES
42
USP23/NF I8 , 1994a) and theoretical calculation based on the 1 : 1
stoichiometry of alpha lactose monohydrate ( 5 . 0 % ; Table I I I . 2 , by
thermogravimetric analysis) . There was no significant tendency to sorb or
lose water at any of the storage conditions tested over a 30 day period, for
either the coarse (A = 125 - 212 11m) or the fine (B = 44 - 74 11m) sieve
fractions (Table I1I .2) , although the fine sieve fraction, B, had a higher
overall water content ( surface moisture, over its larger specific surface;
Zografi , 1988). Scanning calorimetry showed that there were no significant
differences between sieve fractions A and B, with respect to onset and peak
dehydration or melting temperatures, or dehydration and melting
enthalpies (Table III .4) . Thermograms showed a dehydration endotherm
( 120 - 160 °C), a small recrystallization exotherm at 172 °C and a melting
endotherm (in agreement with literature reports; Berlin et aI . , 197 1 ; Raemy
and Schweizer, 1983) between 190 and 225 °C. The microscopic size and
appearance of the crystals, was unaffected by 30 days storage at different
humiditi e s , indicating that alpha lactose monohydrate w a s
thermodynamically stable at 25 °C .
III.c.2.2 Trehalose
Extracted from both insect and vegetable sources, this disaccharide is a
non-reducing sugar which is being explored for use as an excipient and
cryoprotectant in lyophilized products (Carpenter et aI . , 1986) . Clearly
therefore, it is also a candidate for use as a diluent, stabilizer and/or carrier

43
with proteins and peptides in powder products for inhalation. The crystal
structure of trehalose dihydrate has been reported (Taga et ai . , 1972; Brown
et ai . , 1972) . It was easily obtained as a stoichiometric dihydrate (theoretical
water content = 9 .5%) in crystal sizes ranging from approximately 20
through 250 �m; sieve fractionation of 1 kilogram provided 120 and 33 g of
the coarse and fine sieve fractions respectively. Both sieve fractions behaved
similarly with respect to their XRPD (Figure IlL3) and water contents,
although the fine sieve fraction, B, showed a tendency to sorb more water at
increased relative humidities (Table III .2) . This was unlike the behavior of
lactose fraction B and appeared to be surface moisture associated with an
increased weight fraction of smaller crystals (fines) in the trehalose as
originally supplied (Zografi, 1988) . Scanning calorimetry showed that there
were no significant differences between the coarse and fine fractions with
respect to their onset and peak melting temperatures and melting
enthalpies (Table I lL5) . Thermograms showed dehydration and melting
endotherms at 97 DC and 207 DC respectively (Table I I I .2 and Figure I1L5) .
Its reported melting by Slade and Levine (203 DC , 1991) was consistent with
our data, although the value reported in Merck Index (96 - 97 DC; Budavari,
1989) was clearly incorrect. When observed on the hot stage microscope
under crossed polars , birefringence was lost beginning at approximately 92
DC (as confirmed recently by Taylor et ai . , 1994). However, those authors
reported melting at 130 DC (followed by recrystallization from the melt, and
a final melt at 215 DC) while we saw only a single melt at 207 DC on hot stage
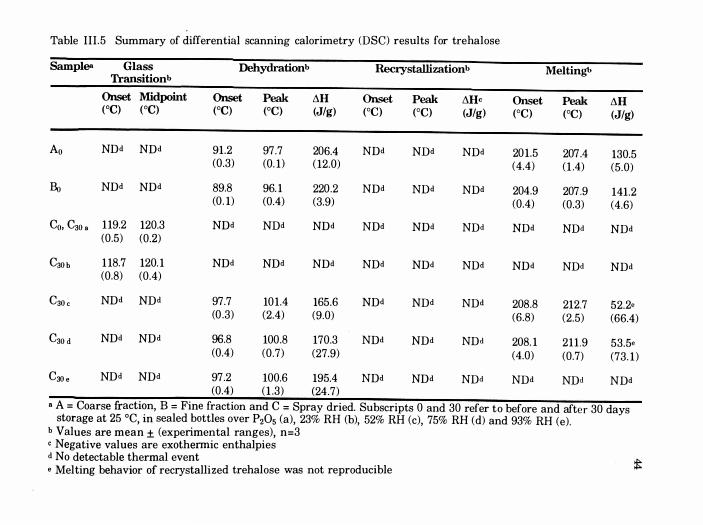
Table III .5 Summary of differential scanning calorimetry (DSC) results for trehalose
Samples Glass Dehydrationb Recrystallizationb Melting!> Transitionb
Onset Midpoint Onset Peak l1H Onset Peak l1Hc Onset Peak l1H (OC) (OC) (OC) (OC) (JIg) (OC) (OC) (JIg) (OC) (OC) (JIg)
Ao NDd NDd 91.2 97 .7 206.4 NDd NDd NDd 201.5 207 .4 130.5 (0.3) (0. 1) ( 12.0) (4.4) ( 1 .4) (5 .0)
Eo NDd NDd 89.8 96. 1 220.2 NDd NDd NDd 204.9 207 .9 141.2 (0 . 1) (0.4) (3.9) (0.4) (0.3) (4.6)
Co, C30 • 119.2 120.3 NDd NDd NDd NDd NDd NDd NDd NDd NDd (0.5) (0.2)
C30 b 1 18.7 120. 1 NDd NDd NDd NDd NDd NDd NDd NDd NDd (0.8) (0.4)
C30 c NDd NDd 97.7 101.4 165.6 NDd NDd NDd 208.8 212.7 52.2e (0 .3) (2.4) (9.0) (6.8) (2.5) (66.4)
C30 d NDd NDd 96.8 100.8 170.3 NDd NDd NDd 208. 1 211 .9 53.5e (0.4) (0 .7) (27.9) (4.0) (0.7) (73. 1 )
C30 e NDd NDd 97.2 100.6 195.4 NDd NDd NDd NDd NDd NDd (0.4) ( 1 .3) (24.7)
• A = Coarse fraction, B = Fine fraction and C = Spray dried. Subscripts 0 and 30 refer to before and after 30 days storage at 25 °C, in sealed bottles over P205 (a), 23% RH (b), 52% RH (c), 75% RH (d) and 93% RH (e).
b Values are mean ± (experimental ranges), n=3 c Negative values are exothermic enthalpies d No detectable thermal event t e Melting behavior of recrystallized trehalose was not reproducible
45
Figure I lL3 Typical X-ray diffractograms of trehalose , sucrose and mannitol before (subscript 0) and after (subscript 30) storage for 30 days at different relative humidities. Key: A = coarse sieve fraction, B = fine sieve fraction, C = spray dried. Subscripts : a = stored in sealed bottles over P 205 ; b - e were stored open at b = 23%, c = 52%, d = 75% and e = 93% RH. XRPD was not performed on coarse or fine sieve fractions after storage at different relative humidities . No diffraction pattern is shown for spray dried sucrose, C30e, which dissolved in its own sorbed moisture at 93% RH.
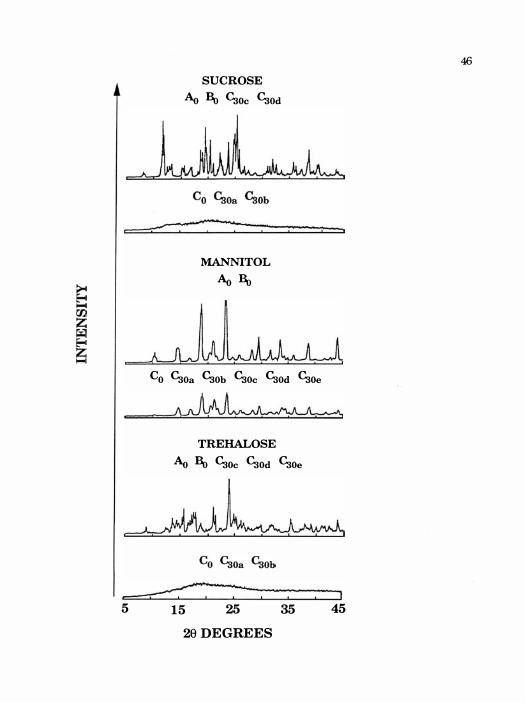
SUCROSE Ao Bo CaOc Caod
MANNITOL Ao Bo
Co Caoa Caob Caoc Caod Caoe
TREHALOSE Ao Bo CaOc CaOd CaOe
5 15 ::: : : 25 35
29 DEGREES
46
J 45
47
Figure IlI .4 Typical TGA and DSC thermo grams of lactose before (subscript 0) and after (subscript 30) storage for 30 days at different relative humidities . Key: A = coarse sieve fraction, B = fine sieve fraction, C = spray dried. Subscripts : a = stored in sealed bottles over P205 ; b - e were stored open at b = 23%, c = 52%, d = 75% and e = 93% RH. Only TGA was performed on A and B before and after exposure at different RH.

..------------------, 9.o 10 Ao AaOa,b,c,d,e Bo B30a,b,c,d,e
60 1...-___________ �_�--:-:'. 0.0 30 150 270
r----------------.9.0 10
60 '--_� ____________ ---' 0.0 30 150 270
r-----c::----:r:--_ -r:::-"_ ------, 9.0 30c ""30d �.iOe
100'1----------..
60 1...------------�-�-l 0.0 30 150 270
TEMPERATURE (C)
48
49
and DSC, with no exotherms (for recrystallization) in the thermograms.
The microscopic size and appearance of the crystals , was unaffected by 30
days storage at up to and including 93% RH, showing the thermodynamic
stability of trehalose dihydrate at 25 °C.
llI.c.2.3 Sucrose
Derived from a number of vegetable sources, sucrose can be obtained
easily as anhydrous crystals (without water of crystallization). The crystal
structure of sucrose has been reported (Brown and Levy, 1963) . Crystal size
of the material obtained from Sigma Chemical Co. (St. Louis , MO) was
large (> 212 �m). Thus, it required comminution before use; sucrose from
several other suppliers we reviewed was similar in this respect, meaning
that there was substantial waste following sieve fractionation unless
considerable size reduction was employed. This was avoided in this study,
because of the possibility of creating a large amorphous content. Thus, 1
kilogram of the lightly crushed material provided only 30 and 18 g of the
coarse and fine sieve fractions respectively. Both sieve fractions A and B
behaved similarly; they were anhydrous and highly crystalline (Figure
I I L 3 ) . Scanning calorimetry showed that there were no significant
differences between the coarse and fine fractions with respect to onset and
peak melting temperatures and enthalpies (Table I I I .6 ) . Thermograms
(Figure IlL5) showed a melting endotherm only, between 175 and 200 °C (in agreement with literature reports; Raemy and Schweizer, 1983; Roos , 1993)

Table I1L6 Summary of differential scanning calorimetry eDSC) results for sucrose
Samples Glass Dehydrationb Recrystallizationb Meltingh Transitionb
Onset Midpoint Onset Peak .1H Onset Peak .1Hc Onset Peak .1H (OC) (OC) (OC) (OC) (JIg) (OC) (OC) (JIg) (OC) (OC) (JIg)
Ao NDd NDd NDd NDd NDd NDd NDd NDd 186.8 189.5 123.4 (0 .2) (0 .2) (2 .6)
130 NDd NDd NDd NDd NDd NDd NDd NDd 188 . 1 189.8 130.2 (0 .0) (0 .2) ( 1 .9)
Co, C30 a 60.2 62.7 NDd NDd NDd 1 11 .7 126. 1 -82.9 186.5 188.8 120.8 (2.8) ( 1 .0) ( 13 .7» (5 .2) ( 1 1 .3) ( 1 .6) (0.2) (7 . 1 )
C30 b NDd NDd NDd NDd NDd 1 16.4e 123 .3e - 18.6e 187 . 1 188.7 109.6 (4.4) ( 1 .0) (27.8) ( 1 .5) ( 1 ,0) (26.9)
C30 c NDd NDd NDd NDd NDd NDd NDd NDd 183 . 1 185 .8 107 .2 ( 1 .4) (0.5) (3.0)
C30 d NDd NDd NDd NDd NDd NDd NDd NDd 182.4 185.2 102.4 (0 .7) ( 1 .2) (6.8)
• A = Coarse fraction, B = Fine fraction and C = Spray dried. Subscripts 0 and 30 refer to before and after 30 days storage at 25 °C, in sealed bottles over P205 (a), 23% RH (b), 52% RH (c) and 75% RH (d).
b Values are mean ± (experimental range), n=3 c Negative values are exothermic enthalpies d No detectable thermal event e Values are mean ± (experimental range), n=2 23

51
Figure IlL5 Typical TGA and nsc thermograms of trehalose, sucrose and mannitol before (subscript 0) and after (subscript 30) storage for 30 days at different relative humidities. Key: A = coarse sieve fraction, B = fine sieve fraction, C = spray dried. Subscripts: a = stored in sealed bottles over P 205; b - e were stored open at b = 23%, c = 52%, d = 75% and e = 93% RH. The second (melting) endotherm shown for trehalose, shown in the top left frame, was poorly reproducible for spray - dried material which had recrystallized on storage (C30e,d, .) . Sucrose, A30., B 3o. , and C 30., dissolved in sorbed moisture at 93% RH. Only TGA was performed on A and B before and after exposure at different RH.

52
SUCROSE AO ASOa,b,c,d BSOa,b,c,d CsOe d Co C30• CSOb
12 12 100 100
6
�--------------/) � � L-________________________ � O
30 90 150 210
l00 �-------------------------
t: 5 &j 90 � o?-
'--so
20
0 30 90 150 210
90
90 150
Co CSOa,b,c,d,. r-------�--���------_, �
l00 r-------------------------
90
so � ________________________ � O 30 90 150 210
TREHALOSE AO A3Oa,b,c,d,. Bo BSOa,b,c,d,. C3Oc,d,e Co C30B C30b
15 S.O
100 100 � !: -i
s �c:: � SO 7.5 1.50:3 -'-
SO (0.'" ... ..,0
<� �:.l 0 60 0
90 150 210 40 100 160 220 TEMPERATURE (C) TEMPERATURE (C)

53
with no dehydration event or detectable weight loss at up to 160 °C (Table
I I l .2 ; sucrose melts at 188 °C) . These characteristics, and the microscopic
size or appearance of the crystals, were unaffected by 30 days storage at up
to and including 75% RH, indicating the stability of anhydrous crystalline
sucrose under most conditions at 25 °C. At 93% RH for 30 days however,
crystalline sucrose dissolved in its own sorbed moisture (Table I l I . 2 ) to
form syrup (due to its known hygroscopicity and critical relative humidity =
84%; Makower and Dye, 1956; Van Campen et aI . , 1983).
III.c.2.4 MBIrnitol
Derived from seaweeds and by synthesis from other sugars, mannitol
was obtained as anhydrous crystals (without water of crystallization) .
Crystal structures of several polymorphic forms of mannitol have been
reported (Rye and Sorum, 1952 ; Berman et aI . , 1968) . Crystal sizes ranged
from approximately 10 through 260 11m; sieve fractionation of 1 kilogram
provided 16 and 300 g of the coarse and fine sieve fractions respectively. Both
sieve fractions A and B behaved similarly; they were anhydrous and highly
crystalline (Figure IlI .3) . Scanning calorimetry showed that there were no
significant differences between the coarse and fine fractions with respect to
onset and peak melting temperatures and enthalpies (Table 1 1 1 . 7 ) . Thermograms (Figure I lL5 ) showed a sharp melting endotherm only,
between 150 and 175 °C (in agreement with literature reports; Raemy and
Schweizer, 1983) and no dehydration event or detectable weight loss at up to

Table I I I .7 Summary of differential scanning calorimetry (DSe) results for mannitol
Samplea Glass Dehydrationb Recrystalllzationb Melting!> Transitionb
Onset Midpoint Onset Peak l1H Onset Peak l1Hc Onset Peak l1H (Oe) (OC) (OC) (ec) (JIg)
(ec) (ec) (JIg) (ec) (ec) (JIg)
Ao NDd NDd NDd NDd NDd NDd NDd NDd 164.8 166.9 268.5 (0 . 1) (0.4) (22.4)
130 NDd NDd NDd NDd NDd NDd NDd NDd 165 . 1 167 .4 282.6 (0.4) ( 1 . 1) ( 1 1 .5)
Co, C30 a NDd NDd NDd NDd NDd NDd NDd NDd 163.9 166.3 297 .8 (0 .5) (0.4) (53 . 1 )
C30 b NDd NDd NDd NDd NDd NDd NDd NDd 164 . 1 166.3 279.3 (0. 1 ) (0.2) (52.9)
e30 c NDd NDd NDd NDd NDd NDd NDd NDd 164.2 166.3 276.5 (0 .5) (0.2) (25 . 1)
C30 d NDd NDd NDd NDd NDd NDd NDd NDd 164.0 166.6 283.0 (0 .2) (0 .5) (28.3)
C30 e NDd NDd NDd NDd NDd NDd NDd NDd 164.4 166.3 275.4 (0 .2) (0 .3) (43.9)
a A = Coarse fraction, B = Fine fraction and e = Spray dried . Subscripts 0 and 30 refer to before and after 30 days storage at 25 °C, in sealed bottles over P205 (a), 23% RH (b), 52% RH (c), 75% RH (d) and 93% RH (e) .
b Values are mean ± (experimental ranges), n=3 c Negative values are exothermic enthalpies
� d No detectable thermal event

55
2 0 0 °C (Table I IL2) . These characteristics, and the microscopic size or
appearance of the crystals, were unaffected by 30 days storage at and up to
including 93% RH, indicating the stability of anhydrous mannitol at 25 ° C .
Closer examination of X-ray diffraction patterns o f the crystalline fractions
revealed that mannitol was in the � polymorphic form.
III. c . 3 Spray dried sugars, C
The spray drying conditions for each sugar are listed in Table IIL l .
Spray drying particulates small enough for inhalation purposes required a
high collection efficiency, small droplet spray dryer. Many commercial
devices are inappropriate because their droplet dispersions are too large,
thus demanding small nonvolatile concentrations (the alternative means of
producing small particulates ) ; this in turn, reduces efficiency by
demanding long spray drying times. The Yamato ADL-3 1 and the nominal
spray drying conditions for use with these sugars were chosen based on a
systematic experimental review reported previously (Carvajal et aI. , 1994).
Nominal spray drying conditions were held constant and close to optimal
(Carvajal et aI . , 1 994) for all four sugars . Reductions in the nominal inlet
temperature of 150 °C (to 125 DC) were required in the case of sucrose and
trehalose, which formed a crusty mass at 150 °C, instead of the free flowing
material collected with the reduced inlet temperature; the aspirator setting
was also reduced for trehalose, as described in Table III . I. All spray dried
sugars were collected as apparently dry, free flowing powders, at rates � 1
56
g/min, by cyclone separation. Table I I I .3 shows the apparent particle size
distributions of each of the four products in terms of median aerodynamic
diameters and geometric standard deviations , fol lowing replicate
determinations using the Aerosizer® with Aerodisperser™ . Results are
expressed as aerodynamic diameters because of the common association of
this term with the prediction of aerosol deposition in the lung ( Byron,
1990b) . With the exception of sucrose, which formed cohesive agglomerates
[apparent median aerodynamic diameter = 12 .5 Jlm; agglomerates failed to
de aggregate even under high shear conditions (Hindle and Byron, 1995)] ,
product median aerodynamic diameters were approximately 5 Jlm.
Theoretically, spheres with identical diameters should vary in terms of
their aerodynamic diameter if their densities are different (aerodynamic
diameter = equivalent spherical diameter x densityl/2) . Table IIL3 shows
that the median aerodynamic diameters of lactose, trehalose and mannitol
ranked in order of product density, as predicted.
Lactose, sucrose and trehalose were all obtained in the amorphous
form following spray drying, as expected (Matsuda et aI . , 1992; Elamin et
al . , 1995) . None of these products showed birefringence under crossed
polars and all three displayed a typical amorphous "halo" after X-ray
powder diffraction (Figures I I I .2 and IIL3) . Conversely, and contrary to
the conventional wisdom, which presumes that materials which are spray
dried are amorphous, spray dried mannitol was birefringent under crossed
polars and highly crystalline according to XRPD ( Figure III .3) . Spray

drying is usually believed to offer insufficient opportunity for nucleation
and crystal growth because average droplet drying times are short
(approximately 1 1 seconds in the Yamato ADL-3 1 under the operating
conditions shown in Table III. 1 ) .
Attempts were made to quantify the amorphous content of the spray
dried mannitol, C, before and after storage at different relative humidities .
Assuming that the original material purchased from Sigma was effectively
100% crystalline, the decreases seen in peak height following XRPD could
be crystal size and orientation effects (Cullity, 1978); there was no evidence,
on the diffractograms for the spray dried mannitol, of an amorphous
interference pattern (compare A and B to C, for mannitol in Figure IlL3) .
Moreover, the spray dried material showed a statistically identical, storage
and humidity independent, melting endotherm (Figure IlL5, Table III . 7 ) .
No significant difference (by single factor ANOVA) between melting
endotherms of the crystalline starting materials and mannitol type C ,
stored under any study conditions were observed. There were n o shifts from
baseline in the calorimetric thermograms for type C, other than the
melting endotherm (Figure IlL5) , and TGA profiles were also unchanged
by spray drying or storage conditions (Table III .2 ) . Exposure of the spray
dried mannitol to high humidity in a microcalorimeter (VTI, Hialeah, FL)
also failed to induce any observable recrystallization event. Thus, mannitol
type C in these studies was, to all intents and purposes, 100% crystalline .
The amorphous form collected following spray drying of lactose ,

58
trehalose and sucrose was unstable in the solid state at 25 °C, reverting to
the crystalline form (forming sintered and cemented masses) in all cases at
relative humidities .;::. 52%. Type C materials showing an amorphous halo
after XRPD before storage (Figures I 1L2 and I1L3) produced diffraction
patterns which were indistinguishable from the original starting
materials , indicating the return of identical crystal structures , after
storage at RHs � 52% . In the case of lactose, because the a and � isomers
are known to have different crystal structures and diffraction patterns
(Otsuka et aI . , 199 1 ; the beta form has a major peak at 28 = 10° , for
example), there was no evidence of crystalline beta lactose in the XRPD data
for the recrystallized, spray dried product . We estimated, based upon
known mutarotation kinetics for lactose (Pigman and Anet, 1972), and a
solution to dry product time difference of approximately 45 min, that 5 - 7 %
o f the �-isomer was present i n this spray dried lactose. I n samples stored at
52 and 75% RH however, there was evidence of further alpha to beta
mutarotation in the solid state (Figures I 1 I .4 and below), even though
XRPD data failed to show its existence. We must conclude therefore, that
the XRPD similarity between type A or B (pure a-lactose) and the
recrystallized type C (a and �; Figure III . I) indicates that there was either
insufficient of the recrystallized �-form for detection by XRPD , or that the
�-form had not recrystallized (in the presence of a-lactose), or both.

59
N one of the sugars, other than lactose, in this study, show mutarotation
in solution and thus, the spray dried forms, C , of trehalose, sucrose and
mannitol , do not contain mixtures of isomers . As a direct result of this
observation, interpretation of the thermograms for these spray dried sugars
was straightforward and is summarized in Tables I lLS , I I I .6 and I I I . 7 .
The amorphous trehalose and sucrose (Co ,CaOa,b ) showed weight loss
beginning at approximately 3 1 °C. Thus, moisture which was sorbed into
the amorphous powders (Table 111 .2) , following spray drying, was loosely
bound (Zografi, 1988) . During calorimetry, amorphous trehalose showed
increasing energy requirements (climbing baseline) until the sorbed water
was driven off, followed by a glass-to-rubber transition at about 120 °C (Table
IlLS) with no melting endotherm (Figure 111 . 5 ; typical of an amorphous
solid, behaving as a supercooled liquid). There was no recrystallization
when calorimetry was performed in regular DSC pans, unlike the recent
report (French et aI . , 1995), that spray dried trehalose recrystallized at 134
°C during scanning calorimetry in hermetically sealed pans . Water, which
is retained during heating in the hermetically sealed pans, can enhance
m o l e cular mobility ( Z o grafi , 1 9 8 8 ) and this pro b ably enabled
recrystallization under those circumstances . Amorphous sucrose (Table
111 .6) , on the other hand, showed a "glass transition" during the evolution
of sorbed water (approximately 60 °C) , a recrystallization exotherm
(confirmed by hot-stage microscopy), at about 125 °C and a resultant
melting endotherm between 180 and 190 °C. Following moisture induced

00
recrystallization for 30 days at RH � 52%, the thermal behavior of sucrose
and trehalose became typical of the original crystalline materials .
Spray dried lactose thermograms, before and after the solid state
recrystallization events described above (RH � 52%), are complicated by the
presence of an admixture of the a and 13 isomers in the product; the ratio of
the two is frequently variable in spray dried lactose (Lerk, 1993) . Thus, the
results shown in Figure 1II .4 and Table III .4 for lactose type C, may well be
different if the ratio of the isomers in the sample is different. While the
onset of weight loss for amorphous, spray dried lactose (Figure I l I . 2 ,
C O, C30a,b - check) was also 3 1 °C , the results o f calorimetry showed an
initial broad endotherm corresponding to loss of sorbed moisture, a glass
transition (T g) at 1 1 7 °C, an exothermic recrystallization event at 172 °C and
a melting endotherm at 2 16 °C . The value for T g was as expected, and was
typical of those for dry sugars, after the loss of sorbed water (Roos and
Karel, 1991; Hancock and Zografi, 1994, Saleki-Gerhardt and Zografi, 1994).
Following moisture induced recrystallization, enthalpies of dehydration
and melting (Table I I l .4 ) , were lower than the expected values for
crystalline a-lactose monohydrate . This was indicative of variations in the
content of l3-lactose; the progressive decrease in the enthalpy of melting
(Table IlI .4 , type C, with increasing RH to 75%) showing the continuing
mutarotation of lactose in the solid state at moderately high relative
humidities (Otsuka et aI . , 1990) . The sample stored at 93% RH however,

61
showed the increased stability of a-lactose monohydrate , once in the
crystalline form. In this case of very high humidity, recrystallization
occurred very rapidly and before substantive further mutarotation could
occur in the amorphous glass. Thus, in this sample, stored at 93% RH, the
content of j3-lactose was similar to that of the original spray dried product.
Also, in the samples stored at 52% RH and 75% RH (Figure IlI .4) there was
a small endotherm at around 230 °C, the melting point of anhydrous j3-
lactose (Berlin, 197 1).
Spray dried lactose, trehalose and sucrose showed moisture uptake at
all relative humidites with or without changes in their physical form. At
23% RH all three sugars showed increased moisture contents relative to
their initial values (Table IIL2) . However no crystallization was detected in
these samples by DSC (Figures III .4 and IlLS) and XRPD (Figures I lL2
and I I I . 3 ) in the time frame of exposure, i .e . after 30 days. Although the
XRPD pattern for spray dried sucrose stored at 23% RH showed an
amorphous halo (Figure I I I . 3 ) , similar to the one obtained prior to
exposure, it did not show a clear T g or a recrystallization exotherm on DSC
(Figure I lLS) . This may be because, the increased moisture content
accelerated the crystallization process during heating in the DSC .
Moreover, amorphous spray dried sucrose has been shown to remain in the
amorphous form at this RH, within the time frame employed in this study
(Makower and Dye, 1956).

62
III .d SUMMARY AND CONCLUSIONS
This work was initiated to dovetail with other investigations of
crystalline drug carriers (with different interparticulate bonding strengths
and/or electrostatic behavior; Hindle et aI . , 1994) and aerosolizable spray
drying excipients with the capacity to protect some proteins against
denaturation (Naini et aI . , 1993) . At present, lactose is the only acceptable
carrier for dry powder inhalation systems in the United States. However,
all sugars obtained as crystalline sieve fractions in this investigation
appeared to be suitable for admixture with micronized drugs and
presentation in powder inhalers, at least at an investigational level . Only
crystalline sucrose, which dissolved in its own sorbed moisture at 93% RH,
appeared to require extraordinary packaging precautions, in order to
protect against moisture induced formulation changes in high humidity
environments . There was no evidence of mutarotation of alpha lactose
monohydrate, at any of the storage humidities (water contents and
calorimetry were unchanged), showing the rigidity and stability of its
crystal structure at 25 °C (mutarotation in the solid state requires
molecular mobility). It remains to be seen whether all of these sugars will
also afford the apparent short-term moisture protection (Hindle et aI . , 1994),
seen with aerosolization of albuterol sulfate in the presence of lactose at
high humidites. That drug formed cohesive agglomerates over a < 3 minute
time frame, when aerosolized in the absence of a lactose diluent (Jashnani
et aI . , 1995) . These examples are cited to illustrate the importance of an

improved menu of substances for use in powder inhalers . It is likely that
alternate crystalline sugars can be used to advantage in powder inhalers,
when a given drug blend with lactose has been shown to perform poorly
(Phillips et aI . , 1994).
Spray dried sugars stored at high humidities showed predictable
recrystallization changes over time with the exception of mannitol .
Mannitol defied conventional wisdom and crystallized during the brief ( 1 1
sec) spray drying period, prior to collection and storage . While its behavior
with co-spray dried solutes was not studied here, its capacity to form stable,
humidity independent crystallites , during spray drying, was surprising
and unique among this array of sugars. Mannitol is a non-reducing sugar
and, as we have discussed above, our efforts to show the presence of even
small amounts of amorphous content in the spray dried bulk were
unsuccessful . Mannitol should certainly be studied further for its capacity
to afford molecular protection to proteins during drying and storage;
development of crystalline formulations for powder inhalers may be easier
than their amorphous counterparts , both from a p ackaging and
aerosolization point of view.
Spray dried formulations, which are respirable (Table IlL3) are likely
to have to deal with at least some amorphous content which will require
protection against humidity induced changes . Spray dried sucrose was
intensely hygroscopic and difficult to de aggregate even under dry
conditions . Trehalose and lactose, formed sintered masses over 30 days at

64
humidities > 23%. Although the kinetics of solid state recrystallization were
not studied here , these changes can be rapid and must not be allowed to
occur in powder inhaler formulations . Thus, both powder packaging and
the water content of the inlet air to the inhaler should be controlled for such
products . Provided this can be achieved, and thus powder deaggregation
made to occur reproducibly, the choice of a particular sugar as an excipient
may well depend upon its stabilizing capacity (against protein denaturation
and chemical degradation) . Lactose, as described above, is a potentially
reactive reducing sugar, which may preclude its use with certain proteins .
It has the further disadvantage that spray dried products are bound to be
mixtures of both the a and 13 isomers . The ratio can only be considered
constant if the solution from which spray drying has occurred has either
stood for 6 - 7 mutarotation half lives (about 17 hours at 20 °C) or, if the
spray drying conditions are very carefully controlled and the product is kept
dry (to prevent further mutarotation). If sucrose and lactose are rejected for
the above reasons, mannitol may be unsuitable (for protection against
protein denaturation) because a sugar's protein stabilizing capacity is
believed to require its presence as an amorphous glass (with its glass
transition temperature, in the presence of any sorbed moisture, above that
of the storage temperature) . Trehalose, with a high glass transition
temperature in its dry state , and a tendency to retain relatively large
amounts of moisture without recrystallizing, may have excellent stabilizing
properties in this regard (Green and Angell, 1989).

IV. CHARACTERIZATION AND OPTIMIZATION OF SPRAY DRYING
AND ELECTROSTATIC PRECIPITATION APPARATUS FOR
COLLECTION OF INHALABLE MICROPARTICLES
IV. a INTRODUCTION
Spraying of aqueous solutions of drug followed by droplet drying has
been used as an alternative to jet milling to produce particles for inhalation
in the laboratory (Chawla et aI . , 1994; Vidgren et aI . , 198 7 ) . Such a
technique can also be used for producing fine particles of proteins and
peptides for potential administration through the lung (Broadhead et aI . ,
1994). However, i n the developmental stage, large amounts o f expensive
protein are required for solution formulation and drying optimization
(Fo ster and Leatherman, 1995 ) . In addition, until recently, most
commercially available laboratory spray dryers had low spraying and
collection efficiencies for small particles « 5 11m). Thus, in order to review
protein activity following spray drying and to study the affect of various
sugars on protein stability during drying (Chapter V), an apparatus
capable of collecting fine particles, following spraying of low concentration
aqueous solutions was necessary.
Commercially available nebulizers like the small particle aerosol
generator (SPAG, lCN Pharmaceuticals) are capable of atomizing low

solids concentration aqueous solutions into fine droplets (Byron et a1 . , 1988 ;
May, 1973) . Such droplets could be dried by supplying further warm air to
the droplets prior to particle collection. Fine particles suspended in the air
stream could then be charged and separated inside an electrostatic
precipitator, which, at least in theory is capable of collecting fine particles
to a high degree of efficiency (Hinds, 1982; Oglesby and Nichols, 1978) .
A particle collection apparatus, assembled using the principles
outlined above was initially characterized with respect to electrostatic
precipitator voltage and starting solute concentration. In addition the
collection efficiency was evaluated as a function of volumetric air flow and
temperature of drying air. This chapter describes these experiments as a
precursor to the work described in Chapter V and also attempts
comparisons between experimental and theoretical collection efficiencies
calculated using known precipitator geometry and particle charging
theory.
IV.h MATERIALS AND METHODS
IV.h. l MATERIALS
Lactose NF (Paddock Laboratories, Minneapolis, MN) and disodium
fluorescein (Fisher Scientific Company, Raleigh, NC ) were used as
received. All other chemicals used were of reagent grade quality and were
purchased from Fisher Scientific Company (Raleigh, NC) . Water used was
deionized by reverse osmosis .
IV.h.2 ME'IHODS
IV.h.2.I Particle collection apparatus
The particle collection apparatus, incorporating a small particle
aerosol generator CSPAG, ICN Pharmaceuticals, Costa Mesa, CA) and an
in-house built wire-in-tube electrostatic precipitator, is shown in Figure
IV. I . The exploded views of different parts of the apparatus with exact
dimensions are shown in Figures IV.2 and IV.3 . Aqueous solutions were
placed inside the reservoir of the nebulizer CA, Figure IV. I ) and atomized
by supplying compressed air. The inlet pressure on the nebulizer was kept
constant at 26 psig CSPAG Instructions Manual, ICN Pharmaceuticals ,
Costa Mesa, CA, 1989) . Nebulizer air flow CNA, Figure IV. I ) was adjusted
to 7 liters/min and the drying air flow CDA, Figure IV. I ) was held at 10
liters/min. Aerosols exiting the primary drying chamber CB, Figure IV. I )
were introduced into a secondary drying chamber C C , Figures IV. I and
IV.2) . Additional drying air was supplied to a cylindrical chamber C, by
means of a hot air gun CD, Figure IV. 1) . In some experiments the air flow
and temperature of the hot air gun, D, were independently controlled by
means of two variable autotransformers CE & F, Figure IV. I ) and
temperature of drying air inside the chamber C was measured by a
thermometer CH, Figure IV. I) . Air flows through the complete apparatus

High Voltage I
J
To fume hood -+---II
kV I� 0 0 01:1 0 0
. 0 .
SPAG - 2
! Compressed Air Supply
Figure IV. l Schematic diagram of the particle collection apparatus.
KEY A - NebulizerReservoir B - SPAG Drying chamber C - Secondary drying
chamber D - Hot air gun E - Rheostat controlling
air flow F - Rheostat controlling
temperature G - High voltage supply H - Thermometer I - Electrostatic
precipitation column J - Central wire conductor K - Exhaust tubing L - Glass l ining NA-Nebulizer air flow DA-Drying air flow
83
Inhalation tubing length: 265 mm ID: 2 1 mm
52 mm Inhalation tubing length: 130 mm ID: 2 1 mm
t
�
I I --+-.. ·Thermometer
f.-90 mm
Figure IV.2 Exploded view of the secondary drying chamber C , with dimensions . The inhalation tubes shown in this figure were considered as part of the drying chamber for particle recovery purposes.

K: Exhaust Tubing Length: 1067 mm ID: 21 mm
.... o(lf---....:;; .•. d = 22
�J: Central Conductor Length: 908 mm Diameter: 2 .4 mm
70
---.. � I: Precipitation Column Length: 762 mm ID: 57 mm Wall thickness : 3 mm
·,:·I-.J-----1_ L: Glass Lining Length: 762 mm ID: 49 mm Wall thickness : 3 mm
.... _lIiiii .... --__ � Teflon screw cap
Figure IV. 3 Exploded view of the electrostatic precipitation column shown with the central wire conductor, glass lining and exhaust tube with dimensions.
71
were mea sured using a mi cromanometer connecte d t o a
pneumotachograph head placed at the end of the exhaust tubing (K, Figure
IV. 1 ) , in sham experiments (in the absence of nebulized solutions) at
different settings of the autotransformer controlling air flow of the heat gun
(A detailed description of calibration of the pneumotachograph with air
flow measurement can be found in Appendix All ) . Particles were then
collected in a wire-in-tube type electrostatic precipitator column (I, Figures
IV. 1 and IV.3) . High voltages in the range of 0 - 20 kV (negative polarity)
were applied to the central wire conductor (J, Figures IV. 1 and IV.3 ) by
means of a high voltage generator (G, Figure IV. 1 ; Model #280 7R,
Brandenburg/Astec, Alpha I I Series , Stourbridge, UK) . Aerosols were
generated and collected inside the column (I, Figures IV. 1 and IV.3 ) for
lengths of time in the range of 10 min to 30 min, dictated by experimental
requirements . At the end of each experiment the apparatus was
dismantled and the column (I , Figure IV. 1 ) , exhaust tubing (K, Figures
IV. 1 and IV.3) , secondary drying chamber (C, Figures IV. 1 and IV.2 ) and
the primary drying chamber (B, Figure IV. 1 ) washed with sufficient
volume of 0 . 1 N NaOH solution, and fluorescein was spectrophotometric ally
detected at 490 nm (Varian DMS 100S UV-VIS Spectrophotometer, Varian
Associates, Walnut Creek, CA) . Total solids deposition per minute at each
of these sites was estimated following fluorescein determination from the
mass ratio of fluorescein to lactose in the initial solution ( 1 : 19) .
At the beginning of each run total output from the nebulizer

72
(operating at NA and DA of 7 liters/min and 10 liters/min respectively) was
isokinetically collected (vacuum flow rate = aerosol supply rate) on an
absolute glass fiber filter (Gelman Sciences , Ann Arbor, Ml) through
which air was drawn, in order to determine the mass output of fluorescein
and lactose per minute of nebulization. Deposition at each of the above
described sites was calculated as a percentage of the total solids output from
the nebulizer. Particles failing to deposit at any of the four sites were
estimated as "Losses" .
IV.b.2.2 Effect of electrostatic precipitator (EP) voltage, nebulized
solution concentration and hot air gun voltage on collection efficiency
In these experiments, particles were collected inside the column (I ,
Figure IV. 1 ) without the glass collection surface. Also, in preliminary
characterization experiments, temperature and volumetric air flow of
drying air being supplied to drying chamber C (Figure IV. l ) were not
independently varied. Only a single autotransformer was used to control
the hot air gun (D, Figure IV. l ) and voltages supplied to the fan and
heating coils were identical. Collection characteristics of the apparatus
were quantified using aqueous solutions of lactose and fluorescein ( 19 : 1
weight ratio) . A range of solution concentrations between 10 - 7 5 mg/ml of
total solids ( 1 - 7.5% w/v) and hot air gun voltages settings between 0 - 60 V
(by adjusting the autotransformer) were tested. Solutions ( 100 ml volume at
time zero in reservoir A, Figure IV. l ) were nebulized for different lengths
73
of time, collected in different regions of the apparatus and quantified as
described above.
IV.h.2.3
efficiency
Effect of drying air flow and temperature on particle collection
In these experiments a glass collection surface (L, Figure IV. 1 ) was
introduced inside the precipitator column (I, Figure IV. 1 ) identical to that
which was to be employed in protein drying experiments (Chapter V). This
facilitated washing and recovery of particles with low volumes of solvent,
prior to analysis . This was important when the apparatus was used for
protein particle collection following nebulization of low concentration
solutions (Chapter V). Also, drying air supplied to chamber C (Figure IV. 1 )
was independently controlled for temperature and volumetric air flow, in order to assess the effect both of these variables on particle collection
efficiency.
Aqueous solutions of disodium fluorescein and lactose were used
with a total concentration of 10 mg/ml ( 1% w/v) in a weight ratio of 1 : 19 .
Fifty milliliters (50 mI) solutions were nebulized, dried and electrostatically
collected for 15 min. At the end of 15 min the apparatus was dismantled
and different parts of the apparatus, including the glass collection surface
(L, Figure IV. 1 ) were washed with 0 . 1 N NaOH, prior to spectrophotometric
detection of fluorescein at 490 nm. Total solids were calculated from the
weight ratio of fluorescein and lactose in the initial solution ( 1 : 19) as before.
74
Two targeted air temperatures of 30 °C and 40 °C as measured by a
thermometer (H, Figure IV. l ) in chamber C (Figure IV. l ) were used.
Volumetric air flows of 29. 1 liters/min and 50 .6 liters/min, calculated as
described above and in Appendix All were studied. At the beginning of
each experimental run, total solids output per minute from the nebulizer
was calculated by isokinetically collecting the output on an absolute glass
fiber filter for 10 min. Particle recovery in each of the components of the
apparatus per unit time was expressed as a percentage of the total rate of
solids output.
IV.h.2.4 Photomicrography and scanning electron microscopy of
electrostatically precipitated particles
Aqueous lactose solutions in concentrations of 10 mg/ml, 50 mg/ml
and 75 mg/ml were nebulized, dried (hot air gun voltage of 60 V) and
electrostatically collected at 20 kV onto glass slides placed inside the
precipitator column (1, Figure IV. l) for 15 min. These slides were then
photographed (Nikon N2000 camera, Tokyo, Japan) under a microscope
(Nikon Optiphot, Tokyo, Japan) using a x40 magnification objective in order
to assess their appearance.
In separate experiments a 1% w/v solution of fluorescein and lactose
(mass ratio of 1: 19) was nebulized and dried at different temperatures (as
recorded in chamber C, Figure IV. l ) . Three different temperatures were
studied: 29 °C, 41 °C and 63 °C. Scanning electron microscope (SEM) stubs

75
were introduced inside the precipitator column ( 1 , Figure IV. l ) and
particles were electrostatically collected at each of the drying temperatures
and an air flow of 29 liters/min and an applied EP voltage of 20 kV. At the
end of 15 min collection the stubs were removed, sputter coated with gold
palladium followed by scanning electron microscopy.
IV.h.2.5 Theoretical particle collection efficiencies during electrostatic
precipitation
Theoretical collection efficiencies inside the precipitator column were
calculated using particle charging theory and known precipitator
geometry. Efficiencies were calculated using the Deustch-Anderson
equation (Hinds, 1982; Oglesby and Nichols, 1978):
E' = 1 - e(·vTE • AlQ) . . . . . . . . . . . . . . . . . . . . . . . . . . Equation IV. l
where E' = Collection efficiency
VTE = Terminal electrostatic velocity
A = Collection surface area
and Q = Volumetric air flow rate
The terminal electrostatic velocity, VTE is given by (Hinds, 1982):
VTE = neE/(31t�d) . . . . . . . . . . . . . . . . . . . . . . . . . . Equation IV.2
where E = Electric field strength
n = Number of charges on a particle
� = Viscosity of air

e = Charge on an electron
and d = Diameter of the particle
76
Electric field strength for a wire-in-tube type electrostatic precipitator can
be calculated from (Hinds, 1982):
Equation IV.3
where II W = Difference in voltage between wire and tube
rt = Radius of tube
rw = Radius of wire
Collection efficiencies were calculated assuming particle Reynold 's
numbers > 1, indicating turbulent air flow (Hinds, 1982) , and an assumed
uniform particle size distribution of 1 �m for the SPAG generator (Byron et
aI . , 1988) and also when dried at 40 °C as seen from the SEM. A description
of field charging theory used to calculate number of charges (n) on the
particles with a sample efficiency calculation is given in Appendix AI .
IV.c RESULTS AND DISCUSSION
IV.c. 1 Spray drying and electrostatic precipitation
The "Small Particle Aerosol Generator" or SP AG is a modified three
jet Collison nebulizer (SPAG Instructions Manual, ICN Pharmaceuticals,
Costa Mesa, CA, 1989 ; Appendix AIX) .The SPAG was driven by compressed gas, which passed through an external pressure compensated
77
flowmeter (NA, Figure IV. l ) before entering the nebulizer. This facilitated
a reliable reading when the NA flowmeter was operated at 7 liters/min, but
has been reported to be less accurate when operated at lower air flows
(Byron et a! . , 1988). The DA (Figure IV. l ) flow meter on the other hand has
been shown to give reliable readings at all flow rates (Byron et a! . , 1988) .
Due to expansion of the high pressure air jets inside the nozzle, there is a
reduction of static pressure which causes the solution to be drawn up the
three nebulizer tubes (Venturi effect) . This is then broken up by the air jet
into a dispersion of droplets (May, 1973) . In SPAG a majority of these
droplets impact on the walls of the nebulizer reservoir which are then
recirculated. This enables only fine droplets to escape the reservoir.
To facilitate drying of droplets in the primary drying chamber (B,
Figure IV. l) a maximum drying air flow (DA, Figure IV. l ) of 10 liters/min
was used. The incoming compressed air was kept at 26 psig by means of the
SPAG pressure regulator as recommended by the manufacturer. An
external compressed gas source of 50 psig was used throughout.
Electrostatic precipitation has been traditionally used in industrial
air pollution control of particulate emissions (White, 1963 and Robinson ,
1 9 7 3 ) . The process is based on the principle of charging particles in a
corona discharge generated under high electric field strengths. In a wire
in-tube type electrostatic precipitator (used in this study), when high
voltages are applied to the central wire conductor, a highly non-uniform
electric field develops close to the wire (Oglesby and Nichols, 1978) . This

78
field accelerates the electrons in the surrounding gas to high velocities,
causing ionization of the gas in the region around the wire . This
phenomenon is called a corona discharge. The ions thus generated migrate
towards the outer passive electrode (column inner surface maintained at
ground potential in this case) . If a gas laden with particles is introduced
inside the precipitator column, the ions get attached to the particles ,
imparting an electric charge . This charge acquisition by the particles
allows them to migrate towards the column inner surface where they are
deposited. Deposition efficiency depends on several factors like number of
charges acquired by the particles, electric field strength, volumetric air
flow through the system, particle size distribution, electrical conductivity or
resistivity of the particles and particle re-entrainment in the air stream
(Oglesby and Nichols, 1978; and Hinds 1982) . The deposited particles are
held on to the surface by a combination of electrical and molecular forces
(Oglesby and Nichols, 1978).
IV.c. I. I Effect of electrostatic precipitator (EP) voltage, nebulized
solution concentration and hot air gun voltage on collection efficiency
These preliminary experiments were performed to characterize
particle deposition with respect to E P voltage, nebulized s olution
concentration and hot air gun voltage (fan supply voltage = heating coil

Table IV. 1 Percentage collection efficienciesa in the particle collection apparatus as a function of electrostatic precipitator (EP) voltageb,c,d
EP Volta�e (kV) Exi t Tube-K e Dr�er-Ce Dr�er-Be Column-Ie Losses
0.0 1.9 (0.9) 1 . 1 (0.3) 1 .8 (0.6) 0 .8 (0 . 1) 94.4 (0.9)
7.7 3.0 ( 1 .7) 1 .8 (0.8) 2.3 (0.3) 28.7 (6.9) 64.3 (5.2)
10.0 2.9 ( 1 .6) 2.4 (1 .5) 2 .4 (0.7) 24.5 (6.9) 67.8 (10.3)
17.8 3.0 (1 .4) 2.4 (1.5) 2 .5 (0.7) 39.9 (14.6) 52.2 (13.1)
20.0 0.8 (0.3)f 1 .5 (O.4)f 2 .7 (1 .0)f 63.5 ( 14.8)f 31 .5 ( 14.0)f
a Collection efficiencies are expressed as percentages of total solids output rate from the nebulizer, estimated by isokinetic collection on an absolute glass fiber filter.
b In these experiments air flow and temperature of the hot air gun (D, Figure IV. 1 ) were not controlled independently. Also no glass collection lining (L, Figure IV. 1 ) was used inside the column (I, Figure IV. 1 ) . Hot air gun voltage (as in text) and nebulized solution concentration were kept constant at 60 V and 10 mg/ml respectively.
d Values are mean (sample SD), n=3 . The letters K, C, B and I correspond to different components in Figure IV. 1 . Values are mean (sample SD), n=6 .
(ll
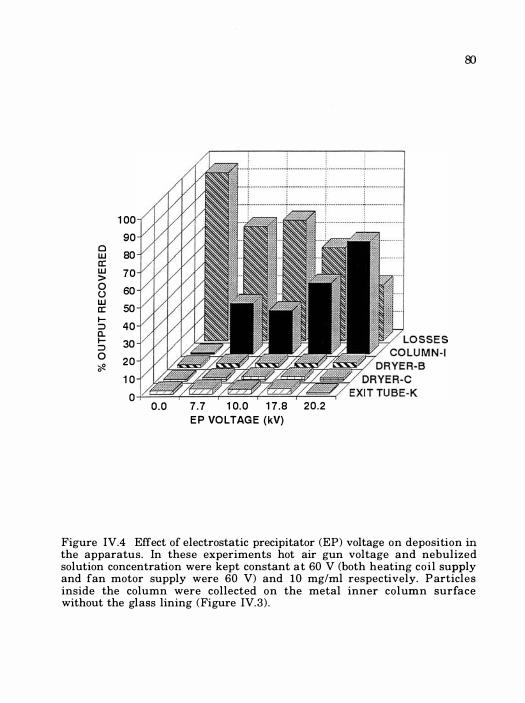
1 00 90
0 80 w a: w 70 > 0 60 () w 50 a: I-::::> 40 c.. I- 30 ::::> 0 20 �
1 0 0
0 .0 7 . 7 1 0. 0 1 7 .8 20 .2 E P VO LTAG E (kV)
Figure IV.4 Effect of electrostatic precipitator (EP) voltage on deposition in the apparatus. In these experiments hot air gun voltage and nebulized solution concentration were kept constant at 60 V (both heating coil supply and fan motor supply were 60 V) and 10 mg/ml respectively. P articles inside the column were collected on the metal inner column surface without the glass lining (Figure IV.3) .

81
voltage = hot air gun voltage) . Particle collection efficiencies [calculated as
percentage of the total solids output from the nebulizer (A, Figure IV. l )] as
a function of EP voltage are given in Table IV. ! . The mean percentage
collection efficiencies are also plotted in Figure IV.4 . These experiments
were performed with a fixed solution concentration of 10 mg/ml and a hot
air gun voltage setting of 60 V. As can be seen from Figure IV.4 , particle
collection in the exit tube-K, dryer-C and dryer-B was minimal . Particles
were either collected inside the precipitator column (I , Figure IV. l ) or lost
to the exhaust ("Losses") . Percentage of the total output recovered inside the
column-I increased with increasing EP voltage, although only a 64%
maximum recovery was possible at 20 kV (Table IV. l ) , the maximum
voltage which could be maintained with this voltage generator.
Percentage collection efficiencies as a function of nebulized solution
concentration are given in Table IV.2 and the mean values are plotted in
Figure IV.S . These experiments were performed at a constant EP voltage of
20 kV and hot air gun voltage setting of 60 V. Once again percentage of
output recovered in the exit tube-K, dryer-C and dryer-B was minimal .
Although the total mass of particles depositing in the column increased
with increasing solution concentration, the percentage of each solution's
total solids output which was collected in the column, decreased with
increasing solution concentration. This may be due to increased particle
build up on walls of the column, at higher solids concentration, which
causes less efficient charging and deposition of subsequent particles

Table IV.2 Percentage collection efficienciesa in the particle collection apparatus as a function of nebulized solution concentrationb,c,d
Concentration (ms:iml) Exit Tube-Ke Drler-Ce Drler-Be Column-I e Losses
10.0 0.8 (0.3)f 1 .5 (O.4)f 2.7 ( 1 .0)f 63.5 (14.8)f 3 1.5 ( 14.0)e
25.0 1 . 1 (0 . 1) 1 .3 (0. 1) 4 .6 (0.7) 37.7 (2.4) 55.3 (2.6)
50.0 2.2 (0.5) 2.7 (0. 1) 4 .9 ( 1 .2) 32.2 (6.7) 57.9 (7 .6)
75.0 2.9 (0.4) 3.8 (0 .9) 3 .9 (0.9) 25.8 (1 1.4) 63.6 (9.3)
a Collection efficiencies are expressed as percentages of total solids output rate from the nebulizer, estimated by isokinetic collection on an absolute glass fiber filter.
b In these experiments air flow and temperature of the hot air gun (D, Figure IV. 1 ) were not controlled independently. Also glass collection lining (L, Figure IV. 1 ) was not used inside the column (I , Figure IV. 1 ) .
c Hot air gun voltage and EP voltage were kept constant at 60 V and 20 kV respectively. d Values are mean (sample SD), n=3 . e The letters K, C, B and I correspond to different components in Figure IV. 1 .
Values are mean (sample SD), n=6 .
R5

83
7 0
0 60 w II: W 50 > 0 u 40 w II: I- 30 � a. I- 2 0 � 0 � 1 0
0 1 0 25 50 75
SOLUTI O N CO NCE NTRATI O N (mg/ml )
Figure IV. 5 Effect of nebulized solution concentration on deposition in the apparatus. In these experiments hot air gun voltage and EP voltage were kept constant at 60 V (both heating coil supply and fan motor supply were 60 V) and 20 kV respectively. Particles inside the column were collected on the metal inner column surface surface without the glass lining (Figure IV.3 ) .

84
(White , 195 1) . Reduced collection efficiency could also be due to increased
particle re-entrainment in the air stream with the larger overall amounts
being deposited per minute with higher solution concentrations in the
nebulizer (White, 1963).
Table IV.3 and Figure IV. 6 show deposition patterns in the
apparatus for different voltage settings on the autotransformer controlling
the hot air gun. These experiments were performed at an EP voltage of 20
kV and a solution concentration of 10 mg/ml ( 1% w/v). Voltage settings of 0 -
60 V did not affect the fractional deposition in the column (ranged between
59 - 64%). However when the hot air gun voltage setting was increased to 90
V almost 88% of the output was recovered in the column. This may be a
result of faster water evaporation from the nebulized droplets producing
particles which because of their smaller size exhibit higher capture
efficiencies and larger electrophoretic mobility. However in these
experiments the combined effects of air flow and drying air temperature
could not be distinguished.
Photomicrographs of particles recovered inside the column following
nebulization and drying are shown in Figure IV.7 . Particles appeared dry,
discrete and relatively monodisperse with respect to size in all cases .
Although drying of higher solids concentrations produced larger particles,
the majority of the particles observed under the microscope were < 5 /lm for
all three solutions ( 10 mg/ml, 50 mg/ml and 75 mg/ml) .

Table IV.3 Percentage collection efficienciesa in the particle collection apparatus as a function of heat gun voltageb•c.d
Hot Air Gun Exit Tube-Ke Dryer-Ce Dryer-Be Column-I e Losses Volta�e (V)
0 0.8 (0.2) 1 .6 (0.5) 3 .3 (0 .5) 62.8 ( 15 .8) 3 1 .5 ( 15 .3)
:J) 0.5 (0 . 1) 1 .0 (0.2) 3 .3 (0.2) 58.8 ( 1 .3) 36.4 ( 1 .2)
ill 0.8 (0.3)f 1 .5 (O.4)f 2.7 ( 1 .0)f 63.5 ( 14.8)f 31 .5 ( 14.0)f
00 0.2 (0.0) 1 .5 (0.2) 3.7 (0.8) 87 .8 (5 .3) 6.9 (4.8)
a Collection efficiencies are expressed as percentages of total solids output rate from the nebulizer, estimated by isokinetic collection on an absolute glass fiber filter.
b In these experiments air flow and temperature of the heat gun (D, Figure IV. 1) were not controlled independently. Also glass collection lining (L, Figure IV. 1) was not used inside the column ( I , Figure IV. 1 ) .
c Nebulized solution concentration and EP voltage were kept constant at 10 mg/ml and 20 kV respectively. d Values are mean (sample SD), n=3 . e The letters K, C , B and I correspond to different components in Figure IV. 1 .
Values are mean (sample SD), n=6.
81

86
90 80 0 w 70 a: w > 60 0 () 50 w a:
I- 40 :::> a. 30 I-:::> 0 20 �
1 0 0
0 30 60 90 HOT AI R GUN VO LTAG E (V)
Figure IV.6 Effect of hot air gun voltage (heating coil supply and fan motor supply) on deposition in the apparatus . In these experiments nebulized solution concentration and EP voltage were kept constant at 10 mg/ml and 20 kV respectively. Particles inside the column were collected on the metal inner column surface without the glass lining (Figure IV.3) .

Figure IV.7 Photomicrographs of lactose particles collected from the electrostatic precipitator. The nebulized solution concentration was (a) 10 mg/ml (b) 50 mg/ml and (c) 75 mg/ml without the glass lining and collected at an EP voltage of 20 kV and hot air gun voltage of 60 V. All photomicrographs were taken at the same magnification (x40). The distance between the scale marks is 10 �. £S

88
IV.c. 1.2 Effect of drying air flow and temperature on particle collection
efficiency
In order to better characterize the electrostatic collection process,
drying air temperature and flow rate were independently varied. This was
achieved by modifying the circuitry of the hot air gun and by attaching it to
two autotransformers (D and E , Figure IV. l ) . Particle deposition was
studied at two air flow rates of 29. 1 ± 0 .8 liters/min and 50.6 ± 1.5 liters/min
and two mean temperatures for the mixed air and aerosol leaving dryer-C
(Figure IV. l ) . Air flow measurements were made by operating the
apparatus under solution free conditions and are described in Appendix W.
Summary of the percentage collection efficiencies obtained under different
air flow and temperature conditions are given in Tables IV.4 - IV. 7 and
Figure IV.8 - IV. l 1 . Percentage of the output deposited in the column
increased with increasing precipitator potential (EP voltage) at all flow
rates and temperatures employed. However particle deposition in the
column was dependent on the total air flow rate. Increased deposition was
observed at the lower air flow rate of 29. 1 liters/min compared to 50 .6
liters/min at both the drying temperatures (Figures IV.8 - IV. 1 1 ) . This
implied that the collection efficiency was a simple function of the particle
residence time inside the column. Although temperature is known to affect
the collection efficiency by altering the corona generating voltage and
particle size of the collected particles, no differences were noted in the
deposition in the column for different drying temperatures under
Table IV.4 Summary of particle collection efficiencies a at a drying temperature of 28 .4 °C ( l . 8 )b and volumetric air flow of 29. 1 liters/min (0.8)c as a function of electrostatic precipitator voltage
EP Voltage (kV) Exit Tube-Kd Dryer-Cd Dryer-Bd
5
10
15
aJ
1.6 (0.7)
0.9 (0.2)
1.0 (0.2)
0.6 (0.0)
2.4 (0.3)
2 .3 (0.3)
2 .9 (0.5)
2 .7 (0.2)
3.7 (1 .6)
4.9 (1 .8)
5.4 (2 .1)
7.4 (1 .6)
Column-Id Losses
20.3 (1 .3)
29.9 (1 .7)
41 .6 (2.5)
45.3 (3 . 1)
72. 1 (0.6)
61.9 (3 .1)
49. 1 (1 .4)
44.0 (3.7)
a Collection efficiencies are expressed as percentages of total solids output rate from the nebulizer, estimated by isokinetic collection on an absolute glass fiber filter.Values are mean (sample SD), n=3 .
b Rheostat F (Figure IV. 1) controlling temperature of hot air gun was set between 30 - 32 V and temperatures recorded in dryer C (Figure IV. 1). Value is mean (sample SD), n= 12.
c Rheostat E (Figure IV. 1 ) controlling air flow to hot air gun was set at 8 V (Appendix AIl) . Value is mean (sample SD), n=3
d The letters K, C, B and I correspond to different components in Figure IV. 1 .
ffi

80
0 70 w a: w 60 > 0 50 (J w 40 a: I-:::> 30 0.. I-:::> 20 0 � 1 0
5 1 0 1 5 E P VO L TAG E(kV)
20
LO S S E S
C O L U M N - I
DRYE R-B
DRYER-C
EXIT TUBE-K
Figure IV.8 Deposition in the apparatus following spray drying and electrostatic collection of 10 mg/ml solution at 28 ± 2 °C (rheostat F , kept between 30 - 32 V and temperatures were measured in dryer C, Figure IV. 1 ) and a volumetric air flow of 29 . 1 ± 0.8 liters/min (rheostat E, Figure IV. 1 , kept at 8 V, Appendix All) . In these experiments the particles were collected on glass lining (L, Figure IV.3) .

Table IV.5 Summary of particle collection efficiencies a at a drying temperature of 4 1 . 0 °C (0 .7 )b and volumetric air flow of 29. 1 liters/min (O .8)e as a function of electrostatic precipitator (EP) voltage
EP Voltage (kV) Exit Tube-Kd Dryer-Cd Dryer-Bd
5
10
15
m
0.7 (0.4)
1 .0 (0.2)
1 .2 (0.3)
0.8 (0 . 1)
1 .8 (0 .8)
2.2 (0.5)
2 .3 (0.9)
3 .0 (0.6)
4.0 (3.0)
8.4 ( 1 .6)
4 .7 (2.3)
6.2 ( 1 .5)
Column-Id Losses
18.9 (0.5)
30.6 ( 1 .0)
41 .8 (1 .8)
45.2 (3.8)
74.6 (3.3)
57.8 ( 1 .6)
50.0 ( 1 .5)
44.8 (3.0)
a Collection efficiencies are expressed as percentages of total solids output rate from the nebulizer, estimated by isokinetic collection on an absolute glass fiber filter. Values are mean (sample SD), n=3 .
b Rheostat F (Figure IV. 1) controlling temperature of hot air gun was set between 50 - 58 V and temperatures recorded in dryer C (Figure IV. 1) . Value is mean (sample SD), n= 12 .
e Rheostat E (Figure IV 1 ) controlling air flow to hot air gun was set at 8 V (Appendix AIl) . Value is mean (sample SD), n=3
d The letters K, C, B and I correspond to different components in Figure IV. 1 .
s
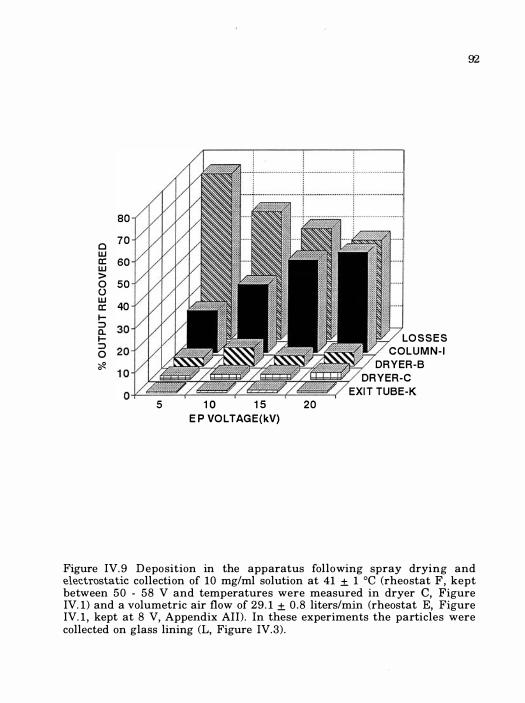
80
0 7 0 w II: w 60 > 0 50 () w 40 II: I-::l a. I-::l 0 �
5 1 0 1 5 E P VO LTAG E(kV)
20
LO S S E S
C O L U M N- I
DRYER-B
DRYER-C
EXI T TUBE-K
92
Figure IV. 9 D eposition in the apparatus following spray drying and electrostatic collection of 10 mg/ml solution at 41 ± 1 °C (rheostat F, kept between 50 - 58 V and temperatures were measured in dryer C, Figure IV. l) and a volumetric air flow of 29 . 1 ± 0 .8 liters/min (rheostat E, Figure IV. l , kept at 8 V, Appendix All) . In these experiments the particles were collected on glass lining (L, Figure IV.3) .

Table IV.6 Summary of particle collection efficiencies . at a drying temperature of 26 .8 °C (0 . 7 )b and volumetric air flow of 50.6 liters/min ( 1 . 5 )c as a function of electrostatic precipitator (EP) voltage
EP Voltage (kV) Exit Tube-Kd Dryer-Cd Dryer-Bd
5
10
15
3)
0.9 (0.7)
1.0 (0.3)
1.1 (0.3)
0 .8 (0 . 1)
2 . 7 ( 1 . 1)
2.9 (0.8)
2.3 (0 .7)
3 .1 (0.9)
5 .3 (2 .3)
5 .1 (0.3)
2 .8 (0.6)
4.2 (3 .1 )
Column-Id Losses
15 . 1 (2.2)
26.2 (0.9)
36.9 ( 1 .4)
36.6 (1 .5)
76. 1 (2.4)
64.8 (1 .8)
57.0 (0.9)
55.3 (2.7)
a Collection efficiencies are expressed as percentages of total solids output rate from the nebulizer, estimated by isokinetic collection on an absolute glass fiber filter. Values are mean (sample SD), n=3 .
b Rheostat F (Figure IV. 1) controlling temperature of hot air gun was set between 30 - 3 2 V and temperatures recorded in dryer C (Figure IV. 1) . Value is mean (sample SD), n=12 .
c Rheostat E (Figure IV. 1) controlling air flow to hot air gun was set at 12 V (Appendix AIl) . Value is mean (sample SD), n=3
d The letters K, C , B and I correspond to different components in Figure IV. 1 .
s

80
0 7 0 w a: w 60 > 0 50 () w 40 a: I-::::) 30 c.. I-::::) 20 0 � 1 0
0 5 1 0 1 5 20
E P VO L TAG E ( kV)
Figure IV. I 0 Deposition in the apparatus following spray drying and electrostatic collection of 10 mg/ml solution at 27 ± 1 °C (Rheostat F, kept between 30 - 32 V and temperatures were measured in dryer C , Figure IV. l ) and a volumetric air flow of 50 .6 ± 1 .5 liters/min (Rheostat E, Figure IV. l kept at 12 V, Appendix All) . In these experiments the particles were collected on glass lining (L, Figure IV.3 )

Table IV.7 Summary of particle collection efficiencies a at a drying temperature of 39 .5 °C (0 .5 )b and volumetric air flow of 50.6 liters/min ( 1 .5 )c as a function of electrostatic precipitator (EP) voltage
EP Voltage (kV_)__ Exit Tube-Kd Dryer-Cd Dryer-Bd
5
10
15
a:J
1 .0 (0.9)
1 .3 (0.5)
1 .0 (0.2)
1 .0 (0 . 1)
1.8 (0 . 1)
2.2 (0 .8)
2.2 (0 .5)
2.3 (0.0)
4 .0 (2.7)
5 . 1 (2.3)
3 .5 ( 1 .8)
6 .5 (3.4)
Column-Id Losses
14.2 ( 1 .6)
24.9 (0.6)
31 .7 (0.8)
33.5 (0.4)
79.0 (4.1)
66.5 (2.2)
61.6 (3.2)
56.8 (3 .6)
a Collection efficiencies are expressed as percentages of total solids output rate from the nebulizer, estimated by isokinetic collection on an absolute glass fiber filter. Values are mean (sample SD), n=3 .
b Rheostat F (Figure IY. 1 ) controlling temperature of hot air gun was set between 50 - 58 V and temperatures recorded in dryer C (Figure IV. 1) . Value is mean (sample SD), n= 12 .
c Rheostat E (Figure IY. 1) controlling air flow to hot air gun was set at 12 V (Appendix All). Value is mean (sample SD), n=3
d The letters K, C, B and I correspond to different components in Figure IV. 1 .
�

c w a: w > o o w a: I::J 0. I::J o �
5 1 0 1 5 E P VO L TAG E(kV)
20
LO SSES
CO L U M N- I
DRYE R-B
DRYER-C
EXIT TUBE-K
Figure IV. l l Deposition in the apparatus following spray drying and electrostatic collection of 10 mg/ml solution at 40 ± 1 °C (rheostat F , kept between 50 - 58 V and temperatures were measured in dryer C, Figure IV. l ) and a volumetric air flow of 50 .6 ± 1.5 liters/min (rheostat E, Figure IV. l kept at 8 V, Appendix All ) . In these experiments particles were collected on the glass lining (L, Figure IV.3) .
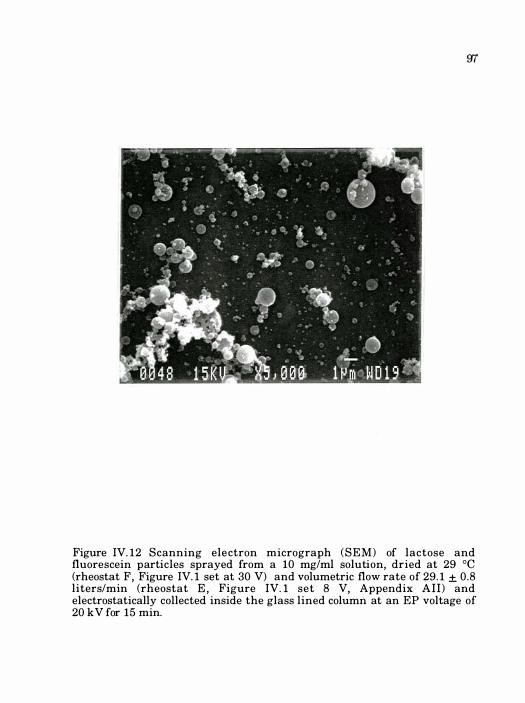
Figure IV. 12 Scanning electron micrograph (SEM) of lactose and fluorescein particles sprayed from a 10 mg/ml solution, dried at 29 °C (rheostat F , Figure IV. l set at 30 V) and volumetric flow rate of 29. 1 ± 0.8 liters/min (rheostat E , Figure IV. l set 8 V, Appendix All ) and electrostatically collected inside the glass lined column at an EP voltage of 20 kV for 15 min.

Figure IV. 13 Scanning electron micrograph (SEM) of lactose and fluorescein particles sprayed from a 10 mg/ml solution, dried at 4 1 °C (rheostat F, Figure IV. 1 set at 50 V) and volumetric flow rate of 29 . 1 ± 0 .8 liters/min (rheostat E , Figure IV. 1 set at 8 V, Appendix All ) and electrostatically collected inside the glass lined column at an EP voltage of 20 kV for 15 min.

Figure IV.14 Scanning electron micrograph (SEM) of lactose and fluorescein particles sprayed from a 10 mg/ml solution, dried at 63°C (rheostat F, Figure IV.1 set at 70 V) and volumetric flow rate of 29.1 ± 0.8 liters/min (rheostat E, Figure IV.1 set at 8 V, Appendix AIl) and electrostatically collected inside the glass lined column at an EP voltage of 20 kV for 15 min.

100
conditions of the same air flow.
Figures IV. 12 - IV. 14 show the scanning electron micrographs
(SEM) of electrostatically collected particles at 20 kV and drying
temperatures of 29 DC (Figure IV. 12), 4 1DC (Figure IV. 13 and 63 DC (Figure
IV. 14). As expected, smaller and better dried particles were obtained when
higher temperatures were used.
IV.c. 1.3 Theoretical particle collection efficiencies during electrostatic
precipitation
Experimental particle collection efficiencies obtained at a drying
temperature of 41 DC and the two air flows of 29 . 1 liters/min and 50 .6
liters/min were compared to theoretical collection efficiencies calculated for
the two flow regimes assuming a particle size of 1 11m when drying was
performed at 41 DC. Theoretical collection efficiencies were calculated
employing the Deutsch-Anderson equation (Equation IV. l ) and using field
charging theory and known geometry of the collection surface ( Hinds,
1982) . The results are shown in Figure IV. 1 5 . Calculated collection
efficiencies consistently overestimated the experimental collection
efficiencies. This may be due to several factors like particle re-entrainment
in the air stream, decreased field strength due to the presence of a glass
collection surface between the conducting electrode (wire J , Figure IV. l )
and the passive electrode (column surface in this case) . Also , the
assumption that particles have a uniform particle size (1 11m) may affect

101
100 . �� � -- -- - . / ,
� .-,
J .-.-
, , , ,
75 .. I ,
U I I
.S I I
I
'"CI I I
� I
50 I I
Q) I
8 I I
I I
� I
I I
-a •
�
25
� 0
0 5 10 15 20 25
EP Voltage (kV)
Figure IV. 15 Comparison of theoretical and experimental collection efficiencies during electrostatic collection. Closed symbols represent theoretical collection efficiciencies, calculated using E quation IV. 1 as described in the methods section (IV.b .2 .5) , at two air flow rates of 29 . 1 liters/min (. ) and 50 .6 liters/min (e) and assuming a particle size of 1 IlIll at the drying temperature of 4 1 °C. Open symbols represent experimental collection efficiencies expressed in terms of the percentage output recovered in column I with glass lining (L, Figure IV. 1 ) at air flow rates of 29 . 1 liters/min (0) and 50.6 liters/min (0) and a drying temperature of 4 1 °C.
102
the theoretical calculations since, in practice , spray drying results in a
particle size distribution and not particles of uniform size. Calculations of
particle charges assuming a particle size distribution is complicated and is
beyond the scope of this thesis . While it is attractive to imagine that
precipitators can be designed for collection of micronized powders , purely
on the basis of theory, this does seem to be possible . These results show the
importance of empirical determinations of collection efficiency at a variety
of operating conditions in order to optimize the drying and collection
process .
IV.d SUMMARY AND CONCLUSIONS
A particle collection apparatus incorporating a commercial
nebulizer and a wire-in-tube type electrostatic precipitator was built and
characterized with respect to particle drying and collection efficiency.
Empirical determinations of collection efficiency were made under a variety
of operating conditions using aqueous solutions of lactose and disodium
fluorescein.
Only particles collected inside the precipitator column CI, Figure
IV. l ) are potentially recoverable for further study. Under all operating
conditions, percentage of particles depositing in parts of the apparatus
other than the column were minimal . Particles were either recovered in
the column or lost in the air stream ("Losses").
At all conditions, percentage deposition in the column increased with
103
increasing precipitator potential , indicating that higher electric field
strengths are required for better collection efficiencies . Increasing the
concentration of nebulized solution, decreased the percentage of total output
being recovered in the column (64 % and 26% of outputs recovered inside the
column after nebulization of 10 mg/ml and 75 mg/ml solutions respectively,
Table IV. 2) .
In separate experiments, the hot air gun (D, Figure IV. l ) was
modified to enable independent control of drying air temperature and
volumetric air flow rate . A 10 mg/ml solution was nebulized and
electrostatically collected at two drying temperatures of 28 °C and 4 1 °C and
two air flow rate of 29 . 1 liters lmin and 50 .6 liters/min. The temperature of
the drying air did not affect the fractional deposition in the column,
although better dried particles were apparently obtained when drying was
performed at higher temperatures, as shown by SEM. D eposition in the
column however, was dependent on volumetric air flow rate, with lower air
flow showing higher fractional deposition in the column. This showed that
deposition was a function of particle residence time ( and electrophoretic
mobility) inside the column.
Experimentally obtained column recoveries were compared to
theoretical collection efficiencies calculated using particle charging theory
and geometry of the wire-in-tube precipitator. Theoretical efficiencies
overestimated the experimental observations at the conditions used in this
study and showed the importance of empirically determining of collection
104
efficiencies under a variety of operating conditions , when desi gning
precipitators for fine particle collection.
The particle collection apparatus developed and described in this
chapter could be used for the collection of low amounts of fine particles
suitable for inhalations . This apparatus was used for evaluating protein
activity following spray drying and electrostatic precipitation of two model
proteins , bacterial alkaline phosphatase (BAP) and bovine intestinal
alkaline phosphatase (BIAP) and is described in Chapter V.

V. STABILITY OF SPRAY DRIED ALKALINE PHOSPHATASE DURING
DRYING AND STORAGE: PROTECTION AFFORDED BY MOLECULAR
DISPERSION IN LACTOSE, TREHALOSE, SUCROSE AND MANNITOL.
V. a INTRODUCTION
Delivery via the pulmonary route is coming under increased scrutiny
for the systemic administration of drugs (Byron and Patton, 1994). With the
discovery of newer protein and peptide drugs, inhalation offers some
distinct advantages over other routes (Adjei and Gupta, 1994; Patton et aI . ,
1994) . One protein drug (recombinant human DNase, Pulmozyme®) has
been approved for administration to the lung by nebulization of aqueous
solutions, for alleviating symptoms of cystic fibrosis . DNase is a mucolytic
enzyme whose topical action in the lung helps reduce sputum viscosity
(Cipolla et aI . , 1994a) . However, in future the lung may also serve as a
conduit for protein therapeutics which have access to the systemic
circulation (Niven, 1993) .
Practical realization of the potential of this route of administration,
requires the production of aerosolizable , respirable particles with
aerodynamic diameters < 5 !lm (Byron, 1990b) . Such particles may be
formulated and delivered using dry powder inhalers (DPls) which seem to
be the delivery systems of choice for proteins, since powder inhalation
105

106
avoids dispersion in hydrophobic propellants (in pressurized metered dose
inhalers; MDIs) and chemical and conformational instability in aqueous
solution associated with nebulizer liquids and the proces s ( e s ) of
nebulization (Martin et aI . , 1994) . Traditionally, such small particles of
bronchodilator and steroid drugs for lung administration were produced by
air-jet milling of crystalline drug substances (Moren, 1987) . Difficulties in
production of crystallized proteins and the high temperatures produced
during such processing make this technique an unattractive method for
thermolabile and plastic materials like proteins . Furthermore, plastic
materials are difficult to micronize to respirable particle sizes of the order
of micrometers. Thus, alternative particulate technologies like processing
from supercritical fluids (Yeo et aI . , 1993; Phillips and Stella, 1993) and
spray drying (Broadhead et aI . , 1994) are being explored for the production
of protein micro particles for inhalation.
Spraying, using a commercially available nebulizer followed by
droplet drying and electrostatic precipitation has been shown to produce
apparently dry particles < 5 J.1m (Naini, et aI . , 1993 and Chapter IV).
Furthermore, sugars have been traditionally used in stabilizing proteins in
solution (Arakawa and Timasheff, 1982) and as cryoprotectants during
freeze drying (Carpenter et aI . , 1986) . Recently there has been increased
interest in the study of stabilizing proteins during air drying (Carpenter et
aI . , 1987), spray drying (Broadhead et aI . , 1994) and long term storage of the
dried mixtures, partly because of the interest in production of respirable dry

107
protein particulates . The mechanism by which sugars offer protection
during drying and storage is not well understood. Even so, the molecular
structure of sugars are believed to offer multiple hydrogen bonding sites
which can potentially bind to polar residues on the protein molecule acting
as a "water substitute" and thus stabilize its conformational structure
(Prestrelski et aI . , 1993) . Alternatively, a hypothesis based on the material
science approach of glass to rubber transitions in amorphous materials has
been proposed, to explain stabilization of proteins by excipients during
drying and storage in the solid state (Franks et aI . , 1991) . According to this
hypothesis, when a protein-sugar solution is dried, the protein is entrapped
in an amorphous glassy matrix of the sugar which reduces molecular
motion and thus the frequency of destabilizing reactions . The amorphous
glassy matrix should be below its glass transition temperature (Tg) to
theoretically remain stable for pharmaceutically relevant time periods .
Only when storage temperatures exceed the glass transition temperature
does the amorphous bulk become rubbery, molecular mobility increases,
and materials then become prone to recrystallization and increased
chances of degradative chemical reactions in the solid state (Ahlneck and
Zografi, 1990).
Designing a protein powder formulation for inhalation, requires that it
should be physically and chemically stable in the dry state over its shelf life.
It should also be readily reconstitutable in lung fluids for the protein to
elicit its local or systemic pharmacological effect. This chapter deals with

108
the feasibility of using spray drying and electrostatic collection for
producing enzymically active reconstitutable protein-sugar microparticles .
Since the protein forms a molecular mixture embedded in a sugar matrix
inside the microparticles, the sugar must be inhaled along with the drug.
This is in contrast to traditional carriers in dry powder inhalers, where the
carrier is detached from micronized drug particles , before the patient
inhales the drug. Alkaline phosphatase (bacterial and bovine intestinal)
was chosen as the model protein for studying spray drying and electrostatic
collection in the apparatus described in Chapter IV, with and without the
addition of lactose, trehalose, sucrose or mannitol to the initial solution.
Stability of the dried solids was also investigated after storage at 23% RH
and 25 °C for 14 days, conditions under which each of these sugars in the
solid state , was proven to retain their its original physicochemical
characteristics for 30 days after collection as a spray dried respirable solid
in the absence of added protein (Chapter III) .
V.h MATERIALS AND METHODS
Bacterial (E. c o l i ) alkaline phosphatase (Product #P4252, Lot
# 10 1H40 19 1), as a suspension in 2 . 5 M ammonium sulfate solution and
bovine intestinal alkaline phosphatase (Product #P7640, Lot #043H7 185) , as
a freeze-dried powder, substrate disodium p-nitrophenol phosphate
(Product # 104-0, Lot #123H50083), p-nitrophenol standard solution (Product
# 104- 1 , Lot #0 14H6 137) bovine serum albumin protein standard (Product

109
#P09 14, Lot #14H8530), sucrose, D-mannitol and a.,a.-trehalose dihydrate
were all obtained from Sigma Chemical Company (St. Louis , M O ) . a.
Lactose monohydrate was obtained from Foremost Ingredient Group
(Baraboo , WI ) . Tris [Tris(hydroxymethyl)-aminomethane] and sodium
dodecyl sulphate (SDS) were obtained from Pharmacia LKB (Piscataway,
NJ). Protein assay kits (Product #500-006, Lot#'s 5 1 143A and 5 1558A) were
from Bio-Rad Laboratories (Hercules, CA). All other chemicals used, were
of reagent grade quality and obtained from Fisher Scientific Company
(Raleigh, NC) .
A series of solutions were spray dried, collected and characterized in
the apparatus developed and described in Chapter IV. E ach of these
solutions was coded and summarized in Table V. l . The remainder of this
section details procedures employed in each case .
V.b.l Nebulization, drying and electrostatic precipitation
The apparatus used for spray-drying and electrostatic precipitation of
protein and protein-sugar mixtures is shown in Figure V. l . The apparatus
was completely characterized with respect to particle collection efficiency,
using lactose and dis odium fluorescein as described in Chapter IV. Briefly,
the apparatus consisted of a Small Particle Aerosol Generator (SPAG-2 ,
lCN Pharmaceuticals, Costa Mesa, CA), which included the nebulizer
reservoir (A), drying chamber (B), nebulizer airflow controller (NA), drying

Table V. 1 Summary of enzyme solutions spray dried and electrostatically collected.
Solution Target Protein Buffer & Sugar Added Volume Concentrationc Code Conc . a Amt . a other solidsb Sugar Amt .
(!1g/ml) (mg) (mg) (mg) (ml) (mg/ml)
Bacterial Alkaline Phosphatase (BAP) BAP 120 3 3) No sugar 0 25 1 .3 BAPL 120 3 3) Lactose 217 25 10.0 BAPT 120 3 3) Trehalose 217 25 10.0 BAPS 120 3 3) Sucrose 217 25 10.0 BAPM 120 3 3) Mannitol 217 25 10.0
Bovine Intestinal Alkaline Phosphatase (BIAP)
BIAP 1000 25 55 No sugar 0 25 3.2 BIAPL 1000 25 55 Lactose 170 25 10.0 BIAPT 1000 25 55 Trehalose 170 25 10.0 BIAPS 1000 25 55 Sucrose 170 25 10.0 BIAPM 1000 25 55 Mannitol 170 25 10.0
a Protein was detennined in the actual experiments by the Bradford assay in tenns of BSA equivalents (BSAE); thus actual protein concentrations may be greater or smaller than those quoted.
b Altered buffer salt (Tris) content in the final dried product could affect maximal enzyme activity of alkaline phosphatase. Total concentration of non volatile ingredients.
...... o

To fume hood
J 0 0 1::111:::1 0 0
. 0 .
! Compressed Air Supply
Figure V. I Schematic diagram of the particle collection apparatus.
KEY A - NebulizerReservoir B - SPAG Drying chamber C - Secondary drying
chamber D - Hot air gun E - Rheostat controlling
air flow F - Rheostat controlling
temperature G - High voltage supply H - Thermometer I - Electrostatic
precipitation column J - Central wire conductor K - Exhaust tubing L - Glass lining NA-Nebulizer air flow DA-Drying air flow
� � �
112
air flow controller (DA) and an inlet for compres sed air supply (Figure
V. I ) . A controlled inlet air pressure of 26 psig enabled a nebulizer air flow
(NA) of 7 liters/min and a drying air flow (DA) of 10 liters/min to be used
throughout. Aerosol generated from the SPAG was introduced via
inhalation tubing into a secondary drying chamber (C) . Additional drying
air ( 12 liters/min) was introduced into the chamber by means of a hot air
gun (D ) whose air flow and temperature were controlled by means of two
variable transformers (E & F respectively) . Dimensions of all components in
Figure V. I were as described in Chapter IV, and shown in Figures IV.2
and IV.3 .
The steady state air temperature (approximated by the dry-bulb
temperature) inside the drying chamber (C) was monitored during the
experiment by means of a thermometer (H), introduced into the chamber.
In all experiments a total air flow of 29. 1 liters/min was measured at the
outlet of the precipitator column ( 1 ), and a targeted temperature of 63 °C in
the secondary drying chamber (C) , corresponding to a voltage range
between 70 and 80 V on the transformer controlling temperature ( F) , were
used. Dried particles exiting the chamber (C) were then introduced into a
wire-in-column type electrostatic precipitator, which consisted of a
charging and collection column ( 1 ) and a central wire conductor (J) . To
facilitate easy recovery of collected material, sections of large bore glass
tubing were introduced inside the precipitator column ( 1 ) whose
dimensions are given in Chapter IV , Figure IV. 3 . The column was

113
exhausted into a fume hood through inhalation tubing (K) . A voltage of -20
kV (negative polarity) was applied to the central conductor (J) of the
precipitator by means of a high voltage generator (G, Model #2807R,
Brandenburg/Astec, Alpha I I Series , Stourbridge, UK) . Aerosols were
generated from solutions placed in the nebulizer reservoir (A, Figure V. l)
and collected on the glass collection surfaces ( I ) inside the column for 90
minutes in each case.
V.h.l .l Bacterial Alkaline Phosphatase
Bacterial alkaline phosphatase (BAP) was obtained as a suspension in
2 . 5 M ammonium sulfate solution and contained 4 . 1 mg/ml of protein (as
determined by the Warburg-Christian method ; Sigma certificate of
analysis ) . This suspension was desalted by ultrafiltration prior to use,
hence the final nebulized solutions contained the pure enzyme and Tris
buffer salt.
Briefly, three 250 �l aliquots of the enzyme suspension were pipetted
into three Microcon- 10 (MW cut off = 10 kDa, Product #42406, Amicon,
Beverly, MA) micro concentrator sample reservoirs attached to filtrate vials .
250 �l of 10 mM Tris buffer pH 8 .0 was added to each reservoir . These
solutions were spun in a bench top centrifuge (Eppendorf, Centrifuge 5415 ,
Brinkmann Instruments, Westbury, NY) at 7000 rpm for 10 min . At the
end of the 10 min run, two additional 10 min spins were performed, with
250 �l of fresh buffer added to the sample reservoir at the end of each spin.

114
After three spins, 100 III of fresh buffer was added to each sample reservoir,
inverted into fresh retentate vials and briefly spun for 2 min at 4000 rpm, to
collect the desalted enzyme fraction. The three desalted enzyme fractions
were mixed and reconstituted to 25 ml with 10 mM Tris buffer pH 8 . 0
(Solution BAP, Table V. l ) . Solution BAP h a d a targeted protein
concentration of 120 Ilg B SAE/ml . Protein concentrations quoted
throughout thi s chapter and C hapter VI, are apparent protein
concentrations expressed in terms of bovine serum albumin ( B SA)
equivalents (BSAE ) . Thus for solution BAP (Table V. l ) the total
concentration of nonvolatile ingredients was 1 . 3 mg/ml ( 0 . 1 % w/v;
protein:buffer components = 1: 10) .
For spray drying protein-sugar mixtures , 217 mg of one of the sugars
(lactose, trehalose, sucrose or mannitol) was added to the desalted enzyme
fractions prior to reconstitution with Tris buffer pH 8 . 0 to 25 ml . These
solutions are coded a s : BAPL, BAPT, BAPS and BAPM for enzyme
solutions containing lactose, trehalose, sucrose and mannitol respectively
(Table V. l) . Final protein concentration of these solutions was targeted to
120 Ilg BSAE/ml . The total concentration of non-volatile ingredients of
BAPL, BAPT, BAPS and BAPM in the final solution was 10 mg/ml ( 1% w/v;
protein:buffer components:sugar = 3 :30 :217 , Table V. l) . A 1 ml aliquot of
this solution was retained at ambient conditions (temperature 20 - 23 °C) for
further analysis . The remaining 24 ml was placed in the nebulizer
reservoir (A, Figure V. l ) . Hot air gun (D, Figure V. l ) was turned on and

115
the transformer controlling air flow (E ) was kept at B V (corresponding to
an total air flow of 29 . 1 liters/min, Appendix All ) . Transformer controlling
temperature of the drying air (F) was adjusted between 70 and BO V and a
steady state air temperature of 63 °C was achieved inside the secondary
drying chamber (C) , as measured by the thermometer (H) . The high voltage
generator (G) was then switched on and applied voltage on the electrostatic
precipitator (J) was adjusted to -20 kV (negative polarity). Controlled inlet
air pressure of 26 psig was supplied to the SP AG by an air compressor
(Figure V. l ) . Nebulizer and drying air flow of the SPAG were adjusted to 7
liters/min and 10 liters/min by turning the knobs on NA and DA gauges
respectively (Figure V. l ) . The resulting aerosol generated from the SPAG
was dried and electrostatically collected as described in Section V.b . l for 90
min. Temperatures in the secondary drying chamber (C, Figure V. l ) were
recorded at the beginning, middle and end of each 90 min experiment. At
the end of 90 min, the nebulizer, high voltage generator (G) and the hot air
gun (D ) were turned off in that order. The apparatus was dismantled, glass
columns ( I ) from inside the precipitator column (J) were washed and
reconstituted to 10 ml using 10 mM Tris buffer pH B .O . The initial solution,
column wash and residual solution in the nebulizer reservoir were
analyzed in duplicate for protein content (in BSAE) and enzyme activity
after appropriate dilutions with 10 mM Tris buffer pH B .O . Protein content
was determined by the method of Bradford (Bradford, 1976) using the Bio
Rad protein assay kit (Bio-Rad, Hercules, CA) and protein contents were

116
expressed in terms of BSA equivalents (BSAE ) . Enzyme activity was
determined by following the initial reaction rate of the hydrolysis of p
nitrophenol phosphate to p-nitrophenol at 37 °C (Torriani, 1968 ) . One unit
of enzyme activity was defined as the amount of enzyme that releases 1
nmol of p-nitrophenol per minute at 37 °C . Specific activities of the enzyme
were expressed as Units/Ilg BSAE in assayed solutions . Each solution was
assayed in duplicate and reported values are the mean of three 90 min
experimental runs. Detailed descriptions of the enzyme and protein assays
are given in Chapter VI.
V.h. 1.2 Bovine httestinal Alkaline Phosphatase
Bovine intestinal alkaline phosphatase was obtained as a freeze-dried
powder. The specific lot (#043H7185) used in this investigation consisted of
59 . 1 % protein (phosphatase plus other proteins) and the remaining was
made up of buffer salts (Tris , MgCl2 and ZnCI2 ; Sigma Technical
Information). However, specific information on the nature of proteins,
other than phosphatase, was not available from Sigma. This made it
difficult to compare the bacterial and bovine alkaline phosphatase enzymes
used in this study. This is often the problem with biologics, since their
pharmaceutical chemistry is poorly defined when compared to small
molecular weight drugs . It has been reported that a highly purified
intestinal phosphatase preparation has signifi cantly higher catalytic
activity compared to the bacterial enzyme of similar overall purity (Chappelet-

117
Tordo et aI . , 1974). However, the pH at which this maximal activity occurs
are different for the two enzymes (B . 5 and 1 0 . 5 for BAP and B IAP
respectively). The crude enzyme preparation as obtained from Sigma was
used without purification.
Fifty milligrams of the crude enzyme powder was dissolved and
reconstituted to 25 ml using 10 mM Tris buffer pH B.O (solution BIAP, Table
V. 1) , to give a protein concentration of -1 mg/mI. The total concentration of
non-volatile ingredients in solution BIAP (Table V. 1 ) was 3 .2 mg/ml (0 .3%
w/v; protein:other solids ratio = 5 :11 , Table V. 1) .
For spray drying BIAP-sugar mixtures , 170 mg of one of the sugars
(lactose , trehalose, sucrose or mannitol) was added to 50 mg enzyme
powder before dissolution and reconstituted to 25 ml in 10 mM Tris buffer
pH B .O . These are coded as BIAPL, BIAPT, B IAPS and BIAPM for solutions
containing lactose, trehalose, sucrose and mannitol respectively (Table
V. 1) . The total concentration of non-volatile ingredients in solutions BIAPL,
B IAPT, B IAPS and BIAPM was 10 mg/ml ( 1% w/v ; protein: other
solids: sugar ratio = 5 : 1 1 :34, Table V. l) . One ml of this solution was retained
at ambient conditions (temperature 20 - 23 °e) for further analysis . The
remaining 24 ml was placed in the nebulizer reservoir. Aerosols were
generated and collected for 90 min as described in Sections V.b . 1 and
V.b . 1 . 1 . Protein content in terms of BSA equivalents (BSAE) and enzyme
activity of the initial solution, column wash and residual nebulizer solution
were analyzed after appropriate dilutions with 10 mM Tris buffer pH B .O , as

described above and in Chapter VI .
V.b.2 Solid state stability of dried protein and protein-sugar mixtures
118
Aerosols were generated and collected using bacterial (BAP) and
bovine intestinal alkaline phosphatase (BlAP) as described in Sections
V.b . 1 . 1 and V.b . 1 .2 respectively. At the end of 90 min collection, initial and
residual nebulizer reservoir solutions were analyzed for protein and
enzyme activity as described above. However, the glass collection surfaces
( I , Figure V. 1) in the precipitator were removed and quickly transferred to
desiccator vessels in which a constant relative humidity (RH) of 23% was
maintained with a saturated salt solution (potassium acetate ; Callahan et
aI . , 1982). Desiccator vessels were maintained at 25 °C in an environmental
chamber ( Model 4353 14, Hotpack, Philadelphia, PA) for 14 days. Mter this
period , the glass collection surfaces were removed , washed and
reconstituted to 10 ml, using 10 mM Tris buffer pH 8.0 . This solution was
analyzed for protein content (in BSAE) and enzyme activity as described
above and in Chapter VI . Reported values are mean of three such storage
experiments .
V.b.3 Solution degradation kinetics of bovine intestinal alkaline
phosphatase (BIAP)
A worst case scenario of enzymic degradation at temperatures similar
to those seen within the spray drying process was simulated in solution for

119
BIAP . It was also used to look at the effect of solution temperature on
protein concentration determination by the method of Bradford (Bradford,
1976) . A 2 mg/ml (corresponding to a protein concentration of -1 mg
BSAE/ml) solution of the crude enzyme powder was prepared in 10 mM
Tris buffer pH 8 .0 . One milliliter of this solution was incubated in a test tube
at 63 °C in a constant temperature water bath (Model #950 5 , Fisher
Scientific, Raleigh, NC) . Forty microliter (40 Ill) aliquots of the enzyme
solution were withdrawn at different time points, transferred to a 10 ml
volumetric flask and diluted with 10 mM Tris buffer pH 8 . 0 kept at ambient
temperature (22 - 23 °C) . A 40 III sample withdrawn just prior to incubation
at 63 °C provided the sample for initial enzyme activity. These solutions
were analyzed for protein content (in BSAE) and enzyme activity as
described in Chapter VI.
V.b.4 Effect of droplet drying on protein concentration detennination by the
method of Bradford
Experiments were performed to determine the effect of phase
transformation of the enzyme from the droplet state to the dried state on
apparent protein content determination by the method of Bradford
(Bradford, 1976) . This because BSAE/ml was used as the quotient in the
determination of specific activity (Chapter VI). A 2 mg/ml (corresponding
to a protein concentration of - 1 mg B SAE/ml) of B IAP crude enzyme
powder was made up in 10 mM Tris buffer pH 8 . 0 . This solution was

m
assayed for protein content (in B SAE ) using the method of Bradford
(Bradford, 1976) . D ensity of the solution was determined at room
temperature (20 - 23 °C) using a specific gravity bottle . A known volume of
the solution was sprayed using a small spray bottle into large volume test
tubes. These tubes were dried at 45 °C for 90 min in an oven. At the end of 90
min, 20 ml of 10 mM Tris buffer pH 8.0 was pipetted into the tubes along
with four drops of 0 . 1 % w/v sodium dodecyl sulphate (SDS) solution. SD S
was added t o prevent protein loss b y adsorption t o the tube walls (earlier
experiments performed by spraying enzyme solution into larger glass
chambers without undergoing the drying process , resulted in greater
losses of protein, indicating that protein was being lost by adsorption to
glass at these low concentrations) . Twenty milliliters (20 ml) of the wash
solution was then assayed for protein content (in BSAE) and the apparent
percentage of protein recovered determined.
V.h.5 Scanning electron microscopy of dried BAP and BAP-sugar
aerosols
Scanning electron microscopy (SEM) stubs were attached to the glass
collection surface inside the precipitator column ( I , Figure V. l ) , by means
of double sided sticky tape (Scotch, 3M, St. Paul , MN). Aerosols of BAP
alone and in admixture with one of the four sugars (solutions coded as
BAP, BAPL, BAPT, BAPS and BAPM, Table V. l ) were generated and
collected for 15 min under conditions described in Section V.b . 1 . 1 . At the

121
end of 15 min, the stubs were removed from the column c r , Figure V. 1) ,
coated with gold-palladium using an Eiko IB-2 Ion Coater ( Eiko
Engineering, Ibaraki, Japan) under a vacuum, prior to SEM and
photomicrography.
V.h.6 Statistical analyses
Statistical analyses were performed to detect differences in enzyme
specific activities before and after spray drying and electrostatic collection of
both BAP and BIAP, when dried with or without addition of the four
sugars. All statistical analyses were performed at a level of significance of
a=O .05 , while ensuring normality of the resulting residuals.
The following linear statistical model was used to test the various
hypotheses:
Xij = 11 + CONDi + SOLNj + (CONDi • SOLNj) + eij
where :
Xij = Observation at i th level of COND effect and jth level of SOLN effect (Xij
refers to specific activity in these experiments) .
11 = overall mean effect
C O N D i = Experimental condition effect at level i . Four levels of
experimental conditions were tested; i . e . 1 ) Initial solution, 2 ) nebulizer
reservoir solution, 3) spray dried and 4) spray dried and stored at 23% RH
and 25 °C for 14 days.

122
SOLNj = Solution formulation effect at level j . Five levels of solution effect
were tested for each of the enzymes, BAP and B IAP; i . e . 1 ) sugar free
enzyme formulations (BAP and BIAP), 2) enzyme with lactose (BAPL and
BIAPL), 3) enzyme with trehalose (BAPT and B IAPT), 4) enzyme with
sucrose (BAPS and B IAPS) and 5) enzyme with mannitol (BAPM and
BIAPM) .
CONDi • SOLNj = Effect of interaction between the two main factors CONDi
and SOLNj .
£ij = Error component (residuals) .
Hypotheses were tested using a two way analysis of variance (ANOVA)
with an interaction term as described above . Raw data for specific activities
of BAP and BIAP obtained using different formulation and experimental
conditions are given in Appendix AlII . For example, consider the situation
where the difference in specific activity between spray dried B IAP and
BIAPM was being assessed. The procedure was run with Xij = 6 .5 , 6 .0 and
5.9 Units/Jlg BSAE (for BIAP) and Xij = 5 .0 , 5.3 and 5.4 Units/Jlg BSAE (for
BIAPM) . These values were obtained by dividing enzyme activitie s
(Units/ml) with their respective apparent protein concentrations ( Jlg
BSAE/ml) as given in Table AIlI .2 (Appendix AlII) . Significant differences
for individual comparisons due to the main factors were detected using
Scheffe 's multiple comparison test. If the two way ANOVA showed a
significant interaction effect, a follow up one way ANOVA was used to

123
detect the source of difference ; individual comparisons were then
performed using the Scheffe's multiple comparison test. All statistical
analyses were performed using the program STATGRAPHICS Plus ,
Version 6 (Manugistics Inc . , Rockville, MD, 1992).
V.c RESULTS AND DISCUSSION
In the bulk of the experiments described in this chapter, activities and
specific activities of BAP and BIAP are compared after spray drying and
collection from a variety of formulations . Because specific activity (Units/llg
BSAE ) required both a protein assay and enzyme activity assay, to
determine their ratio, the effect of solution degradation and drying upon
enzyme protein and activity were first studied independently. The results of
these experiments are described in Sections V.c. 1 and V.c .2 .
V.c. l Solution degradation kinetics of bovine intestinal alkaline
phosphatase
Solution degradation kinetics of BIAP were studied in 10 mM Tris at
an enzyme concentration of - 1 mg BSAE/ml and 63 cC . The results are
summarized in Table V.2. The first column gives the protein concentration
in terms of BSA equivalents as determined by the Bradford assay, which
shows a small loss of detectable protein when solution was incubated for 90
min at 63 cC . This underestimation must be due to chemical changes in the
protein at this temperature. A molecular weight threshold of 3000 D altons
124 Table V.2 Solution degradation kinetics of bovine intestinal alkaline phosphatase (BIAP) incubated at 63 °C and its effect on protein concentration determination by the method of Bradford.
Time of Protein Enzyme Specific Activityb incubation Conc. a ,b ,c Activitya,b,d (Units/�g protein) (min) (�g/ml ) (Units/m!)
0 3.4 (0 . 1) 36.6 (0.2) 10.8 (0.2) 1 3.2 (0 . 1) 32.9 (0.8) 10.2 (0.2) 2 3.2 (0 . 1) 29.2 ( 1 .0) 9.2 (0.3) 5 3.0 (0 . 1) 21.3 (1 .2) 7 .1 (0 .3) 00 2.6 (0 . 1) 8 .7 (0.8) 3 .3 (0.2) 00 2.7 (0 . 1) 2.2 (0.3) 0 .8 (0. 1)
a Protein concentration and enzyme activity were determined for 40 �l aliquots withdrawn at diferent time intervals and reconstituted to 10 ml with 10 mM Tris buffer pH 8 .0 .
b Values are mean (sample SD) of three determinations. Protein concentrations were determined by the method of Bradford in terms of BSA equivalents.
d One Unit of enzyme activity was defined as the amount of enzyme that releases 1 nmol of p-nitrophenol per minute at 37 °C.
1 rnm',-----------------------------------,
1 00 Il1o.. � ,. ,. -
1 0+---.--.---.--.---'--'r--.---r--.-� o 1 0 20 30 40 :50 60 70 SO 90 1 00
Time (min)
125
Figure V.2 Log-linear plot of loss of detectable protein vs time for bovine intestinal alkaline phophatase incubated in solution at 63 ce . Plotted values are experimentally obtained data. The solid line shows the best fit by linear regression of the data (y = -O .OO lx + 1 .97 ; r2 = 0 .52 ; standard error of slope = 0.00024; n = 18).

126
125
100 � Units/ml
- - -+- - - Units/(Ilg BSAE)
75
50
25
o o 25 50 75 100
Time (min)
Figure V. 3 Solution degradation kinetics of bovine intestinal alkaline phosphatase (BIAP) in 10 mM Tris buffer pH 8 .0 , incubated at 63 °C shown on linear-linear plot. Activities were either calculated as Units/ml (0) or Units(l1g BSAE (specific activity; + ) . D ata points are means of three determinations (error bars are sample SD) . Error bars are not shown where sample SD was smaller than the size of the symbol used fo. the data point .
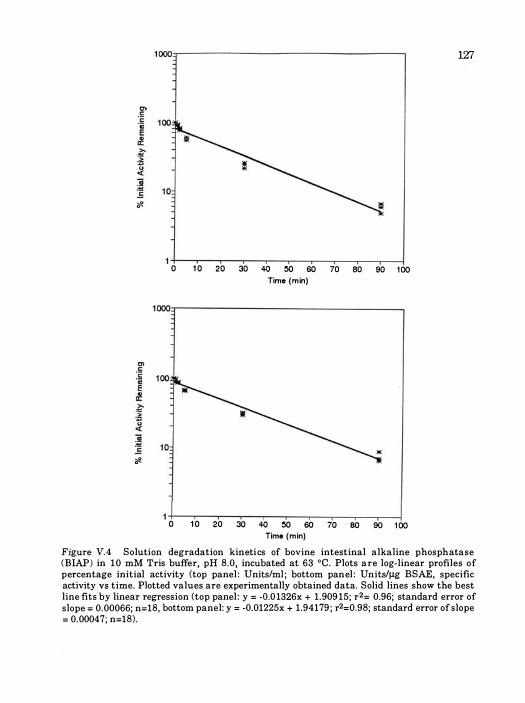
1 ��----------------------------------, 1Z7
1 +---r-�--.---�-.---r--.---r--'--� o 1 0 20 30 40 !:IO 60 70 80 90 1 00
Time (m in)
1 ��----------------------------------.
1 +---r-�--'---�-.---r--.---r--'--� o 1 0 20 30 40 !:IO 60 70 60 90 1 00
Time (m in)
Figure V. 4 Solution degradation kineti cs of bovine intestinal alkaline phosph atase (BIAP) in 1 0 mM Tris buffer, pH 8.0, incubated at 63 °e. Plots are log-linear profiles of percentage initial activity (top panel : Units/ml ; bottom pan el : Units/J.lg BSAE, specific activity VS time. Plotted values are experimentally obtained data. Solid lines show the best line fits by linear regression (top panel : y = -0.0 1326x + 1. 909 15; r2= 0.96; standard error of slope = 0. 00066; n=18, bottom panel: y = -0.01225x + 1.94179 ; r2=0.98; standard error of slope
= 0. 00047; n=18).
128
for binding of Coomassie Blue G-250 to the polypeptide has been reported in
the literature (Chapter VI, Sedmak and Grossberg, 1977) and progressive
hydrolysis to form smaller fragments is feasible at this temperature.
Assuming that the loss of detectable protein followed first-order kinetics,
the negative log-linear slope of percentage initial protein concentration vs
time was determined by linear regression analysis (Figure V.2) . A value for
the degradation rate constant of 0 .002 min-1 was determined from this plot.
From the perspective of this study, at a volumetric air flow rate of 29 Llmin,
droplet residence time inside the apparatus (nebulizer to collection surface
should be ::; 3 sec). Thus, even in the extreme and unlikely case of droplets
reaching the air temperature of 63 °C, the loss of detectable protein should
be minimal during residence time of the droplet drying in these
experiments .
The enzyme also lost considerable activity when incubated at 63 °C in
solution (Table V.2) . Enzyme activity was expressed in this Table and the
resultant plots as both Units/ml and Units/Ilg BSAE in order to show that
enzyme activity changes were not paralleled by changes in apparent protein
concentration. The loss of detectable protein during the course of 90 min
and the enzyme degradation profile were similar, as shown from the
percentage initial activity vs time plots (Figure V.3) . Assuming that loss of
enzyme activity followed first-order kinetics, rate constants of 0 . 028 min-1
(percentage of initial specific activity remaining vs time) and 0 . 03 1 min- 1
(percentage of initial activity remaining vs time), were obtained from the

log-linear plots in Figure V.4.
V.c.2 Effect of droplet drying on protein content determination
These experiments were performed to see if the phase
transformation from droplet to dry particle affected the apparent protein
content values after their determination by the method of Bradford
(Bradford, 1976) . The result of three drying experiments as described in
Section V.b .3 are shown in Table V.3 . Ninety two percent (92%) of the
original protein content sprayed into large volume test tubes and dried was
recovered. The small loss of protein (8%) was probably due to adsorption
and not due to loss of detectable protein, since at these low concentrations,
proteins are known to adsorb to surfaces like glass . In addition, when
enzyme solution was impacted as a wet aerosol onto the walls of a larger
glass chamber (greater surface area for adsorption) and immediately
reconstituted (without droplet drying), greater losses of protein were seen
indicating, once more that loss was due to adsorption and not droplet
drying. To avoid adsorption of protein to glass a few drops of 0 . 1 % w/v SDS
solution was included in the wash solution. Larger amounts of SDS could
not be used since SDS is known to interfere with the Bradford assay at
higher concentrations (Bio-Rad Protein Assays, Bio-Rad Laboratories, Inc . ,
Richmond, CA, 199 1 ) . During spray drying experiments performed as
described in this Chapter, some loss of protein may also have resulted from
adsorption to the glass collection surface 0, Figure V. l) .

1� Table V.3 Effect of droplet drying a on protein contentb determination by the method of Bradford in BIAP solutions.
Experiment #
1
2
3
Amount sprayedc (Jlg)
75. 1
75.0
74.8
Amount recovered from wash solutiond
( Jlg)
67.2
70.4
69.6
% Recovery
89.5
93.9
93.0
Mean % Recovery 92. 1
SD 2.3
a Solution of BIAP in 10 mM Tris buffer pH 8 .0 was sprayed into large volume test tubes and dried at 45 D C for 90 min.
b Protein concentrations are expressed in terms of BSA equivalents . Volume of solution sprayed was determined by weight difference of the spray bottle before and after spraying and the density of enzyme solution.
d Tubes were washed with 10 mM Tris buffer pH 8 .0 along with four drops of 0 . 1 %w/v SDS solution following drying of the droplets.

131
V.c.3. Spray-drying and electrostatic collection of bacterial alkaline
phosphatase (HAP) Early work on which the temperature selection of 63 DC for drying was
based, involved the spray drying and electrostatic collection of sugar free
aerosols containing BAP and buffer salt under identical conditions .
Collected aerosols, which were apparently dry particulates as observed on
the glass collection surface and by electron microscopy (Figure V. 7 ) were
reconstituted with 10 mM Tris buffer pH 8.0 kept at room temperature (20 -
23 DC) . The average specific activity of the enzyme in the reconstituted
solutions in the sugar free experiments was 12 .2 Units/�g BSAE, which
showed a 23% loss in specific activity compared to the initial solution. While
a loss of this magnitude was not large, it was significant relative to the
initial specific activity (ANOVA, p < 0.05, Table V.5) and could be attributed
to drying and/or collection of particulates. Importantly, as was discussed in
Sections V.c. 1 and V.c .2 , it was unlikely that the protein assay responsible
for this change . That assay should not be affected by the processing
conditions employed in these experiments. The initial hypothesis therefore,
that these sugars may offer protection against degradation during drying
and collection of BAP, was theoretically testable by co-drying and collecting
BAP along with the different sugars, then assaying the products for specific
activity. Experimental results for enzyme specific activity using bacterial
alkaline phosphatase (BAP) as the model protein for spray-drying are
summarized in Table V.4 and Figure V.5 .

132
BAP is a dimeric Zn-metalloprotein of molecular weight 94000 Daltons,
composed of two identical monomers (Coleman and Gettins, 1983) . The
complete amino acid sequence (Bradshaw et ai . , 198 1 ) and the three
dimensional structure (Sowadski et ai . , 1985; Kim and Wyckoff, 199 1) of
BAP have been reported. A cartoon representation of the three dimensional
structure of the BAP monomer is shown in Figure V.6 . The isolated
enzyme consists of two Zn+2 and one Mg+2 ion per monomer (Coleman and
Gettins, 1983; Coleman and Chlebowski, 1979) . The presence of metal ions
has been shown to be critical for stabilizing the three dimensional structure
and for enzyme activity (Coleman and Gettins, 1983). Using high sensitivity
differential scanning calorimetry (DSC) , Chlebowski and Mabrey have
shown that apoalkaline phosphatase (enzyme whose metal ions have been
removed by chelation) undergoes a reversible thermally induced
denaturation at 57 .5 DC, which dramatically increases to 85 DC, on binding
to two Zn+2 ions per dimer (Chlebowski and Mabrey, 1977) . The native
dimeric form of the enzyme (with 4 Zn+2 and two Mg+2 ions) was shown to
be remarkably heat stable with a denaturation temperature of 96 DC
(Chlebowski and Mabrey, 1977) .
In these experiments, total apparent protein content of the nebulized
solution (solutions coded as BAPL, BAPT, BAPS and BAPM; Table V. 1 ) was
held at - 1 .2% w/v with respect to other non volatile ingredients (3 mg BSAE
in 250 mg total solids) . Nebulizer solution concentrations were held at - 1%
w/v total solids, exactly as used during equipment validation experiments

Table V.4 Specific activity of bacterial alkaline phosphatase (BAP) following nebulization and spray drying with sugars, electrostatic collection and storage .
Initial Solutionc Nebulizer Reservoir<! Spray Driede Storagef
Spec. Act.b Prot. Conc. Spec . Act.b Prot. Conc. Spec. Act.b Spec . Act.b (U nitsillg prot) ( Ilgiml ) (Unitsillg prot) ( Ilgiml) (Unitsillg prot) (Unitsillg prot)
BAPa 15.7 ( 1 .4) 123.8 (8 .1) 15.5 ( 1 .8) 281 .7 (63.9) 12. 1 (Ll) 10 .5 ( 1 .2)
BAPLa 15.7 ( 1 .2) 127 .8 ( 12.7) 15.6 ( 1 .4) 241 .2 (74.8) 12.2 (2.5) 11.3 (3.3)
BAPTa 14.9 ( 1 .2) 132.6 (9.6) 14 .7 (2.0) 259.0 (67 . 1) 13.0 (2.7) 10.9 (2. 1)
BAPSa 15.2 (1 .0) 129.2 ( 10.4) 14.8 ( 1 .2) 264.4 (41.6) 12.6 ( 1 .3) 11.0 ( 1 .9)
BAPMa 15.9 ( 1 .7) 117 .7 (22.0) 15.4 ( 1 .4) 251 .9 (73.3) 9.3 (2.5) 9.0 (4.4)
a Solutions correspond to coded solutions as tabulated in Table V. l . b One unit i s defined a s the amount of enzyme that releases 1 nmol o f p-nitrophenol per minute a t 37 °C.
Protein content was expressed in terms of BSA equivalents (BSAE) . c Values are mean (sample standard deviation), n=6. d Solution assayed from the nebulizer reservoir at the end of 90 min. Values are mean (sample standard
deviation), n=6. e Spray dried and collected for 90 min. Values are mean (experimental range), n=3.
Spray dried and collected for 90 min prior to storage at 23% RH and 25 °C for 14 days.Values are mean (experimental range), n=3 .
�

134 Table V.5 Summary of two way analysis of variance (ANOVA)a results for enzyme specific activities of bacterial alkaline phosphatase (BAP) .
Source of Sum of Degrees of variation squares freedom
Main Effects SOLNb 15.27 4 CONDe 358.99 3
Interaction COND . SOLN 33.02 12
Residual 144.31 70
Total 544.61 89
a The statistical model tested was:
Mean F-ratio Significance Square level
3.82 1 .85 NSd 119.66 58.05 p < 0.05
2.75 1.34 NSd
2.06
Xij = Jl + CONDi + SOLNj + (CONDi . SOLNj) + Eij and is described in Section V.b.4.
b Five levels of solution effect (SOLN) were tested; BAP, BAPL, BAPT, BAPS and BAPM. Four levels of experimental condition effect (COND) were tested; initial solution, nebulizer reservoir solution, spray dried and spray dried and stored at 23 %RH and 25 °C for 14 days.
d No significant difference.

135
described in Chapter IV. Sugar and buffer components made up the
remaining solids (86.8% and 12%, respectively) . In sugar free experiments
with BAP (solution coded as BAP; Table V. 1 ) the total solids concentration
was -0. 1% w/v, of which -9% (3 mg in 33 mg total solids) was protein and
-91% (30 mg in 33 mg total solids) buffer components. Sugar free solutions
(BAP; Table V. 1) showed an average specific activity of 15.7 Units/�g BSAE.
This activity in solution as shown in the first column of Table V.4 , was
statistically unchanged by the addition of the four sugars (Table V.5) .
The process of atomization during nebulization can potentially
denature some proteins. This may be due to combination of factors .
Typically, shear forces associated with air-j et nebulization, the
recirculation of a large proportion of the solution before exiting as aerosol,
the presence of a large air-water interface within the nebulizer and
evaporation of droplets leading to a concentration effect within both the
droplets and the nebulizer solution have all been shown to play a part in
denaturation. Specifically, shear forces encountered during air-j e t
nebulization may irreversibly destabilize certain proteins (Charm and
Wong, 1970) . Niven and coworkers showed that, lactate dehydrogenase and
recombinant human granulocyte colony stimulating factor (rhG-CSF)
irreversibly lost 20% and 30-40% of their initial activities, respectively, after
10 min air jet nebulization; they also reported that this loss of activity was
affected by the applied nebulization air pressure, time of nebulization and
initial reservoir volume, with greater losses occurring at lower reservoir

� 20 � � bI>
! 15
I " (..) .... 5
e: (..)
� o INITIAL SOLUTION NEBULIZER RESERVOIR SPRAY DRYING SPRAY DRYING & STORAGE
mI ENZYME
I2l ENzym+LACTOSE
IZI ENZYME+TREHALOSE � ENzym+SUCROSE
II ENZYME+MANNITOL
Figure V,5 Specific activities of bacterial alkaline phosphatase (BAP) in initial solution and following nebulization, spray drying with electrostatic collection and storage of dried solids at 23% RH and 25 °C for 14 days , For " INITIAL SOLUTION" and "NEBULIZER RESERVOIR" plotted values are mean, n=6 (error bars are SD), For "SPRAY DRYING" and "SPRAY DRYING AND STORAGE" plotted values are mean, n=3 (error bars are experimental ranges) , �

137
Figure V.6 A cartoon representation of the monomer of bacterial alkaline phosphatase enzyme. The three functional metal sites are shown as black circles ; the two larger circles representing Zn+2 ions and the smaller circle representing Mg+ 2 ion . The numbers indicate N t ermini of the corresponding helices (Adapted from Sowadski et aI . , J. Mol. BioI. , 1 86 (1985) 416-422).
138
Figure V. 7 Scanning electron micrograph (SEM) of bacterial alkaline phosphatase (BAP) spray dried with buffer salts alone and electrostatically collected at 63 °C for 15 min. Concentration of solution nebulized was -0 . 1% w/v with respect to total solids.

139
Figure V.S Scanning electron micrograph (SEM) of bacterial alkaline phosphatase (BAP) spray dried with lactose and electrostatically collected at 63 °C for 15 min. Concentration of solution nebulized was - 1% w/v with respect to total solids .
140
Figure V.9 Scanning electron micrograph (SEM) of bacterial alkaline phosphatase (BAP) spray dried with trehalose and electrostatically collected at 63 °C for 15 min. Concentration of solution nebulized was -1% w/v with respect to total solids .

141
Figure V. 10 Scanning electron micrograph (SEM) of bacterial alkaline phosphatase (BAP) spray dried with sucrose and electrostatically collected at 63 °C for 15 min. Concentration of solution nebulized was - 1% w/v with respect to total solids.

142
Figure V. l ! Scanning electron micrograph (SEM) of bacterial alkaline phosphatase (BAP) spray dried with mannitol and electrostatically collected at 63 °C for 15 min. Concentration of solution nebulized was -1% w/v with respect to total solids.

143
starting volumes, higher nebulization pressures and longer nebulization
times (Niven et ai . , 1994) . However results are also protein dependent.
Cipolla et ai . , reported that recombinant human deoxyribonuclease
(rhDNase), showed no loss of activity after typical air jet nebulization as
indicated by its activity assay (Cipolla et al. , 1994a).
In the experiments described in this chapter, BAP showed no
appreciable loss of activity in the nebulizer solution at the end of 90 min
nebulization (26 psig and starting reservoir volume = 24 ml) as indicated by
specific activity of solution sampled from the nebulizer reservoir. This
result was despite the doubling of concentration of this solution over the 90
min nebulization period (Table V.4) . The presence of trehalose, sucrose ,
lactose and mannitol furthermore, did not affect the residual activity in
solution at the end of 90 min nebulization (ANOVA, Table V.5 ) and nor was
there any precipitation in these solutions due to the doubling of
concentration in the reservoir solution during the experiment (Table V.4)
Once the atomized droplets come into contact with dilution air,
evaporation begins from the droplet surface. This process alone causes a
reduced droplet surface temperature, although these temperatures can be
approximated by the wet-bulb temperature of the drying air (Masters, 1991) .
This must be less than the recorded dry-bulb temperature (measured as 63 °C in these experiments , by the thermometer placed inside the drying
chamber C; Figure V. 1 ) . However the complete process of droplet drying
may be thought of as a two phase process (Daemen and van der Stege, 1982) .

144
In the first phase of drying, the wet-bulb temperature at the droplet surface
lasts as long as the water activity at the surface of the droplet approaches
that of free water. This phase must be followed by an increasing droplet
surface temperature, above the wet-bulb temperature on account of
decreasing water activity due to dissolved solids at the droplet-air interface.
Heat induced enzyme damage is expected mainly during the second phase
of the process and is determined by a combination of drying time ,
temperature, moisture content of the particle and thermolability of the
solids content (Daemen and van der Stege, 1982).
Aerosols exiting the primary drying chamber (B, Figure V. l ) of the
nebulizer were introduced into the secondary drying chamber (C , Figure
V. l) , to which heated air at a targeted air temperature of 63 °C (dry-bulb
temperature) was supplied, in a co-current fashion (See Section V.b. l ) . In
the co-current mode of spray drying, atomized droplets and the drying air
pass in the same direction (Masters , 1991a) . Under these conditions , the
hottest drying air contacts droplets at their maximum moisture content.
The rapid evaporation that follows assures low droplet temperatures and is
most suitable for drying of thermolabile materials (Masters, 199 1) . A drying
air temperature of 63 °C was selected based on the initial lactose/disodium
fluorescein system validation experiments, which resulted in the collection
of dried particles in the precipitator column (Chapter IV) . Scanning
electron microscopy (SEM) of spray dried BAP and BAP-sugar mixtures are
shown in Figure V. 7 (BAP with buffer salts alone) , Figure V.8 ( BAP with

145
lactose), Figure V.9 (BAP with trehalose), Figure V. 10 (BAP with sucrose)
and Figure V. l l (BAP with mannitol) . The drying temperature used in the
secondary dryer (C, Figure V. 1) was 63 °C and electrostatic collection time
was 15 min. When enzyme was spray dried with buffer salts alone (Figure
V.7) , the particles were apparently dry and the particle size smaller than
when compared to products resulting from co-drying with sugars (Figures
V. 8 - V. l l) ; this due to lower nebulized solids concentration in these
solutions (0 . 1% w/v compared to 1% w/v in solutions with sugars). However,
in all cases, the product appeared to be in the form of dry, spherical,
discrete particles which were smaller than 5 11m in diameter (Figures V.7 -
V. 1 1) . Those products containing spray dried sugars often showed smooth
spherical particles typical of many spray-dried products (Masters , 1991a) .
When trehalose and sucrose were included in the nebulizer solution,
the activities retained in the dried, reconstituted solutions were 87% and
83% of their initial solution activities, respectively. Trehalose and sucrose
appeared to offer some protection to the drying-induced loss of BAP activity
although the small increases in specific activity over the sugar free state
were statistically insignificant (ANOVA, Table V.5) . Hence the effect of
each of the four sugars on spray dried BAP was statistically
indistinguishable. Lactose certainly showed no protective effect on BAP
during drying and collection, under the conditions studied. It remains
possible that some degradation shown in the presence of lactose, was due to
reaction with the aldehyde of lactose in the ring opened, reducing form

146
(Chapter III) . When mannitol was included in the solution, a significantly
greater loss of activity (42%) was observed compared to the 23% loss when
the enzyme was spray-dried alone, but again this effect was not statistically
significant for the reasons described above (Table V.5) . In independent
experiments described earlier (Chapter I I I ) the four sugars were spray
dried in a bench top spray dryer and their physical properties characterized
with respect to crystallinity changes and moisture uptake . These
experiments are described in detail in Chapter III . Only lactose, trehalose
and sucrose were obtained in the glassy amorphous state when spray dried
in the bench top spray dryer (Yamato ADL-3 1 , Yamato Scientific America,
Inc . , Orangeburg, NY), whereas mannitol was crystalline after spray
drying, as shown by differential scanning calorimetry (DSC) and X-ray
powder diffraction CXRPD) . Dry product visualization under crossed polars
for the mannitol-BAP mixture confirmed the presence of crystallites in the
particulates in this case (birefringence was observed). This indicated that
this sugar's tendency to crystallize during drying could be positively
harmful to the BAP's enzyme activity possibly because of protein shear
during crystal nucleation and growth.
Sugars have been used for a long time in the stabilization of biological
macromolecules, in solution and dried solid state . It is well established that
sugars stabilize proteins in solution by means of preferential hydration
mechanism proposed by Timasheff (Arakawa and Timasheff, 1982 ) .
However, the ability of sugars to protect against dehydration induced
147
destabilization, during freeze drying (Pikal, 1990; Prestrelski et ai . , 1993),
air drying (Carpenter et ai . , 1987) and spray-drying (Labrude et ai . , 1989;
Broadhead et ai . , 1993) , is not very well understood. Two hypotheses have
been proposed, to explain the dehydration induced protection of proteins by
sugars. In the water replacement hypothesis, it is theorized that the water
removed by dehydration is replaced by sugar molecules, which hydrogen
bond to the protein during the end stages of drying and stabilize the native
conformation (Carpenter and Crowe, 1989) . However sugars with similar
hydrogen bonding capacities have widely varying protein stabilization
effects (Levine and Slade, 1992) . An alternate hypothesis based on the
materials science approach of glass transition has been proposed (Franks
et ai . , 1991 ; Green and Angell, 1989). According to this hypothesis , when a
solution of protein-sugar is dried, at the end stage of drying, the protein is
entrapped in an amorphous glassy matrix of the sugar, thereby reducing
molecular motions and hence destabilization effects during dehydration
and long term storage (Franks et ai . , 199 1 ) . Such a glass is physically
metastable at temperatures below its glass transition temperature (Tg) .
However, at temperatures greater than Tg, molecular mobility increases,
leading to physical instability such as recrystallization and an increased
chance of degradative chemical reactions (Ahlneck and Zografi, 1988). It is
also well established that T g of a glass is dependent on its residual moisture
content, with increased moisture content leading to a depression of the T g,
since water acts as plasticizer of amorphous materials (RODS and Karel,

148
1991) . If Tg is decreased below the storage temperature, physical and
chemical stability can be expected to occur in the solid state . Although, this
hypothesis does not fully explain the effect of all excipients on stabilizing
proteins, it partially explains the relative capacity of certain sugars to
stabilize proteins during dehydration. In these experiments with BAP dried
in the presence and absence of sugars, it was not statistically possible to
rank the sugars which form amorphous glasses in terms of their protective
effects on this enzyme's activity. For this reason, it was not possible to
speculate further on the importance of these glass transition temperature
values on BAP stability during the drying and collection phase; and further
to use the value of T g as a means of selecting a sugar as a protein stabilizer
during spray drying.
V.cA Spray drying and electrostatic collection of bovine intestinal alkaline
phosphatase (BIAP)
A second alkaline phosphatase, from a different source, structure and
purity, was subjected to a similar series of experiments to determine
whether BAP results were typical or unique of this class of enzyme. Bovine
intestinal alkaline phosphatase (BIAP) is a dimeric metallo-glycoprotein
(- 12% carbohydrate content by weight) of molecular weight 138000 Daitons,
composed of two monomers of 69000 each (Coleman and Gettins, 1983 ;
Fosset et ai . , 1974) . The three dimensional structure of BIAP has not been
reported to date . However, a partial amino acid sequence analysis revealed

149
that it bears close sequence homology to BAP, especially with regards to the
three amino acids (Asp-Ser-Ala) that make up the active site on the
monomer (Coleman and Gettins, 1983) . In spite of such structural
similarities, resistance of BIAP to thermal degradation has been reported
to be much poorer than that of the bacterial enzyme. Denaturation
temperatures for the bovine enzyme have been reported to occur at -65 ac.
In experiments with BIAP the total protein content was - 10% (25 mg
in 250 mg total solids for solutions coded as BIAPL, BIAPT, BIAPS and
BIAPM for solutions containing lactose, trehalose, sucrose and mannitol;
Table V. l) in a 1% w/v solution with respect to total non-volatile solids; this
was because BIAP had a much lower specific activity (and possible purity)
than BAP (BAP = 15 . 7 Unitsil-lg BSAE and BIAP = 8 .8 Units/Ilg BSAE) .
Buffer components and sugar constituted the remaining 2 2 % and 6 8 % of
the solids respectively (Table V. l) . In sugar free experiments total solids
concentration in the nebulizer solution was -0 .3% w/v (solution coded as
B IAP; Table V. l ) , of which 32% was protein and 68% buffer salts .
Nebulization and droplet drying and particulate collection conditions were
used, which were identical to those used for BAP. Results for specific
activity of BlAP are summarized in Table V.6 and Figure V. 12 . Protein
containing sugar free solutions (BlAP; Table V. l ) showed a specific activity
of 8 .8 Units/Ilg BSAE . This enzyme activity in solution was not affected by
the addition of any of the four sugars, lactose, trehalose, sucrose and
mannitol, and/or air-jet nebulization at 26 psig for 90 min, with an initial
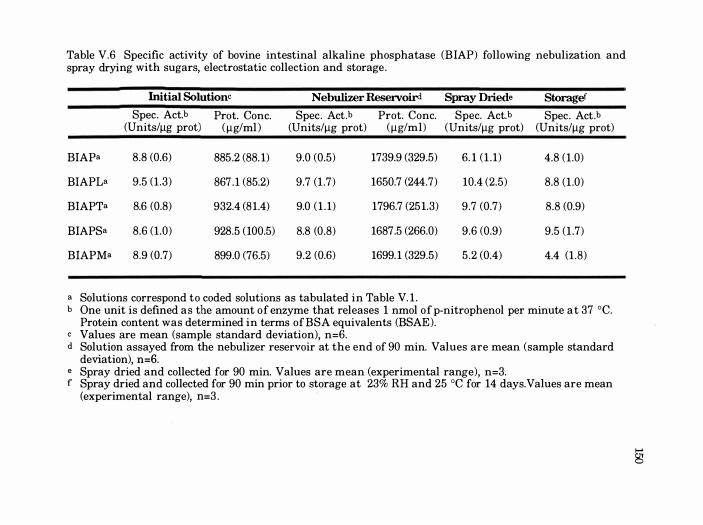
Table V.6 Specific activity of bovine intestinal alkaline phosphatase (BIAP) following nebulization and spray drying with sugars, electrostatic collection and storage .
Initial Solutionc Nebulizer Reservoir<! Spray Driede Storagef
Spec. Act.b Prot. Conc. Spec . Act .b Prot. Conc. Spec. Act.b Spec. Act .b (Units/Ilg prot) ( Ilg/ml ) (Units/Ilg prot) (Ilg/ml) (Units/Ilg prot) (Units/Ilg prot)
BIApa 8.8 (0.6) 885 .2 (88. 1) 9.0 (0.5) 1739.9 (329.5) 6. 1 ( 1 . 1) 4.8 ( 1 .0)
BIAPLa 9.5 (1 .3) 867 . 1 (85.2) 9.7 (1 .7) 1650.7 (244.7) 10.4 (2.5) 8.8 (1 .0)
BIAPTa 8.6 (0.8) 932.4 (81.4) 9.0 ( 1 . 1) 1796.7 (251.3) 9 .7 (0.7) 8 .8 (0.9)
BIAPSa 8.6 (1 .0) 928.5 ( 100.5) 8.8 (0 .8) 1687.5 (266.0) 9.6 (0.9) 9.5 (1 .7)
BIAPMa 8.9 (0.7) 899.0 (76.5) 9.2 (0.6) 1699. 1 (329.5) 5 .2 (0.4) 4.4 (1 .8)
a Solutions correspond to coded solutions as tabulated in Table V. 1 . b One unit is defined as the amount of enzyme that releases 1 nmol of p-nitrophenol per minute at 37 °C.
Protein content was determined in terms of BSA equivalents (BSAE). c Values are mean (sample standard deviation), n=6. d Solution assayed from the nebulizer reservoir at the end of 90 min. Values are mean (sample standard
deviation), n=6. e Spray dried and collected for 90 min. Values are mean (experimental range), n=3.
Spray dried and collected for 90 min prior to storage at 23% RH and 25 °C for 14 days.Values are mean (experimental range), n=3 .
§

151 Table V.7 Summary of two way analysis of variance (ANOVA)a results for enzyme specific activities of bovine intestinal alkaline phosphatase (BIAP) .
Source of Sum of Degrees of variation squares freedom
Main Effects SOLNb 93.69 4 CONDe 39.95 3
Interaction COND . SOLN 91.78 12
Residual 61.36 70
Total 243.71 89
a The statistical model tested was:
Mean F-ratio Significance S9uare level
23.42 26.72 p < 0.05 13.32 15. 19 P < 0.05
7.65 8 .73 p < 0.05
0.88
Xij = Jl + CONDi + SOLNj + (CONDi . SOLNj) + Eij and is described in
Section V.b.4 (a = 0 .05). b Five levels of solution effect (SOLN) were tested; BIAP, BIAPL, B IAPT,
BIAPS and BIAPM. Four levels of experimental condition effect (COND) were tested; initial solution, nebulizer reservoir solution, spray dried and spray dried and stored at 23 %RH and 25 °C for 14 days .

Table V.8 Summary of significance levels for individual follow up one way analyses of variance (ANOVA)a for specific activities of bovine intestinal alkaline phosphatase (BIAP) .
Source of COND=Intial COND=Nebulizer variation solution Reservoir
Between (SOLNj)b NSd NSd
COND=Spray Dried
p < 0.05
COND=Spray dried & stored
p < 0.05
Source of variation
SOLN=BIAP SOLN=BIAPL SOLN=BIAPT SOLN=BIAPS SOLN=BIAPM
Between (CONDi)c p < 0 .05 NSd NSd NSd
a All statistical analysis was performed at a = 0 .05 b SOLNj = Formulation effect; j = BIAP, BIAPL, BIAPT, BIAPS or BIAPM.
p < 0.05
c CONDi = Experimental condition effect; i = Intial solution, nebulizer reservoir, spray dried and spray dried and stored.
d No significant difference .
§
153
reservoir volume of 24 ml (Table V.8 ) . At end of 90 min nebulization
however a frothy solution remained in the nebulizer reservoir, probably
because of surface activity of the protein after its concentration had doubled
during 90 min of nebulization (Table V.6).
Aerosols of BIAP with and without lactose, trehalose, sucrose and
mannitol were dried and electrostatically collected using the apparatus
shown in Figure V. l . Dried aerosols collected on the glass collection
surface inside the precipitation column 0, Figure V. 1) , were rinsed with 10
mM Tris buffer pH 8 .0 . Reconstituted solutions were appropriately diluted
and analyzed for protein content and enzyme activity.
In case of BIAP spray dried in the absence of added sugar the dried
and reconstituted solution showed a similar drop in specific activity to that
seen with BAP. Thus an average of 6 . 1 Units/Ilg BSAE was recovered, a
3 1% loss of activity compared to the initial solution (protein content
determination was probably unaffected by processing as discussed in
Sections V.c. 1 and V.c .2) . This increased loss of BIAP activity may be due to
its lower thermal denaturation temperature (-65 °C) compared to BAP (96
DC) . Hence, at the drying temperature of 63 °C used in this study, a greater
fraction of BIAP may be expected to be in the denatured state compared to
BAP. However, in the presence of lactose, trehalose or sucrose, activity was
completely retained when BIAP was spray-dried, collected electrostatically
and subsequently reconstituted with Tris buffer pH 8 .0 (Table V.6) . Similar
to BAP, and probably for similar reasons, spray drying BIAP with mannitol

15
� � III> � � 2-
� t,) < t,) ...
f:j t,) � rn
INITIAL SOLUTION NEBULIZER RESERVOIR SPRAY DRYING SPRAY DRYING & STORAGE
• ENZYME
ILl ENZ¥ME+LACTOSE
!ill ENZYME+TREHALOSE I§I ENZ¥ME+SUCROSE
III ENZYME+MANNITOL
Figure V. 12 Specific activities of bovine intestinal alkaline phosphatase (BIAP) in initial solution and following nebulization, spray drying with electrostatic collection and storage of dried solids at 23% RH and 25 °C for 14 days . For " INITIAL SOLUTION" and "NEBULIZER RESERVOIR" plotted values are mean, n=6 (error bars are SD). For "SPRAY DRYING" and "SPRAY DRYING AND STORAGE" plotted values are mean, n=3 (error bars are experimental ranges). �

155
resulted in a 42% loss of initial activity, a result which indicated
significantly greater degradation than when BlAP was dried in the absence
of sugar (ANOVA, individual comparisons by Scheffe ' s multiple
comparison test, p < 0 .05) . Once more, mannitol co-dried BlAP showed the
presence of crystallization when observed under crossed polars
(birefringence) . It was not possible however, to discriminate statistically
between the protective effects of trehalose, sucrose and lactose, even though
on average , lactose appeared to enable or even cause some B IAP
degradation.
In independent experiments described in Chapter I I I , spray dried
lactose, sucrose and trehalose were amorphous and spray dried mannitol
was crystalline (Chapter Ill ) . It was impossible in these experiments,
where product yields were small to fully characterize the spray dried
particulates as well as determining protein contents and activities . It
seems reasonable however that during nebulization and electrostati c
collection i n these experiments, similar physical forms o f each sugar was
formed, although conditions employed for drying were different from those
using the Yamato spray dryer (as described in Chapter III ) . Admixture of
buffer salts and proteins to mannitol probably reduced the degree of that
sugar's overall crystallization but did not prevent it entirely (birefringence
under cross polars) .
Some of the results presented above may be confounded by the
presence of altered buffer (Tris) components in the dried and reconstituted
156
products . This because increasing concentration of Tris has been shown to
increase the maximal activity of alkaline phosphatase (Chappelet-Tordo et
aI . , 1974). However, such effects have been reported to become significant
only at high concentrations of Tris (molar range) and, thus, may not be a
factor in these experiments. These results with BAP and BIAP seem to
support the hypothesis, that formation of an amorphous glassy matrix of
the sugar was a prerequisite for offering protein protection during spray
drying even though, in the case of some fairly stable proteins (BAP in this
case) no statistically proven protection was afforded by the addition of a
glass-forming sugar (trehalose and sucrose; Table V.4) . Some non-specific
bonding between protein and sugar in the dried mixture may also have
contributed to the stabilization, as previously reported (Carpenter and
Crowe, 1989), but this was not tested in this study. Spray dried lactose,
sucrose and trehalose showed distinctly different glass transition
temperature s (T g) of 1 17 °C, 75 °C and 120 °C respectively, in their
completely dry state, as determined by crimped pan DSC (Chapter I I I ) . It
was not possible to differentiate between glass-forming sugars and the
protection they offered in terms of their quoted Tg values. This was due to
several confounding factors such as residual moisture content of the dried
solids, thermolability of the protein used and the sensitivity of the assay to
show differences and temperature of drying. The crystallization of
mannitol along with the protein during the drying process had a positively
harmful effect on protein activity and thus structure in both cases. Such a

157
Figure V. 13 Molecular structures of sugars used in this investigation. Ring structures are numbered with and without primes ( , ) , only for convenient textual reference . The structure of f3-lactose is shown because a
mixture of the a and 13 isomers forms quite rapidly in solution, following
dissolution of a-lactose monohydrate in water.
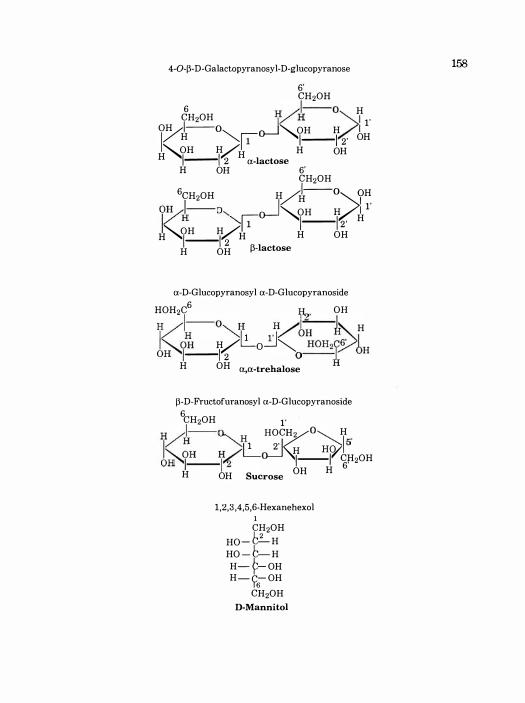
4-O-p-D-Galactopyranosyl-D-glucopyranose
6' CH20H
6 H )--0 H CH20H 1/ H �I l'
OH 1--0 o---J OH H I I/H �f1 �1-- 1 2 ' OH �OH H/H H OH H 1--- 1 2 a-lactose
H OH 6' CH20H
6CH20H H/k--O>.?H
01,H )-0........ o-J"'-..OH H I l'
/ H
........ it 1-- 1 2 ' H
H"'-..OH H/H H OH 1-- 1 2 H OH p-lactose
a-D-Glucopyranosyl a-D-Glucopyranoside
HOH2C6 ?" OH
H/I-o�H H/,I"'-�" H I�� H/�O�� O�OH2y9b OH 1-- 1 2 O--A H
H OH a,a-trehalose
P-D-Fructofuranosyl a-D-Glucopyranoside 6 CH20H l'
H )--0 ........ H
HOC�2 0, HI ' / H -.....: 1 2' , 5 I" OH H /L� HI�lo/CH20H OH "'1--1"2 6' H OH Sucrose
OH H
1,2,3 ,4,5,6-Hexanehexol 1 CH20H
HO - c:...::H HO - C-H
H- P- OH H - ys OH
CH20H
D-Mannitol
158

159
decreased protein stabilizing effect has also been reported for
cryoprotectants due to their crystallization in freeze dried solids ( Izutsu et
aI . , 1993) and thus, it is tempting to speculate that similar protein damage
mechanism (lzutsu et aI . , 1993) was in play in this case also.
V.c.5 Stability of dried protein and protein-sugar mixtures
Excipients like sugars, which stabilize proteins during dehydration,
are also believed to offer protection to proteins during long term storage in
the solid state (Tarelli and Wood, 198 1 ; Ford and Dawson, 1993 ; Broadhead
et aI . , 1994) . The protective ability of sugars appears to depend on factors
such as, the chemical nature of the sugar, the residual moisture content of
the sugar-protein molecular mixture and the temperature and relative
humidity of storage (Hageman, 1988; Tarelli et aI . , 1987 ; Pristoupil et aI . ,
1985; Lea and Hannan, 1949).
Both BAP and BlAP were spray dried in buffered solutions with or
without one of the four sugars, as described in Section V.b. I . Protein and
sugar concentrations of the nebulizer solutions were kept at the same levels
as those described in Section V.c.3 . Dried aerosols were collected on glass
collection tubes introduced inside the precipitator column (I , Figure V. 1 ) .
The dry particle coated glass tubes were stored at 25 °C and 23% RH for 14
days, as described in Section V.b .2 , prior to reassay. These conditions were
chosen expressly because none of these sugars showed any changes in their
physical characteristics over 30 days at this temperature and humidity
100
(Chapter III ) ; trehalose, sucrose and lactose became crystalline when
stored at RH > 23% (Figures IIL2 and I IL3 , Chapter II I ) . Results for
enzyme activity after 14 days storage are shown for BAP and BIAP, in the
right hand columns of Table V.4 and Table V.6 respectively. BAP spray
dried in the presence of buffer salts alone and stored at 25 °C and 23% RH
for 14 days, retained only 67% of the initial solution activity, which
represented a further loss of about 10% activity, compared to the spray dried
material without storage . However, this difference was not statistically
significant (Table V.5 ). No clear protection was offered by any of the sugars
to this loss of activity on solid-state storage. Further losses in activity after
storage of BAP dried with the four sugars, ranged from 1% (mannitol) to
10% (sucrose) compared to the spray dried material without storage (Table
V.4) . Surprisingly, mannitol showed the least change in terms of absolute
degradation [(Unitslllg BSAE)/14 days] while trehalose appeared to offer no
protection in the solid state even though it protected BAP during drying and
collection. However, none of the four sugars could be statistically
distinguished with respect to their protective effect on the enzyme during
storage .
BIAP spray dried with buffer salts alone and stored at 25 °C and 23%
RH for 14 days showed a further loss of about 15% activity compared to the
spray dried material tested prior to storage . However, individual
comparisons by Scheffe's test showed no significant differences . With BIAP
however, the three glass forming sugars, lactose, sucrose and trehalose

161
offered statistically equivalent protection both during drying and storage
(Table V.8) . BIAP dried with mannitol showed an activity of 4.4 Units/Ilg
BSAE on storage, but even this was not statistically different from the
activity of spray dried BIAP-mannitol without storage .
Overall and statistically, BIAP activity loss during storage in the solid
state did not occur provided trehalose, sucrose, lactose or mannitol were
used in the spray drying process. BIAP-mannitol lost substantial activity on
drying, but this residual activity was largely retained on further storage . It
is possible, of course, that these conclusions may have been different if the
storage duration and the number of samples had been increased.
Structures of the sugars used in this study are given in Figure V. 12 .
Mannitol is a non-reducing sugar alcohol, lactose, sucrose and trehalose
are disaccharides . Sucrose and trehalose are non-reducing sugars while
lactose is a reducing sugar (Tarelli and Wood, 198 1 ) . It has been widely
reported that reducing sugars like lactose may interact with proteins via
the Maillard reaction, whereby the open ring aldehyde form of the sugar
undergoes condensation with free amino groups on the protein to form
Schiff-bases which eventually undergo Amadori rearrangement. This
leads to product discoloration and, loss of activity of the protein (Ford and
Dawson, 1993; Hageman, 1988; Tarelli and Wood, 198 1) . There was no
evidence of such reactions occurring in these studies. Non-reducing sugars
like sucrose and trehalose may be potentially reducing, after breakage of
the inter-glycosidic linkage . However, for many disaccharides such

162
breakage occurs to a significant extent only in solutions of extreme pH or
freeze dried solids kept at high temperatures (Tarelli and Wood, 198 1 ) .
Moreover, relative stability of the inter-glycosidic bond for different
disaccharides varies widely. Tarelli and Wood have shown that in 0 .05 M
sodium phosphate buffer, pH 7, a greater percentage of sucrose was lost
compared to trehalose, after heating at 100 °C for 1 7 hours, indicating the
intrinsic stability of trehalose's inter-glycosidic bond compared to that of
sucrose (Tarelli and Wood, 198 1) . Pazur, quotes activation energies for acid
hydrolysis of the glycosidic bond of sucrose, lactose and trehalose as 25830
cal/mole, 26900 cal/mole and 40 180 cal/mole respectively, indicating the
relative stability for the disaccharide sugars, as trehalose>lactose>sucrose
(Pazur, 1970 ) . Pharmaceutically, and in the solid state in the se
investigations, it is unlikely that the above discussion is even relevant.
Nevertheless, lactose remains as a reducing sugar in the disaccharide
form, a fact which also enables it to mutarotate via the aldehyde
intermediate; the spray dried product must therefore contain a mixture of
the two anomeric forms, a-lactose and j3 -lactose as shown in Figure V. U
(Pigman and Anet, 1972).
Similar to the discussion in Chapter III , the likely content of j3-lactose
in the lactose containing protein mixtures, was 5 - 7% . Clearly it is
impossible to say, from these investigations, whether the a/j3 lactose ratio
may affect lactose's ability to protect BAP or BIAP during drying, collection
163
or storage, except to note that no real studies have been reported to date,
which test the importance of sugar stereochemistry on protein
protection.
Under storage conditions used in this study (25 DC and 23% RH for 14
days), no substantial degradative reactions between BAP or BIAP and the
sugars occurred. Earlier reports of Maillard reactions between reducing
sugars like lactose and proteins in the solid state involved experiments
which were performed under more stressful conditions of temperature,
relative humidity and duration of storage (Ford and Dawson, 1992; Tarelli
and Wood, 1989; Lea and Hannan, 1949). Ford and Dawson studied the
activity of bovine intestinal alkaline phosphatase-sugar mixtures freeze
dried and stored at different temperatures and time periods (Ford and
Dawson, 1992). They showed that alkaline phosphatase, formulated with
lactose and trehalose, retained maximal activity after storage for 12 weeks
at -20 DC, 20 DC, 37 DC and 45 DC. Only at 56 DC, was there a considerable loss
of activity, with a more rapid decline in the lactose formulation (7 - 14 days)
compared to the trehalose formulation (21 - 42 days) . Trehalose formulation
was predicted to retain 42% of its initial activity even after storage at 3 7 °C
for a year (Ford and Dawson, 1992).
V.d SUMMARY AND CONCLUSIONS
A particle collection apparatus built and characterized previously
(Chapter IV), was used to review protein activity following spray drying
164
and electrostatic precipitation. Bacterial alkaline phosphatase (BAP) and
bovine intestinal alkaline phosphatase (BIAP) were selected as model
proteins to study the effect of nebulization and drying on their residual
activity. Four sugars, lactose, trehalose, sucrose and mannitol were co
dried with the enzymes, and form molecular mixtures in the dry state, thus
to look at their affect on preventing enzyme activity loss on spray drying and
storage of sugar-protein mixtures .
BAP lost 23% of its original activity following spray drying and
electrostatic collection, when dried from sugar free solutions . Although
lactose, sucrose and trehalose all appeared to prevent of this loss , the
results were not statistically different from the sugar-free result. Mannitol,
which was crystalline on spray drying alone and in admixture with the
protein, also failed to protect BAP. This result however, was also not
significantly different from other sugars.
The second enzyme, BIAP, lost 3 1% of its original activity when spray
dried from sugar-free solutions. Lactose, trehalose and sucrose offered
complete protection on spray drying and collection (no significant difference
in activity from original solution). However, these three sugars were
indistinguishable with respect to their stabilizing capacity for BIAP drying.
BIAP dried with mannitol showed an activity loss similar to the sugar free
solution, indicating that mannitol failed to offer protection to the enzyme .
Both enzymes failed to lose any further activity on storage of the dried
solids at 23 %RH and 25 °C for 14 days (no significant difference between
165
material prior to storage and storage at 23% RH and 25 °C). Storage results
were not different from their respective initial spray dried counterparts , for
both the enzymes in the presence or absence of the four sugars . The
reported degradative chemical reactions between reducing sugars like
lactose and proteins in the solid state were not evident under these storage
conditions and degradation reactions may only become relevant, under
more extreme conditions of temperature and relative humidity.
Lactose, trehalose and sucrose were obtained as amorphous solids on
spray drying and remained in this physical form when stored at 23% RH
and 25 °C for 30 days (Chapter III ) . In contrast mannitol was crystalline
on spray drying. Moreover, enzyme-mannitol solutions spray dried and
electrostatically collected, revealed crystallization, when observed with a
microscope under cross polars (birefringence) . It appeared that formation
of the amorphous glassy state may be a prerequisite for stabilization of
proteins like BIAP during spray drying.
The results suggested that it was feasible to produce small particles of
active protein when spray dried with glass forming sugars like lactose,
trehalose and sucrose. However, the final performance of the dry powder as
an aerosol must also depend on physical and chemical stability of the dried
mixtures and the ease of their dispersion to form respirable clouds.
VI. DETERMINATION OF MOISTURE IN CRYSTALLINE AND SPRAY
DRIED SUGARS USING ISOTHERMAL THERMOGRAVIMETRIC
ANALYSIS (TGA) AND KARL FISCHER (KF) COULOMETRIC
TITRATION
VI. a INTRODUCTION
Determination of moisture is routinely employed in the quality
control of pharmaceutical ingredients. Karl Fischer titration (KF) is the
most commonly used method for routine determination of water in solid,
liquid and gaseous samples (Scholz, 1984). This is believed to be a more
definitive method for water determination than loss-on-drying (LOD)
because LOD results may be confounded by the presence of volatiles other
than water. However, KF requires the extraction of water from the sample
prior to or during titration if it is to produce a reliable result. Water can be
extracted from samples by different methods, like dissolving in anhydrous
solvents such as methanol or formamide and injecting a suitable portion of
the solution into the KF titration vessel. Alternatively, water may be
evaporated in a heating chamber attached to a KF titration vessel which is
sealed to prevent moisture ingress from the atmosphere . Titration may
then be effected specific to the evolved moisture. This technique can be rapid
and useful for materials when moisture is loosely bound to the sample ,
166
167
such as in freeze dried or spray dried materials . However such a method
may not always work well, when bound water (eg. crystalline hydrates) is
being determined, due to the erratic loss of bound water on heating. In this
chapter, the moisture content of crystalline sieve fractions of four different
sugars, lactose, trehalose, sucrose and mannitol, and their spray dried
forms, was determined using KF coulometric titration. Results were
compared, following sugar dissolution in formamide and KF titration, to
those following heating of each sugar with subsequent titration of the
evolved water in the collection gas passing over the sample. The second
evaporative method was performed in order to validate a third; isothermal
thermogravimetric analysis (TGA). TGA, a micro LOD method which can
be performed quite simply on milligram quantities of sample, is much
more convenient than either KF technique. It requires however, that weight
loss due to heating first be proven to be due to loss of water.
VI.b PRINCIPLE OF COULOMETRIC KARL FISCHER TITRATION
The Karl Fischer reaction can be shown as follows :
12 + S02 + 3Pyridine + CH30H + H20 - - - - - - -> 2Pyridine.HI + Pyridine . H2S04
------------------ ----- Equation VI .b . l
I n coulometric KF titration, iodine that i s used i n the above reaction i s not
added to the reagent (as in volumetric titration mode), but is produced in an
iodide containing solution by anodic oxidation as shown in Equation VI.b.2
(Scholz, 1984)

168
21-1 - 2e --------> Iz ----------------------- Equation VLb_2
When sample is added to the anodic solution (Figure VL l) containing
iodide ion, sulfur dioxide, base (pyridine) and methanol as principal
components, water in the sample reacts with electrolytically generated
iodine (Equation VLb _2) as shown in Equation VLb_ L One mole of iodine
reacts with one mole of water and thus 1 mg of water is equivalent to 10 _ 7 1
coulombs_ Using this relationship, water content i s calculated from the
electricity (coulombs) required for electrolysis (Aquamicron Instruction
Manual, Mitsubishi Kasei Corporation, Tokyo, Japan)_
VI. c MATERIALS AND METHODS
VI.c .l MATERIALS
D-Mannitol, sucrose and a,a-trehalose dihydrate were obtained from
Sigma Chemical Co_ (St. Louis, MO). a-Lactose monohydrate was obtained
from Foremost Ingredient Group (Baraboo, WI) . Karl Fischer reagents
Aquamicron-AS® and Aquamicron-CS® were obtained from C o s a
Instrument Corp . (Norwood, NJ) . K F standards ( Hydranal®-W a t e r
Standard 1 .00; 1 g containing 1 .00 ± 0.03 mg water and Hydranal®-Standard
sodium tartrate dihydrate; water content = 15 .66 ± 0 .05%) manufactured by
Riedel-de Haen (Seelze, Germany) and other chemicals used were obtained
from Fisher Scientific Co. (Raleigh, NC) .

VI.c.2 ME'IHODS
VI.c.2 . 1 Spray drying of sugars
169
A 10% w/v solution of each sugar was spray dried using a Yamato
ADL-31 Mini-Spray Dryer (Yamato Scientific America Inc . , Orangeburg,
NY) as described in Chapter I I I . Collected spray dried sugars were quickly
packed into amber bottles , tightly closed and stored in desiccators,
containing phosphorous pentoxide .
VI.c.2.2 Sieve fractionation of sugars
Two particle size fractions; 44-74 11m ["fine fraction"] and 125-2 12 11m
["coarse fraction"], of each sugar were obtained by sieve fractionation as
described in Chapter III and were retained in tightly closed amber bottles
stored over phosphorous pentoxide .
VI.c.2.3 Thermogravimetric analysis (TGA)
Thermogravimetric analysis (TGA) was performed using TGS2
along with System 4 microprocessor controller (Perkin Elmer, Norwalk,
CT). TGA was performed in triplicate, in the isothermal mode to determine
a time period for complete dehydration of the sugars . Temperatures used
for the isothermal TGA runs, were previously determined using TGA in
the non-isothermal mode (Naini et ai . , submitted 1996) . These were
temperatures corresponding to apparent plateaus in weight loss versus

170
temperature plots. Conditions used for isothermal TGA are shown in Table
VI . l .
VI.c.2.4 Karl Fischer (KF) moisture determination
KF analysis was performed by coulometric titration using a
Mitsubishi Moisture Meter, Model CA-05 attached to VA-05 vaporizer oven
(Mitsubishi Kasei Corp . , Tokyo, Japan) . The schematic diagram of the
moisture meter set up is shown in Figure VI . 1 . Two different methods
based on coulometric KF titration (Method Ic of USP), were employed to
determine moisture content of sugars (USP23/NF18, 1994b).
Method A: Sugars were accurately weighed into glass weigh funnels
(catalogue #14-353B, Fisher Scientific Co. , Raleigh, NC) and introduced into
the sample boat positioned below the sample inlet port (Figure VI . 1 ) .
Sample sizes o f 5 - 1 0 mg were employed throughout. At time zero the
sample boat was slid into the preheated oven connected to KF titration
vessel shown in Figure VI . 1 . Nitrogen (Nitrogen, NF, Airco, Richmond,
VA) dried by passing it over phosphorous pentoxide, at a flow rate of 250
mllmin (adjusted by means of the flow valve, Figure VI . 1 ) was used as the
carrier gas to transfer the evolved moisture , into the titration vessel by
means of a connecting tube . To prevent condensation of the evolved
moisture while being transported into the titration vessel, the tube was
heated to the same temperature as the oven. Oven temperatures for testing
were selected following non isothermal TGA as described earlier. Delay
171
times for titration, determined by isothermal TGA experiments (time to
plateau), were also entered into the program of the moisture meter. The
delay times and temperatures used for different sugars are shown in Table
VI .2 . All reported values are the means of five determinations. Sodium
tartrate dihydrate (Hydranal® ), with a theoretical water content of 15 .66% ±
0.05% (Bryan et aI . , 1976 and Dietrich, 1994) was used as the standard for
Method A.
Method B: Approximately 100 - 500 mg (accurately weighed) of the
sugar was dissolved in 10 ml formamide and 400 III of this solution was
injected into the anodic solution through a septum (Figure VI . 1) , using a
syringe (#1705, Hamilton Co. , Reno, NV) attached to a non sterile, septum
piercing stainless steel needle (Popper & Sons, Inc . , New Hyde Park, NY). The accurate weight of each sample solution inj e cted ( known
concentration) was determined by difference in syringe weight before and
after sample injection and used for moisture content calculation. A blank
formamide injection was performed prior to each sample injection. Blank
moisture content of the solvent was subtracted from the titrated water
content of each sample solution. All reported values are mean of five such
(sample-blank) determinations . A specific gravity of 1 . 129 g/ml at 25 °C
(certificate of actual lot analysis , Fisher Scientific Co . , Raleigh NC) for
formamide was used in the calculation of moisture contents. Hydranal®
Water Standard 1.00 (water content = 1 .00 ± 0 . 03 mg/g) was used as the
standard for Method B and also to check the performance of the moisture

172
meter (Dietrich, 1994) prior to performing all experiments . .
VI.d RESULTS AND DISCUSSION
Results from the isothermal TGA experiments are summarized in
Figures VI .2 - VI .5 and Table Vl. l . Crystalline fractions of sucrose and
mannitol and spray dried mannitol did not show detectable weight loss
using isothermal TGA. All other sugars reached a plateau for weight loss
vs time curves in less than or equal to 10 min. Coarse fractions of trehalose
and lactose (Figures VI . 3 & VI .4) showed a thermal lag during
dehydration, compared to their fine sieve fraction (Naini et aI . , submitted
1996) . Sodium tartrate dihydrate was used as a reference standard for
moisture content determination by Method A. Moisture content of this salt
at the end of a 3 min dehydration time (time to plateau) was in close
agreement with its theoretical water content of 15 .66% (Figure VI .2 & Table
VI . 1) . Based on isothermal TGA data (Figures VI .2 - VI .5) , time periods
required for effecting complete moisture release were determined and listed
in Table VI . 1 along with moisture contents corresponding to weight losses
at these same time points.
Moisture contents determined by the KF technique using Methods A
& B are shown in Table V1 .2 . Delay times (DT) for heating (times in the
oven, prior to titration) for Method A were selected based on isothermal
TGA data for complete moisture release (Table VI . 1 ) . DTs were chosen so
that DT > apparent time to reach a plateau following isothermal TGA

Tubes containing
Magnetic stirrer
� Nitrogen purge
Flow valve
I nt'
--I-v_- - ___ ul __ I�
Display
D O D D D O D D D
Mitsubishi moisture meter
1----+I .. ��Keyboard
Figure VI . l Schematic diagram of the Mitsubishi moisture meter with the attached programmable vaporizer oven used for moisture determinations of sugars by coulometric KF titration. tl ""
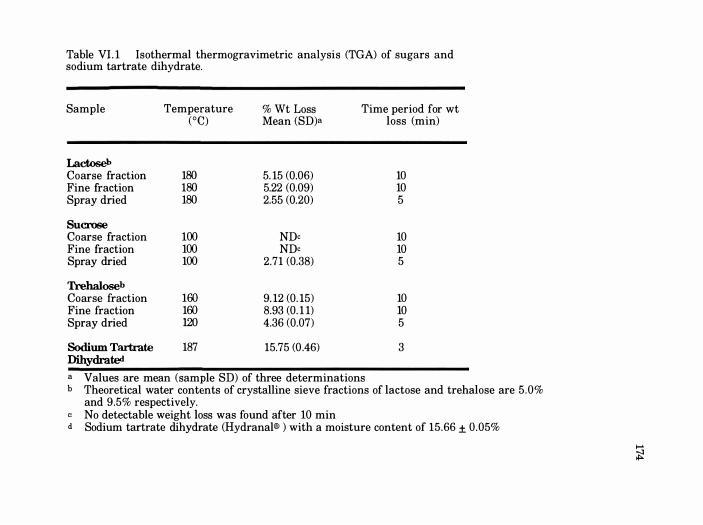
Table VI. 1 Isothermal thermogravimetric analysis (TGA) of sugars and sodium tartrate dihydrate.
Sample Temperature % Wt Loss Time period for wt (0e) Mean (SD)a loss (min)
Lactoseb Coarse fraction 180 5. 15 (0.06) 10 Fine fraction 180 5.22 (0.09) 10 Spray dried 180 2.55 (0.20) 5
Sucrose Coarse fraction 100 NDc 10 Fine fraction 100 NDc 10 Spray dried 100 2.71 (0.38) 5
Trehaloseb Coarse fraction 160 9. 12 (0. 15) 10 Fine fraction 160 8.93 (0. 1 1) 10 Spray dried 120 4.36 (0.07) 5
Sodium. Tartrate 187 15.75 (0 .46) 3 Dihydraf.ed a Values are mean (sample SD) of three determinations b Theoretical water contents of crystalline sieve fractions of lactose and trehalose are 5 .0%
and 9.5% respectively. No detectable weight loss was found after 10 min
d Sodium tartrate dihydrate (Hydranal® ) with a moisture content of 15 .66 ± 0.05%
>-' �

175
under identical conditions. All sieve fractions of sugars used in this study
were shown to be crystalline using X-ray powder diffraction (Naini et aI . ,
submitted 1996). However spray dried lactose, trehalose and sucrose were
shown to be completely amorphous by X-ray powder diffraction. As
expected, longer delay times were required for complete water release from
the crystalline hydrates, whose water was tightly bound compared to the
amorphous spray dried forms with loosely bound water (Zografi, 1988) . For
all materials studied, isothermal TGA results were in close agreement
with water contents obtained from the Method B, KF technique. For sodium
tartrate dihydrate, moisture estimated using Method A (Table VI . 2 ) was
lower than that estimated using isothermal TGA (however the difference
was statistically insignificant; t-test, a = 0 .05 ) and also its theoretical
moisture content of 15 .66%. A similar trend was seen with the crystalline
hydrates of lactose and trehalose. On the other hand, moisture contents of
the spray dried sugars determined using Method A were in close
agreement with those from Method B and also the isothermal TGA data
(Tables VI . 1 and VI .2) . This indicated slight underestimations of moisture
contents when using Method A for bound crystalline water which may be
due to several factors . Obviously, there are differences in the heating
environments between the TGA and the KF ovens . More importantly hot
N2, bubbling through the anodic solution in Method A may carry away both
the moisture and the volatile components of the anodic solution over time.
This appears to be more dramatic with samples containing higher
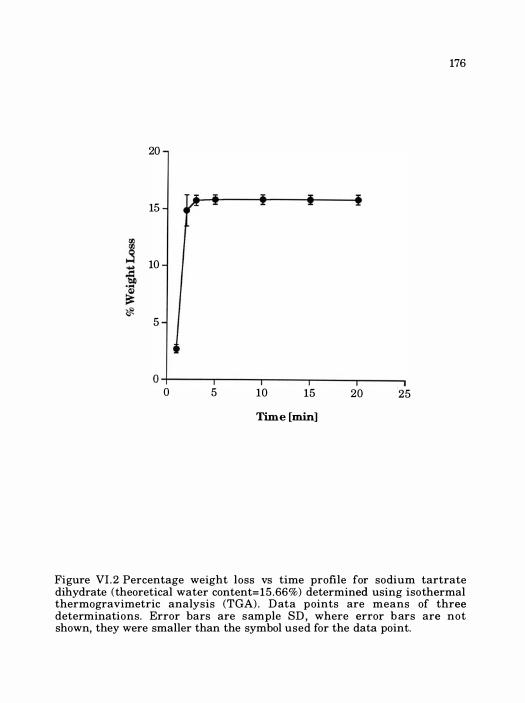
176
20
15
10
5
O �-----r-----.----�----�----� o 5 10 15 20 25
Time [min]
Figure VI .2 Percentage weight loss vs time profile for sodium tartrate dihydrate (theoretical water content=15 .66%) determined using isothermal thermogravimetric analysis (TGA) . D ata points are means of three determinations. Error bars are sample SD , where error b ars are not shown, they were smaller than the symbol used for the data point.

10.0
8 .0
] 6.0
... -Q � 4.0 l§.
2.0
KEY
-- .... -- - Spray dried at 120 oC --+-- Coarse fraction at 160 0C ........•........ Fine fraction at 160 0C
� - - - �- - - - - - - - � - - - - - - - � - - - - - - - - . I I I I I
0.0 -t----,-----r---r----.-----, o 5 10 15 20 25
Time [min]
177
Figure VI .3 Percentage weight loss vs time profiles for crystalline and spray dried trehalose ( theoretical water content for crystalline dihydrate=9.5%) determined using isothermal thermogravimetric analysis (TGA) at the temperatures shown in the key. D ata points are means of three determinations . Error bars are sample SD ; where error bars are not shown, they were smaller than the symbol used for the data point.

178
KEY
- - .... - - - Spray dried at 180 oC
---+-- Coarse fraction at 180 oC ........•........ Fine fraction at 180 oC
�---�--------!r-------�------ -�
1 .
O .U+-----,------,r---,---.-------, o 5 10 15 20 25
Time [min]
Figure VI .4 Percentage weight loss vs time profiles for crystalline and spray dried lactose (theoretical water content for crystalline a-lacto s e monohydrate= 5 . 0 % ) determined using isothermal thermogravimetric analysis (TGA) at the temperatures shown in the key. D ata points are means of three determinations . Error bars are sample SD, where error bars are not shown, they were smaller than the symbol used for the data point .

179
KEY ------ Spray dried at 100 oC - - - - "' - - - - Coarse sieve fraction at 100 0C ········0········ Fine sieve fraction at 100 0C
6 .0
� 4.0
oS .....
! �
r f ! �
l§ 2.0
0 .0 •• ------.-----------.-----------... ------------. i I I i I o 5 10 15 20 25
Time [min]
Figure VI . 5 Percentage weight loss vs time profiles for crystalline and spray dried sucrose determined using isothermal thermogravimetric analysis (TGA) at the temperatures shown in the key. D ata points are means of three determinations . Error bars are sample SD, where error bars are not shown, they were smaller than the symbol used for the data point. The profiles for both the sive fractions of sucrose did not show any weight loss upon TGA.
180
moisture contents (sodium tartrate and trehalose) . There was an apparent
trade off between oven temperature and delay time setting when using
Method A for determining crystalline water contents in that values went up
with increasing temperature and down with increasing delay times . There
was no evidence that the different values shown in Table VI .2 was due to
any method for these sugars, lacking specificity for water.
Formamide has been reported to be a suitable extraction solvent for
determination of hydrate water contents of lactose and maltose, with water
contents closely matching those obtained by a vacuum oven method
(McComb, 1957). Because of its highly polar nature, formamide was a good
solvent for the sugars used in this study. Lactose is capable of existing in
the open ring aldehyde form, which can potentially react with methanol in
the KF medium to form acetal and water (Scholz, 1984) . Water, thus
released from this side reaction could produce erroneously high results
(Scholz, 1984) when determining water content of lactose using KF titration.
The fact that this was not observed in the present study may be due to low
amounts of the open ring form present in the sample solutions of lactose in
formamide . It is also the proposed solvent for moisture determination in
the a-lactose monohydrate monograph in USP23INF 18 ( 1994b) . However the
monograph has since been modified to include a 2 : 1 mixture of methanol
and formamide (USP23INF I8 Supplement 1, Jan 1995) . This was done to
avoid problems with equilibration and stabilization of the KF apparatus
when using formamide as the solvent, because of its decreased conductivity

Table VI.2 Results for moisture contents of different sugars and sodium tartrate dihydrate following Karl Fischer titration by the two different methods.
Sample
Lactoseb Coarse fraction Fine fraction Spray dried Sucrose Coarse fraction Fine fraction Spray dried Trehaloseb Coarse fraction Fine fraction Spray dried Mannitol Coarse fraction Fine fraction Spray dried Standards
Temp of Oven (C)
180 180 180
ill) ill) 100
160 160 1al
ill) ill) ill) 187
Method A
Delay Time (min)f
10 10 5
10 10 5
10 10 5
10 10 10 3
Values (% w/w) are mean (sample SD) of five determinations
Method B
% Moisture % Moisture Mean (SD)a Mean (SD)a
4.91 (0.45) 5.02 (0.09) 4.98 (0. 19) 5.07 (0.79) 2.41 (0.03) 2.37 (0.08)
NDc 0 . 10 (0.09) NDc 0.03 (0.06)
2.38 (0.32) 2 .46 (0. 10)
8 .55 (0. 3 1) 8.94 (0. 17) 8.34 (0.06) 8.35 (0. 1 1) 3.96 (0.08) 4.24 (0.23)
NDc 0.22 (0.55) NDc 0.02 (0.06) NDc 0.46 (0.34)
14.98 (0.56)<1 0. 10 1 (0.003)c
Theoretical water contents of crystalline sieve fractions of lactose and trehalose are 5 .0% and 9.5% respectively No detectable moisture was recorded after a 10 minute delay titration.
d Sodium tartrate dihydrate (Hydranal®) with a moisture content of 15.66 ± 0.05% Hydranal® Check-Solution 1.00 with stated moisture content of 1 .003 1lg/mg (SD = 0.002 mg)
Delay time was the time for which the sample was heated and the vapor collected in the titration vessel , prior to coulometric titration for water.
� ......
182
(Chowhan et aI . , 1994).
Method B using formamide as the extraction solvent gave reliable
estimates for moisture contents with less variability than Method A (Table
VI . 2 ) . Although, formamide has been implicated in influencing the
stoichiometry of the KF reaction (Chowhan et aI . , 1994), this was not found
to be a problem in our experience with moisture determination for any of
these sugars.
Although, coulometric titration can detect very small amounts of
water (sample moisture contents of 0 . 1 - 0 .000 1%), it failed to give reliable
estimates for crystalline sucrose and mannitol samples, whose moisture
estimates using Method B were statistically indistinguishable from the
formamide blank (Table VI.2 ; t-test, a = 0.05) .
VI.e SUMMARY AND CONCLUSIONS
I sothermal TGA gave quick and reliable estimates for moisture
content in each of the sugars studied. However, it was necessary to
establish that the weight loss recorded following TGA was due to moisture
using an independent method such as KF titration. Two adaptations of the
coulometric KF technique were employed to determine total water contents
of four sugars in their crystalline and spray dried forms. Method A, using
the evaporative technique gave good estimates for amorphous sugars whose
water was loosely bound. However, its suitability for crystalline samples
with high moisture contents was questionable. Method B, using formamide

183
as extraction solvent, although a labor intensive technique was a practical
way of determining the absolute moisture contents of all the sugars . Once
the water content was established using Method B, isothermal TGA may be
used for routine determination of moisture contents using milligram
quantities of sugar sample.

VII. DETERMINATION OF TOTAL PROTEIN CONTENT AND
ALKALINE PHOSPHATASE ENZY"ME ACTIVITY IN SOLUTION
VIL a INTRODUCTION
This appendix describes the protein and enzyme assays used to
determine specific activities of bacterial (BAP) and bovine intestinal (BIAP)
alkaline phosphatase reported in Chapter V. Protein content was assayed
using the method of Bradford (Bradford, 1976). It is based on the observation
that Coomassie Brilliant Blue G-250 exists in two different color forms, red
and blue. The red form is converted to the blue form upon binding to
protein, and since the protein-dye complex has a high extinction coefficient,
this assay can be used to detect microgram quantities in sample solutions
(Bradford, 1976). Also it is not prone to interference from carbohydrates,
like the more traditionally used Lowry assay (Bradford, 1976) .
Enzyme activity was determined from the initial reaction rates of
alkaline phosphatase catalyzed hydrolysis of p-nitrophenol phosphate to
yield p-nitrophenol (Torriani, 1968 ).
VII.h MATERIALS AND METHODS
Bacterial ( E . coli ) alkaline phosphatase (Product #P425 2 , Lot
#lO lH40 191) , as a suspension in 2 .5 M ammonium sulfate solution and
184
185
bovine intestinal alkaline phosphatase (Product #P7640, Lot #043H7 185) , as
a freeze dried powder, enzyme substrate disodium p-nitrophenol phosphate
(Product #104-0, Lot # 123H50083), p-nitrophenol standard solution (Product
# 104- 1, Lot #0 14H6 137) and bovine serum albumin (ESA) protein standard
(Product #P0914, Lot # 14H8530) were obtained from Sigma Chemical
Company (St. Louis, MO). Tris [Tris (hydroxymethyl)-aminomethane] was
obtained from Pharmacia LKB (Piscataway, NJ) . Protein assay dye reagent
solutions (Product #500-006, Lots #5 1 143A and #5 1558A) were obtained from
Bio-Rad Laboratories (Hercules, CA). 1 N sodium hydroxide solution of
reagent grade quality was obtained from Fisher Scientific C ompany
(Raleigh, NC).
VII. b.I Protein content determination
The dye reagent concentrate solution contained the dye, phosphoric
acid and methanol (Bio-Rad protein assay manual, Bio-Rad Laboratories,
Hercules, CA, 1994) . Tris buffer at 10 mM concentration was made in
deionized distilled water and the pH was adjusted to 8 .0 using 1 .0 N HCI
solution. Four standard solutions of BSA (obtained from Sigma) in the
concentration range of 1 .25 - 10 .00 �g/ml were prepared in the buffer. 600 �l
of the dye reagent concentrate was added to 2 .4 ml of each protein standard
solution and the resulting mixture was vortexed and held at ambient
temperature (22 - 23 °C) for a further 5 min, prior to reading the absorbance
at 595 nm (Ultrospec II, LKB-Pharmacia, Piscataway, NJ) in glass cuvettes
186
(Catalogue # 14-385-9 10B, Fisher Scientific Co . , Raleigh, NC), since the
protein-dye complex binds more strongly to quartz as compared to glass
(Bradford, 1976). The cuvettes were cleaned at the end of each experiment by
rinsing them with methanol. A protein free buffer solution prepared in a
similar fashion served as the blank reference solution. Blank absorbencies
were subtracted from the absorbencies of the standard solutions of BSA. A
calibration plot of protein (BSA) concentration vs absorbance due to the
protein-dye complex was constructed. Plotted values were the mean of three
determinations. Since there can be batch to batch variation in dye response,
each commercially obtained batch of dye reagent solution used in the assay
was used to make a separate calibration plot.
For determining protein content of unknown alkaline phosphatase
enzyme solutions, 600 III of the dye reagent solution was added to 2.4 ml of
the enzyme solution in Tris buffer pH 8 . 0 and the resulting mixture
vortexed and held at ambient temperature for 5 min, The absorbance was
read at 595 nm in glass cuvettes. An enzyme free buffer solution prepared
in a similar fashion served as the blank . Blank subtracted sample
absorbance was used to estimate protein concentration by linear
interpolation based on the whole of the calibration curve plotted as described
above. Hence all protein concentrations of the enzyme solutions are
expressed in terms of the relative standard BSA. As a result, in this
Chapter, and in Chapter V, protein amounts are expressed in terms of
micrograms of BSA equivalents (BSAE) and not as absolute concentrations

of alkaline phosphatase.
VII. b.2 Determination of alkaline phosphatase enzyme activity
VII.b.2. l Calibration plot of paranitrophenol in 1.0 N NaOH solution
187
Alkaline phosphatases (BAP and BIAP) catalyze the hydrolysis of p
nitrophenol phosphate ( substrate) to p-nitrophenol under alkaline
conditions . The product released can be determined quantitatively by
spectrophotometry at 404 nm. Six standard solutions of p-nitrophenol
(Sigma) in 1.0 N NaOH were prepared in the concentration range 10 - 100
nmol/ml. Absorbencies of the resulting solutions were read at 404 nm. 1 . 0 N
NaOH served as the blank reference solution which was used to adjust A404
to zero. Concentrations of p-nitrophenol were plotted vs absorbance . Plotted
values are the mean of three determinations.
VII.b.2.2 Limits of linearity for product (p-nitrophenol) accumulation vs
incubation time
The maximum product concentration which was able to accumulate
before the product concentration vs time curve became non-linear, was
established (Segel, 1976) for both the enzymes, BAP and BIAP.
For BAP, the enzyme suspension in ammonium sulfate solution was
desalted as described in Section V.b. 1 . l (Chapter V). Two enzyme solutions
were prepared in 10 mM Tri s buffer pH 8 . 0 . Apparent protein

188
concentrations (in BSAE) of these solutions, as determined by the Bradford
assay, were 3 .42 Ilg BSAE/ml and 7 .5 Ilg BSAE/ml . 375 III of each enzyme
solution (for each of the time points tested) was incubated at 37 °C in a water
jacketed vessel. Reaction was initiated by the addition of 125 III of 10 mM p
nitrophenol phosphate (substrate) solution in Tris buffer pH 8 .0 . At specific
time intervals the reaction was stopped by the addition of 3 ml of 1 . 0 N
NaOH solution (Engstrom, 196 1 ) and absorbance read at 404 nm. Enzyme
free buffer incubated with 125 III substrate solution served as the blank or
reference solution which was used to adj ust �04 to zero . Measured
absorbencies were used to estimate the product (p-nitrophenol) released by
interpolation from the p-nitrophenol calibration curve. A plot of p
nitrophenol concentration vs incubation time was constructed and based on
this plot, a constant incubation time in the linear phase of the plot was
selected for use in the final assay for enzyme activity.
For BIAP two solutions were prepared in 10 mM Tris buffer by
reconstituting the commercially obtained freeze dried powder. Apparent
protein concentrations of the solutions as estimated by the Bradford
method, were 2.53 Ilg BSAE/ml and 8.90 Ilg BSAE/ml. 375 JlI of each BIAP
solution (for each of the time points tested) was incubated at 37 °C in a water
jacketed vessel. Reaction was initiated by the addition of 125 III of 10 mM p
nitrophenol phosphate (substrate) solution in Tris buffer pH 8 .0 . At specific
time intervals the reaction was stopped by the addition of 3 ml of 1 . 0 N
NaOH and absorbance read at 404 nm. BIAP-free buffer, similarly

189
incubated with 125 !ll substrate solution, served as the blank or the
reference solution, which was used to adjust A404 to zero . Measured
absorbencies were used to estimate p-nitrophenol concentrations by linear
interpolation from the p-nitrophenol calibration curve. A plot of p
nitrophenol concentration vs incubation time was made and based on this
plot a constant incubation time in the linear phase of the plot was selected
for use in the final assay for enzyme activity.
VlI.h.2.3 Limits of linearity for enzyme activity vs apparent protein
concentration in enzyme solutions
BAP was desalted as described in Chapter V (Section V.b. 1 . l ) . BlAP
enzyme powder was reconstituted and diluted in 10 mM Tris buffer pH 8 .0 .
Four concentrations of each enzyme solution were made using 10 mM Tris
buffer pH 8 . 0 . Apparent protein concentration of the solutions as
determined by the Bradford assay were in the concentration range 2 . 5 8 -
8 .75 !lg BSAE/ml (BAP) and 2 . 19 - 8 .43 !lg BSAE/ml (BIAP). 375 !ll of each
enzyme solution was incubated at 37 °C in a water jacketed vessel . The
reaction was initiated by the addition of 125 !ll of 10 mM p-nitrophenol
phosphate (substrate) solution in 10 mM Tris buffer pH 8 .0 . At the end of 4
min (plots of product release vs incubation time for BAP and B lAP were
apparently rectilinear for times :;; 4 min, see Figures VIl .4 and VlI . 5 )
incubation time, the reaction was stopped by the addition of 3 ml of 1 . 0 N
NaOH solution and absorbance read at 404 nm. Enzyme-free buffer solution

100
prepared in a similar fashion served as the blank which was used to zero
the spectrophotometer in all cases. Concentrations of p-nitrophenol were
estimated by linear interpolation of the absorbance values from the whole
calibration curve for p-nitrophenol (see Figure VIL3) .
One Unit of enzyme activity was defined as the amount of enzyme
that catalyzes the release of 1 nmol of p-nitrophenol per minute at 37 °C and
pH 8 .0 . Activity was calculated as follows:
Enzyme activity of the original enzyme solution assayed =
[p-nitrophenol (nmollml) in final solution] X (DF/4)
where DF (dilution factor) = (3 .5/0 .375) ; the result was divided by 4 to
normalize to a one minute reaction time. The mean BAP (Figure VII .6 )
and BIAP (Figure VII . 7 ) activities (n = 3) in Units/ml vs apparent protein
concentration were constructed.
VIL c RESULTS AND DISCUSSION
VILc. 1 Protein content determination
Protein contents of alkaline phosphatase (BAP and BIAP) solutions
subsequently assayed for enzymatic activity were determined using the
method of Bradford (Bradford, 1976). The assay is based on the observation
that there is a shift in the absorbance maximum of Coomassie Brilliant
Blue G-250 when it binds to protein. It has been reported that the dye exists
as three absorbing species, a red cationic species, a neutral green species

Table VII . 1 Summary of assay validation parameters for protein determination by the method of Bradford (Bradford, 1976).
Linear Rangea r2 Precisionb Accuracyc LOQd (Ilg/ml) ( % CV) (Ilg/ml )
Lot #5 1 143A
Lot #5 1558A
1 .25 - 10.00
1.25 - 10.00
a Protein standard used was BSA.
0.99
0.99
4.6 - 5.6
7 .8 - 2 . 1
7 . 7 - 1 . 2
7 .8 - 2.4
1 .25
1 .25
b Precision = (sample standard deviation of absorbance/mean absorbance) x 100, n=3 . Values are calculated from the upper and lower limits of the linear concentration range shown. Accuracy =[Abs(At - Ai)/ At] x 100, where At = True absorbance value and Ai = Interpolated absorbance from the calibration curve. Values are calculated from the upper and lower limits of the linear concentration range shown.
d Limit of quantitation was defined as the lower limit of the calibration curve ( 1 .25 Ilg BSAE/ml in both case s .
§

192
and a blue anionic species. Binding of the dye to protein stabilizes the blue
anionic fonn which can be detected at 595 nm (Compton and Jones, 1985) .
Dye binding essentially requires basic (arginine) or aromatic amino acid
residues in the protein (Compton and Jones, 1985) . The resulting protein
dye complex has a high extinction coeffi cient, making microgram
quantities of protein detection possible . Also, the dye binds to the protein
very rapidly and the dye-protein complex remains in solution for at least 1
hour. This enables rapid detection without critical timing for the assay
(Bradford, 1976). The dye assay is also relatively insensitive to the presence
of carbohydrates and Tris in the assay solution unlike the more commonly
used Lowry assay (Lowry et aI . , 195 1) .
Calibration curves constructed by plotting blank subtracted
absorbencies vs protein standard (BSA) concentrations are shown in
Figures VII . 1 and VI! .2 , for dye reagent batches # 5 1 143A and # 5 1558A
respectively. Both the calibration curves used for protein estimation were
evaluated for accuracy, precision, linearity and limit of quantitation (LOQ)
using upper and lower limits of concentration ranges shown in Table
VI! . l . Accuracy of the method was expressed as the percentage difference
between calculated and measured values for A595 (Karnes et aI . , 1991).
Precision (variability in the measurement of A595 ) was estimated as
percentage coefficient of variation (% CV) in a set of three detenninations,
although calculations using a set of six determinations are usually
recommended (Karnes et aI . , 1991) . Limit of quantitation (LOQ) was defined

193
0.500
0.450 '"
0.400 '"
0.350
0.300
00 '" 0.250 00 <t 0.200
0. 1 50
0 . 1 00
0.050
0.000 0.00 2 .00 4.00 6.00 B.OO 1 0.00 1 2 .00
BSA Concentration [microg .... ms/ml]
Figure VII . 1 Calibration curve for protein estimation by the method of Bradford, using Bio-Rad assay kit (Lot #5 1 143A) . Plotted values are experimentally obtained data. The solid line shows the best fit by linear regression of the data (y = 0 .0400x + 0 .0149; r2 = 0.99; standard error of slope = 0.00 103; n = 12).

194
0.600
0.500
0.400
10 '" 0.300 10 <{
0.200
0.1 00 III
0.000 0.00 2.00 4.00 6.00 B.OO 1 0.00 1 2 .00
BSA Concentration [micrograms/ml)
Figure VII . 2 Calibration curve for protein estimation by the method of Bradford, using Bio-Rad assay kit (Lot #5 1558A). Plotted values are experimentally obtained data. The solid line shows the best fit by linear regression of the data (y = 0 . 05 1 2 1x + 0. 0297 7 ; r2 = 0.99; standard error of slope = 0.00155; n = 12).

195
2.0
1 .B
1 .6
1 .4
1 .2
... 0 1 .0 ... <C O.B
0.6
0.4
0.2
0.0 0 30 60 90 1 20
p·n�rophenol concentration [nmo l/mll
Figure VII . 3 Calibration curve for p-nitrophenol in 1 . 0 N NaOH solution. Plotted values are experimentally obtained data. The solid line shows the best fit by linear regression of the data (y = 0 . 0 18 15x + 0 .02196; r2 = 0 .99; standard error of slope = 0 .000 15; n = 18) .

196
as the concentration of the lowest standard i. e. 1 .25 Ilg BSAE/ml (Karnes et
a! . , 199 1) . The practical limit of quantitation was also established as 1 . 25 ±
0 .20 Ilg BSAE/ml . Assay validation parameters for both lots of the dye
reagent are shown in Table VII . 1 . Both the calibration curves were
apparently rectilinear in the concentration range 1.25 - 10.00 Ilg/ml (r2 >
0 .99, n = 12) and the values for precision and accuracy were reliable within
a 10% margin of error (Table VII . 1 ) .
VII.c.2 Determination of enzyme activity
VII.c.2. 1 Calibration plot of product (p-nitrophenol)
The calibration plot of p-nitrophenol concentrations (in 1 .0 N NaOH) vs
A404 is shown in Figure VII . 3 . It was rectilinear in the concentration
range 10 - 100 nmollml (r2 > 0 .99, n = 18) and thus was used to estimate p
nitrophenol concentrations following enzymatic reactions in unknown
solutions.
VII.c.2.2
time
Linearity of product (p-nitrophenol) released vs incubation
Plots of incubation time vs p-nitrophenol released for two
concentrations of BAP (3.42 Ilg BSAE/ml and 7.50 Ilg BSAE/ml) and two
concentrations of BIAP (2.53 Ilg BSAE/ml and 8 .90 Ilg BSAE/ml) are shown
in Figures VIl .4 and VII .5 respectively. A visual observation of these plots

197
250
] ;::;;, 200
j 't) � 150
..9:l �
1 100
.§ 50 • 3.42 1lg/ml ·S Q. lIE 7.50 1lg/ml
0 0 5 10 15 20 25 30
Incubation time (min)
Figure VII . 4 Plot of p-nitrophenol concentration vs incubation time for two apparent protein concentrations of bacterial alkaline phosphatase (BAP; •
3 .42 )1g BSAE/ml; * 7 .50 )1g BSAE/ml, as determined by the method of Bradford). Each data point is based on a single determination and the solid lines are shown for visual clarity and does not necessarily indicate data continuity.

100
150
]: ;::.
� 100
"C � ] '8 50
! • 2053 11g/ml oS 6- lIE 8090 I1g/ml
0 0 5 10 15 20 25 30
Incubation time [min]
Figure VII . 5 Plot of p-nitrophenol concentration vs incubation time for two apparent protein concentrations of bovine intestinal alkaline phosphatase (BlAP ; • 2 .53 Jlg BSAE/ml; * 8 . 90 Jlg BSAE/ml, as determined by the method of Bradford) . Each data point is based on a single determination and the solid lines are shown for visual clarity and does not necessarily indicate data continuity.

199
revealed that the plots were apparently rectilinear in the initial phase « 5
min) . The product released (phosphate) during the enzyme reaction acts as
an inhibitor and this is probably the reason for the non linear product
formation curves shown in Figures VIl .4 and VIL5 . An incubation time of
4 min was chosen for use in the final assay as the incubation time for the
final assay of both the enzymes. For both BAP and BIAP, values of r2 > 0 .99
were determined at 0 :::; t :::; 4 min (n = 4, in both cases) .
VII.c.2.3 Linearity of enzyme activity vs apparent protein concentration
in the enzyme solution assayed
Plots of protein concentration vs enzyme activity expressed in Units/ml
are shown in Figures VIl .6 and VIl . 7 for BAP and BIAP respectively. The
plot for BAP was rectilinear in the apparent protein concentration range
2 .58 - 8 .75 �g BSAE/ml (r2 > 0 .99; n = 15) . The plot for BIAP was rectilinear
in the apparent protein concentration range 2 . 19 - 8 .43 �g BSAE/ml (r2 >
0 .99; n = 15).
VII.c.2.4 Estimation of enzyme specific activity in unknown solutions
For BAP and BIAP unknown solutions both protein and enzyme
activity assays were performed in order to determine specific activities .
Apparent protein content was determined by the method of Bradford
(Section VILb . l ). If the apparent protein concentrations of BAP solutions
were less than the upper limit of the linear range for BAP i.e. 8 .75 Ilg

200
1 60
1 40
� 2 '" ::> � � 80
u <t "
60 E ,., N I: UJ 40
20
1 0
Protein Concentration [ug BSAE/ml]
Figure VII . 6 Plot of enzyme activity vs protein concentration (determined by the method of Bradford) for bacterial alkaline phosphatase (BAP) . Plotted values are experimentally obtained data. The solid line shows the best fit by linear regression of the data (y = 13 .8749x + 3 . 1 195; r2 = 0 .99; standard error of slope = 0.23 13; n = 15).
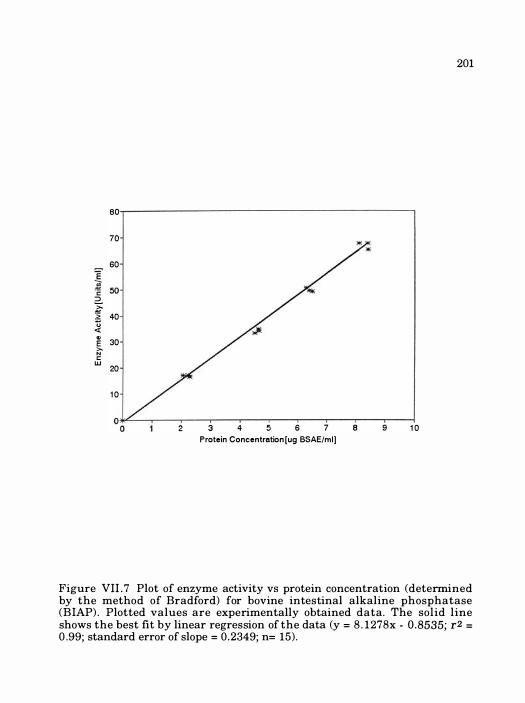
201
80
70
60
� .� � c: ::::> 'E :� 40 u <t "
30 E >-N c: UJ 20
1 0
2 3 4 5 6 7 8 9 1 0
Protein Concentration [ug BSAE/ml]
Figure VII . 7 Plot of enzyme activity vs protein concentration (detennined by the method of Bradford) for bovine intestinal alkaline phosphatase (BIAP) . Plotted values are experimentally obtained data. The solid line shows the best fit by linear regression of the data (y = 8 . 1278x - 0.8535; r2 = 0 .99; standard error of slope = 0 .2349; n= 15) .

202
BSAE/ml (Figure VII . 6 ),the enzyme activity was determined without
further dilution. If the apparent protein concentration was > 8 . 7 5 �g
BSAE/ml sufficient dilution was made with 10 mM Tris buffer pH 8 . 0 before
re-assaying for protein content and then for enzyme activity. Similarly, for
BIAP if the protein concentrations were less than the upper limit of its
linear range i .e . 8.43 �g BSAE/ml (Figure VII . 7 ), the enzyme activity was
determined. If. the protein concentrations of the assayed BIAP solutions
was > 8 .43 �g BSAE/ml, the assays were repeated after dilutions in buffer.
Enzyme specific activity was assayed as follows: 375 III of the BAP or
BIAP solution was incubated at 3 7 °C. The reaction was started by adding
125 III of 10 mM of p-nitrophenol phosphate solution (substrate) in 10 mM
Tris buffer pH 8 .0 . At the end of 4 min incubation the reaction was stopped
by the addition of 3 mi LO N NaOH solution and absorbance read at 404 nm.
Concentration of p-nitrophenol was estimated by interpolation from the p-
nitrophenol calibration curve (Figure VII .3 ) . Enzyme activity in Units/ml
was calculated as described in Section VILb . 2 . 3 . Specific activity of the
enzyme in unknown solutions was then determined from:
Specific activity [Units/�g BSAE]
Enzyme activity [Units/mll . . . . . . . . E quation VII . 1 Protein Concentration [Ilg BSAE/ml]

VIII. OVERALL SUMMARY AND CONCLUSIONS
The feasibility of producing inhalable microparticles of sugars and
sugar-protein molecular mixtures was investigated. Four sugars: lactose ,
trehalose, sucrose and mannitol were selected for review based on their
different physicochemical properties. Lactose, trehalose and sucrose were
disaccharides, while mannitol was a straight chain sugar alcohol .
Chemically, lactose was a reducing sugar, since in the presence of
moisture it could exist in equilibrium with its open chain reactive aldehyde
form. This property of lactose also caused it to mutarotate and exist in two
anomeric forms: (a and 13) . a-Lactose could be readily purchased as the
stoichiometric crystalline monohydrate (water content = 5% w/w). 13-lactose
(anhydrous) could not easily be obtained in pure form. Trehalose, sucrose
and mannitol were all non-reducing sugars. Sucrose and mannitol are
currently used as accepted excipients in other pharmaceutical dosage
forms and trehalose is under review as an excipient in lyophilized
preparations .
Crystalline a-lactose monohydrate is presently the only approved
carrier in dry powder inhalers ( D P l s ) in the United State s .
Characterization o f additional crystalline sugars with respect to their

204
behavior under different storage conditions was used to assess their
suitability for use as carriers in dry powder inhalers (DPIs). Studies were
also performed because sugars have been suggested as stabilizers to protect
proteins during spray drying and storage of dried powders . Since spray
drying offers an alternative to other particle size reduction techniques, it
was developed and tested for the production of microparticles of sugar
containing the drug (protein) in intimate molecular mixtures . In these
cases, the sugar carrier would be inhaled along with the drug. This
contrasts with the use of conventional sugar carriers in DPIs , which
consist of a physical admixture of the micronized drug with a larger
particle size carrier. In these cases, during inhalation, the drug i s
intended t o separate from the carrier, and b e inhaled alone.
Two size fractions: "coarse" ( 125 - 2 12 11m) and "fine" (44 - 74 11m) of
each of the four sugars: lactose, trehalose, sucrose and mannitol were
prepared by sieve fractionation. They were examined for moisture uptake
and physicochemical stability after storage at four different relative
humidities (RHs) : 23%, 52%, 75% and 93% RH and 25 °C for 30 days to
assess their suitability for use in physical admixtures with drugs in powder
inhalers . All sieve fractions , except sucrose did not show any moisture
uptake (as determined by weight loss on thermogravimetric analysis) when
stored at the different RHs . Sucrose was stable when stored at � 75% RH,
however it dissolved in the sorbed moisture (turning into syrup) when
stored at 93% RH, indicating that its critical relative humidity had been

205
exceeded at this RH. These results indicated that the crystalline sieve
fractions were thermodynamically stable at 25 °C (with the exception of
sucrose) at all the storage conditions studied and thus, in this respect were
suitable for use as carriers in DPls , and could be used whenever
formulations with lactose performed poorly. Sucrose would not necessarily
have to be excluded from this generalization, except to say that any sucrose
drug blends to be used in powder inhalers must be stored in sealed moisture
proof packages, to avoid predictable moisture-induced changes in DPI
performance .
The four sugars were also spray dried using a Yamato bench top
spray dryer from 10% w/v aqueous solutions. Lactose, trehalose and
mannitol were obtained with median aerodynamic diameters between 4 - 6
!lm as determined by the Aerosizer® equipped with an Aerodisperser® .
This showed the feasibility of spray drying these sugars to produce
inhalable particulates . Spray dried sucrose on the other hand, was very
cohesive and difficult to deaggregate ; resulting in apparent median
aerodynamic diameters of 12 !lm as measured by the Aerosizer® . Spray
dried lactose, trehalose and sucrose were obtained as amorphous glasses as
indicated by differential scanning calorimetry (DSC ) and X-ray powder
diffraction (XRPD) . However, contrary to the popular belief that spray
drying destroys crystalline structure, spray dried mannitol was highly
crystalline as assessed by DSC and XRPD. Amorphous spray dried lactose,
trehalose and sucrose, showed apparent glass transition temperatures (Tg)

200
of 1 17, 120 and 62 °C respectively, in the completely dry state (the presence of
moisture in the amorphous glass at 25 °C could feasibly lower these T g
values, since water is a plasticizer for amorphous materials) . When stored
at 23% RH and 25 °C for 30 days, spray dried lactose, trehalose and sucrose
showed increased equilibrium moisture contents compared to the starting
material (ranging from 4 .6% for spray dried sucrose to 5.6% for spray dried
trehalose), but remained in the amorphous form over that time period. This
was assessed by DSC and XRPD of the stored materials . However, the
amorphous sugars (spray dried lactose, trehalose and sucrose) completely
recrystallized after storage at the higher humidities of 52%, 75% and 93%
RH. This moisture-induced recrystallization resulted in the formation of
stoichiometric hydrates for lactose and trehalose and the anhydrate form of
sucrose. A small amount of 13-lactose anhydrous was detectable by DSC in
recrystallized lactose samples stored at 52% and 75% RH, indicating that
some mutarotation of lactose had occurred in the solid state at these RHs.
Spray dried mannitol, which was obtained in the crystalline state after
spray drying, did not show any further moisture uptake after storage, at
any RH employed in this study. Even small amounts of amorphous content
were undetectable in spray dried mannitol samples collected here, showing
that it was in the same crystal form, although its appearance was
physically different to the original starting material .
Because, few commercially available spray dryers are capable of
drying and collecting small particles (:::; 5 11m) to a high degree of efficiency,

a small particle collection apparatus was designed. This incorporated a
commercially available nebulizer and a purpose-built wire-in-tube type
electrostatic precipitator. The apparatus was characterized for particle
collection efficiency using aqueous solutions of lactose and disodium
fluorescein, as a function of several operating variable s ; applied
precipitator voltage, concentration of nebulized solution, temperature and
volumetric flow rate of the drying air through the apparatus . Only particles
collected inside the column (I , Figure IV. l ) were potentially recoverable for
further study. Under all operating conditions, particle deposition in parts of
the apparatus other than the electrostatic column was minimal . The total
solids output exiting the nebulizer, was either collected inside the column
or lost to the air stream. At all conditions, the percentage of the output
recovered in the column increased with increasing applied voltage on the
precipitator, with 64% recovery at an applied potential of 20 kV. A larger
percentage of the output was recovered when using low concentration
nebulizer solutions (64% and 26% recoveries in column after nebulizing 10
mg/ml and 75 mg/ml solutions respectively). Using a 10 mg/ml solution,
deposition in the column was investigated as a fun ction o f drying
temperature and volumetric air flow rate (in these experiments a glass
liner was introduced inside the column to facilitate collection and
subsequent detection of particles) . Two volumetric air flow rates of 29 . 1
liters/min and 50 .6 liters/min and two drying temperatures of 28 °C and 4 1
° C were used. Drying air temperature appeared to have n o effect o n particle

208
deposition inside the column, even though better dried particles were
obtained at higher drying temperatures, as observed by scanning electron
micrography (SEM). As expected, deposition was directly dependent on
volumetric air flow through the system, with higher efficiencies at lower
air flow rate , showing that deposition was a function of particle residence
time inside the column.
Once characterized, the particle collection apparatus was used to
review protein activity following spray drying and electrostatic collection of
protein-sugar mixtures. Two enzymes , bacterial alkaline phosphatase
(BAP) and bovine intestinal alkaline phosphatase (BIAP) were selected as
model proteins . To investigate the effect of sugars as stabilizers, enzyme
solutions were sprayed in the presence and absence of four sugars (lactose,
trehalose, sucrose and mannitol) , dried at -63 °C (as measured in dryer C,
Figure V. I) and electrostatically collected inside the glass-lined precipitator
column for 90 min. Enzyme activity was determined from the initial
reaction rates of alkaline phosphatase-catalyzed hydrolysis of p-nitrophenol
phosphate ( substrate ) . Enzyme specific activities were expressed as
Units/Ilg BSAE, where one Unit of enzyme activity was defined as the
amount of enzyme that catalyzes the release of one nmol of p-nitrophenol
per minute at 37 °C and pH 8 .0 . Each of the enzyme solutions were made in
10 mM Tris buffer pH 8.0 with or without the addition of each of the four
sugars: lactose, trehalose, sucrose and mannitol.
Sugar-free solutions of BAP, the purer enzyme of the two model

209
proteins, had a total non volatile solids content of -0 . 1% w/v and showed an
average specific activity of 15 . 7 Units/Ilg BSAE . This specific activity
remained unchanged after the addition of each of the four sugars [total non
volatile solids concentration = 10 mg/ml ( 1% w/v)] and at the end of the 90
min experiment, in the residual nebulizer solution. However, the enzyme
spray dried at 63 °C (as measured in dryer-C , Figure V. 1 ) and
electrostatically collected in the column (I, Figure V. 1) , showed a specific
activity of 12. 1 Units/Ilg BSAE after reconstitution. This loss of activity was
significant compared to the initial solution (ANOVA, p < 0 .05) . Trehalose
and sucrose seemed to offer some protection to this drying and/or collection
induced loss, when included with the enzyme in the prenebulized solution,
although specific activity values were statistically indistinguishable from
those determined following drying from sugar-free solution. Thus, some
activity loss appeared to be inevitable in this case . Lactose and mannitol
seemed to offer no protection at all to the enzyme during spray drying and
electrostatic collection, but once again specific activity values were not
significantly different from those following drying from sugar-free solution.
In separate experiments, BAP was spray dried with or without addition of
the four sugars, as described above . These dried powders were stored at
23% RH and 25 °C for 14 days, prior to reconstitution and analysis. The
storage conditions were chosen based on the observation that independently
spray dried sugars remained as stable amorphous materials , after storage
for 30 days at this temperature and RH (Chapter I I I ) and thus ,

210
recrystallization should not occur during storage . Sugar-free BAP and
BAP-sugar mixtures did not show a significant change in specific activities
compared to their respective prestored materials, indicating that no further
loss of activity occurred during storage for 14 days under these conditions.
The second enzyme, bovine intestinal alkaline phosphatase (BIAP)
was examined in a similar fashion. BIAP was present in increased total
protein concentration in the nebulized solution ( - 1 mg BSAE/ml compared
to - 120 Ilg BSAE/ml for BAP) . Even so, the total non-volatile solids
concentration in the BIAP-sugar solutions was held constant at 10 mg/ml
( 1 % w/v) . Sugar-free BIAP solutions had a specific activity of 8 .8 Units/Ilg
BSAE . This value was unaffected by the addition of sugars or by
nebulization for 90 min. However, sugar-free BIAP solution dried at 63 °C
and collected inside the column, showed a lowered specific activity of 6 . 1
Units/Ilg BSAE, indicating a significant loss o f activity compared t o the
initial solution. In the case of this enzyme , this loss of activity was
completely prevented, when either lactose, trehalose and sucrose were used
in the initial solution as stabilizers (activities were indistinguishable from
the respective initial solution activities) . However, co-drying B IAP with
mannitol, resulted in a 40% loss of activity. This value was significantly
different from the initial solution activity of 8 . 8 Units/Ilg BSAE, but was
statistically indistinguishable from the activity of the dried sugar-free
solution. Storage experiments were performed with BIAP, similar to those
conducted with BAP. BIAP and B IAP-sugar mixtures showed a similar

211
trend to BAP, that it did not lose additional activity during storage at 23%
RH and 25 °C for 14 days, when compared to their prestored counterparts.
Experimental results with BlAP showed that only those sugars which
existed in the glassy state offered protection to this enzyme during spray
drying. Mannitol which was crystalline in the spray dried molecular
mixture, failed to offer any protection to BlAP. This was consistent with the
earlier hypothesis that the ability of some sugars to protect proteins during
drying and storage as dry powders, may depend on the physical state
(amorphous or crystalline) of the sugar in the final powdered molecular
mixture . According to the "glass transition" theory, the amorphous glass
immobilizes the protein in the dried mixture, reducing molecular motion,
and thus decreasing destabilization reactions . This amorphous glass can
then remain "stable" for pharmaceutically relevant time periods . Only
when the processing or storage temperature exceeds the glass transition
temperature (T g ) of the amorphous glass , should one expect physical
instability (recrystallization) and/or increased chances of chemical
reactivity between the sugar and protein, due to increased molecular
mobility.
If spray dried protein-sugar molecular mixture s are to be
successfully used in DPls, the selection of sugar may depend on several
factors. Among these factors are the cohesiveness of the spray dried powder
(aerosolizability) , its susceptibility to moisture uptake, potential for
chemical reactivity and its ability to protect the proteins during drying and

212
storage . Using these factors as selection criteria, sucrose appeared to be
unsuitable at the outset, because of the difficulty in deaggregating this
powder into primary particles suitable for inhalation. Lactose, because of
its reducing property may also have drawbacks for co-drying and storage
with some proteins in the dry state. Surprisingly, mannitol was spray dried
and collected in the crystalline form. While this enabled some resistance to
moisture-induced changes , mannitol may not be a suitable stabilizer for
protein in cases where an amorphous glass is required for stabilization.
Trehalose therefore, seemed to survive the screening for protein-protection
most successfully. As a carrier for use in amorphous spray dried sugar
protein molecular mixtures it still required packaging to prevent moisture
induced recrystallization. Nevertheless, it is potentially less reactive than
lactose . It also spray dries as an amorphous glass and is much less
cohesive and hygroscopic than sucrose. Even so, formulations of all spray
dried amorphous powders for inhalation require extraordinary precautions
with respect to packaging and storage, since such powders are prone to
moisture sorption, which can result in a series of physical and chemical
changes, all of which have pharmaceutical stability implications.

LIST OF REFERENCES
213

214
LIST OF REFERENCES
Adjei, A. and Garren, J . , Pulmonary delivery of peptide drugs: effect of particle size on bioavailability of leuprolide acetate in healthy human volunteers. Pharm. Res. , 7 ( 1990) 565-569.
Adjei, A. and Gupta, P., Pulmonary delivery of therapeutic peptides and proteins . J. Controlled Release , 29 ( 1994) 36 1-373.
Ahlneck, C . and Zografi, G. , The molecular basis of moisture effects on the physical and chemical stability of drugs in the solid state . Int. J. Pharm . , 62 (1990) 87-95.
Arakawa, T. and Timasheff, S. N . , Stabilization of protein structure by sugars. Biochemistry, 2 1 ( 1982) 6536-6544.
Arakawa, T., Kita, Y. and Carpenter, J. F . , Protein-solvent interactions in pharmaceutical formulations . Pharm. Res. , 8:3 ( 1991) 285-291 .
Back, J . F . , Oakenfull, D . and Smith, M. B . , Increased thermal stability of proteins in the presence of sugars and polyols. Biochemistry , 18 :23 ( 1979) 5191-5196.
Beevers, C. A. and Hansen, H. N. , The structure of a-Lactose Monohydrate. Acta Cryst. B27 ( 1971) 1323-1325.
Berlin, E . , Kliman, P . G . , Anderson, B . A . and Pallansch, M . J . , Calorimetric measurement of the heat of desorption of water vapor from amorphous and crystalline lactose. Thermochim. Acta, 2 (1971) 143- 152 .
Berman, H. M. , Jeffrey, G. A. and Rosenstein, R. D . , The crystal structures of a' and B forms of D-Mannitol. Acta Cryst. B24 ( 1968) 442-449 .
Bio-Rad Protein Assays, Bulletin #1 069, Bio-Rad Laboratories , Inc . , Richmond, CA, 1992 .
Bowers, G . N . and McComb, R. B . , A continuous spectrophotometric method for measuring the activity of serum alkaline phosphatase. Clin. Chem. , 12 ( 1966) 70-89.
215
Bradford, M. M . , A rapid and sensitive method for the quantitation of microgram quantities of protein utilizing the principle of protein-dye binding. Anal. Biochem. , 72 ( 1976) 248-254.
Bradshaw, R A, Cancedda, F . , Ericsson, L . H. Newmann, P . A. , Piccoli, S . P . , Schlesinger, M. J . , Shriefer, K and Walsh, K A, Amino acid sequence of Escherichia coli alkaline phosphatase. Proc. Natl. Acad. Sci., 78 (1981) 3473-3477.
Bristow, A. F . , Dunn, D. and Tarelli, E . , Additives to biological substances . IV. Lyophilization conditions in the preparation of international standards: An analysis by high-performance liquid chromatography of the effects of secondary desiccation. J. BioI. Stand. , 16 ( 1988) 55-61 .
Broadhead, J . , Edmond Rouan, S . K, Hau, I . and Rhodes, C . T . , The effect of process and formulation variables on the properties of spray dried �galactosidase . J. Pharm. Pharmacol. , 46 ( 1994) 458-467 .
Brown, G. M. and Levy, H . A, Sucrose: Precise determination of crystal and molecular structure by neutron diffraction. Science, 14 1 ( 1963) 92 1-923 .
Brown, G. M. , Rohrer, D . C . , Berking, B . , Beevers, C . A , Gould, R. O . and Simpson, R, The crystal structure of a, a-Trehalose dihydrate from three independent X-ray determinations. Acta Cryst. B28 ( 1972) 3 145-3 158.
Bryan, W. P. and Rao, P. B. , Comparison of standards in the Karl Fischer method for water determination. Anal. Chim. Acta , 84 ( 1976) 149- 155.
Budavari, S. (Ed.) , The Merck Index, 11th Edition , Merck & Co . , Rahway, NJ, 1989, pp. 1508.
Byron, P . R, Phillips , E. M. and Kuhn, R, Ribavirin administration by inhalation: aerosol-generation factors controlling drug delivery to the lung. Resp. Care, 33: 1 1 ( 1988) 10 1 1- 1019.
Byron, P. R . . , Aerosol formulation, generation and delivery using metered systems. In Byron, P. R (Ed.) Respiratory Drug Delivery , CRC Press, Boca Raton, Florida, 1990a, 167-205.
Byron, P. R., Aerosol formulation, generation and delivery using nonmetered systems. In Byron, P. R (Ed . ) Respiratory Drug Delivery , CRC Press, Boca Raton, Florida, 1990b, 143-165 .
Byron, P. R and Patton, J . S . , Drug delivery via the respiratory tract. J. Aerosol Med. , 7 (1994) 49-75.

216
Byron, P. R. , Miller, N. C . , Blondino, F E . , Visich, J. E . and Ward, G . R . , Some aspects of alternative propellant solvency. In Byron, P . R. , Dalby, R . N. and Farr, S. J . (Eds . ) , Respiratory Drug Delivery IV, Interpharm Press, Buffalo Grove, IL, 1994, 23 1-24 1 .
Bystrom, K and Briggner, L-E . , Microcalorimetry - a novel technique for characterization of powders . In Byron, P. R. , Dalby, R. N. and Farr, S . J . (Eds . ) , Respiratory Drug Delivery IV, Interpharm Press, Buffalo Grove , IL, 1994, 297-302.
Calam, D. H. and Tarelli, E . , Additives to biological substances . V. The stability of lactose as a carrier for biological standards. J. Biol. Stand. , 16 ( 1988) 63-66.
Callahan, J . , Cleary, G.W., Elefant, M . , Kaplan, G . , Kensler, T. and Nash, R.A. , Equilibrium moisture contents of pharmaceutical excipients . D rug Dev. Ind. Pharm. , 8 ( 1982) 335-369.
Carpenter, J. F . , Hand, S . C . , Crowe, L. M. and Crowe, J. R . , Cryoprotection of phosphofructokinase with organic s o l ute s : characterization of enhanced protection in the presence of divalent cations. Arch. Biochem. Biophys. , 250 ( 1986) 505-512 .
Carpenter, J . F . , Martin, B . , Crowe, L . M . and Crowe, J . R . , Stabilization of phosphofructokinase during air-drying with sugars and sugar/transition metal mixtures . Cryobiology, 24 ( 1987) 455-464.
Carpenter, J . F . and Crowe, J. H . , An infrared spectroscopic study of the interaction of carbohydrates with dried proteins . Biochemistry , 28 ( 1989) 3916-3922.
Carvajal, M. T . , Gasior, P . , Phillips, E. M . , Weinrib, A. , Tarantino, R. and Malick, A. W. , Spray drying optimization to produce powder for inhalation. Pharm. Res . . , 1 1 :Suppl. ( 1994) S- 140 .
Chappelet-Tordo, D . , Fosset, M., Iwatsubo, M . , Cache, C. and Lazdunski, M . , Intestinal alkaline phosphatase. Catalytic properties and half of the sites reactivity. Biochemistry, 13 ( 1974) 1788- 1795.
Charm, S. E. and Wong, B. L., Enzyme inactivation with shearing. Biotechnol. Bioeng. , 12 ( 1970) 1 103- 1 109.
Chawla, A., Taylor, K. M. G . , Newton, J. M. and Johnson, M. C. R. , Production of spray dried salbutamol sulphate for use in dry powder aerosol formulation. Int. J. Pharm. , 108 ( 1994) 233-240 .

217
Chlebowski, J. F. and Mabrey, S . , Differential scanning calorimetry of apo- , apophosphoryl , and metalloalkaline phosphatases . J. Biol. Chem. , 252 ( 1977) 7042-7052.
Chowhan, Z. T, Paul, W. L and Grady, L. T . , Harmonization of excipient standards and test methods : challenges and progress. Pharm. Tech. , 18 :6 (1994):78-96.
Cipolla, D. C . , Gonda, ! ' and Shire, S. J . , Characterization of aerosols of human recombinant deoxyribonuclease I (rhDN ase) generated by j et nebulizers . Pharm. Res. , 1 1( 1994a) 491-498 .
Cipolla, D . C . , Clark, A. R . , Chan, H-K. , Gonda, 1 . and Shire, S . J . , Assessment o f aerosol delivery systems for recombinant human deoxyribonuclease. S. T. P. Pharma. Sciences , 4: 1( 1994b) 50-62.
Clark, A. R . , Medical aerosol inhalers: past, present and future . Aerosol Sci. Tech. , 22 ( 1995) 374-391.
C olaco, C . , Sen, S. , Thangavelu, M . , Pinder, S . and Roser, B . , Extraordinary stability of enzymes dried i n trehalose: simplified molecular biology. Bio / Technology, 10 ( 1992) 1007-1011 .
Coleman, J . E . and Chlebowski, J . F . , Molecular properties and mechanism of alkaline phosphatase. In Eichhorn, G. L . and Marzilli , L . G. (Eds . ) Advances in Inorganic Biochemistry - Volume 1 , ElsevierlNorth Holland, New York, 1979, 1-66.
Coleman, J . E. and Gettins, P., Molecular properties and mechanism of alkaline phosphatase . In Spiro, T . G . (Ed . ) Zinc Enzymes, WileyInterscience, New York, 1983, 153-2 17 .
Compton, S . J . and Jones , C . G . , Mechanism o f dye response and interference in the Bradford protein assay. Anal. Biochem. , 15 1 ( 1985) 369-374.
Cullity, B. D. Elements of X - ray diffraction, 2 nd Edition, Addison-Wesley , Reading, MA, 1978, 284-285.
Dalby, R. N. , Byron, P . R . , Shepherd, H. R. and Papadopoulos, E . , CFC propellant substitution: P-134a as a potential replacement for P- 12 in MDIs . Pharm. Tech. , 14 :3 ( 1990) 26-33.
Dalby, R. N. , Naini , V. and Byron, P . R. , Droplet drying and electrostatic collection: a novel alternative to conventional comminution techniques . J. Biopharm. Sci. , 3 : 112 ( 1992) 91-99.

218
Dalby, R. N. and Tiano, S. L . , Rational testing methods for nebulizers and respiratory solutions . In Byron, P. R, Dalby, R N. and Farr, S. J. (Eds . ) , Respiratory Drug Delivery IV, Interpharm Press, Buffalo Grove, IL, 1994, 249-257.
Daly Jr. , J . J. and SanGiovanni, M. L . , Replacements for CFC propellants : a technicaVenvironmental overview. Spray Tech. & Marketing, 3 ( 1993) 34-38.
Daemen, A. L. H. and van der Stege, H. J . , The destruction of enzymes and bacteria during the spray-drying of milk and whey. 2. The effect of the drying conditions. Neth. Milk Dairy J. , 36 ( 1982) 2 1 1-229.
Dietrich, A. , Karl Fischer titration, Part 2 . Standardization, equipment validation, and control techniques. Am. Lab., March ( 1994) 33-39.
Eddington, S . M . , The anatomy of access : peptide drug delivery. Bio / Technology, 9 (1991) 1329-133 1.
Elamin, A. A. , Sebhatu, T . and Ahlneck, C., The use of amorphous model substances to study mechanically activated materials in the solid state . Int . J. Pharm., 119 ( 1995) 25-36.
Engstrom, L., Studies on calf-intestinal alkaline phosphatase. Biochem. Biophys. Acta, 52 ( 1961) 36-48.
Fell, J . T. and Newton, J . M., The production and properties of spray dried lactose: the physical properties of samples of spray dried lactose produced on an experimental drier. Pharm. Acta Helv. , 46 (1971) 425-430.
Franks, F., Hatley, R H. M. and Mathias, S . F., Material science and the production of shelf stable biologicals . Biopharm, 3 : 10 ( 199 1) 38-55.
Franks, F . , and Berg, C . V. D . , A rational approach to the drying of labile biologicals : the role of salts and stabilizers . In Crommelin, D . J. A. and Midha, K. K. (Eds . ) , Topics in Pharmaceutical Sciences - 1 991 , Medpharm Scientific, Stuttgart, Germany, 1992, 233-240 .
French, D . L . , McAuley, A. J . , Chang, B . and Niven, R W . , Moisture induced state changes in spray dried trehalose/protein formulations. Pharm. Res. , 12:Suppl. ( 1995) S-83.
Ford, A. W. and Dawson, P. J . , The effect of carbohydrate additives in the freeze drying of alkaline phosphatase. J. Pharm. Pharmacol. , 45 ( 1993) 86-93.

219
Fosset, M . , Chappelet-Tordo , D . and Lazdunski, M . , Intestinal alkaline phosphatase. Physical properties and quaternary structure . Biochemistry , 13 ( 1974) 1783-1788.
Foster, T. P. and Leatherman, M. W. , Powder characteristics of proteins spray dried from different spray dryers . Drug Dev. Ind. Pharm . , 2 1 : 15 (1995) 1705-1723.
Fries, D. C . , Rao, S. T. and Sundaralingam, M . , Structural chemistry of carbohydrates. III. Crystal and molecular structure of 4-0-B-D-galactopyranosyl-ex -D-glucopyranise Monohydrate (a-Lactose Monohydrate) . Acta Cryst. B27 (1971) 994-1005.
Ganderton, D. and Kassem, N. M. , Dry powder inhalers . Adv. Pharm. Sci. , 6 ( 1992) 165-191.
Gonda, I . , Targeting by deposition. In Hickey, A. J. (Ed.) Pharmaceutical Inhalation Aerosol Technology, Marcel Dekker, New York, 1992 , 6 1-82.
Gonda, I . , Cipolla, D. C. , Shire, S. J. , Meserve, K. , Weck, S . , Clark, A. R and Chan, H-K. , A case study in aerosol protein drug development: aqueous solution aerosols of rhDNase. In Byron, P. R, Dalby R. N. and Farr, S. J . (Eds . ) Respiratory Drug Delivery IV, Interpharm Press, Buffalo Grove, IL, 1994, 47-54.
Green, J .L. and Angell, C.A., Phase relations and vitrification in saccharidewater solutions and the trehalose anomaly. J. Phys. Chem. , 93 ( 1989) 2880-2882.
Hageman, M. J . , The role of moisture in protein stability. Drug Dev. Ind. Pharm. , 14 ( 1988) 2047-2070.
Hancock, B .C . and Zografi, G . , The relationship between the glass transiti on temperature and the water content of amorphous pharmaceutical solids . Pharm. Res. , 1 1 ( 1994) 47 1-477.
Handbook of Pharmaceutical Excipients, Academic Press, New York, NY, 1986, 155.
Hindle, M. and Byron, P .R, Size distribution control of raw materials for dry powder inhalers using the Aerosizer with the Aero-disperser. Pharm. Tech., 19 ( 1995) 64-78.
Hindle, M . , Jashnani , R.J. and Byron, P . R., Dose emissions from marketed inhalers : influence of flow, volume and environment. In Byron,

P. R . , Dalby, R N. and Farr, S. J . (eds . ) , Respiratory Drug Delivery IV, Interphann Press, Buffalo Grove, IL, 1994, 137- 142 .
Hind s , W. C . , Aerosol Technology - Properties, Behav ior, a n d Measurement of Airborne Particles, Wiley-Interscience, New York, 1982, 284-314.
Izutsu, K. , Yoshioka, S. and Terao, T . , Decreased protein-stabilizing effects of cryoprotectants due to crystallization. Pharm. Res. , 10 ( 1993) 1232- 1237.
Jashnani, RJ. , Byron, P.R and Dalby, R.N. , Testing of dry powder aerosol formulations in different environmental conditions . Int. J. Pharm., 1 13 (1995) 123-130.
Karnes, H. T . , Shiu, G. and Shah, V. P . , Validation of bioanalytical methods. Pharm. Res. , 8:4 ( 199 1) 42 1-426.
Kim, E. E. and Wyckoff, H. W . , Reaction mechanism of alkaline phosphatase based on crystal structures . Two metal ion catalysis . J. Mol. BioI., 218 (1991) 449-464.
Labrude, P . , Rosolomanana, C . , Vigneron, C . , Thirion, C . and Chaillot, B . , Protective effect o f sucrose o n spray drying o f oxyhemoglobin. J. Pharm. Sci. , 78 (1989) 223-229.
Laube, B. L . , Georgopoulos, A. and Adams, G. K. , Preliminary study of the efficacy of insulin aerosol delivered by oral inhalation in diabetic patients . J. Am. Med. Assoc. , 269 ( 1993) 2106-2 109.
Lea, C . H. and Hannan, R S. , Studies of the reaction between proteins and reducing sugars in the "dry state" . 1. Effect of activity of water, of pH and of temperature on the primary reaction between casein and glucose. Biochem. Biophys. Acta, 3 ( 1949) 313-325.
Lerk, C. F., Consolidation and compaction of lactose . Drug Dev. Ind. Pharm., 19 ( 1993) 2359-2398 .
Levine, H. and Slade, L . , Another view of trehalose drying and stabilizing biological materials. Biopharm, 5 :5 ( 1992) 36-40.
Lowry, O . H., Roseborough, N. J. , Farr, A. L . and Randall, R. J. , Protein measurement with Folin phenol reagent. J. BioI. Chem. , 193 (1951) 265-275.
Makower, B . and Dye, W. B . , E quilibrium moisture content and crystallization of amorphous sucrose and glucose. J. Agr. Food Chem. , 4 ( 1956) 72-77.

221
Martin, G. P . , Onyechi, J . O . and Mariott, C . , Future prospects for the pulmonary delivery of drugs. S. T. P. Pharma. Sciences, 4 ( 1994) 5- 10 .
Masters, K. , Spray Drying Handbook, 5th Edition, Longman Scientific and Technical, New York, 1991a, 23-66.
Masters, K. , Spray Drying Handbook, 5th Edition, Longman Scientific and Technical, New York, 199 1b, 643-662 .
Matsuda, Y. , Otsuka, M . , Onoe, M and Tatsumi, E . , Amorphism and physical stability of spray dried frusemide. J. Pharm. Pharmacol. , 44 ( 1992) 627-633.
May, K. R . , The Collison nebulizer: description, performance and application. Aerosol Sci. , 4 ( 1973) 235-243 .
McComb, E . A. , Formamide as an extraction solvent in Karl Fischer method for determining moisture in lactose and maltose. Anal. Chem., 29 (1957) 1375.
Molina, M. J. and Rowland, F. S . , Strato spheric sink for chlorofluoromethanes : chlorine atom-catalyzed destruction of ozone. Nature, 249 (1974) 8 10-812.
Moren, F., Dosage forms and formulations for drug administration to the respiratory tract. Drug Dev. Ind. Pharm. , 13 ( 1987) 695-728.
Mumenthaler, M., Hsu, C.C. and Pearlman, R. , Feasibility study on spray drying protein pharmaceuticals: recombinant human growth hormone and tissue plasminogen activator. Pharm. Res. , 11 ( 1994) 12-20.
Naini , V. , Byron, P . R. and Dalby, R. N . , Collection of spray dried respirable particulates using electrostatic precipitation - Effects of air flow and temperature. Pharm. Res. , lO:Suppl. ( 1993) S- 134.
Naini , V. , Byron, P. R. and Phillips , E. M . , Physicochemical stability of crystalline sugars and their spray dried forms : dependence upon relative humidity and suitability for use in powder inhalers . Pharm. Dev. Tech . , submitted, March, 1996.
Niven, R. W. , Delivery of biotherapeutics by inhalation aerosols . Pharm. Tech. , 17 (1993) 72-82.
Niven, R. W., Ip, A. Y. , Mittelman, S. D . , Farrar, C . , Arakawa, T . and Prestrelski, S . J., Protein nebulization: 1 . Stability of lactate dehydrogenase and recombinant granulocyte-colony stimulating factor to air-jet

222
nebulization. Int. J. Pharm. , 109 ( 1994) 17-26.
Oglesby Jr . , S . and Nichols . , G. B., Electrostatic Precipitation . M arcel Dekker, New York, 1978, 1- 13 .
Otsuka, M . , Ohtani, H . , Otsuka, K. and Kaneniwa, N. , Effect of humidity on solid-state isomerization of various kinds of lactose during grinding. J. Pharm. Pharmacol. , 45 ( 1992) 2-5.
Parrott, E . L. , Milling of pharmaceutical solids. J. Pharm. Sci. , 63:6 ( 1974) 813-829.
Patton, J. S . , Trinchero, P. and Platz, R. M . , Bioavailability of pulmonary delivered peptides and proteins : a-interferons, calcitonins and parathyroid hormones . J. Controlled Release, 28 ( 1994) 79-85 .
Patton, J .S . and Platz, R M . , (D) Routes of delivery: case studies , pulmonary delivery of peptides and proteins for systemic action. Adv. Drug Del. Rev. , 8 ( 1992) 179-196.
Pazur, J. H . , Oligosaccharides . In Pigman, W. and Horton, D. (Eds . ) , The Carbohydrates : Chemistry and Biochemistry, (Volume IIA) , 2 nd Edition. Academic Press, New York, 1970, 69- 129.
Phillips, E. M . and Stella, V. J . , Rapid expansion from supercritical solutions: application to pharmaceutical processes . Int. J. Pha rm . , 94 (1993) 1-10.
Phillips, E .M . , Ahmed, H . , Carvajal, M .T . , Fanale, K., Sethatekukul , K. , Rana, J . , Tarantino , R and Malick, A.W. , Formulation development of spray dried powders for inhalation. Pharm. Res. , l 1 :Suppl. ( 1994) S- 158 .
Pigman, W. and Anet, E . F . L . J . , Mutarotations and actions of acids and bases . In Pigman, W. and Horton, D . (Eds . ) , The Carbohydrates -Chemistry and Biochemistry, (Volume lAY, 2 nd Edition. , Academic Press, New York, NY, 1972, 165- 194.
Pikal, M . J . , Freeze-drying of proteins - Part II: formulation selection. Biopharm, 3 ( 1990) 26-30.
Pine, S . H. , Organic Chemistry, 5th Editio n , McGraw Hill , New York, 1987a, 768-772.
Pine, S . H., Organic Chemistry, 5th Edition , McGraw Hill , New York, 1987b, 224-227.

Prestrelski, S. J . , Arakawa, T. and Carpenter, J. F . , Separation of freezingand drying-induced denaturation of lyophilized proteins using stres s specific stabilization: I I . Structural studies using infrared spectroscopy. Arch. Biochem. Biophys. , 303 ( 1993) 465-473.
Prestrelski, S .J . , Tedeschi, N. , Arakawa, T. and Carpenter, J.F. , Dehydrationinduced conformational transitions in proteins and their inhibition by stabilizers, Biophys. J. , 65 ( 1993) 661-67 1 .
Pristoupil, T. 1 . , Kramiova, M. , Fortova, H . and Ulrych, S . , Haemoglobin lyophilized with sucrose : the effect of residual moisture on storage . Haematologia, 18 ( 1985) 45-52.
Raemy, A. and Schweizer, T .F . , Thermal behavior of carbohydrates studied by heat flow calorimetry. J. Therm. Anal. , 28 ( 1983) 95- 108.
Robinson, M . , Electro static Precipitation. In M oore , A. D. ( E d . ) Electrostatics and its Applications" Wiley, New York, 1973, 180-220.
Roos, Y. , Melting and glass transitions of low molecular weight carbohydrates. Carbohydr. Res. , 238 ( 1993) 39-48 .
Roos, Y. and Karel, M . , Plasticizing effect of water on thermal behavior and crystallization of amorphous food models . J. Food Sci. , 56 ( 1991) 38-43 .
Rye, A. and Sorum, H . , Crystalline modifications of D-Mannitol . Acta Chem. Scand. , 6 ( 1952) 1 128-1 129.
Sakharov, 1 . Y., Makarova, 1. E. and Ermolin, G . A, Purification and characterization of intestinal alkaline phosphatase from harp seal. Compo Biochem. Physiol. , 90B ( 1988) 709-7 14.
Saleki-Gerhardt, A. and Zografi, G., Non-isothermal and isothermal crystallization of sucrose from the amorphous state . Pharm. Res. , 11 ( 1994) 1166-1173.
Scholz, E. Karl Fischer Titration, Determination of Water, Che m ical Laboratory Practice. Springer-Verlag, Berlin, 1984.
Sedmak, J . J . and Grossberg, S. E. , A rapid, sensitive, and versatile assay for protein using Coomassie blue G250. Anal. Biochem. , 79 ( 1977) 544-552.
Segel , 1 . H. , Biochemical Calculations, 2nd Edition . Wiley, New York, 1976, 281-293.
Slade, L. and Levine, H . , Beyond water activity: recent advances based on

224
an alternative approach to the assessment of food quality and safety. Grit. Rev. Food Sci. Nutr. , 30 ( 1991) 115-360.
Small Particle Aerosol Generator - SPAG2, Instructions for Use , ICN Pharmaceuticals, Inc. , Costa Mesa, CA, 1989.
Sowadski, J . M., Handshumacher, M. D., Krishna Murthy, H. M . , Foster, B . A. and Wyckoff, H . • W., Refined structure of alkaline phosphatase from Escherichia coli at 2 .8 A resolution. J. Mol. Biol. 186 ( 1985) 416-422.
Staniforth, J . N., The importance of electrostatic measurement in aerosol formulation and preformulation. In Byron, P. R, Dalby, R N. and Farr, S . J . (eds . ) , Respiratory Drug Delivery IV, Interpharm Press, Buffalo Grove, IL, 1994, 303-311 .
STATGRAPHICS Plus, Version 6. 0 , Manugistics , Inc . , Rockville, MD, 1992.
Taga, T . , Senma, M. and Osaki, K. , The crystal and molecular structure of trehalose dihydrate. Acta Gryst. B28 ( 1972) 3258-3263.
Tarelli, E. and Wood, J . M . , Additives to biological substances . 1. Effect of added carbohydrates on bovine serum albumin. J. Biol. Stand. , 9 ( 1981) 121-129.
Tarelli , E. and White, C. A, Additives to biological substances . I I . Relative stabilities of some carbohydrate additives at and around neutral pH values in the phosphate buffers and water. J. Biol. Stand. , 10 ( 1982) 95- 103.
Tarelli, E. , Elphick, A D., Gostick, J . D. and Stammers, R P. , Additives to biological substances. III . The moisture content and moisture uptake of commonly used carrier agents undergoing processing conditions similar to those used in the preparation of international biological standards. J. Biol. Stand. , 15 ( 1987) 33 1-340.
Taylor, L .S . , York, P. and Mehta, V. , Phase characterization of trehalose dihydrate. Pharm. Res. , 1 1 :Suppl. ( 1994) S- 151 .
Timasheff, S . N. and Arakawa, T . , Stabilization of protein structure by solvents . In Creighton, T . E . (Ed . ) , Protein Structure : A Practical Approach , IRL Press, Oxford, 1989, 33 1-345 .
Tom, J. W. and Debenedetti, P. G . , Particle formation with supercritical fluids - A review. J. Aerosol Sci. , 22:5 ( 199 1) 555-584.
Torriani, A, Alkaline phosphatase of Escherichia coli . Methods Enzymol. ,
225
12B (1968) 212-218.
United States Pharmacopeia , USP23 /NF18. , United States Pharmacopeial Convention, Rockville, MD, 1994a, 2258-2259.
United States Pharmacopeia , USP23 / NF 18. , United States Pharmacopeial Convention, Rockville, MD, 1994b, 1840-1843.
United States Pharmacopeia , USP23 / NF18., First Supplement, United States Pharmacopeial Convention, Rockville, MD, 1995, 2584.
Van Campen, L., Amidon, G.L. and Zografi, G. , Moisture sorption kinetics for water soluble substances I I : experimental verification of heat transport control. J. Pharm. Sci. , 72 ( 1983) 1388-1393 .
Vidgnln, M.T . , Vidgren, P.A. and Paronen, T .P . , Comparison of physical and inhalation properties of spray-dried and mechanically micronized disodium cromoglycate. Int. J. Pharm. , 35 ( 1987) 139- 144.
Vidgren, P. A., Vidgren, M. T. and Paronen, T. P., Physical stability and inhalation behavior of mechanically micronized and spray dried disodium cromoglycate in different humidities. Acta Pharm. Fenn. , 98 ( 1989) 7 1-78 .
Wallace , B . M. and Lasker, J . S . , Stand and deliver: getting peptide drugs into the body. Science, 260 (1993) 912-913.
White, H. J. , Particle charging in electrostatic precipitation. AlEE Trans. , 70 ( 1951) 1186-1191.
White, H . J . , Industrial Electrostatic Precipitatio n , Addison-Wesley, Reading, MA, 1963, 33-47 .
Yernault, J . C . , Inhalation therapy: a historical perspective. Eur. Respir. Rev. , 4 ( 1994) 65-67.
Yeo, S . , Lim, G . , Debenedetti , P. G. and Bernstein, H . , Formation of microparticulate protein powders using a supercritical fluid anti solvent. Biotech. Bioeng. , 41 ( 1993) 341-346.
Zografi, G . , States of water associated with solids . Drug Dev. Ind. Pharm . , 14 ( 1988) 1905-1926.

APPENDIX I. CALCULATION OF THEORETICAL PARTICLE
COLLECTION EFFICIENCIES INSIDE THE ELECTROSTATIC
PRECIPITATOR USING PARTICLE CHARGING THEORY
AL a INTRODUCTION
Aerosol velocities in an electric field can be much higher than
gravitational or inertial velocities (Hinds, 1982). This fact is exploited in the
design and use of electrostatic precipitators. The electrostatic precipitation
process consists of three fundamental steps; particle charging, particle
collection and removal of the collected dust (Oglesby and Nichols , 1978) .
Particles charging in electrostatic precipitation is usually achieved by two
mechanisms : field charging and diffusion charging ( Hinds , 1 9 8 2 ) .
"Diffusion charging" i s believed t o b e the dominant mechanism for aerosols
smaller than 0 . 1 �m, where collisions result from the Brownian motion of
ions and aerosols (Hinds, 1982). However, "Field charging" is thought to be
the dominant mechanism for aerosols larger than or equal to 1 �m. For
aerosols between these two sizes, charging is achieved by a combination of
the two mechanisms. Both mechanisms require the production of unipolar
ions (Hinds, 1982) . To achieve useful aerosol charging for electrostatic
precipitation, high concentrations of such unipolar ions are often produced
by a corona discharge . Providing a sufficient nonuniform electric field
226

between a concentric wire (active electrode) and tube (grounded or passive
electrode) can provide such a discharge, which is characterized by a thin
layer of highly charged ions surrounding the wire . The ions then migrate
towards the passive electrode (the tube in the precipitator) causing further
ionization of the gas . If the gas contains fine particles, these are bombarded
by the ions causing the aerosol particles to acquire high number of charges .
The charged particles then migrate towards the passive electrode, where
they are deposited. Particle deposition in electrostatic precipitators depend
on a variety of factors, like particle size of the dust, volumetric air flow
through the system, applied electric field strength, conductivity/resistivity
of the collected dust and particle re-entrainment of particles in the air
stream .
AI.h THEORETICAL CALCULATION OF AEROSOL COLLECTION
EFFICIENCY IN A wm.E·IN·TUBE ELECTROSTATIC PRECIPITATOR
Theoretical particle collection efficiencies inside an electrostatic
precipitator can be calculated using the Deustch-Anderson equation
(Hinds, 1982):
E' = 1 - e(VTE *AlQ) . . . . . . . . . . . . . . . . . . . . . . . . . Equation AL I
where E ' is the collection efficiency, VTE is the terminal electrostatic
velocity, A is the collection surface area and Q is the volumetric air flow
rate. The terminal electrostatic velocity (VTE) is given by:
VTE = neE I (31tl1d) . . . . . . . . . . . . . . . . . . . . . . . . . . Equation AL2
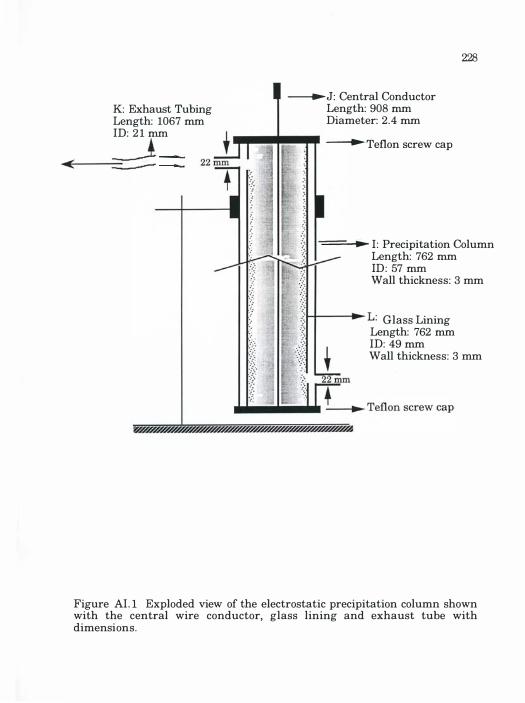
K: Exhaust Tubing Length: 1067 mm ID: 2 1 mm
�<�----� � =
�J: Central Conductor Length: 908 mm Diameter: 2.4 mm
228
..... I11!1 .. -... � Teflon screw cap
.: .
" ':
--__ .� I : Precipitation Column Length: 762 mm ID: 57 mm Wall thickness: 3 mm
,,:HI----� L: Glass Lining Length: 762 mm ID: 49 mm Wall thickness: 3 mm
Figure AL l Exploded view of the electrostatic precipitation column shown with the central wire conductor, glass lining and exhaust tube with dimensions.

229
where E is the electric field strength, � is the viscosity of air ( 1 . 8 1 x 1 0 -4
dyn. s/cm2), e is the charge on an electron (4.8 x 10 -10 statcoulombs), d is the
particle diameter and n is the number of charges on the particle .
The electric field strength (E) for a wire-in-tube geometry is given by:
E = t'1 W / [rt In(rJrw)] . . . . . . . . . . . . . . . . . . . . _ Equation AL3
where t'1W is the difference in voltage between wire and tube, rt is the
radius of the tube (in these studies it is the radius of the glass tubing-I = 2 .4
cm, Figure AL I) and rw is the radius of the wire (rw = 0 . 12 cm, Figure AL I)
The number of charges on the particle (n , Equation AL2 ) was
calculated by making the following simplifying but not invalidating
assumptions: 1) Turbulent air flow in the system (particle Reynolds
number 1) , 2) aerosol particles are charged by a field charging mechanism
(uniform particle diameter of �1 �m at a drying temperature of 4 1 °C and 3 )
aerosols are uniformly distributed across every cross section of the
precipitator. The number of charges (n) acquired by a particle during time
t, in an electric field E if diffusion charging is neglected (assumed to be
insignificant) is given by:
n = [3£ I (£ + 2)] x [E d2 / 4e] x [ (neZiNit) 1 ( 1 + neZiNit)] . . . . . . . Equation AI.4
where E is the dielectric constant of the particle (assumed to be 5 for lactose,
since most materials have 1 < E < 10, Hinds, 1982), E is the electric field
strength, d is the diameter of the particle, e is the charge on an electron, Zi
is the mobility of the ions (approximately 450 cm2/statvolts; Hinds, 1 982), N;
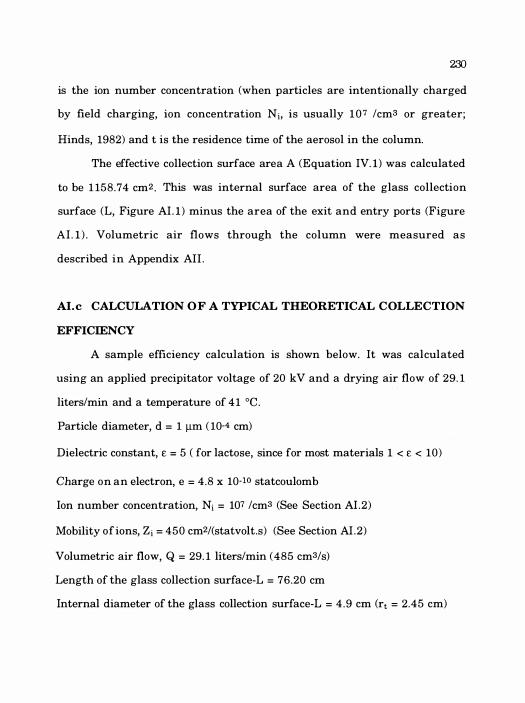
230
is the ion number concentration (when particles are intentionally charged
by field charging, ion concentration Ni, is usually 1 0 7 /cm3 or greater;
Hinds, 1982) and t is the residence time of the aerosol in the column.
The effective collection surface area A (Equation IV. 1) was calculated
to be 1 158 .74 cm2 . This was internal surface area of the glass collection
surface (L, Figure AL I) minus the area of the exit and entry ports (Figure
AL I ) . Volumetric air flows through the column were measured as
described in Appendix All .
AL e CALCULATION OF A TYPICAL THEORETICAL COLLECTION
EFFICIENCY
A sample efficiency calculation is shown below. It was calculated
using an applied precipitator voltage of 20 kV and a drying air flow of 29. 1
liters/min and a temperature of 4 1 ce .
Particle diameter, d = 1 !lIIl ( 10-4 cm)
Dielectric constant, E = 5 ( for lactose, since for most materials 1 < E < 10)
Charge on an electron, e = 4.8 x 10⁻¹⁰ statcoulomb
Ion number concentration, Ni = 107 /cm3 (See Section AL2)
Mobility of ions, Zi = 450 cm2/(statvolt.s) (See Section AL2)
Volumetric air flow, Q = 29. 1 liters/min (485 cm3/s)
Length of the glass collection surface-L = 76.20 cm
Internal diameter of the glass collection surface-L = 4 .9 cm (rt = 2.45 cm)
Diameter of the wire conductor-J = 0 .24 cm (rw = 0 . 12 cm)
Collection surface area, A = 1 158 . 7 cm2
Difference in voltage between wire and tube, t>W = 20 kV
From Equation AI .3
E = 20 I [2.45 In(2.45 I 0 . 12)]
= 2 .71 kV/cm
231
= 9.03 statvolts/cm [1 statvolt = 300 V; cgs units are used for the advantage
of simplified equations]
STEP 1: Calculate the residence time,t of the aerosol in the column:
t = (1trt2 x length of glass tube) I Q
= 2.9 s
STEP 2: Calculate [3£ I (£ + 2)] = 2. 14
STEP 3: Calculate [E d2 1 4e] = [9.03 (statvoltlcm) x 00.4)2 (cm2)] I [ 4 x (4 .8 x
10.10) (statcoulomb)]
= 47.03 [no units since statvolt.cm = statcoulomb; Hinds, 1982]
STEP 4: Calculate 1teZjNjt = 1t [(4 .8 X 10- 1 0 ) (statcoulomb) x 450 {cm2 I
(statvolt.s)} x 007 Icm3) x 2.9 s]
= 19.68 [no units since statvolt .cm = statcoulomb]

STEP 5: Using Equation AI .4 calculate n
n = (2. 14 x 47) x [19.68 / ( 1+19.68)]
= 96
232
Terminal electrostatic velocity VTE can now be calculated from Equation
AI . 3
STEP 6 : Calculate VTE = [96 x (4.8 x 10-10) (statcoulomb) x 9 .07 (statvolUcm)] /
[3 1t x ( 1 .81 x 10-4) (dyn.s / cm2) x ( 10-4)2 (cm2)]
= 2.45 cmls
STEP 7: Knowing the volumetric air flow (Q) , collection surface area (A)
and VTE Equation AL I can now be applied to calculate the efficiency E'
E' = 1 - e[-2.45 (emls) x 1 158.74 (em2) I 485 (emS/s)]
= 0.9971.
Expressed as a percentage this is = 99 . 7 1%
Collection efficiencies calculated using the above method for two flow
regimes of 29. 1 liters/min and 50.6 liters/min and different electrostatic
precipitator voltages are shown in Table AL l . These values were used for
generating the theoretical collection efficiency curves shown in Figure
IV. 1 5 .
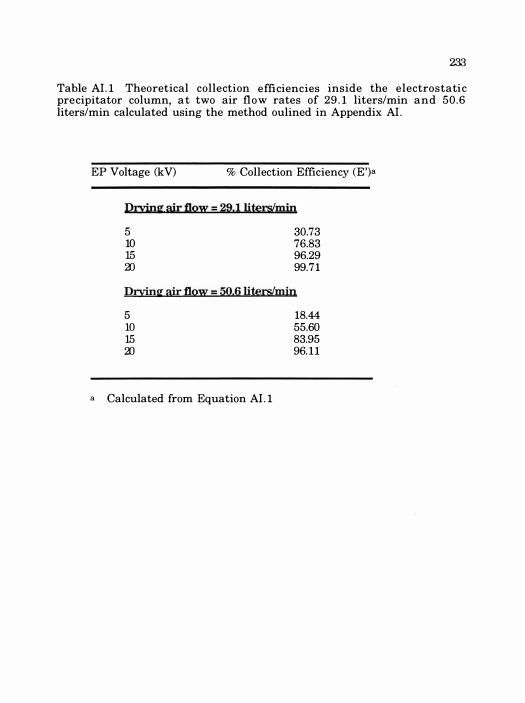
233
Table AL I Theoretical collection efficiencies inside the electrostatic precipitator column, at two air flow rates of 29 . 1 liters/min and 50 .6 liters/min calculated using the method oulined in Appendix AI .
EP Voltage (kV) % Collection Efficiency (E')a
Drying air flow - 29,l literstmin 5 10 15 al
30.73 76.83 96.29 99.71
Drong air flow = 5O,6 literslmin 5 10 15 al
a Calculated from Equation AL I
18.44 55.60 83.95 96. 11

APPENDIX II. DETERMINATION OF TOTAL VOLUMETRIC Am FLOW
TlffiOUGH THE PARTICLE COLLECTION APPARATUS
AII. a INTRODUCTION
This Appendix describes the determination of volumetric air flows
through the particle collection apparatus used in Chapter IV, at different
voltage settings of the autotransformer controlling air flow rate from the
hot air gun (D, Figure IV. 1 ) . Flows were determined using a calibrated
pneumotachograph attached to a micromanometer.
AII.h CALIBRATION OF THE PNEUMOTACHOGRAPH HEAD
A pneumotachograph (Catalog #FIOL , Mercury Electronics ,
Glasgow, Scotland, UK) was cleaned and calibrated using a calibrated flow
meter (rotameter size #5, catalog #FI500, Gilmont Instruments Inc . ,
Barrington, I L ) . The experimental set up for calibration of the
pneumotachograph is shown in Figure AIL l . The flow control valve
(Figure All . 1) was adjusted to give different scale readings on the
flowmeter (center of the ball) . At each setting of the flow valve, the apparent
cumulative volume of air ( 1 atm and 70 OF) fl owing through the
pneumotachograph head in 5 seconds was measured using the VP-5
Micromanometer (VP5, Mercury Electronics, Glasgow, Scotland, UK), in
234

Air Flow
+ Pnemnotachograph
• FlowDleter
Flow control valve
235
\nP-5 �icroDlaJ1oDleter
.. CODlpressed air supply
Figure AIL 1 Calibration of the pneuDlotachograph using a calibrated flowDleter and a DlicroDlanoDleter.

Air Flow
� VP-5 Micromanometer
�
L
• • 1::::111;31 • •
. 0 .
SPAG - 2
!
KEY
A - NebulizerReservoir B - SPAG Drying chamber C - Secondary drying
chamber D - Hot air gun E - Rheostat controlling
air flow F - Rheostat controlling
temperature G - High voltage supply H - Thermometer I - Electrostatic
precipitation column J - Central wire conductor K - Exhaust tubing L - Glass lining NA-Nebulizer air flow DA-Drviml air flow
Compressed Air Supply
Figure AII .2 Experimental set up for the measurement of volumetric air flow through the apparatus using a calibrated pneumotachograph at different voltage setting on rheostat E . �

2.�.---------------------------------------------.
Air Flow (liters/min) (calibrated rotameter)
Figure AII . 3 Calibration plot of apparent cumulative air volume entering the pneumotachograph head in 5 seconds (VP5 Units) vs air flow in liters/min. Plotted values are experimental determinations. The straight line is the best fit by linear regression [ y = 0 .023 17x, r2 = 0 .99, standard error of slope = 0 .000 14, n = 56]
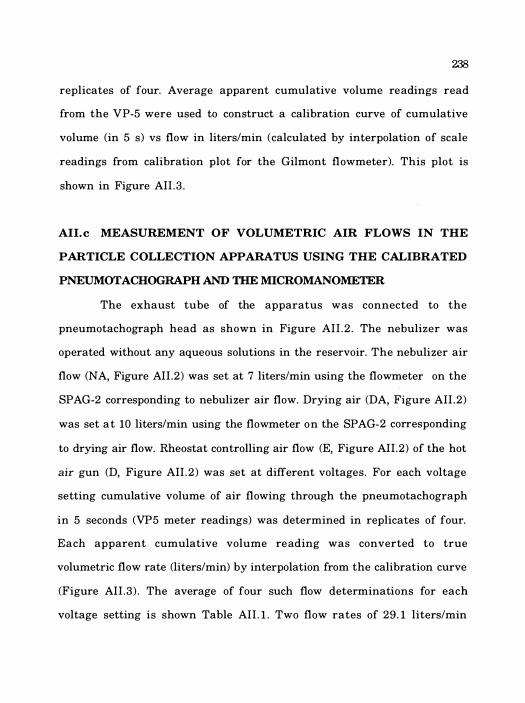
238
replicates of four. Average apparent cumulative volume readings read
from the VP-5 were used to construct a calibration curve of cumulative
volume (in 5 s) vs flow in liters/min (calculated by interpolation of scale
readings from calibration plot for the Gilmont flowmeter). This plot is
shown in Figure AIL3 .
AIL e MEASUREMENT OF VOLUMETRIC AIR FLOWS IN THE
PARTICLE COLLECTION APPARATUS USING THE CALIBRATED
PNEUMOTACHOGRAPH AND THE MICROMANOMETER
The exhaust tube of the apparatus was connected to the
pneumotachograph head as shown in Figure AIL 2 . The nebulizer was
operated without any aqueous solutions in the reservoir. The nebulizer air
flow (NA, Figure AII .2) was set at 7 liters/min using the flowmeter on the
SPAG-2 corresponding to nebulizer air flow. Drying air (DA, Figure AII .2 )
was set at 10 liters/min using the flowmeter on the SPAG-2 corresponding
to drying air flow. Rheostat controlling air flow (E, Figure AII .2) of the hot
air gun (D, Figure AIL 2 ) was set at different voltages. For each voltage
setting cumulative volume of air flowing through the pneumotachograph
in 5 seconds (VP5 meter readings) was determined in replicates of four.
Each apparent cumulative volume reading was converted to true
volumetric flow rate (liters/min) by interpolation from the calibration curve
(Figure AIL3) . The average of four such flow determinations for each
voltage setting is shown Table AIL ! . Two flow rates of 29 . 1 liters/min

239
(corresponding to a voltage of 8 V) and 50 .6 liters/min (corresponding to a
voltage of 12 V) were used in experiments in Chapter IV.

240 Table AI! . 1 Volumetric flow rate at differerent voltage settings on the rheostat controlling air flow (E, Figure All . 1) of the hot air gun.
Voltage Setting (V)
4 6 8 10 12 14 16 18 aJ
Air Flow Oiters/min)a
5.8 (0.8) 19.3 (0.8) 29. 1 (0.8) 41.2 (1 .3) 50.6 (1 .5) 57.8 (0.8) 64. 1 (0.8) 69.9 (1 .3) 73.9 (1 .5)
a Values are mean (sample SD), n=4

APPENDIX III. SUMMARY OF RAW DATA FOR ALKALINE
PHOSPHATASE ENZYME ACTIVITES AND PROTEIN
CONCENTRATIONS (IN BSAE) USED IN CALCULATION OF ENZYME
SPECIFIC ACTIVITIES
This Appendix summarizes the raw data for enzyme activities of
bacterial (Table AIlI . l ) and bovine intestinal (Table AIl I . 2 ) alkaline
phosphatase and protein concentrations in the solutions assayed. These
data were used for the determination of mean specific acivities as reported
in Chapter V (Tables V.4 and V.6).
241
Table AII! . 1 Summary of raw data for bacterial alkaline phosphatase enzyme (BAP) activity and protein concentrations (in BSAE) . This data was used to calculate mean specific activities as given in Table VA (Chapter V). BAP - Sugar free BAP; BAPL - BAP with lactose; BAPT - BAP with trehalose; BAPS - BAP with sucrose and BAPM - BAP with mannitol .
�

INITIAL SOLUTION
Enzyme Activity (Units/ml) Protein Concentration (�g BSAE/ml)
BAP 63.0 54.0 54.7 58.7 60.7 59.9 4. 1 3 .8 3 .9 3 .6 3 .5 3 .5
BAPL 63.6 56.7 60.0 59.9 62.6 59. 1 4.2 3 .2 3 .6 4.0 4. 1 4. 1 I BAPT 60.8 57.6 59.4 60.3 56.3 59.3 4.2 4. 1 3 .5 3 .9 4.0 4.2
BAPS 55.3 59.0 61 .8 57.4 60.4 60. 1 3 .6 3 .6 3 .8 3 .8 4 .2 4.3
BAPM 49. 1 45.2 59.8 55.2 60.7 60. 7 3 .2 2 .5 3 .3 3 .7 4 .2 4 .2
NEBULIZER RESERVOIR
Enzyme Activity (Units/ml) Protein Concentration (�g BSAE/ml)
BAP 89.2 65. 1 7 7 . 1 60. 1 93. 1 101.6 6 . 1 4 .8 5 .7 3 .6 5 .4 5 .9
BAPL 108.7 36.6 6 1 . 1 92.9 1 14.6 75.5 6 .6 2 .1 3 .7 6 .6 7 .6 5 .3
BAPT 93.8 88.9 52.4 72. 7 95.4 85.8 6.7 6.8 2 .8 5 .0 6 .8 6 .3
BAPS 90.2 81 .4 59.4 80.0 95.4 85. 1 6 .3 4 .7 4.2 5 .6 6 .7 5 .9
BAPM 62. 1 41 .9 60.6 90.8 103.8 85. 1 4.0 2.4 3 .6 6 .2 7 .3 6 .1
SPRAY DRIED
Enzyme Activity (Units/ml) Protein Concentration (�g BSAE/ml)
BAP 20.3 25. 1 72.9 1.6 2 . 1 6 . 3
BAPL 25.2 22.4 19.3 2.0 1 . 7 1 . 8
BAPT 62. 1 38.0 56.3 5 . 1 3 . 2 3 . 8
BAPS 40.4 42.9 66.2 3.4 3.4 5.0
BAPM 13.9 18.4 63.4 1.8 1 .8 6 .3
SPRAY DRIED AND STORED
Enzyme Activity (Units/ml) Protein Concentration (�g BSAE/ml)
BAP 70.8 66.2 41.4 6.9 6.6 3 . 7
BAPL 43.0 24.9 54. 1 3 .8 2 .6 4.2
BAPT 54.5 21.0 50.9 4 .7 2 .2 4 .4
BAPS 35.4 54.8 35.3 2.9 5.3 3.4
BAPM 16.8 14.7 19.4 2.4 1 .7 _ 1.7 __ I_ I �

Table AIII .2 Summary of raw data for bovine intestinal alkaline phosphatase enzyme (BIAP) activity and protein concentrations (in BSAE). This data was used to calculate mean specific activities as given in Table V.6 (Chapter V). BIAP - Sugar free BIAP; BIAPL - BIAP with lactose; BIAPT - BIAP with trehalose; BIAPS - BIAP with sucrose and BIAPM - BIAP with mannitol .
t

INITIAL SOLUTION
Enzyme Activity (Units/m!) Protein Concentration (�g BSAE/ml)
BIAP 30.0 29.9 31 .0 29. 1 33.0 33.6 3 .3 3 .2 3.3 3 .6 4 .1 3.9
BIAPL 3 1.4 30.9 38.8 29.4 34.3 32.0 3.2 3.3 3.3 3 .7 4. 1 3.3
BIAPT 32.8 34.4 29.2 32.4 31 .9 31 .4 3 .5 3 .5 3.4 4.0 4 . 1 3 .9
BIAPS 3 1.3 33.5 31 .3 33.5 30. 7 30. 1 3 .6 3 .3 3 .3 4.2 4. 1 3 .8
BIAPM 32.0 30. 1 31 .3 33.4 30.9 34.6 3.6 3 .4 3 .3 4.0 3.9 3 .5
NEBULIZER RESERVOIR
Enzyme Activity (Units/m!) Protein Concentration (�g BSAE/m!)
BIAP 41 .6 35.9 37.8 57.0 47. 1 43.5 4.5 3 .8 4.0 6 .8 5 .5 4.8
BIAPL 42.5 42.8 52.9 36.5 42.8 42.5 4 .4 4 .4 4 .3 5 .0 4 .9 4. 1
BIAPT 30.5 32.8 46.3 42.3 41.2 44.0 3.2 3 .3 4 .6 5 .7 5 .3 4 .9
BIAPS 37.7 50.6 45. 1 44.5 42.4 38 .7 4 .2 5 .2 4.6 5 .5 5 .3 4.7
BIAPM 38.4 41.0 38.6 44.5 42.2 45.5 4.2 4.5 4.0 5 .3 4 .9 4 .5
SPRAY DRIED
Enzyme Activity (Units/m!) Protein Concentration (�g BSAE/m!)
BIAP 27. 1 23.9 24.0 4.2 4.0 4. 1
BIAPL 33. 1 33.8 41 .4 3 .5 3 .5 3 .4
BIAPT 42.3 42. 1 28.9 4.4 4.2 3. 1
BIAPS 3 1 . 1 31 .8 27 .9 3 .4 3 .3 2.8
BIAPM 16.5 19.6 16.7 3.3 3 .7 3. 1
SPRAY DRIED AND STORED
Enzyme Activity (Units/m!) Protein Concentration (�g BSAE/m!)
BIAP 26.3 22.7 17 .1 5 .3 4.3 4.0
BIAPL 34.3 29.0 29.5 4.3 3 .0 3.4
BIAPT 27.6 26.3 30.8 3.3 3.0 3.3
BIAPS 29.9 25. 1 35 .1 3 .6 2 .5 3 .5
BIAPM 6.5 14·L �1 1 .9 3 . 1 3 . 1 �

APPENDIX IV. THERMAL ANALYSIS OF CRYSTALLINE SUGARS
AND THEm SPRAY DRIED FORMS
This Appendix presents the thermogravimetric analysis (TGA) and
differential scanning calorimetry (DSC) profiles of different sugar forms .
D S C and TGA were performed as described in Sections I I I .b . 2 .4 and
III .b .2 .5 respectively (Chapter III ) .
In each of the Figures subscript 0 and 30 refer to before and after
storage for 30 days at different humidities. Key: A=Coarse fraction, B=Fine
fraction, C=Spray dried. Subscripts : a=Stored in sealed bottles over P 205;
b=23% RH, c=52% RH, d=75% RH and e=93% RH. Only TGA was performed
on A and B before and after exposure at different RH.
246

247
,------------------------.- 9.0
100 �-----------
ED .L.-�___' __ __'_ __ _'_ __ ..L._ _ __'_ __ _'_---'----.-l. 0.0 3) ro 150 210 270
Temperature (Oe)
Figure AIV. l TGA (top) and D SC (bottom) profiles for forms Ao , Bo , A30a,b,c,d,e and B30a,b,c,d,e of lactose.

248
...----------------------""""T 9.0
100
oo,!-_.:......... __ --'-__ '--_--'-__ --'--_----'-__ -'-_----1 0.0 30 150 210 270
Temperature (OC)
Figure AIV.2 TGA (top) and DSC (bottom) profiles for forms Co and Caoa of lactose .

249
r--------------------� 9.0
W .L-_----'-_�__'_ _____ _'_ _ ___a. __ __'_ _ ___a. __ _1 0.0 :J) 00 150 210 270 Temperature (OC)
Figure AIV.3 TGA (top) and DSC (bottom) profiles for form C30b of laetose .
250
�----------------------------------------� �o
l00�--------------------
IDL-_--'-__ --'-__ "---_----'-__ -'--_--'-__ --'-_----1 0.0 ro 00 210
Figure AlV.4 TGA (top) and DSC (bottom) profiles for forms C30c ,d,e of lactose.
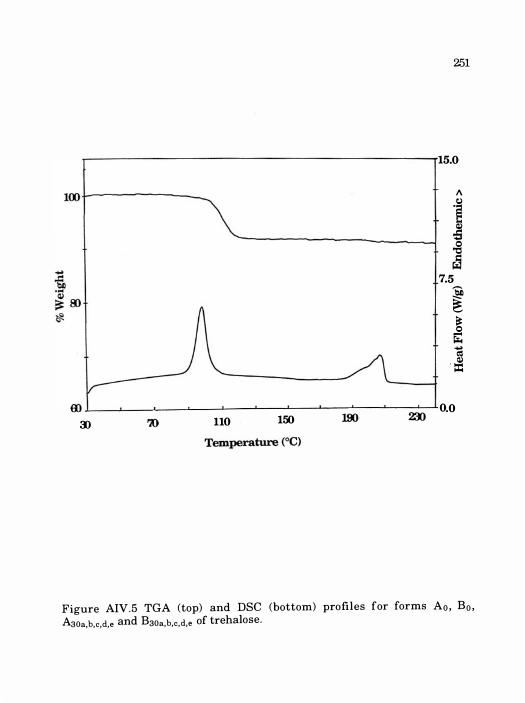
251
15.0
l00 L-------------- A
.� � .g �
7.5 .-� � � 0 r;: .... c:I . �
m L-__ � __ J_ __ � __ � __ � __ � __ � __ � __ � __ �� :J) 110 150 ZD
0.0
Figure AIV.5 TGA (top) and DSC (bottom) profiles for forms Ao , Bo ,
A30a,b,c,d,e and B30a,b,c,d,e of trehalose.
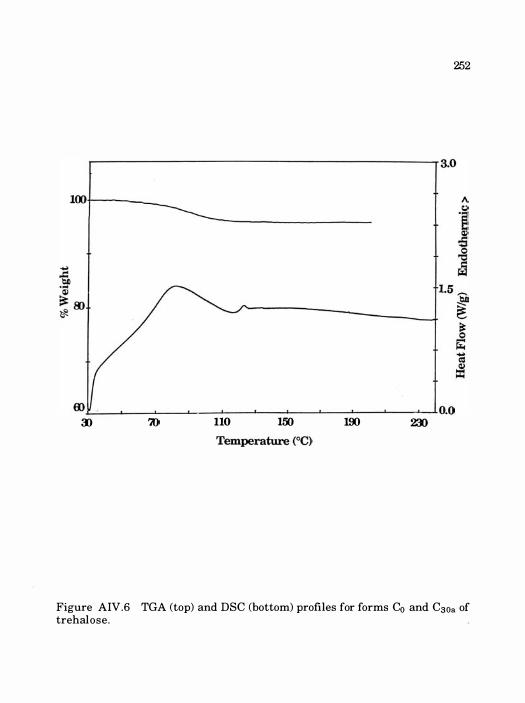
252
�------------------------------------------� 3.0
100-1--__ _
OOL..:..._-'--_-'-_-'-__ --'--_--L-_--L-_--'-_--'-_---L_--'--L 0.0 :I) 110 150 190
Figure AIV.6 TGA (top) and DSC (bottom) profiles for forms Co and Caoa of trehalose .

253
�----------------------------------------�ao
m L--'--__ -'--__ -'--_ _'_ _ _'__-'--_-'---_-'-_"'-_ -'---..----L 0.0 aJ 140 240
Figure AIV. 7 TGA (top) and DSC (bottom) profiles for form C 3 0b of trehalose .

254
.----------------------..,. 15.0
100 �------------------__ __
Temperature (Oe)
Figure AIV. 8 TGA (top) and DSC (bottom) profiles for forms C30c.d.e of trehalose.

255
r-----------------------� 12.0
l00r---------------�--------------------�
iD L-_-'-_----'-______ '--_--'--_--'-_----"-_----' __ "'--_J 0.0 ID 00 150 210
Temperature (OC)
Figure AIV. 9 TGA (top) and D SC (bottom) profiles for forms Ao , Bo , A30a,b,c,d and B30a,b,c,d of sucrose .

256
.-____________________ ----.. 12.0
100 +----
Figure AIV. I0 TGA (top) and DSC (bottom) profiles for forms Co and C30a of sucrose .
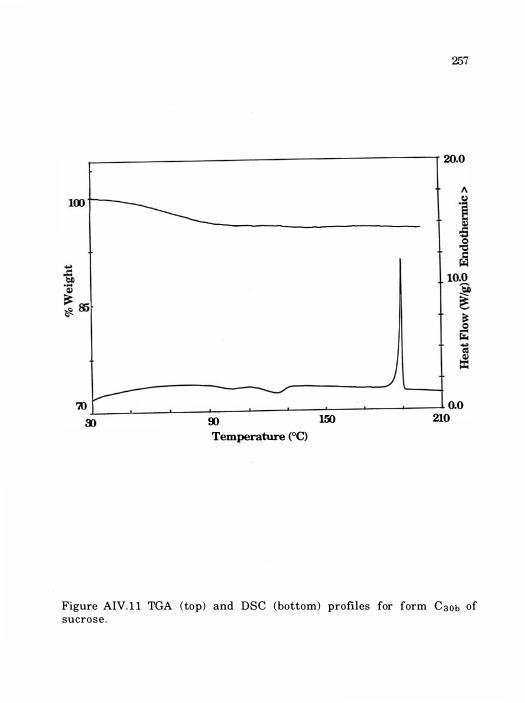
'2157
.------------------------,- 20.0
l00� ---------------------
00 150
Temperature (OC)
-
0.0 210
Figure AIV. l l TGA (top) and DSC (bottom) profiles for form C 3 0b of sucrose .

258
8.0
100 II
.� ..s .g � t5 fo
. ... 4.0 � � 00 � � �
� � � cu �
g) 0.0
:I) 00 150 210 Temperature (Oe)
Figure AIV. 12 TGA (top) and DSC (bottom) profiles for forms Caoc ,d of sucros e .
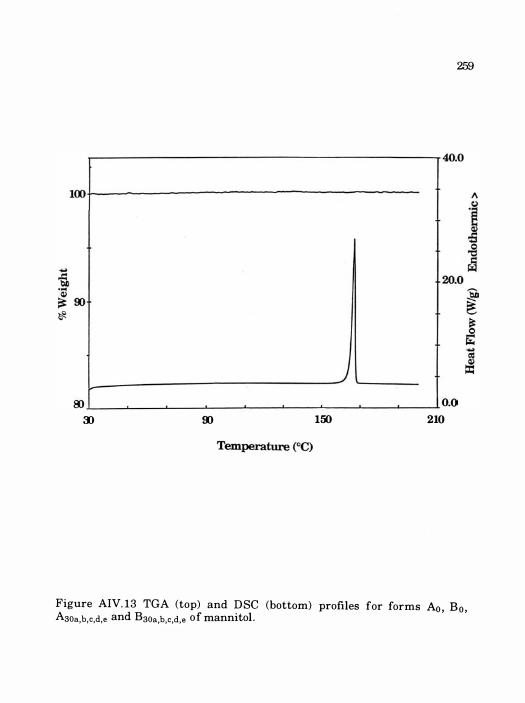
259
,..--------------------, 40.0
l00�----------------------------
8) L_----'-_-'-__ -'--_--'-_---' __ -L--_----'-_--'-_------'- 0.0
:J) 00 150 210
Figure AIV. 13 TGA (top) and D SC (bottom) profiles for forms P.o , B o , A30a,b,c,d,e and B30a,b,c,d,e of mannitol .
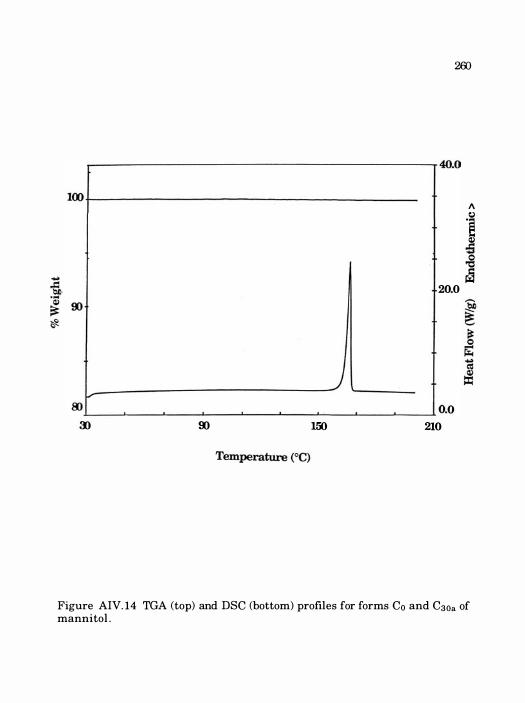
200
r---------------------� 40.0
lOO�---------------------------------------- A
.� � �
20.0
V il)L-__ ---'--____ '--__ ........ __ ----''--__ --'-__ -'--'--__ -'--__ ........ _----'- 0.0 30 90 150 210
Figure AIV. 14 TGA (top) and DSC (bottom) profiles for forms Co and CSOa of mannitol .

261
40.0
100 A
·1 o£j ,g
.... � � 20.0 .... � Ql ro � � � �
r£ .... ell :!
8) 0.0 :J) ro 150 210
Temperature (OC)
Figure AIV. 15 TGA (top) and DSC (bottom) profiles for form C 3 0b of mannitol .

262
40.0
100 1\ I:.l
.� � � � � 20.0 .6) � � 00 !:l( �
� 0
� � as =
K) 0.0
:D 00 150 210
Temperature (OC)
Figure AIV. 16 TGA (top) and DSC (bottom) profiles for forms C30c d e of mannitol .
' ,
APPENDIX V. PARTICLE SIZE DETERMINATION OF SPRAY DRIED
SUGARS USING THE AEROSIZER® WITH THE AERODISPERSER®
This Appendix presents the particle size distributions as measured
by the Aerosizer® with the Aerodisperser®. The instrument was operated
under the conditions described in Section III .b .2 .6 (Chapter III) .
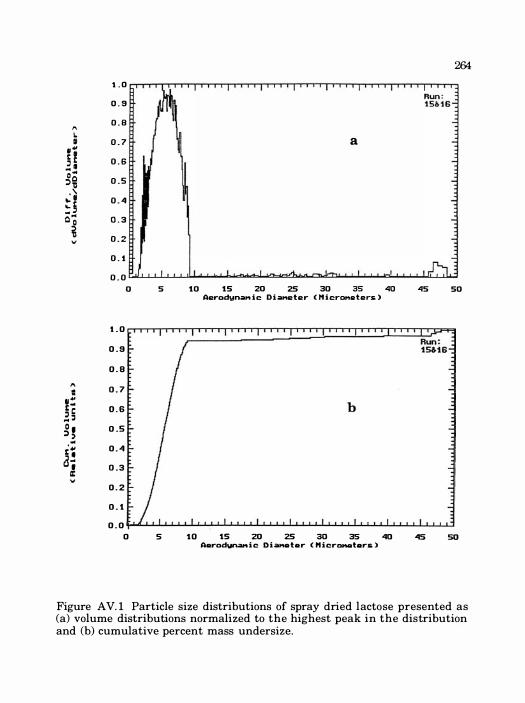
264 1 . 0
0 . 9
0 . 8 " � � 0 . 7 a
, " t ! o . s � . 0 " ::> c 0 . 5 1) �� � S
0 . -4
C ... 0 0 . 3 � 0 . 2
o . t
0 . 0 0 5 10 15 20 25 30 35 40 -45 50
AerodynaM i c D i aMe t e r ( t1 i c:r�a t er5 )
1 . 0
0 . 9
0 . 8
« 0 . 7
r: O . S � C ... � O . ;)�
0 . 5
i" 0 . -4
a� 0 . 3 • a:
0 . 2
o . t
0 . 0
0 5 1 0 15 20 25 30 35 .qI) -45 50 AerodynaM i c D i aMe t e r ( " i crDl'Niltars. )
Figure AV. ! Particle size distributions of spray dried lactose presented as (a) volume distributions normalized to the highest peak in the distribution and (b) cumulative percent mass undersize.
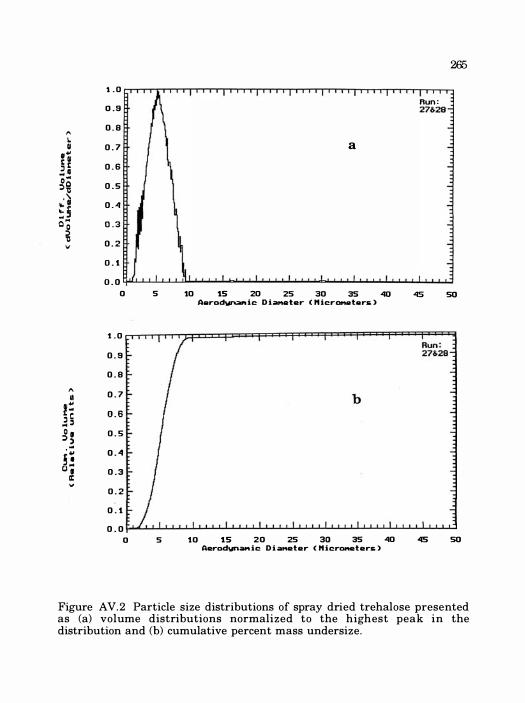
265
1 . 0
� I I I I I I I
O . S Run : 27&2B -
"-O . B
� � 0 . 7 a , '" t � J E 0 . 6 . ' o � ::> 0 0 . 5 1) ..:� 0 . 4 :: 5 o · 0 0 . 3
� 0 . 2
0 . 1 t 0 . 0 I r r r r
0 5 10 15 20 25 30 35 40 45 50 Aarod\In,aM i c: D i »UItar ( H icrClM8:ters. )
1 . 0
O . S
O . B "- 0 . 7 •
r� 0 . 6 J C . � 0 , ::» 0 . 5
§ � 0 . 4
u · 0 . 3 • a:
0 . 2
0 . 1
0 . 0 0 5 10 15 20 25 30 35 40 45 50
AaroctwnaM ic: D i aMat a r ( H i crmwt ars. )
Figure AV.2 Particle size distributions of spray dried trehalose presented as (a) volume distributions normalized to the highest peak in the distribution and (b) cumulative percent mass undersize.

266
1 . 0
O . S
0 . 8 " � a • 0 . 7
. " § I 0 . 6
.. .. 0 0 0 . 5 � 'Il -:� 0 . '1 .. § Qg 0 . 3
'0 0 . 2
O . t
0 . 0
0 10 20 30 '10 50 60 70 so 90 100 Aa rodwnaM i c Di ..... t.r ( M i crOl'UltaYs. )
1 . 0
Run :
O . S �6
0 . 8
. 0 . 7
�.;: t " 0 . 6 J e .. J 0 , ��
0 . 5
to' 0 . '1
a� 0 . 3 I
a: 0 . 2
0 . 1
0 . 0
0 10 20 30 '10 50 60 70 80 90 100
AQr� i c D i at'Mtter ( M icrDl'NttaYA )
Figure AV. 3 Particle size distributions of spray dried sucrose presented as (a) volume distributions normalized to the highest peak in the distribution and (b) cumulative percent mass undersize.

0 . 9
0 . 8
0 . 7
0 . 3
0 . 2
0 . 1
1 . 0
0 . 9
0 . 8
"-0 . 7 •
�� 0 . 6 .. ' 0 , ;) )
0 . 5
-£" 0 0 4
a� 0 . 3 •
It 0 . 2
0 . 1
0 . 0
0
5 10 15 20 25 30 35 40
AerodynaM i c D iaMeter ( M icyOtoMl:tars )
b
5 1 0 � � � 25 � � 40
AarodynaM i c: D i aMeter ( " icrOl't8ters )
50
Run : 25&26
50
Figure AVA Particle size distributions of spray dried mannitol presented as (a) volume distributions normalized to the highest peak in the distribution and (b) cumulative percent mass undersize .
APPENDIX VI. PARTICLE SIZE MEASUREMENT OF CRYSTALLINE
SIEVE FRACTIONS OF SUGARS USING SCANNING ELECTRON
MICROSCOPY (SEM) AND OPTICAL MICROSCOPY
This appendix presents SEMs of crystalline sieve fractions . Powder
was mounted onto metal stubs and coated with gold-palladium using an
Eiko IB-2 Ion Coater (Eiko Engineering, Ibaraki, Japan), followed by SEM
(Joel JSM-820, Peabody, MA).
Particle size distributions were determined using optical microscopy
(Optiphot, Nikon, Tokyo, Japan) . More than 300 particles were counted for
each sugar sample . SEMs of lactose, trehalose and sucrose sieve fractions
showed the particles shaped like cubes and mannitol fractions appeared
plate like . For lactose, trehalose and sucrose samples, both length and
breadth of each particle was measured. Average of length and breadth was
taken as the side of the cube (assumed geometry for these sugars) for
volume calculations . For mannitol the length and breadth was measured.
Volumes were calculated using a cuboid shape (length x breadth x depth) .
Depth of the mannitol particles was assumed to be 10 Jlm for easier
calculations . Particle size distributions for each fraction are presented as
the cumulative percent volume undersize and number distribution.
268

269
a
b
Figure AVI . l SEMs of (a) "coarse fraction" and (b) "fine fraction" of lactose.

2:10
a
b
Figure A VI .2 SEMs of (a) "coarse fraction" and (b) "fine fraction" of trehalose.
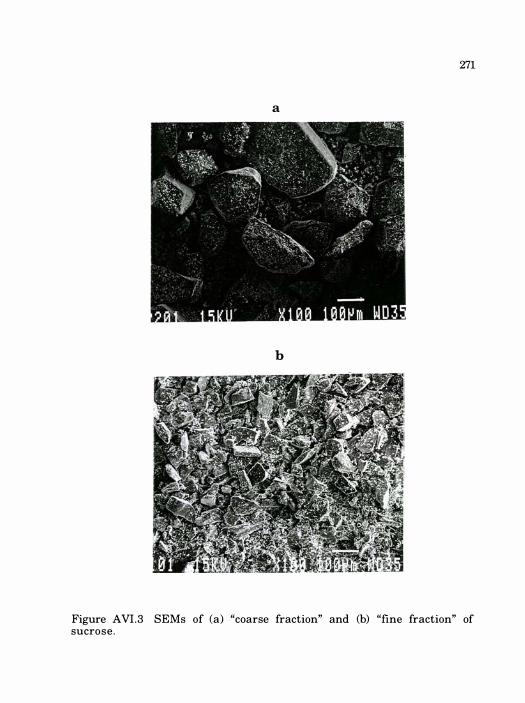
271
a
b
Figure AVI .3 SEMs of (a) "coarse fraction" and (b) "fine fraction" of sucrose .

'2:72
a
b
Figure AVI . 4 SEMs of ( a ) "coarse fraction" and ( b ) "fine fraction" of mannito l .

100.0
� 90.0
.� 80.0 '" "0 s: 70.0 ;;J '"
80.0 e := � 50.0
� 40.0
:c 01 30.0 "3 8 20.0 :=
0 10.0 lI'
0.0
0
20
so 100 ISO 200 250
Endpoint of Size Interval C)un) [Mean of Length & Breadth]
60 100 140 180 220 280
Endpoint of Size Interval C)un) [Mean of Length & Breadth]
273
300
Figure AVI. 5 Particle size pistributions of "coarse fraction" of lactose presented as (a) percent cumulative volume undersize and (b) number distributions .
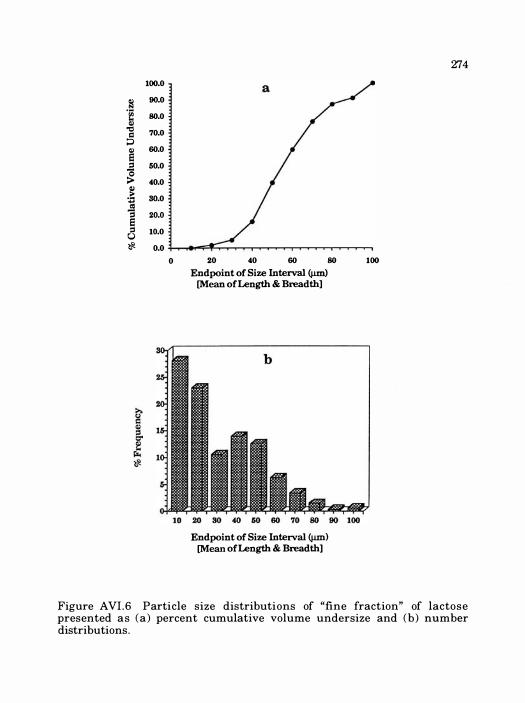
gs .� Q) "" c:: ;:J Q) e = � �
� -3 e =
Co) l!<
100.0
90.0
80.0
70.0
60.0
60.0
40.0
80.0
20.0
10.0
0.0
0 20 40 60 80 100
Endpoint of Size Interval (j.un) [Mean of Length & Breadth]
Endpoint of Size Interval 4=) [Mean of Length & Breadth]
274
Figure A VI .6 Particle size distributions of "fine fraction" of lactose presented as (a ) percent cumulative volume undersize and (b ) number distributions .
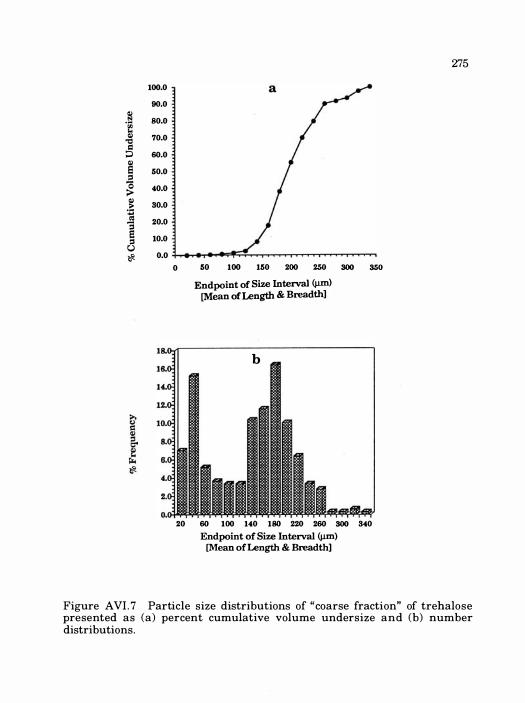
:i ·0 II) '" = ;l e ::I '0 > II) � OS 1 ::I U �
100.0
90.0
80.0
70.0
60.0
50.0
40.0
30.0
20.0
10.0
0.0
0 50 100 150 200 250 300 350
Endpoint of Size Interval <!un)
[Mean of Length & Breadth]
b
20 60 100 140 180 220 260 300 340
Endpoint of Size Interval <!un) [Mean of Length & Breadth]
'2:75
Figure A VI . 7 Particle size distributions of "coarse fraction" of trehalose presented as (a) percent cumulative volume undersize and (b) number distributions.

100.0
gj 90.0
.� 80.0 '" '" = 70.0 ;:l '" 80.0 e ::l
50.0 � '" 40.0 >
:Q 80.0 -3 e 20.0 ::l U 10.0
lJ. 0.0
0 20 80 80 100 120 140
Endpoint of Size Interval <J.un) [Mean of Length & Breadth)
b
20 SO 40 50 80 70 80 90 100 110 120 ISO
Endpoint of Size Interval <J.un) [Mean of Length & Breadth)
276
Figure A VI .8 Particle size distributions of "fine fraction" of trehalose
presented as (a) percent cumulative volume undersize and (b) number
distributions .
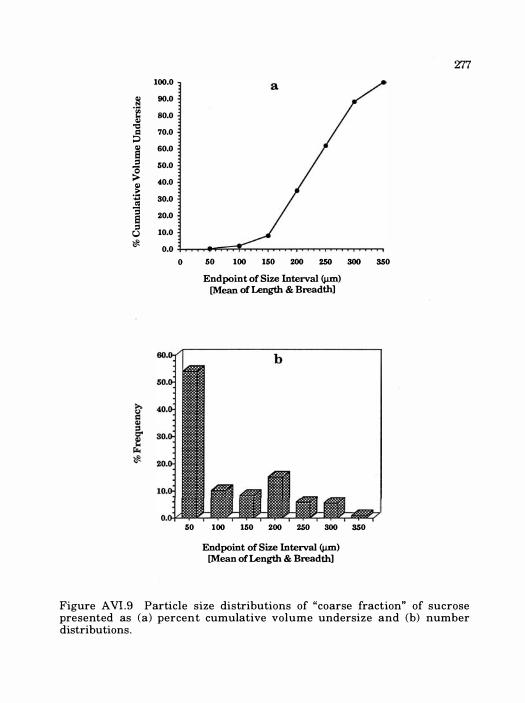
100.0
� 90.0
.� ., 80.0
"Q s:I 70.0 ;:J ., 60.0 8 = 60.0 � 40.0 �
:;:! 30.0 OS -= 20.0 8 =
10.0 U ll<
0.0
0 60 100 160 200 260 300 360
Endpoint of Size Interval C).tm) [Mean of Length & Breadth]
60 100 160 200 260 300 360
Endpoint of Size Interval C).tm) [Mean of Length & Breadth]
Figure AV1 .9 Particle size distributions of "coarse fraction" of sucrose presented as (a) percent cumulative volume undersize and (b) number distributions .

100.0
� 90.0
.� IP 80.0 � 1:1
� 70.0
IP Ei 60.0
� 50.0
IP .w.o > :.:3 -3 30.0
Ei 20.0 :s
u 10.0 � 0.0
0
a
20 .w 60 80 100 120
Endpoint of Size Interval C)un) [Mean of Length & Breadth]
10 20 30 .w so 60 70 80 90 100 110 120
Endpoint of Size Interval {).1m) [Mean of Length & Breadth]
278
Figure AVI . I0 Particle size distributions of "fine fraction" of sucros e presented a s ( a ) percent cumulative volume undersize and ( b ) number distributions.

� .� ., � = ;J � :s � � 01 '3 8 :s U
ll'<
100.0
90.0
so.o
70.0
60.0
60.0
40.0
30.0
20.0
10.0
0.0
0 200 400 600 800 1000 Endpoint of Size Interval ijJ.m)
[Length]
100 200 300 400 600 600 700 800 900 1000
Endpoint of Size Interval ijJ.m) [Length]
'Z79
Figure A VI . l l Particle size distributions of "coarse fraction" of mannitol presented as (a) percent cumulative volume undersize and (b) number distributions .

100.0
gj 90.0
.� 80.0 41 'tl
70.0 CI ;:J 41 60.0 e ::s 50.0 � 40.0 �
:0 80.0 01 'E
20.0 e ::s
Co) 10.0
� 0.0
a
0 50 100 150 200 250
Endpoint of Size Interval ij!m) [Lenglh]
25 50 75 100 125 150 175 200 225 250 275
Endpoint of Size Interval ij!m) [Lenglh]
800
Figure AVI . 12 Particle size distributions of "fine fraction" of mannitol presented as (a) percent cumulative volume undersize and (b) number distributions.
APPENDIX VII. X-RAY POWDER DIFFRACTION (XRPD) OF
CRYSTALLINE SUGARS AND THEm SPRAY DRIED FORMS
This Appendix presents the X-ray diffraction patterns for different
forms of each sugar at different storage conditions. X-ray diffraction was
performed as described in Section lII .b .2 .8 (Chapter III ) .
In each Figure subscripts 0 and 30 refer to before and after storage
for 30 days at different relative humidities. Key: A=Coarse fraction, B=Fine
fraction, C=Spray dried. Subscripts: a=Stored in sealed bottles over P205,
b=23% RH, c=52% RH, d=75% RH and e=93% RH. XRPD was not performed
on coarse and fine fractions after storage at different relative humidities.
281

282
I
III
=
N
5 15 25 as 45
20 DEGREES
Figure AVII . l XRPD patterns for lactose. ( I ) Ao (II ) Bo ( I I I ) C o and CaOa (IV) Caob (V) Caoc,d,e

III �; .. :--,-:::::J
IV
v
.tl 5 15 45
20 DEGREES
283
Figure AVII . 2 XRPD patterns for trehalose. en Ao (II) B o (Ill) C o and C 30a
(IV) C30b (V) C30c,d,e
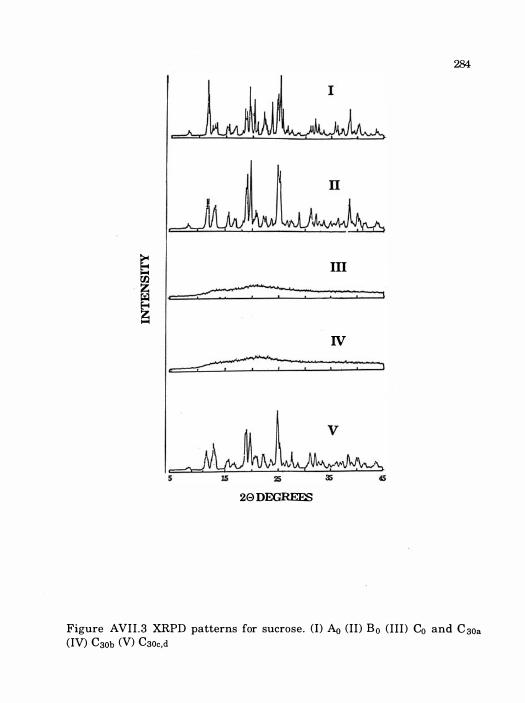
284
E III 00 Z � j
� IV
� J
20 DEGREES
Figure AVI I . 3 XRPD patterns for sucrose. (l) Ao (II) B o (III) Co and C 30a (IV) C30b (V) C30c,d

285
IT
5
20 DEGREES
Figure AVII .4 XRPD patterns for mannitol. (I) � (II) B o (III) C o and C 30a (IV) C30b (V) C30c,d,e
APPENDIX VIII. HOT STAGE MICROSCOPY OF SPRAY DRIED
SUGARS OBSERVED UNDER CROSSED POLARS
This Appendix presents photomicrographs of spray dried lactose and
sucrose . Hot stage microscopy was performed as described in Section
I I I .b .2 . 7 (Chapter III) . Phase transformations in amorphous sugars (spray
dried lacto se , trehalose and sucros e ) , such as glass -to-rubber,
recrystallization and melting were observed and photomicrographed under
crossed polars (Nikon N2000, Nikon, Tokyo, Japan) . Spray dried trehalose
did not show any recrystallization event and is not shown in this Appendix.

'2137 a
b o
o o
Figure AVr I l . 1 Photomicrograph of spray dried lactose under crossed polars at (a) 30 °C and (b) 140 °C.
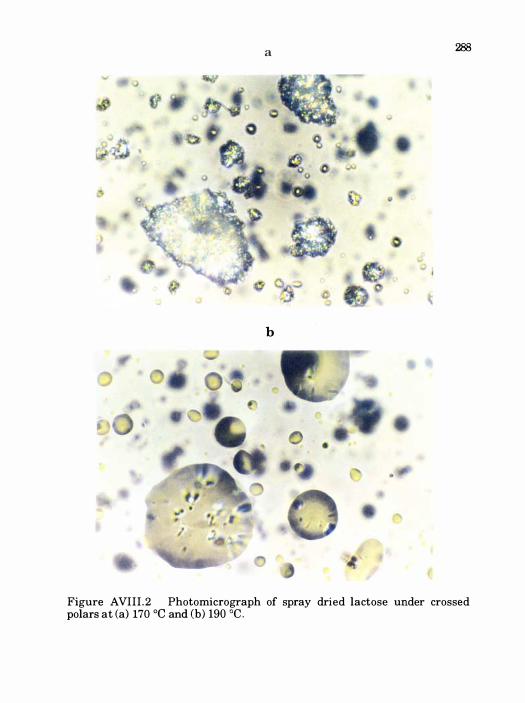
a 288
b
Figure AVIII .2 Photomicrograph of spray dried lactose under crossed polars at (a) 170 ac and (b) 190 ac .

289 a
b
o
o
O ' 0 o
o
Figure AVIII . 3 Photomicrograph of spray dried sucrose lmder crossed polars at (a) 30 DC and (b) 106 cC .

a
b ..
. - . , #
'.
•
•
. .
290
' .
Figure AVIll .4 Photomicrograph of spray dried sucrose under crossed polars at (a) 151 °C and (b) 192 °C .

APPENDIX IX. INSTRUCTIONS MANUAL FOR THE SMALL PARTICLE
AEROSOL GENERATOR (SPAG)
This Appendix presents the instruction manual for the use of the
Small Particle Aerosol Generator (SPAG 2; ICN Pharmaceuticals , C osta
Mesa, CAl .
291

SMAll PARTICLE AEROSOl GENERATOR MODel SPAG·2·
6000 SERIES MooEl
INSTRUCTIONS FOR USE
WARNING:
RIBAVIRIN AEROSOL SHOULD NOT BE USED FOR INFANTS REQUIRING ASSISTED VENTIUTION BECAUSE PRECIPITATION OF THE DRUG IN THE RESPIRATORY EQUIPMENT MAY INTERFERE WITH SAFE AND EFFECTIVE VENTILATION OF THE PATIENT. CondItions lor sale use with • �nUlator ara slil in d .... elopment.
Federal law restricts Ihls device 10 .ale by or on the order of • physician.
' For use In the adminlst,alion 01 Virazole- (Ribavwln) only. ThIs device may not be used lor the administration 01 any other drug.
I IONi leN Pharmaceuticals, Inc. ICf,I P;a:J 3300 tir·a�dA>Ie Co.t.1 "'r� C" 926;>£ t11" �� Ol00 M!'daI E'I'I()·9� (SOOf 572'14:xJ
A. INTRODUCTION
WARNtNQj
RIBAVIRIN AEROSOL SHOULD NOT BE USED FOR INFANTS REQUIRINQ ASSISTED VENTllATtON BECAUSE PRECIPITATION OF THE DRUG IN THE RESPIRATORY EQUIPMENT MAY INTERFERE WITH SAFE AND EFFECTIVE VENTILATION OF THE PATIENT, Conditions !oJ "'a usa with • �ntl1alor ar • • Jil in development.
The Sma" Particle Aerosol Ganef.lor ModaI-2 (SPAQ·2) Is Indicaled for .oorin!stration of Virazole' (rlbavitln) aerosot only. RlblllVifln .. rosol II Indicated In 1ha lnIatmene at carefully .elected hospitalized Infants and young c:h/Idran with sever. bwer respiratory I,act inlectlons due to resplralory Syncy1Ia1 virus (RSV),
B. GENERAL OPERATION OF THE SPAG·2 AEROSOl GENERATOR The pneumatic rIow ayttem of the SPAG-2 II depicted In Figura 1. The SP"'(l-2 1t driven by a pressurized gas (air or blended oxy;en) 1IOU!'Ce. which passes ltYougf1 an .... rnal pressure compensated flowmeter belor' anlering the SPAG-2. TM incoming gas I, regulated 10 26 pslg (179 KPa), and than II directed, via • manllold and presstJfa compansalad nowmelers, 10 both the nebulller and the drying thamber.
The nebulile, generates a fine aerosol 01 hy<lflled V1razole-, Ind the drying chamber further dehumidifies the aerosol. The mass median diameter of the aerosol par1icles Is appro�imalely 1.3 micron.
!§


C. ASSEMBlY Of THE SPAQ-2 AEROSOl. GENERATOR
1. Each shipplog ear1On conlainl the following lIem.:
1 · SPAQ·2.
2 · 500 mt. ,eservoirs (po/ysullone plaslic�
2 · AeMrvoir caps (poIy$ullone plaslic� wilh gaskel and O-rings.
2 · Nebulizers.
2 · Drying chambe" (poIysullone pIa$lic�
2 · Cleaning wires lor nebuMzer (0.011· dia .. slaJnleu sleel),.
12 - lengths nebulizer tubing Islllcone�
2 · Ext,a nebulizer cleanout SClewl lslsloless steal).
2 · E.lClra nebulizer washers (Tellon'").
2 · Operator's manuals.
The spate parts lncIuded with lhe SPAG·2 win allow operation with Mttle Of no downUme.
2. Operation 01 the SPAG-2 requires thai the following equlpmeot and Items be provided by the hospital or clinic:
• Compressed gas source. regulated to 4O-M psIg (poonda per &quare Inch g.uge) 1275-413 kPa). Usa air which meets apedficalions lor medical breathing use, unles. the phyaic:Ian presalbes 01C)'01In which must be blended.
• H oreater lhan 21% o� Is 10 be delivered 10 the palient, an oxyoen blender should be used. Fr.aion 01 inspired oxygen (FP21 should be monitored at the poinl 01 pstient delivery.
CAUTION: Oxygen therapy requtr •• caralul monitoring.
• Flowmeter, preslure compenseted, capable of measuring 1S lIte,. per minute at 50 psig (344 kPa).
• Hose to supply gas to the SPAG-2 (.PPfId with • standard 9/1�18 hemI. spherical conoec1or).
• Aerosol coodvction tubing, 22 mm diameter.
Further equipment required will depend on the particular mode of .erolOl administration_ Virazole' a.rosol may be delivered to a face mas!(, hood, or lent.
JiJo c.��'c::rn�� �,:�u:aJ�:r·1
HabuIt"' A •• embly (Part no. 4015)
f�*}�<wrh'l.·�.·; ,e·":T'
�� ;;;�� . . . .• _" ""T_ .
�r.�N��=
�

t ·_ · � · :� ·. I I. � .. ;; ; ... . 1. I �' I J Y x J� :'';''
�
R." ,yol, (Pert no. lOt3)
Acc. .. ory Plebo-(Part no. 4012) 2 · Mone n.builler .. Iho 2 . .... n,bullzer screw. 2 · c".noul wi, ..
Nebulizer tubing li���n��h:C:L.ul.r tubl
J. Check .' 3 nebI.IIlz ... orifice, with 1he cle.nlng wire to tntura 1My '" not occluded. In ... " tht Mbutlt ... slam Into .... lWao- lifting In 1M cent ... of .... reNrt'OW cap. TiQhten 1M .",. firmly wtlh tht hand light nut.
... Inspect the reMfVQlf cap vasket 101' deanlineu. Place the cap onlo 1M ulStlrvok' containing the Vwazole' solution (1M page 13 lor inltructionl describlng preparation at Vlrazol.·� Twisl lhe cap cIockwIsa 10 Inl 1he cap onto the reservoir. Make IUffl thal lh, nebulter pIck.up tubel ... not flush agalrm the boftom of the reservoir.
5. Place the capJreservoir assembly Inlo lhe housing and snap It Into place In the brllCkel
6. Connect the drytno air now (black holl) quldt coupllng \o N larger litting OO 1he CilP spoul Connec:t IM nebulizer .... now (blue hose) quid( c:oupling lO the smaller llt\lng on lhe body 01 the cap. Press each quick coupling In with . Iwltting moUon until It snaps Into piece.
1 1 � fi Bf,·� , -
'::
�

7. Insert the drying Chamber through h side hole In the SPAll housing, and push onlo tn. e.p spout ().ring. The now dfrection al'fow on the chImber must point away from the cap.
(Jf!r ra- -
",-(j .. - . j I ' , ,
B. Connect the aerosol tubing (supPlied by the u5&r) to the ooUet port of tne drying chamber. cfIE-NOTE: The length 01 the aerosol conduction tubing between the SPAQ·2 and the
mask. hood 01' tent should be kepi as short as convenientty possible 10 minimize collection 01 Berosol during operation. The tubing should be changed al leasl daity.
9. For use wllh II hood, tht llerosol detivery � tubing from the $PAQ·2 should be placed I into the Inlet port ol lhe hood. . . �. , .::...1 ( "" " .. ; o e;
10. For us. wllh II lac. mlSlt, II stand8ld -r piece shouJd be connected to the maP:. Tho.O<."" d" " 'l' '''''''9 ,,,,m '''''m SPAQ·2 should be connec1ed to one
:����n:���io�itlonaJ , I :\:_ ���=s�r:r
-
I�:; �Sr:=aI ; " � 0 0 � Vlfazole delivery. Tn. lenglh oJ lhe � � . -;==��� . . fN M �Id tollow the hospital's procedure lor determining the pallenl" lidal volume.
1 1 . FOI' us. wi1h a tent, the tent must be IIII-up with 1M cu$lomary ak flow and cooling a)"Sterna. The aerosol delivery lubing Irom r.. SPAQ·2 should be ooonected to the Inlet port 01 In. lent.
0. SPAQ·2 OPERATING PROCEDURE ~ NOTE: Il orealer Ihan 2t% OlCygen Is to be d.�v.red to the palient. an OlC)1l11n blender should
be used, Fraction of InSpIred oxygen (FP21 should be monilOl'ed at thepointof patient delivery.
WARNING:
1 Whenavar two or mora oxygan blanding ayatama are und, an bt.ndlng ayatama muat '" adJu.ted whan any changaa are mada In F,O ..
CAUTION; The 0" aouree mu.t be eonnec:ted to the SPAO-2 ancl turned on whene.,., the SPAG-2 1aln un. The aoure. muat be r.gulllted In thl! range 40-60 palll (275-4t3 kPa). Uae air which meata a.,.clficatlona tor medical breathing u .. , un .. aa the phyalclan preacrlbe. oxygen which muat be btandad. Oxygen therapy requlra. caralul monllOMli.
1. Connect the SPAG·2 to the eKlerna! flowmeter (pmvIded by user� Open the edern" flowmeter control valve compIetety. II Is Impor1ant that the eKlerna! fIowmeler doel not restrld gas now 10 the SPAG-2,
2. Open the nebulizer flowmeter valve compIetety (approxlmatety silt turna counter· clockwise Irom tha closed posltlon�
3. Disengage the lock sIe ..... on the SPAQ·2 p!'essure regulator by punlng the adjustment knob oulward. Adjuat the prelsure regulalOf' knob (clockwise to loclease) untU 26 ps.1g (179 kPa) II Indicated on the SPAO·2 pressura g.�.
4. Open the drying air IIowmeler valve 'rom the closed position until the exlernal flOwmeter Incficate. the desired toIaf now through the unit. II I. suggested thai the elClernat llowmeter should read apprOltimatefy 15 liters per mlnula (LPM) when using a hood or a lent, and approxlmatety 12 LPM when using a lac. mllsA.
5. Readjust thl! SPAQ·2 pressure regulator to 26 psig (179 kPa).
6. Verily that the eKlemaf flowmeter reading is correct and. it necessary. adjust iI .gllin by turnlng the drying air lIowmeter valva.
�
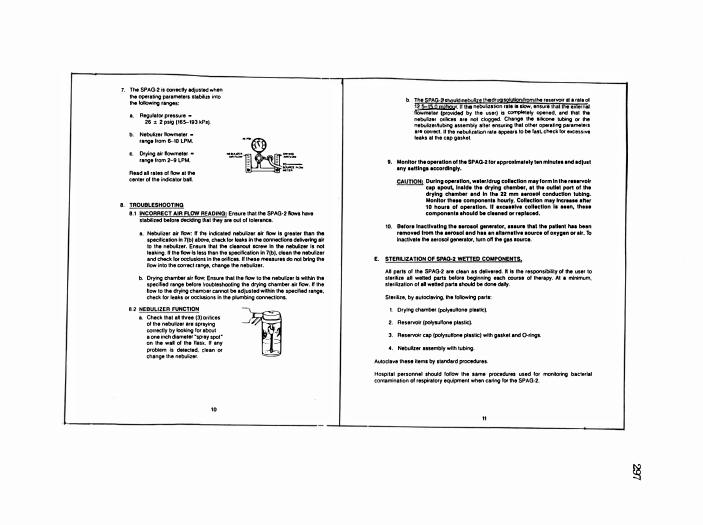
7. TM SPAQ·2 is conectty �uSled when the operating paramelerl IIabiliza into the IoIIowing rangel:
a. ReoutalOf preasUfe _ 26 � 2 pslg (165-193 kPfl�
b. Nebulizllf flowmeter _ rano- Ilom �10 LPM.
c. Drying air I\owmeter -lange trom 2-9 LPM.
Read aN rates 01 flow at the center 01 the indicator bal.
8. TROUBLESHOOTINQ
1L" .......... -- ....... :: = -""" = = ... -
• = " ""
8.1 INCORRECT AIR FLOW READINQ: Ensure that lhe SPAQ·2 1\ows have stabilized belore deciding U\al lhey are ou1 of to'erance,
a. Nebulize, ali flow: If lila indicated nebulizer air now Is greater \han the specification In 7(b) above, c:hec:k lor leak. In the c:orvMK:tlonl delivering air 10 the nebuHzer. Ensur, thai the deanout screw In the nebuller is not leaking. li the now Is tess than the speciflc:alion In 71b). clean the nebullter and c:heck lor occlusions In the orifice .. If lhe,e measures do not bring the flow Into the correct range. change the nebulizer.
b. Drying charnbet' alr flow: Ensure that the flow to the nebull1er Is wHhIn the specified range before Itoubleshootlng the drying chamber air flow. K the llow to the drying chamber cannot be adjuSled within the specified '800'. check lor leak. or occlusions in the plumbing connection ..
B.2 NEBULIZER FUNCTION
a. Check that aN three (3) orificas 01 tile nebulizer Ite .prlying COII'CUy by lOoking lor about a one inch diamelllf -SPlay spolon the wal 01 the Halk. II any problem is delec1ed, clean or change Ihe nebulizer.
10
�
b. The SPAG·2 should nebulize lhe drug soMion from the reservoir at a rat' 01 12�. 1I Ihe nebulization ra" iI Pow, ensUl. thit it; .x(.rila! n;;;;;met8f � by the user) is completely opened, and \hat th' nebufil8f orifices al. not cloQged. ChanQa the � tubing or !he nebulilerflubing assembly aller ensuring that other operating parameters a18 COllect. " the nebulization rata appaa" to be last, cllack lor •• cessivil leak. al the cap gasket.
,. MonUor the operaUon of the SPAQ·2 lor approximate'" t.n mlnut •• and .dlul' any •• "Ing' accordingly,
CAUTtON: During oper.tlon, w.ter/drug collection rna,. form In lhe re,.rvolr cap .pout. In,lde the drying chlmbar, al the outlet por1 of the drying chamber and In tIM 22 mm •• ro,oI conduction tubing. Monitor theM component. hourly, Collection mey Inc,.. •• aftat' 10 hour. 01 operation. It exc .. elve collection I. a •• n. th, .. component. ahould be cleaned or repla«*l,
10. B.lorl lnactlvallng the .,roaot g.n,r.tor, ... \Ire thai the patient haa been removed hom the Hrosol and haa an a"amatlve .ource 01 oxyg" or air. To inactivate the aerosol generalOt. tum ott the gas sourCl.
E. STERILIZATtON OF SPA<l-2 WenED COMPONENTS.
An parts of the SPAQ·2 al. clean as delivered. n Is the responsibi�l.,. 01 the user to sterilize an wafted parts beb. beginning each oourn 01 therapy. AI a minimum, Slel�i18tlon 01 II Wlfted parta IhouId be dona dalt)'.
St8filize, by .utocllVlng, the following part,:
I. DryIng chamber (polylullone pI.ltlC�
2. Aeservolf lpolysultone plastic�
3. Reservoir cap (potysuHone plastic) wI1h galket and O-rings.
4. Nebullz.er assembly wHh tubing.
Autoclave lhesa items by standard procedure ..
Hospila' personnel .hould follow the .. me procedures used lor monitoring bactatill contamination of respiratory eQUipment when caring lor the SPAQ·2.
11
�

F. CLEANING OF COMPONENTS
I . Any VlluOie. lOIullon remaining in the reservoir aller treatment should be 6scarded.
2. VirazDle. is a very wat.r soluble material. The components (reservoir, cap, nebullzet and drying chamber) can be effectively cleaned wilh warm tap waler and mild detergent Arter cleaning, rinse with warm tap wet., and than with dislilled or deionized waler.
3. Extra anentlon should be gi .... n 10 cleaning the nebullter. 00 not disassemble unless an occlusion II IUspec1ed. Probe the orilices of the nebulizer with the O.Ot ,. cleaning wire to dislodge any malerlal. Ensure ihat Ihe wire . lnser1ed completely Into each of the ltvee &ma. k\ner holes on the side of the nebulizer lip. Alt8f cleaning and rinsing the nebulizer, shalte to remove walet from the sma. passageway&.
<4 , n disassembly of the nebulizer bacomas necessary, ramove the sma. claanout screw (wlthwashel) end the silicone tubing. Probe •• orlflces with IheCiaarq wire. Soak all nebulizer parts in warm to hoi water containing detergent, rinse Ihoroughty, than blow dry with compressed ail. Reassemble lha nebulizer.
5. The resarvoif, cap. nebulizer, and drying chamber should be sterilized by autocJay. ing (Sea Sac1ion E�
6. The houSing can be cleaned with any disinfectant CUfl'enlly used by the hospHal lOt cleaning the exterior of s!mUar respiratory therapy equipment (e.g. venlilalOra, IPPB davicas� Fof example, Sanamaster III (QUaternary compound). , ozJoallon.
12
G. PREPARATION OF YlRAZOlE8 FOR USe: IN THE SfllMi..2
Vifazo!e. is supplied .s II grams or lyOPhIlized drug per tOO mI viii for "Iosol administration only. By Iterlla technique, dissotYe the drug In Iterlla USP w.ter lor injetlion Of inhalation in the 100 mI vial. Tu,,"ster kl tn. clean, lIerlllzed SOO mI SPAQ·2 res8fvoir, and further diMe to a final voIumf or 300 mI with Iterlle USP w.tar for In}actlon Of inhalation. The flO8l concentration IhOuId be 20 rngtmt. � This wet .. should not have had any antimicrobial agent or Ol� substance �. The solution ahould be inspected visualty for particulate maner and discoforation prior 10 aClminillratlon, Solutions that have been placed In !he 800·2 unit should be di&Clllrd8d .t lea,1 every 2<4 hour' and when the liquid level .. low belore adding newty reconstHuted solution. Using the recommended drug concentration or 20 mgImf Vlrazol.e as the starling solution W1 the drug lesarvolrof the SPAQ·2uni\ the ....... ege aerosol concentration for . t 2 hour period would be 1 90 microglamsl1ilar (0.t9 mg.1) of air.
Via" conlalnlng the tyophllJ:ed drug powder should be Itored In . dry pI.ce at tS-2S"C (59-78.F� Reconstitutaci solutions may be ,tored. under ,terlle conditions, at room temperature (20-30"C. 68-66. F) for 24 hours. SolutIonS which have been placed In the 8PAG.2 unit should be dIscarded at lea,t every 24 hours.
NOTE: Levels of rlbavlfln In lhe environment are expected to be low durlng proper IdmInls· Iratlon of the drug. 1b help minimize Incidental expo,ure, rlbMln ahould be admlnls· tered In • weI.ventilated hospital ,ening. Hospital ,Ia" responsible lot .erosol delivery should consider using a prOlecUve lace cover (nose and mouth) 10 reduce loddental exposUle. Common surgical masks do not provide . algnlflC8l'l! amount of protection. The 3M. Model 9970 personal mask ha. been ldenlified as one which supplie. &lgnlfcanl protection when prop8f!y filled.
13
�

H. SELECTED REPlACEMENT PARTS FOR THE SPAQ-2 Replacement pat1. and tectvllcal assistance IOf I� SPAQ·2 may be obtained by contacting your k1cal lepresentative 01' the ICN onice listed bKIw. When Ofdering. please specily the modef SPAQ·2 and de�ice serial number, as �e. as the pari numbel end description Dl Ihe lIem desired.
Device S-lial Nc.
". 5e,ial nos.
6000-15999
3100·5999
Part Oesctiption
O-ring l[)r cap nebuher air por1 O-ring '[)r cap dlying air port O-ring !of cap spout Drying thambel (pofysuIIOM plastic) Accessory pacIutge (2 cleaning wires, nebulizer screw. and washers) Reservoir Reservoir cap gasket Cap assembly (includes gaskel, C'rlngs) Nebulinr assembly Silicone tubing fOf nebu�zer (12 I8ng:hs)
Cap assembly (Includes gaskel, fining') Reservoir Rsservdr cap g8sket Nebulizer assembty Silicone tublng IOf nebulizer (12 Ieng"s)
teN Pharmaceuticals, Inc. 3300 Hyland Avenue
Cosla Mesa, CA 92626 Te�phone: (714) 545..()100
(800) 512·7400 (24 hour answellng service)
"
� 1 1 .. 1 107 1 1 15 , ... 4012
'093 1122 "''' "''' 4018
4010 ,0<, , ... .CO< <00,
Vrrazole' ��)
"--,-, - -:.�'t;�.z::::.:: 5?-=�"':�.i ������� ::-::!i"�.7 .. :"-: -.-.\� §:� 9 =t.�.� CUf<lCAI,.rtlAI.IlACGl.OC', - -
���� =-'::_�.�:J;5 :=: .. r�-=--- --:-�--=- == ':.:!: �-2�=:'=::�
��;;'g� -
���-¥t� ;i���i�
�5. ���:� ==:-�.f.:�E ::,,",,!;:,"::..:::.,:!,.::' .. -,.::: �!����-=� �.E::.::..� = .. "::':.":..."':"� C�..:�::-�
-- _ . __ .. ... .....
�� =: ,00:-'-::
=-'.l';;:"":::=�"":"":'!: �-;"�=::::7:; :rE..-=S;��.'!'E =!r��=�
"
��t�; :�..:::. .. ,,:":::e.-="": �: "'=- _ .. _ _ .. ...
=:��E:"C:_==: -u� _ _ .. __ •
r�!-�7� ;¥.;�S::;:E �
-- . - - - -
�c::-.:: -;'''S:S=-S - _ .. ""_ .. .. -'"" ;;:. =-.. ::= .. �:� _ _ ...!�""::.=C
�i�� �1=:'---"".l:=: ..:-::::...�..-:.:;;:: = ::.":.!"�;,':.!..-=� :::=" T'..:..:!''::::=!
��� :s:.t.�:..!1'':: ''''' . - - - -- ..... � .. . �;ap--=�
... -
�� .. :��:�� :=��;;
�

300

VITA