Detection of immunoglobulin isotypes from dried blood spots
9
Detection of immunoglobulin isotypes from dried blood spots Nancy J. Andersen a,1 , Tapan Kumar Mondal a,1 , Mark T. Preissler b , Brian M. Freed c , Sabine Stockinger c , Erin Bell d , Charlotte Druschel e , Germaine M. Buck Louis f , David A. Lawrence a, ⁎ a Wadsworth Center, New York State Department of Health, Albany, NY 12208, United States b Serology/Immunology Lab, Albany Medical Center, Albany, NY 12208, United States c University of Colorado, ClinImmune Labs, Aurora CO 80045, United States d University at Albany School of Public Health, Rensselaer, NY 12144, United States e Congenital Malformations Registry, NYSDOH, United States f Division of Intramural Population Health Research, Eunice Kennedy Shriver National Institute of Child Health & Human Development, United States article info abstract Article history: Received 16 September 2013 Received in revised form 12 November 2013 Accepted 4 December 2013 Available online 13 December 2013 The study was designed to determine the sensitivity and reproducibility of recovering immuno- globulin (Ig) isotypes (IgG subclasses, IgA, IgE and IgM classes) from dried blood spots (DBS), a methodologic subcomponent of the Upstate KIDS Study. A multiplexed Luminex assay was used for IgG1/2/3/4, IgA and IgM analysis; an ELISA was used for IgE. Plasma samples from de-identified patients were used to compare the Luminex assay with nephelometry, which is routinely used to quantify IgA, IgG and IgM in clinical samples. The IgE ELISA was compared to an immunofluorescence assay. Prior to evaluation of punches from newborn dried blood spots (NDBSs), recoveries of Ig from punches of cord blood DBSs (CBDBSs) vs. plasma from the same cord bloods were compared. Although the recoveries of Ig from plasma and DBSs were not comparable, which could be due to cell lysates in the DBS samples, the analyses were reproducible. Additionally, the levels of IgA, IgG2, IgG4, and IgM recovered from CBDBSs positively correlated with those in plasma. The DBS data is a relative value since it is not equivalent to the plasma concentration. The majority of Ig concentrations recovered from 108 newborns of the Upstate KIDs Study were within the range of newborn plasma Ig levels with the exception of IgG3. The IgG4 values displayed the greatest variance with a wide range (0.01–319 mg/dl), whereas, IgG1 values had the narrowest range (85.2–960.4 mg/dl). © 2014 Elsevier B.V. All rights reserved. Keywords: Dried blood spots IgE Immunoglobulin isotypes Newborn Cord blood 1. Introduction Eluted proteins from newborn dried blood spots (NDBS) have been used to assess the levels of cytokines and chemokines; however, to date, few studies have quantified the levels of immunoglobulins (Igs). Most likely, there have been few studies of newborn Ig levels, because most antibodies are of the IgG class, and maternal IgG antibodies are transported through the placenta. Previously, only the four IgG isotypes (IgG1/2/3/4) were suggested to be transported through the placenta. The exclusive transport of the IgG subclasses from mother to infant has recently been challenged with the investigation of immuno- deficient babies with maternal IgA (Borte et al., 2012). The quantities of each of the Ig isotypes, including the IgG subclasses, regardless of whether a portion of the Ig is from the mother, could provide clues about developing disorders or altered processes. The IgG subclasses are not equally transported through the placenta by the neonatal Fc receptor (FcRn) (Palmeira et al., 2012), in that usually IgG1 displays the greatest transport and IgG2 the lowest (Costa-Carvalho et al., 1996). IgG transfer to the fetus increases in the third trimester with the greatest amounts occurring in the last 4 weeks of gestation (Saji et al., Journal of Immunological Methods 404 (2014) 24–32 ⁎ Corresponding author at: David Axelrod Institute, 120 New Scotland Ave, Albany, NY 12208. E-mail address: [email protected] (D.A. Lawrence). 1 Equal contributors to this study. 0022-1759/$ – see front matter © 2014 Elsevier B.V. All rights reserved. http://dx.doi.org/10.1016/j.jim.2013.12.001 Contents lists available at ScienceDirect Journal of Immunological Methods journal homepage: www.elsevier.com/locate/jim
-
Upload
independent -
Category
Documents
-
view
3 -
download
0
Transcript of Detection of immunoglobulin isotypes from dried blood spots
Journal of Immunological Methods 404 (2014) 24–32
Contents lists available at ScienceDirect
Journal of Immunological Methods
j ourna l homepage: www.e lsev ie r .com/ locate / j im
Detection of immunoglobulin isotypes from dried blood spots
Nancy J. Andersen a,1, Tapan Kumar Mondal a,1, Mark T. Preissler b,Brian M. Freed c, Sabine Stockinger c, Erin Bell d, Charlotte Druschel e,Germaine M. Buck Louis f, David A. Lawrence a,⁎a Wadsworth Center, New York State Department of Health, Albany, NY 12208, United Statesb Serology/Immunology Lab, Albany Medical Center, Albany, NY 12208, United Statesc University of Colorado, ClinImmune Labs, Aurora CO 80045, United Statesd University at Albany School of Public Health, Rensselaer, NY 12144, United Statese Congenital Malformations Registry, NYSDOH, United Statesf Division of Intramural Population Health Research, Eunice Kennedy Shriver National Institute of Child Health & Human Development, United States
a r t i c l e i n f o
⁎ Corresponding author at: David Axelrod Institute,Ave, Albany, NY 12208.
E-mail address: [email protected] Equal contributors to this study.
0022-1759/$ – see front matter © 2014 Elsevier B.V. Ahttp://dx.doi.org/10.1016/j.jim.2013.12.001
a b s t r a c t
Article history:Received 16 September 2013Received in revised form 12 November 2013Accepted 4 December 2013Available online 13 December 2013
The study was designed to determine the sensitivity and reproducibility of recovering immuno-globulin (Ig) isotypes (IgG subclasses, IgA, IgE and IgM classes) from dried blood spots (DBS), amethodologic subcomponent of the Upstate KIDS Study. A multiplexed Luminex assay was used forIgG1/2/3/4, IgA and IgM analysis; an ELISA was used for IgE. Plasma samples from de-identifiedpatients were used to compare the Luminex assay with nephelometry, which is routinely used toquantify IgA, IgG and IgM in clinical samples. The IgE ELISAwas compared to an immunofluorescenceassay. Prior to evaluation of punches from newborn dried blood spots (NDBSs), recoveries of Ig frompunches of cord blood DBSs (CBDBSs) vs. plasma from the same cord bloods were compared.Although the recoveries of Ig fromplasma andDBSswere not comparable,which could be due to celllysates in theDBS samples, the analyseswere reproducible. Additionally, the levels of IgA, IgG2, IgG4,and IgM recovered fromCBDBSs positively correlatedwith those in plasma. TheDBS data is a relativevalue since it is not equivalent to the plasma concentration. The majority of Ig concentrationsrecovered from 108 newborns of the Upstate KIDs Study were within the range of newborn plasmaIg levels with the exception of IgG3. The IgG4 values displayed the greatest variance with a widerange (0.01–319 mg/dl), whereas, IgG1 values had the narrowest range (85.2–960.4 mg/dl).
© 2014 Elsevier B.V. All rights reserved.
Keywords:Dried blood spotsIgEImmunoglobulin isotypesNewbornCord blood
1. Introduction
Eluted proteins from newborn dried blood spots (NDBS)have been used to assess the levels of cytokines and chemokines;however, to date, few studies have quantified the levels ofimmunoglobulins (Igs). Most likely, there have been few studiesof newborn Ig levels, because most antibodies are of the IgGclass, and maternal IgG antibodies are transported through theplacenta. Previously, only the four IgG isotypes (IgG1/2/3/4)
120 New Scotland
(D.A. Lawrence).
ll rights reserved.
were suggested to be transported through the placenta. Theexclusive transport of the IgG subclasses from mother to infanthas recently been challenged with the investigation of immuno-deficient babies with maternal IgA (Borte et al., 2012). Thequantities of each of the Ig isotypes, including the IgG subclasses,regardless of whether a portion of the Ig is from the mother,could provide clues about developing disorders or alteredprocesses.
The IgG subclasses are not equally transported throughthe placenta by the neonatal Fc receptor (FcRn) (Palmeira etal., 2012), in that usually IgG1 displays the greatest transportand IgG2 the lowest (Costa-Carvalho et al., 1996). IgG transfer tothe fetus increases in the third trimester with the greatestamounts occurring in the last 4 weeks of gestation (Saji et al.,
Punch
Spot area = 122.72 mm2
Punch area = 8.042 mm2
Punch is 6.55 % of a Spot
Thus, punch contains3.275 µl of the cord blood12.5 mm
3.2 mm
A
B
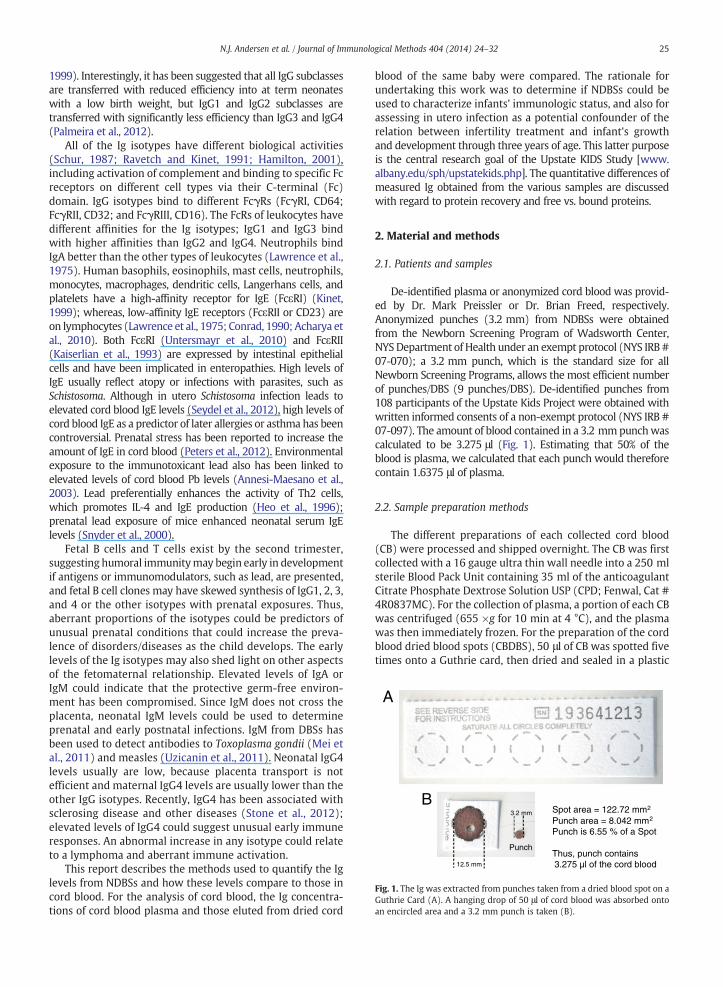
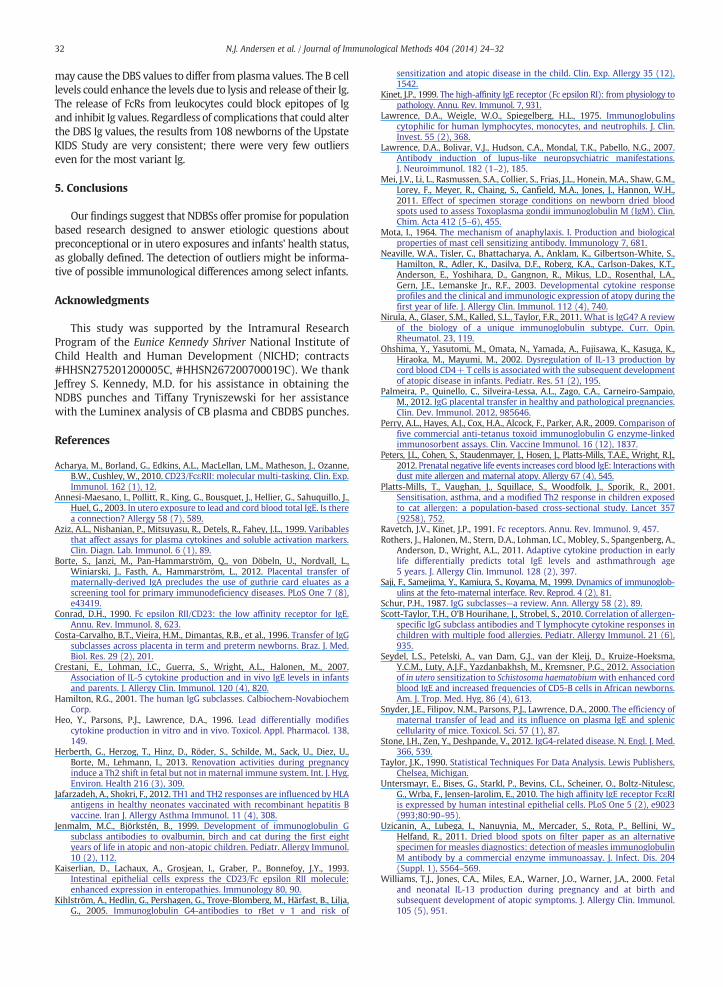
Fig. 1. The Ig was extracted from punches taken from a dried blood spot on aGuthrie Card (A). A hanging drop of 50 μl of cord blood was absorbed ontoan encircled area and a 3.2 mm punch is taken (B).
25N.J. Andersen et al. / Journal of Immunological Methods 404 (2014) 24–32
1999). Interestingly, it has been suggested that all IgG subclassesare transferred with reduced efficiency into at term neonateswith a low birth weight, but IgG1 and IgG2 subclasses aretransferred with significantly less efficiency than IgG3 and IgG4(Palmeira et al., 2012).
All of the Ig isotypes have different biological activities(Schur, 1987; Ravetch and Kinet, 1991; Hamilton, 2001),including activation of complement and binding to specific Fcreceptors on different cell types via their C-terminal (Fc)domain. IgG isotypes bind to different FcγRs (FcγRI, CD64;FcγRII, CD32; and FcγRIII, CD16). The FcRs of leukocytes havedifferent affinities for the Ig isotypes; IgG1 and IgG3 bindwith higher affinities than IgG2 and IgG4. Neutrophils bindIgA better than the other types of leukocytes (Lawrence et al.,1975). Human basophils, eosinophils, mast cells, neutrophils,monocytes, macrophages, dendritic cells, Langerhans cells, andplatelets have a high-affinity receptor for IgE (FcεRI) (Kinet,1999); whereas, low-affinity IgE receptors (FcεRII or CD23) areon lymphocytes (Lawrence et al., 1975; Conrad, 1990; Acharya etal., 2010). Both FcεRI (Untersmayr et al., 2010) and FcεRII(Kaiserlian et al., 1993) are expressed by intestinal epithelialcells and have been implicated in enteropathies. High levels ofIgE usually reflect atopy or infections with parasites, such asSchistosoma. Although in utero Schistosoma infection leads toelevated cord blood IgE levels (Seydel et al., 2012), high levels ofcord blood IgE as a predictor of later allergies or asthma has beencontroversial. Prenatal stress has been reported to increase theamount of IgE in cord blood (Peters et al., 2012). Environmentalexposure to the immunotoxicant lead also has been linked toelevated levels of cord blood Pb levels (Annesi-Maesano et al.,2003). Lead preferentially enhances the activity of Th2 cells,which promotes IL-4 and IgE production (Heo et al., 1996);prenatal lead exposure of mice enhanced neonatal serum IgElevels (Snyder et al., 2000).
Fetal B cells and T cells exist by the second trimester,suggesting humoral immunitymay begin early in developmentif antigens or immunomodulators, such as lead, are presented,and fetal B cell clones may have skewed synthesis of IgG1, 2, 3,and 4 or the other isotypes with prenatal exposures. Thus,aberrant proportions of the isotypes could be predictors ofunusual prenatal conditions that could increase the preva-lence of disorders/diseases as the child develops. The earlylevels of the Ig isotypes may also shed light on other aspectsof the fetomaternal relationship. Elevated levels of IgA orIgM could indicate that the protective germ-free environ-ment has been compromised. Since IgM does not cross theplacenta, neonatal IgM levels could be used to determineprenatal and early postnatal infections. IgM from DBSs hasbeen used to detect antibodies to Toxoplasma gondii (Mei etal., 2011) and measles (Uzicanin et al., 2011). Neonatal IgG4levels usually are low, because placenta transport is notefficient and maternal IgG4 levels are usually lower than theother IgG isotypes. Recently, IgG4 has been associated withsclerosing disease and other diseases (Stone et al., 2012);elevated levels of IgG4 could suggest unusual early immuneresponses. An abnormal increase in any isotype could relateto a lymphoma and aberrant immune activation.
This report describes the methods used to quantify the Iglevels from NDBSs and how these levels compare to those incord blood. For the analysis of cord blood, the Ig concentra-tions of cord blood plasma and those eluted from dried cord
blood of the same baby were compared. The rationale forundertaking this work was to determine if NDBSs could beused to characterize infants' immunologic status, and also forassessing in utero infection as a potential confounder of therelation between infertility treatment and infant's growthand development through three years of age. This latter purposeis the central research goal of the Upstate KIDS Study [www.albany.edu/sph/upstatekids.php]. The quantitative differences ofmeasured Ig obtained from the various samples are discussedwith regard to protein recovery and free vs. bound proteins.
2. Material and methods
2.1. Patients and samples
De-identified plasma or anonymized cord blood was provid-ed by Dr. Mark Preissler or Dr. Brian Freed, respectively.Anonymized punches (3.2 mm) from NDBSs were obtainedfrom the Newborn Screening Program of Wadsworth Center,NYS Department of Health under an exempt protocol (NYS IRB #07-070); a 3.2 mm punch, which is the standard size for allNewborn Screening Programs, allows the most efficient numberof punches/DBS (9 punches/DBS). De-identified punches from108 participants of the Upstate Kids Project were obtained withwritten informed consents of a non-exempt protocol (NYS IRB #07-097). The amount of blood contained in a 3.2 mmpunchwascalculated to be 3.275 μl (Fig. 1). Estimating that 50% of theblood is plasma, we calculated that each punch would thereforecontain 1.6375 μl of plasma.
2.2. Sample preparation methods
The different preparations of each collected cord blood(CB) were processed and shipped overnight. The CB was firstcollected with a 16 gauge ultra thin wall needle into a 250 mlsterile Blood Pack Unit containing 35 ml of the anticoagulantCitrate Phosphate Dextrose Solution USP (CPD; Fenwal, Cat #4R0837MC). For the collection of plasma, a portion of each CBwas centrifuged (655 ×g for 10 min at 4 °C), and the plasmawas then immediately frozen. For the preparation of the cordblood dried blood spots (CBDBS), 50 μl of CB was spotted fivetimes onto a Guthrie card, then dried and sealed in a plastic
26 N.J. Andersen et al. / Journal of Immunological Methods 404 (2014) 24–32
bag with desiccant. All punches of CBDBS were maintained at−20 °C until beginning sample analysis.
2.3. Reagents
For multiplexed analysis of the IgG subclasses, IgM, and IgA,theMilliplex®magnetic bead panel for human immunoglobulinisotyping (HGAMMAG-301K-06, EMD Millipore Corp., Billerica,MA) was used. For the IgE analysis, an ELISA was used (Cat #3810-1H-20, MABTECH Inc., Cincinnati, OH). The ELISA kitfor IgE contained mAb107 capture antibody, mAb182-biotindetection antibody, streptavidin-HRP, and the IgE standard.The substrate used was TMB (Sigma, Cat # T 4444).
2.4. Quantification of IgA, IgG and IgM
Both CBDBS and NDBS were extracted overnight (18–20 h) at 4 °C with 60 μl of elution buffer in low-binding96-well round bottom plates (catalog #1830-9600, USAScientific, Ocala, FL) on an orbital shaker (Titer Plate Shaker,model # 1830-9600, USA Scientific, Ocala, FL) at 500 ±50 rpm. The elution buffer was comprised of PhosphateBuffered Saline (PBS, Lonza catalog #17-516Q) with 0.1% BSA(Sigma-Aldrich, catalog #A-4503) and EDTA-free proteaseinhibitors (1 tablet/10 ml, Roche Applied Science, catalog#04693159001, Mannheim, Germany). Following extraction,the eluants were frozen at−80 °C until analysis was performed.The analysis protocol followed the manufacturer's magneticbead panel instructions with one exception: the CBDBS andNDBS eluants were run at a 1/10 dilution for IgA, IgG1, IgG2, andIgM, and at a 1/250 dilution for IgG3 and IgG4. This wasaccomplished by incubating the dilutions separately withthe respective beads, and then recombining all the respectivesamples together after the capture antibody step. All sampleswere diluted with PBS containing 0.1% BSA and gently vortexed(Thermolyne, Maxi Mix II) prior to the incubation. The dilutedsamples were incubated on an orbital shaker (500 ± 50 rpm;Titer Plate Shaker, Thermo Scientific)with the capture-antibodycoated beads for 2 h at room temperature (RT). The plates werethen washed on an ELISA washer with a magnet for capturingthe beads (BioTek, ELx405 Select CW), and incubated withthe detection solution. Analysis was accomplished using aLuminex100 analyzer (Luminex System, Austin, TX) withxPONENT 3.1software (Luminex). The LODs for the six isotypeswere IgG1, 55 ng/ml; IgG2, 85 ng/ml; IgG3, 0.6 ng/ml; IgG4,0.9 ng/ml; IgA, 5.7 ng/ml; and IgM, 7.5 ng/ml. The results of thisanalysiswere compared to those performed by the Serology Labat AlbanyMedical Center for IgA, IgMand total IgG; these resultswere obtained with nephelometry using a Beckman IMMAGE800.
2.5. Quantification of IgE
Due to the low amounts of IgE in extracted CBDBS and NDBSsamples, CBDBS or NDBS punches were extracted individually inwells of a high-binding ELISA plate (Costar, Cat # 3369) that waspre-coated with anti-IgE capture antibody mAb107. The IgEELISA wells were coated with 50 μl/well of mAb107 (2 μg/mlPBS), and the plate was incubated at 4 °C overnight. The platewas then washed twice with PBS and blocked with 200 μl/wellof Blocking/Washing buffer (PBS containing 0.05% Tween-20
(Sigma, Cat # P-1379) and 0.1% BSA) for 2 h at RT, then washedsix times with wash buffer. For the CBDBS or NDBS IgE analysis,50 μl of MABTech assay buffer was added to each well; punchesspotted with either IgE standard or those collected from theCBDBS or NBDBS card were then added to their respectivewells. To create the IgE standard punches, the standardcurve was prepared according to the manufacturer's in-structions in low-protein binding microfuge tubes. Puncheswere then prepared from blank Guthrie cards and placedinto a 96-well plate. The standard IgE punches weremade byadding 3 μL (the volume that saturated the punch) of individualIgE standards (0.156–10 ng/ml). These IgE-spotted puncheswere kept at RT for 2½ h and then stored at −20 °C until use.For the assay, the standard curve was generated using duplicatepunches, while the sample punches were analyzed in singlicate.For the blank, no punch was placed in duplicate wells. Theanti-IgE coated plate was incubatedwith the punches overnightat 4 °C with shaking on the titer plate shaker (500 ± 50 rpm).Following the capture antibody step, the puncheswere removedand the platewashed six times. For the plasma IgE assay, 50 μl ofplasma was added to the appropriate wells; the protocol for theplasma incubation thereafter followed the manufacturer'sinstructions (MABTECH Inc).
For both assays, 50 μl/well of detection antibody anti-IgEbiotin mAb182 (0.3 μg/ml) was added to each well, The platewas then incubated for 2 h at RT and washed 6 times.Streptavidin-HRP (50 μl/well) was then added to each well ata concentration of 1/1000 in blocking buffer and incubatedfor 1 h at RT. The washes were repeated, and TMB substratewas added (20–30 min in the dark at RT followed by 25 μl/wellof 1 M H2SO4stop solution). The plate was then immediatelyread at 450 and 630 nm on an EL808 reader and analyzed withKC4 software (BioTek, Winooski, VT). The LOD for the IgE ELISAwas 0.1 ng/ml. These results were compared to an automatedfluorescent EIA performed using the Phadia ImmunoCAP system(LOD of 2 U/ml or 4.76 ng/ml). To determine the IgE level, aLyphochek® Immunoassay Plus Control (Bio-Rad) was used.
2.6. Immunoprecipitation and SDS gel analysis
Capture antibody labeled beads from the Ig kit, or ananti-IgE coated well, were used to capture the Ig isotypes. Theanti-IgA, anti-IgG (pooled subclasses), and anti-IgM beadswere separately incubated with the eluants as described. Afterthe beads or wells were washed, detection antibody was notadded. The captured analytes were eluted at 70 °C for 10 minwith 10% SDS buffer containing 10 mM 2-mercaptoethanol;beads and wells without the addition of the eluants were alsoassayed on a 10% acrylamide gel. Separate lanes were analyzedby Western blot using HRP-goat anti-Ig (goat anti-human IgG,IgM, IgA horseradish peroxidase (HRP) conjugate, Millipore Cat# AP120P), as previously described (Lawrence et al., 2007).
2.7. Statistical analysis
Analysis of the data was performed using software aspreviously described, and descriptive statistical analysis wasperformed with GraphPad Prism 4.0 software. Paired t-testanalysis was used for data matched individually (Table 5);the unpaired t-test determined the p values for data pairswhen the data was unmatched (Table 6). Correlation analysis
27N.J. Andersen et al. / Journal of Immunological Methods 404 (2014) 24–32
was performed using the Pearson correlation analysis (Figs. 2and 3), and outlying data points from the NBDBS Ig results(Fig. 5) were obtained via Grubb's test (Taylor, 1990).
3. Results
3.1. Comparative analysis of methods to quantify Ig isotypesfrom plasma samples
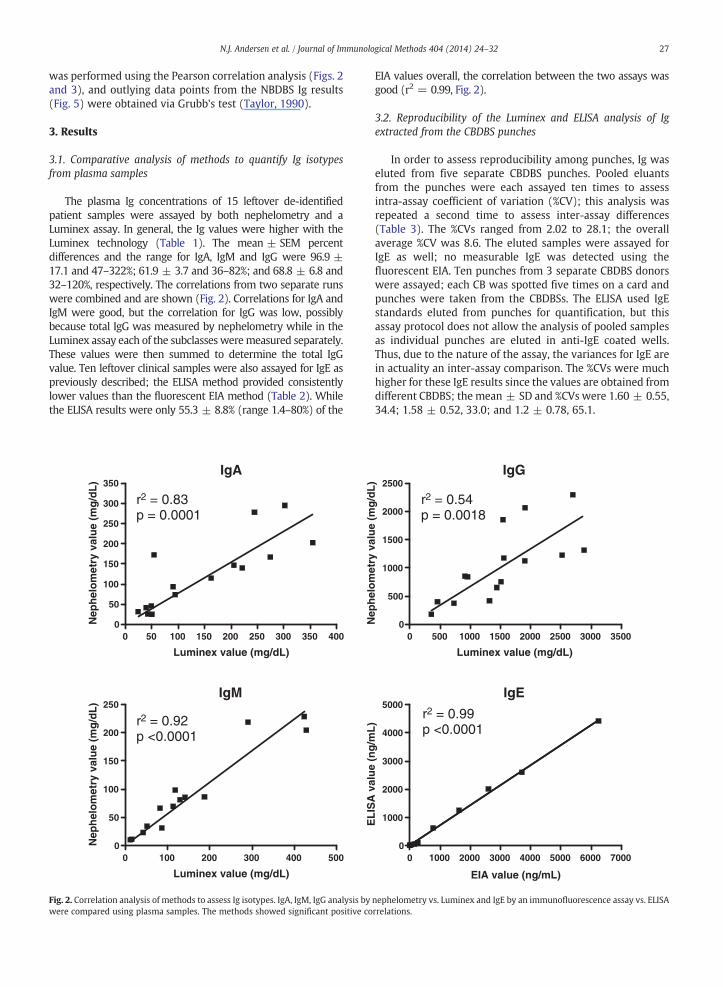
The plasma Ig concentrations of 15 leftover de-identifiedpatient samples were assayed by both nephelometry and aLuminex assay. In general, the Ig values were higher with theLuminex technology (Table 1). The mean ± SEM percentdifferences and the range for IgA, IgM and IgG were 96.9 ±17.1 and 47–322%; 61.9 ± 3.7 and 36–82%; and 68.8 ± 6.8 and32–120%, respectively. The correlations from two separate runswere combined and are shown (Fig. 2). Correlations for IgA andIgM were good, but the correlation for IgG was low, possiblybecause total IgG was measured by nephelometry while in theLuminex assay each of the subclasses weremeasured separately.These values were then summed to determine the total IgGvalue. Ten leftover clinical samples were also assayed for IgE aspreviously described; the ELISA method provided consistentlylower values than the fluorescent EIA method (Table 2). Whilethe ELISA results were only 55.3 ± 8.8% (range 1.4–80%) of the
IgA
0 50 100 150 200 250 300 350 4000
50
100
150
200
250
300
350
r2 = 0.83p = 0.0001
Luminex value (mg/dL)
Nep
hel
om
etry
val
ue
(mg
/dL
)
IgM
0 100 200 300 400 5000
50
100
150
200
250
r2 = 0.92p <0.0001
Luminex value (mg/dL)
Nep
hel
om
etry
val
ue
(mg
/dL
)
Fig. 2. Correlation analysis of methods to assess Ig isotypes. IgA, IgM, IgG analysis bywere compared using plasma samples. The methods showed significant positive co
EIA values overall, the correlation between the two assays wasgood (r2 = 0.99, Fig. 2).
3.2. Reproducibility of the Luminex and ELISA analysis of Igextracted from the CBDBS punches
In order to assess reproducibility among punches, Ig waseluted from five separate CBDBS punches. Pooled eluantsfrom the punches were each assayed ten times to assessintra-assay coefficient of variation (%CV); this analysis wasrepeated a second time to assess inter-assay differences(Table 3). The %CVs ranged from 2.02 to 28.1; the overallaverage %CV was 8.6. The eluted samples were assayed forIgE as well; no measurable IgE was detected using thefluorescent EIA. Ten punches from 3 separate CBDBS donorswere assayed; each CB was spotted five times on a card andpunches were taken from the CBDBSs. The ELISA used IgEstandards eluted from punches for quantification, but thisassay protocol does not allow the analysis of pooled samplesas individual punches are eluted in anti-IgE coated wells.Thus, due to the nature of the assay, the variances for IgE arein actuality an inter-assay comparison. The %CVs were muchhigher for these IgE results since the values are obtained fromdifferent CBDBS; the mean ± SD and %CVs were 1.60 ± 0.55,34.4; 1.58 ± 0.52, 33.0; and 1.2 ± 0.78, 65.1.
IgG
0 500 1000 1500 2000 2500 3000 35000
500
1000
1500
2000
2500
r2 = 0.54p = 0.0018
Luminex value (mg/dL)
Nep
hel
om
etry
val
ue
(mg
/dL
)
IgE
0 1000 2000 3000 4000 5000 6000 70000
1000
2000
3000
4000
5000r2 = 0.99p <0.0001
EIA value (ng/mL)
EL
ISA
val
ue
(ng
/mL
)
nephelometry vs. Luminex and IgE by an immunofluorescence assay vs. ELISArrelations.
IgA
0.00 0.05 0.10 0.15 0.20 0.25 0.300.000
0.005
0.010
0.015
0.020
0.025
0.030
0.035r2 = 0.25p = 0.0051
DBS
Pla
sma
IgG2
0 50 100 150 200 250 3000
50
100
150
200
250
300
350
400
450r2 = 0.87p <0.0001
DBS (mg/dL)
Pla
sma
(mg
/dL
)
IgM
0.0 2.5 5.0 7.5 10.0 12.5 15.00.0
2.5
5.0
7.5
10.0
12.5
15.0
17.5
20.0
22.5
25.0r2 = 0.83p <0.0001
DBS (mg/dL)
Pla
sma
(mg
/dL
)
IgG4
0 10 20 30 40 50 60 700
5
10
15
20
25
30
35
40
45 r2 = 0.25p <0.0052
DBS (mg/dL)
Pla
sma
(mg
/dL
)
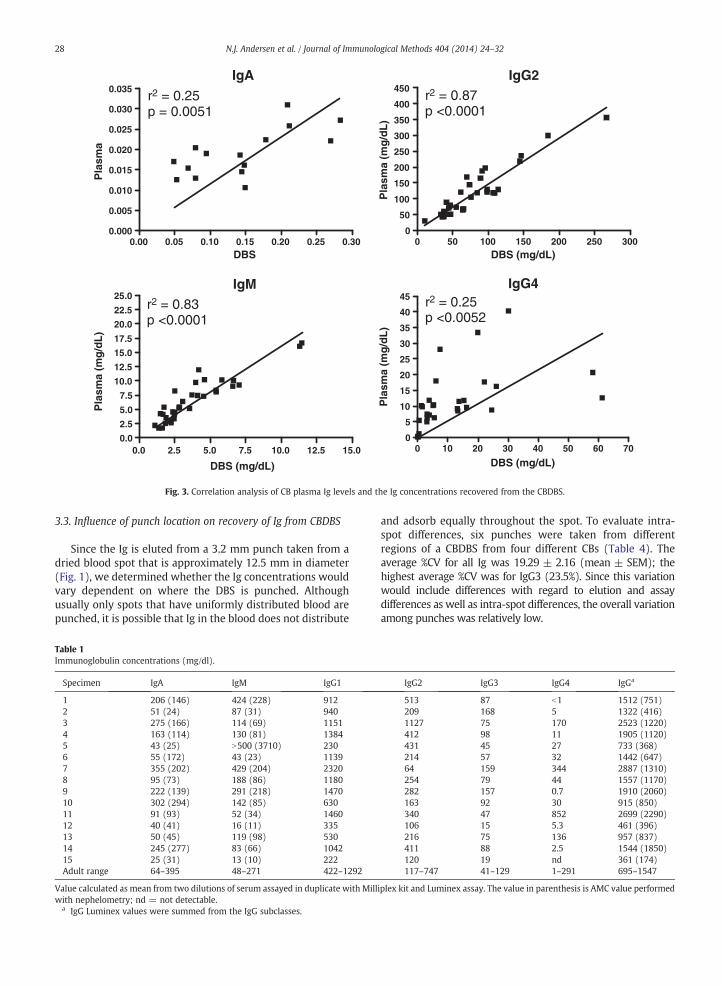
Fig. 3. Correlation analysis of CB plasma Ig levels and the Ig concentrations recovered from the CBDBS.
28 N.J. Andersen et al. / Journal of Immunological Methods 404 (2014) 24–32
3.3. Influence of punch location on recovery of Ig from CBDBS
Since the Ig is eluted from a 3.2 mm punch taken from adried blood spot that is approximately 12.5 mm in diameter(Fig. 1), we determined whether the Ig concentrations wouldvary dependent on where the DBS is punched. Althoughusually only spots that have uniformly distributed blood arepunched, it is possible that Ig in the blood does not distribute
Table 1Immunoglobulin concentrations (mg/dl).
Specimen IgA IgM IgG1
1 206 (146) 424 (228) 9122 51 (24) 87 (31) 9403 275 (166) 114 (69) 11514 163 (114) 130 (81) 13845 43 (25) N500 (3710) 2306 55 (172) 43 (23) 11397 355 (202) 429 (204) 23208 95 (73) 188 (86) 11809 222 (139) 291 (218) 147010 302 (294) 142 (85) 63011 91 (93) 52 (34) 146012 40 (41) 16 (11) 33513 50 (45) 119 (98) 53014 245 (277) 83 (66) 104215 25 (31) 13 (10) 222Adult range 64–395 48–271 422–1292
Value calculated as mean from two dilutions of serum assayed in duplicate with Millwith nephelometry; nd = not detectable.
a IgG Luminex values were summed from the IgG subclasses.
and adsorb equally throughout the spot. To evaluate intra-spot differences, six punches were taken from differentregions of a CBDBS from four different CBs (Table 4). Theaverage %CV for all Ig was 19.29 ± 2.16 (mean ± SEM); thehighest average %CV was for IgG3 (23.5%). Since this variationwould include differences with regard to elution and assaydifferences as well as intra-spot differences, the overall variationamong punches was relatively low.
IgG2 IgG3 IgG4 IgGa
513 87 b1 1512 (751)209 168 5 1322 (416)1127 75 170 2523 (1220)412 98 11 1905 (1120)431 45 27 733 (368)214 57 32 1442 (647)64 159 344 2887 (1310)254 79 44 1557 (1170)282 157 0.7 1910 (2060)163 92 30 915 (850)340 47 852 2699 (2290)106 15 5.3 461 (396)216 75 136 957 (837)411 88 2.5 1544 (1850)120 19 nd 361 (174)117–747 41–129 1–291 695–1547
iplex kit and Luminex assay. The value in parenthesis is AMC value performed
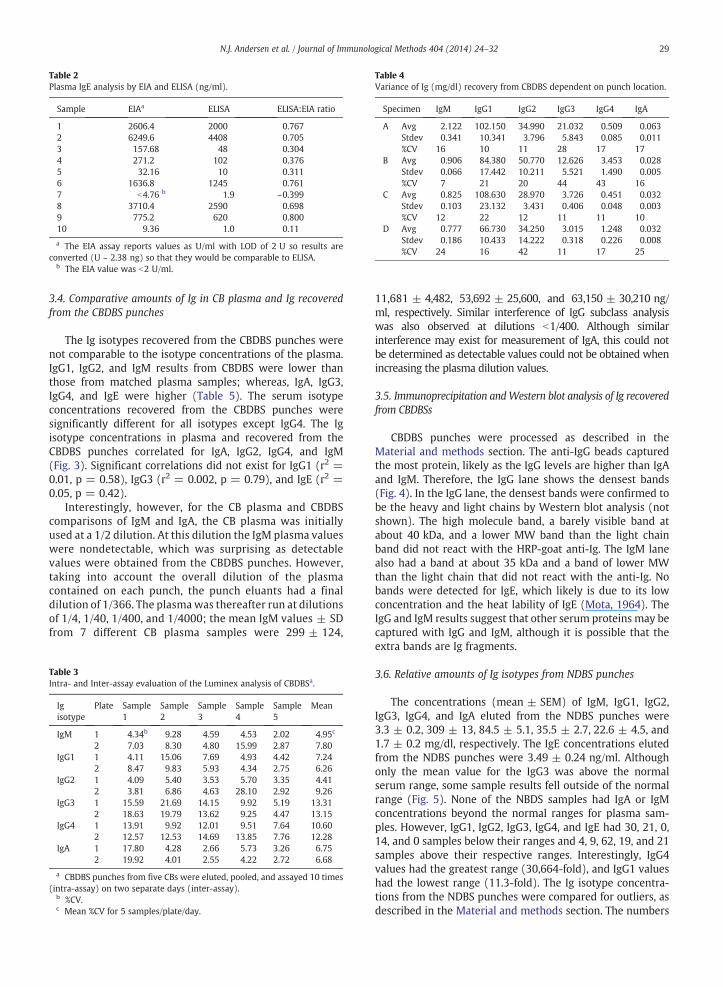
Table 2Plasma IgE analysis by EIA and ELISA (ng/ml).
Sample EIAa ELISA ELISA:EIA ratio
1 2606.4 2000 0.7672 6249.6 4408 0.7053 157.68 48 0.3044 271.2 102 0.3765 32.16 10 0.3116 1636.8 1245 0.7617 b4.76 b 1.9 ~0.3998 3710.4 2590 0.6989 775.2 620 0.80010 9.36 1.0 0.11
a The EIA assay reports values as U/ml with LOD of 2 U so results areconverted (U ~ 2.38 ng) so that they would be comparable to ELISA.
b The EIA value was b2 U/ml.
Table 4Variance of Ig (mg/dl) recovery from CBDBS dependent on punch location.
Specimen IgM IgG1 IgG2 IgG3 IgG4 IgA
A Avg 2.122 102.150 34.990 21.032 0.509 0.063Stdev 0.341 10.341 3.796 5.843 0.085 0.011%CV 16 10 11 28 17 17
B Avg 0.906 84.380 50.770 12.626 3.453 0.028Stdev 0.066 17.442 10.211 5.521 1.490 0.005%CV 7 21 20 44 43 16
C Avg 0.825 108.630 28.970 3.726 0.451 0.032Stdev 0.103 23.132 3.431 0.406 0.048 0.003%CV 12 22 12 11 11 10
D Avg 0.777 66.730 34.250 3.015 1.248 0.032Stdev 0.186 10.433 14.222 0.318 0.226 0.008%CV 24 16 42 11 17 25
29N.J. Andersen et al. / Journal of Immunological Methods 404 (2014) 24–32
3.4. Comparative amounts of Ig in CB plasma and Ig recoveredfrom the CBDBS punches
The Ig isotypes recovered from the CBDBS punches werenot comparable to the isotype concentrations of the plasma.IgG1, IgG2, and IgM results from CBDBS were lower thanthose from matched plasma samples; whereas, IgA, IgG3,IgG4, and IgE were higher (Table 5). The serum isotypeconcentrations recovered from the CBDBS punches weresignificantly different for all isotypes except IgG4. The Igisotype concentrations in plasma and recovered from theCBDBS punches correlated for IgA, IgG2, IgG4, and IgM(Fig. 3). Significant correlations did not exist for IgG1 (r2 =0.01, p = 0.58), IgG3 (r2 = 0.002, p = 0.79), and IgE (r2 =0.05, p = 0.42).
Interestingly, however, for the CB plasma and CBDBScomparisons of IgM and IgA, the CB plasma was initiallyused at a 1/2 dilution. At this dilution the IgM plasma valueswere nondetectable, which was surprising as detectablevalues were obtained from the CBDBS punches. However,taking into account the overall dilution of the plasmacontained on each punch, the punch eluants had a finaldilution of 1/366. The plasmawas thereafter run at dilutionsof 1/4, 1/40, 1/400, and 1/4000; the mean IgM values ± SDfrom 7 different CB plasma samples were 299 ± 124,
Table 3Intra- and Inter-assay evaluation of the Luminex analysis of CBDBSa.
Igisotype
Plate Sample1
Sample2
Sample3
Sample4
Sample5
Mean
IgM 1 4.34b 9.28 4.59 4.53 2.02 4.95c
2 7.03 8.30 4.80 15.99 2.87 7.80IgG1 1 4.11 15.06 7.69 4.93 4.42 7.24
2 8.47 9.83 5.93 4.34 2.75 6.26IgG2 1 4.09 5.40 3.53 5.70 3.35 4.41
2 3.81 6.86 4.63 28.10 2.92 9.26IgG3 1 15.59 21.69 14.15 9.92 5.19 13.31
2 18.63 19.79 13.62 9.25 4.47 13.15IgG4 1 13.91 9.92 12.01 9.51 7.64 10.60
2 12.57 12.53 14.69 13.85 7.76 12.28IgA 1 17.80 4.28 2.66 5.73 3.26 6.75
2 19.92 4.01 2.55 4.22 2.72 6.68
a CBDBS punches from five CBs were eluted, pooled, and assayed 10 times(intra-assay) on two separate days (inter-assay).
b %CV.c Mean %CV for 5 samples/plate/day.
11,681 ± 4,482, 53,692 ± 25,600, and 63,150 ± 30,210 ng/ml, respectively. Similar interference of IgG subclass analysiswas also observed at dilutions b1/400. Although similarinterference may exist for measurement of IgA, this could notbe determined as detectable values could not be obtained whenincreasing the plasma dilution values.
3.5. Immunoprecipitation andWestern blot analysis of Ig recoveredfrom CBDBSs
CBDBS punches were processed as described in theMaterial and methods section. The anti-IgG beads capturedthe most protein, likely as the IgG levels are higher than IgAand IgM. Therefore, the IgG lane shows the densest bands(Fig. 4). In the IgG lane, the densest bands were confirmed tobe the heavy and light chains by Western blot analysis (notshown). The high molecule band, a barely visible band atabout 40 kDa, and a lower MW band than the light chainband did not react with the HRP-goat anti-Ig. The IgM lanealso had a band at about 35 kDa and a band of lower MWthan the light chain that did not react with the anti-Ig. Nobands were detected for IgE, which likely is due to its lowconcentration and the heat lability of IgE (Mota, 1964). TheIgG and IgM results suggest that other serum proteins may becaptured with IgG and IgM, although it is possible that theextra bands are Ig fragments.
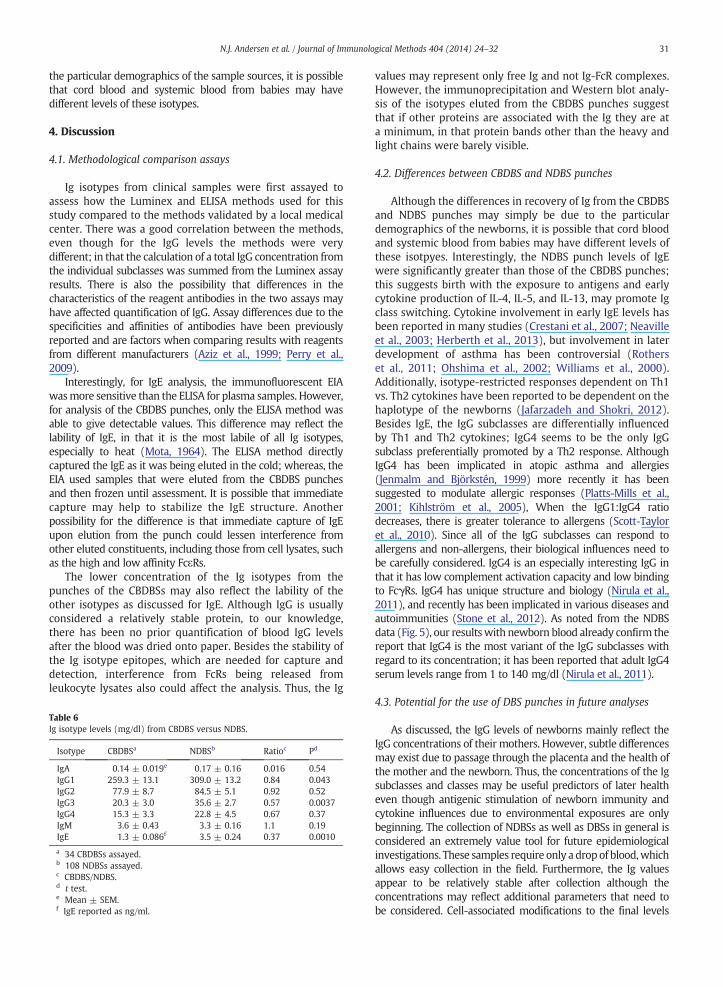
3.6. Relative amounts of Ig isotypes from NDBS punches
The concentrations (mean ± SEM) of IgM, IgG1, IgG2,IgG3, IgG4, and IgA eluted from the NDBS punches were3.3 ± 0.2, 309 ± 13, 84.5 ± 5.1, 35.5 ± 2.7, 22.6 ± 4.5, and1.7 ± 0.2 mg/dl, respectively. The IgE concentrations elutedfrom the NDBS punches were 3.49 ± 0.24 ng/ml. Althoughonly the mean value for the IgG3 was above the normalserum range, some sample results fell outside of the normalrange (Fig. 5). None of the NBDS samples had IgA or IgMconcentrations beyond the normal ranges for plasma sam-ples. However, IgG1, IgG2, IgG3, IgG4, and IgE had 30, 21, 0,14, and 0 samples below their ranges and 4, 9, 62, 19, and 21samples above their respective ranges. Interestingly, IgG4values had the greatest range (30,664-fold), and IgG1 valueshad the lowest range (11.3-fold). The Ig isotype concentra-tions from the NDBS punches were compared for outliers, asdescribed in the Material and methods section. The numbers
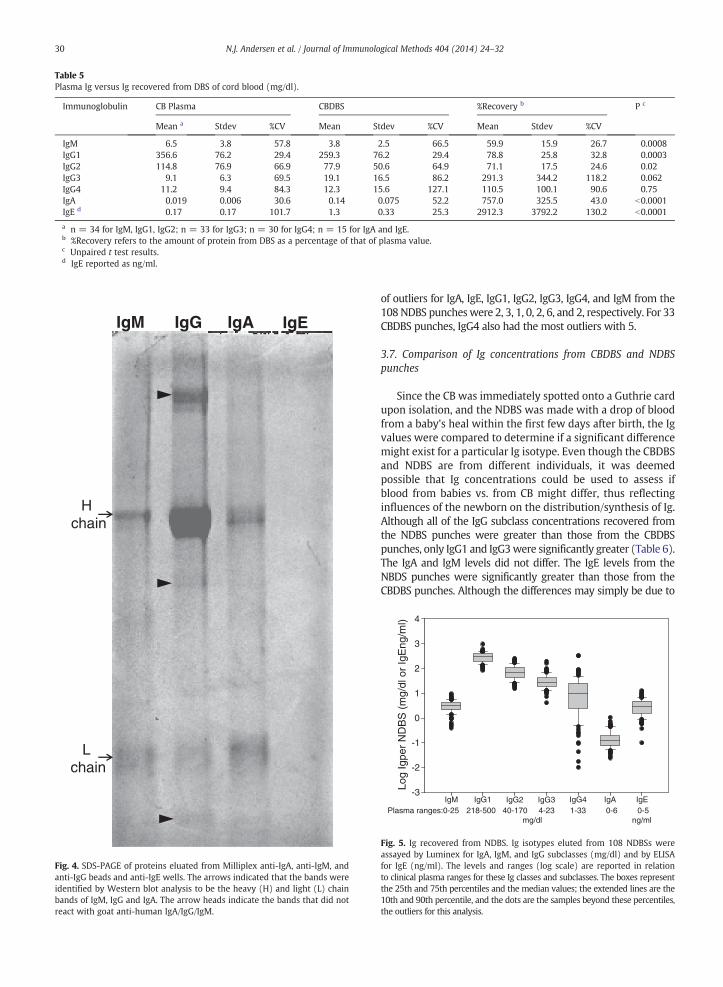
Table 5Plasma Ig versus Ig recovered from DBS of cord blood (mg/dl).
Immunoglobulin CB Plasma CBDBS %Recovery b P c
Mean a Stdev %CV Mean Stdev %CV Mean Stdev %CV
IgM 6.5 3.8 57.8 3.8 2.5 66.5 59.9 15.9 26.7 0.0008IgG1 356.6 76.2 29.4 259.3 76.2 29.4 78.8 25.8 32.8 0.0003IgG2 114.8 76.9 66.9 77.9 50.6 64.9 71.1 17.5 24.6 0.02IgG3 9.1 6.3 69.5 19.1 16.5 86.2 291.3 344.2 118.2 0.062IgG4 11.2 9.4 84.3 12.3 15.6 127.1 110.5 100.1 90.6 0.75IgA 0.019 0.006 30.6 0.14 0.075 52.2 757.0 325.5 43.0 b0.0001IgE d 0.17 0.17 101.7 1.3 0.33 25.3 2912.3 3792.2 130.2 b0.0001
a n = 34 for IgM, IgG1, IgG2; n = 33 for IgG3; n = 30 for IgG4; n = 15 for IgA and IgE.b %Recovery refers to the amount of protein from DBS as a percentage of that of plasma value.c Unpaired t test results.d IgE reported as ng/ml.
IgM IgG IgA IgE
H chain
L chain
Fig. 4. SDS-PAGE of proteins eluated from Milliplex anti-IgA, anti-IgM, andanti-IgG beads and anti-IgE wells. The arrows indicated that the bands wereidentified by Western blot analysis to be the heavy (H) and light (L) chainbands of IgM, IgG and IgA. The arrow heads indicate the bands that did notreact with goat anti-human IgA/IgG/IgM.
30 N.J. Andersen et al. / Journal of Immunological Methods 404 (2014) 24–32
of outliers for IgA, IgE, IgG1, IgG2, IgG3, IgG4, and IgM from the108NDBS puncheswere 2, 3, 1, 0, 2, 6, and 2, respectively. For 33CBDBS punches, IgG4 also had the most outliers with 5.
3.7. Comparison of Ig concentrations from CBDBS and NDBSpunches
Since the CB was immediately spotted onto a Guthrie cardupon isolation, and the NDBS was made with a drop of bloodfrom a baby's heal within the first few days after birth, the Igvalues were compared to determine if a significant differencemight exist for a particular Ig isotype. Even though the CBDBSand NDBS are from different individuals, it was deemedpossible that Ig concentrations could be used to assess ifblood from babies vs. from CB might differ, thus reflectinginfluences of the newborn on the distribution/synthesis of Ig.Although all of the IgG subclass concentrations recovered fromthe NDBS punches were greater than those from the CBDBSpunches, only IgG1 and IgG3were significantly greater (Table 6).The IgA and IgM levels did not differ. The IgE levels from theNBDS punches were significantly greater than those from theCBDBS punches. Although the differences may simply be due to
Log
Igpe
r N
DB
S (
mg/
dl o
r Ig
Eng
/ml)
-3
-1
1
2
3
4
0
-2
IgM IgG1 IgG2 IgG3 IgG4 IgEIgAPlasma ranges:0-25 218-500 40-170 4-23 1-33 0-6 0-5
mg/dl ng/ml
Fig. 5. Ig recovered from NDBS. Ig isotypes eluted from 108 NDBSs wereassayed by Luminex for IgA, IgM, and IgG subclasses (mg/dl) and by ELISAfor IgE (ng/ml). The levels and ranges (log scale) are reported in relationto clinical plasma ranges for these Ig classes and subclasses. The boxes representthe 25th and 75th percentiles and the median values; the extended lines are the10th and 90th percentile, and the dots are the samples beyond these percentiles,the outliers for this analysis.
31N.J. Andersen et al. / Journal of Immunological Methods 404 (2014) 24–32
the particular demographics of the sample sources, it is possiblethat cord blood and systemic blood from babies may havedifferent levels of these isotypes.
4. Discussion
4.1. Methodological comparison assays
Ig isotypes from clinical samples were first assayed toassess how the Luminex and ELISA methods used for thisstudy compared to the methods validated by a local medicalcenter. There was a good correlation between the methods,even though for the IgG levels the methods were verydifferent; in that the calculation of a total IgG concentration fromthe individual subclasses was summed from the Luminex assayresults. There is also the possibility that differences in thecharacteristics of the reagent antibodies in the two assays mayhave affected quantification of IgG. Assay differences due to thespecificities and affinities of antibodies have been previouslyreported and are factors when comparing results with reagentsfrom different manufacturers (Aziz et al., 1999; Perry et al.,2009).
Interestingly, for IgE analysis, the immunofluorescent EIAwasmore sensitive than the ELISA for plasma samples. However,for analysis of the CBDBS punches, only the ELISA method wasable to give detectable values. This difference may reflect thelability of IgE, in that it is the most labile of all Ig isotypes,especially to heat (Mota, 1964). The ELISA method directlycaptured the IgE as it was being eluted in the cold; whereas, theEIA used samples that were eluted from the CBDBS punchesand then frozen until assessment. It is possible that immediatecapture may help to stabilize the IgE structure. Anotherpossibility for the difference is that immediate capture of IgEupon elution from the punch could lessen interference fromother eluted constituents, including those from cell lysates, suchas the high and low affinity FcεRs.
The lower concentration of the Ig isotypes from thepunches of the CBDBSs may also reflect the lability of theother isotypes as discussed for IgE. Although IgG is usuallyconsidered a relatively stable protein, to our knowledge,there has been no prior quantification of blood IgG levelsafter the blood was dried onto paper. Besides the stability ofthe Ig isotype epitopes, which are needed for capture anddetection, interference from FcRs being released fromleukocyte lysates also could affect the analysis. Thus, the Ig
Table 6Ig isotype levels (mg/dl) from CBDBS versus NDBS.
Isotype CBDBSa NDBSb Ratioc Pd
IgA 0.14 ± 0.019e 0.17 ± 0.16 0.016 0.54IgG1 259.3 ± 13.1 309.0 ± 13.2 0.84 0.043IgG2 77.9 ± 8.7 84.5 ± 5.1 0.92 0.52IgG3 20.3 ± 3.0 35.6 ± 2.7 0.57 0.0037IgG4 15.3 ± 3.3 22.8 ± 4.5 0.67 0.37IgM 3.6 ± 0.43 3.3 ± 0.16 1.1 0.19IgE 1.3 ± 0.086f 3.5 ± 0.24 0.37 0.0010
a 34 CBDBSs assayed.b 108 NDBSs assayed.c CBDBS/NDBS.d t test.e Mean ± SEM.f IgE reported as ng/ml.
values may represent only free Ig and not Ig-FcR complexes.However, the immunoprecipitation and Western blot analy-sis of the isotypes eluted from the CBDBS punches suggestthat if other proteins are associated with the Ig they are ata minimum, in that protein bands other than the heavy andlight chains were barely visible.
4.2. Differences between CBDBS and NDBS punches
Although the differences in recovery of Ig from the CBDBSand NDBS punches may simply be due to the particulardemographics of the newborns, it is possible that cord bloodand systemic blood from babies may have different levels ofthese isotpyes. Interestingly, the NDBS punch levels of IgEwere significantly greater than those of the CBDBS punches;this suggests birth with the exposure to antigens and earlycytokine production of IL-4, IL-5, and IL-13, may promote Igclass switching. Cytokine involvement in early IgE levels hasbeen reported in many studies (Crestani et al., 2007; Neavilleet al., 2003; Herberth et al., 2013), but involvement in laterdevelopment of asthma has been controversial (Rotherset al., 2011; Ohshima et al., 2002; Williams et al., 2000).Additionally, isotype-restricted responses dependent on Th1vs. Th2 cytokines have been reported to be dependent on thehaplotype of the newborns (Jafarzadeh and Shokri, 2012).Besides IgE, the IgG subclasses are differentially influencedby Th1 and Th2 cytokines; IgG4 seems to be the only IgGsubclass preferentially promoted by a Th2 response. AlthoughIgG4 has been implicated in atopic asthma and allergies(Jenmalm and Björkstén, 1999) more recently it has beensuggested to modulate allergic responses (Platts-Mills et al.,2001; Kihlström et al., 2005), When the IgG1:IgG4 ratiodecreases, there is greater tolerance to allergens (Scott-Tayloret al., 2010). Since all of the IgG subclasses can respond toallergens and non-allergens, their biological influences need tobe carefully considered. IgG4 is an especially interesting IgG inthat it has low complement activation capacity and low bindingto FcγRs. IgG4 has unique structure and biology (Nirula et al.,2011), and recently has been implicated in various diseases andautoimmunities (Stone et al., 2012). As noted from the NDBSdata (Fig. 5), our resultswith newborn blood already confirm thereport that IgG4 is the most variant of the IgG subclasses withregard to its concentration; it has been reported that adult IgG4serum levels range from 1 to 140 mg/dl (Nirula et al., 2011).
4.3. Potential for the use of DBS punches in future analyses
As discussed, the IgG levels of newborns mainly reflect theIgG concentrations of their mothers. However, subtle differencesmay exist due to passage through the placenta and the health ofthe mother and the newborn. Thus, the concentrations of the Igsubclasses and classes may be useful predictors of later healtheven though antigenic stimulation of newborn immunity andcytokine influences due to environmental exposures are onlybeginning. The collection of NDBSs as well as DBSs in general isconsidered an extremely value tool for future epidemiologicalinvestigations. These samples require only a drop of blood,whichallows easy collection in the field. Furthermore, the Ig valuesappear to be relatively stable after collection although theconcentrations may reflect additional parameters that need tobe considered. Cell-associated modifications to the final levels
32 N.J. Andersen et al. / Journal of Immunological Methods 404 (2014) 24–32
may cause the DBS values to differ fromplasma values. The B celllevels could enhance the levels due to lysis and release of their Ig.The release of FcRs from leukocytes could block epitopes of Igand inhibit Ig values. Regardless of complications that could alterthe DBS Ig values, the results from 108 newborns of the UpstateKIDS Study are very consistent; there were very few outlierseven for the most variant Ig.
5. Conclusions
Our findings suggest that NDBSs offer promise for populationbased research designed to answer etiologic questions aboutpreconceptional or in utero exposures and infants' health status,as globally defined. The detection of outliers might be informa-tive of possible immunological differences among select infants.
Acknowledgments
This study was supported by the Intramural ResearchProgram of the Eunice Kennedy Shriver National Institute ofChild Health and Human Development (NICHD; contracts#HHSN275201200005C, #HHSN267200700019C). We thankJeffrey S. Kennedy, M.D. for his assistance in obtaining theNDBS punches and Tiffany Tryniszewski for her assistancewith the Luminex analysis of CB plasma and CBDBS punches.
References
Acharya, M., Borland, G., Edkins, A.L., MacLellan, L.M., Matheson, J., Ozanne,B.W., Cushley, W., 2010. CD23/FcεRII: molecular multi-tasking. Clin. Exp.Immunol. 162 (1), 12.
Annesi-Maesano, I., Pollitt, R., King, G., Bousquet, J., Hellier, G., Sahuquillo, J.,Huel, G., 2003. In utero exposure to lead and cord blood total IgE. Is therea connection? Allergy 58 (7), 589.
Aziz, A.L., Nishanian, P., Mitsuyasu, R., Detels, R., Fahey, J.L., 1999. Varibablesthat affect assays for plasma cytokines and soluble activation markers.Clin. Diagn. Lab. Immunol. 6 (1), 89.
Borte, S., Janzi, M., Pan-Hammarström, Q., von Döbeln, U., Nordvall, L.,Winiarski, J., Fasth, A., Hammarström, L., 2012. Placental transfer ofmaternally-derived IgA precludes the use of guthrie card eluates as ascreening tool for primary immunodeficiency diseases. PLoS One 7 (8),e43419.
Conrad, D.H., 1990. Fc epsilon RII/CD23: the low affinity receptor for IgE.Annu. Rev. Immunol. 8, 623.
Costa-Carvalho, B.T., Vieira, H.M., Dimantas, R.B., et al., 1996. Transfer of IgGsubclasses across placenta in term and preterm newborns. Braz. J. Med.Biol. Res. 29 (2), 201.
Crestani, E., Lohman, I.C., Guerra, S., Wright, A.L., Halonen, M., 2007.Association of IL-5 cytokine production and in vivo IgE levels in infantsand parents. J. Allergy Clin. Immunol. 120 (4), 820.
Hamilton, R.G., 2001. The human IgG subclasses. Calbiochem-NovabiochemCorp.
Heo, Y., Parsons, P.J., Lawrence, D.A., 1996. Lead differentially modifiescytokine production in vitro and in vivo. Toxicol. Appl. Pharmacol. 138,149.
Herberth, G., Herzog, T., Hinz, D., Röder, S., Schilde, M., Sack, U., Diez, U.,Borte, M., Lehmann, I., 2013. Renovation activities during pregnancyinduce a Th2 shift in fetal but not in maternal immune system. Int. J. Hyg.Environ. Health 216 (3), 309.
Jafarzadeh, A., Shokri, F., 2012. TH1 and TH2 responses are influenced by HLAantigens in healthy neonates vaccinated with recombinant hepatitis Bvaccine. Iran J. Allergy Asthma Immunol. 11 (4), 308.
Jenmalm, M.C., Björkstén, B., 1999. Development of immunoglobulin Gsubclass antibodies to ovalbumin, birch and cat during the first eightyears of life in atopic and non-atopic children. Pediatr. Allergy Immunol.10 (2), 112.
Kaiserlian, D., Lachaux, A., Grosjean, I., Graber, P., Bonnefoy, J.Y., 1993.Intestinal epithelial cells express the CD23/Fc epsilon RII molecule:enhanced expression in enteropathies. Immunology 80, 90.
Kihlström, A., Hedlin, G., Pershagen, G., Troye-Blomberg, M., Härfast, B., Lilja,G., 2005. Immunoglobulin G4-antibodies to rBet v 1 and risk of
sensitization and atopic disease in the child. Clin. Exp. Allergy 35 (12),1542.
Kinet, J.P., 1999. The high-affinity IgE receptor (Fc epsilon RI): from physiology topathology. Annu. Rev. Immunol. 7, 931.
Lawrence, D.A., Weigle, W.O., Spiegelberg, H.L., 1975. Immunoglobulinscytophilic for human lymphocytes, monocytes, and neutrophils. J. Clin.Invest. 55 (2), 368.
Lawrence, D.A., Bolivar, V.J., Hudson, C.A., Mondal, T.K., Pabello, N.G., 2007.Antibody induction of lupus-like neuropsychiatric manifestations.J. Neuroimmunol. 182 (1–2), 185.
Mei, J.V., Li, L., Rasmussen, S.A., Collier, S., Frias, J.L., Honein, M.A., Shaw, G.M.,Lorey, F., Meyer, R., Chaing, S., Canfield, M.A., Jones, J., Hannon, W.H.,2011. Effect of specimen storage conditions on newborn dried bloodspots used to assess Toxoplasma gondii immunoglobulin M (IgM). Clin.Chim. Acta 412 (5–6), 455.
Mota, I., 1964. The mechanism of anaphylaxis. I. Production and biologicalproperties of mast cell sensitizing antibody. Immunology 7, 681.
Neaville, W.A., Tisler, C., Bhattacharya, A., Anklam, K., Gilbertson-White, S.,Hamilton, R., Adler, K., Dasilva, D.F., Roberg, K.A., Carlson-Dakes, K.T.,Anderson, E., Yoshihara, D., Gangnon, R., Mikus, L.D., Rosenthal, L.A.,Gern, J.E., Lemanske Jr., R.F., 2003. Developmental cytokine responseprofiles and the clinical and immunologic expression of atopy during thefirst year of life. J. Allergy Clin. Immunol. 112 (4), 740.
Nirula, A., Glaser, S.M., Kalled, S.L., Taylor, F.R., 2011. What is IgG4? A reviewof the biology of a unique immunoglobulin subtype. Curr. Opin.Rheumatol. 23, 119.
Ohshima, Y., Yasutomi, M., Omata, N., Yamada, A., Fujisawa, K., Kasuga, K.,Hiraoka, M., Mayumi, M., 2002. Dysregulation of IL-13 production bycord blood CD4+ T cells is associated with the subsequent developmentof atopic disease in infants. Pediatr. Res. 51 (2), 195.
Palmeira, P., Quinello, C., Silveira-Lessa, A.L., Zago, C.A., Carneiro-Sampaio,M., 2012. IgG placental transfer in healthy and pathological pregnancies.Clin. Dev. Immunol. 2012, 985646.
Perry, A.L., Hayes, A.J., Cox, H.A., Alcock, F., Parker, A.R., 2009. Comparison offive commercial anti-tetanus toxoid immunoglobulin G enzyme-linkedimmunosorbent assays. Clin. Vaccine Immunol. 16 (12), 1837.
Peters, J.L., Cohen, S., Staudenmayer, J., Hosen, J., Platts-Mills, T.A.E., Wright, R.J.,2012. Prenatal negative life events increases cord blood IgE: Interactionswithdust mite allergen and maternal atopy. Allergy 67 (4), 545.
Platts-Mills, T., Vaughan, J., Squillace, S., Woodfolk, J., Sporik, R., 2001.Sensitisation, asthma, and a modified Th2 response in children exposedto cat allergen: a population-based cross-sectional study. Lancet 357(9258), 752.
Ravetch, J.V., Kinet, J.P., 1991. Fc receptors. Annu. Rev. Immunol. 9, 457.Rothers, J., Halonen, M., Stern, D.A., Lohman, I.C., Mobley, S., Spangenberg, A.,
Anderson, D., Wright, A.L., 2011. Adaptive cytokine production in earlylife differentially predicts total IgE levels and asthmathrough age5 years. J. Allergy Clin. Immunol. 128 (2), 397.
Saji, F., Samejima, Y., Kamiura, S., Koyama, M., 1999. Dynamics of immunoglob-ulins at the feto-maternal interface. Rev. Reprod. 4 (2), 81.
Schur, P.H., 1987. IgG subclasses—a review. Ann. Allergy 58 (2), 89.Scott-Taylor, T.H., O'B Hourihane, J., Strobel, S., 2010. Correlation of allergen-
specific IgG subclass antibodies and T lymphocyte cytokine responses inchildren with multiple food allergies. Pediatr. Allergy Immunol. 21 (6),935.
Seydel, L.S., Petelski, A., van Dam, G.J., van der Kleij, D., Kruize-Hoeksma,Y.C.M., Luty, A.J.F., Yazdanbakhsh, M., Kremsner, P.G., 2012. Associationof in utero sensitization to Schistosoma haematobiumwith enhanced cordblood IgE and increased frequencies of CD5-B cells in African newborns.Am. J. Trop. Med. Hyg. 86 (4), 613.
Snyder, J.E., Filipov, N.M., Parsons, P.J., Lawrence, D.A., 2000. The efficiency ofmaternal transfer of lead and its influence on plasma IgE and spleniccellularity of mice. Toxicol. Sci. 57 (1), 87.
Stone, J.H., Zen, Y., Deshpande, V., 2012. IgG4-related disease. N. Engl. J. Med.366, 539.
Taylor, J.K., 1990. Statistical Techniques For Data Analysis. Lewis Publishers,Chelsea, Michigan.
Untersmayr, E., Bises, G., Starkl, P., Bevins, C.L., Scheiner, O., Boltz-Nitulesc,G., Wrba, F., Jensen-Jarolim, E., 2010. The high affinity IgE receptor FcεRIis expressed by human intestinal epithelial cells. PLoS One 5 (2), e9023(993;80:90–95).
Uzicanin, A., Lubega, I., Nanuynia, M., Mercader, S., Rota, P., Bellini, W.,Helfand, R., 2011. Dried blood spots on filter paper as an alternativespecimen for measles diagnostics: detection of measles immunoglobulinM antibody by a commercial enzyme immunoassay. J. Infect. Dis. 204(Suppl. 1), S564–569.
Williams, T.J., Jones, C.A., Miles, E.A., Warner, J.O., Warner, J.A., 2000. Fetaland neonatal IL-13 production during pregnancy and at birth andsubsequent development of atopic symptoms. J. Allergy Clin. Immunol.105 (5), 951.