Hot spots of retroviral integration in human CD34+ hematopoietic cells
31
doi:10.1182/blood-2007-01-068759 Prepublished online May 16, 2007; Alessandra Recchia and Fulvio Mavilio Manfred Schmidt, Christof von Kalle, Steve Howe, Adrian J. Thrasher, Alessandro Aiuti, Giuliana Ferrari, Claudia Cattoglio, Giulia Facchini, Daniela Sartori, Antonella Antonelli, Annarita Miccio, Barbara Cassani, Hot spots of retroviral integration in human CD34+ hematopoietic cells (795 articles) Oncogenes and Tumor Suppressors (4217 articles) Neoplasia (3131 articles) Hematopoiesis and Stem Cells (523 articles) Gene Therapy (1725 articles) Free Research Articles Articles on similar topics can be found in the following Blood collections http://bloodjournal.hematologylibrary.org/site/misc/rights.xhtml#repub_requests Information about reproducing this article in parts or in its entirety may be found online at: http://bloodjournal.hematologylibrary.org/site/misc/rights.xhtml#reprints Information about ordering reprints may be found online at: http://bloodjournal.hematologylibrary.org/site/subscriptions/index.xhtml Information about subscriptions and ASH membership may be found online at: digital object identifier (DOIs) and date of initial publication. the indexed by PubMed from initial publication. Citations to Advance online articles must include final publication). Advance online articles are citable and establish publication priority; they are appeared in the paper journal (edited, typeset versions may be posted when available prior to Advance online articles have been peer reviewed and accepted for publication but have not yet Copyright 2011 by The American Society of Hematology; all rights reserved. 20036. the American Society of Hematology, 2021 L St, NW, Suite 900, Washington DC Blood (print ISSN 0006-4971, online ISSN 1528-0020), is published weekly by For personal use only. by guest on May 30, 2013. bloodjournal.hematologylibrary.org From
-
Upload
independent -
Category
Documents
-
view
4 -
download
0
Transcript of Hot spots of retroviral integration in human CD34+ hematopoietic cells

doi:10.1182/blood-2007-01-068759Prepublished online May 16, 2007;
Alessandra Recchia and Fulvio MavilioManfred Schmidt, Christof von Kalle, Steve Howe, Adrian J. Thrasher, Alessandro Aiuti, Giuliana Ferrari, Claudia Cattoglio, Giulia Facchini, Daniela Sartori, Antonella Antonelli, Annarita Miccio, Barbara Cassani, Hot spots of retroviral integration in human CD34+ hematopoietic cells
(795 articles)Oncogenes and Tumor Suppressors � (4217 articles)Neoplasia �
(3131 articles)Hematopoiesis and Stem Cells � (523 articles)Gene Therapy �
(1725 articles)Free Research Articles �Articles on similar topics can be found in the following Blood collections
http://bloodjournal.hematologylibrary.org/site/misc/rights.xhtml#repub_requestsInformation about reproducing this article in parts or in its entirety may be found online at:
http://bloodjournal.hematologylibrary.org/site/misc/rights.xhtml#reprintsInformation about ordering reprints may be found online at:
http://bloodjournal.hematologylibrary.org/site/subscriptions/index.xhtmlInformation about subscriptions and ASH membership may be found online at:
digital object identifier (DOIs) and date of initial publication. theindexed by PubMed from initial publication. Citations to Advance online articles must include
final publication). Advance online articles are citable and establish publication priority; they areappeared in the paper journal (edited, typeset versions may be posted when available prior to Advance online articles have been peer reviewed and accepted for publication but have not yet
Copyright 2011 by The American Society of Hematology; all rights reserved.20036.the American Society of Hematology, 2021 L St, NW, Suite 900, Washington DC Blood (print ISSN 0006-4971, online ISSN 1528-0020), is published weekly by
For personal use only. by guest on May 30, 2013. bloodjournal.hematologylibrary.orgFrom

Hot spots of retroviral integration
in human CD34+ hematopoietic cells
Claudia Cattoglio, Giulia Facchini, Daniela Sartori, Antonella Antonelli, Annarita Miccio,
Barbara Cassani, Manfred Schmidt, Christof von Kalle, Steve Howe, Adrian J. Thrasher,
Alessandro Aiuti, Giuliana Ferrari, Alessandra Recchia and Fulvio Mavilio.
From the IIT Unit of Molecular Neuroscience, Istituto Scientifico H. San Raffaele, Milan,
Italy; Department of Biomedical Sciences, University of Modena and Reggio Emilia,
Modena, Italy; San Raffaele Telethon Institute for Gene Therapy, Milan, Italy; Vita-Salute
San Raffaele University, Milan, Italy; National Center for Tumor Diseases, Heidelberg,
Germany; Molecular Immunology Unit, Institute of Child Health, London, United Kingdom.
Running title: Retroviral integration hot spots
Supported by grants from Telethon Italy (GGP06101 and TIGET), the European Commission
(VI FP, CONSERT) and Fondazione Cariplo.
Corresponding author: Fulvio Mavilio Department of Biomedical Sciences University of Modena and Reggio Emilia Via Campi 287, 41100 Modena, Italy Phone: +39-059-2055392 Fax: +39-059-2055410 e-mail: [email protected]
C. Cattoglio, A. Recchia and F. Mavilio designed research and wrote the paper;
C. Cattoglio, G. Facchini, D. Sartori, A. Antonelli, A. Miccio, S. Howe, B. Cassani performed
research and analyzed data; M. Schmidt, C. von Kalle, A. Thrasher, A. Aiuti and G. Ferrari
contributed vital reagents and data sets.
Blood First Edition Paper, prepublished online May 16, 2007; DOI 10.1182/blood-2007-01-068759
Copyright © 2007 American Society of Hematology
For personal use only. by guest on May 30, 2013. bloodjournal.hematologylibrary.orgFrom

ABSTRACT
Insertional oncogenesis is a possible consequence of the integration of gamma-retroviral
(RV) or lentiviral (LV) vectors into the human genome. RV common insertion sites
(CIS) have been identified in hematopoietic malignancies and in the non-malignant
progeny of transduced hematopoietic stem/progenitor cells (HSCs), possibly as a
consequence of clonal selection in vivo. We have mapped a large number of RV and LV
integrations in human CD34+ HSCs, transduced in vitro and analyzed without selection.
Recurrent insertion sites (hot spots) account for >21% of the RV integration events,
while they are significantly less frequent in the case of LV vectors. RV but not LV hot
spots are highly enriched in proto-oncogenes, cancer-associated CIS, and growth-
controlling genes, indicating that at least part of the biases observed in the HSC progeny
in vivo are characteristics of RV integration, already present in non-transplanted cells.
Genes involved in hematopoietic and immune system development are targeted at high
frequency and enriched in hot spots, suggesting that the CD34+ gene expression
program is instrumental in directing RV integration. The lower propensity of LV
vectors for integrating in potentially dangerous regions of the human genome may be a
factor determining a better safety profile for gene therapy applications.
For personal use only. by guest on May 30, 2013. bloodjournal.hematologylibrary.orgFrom

Introduction
Gene therapy of genetic blood disorders requires stable genetic modification of hematopoietic
stem cells. Gene transfer vectors derived from murine gamma-retroviruses, such as the
Moloney murine leukemia virus (MLV), have been used for more than a decade to transduce
human bone marrow-derived or mobilized hematopoietic stem/progenitor cells (HSCs) in a
clinical context. Retroviral vector-mediated gene transfer has recently achieved therapeutic
efficacy, allowing correction of life-threatening diseases such as severe combined
immunodeficiencies (SCID)1-3 or chronic granulomatous disease (CGD)4. MLV-derived
vectors, however, have also raised significant safety concerns for the genotoxic risk
potentially associated with their uncontrolled integration into the human genome5-7. Indeed,
insertional activation of a T-cell proto-oncogene has been correlated with the occurrence of
lymphoproliferative disorders in three patients treated with retrovirally-transduced
hematopoietic cells for X-linked SCID (X-SCID)1. Recent studies have shown that gamma-
retroviral vectors integrate preferentially within transcribed genes and around promoters and
CpG islands8, where insertion of the viral long terminal repeat (LTR) transcriptional enhancer
has a high probability to interfere with gene regulation9. Nevertheless, no adverse event
related to viral insertion was reported in other clinical trials for X-SCID3, adenosine
deaminase-deficient SCID (ADA-SCID)2, CGD4 or graft-versus-host disease9, suggesting the
existence of specific risk factors that are incompletely understood10.
Analysis of MLV integration patterns in natural or experimentally induced
leukemias/lymphomas showed the existence of insertion sites recurrently associated with a
malignant phenotype. These “common insertion sites” (CIS) include proto-oncogenes or other
genes associated with cell growth and proliferation, the activation or deregulation of which
has a causal relationship with the establishment and/or progression of neoplasia11. Some of
these sites, such as the EVI1-MDS1 locus, have been identified at relatively high frequency
also in the non-malignant progeny of transduced hematopoietic cells in mice12 non-human
primates13 and humans4, indicating that insertion into certain genes may cause clonal
amplification of transduced progenitors in vivo. From these studies, however, it is not clear
whether clonal dominance is entirely the result of in vivo selection, or is favored by the
existence of highly preferred regions of retroviral integration that make clonal amplification
more likely to occur. This issue is highly relevant in understanding the different outcomes of
For personal use only. by guest on May 30, 2013. bloodjournal.hematologylibrary.orgFrom

different gene therapy clinical trials, in assessing the relative safety of using MLV-derived
vectors in specific clinical applications, and in comparing the safety profile of alternative
vectors (e.g., HIV-derived lentiviral vectors) or vector designs.
We report an analysis of gamma-retroviral (RV) and lentiviral (LV) vector integration
hot spots from large collections of integration sites obtained from human cord blood- and
bone marrow-derived CD34+ HSCs transduced in vitro and analyzed without selection. Hot
spots account for >20% of the MLV integration sites, while they are significantly less
frequent in the case of HIV-derived vectors. Integration sites associated with clonal
dominance and neoplasia in both mice and humans, including LMO2, are hot spots of
gamma-retroviral but not lentiviral integration in human hematopoietic cells.
Materials and Methods
Retroviral vectors
Cord blood (CB)-derived CD34+ cells were transduced with the previously described LGS∆N
and LGS∆N-∆CAAT RV vectors14, driving the expression of GFP under an intact or a U3-
deleted MLV LTR, and of ∆LNGFR under an internal SV40 promoter. CB-derived CD34+
cells were also transduced with the self-inactivating (SIN) pRRLsin-18.pptCMV-GFPwpre
LV vector15, containing a U3-deleted HIV-1 LTR and a CMV-driven GFP cassette16, or with
the pHR2pptCMV-GFPwpre or the pHR2pptGS∆N LV vectors, retaining HIV-1 wild-type
LTRs and driving the expression of GFP or ∆LNGFR under internal CMV or SV40
promoters. To generate the pHR2pptCMVGFPwpre construct, a pptCMVGFPwpre fragment
from the pRRLsin-18.pptCMVGFPwpre vector was cloned into ClaI-EcoRI sites of
pHR2MD-NGFR17. To obtain the pHR2pptGS∆N LV construct, the pHR2pptCMVGFPwpre
vector was digested with BamHI/EcoRI and ligated to a GFP-SV40∆LNGFR cassette. Bone
marrow (BM)-derived CD34+ cells were transduced with previously described RV vectors
expressing either the ADA (GIADA12) or the γc receptor3 cDNA.
RV vector supernatants were produced by transient transfection of the amphotropic
Phoenix packaging cell line. Infectious particle titer was determined on K562 cells. VSV-G
pseudotyped LV particles were prepared by transient co-transfection of 293T cells, collected
and concentrated as already described17, and titrated on 293T cells. Transduction efficiency
For personal use only. by guest on May 30, 2013. bloodjournal.hematologylibrary.orgFrom

was evaluated by flow cytometry. Amphotropic or GaLV-pseudotyped ADA and γc receptor
RV vectors were titered as previously described2,3.
Transduction of human CD34+ cells
CD34+ HSCs were purified from cord blood Ficoll fractions by magnetic sorting
(MiniMACS; Milthenyi, Auburn, CA) and pre-stimulated for 24-48 hours in serum-free
Iscove’s modified Dulbecco’s medium (IMDM) supplemented with 20% BIT (Stem Cell
Technologies; Vancouver, BC), 20 ng/ml human thrombopoietin, 100 ng/ml Flt-3 ligand
(PeproTech; Rocky Hill, NJ), 20 ng/ml interleukin-6, and 100 ng/ml stem cell factor (R&D
Systems Minneapolis, MN). RV transduction was performed by spinoculation (3 rounds at
1,500 rpm for 45 min) in the presence of 4 µg/ml polybrene. LV transduction was performed
by overnight incubation at a MOI of 200 in the presence of 4 µg/ml polybrene. Transduction
efficiency was evaluated by analysis of EGFP and/or ∆LNGFR expression by flow cytometry
using a mouse anti-human NGFR antibody (Becton Dickinson).
BM- or peripheral blood-derived CD34+ cells were purified from normal donors or
SCID patients by magnetic sorting, pre-stimulated for 24 hours in IMDM containing human
serum, or serum-free X-Vivo10 medium, and a cytokine cocktail (FLT3-ligand, SCF, TPO,
IL-3), and transduced by three cycle-exposure to the GIADA1 or the γc receptor RV vector
supernatant as previously described2,3.
Cloning and analysis of retroviral insertion sites
Integration sites were cloned by linker-mediated PCR (LM-PCR) or linear amplification-
mediated PCR (LAM-PCR), as described18,19. Briefly, genomic DNA was extracted from 0.5-
5 x 10⁶ infected cells and digested with MseI and a second enzyme to prevent amplification of
internal 5’ LTR fragments (PstI for RV vectors and SacI/NarI for LV vectors). An MseI
double-stranded linker was then ligated and LM-PCR performed with nested primers specific
for the linker and the 3’ LTR (MLV: 5’- GACTTGTGGTCTCGCTGTTCCTTGG-3’ and 5’-
GGTCTCCTCTGAGTGATTGACTACC-3’; HIV: 5’- AGTGCTTCAAGTAGTGTGTGCC-
3’ and 5’- GTCTGTTGTGTGACTCTGGTAAC-3’). PCR products were shotgun-cloned
(TOPO TA cloning kit, Invitrogen; Carlsbad, CA) into libraries of integration junctions,
which were then sequenced to saturation. A valid integration contained the MLV or HIV
nested primer, the entire MLV or HIV genome up to a CA dinucleotide and the linker nested
For personal use only. by guest on May 30, 2013. bloodjournal.hematologylibrary.orgFrom

primer. Sequences between the 3’ LTR and the linker primers were mapped onto the human
genome by the BLAT genome browser (UCSC Human Genome Project Working Draft, May
2004). Random genomic sequences originated by LM-PCR (genomic MseI-MseI, PstI-MseI,
NarI-MseI or SacI-MseI fragments) were used as controls. Sequences featuring a unique best
hit with ≥95% identity to the human genome were considered genuine integration sites, and
classified as intergenic when occurring at an arbitrarily chosen distance of >30 kb from any
Known Gene (UCSC definition), perigenic when ≤30 kb upstream or downstream of a Known
Gene, and intragenic when within the transcribed portion of at least one Known Gene. In case
of multiple transcript variants, the most represented and/or the longest isoform was chosen.
Gene density analysis was performed using the Table Browser tool of the UCSC BLAT
genome browser. For each integration, the number of Known Genes (a single isoform in case
of multiple variants) contained in a range of 1 Megabase (Mb) around the insertion site was
calculated. For all pairwise comparisons, we applied a two-sample test for equality of
proportions with continuity correction (Rweb 1.03).
A genomic region was defined as an “hot spot” for retroviral integration according to
criteria developed for defining cancer-related common insertion sites (CIS), with minor
modifications11,20. Cutoff values were set at 36 kb for 2 insertions, 56 kb for 3 insertions and
104 kb for 4 or more insertions.
Gene expression profiling
The expression profile of CD34+ cells was determined by microarray analysis. RNA was
isolated from 1-2 x 10⁶ CB- and BM-derived CD34+ cells stimulated with cytokines according
to the same protocols used for RV (CB- and BM-derived cells) or LV (CB-derived cells)
vector transduction, transcribed into biotinylated cRNA, hybridized to Affymetrix HG-
U133A Gene Chip arrays and analyzed as previously described9. To correlate retroviral
integration and gene activity, expression values from the CD34+ cell microarrays were
divided into four classes, i.e. absent, low (below the 25th percentile in a normalized
distribution), intermediate (between the 25th and the 75th percentile) and high (above the 75th
percentile).
For personal use only. by guest on May 30, 2013. bloodjournal.hematologylibrary.orgFrom

Functional clustering analysis
Functional cluster analysis of genes targeted by retroviral integrations and from control
sequences was performed using the DAVID 2.1 Functional Annotation Tool21,22
(http://david.abcc.ncifcrf.gov). In the DAVID annotation system, a Fisher exact test corrected
for multiple comparisons (DAVID’s EASE score21) is adopted to measure the level of gene-
enrichment in Gene Ontology (GO) annotation terms with respect to a background
population, and GO categories considered over-represented when yielding an EASE score
<0.05. A list of 417 cancer-associated CIS was obtained from the Mouse Retrovirus Tagged
Cancer Gene Database (http://rtcgd.ncifcrf.gov/), where murine genes were replaced with
human homologs. Genes were analyzed also by the network-based Ingenuity Pathways
Analysis tool (Ingenuity® Systems, www.ingenuity.com). Gene identifiers were uploaded
into the application, and mapped to their corresponding Focus Gene in the Ingenuity
Pathways Knowledge Base. Networks were algorithmically generated based on the direct or
indirect interaction between Focus Genes. The Functional Analysis of each network identified
the biological functions and/or diseases that were most significant to the genes in the network.
(Fischer’s exact test). A list of 596 human proto-oncogenes was compiled from the UNSW
Embryology DNA-Tumor Suppressor and Oncogene Database
(http://embryology.med.unsw.edu.au) and the Tumor Gene Database (http://www.tumor-
gene.org).
Results
Retroviral integration preferences in human CD34+ HSCs
Human CD34+ HSCs were purified from umbilical cord blood (CB) pools, bone marrow
(BM) from ADA-SCID and X-SCID patients, or peripheral blood (PB) from a normal donor.
CB CD34+ cells were transduced with MLV-derived gamma-retroviral (RV) or HIV-derived
lentiviral (LV) vectors carrying a GFP reporter gene and either a wild-type or a U3-deleted
(SIN) LTR. BM CD34+ cells were transduced with MLV-derived retroviral vectors
expressing either ADA2 or γc receptor3 from a wild-type LTR. PB CD34+ cells were
transduced with the vector expressing γc receptor3. Transduction efficiency ranged from 15%
(SIN-RV) to >90% (SIN-LV) depending on the vector and target cell type, and remained
stable throughout the culture period. DNA was obtained 1 to 12 days after infection, from
For personal use only. by guest on May 30, 2013. bloodjournal.hematologylibrary.orgFrom

cells that underwent 1 (all BM and PB samples) to 5-6 (all CB samples) cell doublings in
culture. Vector-genome junctions were cloned and sequenced by a linker-mediated (LM) or
linear amplification-mediated (LAM) PCR approach adapted to the different vector types, and
mapped onto the human genome. Cumulatively, we mapped 1,030 RV and 849 LV
integrations in CB- or BM-derived CD34+ cells. 595 RV integrations were obtained from CB
cells transduced with wild-type (395) or SIN (200) LTR vectors expressing ∆LNGFR from an
internal promoter, and 435 from BM cells transduced with wild-type LTR vectors expressing
ADA (190) or γc receptor (245). All LV integrations were obtained from CB cells transduced
with wild-type (404) or SIN (445) LTR vectors expressing GFP or ∆LNGFR from an internal
promoter.
Among RV integrations, 172 (16.7%) were in an intergenic position, 566 (55.0%)
within the transcribed portion of at least one gene, and 292 (28.3%) at a distance of ≤30 kb
upstream or downstream of one or more genes (Table 1; the complete list of sequences is
available at GeneBank with the accession number XXXX). Among LV integrations, 148
(17.4%) were in intergenic, 609 (71.7%) in intragenic, and 92 (10.9%) in perigenic position.
Conversely, a collection of 798 control sequences randomly cloned by LM-PCR contained
369 (46.2%) intergenic, 308 (38.6%) intragenic and 121 (15.2%) perigenic sequences.
Compared to controls, RV vectors showed a preference for intragenic (two-sample test for
equality of proportions with continuity correction, p<10-11) and perigenic (p<10-10)
integration, while LV vectors showed a much higher preference for intragenic positions
(p<10-15).
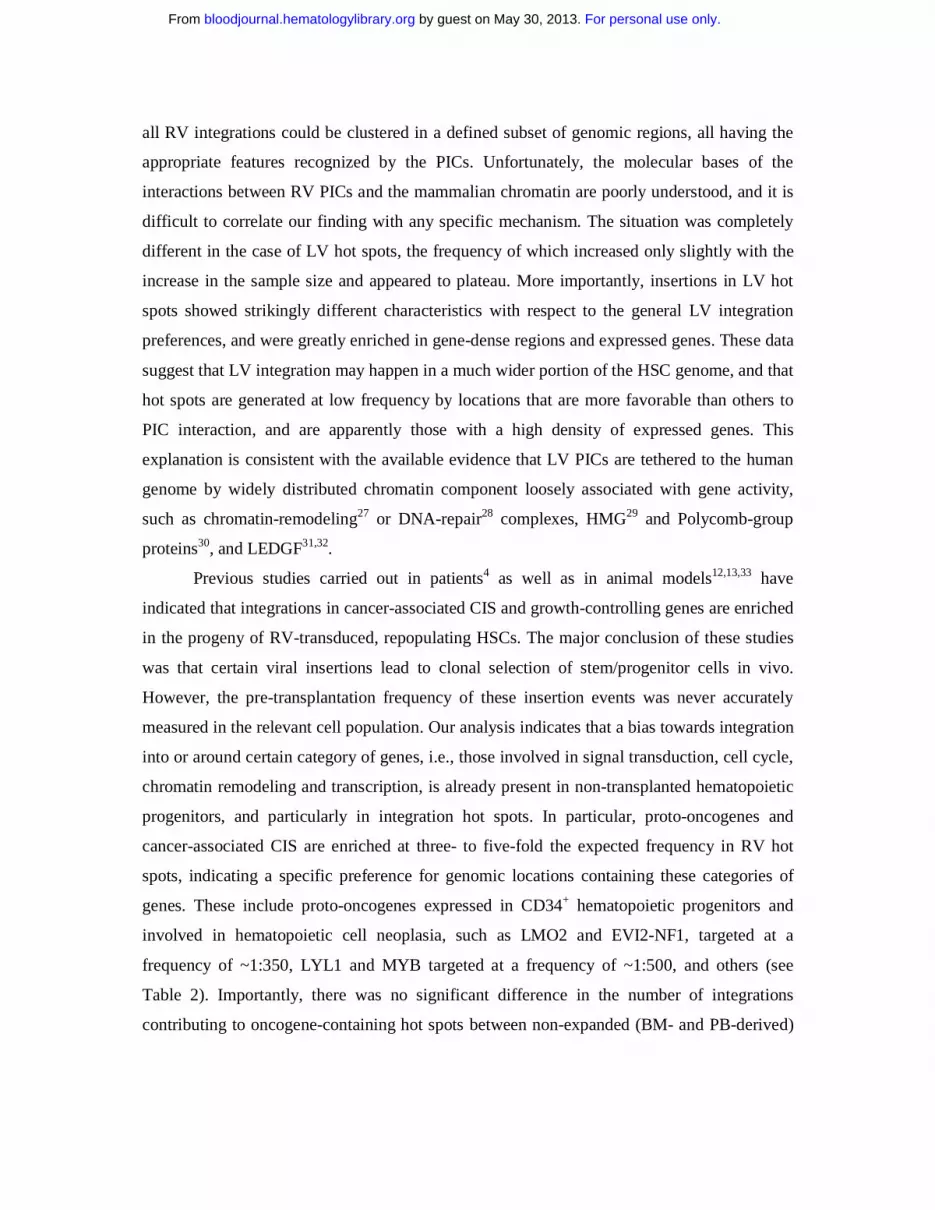
The position of the integrated proviruses with respect to Known Genes is shown in
Figure 1, which considers the total number of vector-gene interactions in an interval of 30 kb
around each insertion site (1,517 and 1241 for RV and LV vectors respectively). Compared to
randomly cloned or computer-generated23 control sequences, a significant clustering around
transcription start sites was observed for RV but not LV vectors. Overall, 29.3% of the total
RV vector-gene interactions were within ±10 kb from the +1 position of Known Genes,
compared to 16.1% for LV vectors (p<10-15) (Table 1, Figure 1). The RV general integration
preferences were similar in CD34+ and HeLa cells, as indicated by the analysis of 869
insertions from a previously published collection24 (Table 1).
In CD34+ cells, RV integrations showed a significant preference for gene-dense
regions: >60% of proviruses were found in genomic regions containing 6-20 genes per Mb,
For personal use only. by guest on May 30, 2013. bloodjournal.hematologylibrary.orgFrom

with a peak of 35% at a density of 6-10 genes/Mb, while >60% of control sequences mapped
to regions with a gene density of <5 genes/Mb (p<10-4) (Figure 2A). On the contrary, LV
integrations followed a distribution within regions of different gene density more similar to
that of the control sequences and of the human genome, and different from that of RV (p<10-
4) (Figure 2B).
To correlate vector integration with gene activity, we determined the expression
profile of >16,000 genes by microarray analysis in CB- and BM-derived CD34+ cells
activated in culture in the same conditions used for RV and LV transduction. As shown in
Figure 3, ~60% of 1,571 probesets representing 866 genes hit by a RV vector detected a
transcript in activated CD34+ cells, and among them 13% were classified as lowly abundant,
30% as intermediately abundant and 17% as highly abundant, compared to a 45-47%
“present” call on the whole microarrays (percentages were slightly different between CB- and
BM-derived cells) and a 11-12%, 23% and 11-12% breakdown in the three abundance
classes. With the exception of the lowest expression class, all differences were statistically
significant (10-15<p<10-7), indicating that RV vectors integrate preferentially into genes active
in CD34+ cells at the time of transduction, and particularly in the fraction of genes expressed
at higher level. A similar correlation with gene activity was observed, as already reported in T
cells25, for genes hit by LV vectors: ~56% of 1,346 probesets representing 757 hit genes
detected a transcript in activated CD34+ cells, with a 13%, 31% and 12% breakdown in the
three abundance classes. Compared to the whole microarray, the fraction of probesets with a
present call was significantly higher (56 vs. 46%, p<10-12), but the difference was accounted
for essentially by the intermediately abundant transcripts (31 vs. 23%, p<10-10) (Figure 3),
indicating that LV vectors tend to integrate into active genes in CD34+ cells but have no
specific preference for genes expressed at high levels when compared to RV vectors (p<10-4).
Genes regulating cell growth and proliferation are preferred targets of retroviral
integration
A functional classification by the Gene Ontology (GO) criteria26 of genes hit by RV and LV
vectors in CD34+ cells (Supplementary Tables 1 and 2) showed statistically significant biases
towards several gene categories (Figure 4A). In particular, genes involved in the
establishment and/or maintenance of chromatin architecture, signal transduction and cell cycle
were significantly more represented in the collection of genes hit by RV integrations
For personal use only. by guest on May 30, 2013. bloodjournal.hematologylibrary.orgFrom

compared to their expected frequency in the human genome (EASE score <0.005). Genes
involved in chromatin remodeling and phosphorylation were hit at a higher than expected
frequency also by LV vectors (EASE score <0.0005 and <0.005 respectively), particularly
those with serine/threonine kinase and GTPase activity (EASE score <0.0005). Two
additional categories, i.e., transcription and apoptosis, were over-represented in genes hit by
RV and/or LV vectors, although at less significant levels (EASE score <0.05). A different
analysis, carried out by the Ingenuity® network-based pathway analysis software, indicated
that genes involved in cell signaling, cell growth/proliferation, cell death, cancer and
hematopoietic system development were significantly over-represented in the collection of
RV and/or LV integrations with respect to genes annotated in the software Pathways
Knowledge Base (0.005<p<0.05). These categories were therefore chosen to carry out a direct
frequency comparison between RV and LV target genes and our control gene list
(Supplementary Tables 1-3). Genes involved in cell signaling, growth/proliferation and death
were over-represented in both RV and LV integrations with respect to control sequences (10-
9<p<10-2, Figure 4B), while genes involved in hematopoietic and immune system
development, immune response and cancer were significantly over-represented only in RV
integrations (10-8<p<10-4, Figure 4B). The comparison was then extended to genes
specifically annotated in cancer-related databases (see methods for definitions and data
source). RV integrations hit 77 proto-oncogenes and 64 cancer-associated CIS, corresponding
to 7.5% and 6.2% respectively of the 1,030 integrations (Figure 5). Both categories were
significantly over-represented (p<10-3 and 10-4 respectively) compared to control sequences
(27 proto-oncogenes and 17 CIS out of 798 sequences). On the contrary, LV integrations hit
49 proto-oncogenes and 32 CIS out of 849 integrations (Figure 5), a borderline significant
difference compared to controls (p=0.03 and 0.07 respectively). Interestingly, HeLa cell
integrations show over-representation of proto-oncogenes but not CIS (not shown). This
finding is not surprising considering that CIS have been mostly defined in hematopoietic
malignancies.
Overall, these analyses show that both RV and LV vectors have a general tendency to
integrate into genes involved in the regulation of cell growth and proliferation, and that RV
integrations have a specific bias for genes associated with oncogenic transformation. An
Ingenuity network analysis confirmed these biases and showed, in addition, that a significant
number of genes hit by RV integrations are functionally linked in gene networks involved in
For personal use only. by guest on May 30, 2013. bloodjournal.hematologylibrary.orgFrom

apoptosis (Supplementary Table 4; Figure 6A), signal transduction, transcriptional regulation
and cancer (Supplementary Table 4; Figure 6B).
RV but not LV vectors show a high frequency of integration hot spots
The RV and LV insertion site collections were analyzed for the presence of integrations at
recurrent sites (hot spots), using essentially the same criteria previously applied to the
definition of cancer-associated CIS (at least two independent insertions in <30 kb, three in
<50 kb and four in <100 kb11,20). Overall, 219 out of 1,030 (21.3%) RV insertion sites met
these criteria, identifying 97 hot spots in the genome of CD34+ cells (Supplementary Table 5).
109 out of 869 integrations (12.5%) met the same criteria in HeLa cells, defining 52 hot spots
(not shown). LV vectors showed a significantly lower propensity to integrate at recurrent
sites, with only 70 out of 849 (8.2%) integrations meeting the definition criteria, and
identifying 33 hot spots (Supplementary Table 5). Comparing the three collections, 1 hot spot
appeared to be a recurrent site for both RV (4 hits) and LV (3 hits) integration (Chr. 17q23.2:
55188652-55285672), while 3 hot spots were found in common between CD34+ and HeLa
cells (not shown). It is worth noting that 22 out of 798 (2.8%) control sequences also met the
hot spot definition criteria (Supplementary Table 5), defining a background level of false
positivity in the LM-PCR analysis. The different sub-groups of RV integrations contributed to
the hot spot list proportionally to their size, with no apparent bias related to the type of
transduced cell (CB, BM or PB), the vector used for transduction (wt-LTR or SIN-LTR), or
the number of cell doublings undergone in culture before harvesting (Supplementary Table 6).
In particular, non-expanded cell populations (BM- and PB-derived), which collectively
contributed less than half of the 1,030 total RV integrations, contributed with at least one
integration to 56 of the 97 (58%) RV hot spots (Supplementary Table 5).
The position of RV hot spot integrations with respects to Known Genes reflected the
RV general integration preferences, with intergenic, perigenic, and gene-dense regions over-
represented to the same extent observed in the entire collection of RV integrations, and
clustering around TSS only slightly decreased (p=0.015) (Table 1, Figures 1A and 2A). On
the contrary, LV hot spots showed a higher frequency of integration in intragenic (81.4 vs.
71.7%) and gene-dense (65.7 vs. 35.6% in the >11 genes/Mb range) regions (Table 1 and
Figure 2B). Similarly, RV hot spots occurred in the same proportion of expressed genes
For personal use only. by guest on May 30, 2013. bloodjournal.hematologylibrary.orgFrom

observed for all RV integrations (Figure 3A), while LV hot spots contained a significantly
higher proportion of expressed genes (73.2 vs. 55.9% p=0.003) (Figure 3B).
Interestingly, the maximum distance between independent integrations defining a hot
spot was significantly lower for RV vectors compared to LV vectors and control sequences
with hot spot characteristics. Overall, 52% and 67% of the RV hot spots in CD34+ and HeLa
cells span less than 10 kb, including those containing three or four independent integrations,
compared to 36% and 27% for LV and control sequences respectively (Figure 7). One fourth
(26.0%) of the RV hot spots in CD34+ cells and almost one half (40.4%) of those in HeLa
cells contained two independent integrations in less than 2 kb, compared to only 3% of the
LV hot spots.
Proto-oncogenes and cancer-associated CIS are hot spots of RV but not LV integration
The list of RV integration hot spots in CD34+ cells includes proto-oncogenes (e.g., LYL1,
MYB), cancer-associated CIS (e.g., FLI1, EVI2A, EVI2B, NF1), and genes involved in
chromosomal translocations in hematopoietic malignancies (e.g., LMO2, MKL1, ETV6)
(Table 2), all of them occurring at frequencies significantly higher than expected (10-8<p<10-
4) and higher than in the overall list of RV integrations (Figure 5). Interestingly, non-
expanded cell populations contributed with at least one integration to 9 of the 17 (53%) hot
spots containing a proto-oncogene or a cancer-associated CIS (Table 2), again indicating the
absence of biases related to the number of cell doublings in culture. On the contrary, LV hot
spots showed little enrichment for proto-oncogenes or CIS, although in this case low numbers
make comparisons poorly significant (Figure 5). Furthermore, RV but not LV hot spots
included a very high proportion of genes belonging to the intracellular signaling cascade
category (25.3%), which were significantly over-represented using either the human genome
or the total RV integrations as a background population in a GO analysis (EASE score:
1.2x10⁻⁶ and 2.2x10⁻⁴, respectively), despite their relatively small number (i.e., 22).
Interestingly, genes involved in hematopoietic and immune system development and in
immune response by Ingenuity® pathway analysis were further and significantly enriched in
RV hot spots with respect to the entire list of RV integrations (p<10-2, Figure 4B).
For personal use only. by guest on May 30, 2013. bloodjournal.hematologylibrary.orgFrom

Discussion
Retroviral integration preferences have significant consequences on the potential genotoxicity
of different families of vectors used to transfer genes into HSCs. The probability of dominant
activation of potentially cancer-causing genes, e.g., those involved in the control of stem cell
self-renewal, growth and differentiation, may in fact differ significantly between RV and LV
vectors simply based on the different frequency by which they may target those genes. Here
we report a detailed analysis of the RV and LV integration preferences in human CB-, PB-
and BM-derived CD34+ HSCs transduced in the same conditions used in clinical applications
and analyzed without selection. The general integration preferences of the two vector families
were similar to those previously described for other mammalian hematopoietic or non-
hematopoietic cells (reviewed in Bushman, 20058), and showed on average a two-fold higher
probability for RV vectors to target gene-dense regions, highly active genes and promoter-
proximal regions. However, RV but not LV integration occurs at high frequency (>20%) at
genomic locations (hot spots) that are significantly enriched in proto-oncogenes and genes
involved in the control of cell proliferation.
A high frequency of hot spots, defined by a statistical criterion previously applied to
define cancer-associated CIS11,20, appears to be a hallmark of RV integration in human CD34+
HSCs. We found that more than one fifth of the RV integrations meet the definition criteria, a
frequency more than 7-fold higher than expected from the analysis of a randomly cloned
collection of human DNA sequences, and almost 3-fold higher than that found in a collection
of LV integrations of comparable size. The average extension of RV hot spots, i.e., the
maximum distance between all insertions within each spot, was well within the definition
criteria, and significantly smaller than that of LV hot spots, spanning less than 10 kb in half of
the cases and less than 2 kb in one fourth of the cases. RV integration appears therefore to
have high preference for restricted genomic locations, which may exhibit specific chromatin
conformations or features that favor tethering of the pre-integration complexes (PICs) with
higher probability. These features do not include gene density, proximity to promoters or gene
expression per se, since hot spots integrations show exactly the same preferences observed in
the entire collection of RV integrations. Interestingly, we observed that the frequency of hot
spots increased progressively during the study, following the increase of the sample size in an
almost linear fashion. This may suggest that by analyzing a much higher number of sequences
For personal use only. by guest on May 30, 2013. bloodjournal.hematologylibrary.orgFrom
all RV integrations could be clustered in a defined subset of genomic regions, all having the
appropriate features recognized by the PICs. Unfortunately, the molecular bases of the
interactions between RV PICs and the mammalian chromatin are poorly understood, and it is
difficult to correlate our finding with any specific mechanism. The situation was completely
different in the case of LV hot spots, the frequency of which increased only slightly with the
increase in the sample size and appeared to plateau. More importantly, insertions in LV hot
spots showed strikingly different characteristics with respect to the general LV integration
preferences, and were greatly enriched in gene-dense regions and expressed genes. These data
suggest that LV integration may happen in a much wider portion of the HSC genome, and that
hot spots are generated at low frequency by locations that are more favorable than others to
PIC interaction, and are apparently those with a high density of expressed genes. This
explanation is consistent with the available evidence that LV PICs are tethered to the human
genome by widely distributed chromatin component loosely associated with gene activity,
such as chromatin-remodeling27 or DNA-repair28 complexes, HMG29 and Polycomb-group
proteins30, and LEDGF31,32.
Previous studies carried out in patients4 as well as in animal models12,13,33 have
indicated that integrations in cancer-associated CIS and growth-controlling genes are enriched
in the progeny of RV-transduced, repopulating HSCs. The major conclusion of these studies
was that certain viral insertions lead to clonal selection of stem/progenitor cells in vivo.
However, the pre-transplantation frequency of these insertion events was never accurately
measured in the relevant cell population. Our analysis indicates that a bias towards integration
into or around certain category of genes, i.e., those involved in signal transduction, cell cycle,
chromatin remodeling and transcription, is already present in non-transplanted hematopoietic
progenitors, and particularly in integration hot spots. In particular, proto-oncogenes and
cancer-associated CIS are enriched at three- to five-fold the expected frequency in RV hot
spots, indicating a specific preference for genomic locations containing these categories of
genes. These include proto-oncogenes expressed in CD34+ hematopoietic progenitors and
involved in hematopoietic cell neoplasia, such as LMO2 and EVI2-NF1, targeted at a
frequency of ~1:350, LYL1 and MYB targeted at a frequency of ~1:500, and others (see
Table 2). Importantly, there was no significant difference in the number of integrations
contributing to oncogene-containing hot spots between non-expanded (BM- and PB-derived)
For personal use only. by guest on May 30, 2013. bloodjournal.hematologylibrary.orgFrom

or moderately-expanded (all CB-derived) cell populations, arguing against the likelyhood of
clonal outgrowth generated in culture by insertional activation of growth-promoting genes.
A network-based pathway analysis indicates that a significant number of genes
targeted by RV integration are functionally linked in transcription-, signal transduction-
apoptosis- and tumorigenesis-related networks. Interestingly, genes involved in hematopoietic
and immune system development are targeted at uniquely high frequency by RV integrations,
and further enriched in RV hot spots, suggesting that the gene expression program of a
cycling hematopoietic cell is at least in part instrumental in directing RV PICs in certain
regions of the genome. Consistent with this hypothesis, almost none of the genes present in
CD34+ cells hot spots are found in hot spots from HeLa cell, which most likely operate
different regulatory networks. Kustikova et al.33 reached similar conclusions in compiling
their “insertional dominance database” from the progeny of serially transplanted HSCs in
mice, although they explain the observed over-representation of certain gene categories and
functional networks with in vivo selection rather than with intrinsic properties of the RV
integration machinery. Indeed, 18 to 34% of the genes present in the mouse database,
depending on the stringency of the comparison, are present also in our list, arguing against an
exclusive role for in vivo selection in determining most of the frequency biases. A notable
exception is the EVI1-MDS1 locus, which we found only once in non-transplanted cells while
it was found at exceedingly high frequencies in vivo in mice12,33, non-human primates13 and,
at least in one case, humans4. Insertional activation of the EVI1-MDS1 locus should therefore
be considered a factor favoring clonal amplification and/or selection in vivo independently
from the frequency by which it is targeted by RV integration before transplantation. It should
be noted, however, that our data come from a population of hematopoietic progenitors in
which the proportion of repopulating stem cells is admittedly low, leaving the possibility that
stem cell-specific hot spots went undetected. Unfortunately, an integration analysis in pre-
transplantation, long-term repopulating stem cells is currently impossible, and it is therefore
difficult to come to definitive conclusions as to what proportion of the biases detected in the
stem cell progeny in vivo is due to vector preferences and what proportion to in vivo
selection. We favor a predominant role of vector-specific factors, also based on our
experience with ADA-SCID patients in whom pre-transplantation and post-transplantation
integration preferences showed essentially overlapping patterns (A.A., B.C., A.R., F.M. et al.,
manuscript in preparation).
For personal use only. by guest on May 30, 2013. bloodjournal.hematologylibrary.orgFrom

In conclusion, this study shows previously unrecognized features of RV and LV
integration into human HSCs that may have an impact in assessing the prospective genotoxic
risk of using either vector system for human gene therapy applications. In particular, the
frequency and characteristics of integration hot spots may be substantial factors in
determining a differential safety profile for RV and LV vectors of comparable design and
content.
For personal use only. by guest on May 30, 2013. bloodjournal.hematologylibrary.orgFrom

References
1. Hacein-Bey-Abina S, Le Deist F, Carlier F, et al. Sustained correction of X-linked
severe combined immunodeficiency by ex vivo gene therapy. N Engl J Med. 2002;346:1185-
1193.
2. Aiuti A, Slavin S, Aker M, et al. Correction of ADA-SCID by stem cell gene therapy
combined with nonmyeloablative conditioning. Science. 2002;296:2410-2413.
3. Gaspar HB, Parsley KL, Howe S, et al. Gene therapy of X-linked severe combined
immunodeficiency by use of a pseudotyped gammaretroviral vector. Lancet. 2004;364:2181-
2187.
4. Ott MG, Schmidt M, Schwarzwaelder K, et al. Correction of X-linked chronic
granulomatous disease by gene therapy, augmented by insertional activation of MDS1-EVI1,
PRDM16 or SETBP1. Nat Med. 2006;12:401-409.
5. Baum C, Dullmann J, Li Z, et al. Side effects of retroviral gene transfer into
hematopoietic stem cells. Blood. 2003;101:2099-2114.
6. Baum C, Kustikova O, Modlich U, Li Z, Fehse B. Mutagenesis and oncogenesis by
chromosomal insertion of gene transfer vectors. Hum Gene Ther. 2006;17:253-263.
7. Nienhuis AW, Dunbar CE, Sorrentino BP. Genotoxicity of retroviral integration in
hematopoietic cells. Mol Ther. 2006;13:1031-1049.
8. Bushman F, Lewinski M, Ciuffi A, et al. Genome-wide analysis of retroviral DNA
integration. Nat Rev Microbiol. 2005;3:848-858.
9. Recchia A, Bonini C, Magnani Z, et al. Retroviral vector integration deregulates gene
expression but has no consequence on the biology and function of transplanted T cells. Proc
Natl Acad Sci U S A. 2006;103:1457-1462.
10. Fischer A, Cavazzana-Calvo M. Integration of Retroviruses: A Fine Balance between
Efficiency and Danger. PLoS Med. 2005;2:e10.
11. Wu X, Luke BT, Burgess SM. Redefining the common insertion site. Virology.
2006;344:292-295.
12. Kustikova O, Fehse B, Modlich U, et al. Clonal dominance of hematopoietic stem
cells triggered by retroviral gene marking. Science. 2005;308:1171-1174.
For personal use only. by guest on May 30, 2013. bloodjournal.hematologylibrary.orgFrom

13. Calmels B, Ferguson C, Laukkanen MO, et al. Recurrent retroviral vector integration
at the Mds1/Evi1 locus in nonhuman primate hematopoietic cells. Blood. 2005;106:2530-
2533.
14. Testa A, Lotti F, Cairns L, et al. Deletion of a negatively acting sequence in a chimeric
GATA-1 enhancer-long terminal repeat greatly increases retrovirally mediated erythroid
expression. J Biol Chem. 2004;279:10523-10531.
15. Follenzi A, Sabatino G, Lombardo A, Boccaccio C, Naldini L. Efficient gene delivery
and targeted expression to hepatocytes in vivo by improved lentiviral vectors. Hum Gene
Ther. 2002;13:243-260.
16. Zufferey R, Donello JE, Trono D, Hope TJ. Woodchuck hepatitis virus
posttranscriptional regulatory element enhances expression of transgenes delivered by
retroviral vectors. J Virol. 1999;73:2886-2892.
17. Dull T, Zufferey R, Kelly M, et al. A third-generation lentivirus vector with a
conditional packaging system. J Virol. 1998;72:8463-8471.
18. Schmidt M, Hoffmann G, Wissler M, et al. Detection and direct genomic sequencing
of multiple rare unknown flanking DNA in highly complex samples. Hum Gene Ther.
2001;12:743-749.
19. Schmidt M, Zickler P, Hoffmann G, et al. Polyclonal long-term repopulating stem cell
clones in a primate model. Blood. 2002;100:2737-2743.
20. Suzuki T, Shen H, Akagi K, et al. New genes involved in cancer identified by
retroviral tagging. Nat Genet. 2002;32:166-174.
21. Hosack DA, Dennis G, Jr., Sherman BT, Lane HC, Lempicki RA. Identifying
biological themes within lists of genes with EASE. Genome Biol. 2003;4:R70.
22. Dennis G, Jr., Sherman BT, Hosack DA, et al. DAVID: Database for Annotation,
Visualization, and Integrated Discovery. Genome Biol. 2003;4:P3.
23. Hematti P, Hong BK, Ferguson C, et al. Distinct genomic integration of MLV and SIV
vectors in primate hematopoietic stem and progenitor cells. PLoS Biol. 2004;2:e423.
24. Wu X, Li Y, Crise B, Burgess SM. Transcription start regions in the human genome
are favored targets for MLV integration. Science. 2003;300:1749-1751.
25. Schroder AR, Shinn P, Chen H, Berry C, Ecker JR, Bushman F. HIV-1 integration in
the human genome favors active genes and local hotspots. Cell. 2002;110:521-529.
For personal use only. by guest on May 30, 2013. bloodjournal.hematologylibrary.orgFrom

26. Ashburner M, Ball CA, Blake JA, et al. Gene ontology: tool for the unification of
biology. The Gene Ontology Consortium. Nat Genet. 2000;25:25-29.
27. Kalpana GV, Marmon S, Wang W, Crabtree GR, Goff SP. Binding and stimulation of
HIV-1 integrase by a human homolog of yeast transcription factor SNF5. Science.
1994;266:2002-2006.
28. Mulder LC, Chakrabarti LA, Muesing MA. Interaction of HIV-1 integrase with DNA
repair protein hRad18. J Biol Chem. 2002;277:27489-27493.
29. Farnet CM, Bushman FD. HIV-1 cDNA integration: requirement of HMG I(Y) protein
for function of preintegration complexes in vitro. Cell. 1997;88:483-492.
30. Violot S, Hong SS, Rakotobe D, et al. The human polycomb group EED protein
interacts with the integrase of human immunodeficiency virus type 1. J Virol. 2003;77:12507-
12522.
31. Llano M, Vanegas M, Fregoso O, et al. LEDGF/p75 determines cellular trafficking of
diverse lentiviral but not murine oncoretroviral integrase proteins and is a component of
functional lentiviral preintegration complexes. J Virol. 2004;78:9524-9537.
32. Ciuffi A, Llano M, Poeschla E, et al. A role for LEDGF/p75 in targeting HIV DNA
integration. Nat Med. 2005;11:1287-1289.
33. Kustikova OS, Geiger H, Li Z, et al. Retroviral vector insertion sites associated with
dominant hematopoietic clones mark "stemness" pathways. Blood. 2007;109:1897-1907.
For personal use only. by guest on May 30, 2013. bloodjournal.hematologylibrary.orgFrom

Table 1. Retroviral integration site distribution in human CD34+ HSCs
Intergenic (%)
Intragenic (%)
Perigenic (%)
Total hits
±10 kb from TSS
(%)
Total vector/gene
interactions*
CD34+ cells
RV vectors 16.7 55.0 28.3 1,030 29.3 1,517
LV vectors 17.4 71.7 10.9 849 16.1 1,241
Control sequences
46.2 38.6 15.2 798 9.1 902
RV hot spots 16.0 56.6 27.4 219 22.2 302
LV hot spots 8.6 81.4 10.0 70 13.2 114
Control hot spots 36.4 59.1 4.5 22 13.0 23
HeLa cells
RV vectors 18.8 48.1 25.5 869 26.1 1,219
RV hot spots 16.5 53.2 30.3 109 27.3 165
Distribution of RV and LV integration sites unambiguously mapped in unselected CB- and BM-derived CD34+ HSCs, and RV integrations in HeLa cells from a previously published collection24. Integrations (total hits) were distributed as inside (intragenic), outside (intergenic), or at a distance of <30 kb upstream or dowstream (perigenic) from, Known Genes (UCSC annotation). Insertions at a distance of ±10 kb from transcription start sites (TSS) are indicated as percentage of the total vector/gene interactions. Control sequences were obtained from a randomly cloned library of Pst1/MseI-restricted, LM-PCR-amplified human CD34+ cell DNA. *Total number of genes within 30 kb from individual hits + intergenic hits.
For personal use only. by guest on May 30, 2013. bloodjournal.hematologylibrary.orgFrom

Table 2. RV and LV hot spots containing at least one proto-oncogene and/or cancer-associated CIS.
Chromosome Range (bp) N° hits Gene symbol Origin* RV hot spots 14q24.3 13882 4 C14orf43, PNMA1 CB-RV (2)
CB-SIN-RV (2) 11p13 48661 3 AF116668, LMO2 BM-ADA (1)
CB-RV (1) CB-SIN-RV (1)
17q11.2 7827 3 EVI2A, EVI2B, NF1, OMG
BM-X-SCID(1) CB-RV (2)
10q25.2 1920 2 ADD3 BM-ADA (1) CB-SIN-RV (1)
11q23.2 22851 2 ZBTB16 BM-ADA (1) CB-RV (1)
11q24.3 14147 2 FLI1 BM-ADA (1) CB-RV (1)
12p13.2 7360 2 ETV6 CB-RV (2) 16p13.11 18559 2 ABCC1 BM-ADA (1) 19p13.13 137 2 BTBD14B, LYL1,
NFIX, TRMT1 BM-X-SCID(1) CB-RV (1)
20p12.3 136 2 PLCB1 CB-SIN-RV (2) 20q13.12 19100 2 C20orf121, PKIG,
SERINC3 CB-RV (2)
22q13.1 29588 2 AB051446, MKL1, RUTBC3
BM-X-SCID (1) CB-SIN-RV (1)
2p11.2 779 2 CAPG, LOC284948, RBED1
PB-ND (2)
2p21 975 2 AK025445, MGC40574, THADA, ZFP36L2
CB-RV (2)
4p14 11999 2 N4BP2, RHOH CB-RV (2) 6q23.3 9422 2 MYB CB-RV (2) 6p24.3 1991 2 RREB1 CB-RV (1)
CB-SIN-RV (1) LV hot spots 9q34.3 31043 3 AK130247, C9orf163,
INPP5E, NOTCH1, PMPCA, DCCAG3
CB-SIN-LV (2) CB-LV (1)
2p21 22106 2 THADA CB-SIN-LV (1) CB-LV (1)
20p12.3 24132 2 PLCB1 CB-LV (2) 17p13.3 25818 2 RUTBC1, SMG6, SRR,
TSR1 CB-LV (2)
Controls 6q25.1 4561 2 ESR1
For personal use only. by guest on May 30, 2013. bloodjournal.hematologylibrary.orgFrom

Range indicates the maximun distance between hits contained in each hot spot. Proto-oncogenes or CIS are shown in bold. For the complete list of hot spots see Supplementary Table 5 * CB-RV, CB-derived CD34+ cells transduced with wt-LTR RV; CB-SIN-RV, CB-derived CD34+ cells transduced with SIN-LTR RV; BM-ADA, BM-derived CD34+ cells from ADA-SCID patients transduced with wt-LTR RV; BM-X-SCID: BM-derived CD34+ cells from X-SCID patients transduced with wt-LTR RV; PB-ND: PB-derived CD34+ cells from normal donor transduced with wt-LTR RV; CB-LV: CB-derived CD34+ cells transduced with wt-LTR LV; CB-SIN-LV, CB-derived CD34+ cells transduced with SIN-LTR LV (the number in parentheses indicates the number of hits for each category)
For personal use only. by guest on May 30, 2013. bloodjournal.hematologylibrary.orgFrom
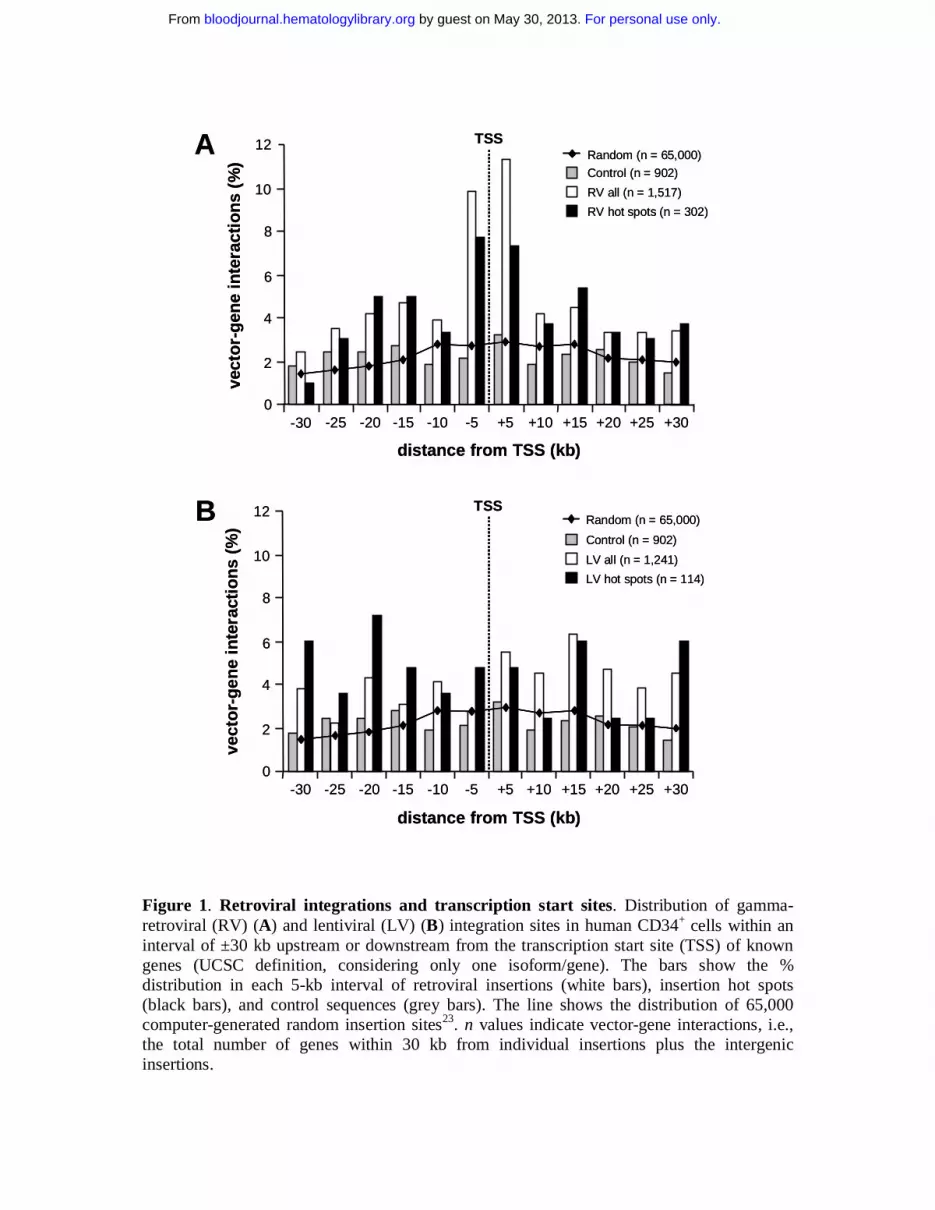
Figure 1. Retroviral integrations and transcription start sites. Distribution of gamma-retroviral (RV) (A) and lentiviral (LV) (B) integration sites in human CD34+ cells within an interval of ±30 kb upstream or downstream from the transcription start site (TSS) of known genes (UCSC definition, considering only one isoform/gene). The bars show the % distribution in each 5-kb interval of retroviral insertions (white bars), insertion hot spots (black bars), and control sequences (grey bars). The line shows the distribution of 65,000 computer-generated random insertion sites23. n values indicate vector-gene interactions, i.e., the total number of genes within 30 kb from individual insertions plus the intergenic insertions.
12
10
8
6
4
2
0-30 -25 -20 -15 -10 -5 +5 +10 +15 +20 +25 +30
TSS
Control (n = 902)
RV all (n = 1,517)
RV hot spots (n = 302)
12
10
8
6
4
2
0
TSS
Control (n = 902)
LV all (n = 1,241)
LV hot spots (n = 114)
-30 -25 -20 -15 -10 -5 +5 +10 +15 +20 +25 +30
vect
or-
gen
ein
tera
ctio
ns
(%)
vect
or-
gen
ein
tera
ctio
ns
(%)
distance from TSS (kb)
A
B
distance from TSS (kb)
Random (n = 65,000)
Random (n = 65,000)
12
10
8
6
4
2
0-30 -25 -20 -15 -10 -5 +5 +10 +15 +20 +25 +30
TSS
Control (n = 902)
RV all (n = 1,517)
RV hot spots (n = 302)
12
10
8
6
4
2
0
TSS
Control (n = 902)
LV all (n = 1,241)
LV hot spots (n = 114)
-30 -25 -20 -15 -10 -5 +5 +10 +15 +20 +25 +30
vect
or-
gen
ein
tera
ctio
ns
(%)
vect
or-
gen
ein
tera
ctio
ns
(%)
distance from TSS (kb)
A
B
distance from TSS (kb)
Random (n = 65,000)
Random (n = 65,000)
For personal use only. by guest on May 30, 2013. bloodjournal.hematologylibrary.orgFrom

Figure 2. Retroviral integration and gene density. Integration sites (white bars) and integration hot spots (black bars) of RV (A) and LV (B) vectors in CD34+ cells are plotted according to the number of Known Genes (UCSC definition, considering only one isoform/gene) contained in a range of 1 Mb around each insertion site, in intervals of 5 genes/Mb. The distribution of control sequences is indicated by light gray bars. The dark gray bars represent the frequency of 1-Mb segments in the human genome for each gene density interval. n values indicate the number of independent hits in each group.
inte
grat
ion
site
s(%
)
A
0
10
20
30
40
50
60
70
0-5 6-10 11-15 16-20 21-25 26-30 >30
Control (n = 798)
RV all (n = 1,030)
RV hot spots (n = 219)
Genome
Known Genes / Mb
Control (n = 798)
LV all (n = 849)
LV hot spots (n = 70)
Genome
0-5 6-10 11-15 16-20 21-25 26-30 >30
Known Genes / Mb
inte
grat
ion
site
s(%
)
B
0
10
20
30
40
50
60
70
inte
grat
ion
site
s(%
)
A
0
10
20
30
40
50
60
70
0-5 6-10 11-15 16-20 21-25 26-30 >30
Control (n = 798)
RV all (n = 1,030)
RV hot spots (n = 219)
Genome
Known Genes / Mb
Control (n = 798)
LV all (n = 849)
LV hot spots (n = 70)
Genome
0-5 6-10 11-15 16-20 21-25 26-30 >30
Known Genes / Mb
inte
grat
ion
site
s(%
)
B
0
10
20
30
40
50
60
70
For personal use only. by guest on May 30, 2013. bloodjournal.hematologylibrary.orgFrom

Figure 3. Correlation between retroviral integration and gene activity in CD34+ cells. The bars show the % distribution of expression values from Affymetrix HG-U133A microarrays of cytokine-stimulated CD34+ cells. To correlate retroviral integration and gene activity, expression values from the CD34+ cell microarrays were divided into four classes, i.e. absent (black), low (i.e., below the 25th percentile in a normalized distribution, blue), intermediate (i.e., between the 25th and the 75th percentile, yellow) and high (i.e., above the 75th percentile, red). (A) The first two bars (all genes) show the distribution of the >16,000 genes on the microarray of cord blood (CB)- or bone marrow (BM)-derived CD34+ cells activated in the same conditions used for transduction with RV vectors, the other two bars represent the expression values of genes targeted by all RV integrations (RV all) or by integration hot spots (RV hot spots), derived from a weighted mean of the CB and BM microarray values. (B) The first bar (all genes) show the distribution of the >16,000 genes on the microarray of CB-derived CD34+ cells activated in the same conditions used for transduction with LV vectors, the other two bars represent the expression values of genes targeted by all LV integrations (LV all) or by integration hot spots (LV hot spots). The n values indicate the number of probesets analyzed for each group of genes.
n=22,283 n=1,571 n=195 n=959 n=65n=22,283
53
12
23
12
55
11
23
11
40
13
30
17
43
13
27
17
54
11
23
11
44
13
31
12
27
10
46
17
0
20
40
60
80
100
CB RV all RVhot spots
CBall genes
LV all LVhot spots
pro
bes
ets
(%)
High Intermediate Low Absent
BM0
20
40
60
80
100
A B
all genes
n=22,283 n=1,571 n=195 n=959 n=65n=22,283
53
12
23
12
53
12
23
12
55
11
23
11
55
11
23
11
40
13
30
17
40
13
30
17
43
13
27
17
43
13
27
17
54
11
23
11
54
11
23
11
44
13
31
12
44
13
31
12
27
10
46
17
27
10
46
17
0
20
40
60
80
100
CB RV all RVhot spots
CBall genes
LV all LVhot spots
pro
bes
ets
(%)
High Intermediate Low Absent
BM0
20
40
60
80
100
A B
all genes
For personal use only. by guest on May 30, 2013. bloodjournal.hematologylibrary.orgFrom

35 ***
26 ***
*41
24
133
*128
795
Cell cycle
Apoptosis
Signal transduction
Transcription
Phosphorylation
Chromatinarchitecture
Genome (n = 14,959)
RV all (n = 762)
LV all (n = 633)
A
*****
**
*
**
*
**
5 10 15 20 25 300
2826245
5146
1492452
1973249
42565
55723
0 3 6 9 12 15
Protein ser/thrkinase activity
GTPase regulator
eligible genes (%)
26295
31458
*
GO Molecular Function
GO Biological Process
Genome (n = 17,847)
RV all (n = 866)
LV all (n = 712)
B
Cancer
Hematopoieticsystem
Immune response
Immune/lymphaticsystem
RV hot spots (n = 76)
Control (n = 268)
RV all (n= 637)
LV all (n = 514)
LV hot spots (n = 31)
***
0 5 10 15 20 25 30 35
4715112705
39417
101
10622374
129020283
12
*
******
***
******
Diseases and Physiological System Development
0 5 10 15 20 25 30
21163
132
399
36
1679
77
Cell growth andproliferation
Cell signaling
Cell death
Cellular and Molecular Function
eligible genes (%)
11
12
4
4
23
******
***
***
***
**
***
*
***
RV hot spots (n = 76)
Control (n = 268)
RV all (n= 637)
LV all (n = 514)
LV hot spots (n = 31)
For personal use only. by guest on May 30, 2013. bloodjournal.hematologylibrary.orgFrom

Figure 4. Genes regulating cell growth and proliferation are preferential targets of retroviral integration. (A) Gene Ontology (GO) analysis of integration target genes in CD34+ cells. Genes identified as targets for RV (black bars) and LV (white bars) integration were analyzed for significant functional clusters with the DAVID 2.1 software. Functional categories are derived from the GO-Biological Process (establishment and/or maintenance of chromatin architecture, phosphorylation, transcription, signal transduction, apoptosis, cell cycle) and the GO-Molecular Function (GTPase regulator activity, protein serine/threonine kinase activity) classifications. Bars indicate the number of integration target genes annotated within the given category out of n genes eligible for each analysis. Asterisks denote the significance level of over-representation of any given category with respect to the human genome (grey bars), used as background population (***, EASE score <0.0005, **, EASE score <0.005, *, EASE score <0.05). The number of gene identifiers annotated within each functional category is indicated in the bars. (B) Functional clustering analysis comparing integration target and control gene lists. Function/disease categories were those significantly over-represented in at least one integration target gene list (0.005<p<0.05) using the Ingenuity Pathways Knowledge Base as background population and the Ingenuity analysis software. Bars represent the percentage of integration target genes belonging to each category among n genes eligible for the analysis. Asterisks denote the probability that differences observed between integration data sets (RV, LV, RV hot spots and LV hot spots) and the control data set are due to chance alone (two-sample test for equality of proportions with continuity correction; ***, p<0.0005, **, p<0.005, *, p<0.05). The number of genes annotated within each category is indicated in the bars.
For personal use only. by guest on May 30, 2013. bloodjournal.hematologylibrary.orgFrom

Figure 5. CIS and proto-oncogenes are over-represented in RV integrations and integration hot spots. Comparative analysis of the frequency of genes annotated in the CIS and proto-oncogene databases (see methods for definitions and data source) between integration target and control gene lists. Bars represent the % of RV and LV integrations, RV and LV integration hot spots, and control sequences targeting at least one proto-oncogene or CIS. The n values indicate the number of independent hits in each group. Asterisks denote the level of enrichment with respect to control data set (two-sample test for equality of proportions with continuity correction; ***, p<0.0005, *, p<0.05).
0 2 4 6 8 10 12
Proto-oncogenes
CIS
Control (798)
RV all (1,030)
LV all (849)
RV hot spots (219)
LV hot spots (70)
176419325
277724494
integration sites (%)
******
*
*
******
0 2 4 6 8 10 12
Proto-oncogenes
CIS
Control (798)
RV all (1,030)
LV all (849)
RV hot spots (219)
LV hot spots (70)
176419325
277724494
integration sites (%)
******
*
*
******
For personal use only. by guest on May 30, 2013. bloodjournal.hematologylibrary.orgFrom

Figure 6. Genes hit by retroviral integration are functionally linked in gene networks. Representative networks originated by Ingenuity analysis of RV target genes (see Supplementary Table 4 for a complete list). Both networks are made of 35 target genes, with an Ingenuity score ≥42. The color code indicates the most significant biological functions associated to each network (p<0.0005). (A) RV network 1; (B) RV network 4 (networks are identified in Supplemetary Table 4).
Apoptosis (21 genes, p =1.8x10⁻⁸)
A
PMAIP1
TPT1
PARP1
CHGB
BCL2L1
MADD
CFLAR
RASGRP3
ITPR1*
TUBB
CRADD*
RTN4IP1
SLC1A6
ATXN1
AHCYL1
CASP10
TUBA8PRKCQ
DYNLL1
RTN4
TUBB1
TNFRSF7FAS
NOSIP
ALOX5AP
SNW1
ALK
MKL1*MAD1L1
DDB2
BRE*
CASP8
BCL2*
MYB*
MLX*
Transcription (25 genes, p =2.0x10⁻¹⁴)Cell proliferation (17 genes, p =1.5x10⁻⁵)Tumorigenesis (12 genes, p =1.3x10⁻⁴)
B
CXXC5
KLF13
MAP3K14
RFX2
ATP2B4ENG
KLF6
TNIP1
SND1
CDC27*
RUNX1
TCF7L2
JUND
EVI1RPL30RXRB
SPP1
FOXP1*
SMAD3
TOB1
PCAF
TGFBR1
SURB7
PPP3CA
FRAT1
TADA2L
RREB1*
HHEX
CTBP1
RFX1
E2F5
FOLR2
CCL18
RARG
NR1H3
Apoptosis (21 genes, p =1.8x10⁻⁸)
A
PMAIP1
TPT1
PARP1
CHGB
BCL2L1
MADD
CFLAR
RASGRP3
ITPR1*
TUBB
CRADD*
RTN4IP1
SLC1A6
ATXN1
AHCYL1
CASP10
TUBA8PRKCQ
DYNLL1
RTN4
TUBB1
TNFRSF7FAS
NOSIP
ALOX5AP
SNW1
ALK
MKL1*MAD1L1
DDB2
BRE*
CASP8
BCL2*
MYB*
MLX*
PMAIP1
TPT1
PARP1
CHGB
BCL2L1
MADD
CFLAR
RASGRP3
ITPR1*
TUBB
CRADD*
RTN4IP1
SLC1A6
ATXN1
AHCYL1
CASP10
TUBA8PRKCQ
DYNLL1
RTN4
TUBB1
TNFRSF7FAS
NOSIP
ALOX5AP
SNW1
ALK
MKL1*MAD1L1
DDB2
BRE*
CASP8
BCL2*
MYB*
MLX*
Transcription (25 genes, p =2.0x10⁻¹⁴)Cell proliferation (17 genes, p =1.5x10⁻⁵)Tumorigenesis (12 genes, p =1.3x10⁻⁴)
B
CXXC5
KLF13
MAP3K14
RFX2
ATP2B4ENG
KLF6
TNIP1
SND1
CDC27*
RUNX1
TCF7L2
JUND
EVI1RPL30RXRB
SPP1
FOXP1*
SMAD3
TOB1
PCAF
TGFBR1
SURB7
PPP3CA
FRAT1
TADA2L
RREB1*
HHEX
CTBP1
RFX1
E2F5
FOLR2
CCL18
RARG
NR1H3
CXXC5
KLF13
MAP3K14
RFX2
ATP2B4ENG
KLF6
TNIP1
SND1
CDC27*
RUNX1
TCF7L2
JUND
EVI1RPL30RXRB
SPP1
FOXP1*
SMAD3
TOB1
PCAF
TGFBR1
SURB7
PPP3CA
FRAT1
TADA2L
RREB1*
HHEX
CTBP1
RFX1
E2F5
FOLR2
CCL18
RARG
NR1H3
For personal use only. by guest on May 30, 2013. bloodjournal.hematologylibrary.orgFrom

Figure 7. Schematic representation of the maximum distance between individual hits within RV and LV hot spots. Symbols represent single hot spots originated from 2 (black), 3 (grey) or 4 (white) hits in the genome of CD34+ HSCs (1,030 RV and 849 LV integrations) and HeLa cells (869 RV integrations), plotted according to the maximum distance between individual integrations (in base pairs, log scale). Also shown are “false positive” hot spots generated by applying the definition criteria to a library of LM-PCR-amplified random sequences of human CD34+ DNA (798 sequences). 26.0% of the 97 RV hot spots in CD34+ cells and almost one half (40.4%) of the 52 RV hot spots in HeLa cells contained two independent integrations in less than 2 kb, compared to only one of the 33 LV hot spots.
100 1.000 10.000 100.000
HeLa RV
CD34 RV
CD34 LV
Controls
2 hits 3 hits 4 hits2 kb
40%
26%
3%
9%
bp100 1.000 10.000 100.000
HeLa RV
CD34 RV
CD34 LV
Controls
2 hits 3 hits 4 hits2 kb
40%
26%
3%
9%
bp
For personal use only. by guest on May 30, 2013. bloodjournal.hematologylibrary.orgFrom