Detection of malaria parasites in dried human blood spots ...
13
Mwanga et al. Malar J (2019) 18:341 https://doi.org/10.1186/s12936-019-2982-9 RESEARCH Detection of malaria parasites in dried human blood spots using mid-infrared spectroscopy and logistic regression analysis Emmanuel P. Mwanga 1*† , Elihaika G. Minja 1† , Emmanuel Mrimi 1† , Mario González Jiménez 2† , Johnson K. Swai 1† , Said Abbasi 1 , Halfan S. Ngowo 1,3 , Doreen J. Siria 1 , Salum Mapua 1,4 , Caleb Stica 1 , Marta F. Maia 5,6 , Ally Olotu 5,7 , Maggy T. Sikulu‑Lord 8,9 , Francesco Baldini 3 , Heather M. Ferguson 3 , Klaas Wynne 2 , Prashanth Selvaraj 10 , Simon A. Babayan 3 and Fredros O. Okumu 1,3,11* Abstract Background: Epidemiological surveys of malaria currently rely on microscopy, polymerase chain reaction assays (PCR) or rapid diagnostic test kits for Plasmodium infections (RDTs). This study investigated whether mid‑infrared (MIR) spectroscopy coupled with supervised machine learning could constitute an alternative method for rapid malaria screening, directly from dried human blood spots. Methods: Filter papers containing dried blood spots (DBS) were obtained from a cross‑sectional malaria survey in 12 wards in southeastern Tanzania in 2018/19. The DBS were scanned using attenuated total reflection‑Fourier Transform Infrared (ATR‑FTIR) spectrometer to obtain high‑resolution MIR spectra in the range 4000 cm −1 to 500 cm −1 . The spec‑ tra were cleaned to compensate for atmospheric water vapour and CO 2 interference bands and used to train differ‑ ent classification algorithms to distinguish between malaria‑positive and malaria‑negative DBS papers based on PCR test results as reference. The analysis considered 296 individuals, including 123 PCR‑confirmed malaria positives and 173 negatives. Model training was done using 80% of the dataset, after which the best‑fitting model was optimized by bootstrapping of 80/20 train/test‑stratified splits. The trained models were evaluated by predicting Plasmodium falciparum positivity in the 20% validation set of DBS. Results: Logistic regression was the best‑performing model. Considering PCR as reference, the models attained overall accuracies of 92% for predicting P. falciparum infections (specificity = 91.7%; sensitivity = 92.8%) and 85% for predicting mixed infections of P. falciparum and Plasmodium ovale (specificity = 85%, sensitivity = 85%) in the field‑ collected specimen. Conclusion: These results demonstrate that mid‑infrared spectroscopy coupled with supervised machine learning (MIR‑ML) could be used to screen for malaria parasites in human DBS. The approach could have potential for rapid and high‑throughput screening of Plasmodium in both non‑clinical settings (e.g., field surveys) and clinical settings (diagnosis to aid case management). However, before the approach can be used, we need additional field validation in other study sites with different parasite populations, and in‑depth evaluation of the biological basis of the MIR sig‑ nals. Improving the classification algorithms, and model training on larger datasets could also improve specificity and sensitivity. The MIR‑ML spectroscopy system is physically robust, low‑cost, and requires minimum maintenance. © The Author(s) 2019. This article is distributed under the terms of the Creative Commons Attribution 4.0 International License (http://creativecommons.org/licenses/by/4.0/), which permits unrestricted use, distribution, and reproduction in any medium, provided you give appropriate credit to the original author(s) and the source, provide a link to the Creative Commons license, and indicate if changes were made. The Creative Commons Public Domain Dedication waiver (http://creativecommons.org/ publicdomain/zero/1.0/) applies to the data made available in this article, unless otherwise stated. Open Access Malaria Journal *Correspondence: [email protected]; [email protected] † Emmanuel P. Mwanga, Elihaika G. Minja, Emmanuel Mrimi, Mario González Jiménez and Johnson K. Swai contribution equally to this work 1 Environmental Health and Ecological Sciences Department, Ifakara Health Institute, Morogoro, Tanzania Full list of author information is available at the end of the article
-
Upload
khangminh22 -
Category
Documents
-
view
3 -
download
0
Transcript of Detection of malaria parasites in dried human blood spots ...

Mwanga et al. Malar J (2019) 18:341 https://doi.org/10.1186/s12936-019-2982-9
RESEARCH
Detection of malaria parasites in dried human blood spots using mid-infrared spectroscopy and logistic regression analysisEmmanuel P. Mwanga1*†, Elihaika G. Minja1†, Emmanuel Mrimi1†, Mario González Jiménez2†, Johnson K. Swai1†, Said Abbasi1, Halfan S. Ngowo1,3, Doreen J. Siria1, Salum Mapua1,4, Caleb Stica1, Marta F. Maia5,6, Ally Olotu5,7, Maggy T. Sikulu‑Lord8,9, Francesco Baldini3, Heather M. Ferguson3, Klaas Wynne2, Prashanth Selvaraj10, Simon A. Babayan3 and Fredros O. Okumu1,3,11*
Abstract
Background: Epidemiological surveys of malaria currently rely on microscopy, polymerase chain reaction assays (PCR) or rapid diagnostic test kits for Plasmodium infections (RDTs). This study investigated whether mid‑infrared (MIR) spectroscopy coupled with supervised machine learning could constitute an alternative method for rapid malaria screening, directly from dried human blood spots.
Methods: Filter papers containing dried blood spots (DBS) were obtained from a cross‑sectional malaria survey in 12 wards in southeastern Tanzania in 2018/19. The DBS were scanned using attenuated total reflection‑Fourier Transform Infrared (ATR‑FTIR) spectrometer to obtain high‑resolution MIR spectra in the range 4000 cm−1 to 500 cm−1. The spec‑tra were cleaned to compensate for atmospheric water vapour and CO2 interference bands and used to train differ‑ent classification algorithms to distinguish between malaria‑positive and malaria‑negative DBS papers based on PCR test results as reference. The analysis considered 296 individuals, including 123 PCR‑confirmed malaria positives and 173 negatives. Model training was done using 80% of the dataset, after which the best‑fitting model was optimized by bootstrapping of 80/20 train/test‑stratified splits. The trained models were evaluated by predicting Plasmodium falciparum positivity in the 20% validation set of DBS.
Results: Logistic regression was the best‑performing model. Considering PCR as reference, the models attained overall accuracies of 92% for predicting P. falciparum infections (specificity = 91.7%; sensitivity = 92.8%) and 85% for predicting mixed infections of P. falciparum and Plasmodium ovale (specificity = 85%, sensitivity = 85%) in the field‑collected specimen.
Conclusion: These results demonstrate that mid‑infrared spectroscopy coupled with supervised machine learning (MIR‑ML) could be used to screen for malaria parasites in human DBS. The approach could have potential for rapid and high‑throughput screening of Plasmodium in both non‑clinical settings (e.g., field surveys) and clinical settings (diagnosis to aid case management). However, before the approach can be used, we need additional field validation in other study sites with different parasite populations, and in‑depth evaluation of the biological basis of the MIR sig‑nals. Improving the classification algorithms, and model training on larger datasets could also improve specificity and sensitivity. The MIR‑ML spectroscopy system is physically robust, low‑cost, and requires minimum maintenance.
© The Author(s) 2019. This article is distributed under the terms of the Creative Commons Attribution 4.0 International License (http://creat iveco mmons .org/licen ses/by/4.0/), which permits unrestricted use, distribution, and reproduction in any medium, provided you give appropriate credit to the original author(s) and the source, provide a link to the Creative Commons license, and indicate if changes were made. The Creative Commons Public Domain Dedication waiver (http://creativecommons.org/publicdomain/zero/1.0/) applies to the data made available in this article, unless otherwise stated.
Open Access
Malaria Journal
*Correspondence: [email protected]; [email protected]†Emmanuel P. Mwanga, Elihaika G. Minja, Emmanuel Mrimi, Mario González Jiménez and Johnson K. Swai contribution equally to this work1 Environmental Health and Ecological Sciences Department, Ifakara Health Institute, Morogoro, TanzaniaFull list of author information is available at the end of the article
Page 2 of 13Mwanga et al. Malar J (2019) 18:341
BackgroundAccurate diagnosis of malaria infection in both humans and mosquitoes is essential for understanding trans-mission patterns, estimating epidemiological bur-den and informing appropriate management of cases. WHO’s Global Technical Strategy for Malaria 2016–2030 (GTS) recommends that surveillance strategies should be integrated as core interventions to provide better estimates of disease burden, improve resource allocation and accelerate progress towards elimination [1]. The malERA Refresh Consultative Panel on Tools for Malaria Elimination reiterated in 2017 that new diagnostic tools are as important as new drugs, vac-cines and vector control tools [2].
Given health system challenges facing many low-income, malaria-endemic countries, there is par-ticular interest in non-immunological point-of-care (POC) techniques that could be readily scaled up with minimum effort [2]. Equally vital is the need for bet-ter quantification and identification of asymptomatic pathogen carriers in situations of low transmission and sub-microscopic parasitaemia [2, 3]. Low-cost mass screening tools are also vital for large cross-sectional investigations such as national malaria indicator sur-veys, and for monitoring progress of interventions such as insecticide-treated bed nets [4–6], indoor residual spraying [7], larviciding [8], and anti-malarial medi-cines [9].
Malaria diagnosis from human samples currently relies on light microscopy with thin and thick blood smears [10], polymerase chain reaction (PCR) assays [11–13] and a variety of antigen-detecting rapid diag-nostic tests [14]. As countries approach elimination, there is greater need for accurate detection of malaria parasites in both symptomatic and asymptomatic indi-viduals [15]. Microscopy is still commonly used in diag-nosis to support case management [10]. With highly trained and experienced microscopists, it can offer reli-able results and enable identification and quantification of sexual and asexual stages of infections by different malaria parasite species (Plasmodium falciparum, Plas-modium vivax, Plasmodium malariae, and Plasmodium ovale, being the most prevalent). However, microscopy-based diagnosis is labour-intensive and often requires more than one highly trained person for confirmation of conflicting results [10]. Additionally, this technique has low sensitivity in many laboratories and misses most low-level parasitaemia cases [16].
PCR, on the other hand, is highly specific and sensi-tive for malaria parasite detection, but is not widely used for primary diagnosis in most malaria-endemic places because it is expensive, requires highly skilled personnel, and is therefore impractical to implement in rural and remote facilities [17]. Furthermore, until the impact of treating sub-microscopic parasitaemia on transmission is fully understood, WHO has recommended that PCR should not be part of routine malaria control or elimina-tion programmes [18]. It is however capable of identifying low-level parasitaemia that are otherwise undetectable by other methods, and distinguishing between individual parasite species. Recent developments in PCR applica-tions have signaled the potential of non-invasive malaria diagnostic options, such as those relying on DNA detec-tion in saliva, urine, sweat, and even faecal excreta [19–21]. Besides, real time PCR assays enable quantitative assessments and comparison of infection loads [15], but are expensive for most laboratories. A related technology is the loop-mediated isothermal amplification (LAMP), which is also increasingly used for diagnosis of multiple malaria species, and can be conducted at room tempera-tures without PCR instruments [22].
At present, malaria rapid diagnostic tests (RDTs) are the best option for addressing the technical limita-tions of both light microscopy and DNA-based diagno-sis. These tests target persistent specific antigens from malaria parasites [14, 23, 24] and are quick and deploy-able at large scale. They also do not require highly skilled labour, electricity or sophisticated storage needs. Unfor-tunately, RDTs can be unreliable in low transmission settings, resulting in significant false negative and false positive results [25]. Both microscopy and RDTs are recommended only when the number of malaria para-sites exceed 100/µL, and are therefore not applicable for measuring low-level parasitaemia or identifying asymp-tomatic cases [16]. In one example, mass RDT screen-ing followed by treatment did not result in reduction of malaria incidence in the pre-elimination settings of Zan-zibar, most likely due to poor reliability of the RDTs [26]. However, a new rapid lateral flow technique that detects specific proteins of the infectious Plasmodium stages, i.e., gametocytes, in saliva is showing encouraging results in detecting sub-microscopic parasites in children and adults [27].
Recent studies have shown that non-molecular tech-niques such as near-infrared spectroscopy (12,500 cm−1 to 400 cm−1 frequencies) and mid-infrared spectroscopy
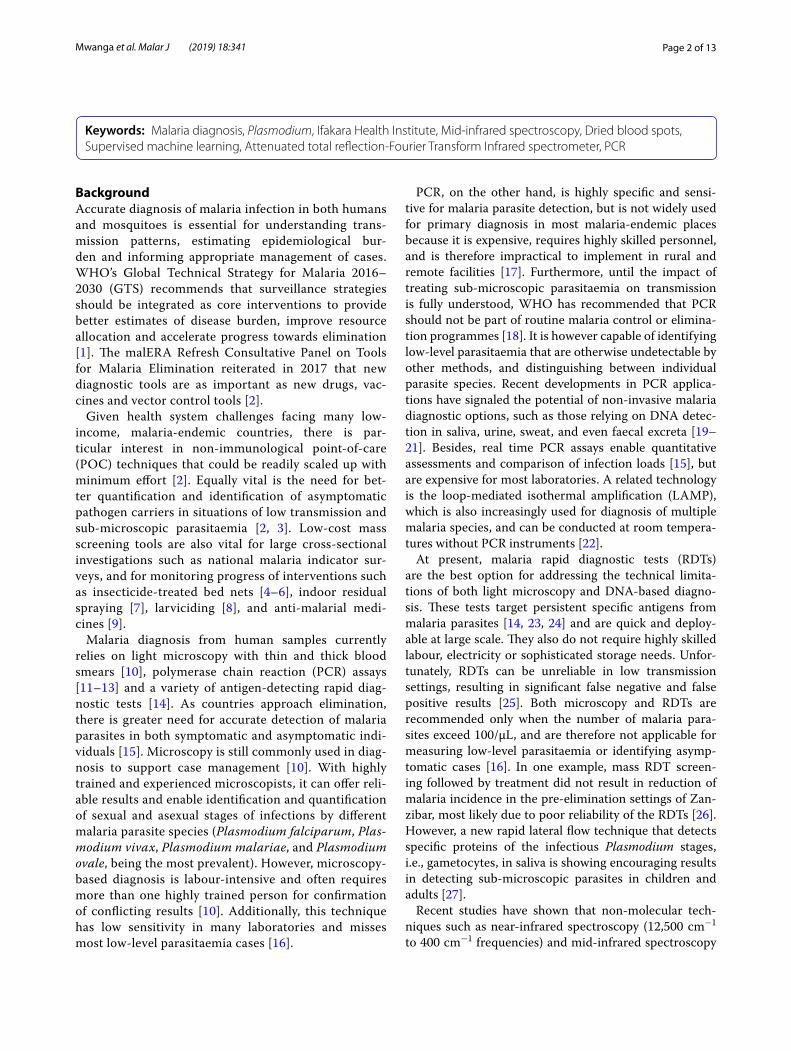
Keywords: Malaria diagnosis, Plasmodium, Ifakara Health Institute, Mid‑infrared spectroscopy, Dried blood spots, Supervised machine learning, Attenuated total reflection‑Fourier Transform Infrared spectrometer, PCR

Page 3 of 13Mwanga et al. Malar J (2019) 18:341
(4000 cm−1 to 400 cm−1 frequencies), combined with advanced data analysis, could provide cheaper, quicker, reagent-free, and potentially simpler options for surveys of mosquitoes and mosquito-borne infections. Exam-ples include detection of endosymbionts such as Wol-bachia bacteria, and pathogens such as Plasmodium and Zika virus in mosquitoes [28–31]. Such approaches have also been used for estimating ages of disease-transmit-ting mosquitoes [32–38], distinguishing between vec-tor species [32, 38, 39] and assessing their blood-feeding histories [40], all of which directly influence malaria transmission.
Khoshmanesh et al. [41] used mid-infrared (MIR) spectroscopy combined with partial least-squares (PLS) regression to detect early ring stages of laboratory-cultured P. falciparum with detection limits less than 1 parasite/µL. To improve this approach, Roy et al. [42] used Plasmodium cultures to spike whole blood obtained from six uninfected volunteers, then aliquoted these mixtures multiple times to obtain 132 specimens con-taining different quantities of P. falciparum parasites, glucose and urea. Based on PLS regressions analysis of MIR spectra from these aliquots, they correctly identi-fied 98% of specimens with parasitaemia densities above 0.5% (~ 25,000 parasites/µL). Sensitivity was however only 70%, possibly because the model included only a small number of negative samples. Although limited to laboratory cultures and small number of samples with low genetic variability, these studies were the first to demonstrate direct potential of MIR for malaria parasite detection.
This current study has extended the approach used by Khoshmanesh et al. [41] and Roy et al. [42], to provide the first demonstration of MIR spectroscopy coupled with supervised machine learning (MIR-ML) to diag-nose malaria in human dried blood spots (DBS) obtained from field surveys of naturally infected individuals in a malaria-endemic community in Tanzania.
MethodsStudy areaSamples for this analysis were obtained from a cross-sec-tional malaria parasite prevalence survey conducted in 12 administrative wards in Ulanga and Kilombero districts in southeastern Tanzania (Fig. 1). Average altitude of the area is 270 m above sea level, annual rainfall is 1200–1800 mm and annual temperatures range between 20 °C and 32 °C. Malaria prevalence at the time of the survey varied from < 1% in the northernmost urban wards of Ifakara town and Mlabani, to > 40% in southern wards of Igota and Igumbiro (Swai et al. unpublished). Of all Plas-modium species, P. falciparum accounts for most malaria infections Tanzania [43].
Transmission intensities also vary and were last esti-mated to be ~ 16 infectious bites/person/year in the Ulanga district wards [44], and < 1 infectious bites/person/year in the Kilombero district wards [45]. The dominant vector species is Anopheles funestus followed by Anopheles arabiensis [44]. Long-lasting insecticidal-treated bed nets (LLINs) are the most common preven-tion tool used in the study with coverage of > 80% [4].
Malaria parasite surveys using RDTsThe parasite survey included 1486 households and 3292 individuals across the 12 study wards (Fig. 1), and was conducted between September 2018 and February 2019. Blood samples were taken from finger pricks of house-hold members of all age groups and both genders, and then tested for malaria parasites using RDTs and PCR.
The RDTs (SD BIOLINE malaria Ag P.f/Pan 05FK60) were used to screen all individuals and results interpreted following manufacturer’s instructions [46]. This RDT kit detects P. falciparum and other Plasmodium species in whole blood samples [46] by differential detection of circulating histidine-rich antigen II (HRP-II) of P. falci-parum, and common Plasmodium lactate dehydrogenase (pLDH) of Plasmodium species [14, 23, 24]. All malaria-positive specimens were verified by light microscopy, and if found positive, the individual was immediately treated by a study clinician according to Tanzania national treat-ment guidelines for malaria [47].
In addition to microscopy and RDTs, DBS specimens were collected from all RDT-tested patients regardless of test results. Three to four drops of blood were placed directly from finger prick onto Whatman 903™ card (GE Healthcare Bio-Sciences Corp.) [48]. The DBS specimens were dried in open air for 15 min, and stored in zip-locked plastic bags, with desiccants. The DBS were stored at − 20 °C for 2–5 months, after which further tests were done, all at once, as described below.
Mid‑infrared scanning of dry blood spotsThe DBS collected from individuals for which there had been positive malaria test results (n = 147), and a sepa-rate random selection of specimens from individuals with negative results (n = 149) were scanned using a Bruker ALPHA Fourier-Transform Infrared (FTIR) spectrometer equipped with Platinum ATR and a Platinum diamond sampling module [49]. The individual DBS cards were placed between the anvil and crystal plate of the spec-trometer, each time ensuring that the MIR beam directly struck the middle of the blood spots (Fig. 2a).
The MIR spectra were captured from 4000 to 500 cm−1 wave numbers, with spectral resolution set at 5 cm−1. Each individual DBS sample was scanned 32 times in 30 s, and averaged to obtain a single representative spectrum.

Page 4 of 13Mwanga et al. Malar J (2019) 18:341
The anvil and crystal were cleaned after each specimen scan, using velvex tissue soaked in 70% ethanol and dried using a clean dry tissue. The spectrometer has an inter-nal validation unit (IVU) with reference standards, and was programmed to conduct automated instrument tests for operational and performance qualification. However, additional performance and quality checks were done by conducting frequent background scans before first sam-ple scan and after every five specimen scans. Additional details of the MIR spectrometer and the scanning process have been described elsewhere [38, 40]. All DBS samples were scanned at the same time.
Nested PCR assays to confirm malaria infections in the dry blood spotsDNA was extracted from the DBS papers and the pres-ence of any of the malaria parasites (P. falciparum, P. ovale, P. vivax and P. malariae) examined using nested PCR targeting 18S ssRNA sequences, according to the
Snounou and Singh protocol [50], with slight modifica-tion to include primers for Plasmodium knowlesi [51]. The first PCR reaction used 10 µl of DNA, amplified with rPLU1 and rPLU5 primers targeting fragment lengths between 1600 and 1700 bp. The second PCR stage used 2 µl of the first PCR product, plus species-specific primer pairs (rFAL1-rFAL2, rOVA1-rPLU2, rVIV1-rVIV2, rMAL1-rMAL2, and Pmk8-Pmkr9) in five different reac-tions (Additional file 1). Amplification for all reactions was done using PCR master mix with total volumes of 20 µl. The PCR products were analyzed after electro-phoresis in agarose gel and DNA bands visualized using Kodak Logic 100 imaging system.
Data analysisThe OPUS software [52] was used to clean and compen-sate all spectra for water vapour absorption bands and carbon dioxide (CO2) interference bands as described in Mwanga et al. [40] and Gonzalez-Jimenez et al. [38].
Fig. 1 Map showing study villages in Kilombero and Ulanga districts, southeastern Tanzania (courtesy of Alex J Limwagu)

Page 5 of 13Mwanga et al. Malar J (2019) 18:341
Fig. 2 Schematic illustration of specific processes of: a collection of blood specimens and preparation of DBS on filter papers, scanning on mid‑infrared spectrometer, and recording sample spectra; b data splitting, model training, cross‑validation and evaluation of performance of final model (supervised machine learning process)
Page 6 of 13Mwanga et al. Malar J (2019) 18:341
A final dataset of 296 samples, including 123 PCR-con-firmed Plasmodium-positive and 173 Plasmodium-neg-ative individuals was considered for further analysis in the Python programming language version 3.7 with the scikit-learn library [53]. All wave numbers from the spec-tra were included in the analysis. Supervised machine learning algorithms were trained to map spectra to known PCR test results, by implementing binary classifi-cation strategy, and validated on a separate set of spectra not used for training (Fig. 2b).
Primary assessment was done against PCR as reference because of its high sensitivity and specificity compared to RDTs and microscopy [17, 54]. At this proof-of-concept stage, it was however not possible to balance the speci-mens by other variables such as anaemia, gender, age, period of storage, or prevailing parasitaemia prevalence in the different villages.
The PCR analysis had identified mostly infections of P. falciparum occurring singly, though there were also a few cases of mixed infections consisting of P. falciparum, together with P. ovale. The MIR-based predictions were therefore done first by excluding the mixed infections, and second, without excluding them.
Classifying DBS samples as positive or negative for Plasmodium falciparum, based on PCR test results as referenceAll samples with mixed Plasmodium species infec-tions (N = 9) were excluded, so that the remaining data-set included only P. falciparum positives and a reduced number of negative samples (N = 260; Npositives = 114, and Nnegatives = 146). As previously described [40], the dataset was first partitioned into training set (80%; N = 208) and validation datasets (20%; N = 52). The validation set was preserved for evaluating prediction accuracies of the final model.
The training dataset was subjected to multiple rounds of randomly stratified splits into training sets (80%) and test sets (20%), to achieve rigorous classification of the different malaria-positive and malaria-negative samples. To provide a mix of data representation methods and allow for both parametric and non-parametric assess-ment of the data, baseline performances of seven differ-ent classification algorithms were tested. These included: K-nearest neighbours classifier (KNN), logistic regres-sion (LR), support vector machine classifier (SVM), naïve Bayes (NB), random forest classifier (RF), XGBoost clas-sifier (XGB), and multilayer perceptron (MLP) [53]. All code was adapted from https ://githu b.com/Simon AB/Gonza lez-Jimen ez_MIRS.
The algorithms were trained on spectral features (absorbance of MIR spectra in at different wavenum-bers) representing malaria-positive and malaria-negative
DBS samples (Fig. 3). The best-performing classification algorithm was optimized by fitting 70 bootstrapped mod-els, for which the outputs were aggregated to obtain an ensemble model with highest accuracy and lowest vari-ance. Finally, best-performing classifiers were bagged and used to compare the predicted labels against true labels (Plasmodium positive or Plasmodium negative) using the naïve validation set separated at the beginning.
The full analysis was repeated, this time including the mixed infections, which had been removed from the ini-tial model training. This way, the MIR-ML approach was evaluated for predicting infection with any of the two Plasmodium species (P. falciparum and P. ovale) occur-ring singly or together in a DBS.
Lastly, based on the previous spectroscopic analysis of body fluids [55], and the earlier work by Roy et al. [42], Kozicki et al. [56], Khoshmanesh et al. [41], putative bands possibly responsible for the spectral differences between Plasmodium-infected and Plasmodium-free specimen were examined. Biochemical compositions such as lipids, proteins, carbohydrate and nucleic acids were explored from the sensitivity of the candidate MIR bands. Prediction coefficients of the best model were extracted and plotted its most dominant wave numbers.
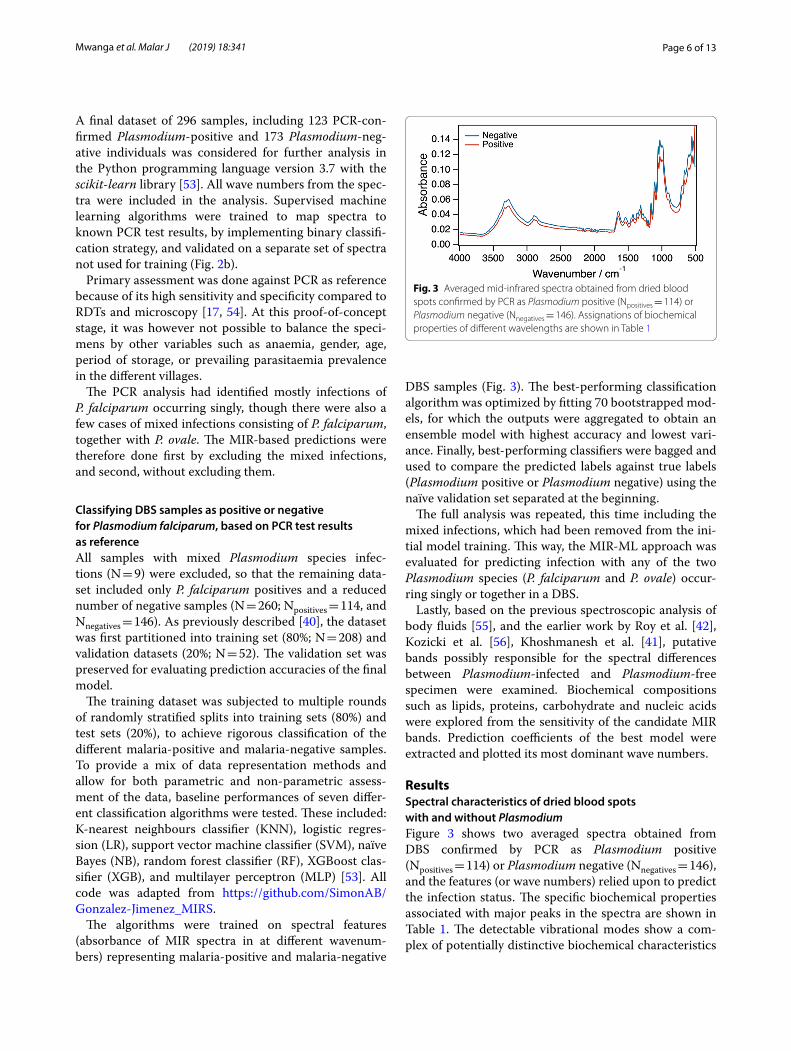
ResultsSpectral characteristics of dried blood spots with and without PlasmodiumFigure 3 shows two averaged spectra obtained from DBS confirmed by PCR as Plasmodium positive (Npositives = 114) or Plasmodium negative (Nnegatives = 146), and the features (or wave numbers) relied upon to predict the infection status. The specific biochemical properties associated with major peaks in the spectra are shown in Table 1. The detectable vibrational modes show a com-plex of potentially distinctive biochemical characteristics
Fig. 3 Averaged mid‑infrared spectra obtained from dried blood spots confirmed by PCR as Plasmodium positive (Npositives = 114) or Plasmodium negative (Nnegatives = 146). Assignations of biochemical properties of different wavelengths are shown in Table 1

Page 7 of 13Mwanga et al. Malar J (2019) 18:341
associated with lipids, proteins, amides, sugars and the haem group (Table 1).
Classifying DBS samples as positive or negative for Plasmodium falciparum, based on PCR test results as referenceIn the first analysis, only P. falciparum-infected individu-als were considered in the category of malaria-positive DBS cards, and any mixed infections were excluded. Logistic regression (LR) outperformed the other six can-didate classifiers in accuracy and precision (Fig. 4a). The best LR models predicted P. falciparum-infected and non-infected individuals with overall accuracy up to 90% before optimization (Fig. 4a) and 91.5% after optimiza-tion (Figs. 4b and 5a). When challenged with the valida-tion dataset, the optimized model achieved an overall accuracy of 92.3%, correctly identifying 92% of PCR-negative individuals and 93% of PCR-positive individuals (Fig. 5b).
The validity of MIR-ML is shown in Table 2. The approach was 92.8% sensitive and 91.7% specific. For comparison, the validity of the RDTs used in the survey, when compared to PCR, is also shown. The RDTs were 97.6% sensitive and 84.4% specific for detection of Plas-modium-infected individuals in this study area.
Selection of most dominant spectral features (wave numbers) used for distinguishing between Plasmodium falciparum positive or negative dried blood spotsThe LR coefficients showed the relative importance of wave numbers, enabling selection of those most
responsible in the decision function (prediction of malaria positive and malaria negative DBS). Figure 6 therefore shows the wave numbers with the strongest likelihood in predicting the infection status of the indi-viduals. All the top 20 wave numbers (features) were in the fingerprint region of the MIR spectra (1730 cm−1–883 cm−1) where lipids, amino acids and proteins is mostly detected (Table 1).
Predicting PCR test results from MIR spectra without excluding mixed infectionsIn the second analysis, all infected individuals were considered regardless of Plasmodium species present. Once again, LR was the best model, achieving up to 93% accuracy and 95% after bootstrapping. The final model achieved 87% overall accuracy for the validation set, cor-rectly identifying 91% of PCR-negative individuals and 82% of PCR-positive individuals.
DiscussionThis study is an initial demonstration, using field-col-lected blood specimens, that MIR spectroscopy coupled with logistic regression analysis could potentially be har-nessed for detection of infectious parasitic diseases, in this case malaria. Malaria cases were identified by both MIR spectroscopy and PCR, then the results were com-pared. It considered 296 individual samples, to dem-onstrate potential application of MIR spectroscopy for malaria detection. The main finding was that spectral sig-natures collected from human DBS can be relied upon to identify malaria-infected and non-infected specimens.
Table 1 Biochemical properties associated with peaks in the mid-infrared spectra obtained from dried blood spots in Fig. 3
Wave number (cm−1) Vibrational mode Component identification
3600–3000 N–H stretching Amides (proteins, haemoglobin), urea
O–H stretching Alcohols carbohydrates, cellulose
3332 O–H stretching Alcohol cellulose
3293 N–H stretching Amide (proteins, hemoglobin)
3272 O–H stretching Cellulose
3000–2800 C–H stretching Lipids, amino acids, carbohydrates
2894 C–H stretching Cellulose, carbohydrates
1700–1600 C=O stretching Amides (proteins, haemoglobin), urea
1540 N–H bending coupled to C–N stretching Amides (proteins, haemoglobin)
1457 CH3 bending Amino acids, lipids
1400–1310 C–H stretching Lipids, amino acids, carbohydrates
1307 C–N stretching Amides (proteins, haemoglobin)
1165–1110 C–O–C stretching Ethers (cellulose, carbohydrates)
1070–950 C–O stretching Alcohols (cellulose, carbohydrates, amino‑acids)
=C–H bending Haem group; haemoglobin
730 C–H bending Lipids, amino acids, carbohydrates

Page 8 of 13Mwanga et al. Malar J (2019) 18:341
Validity of this approach was verified by PCR tests, and corroborates the earlier evidence by Khoshmanesh et al. [41] and Roy et al. [42], who first demonstrated applica-tions of MIR spectroscopy to detect Plasmodium. Other related approaches include the use of surface-enhanced Raman spectroscopy (SERS), requiring silver nanopar-ticles to be added to lysed blood, and magneto-optic scanning to detect haemozoin, a waste product of Plas-modium infection of red cells pigment, haemoglobin [57, 58]. Both of these approaches have been tested in vitro, although Newman et al. also evaluated the magneto-optic systems in a small pre-clinical trial with 13 partici-pants [59].
An important advancement in the work presented here is that it has demonstrated the first direct applica-tion of MIR spectroscopy on field-collected DBS speci-mens on filter papers. The technique therefore requires no additional reagents or pre-processing of samples. The samples analysed came from multiple age groups of both male and females in villages with varying malaria prevalence rates, thereby providing considerable vari-ability between individual infections. When the final optimized LR model was applied to new blood samples that had not been exposed to the classifier, they cor-rectly identified 92% of the malaria-free individuals and 93% of malaria-infected individuals compared to PCR.
This study adds to the growing evidence show-ing the potential role of infrared spectroscopy and
Fig. 4 a Percentage prediction accuracies and precisions for different classification models, based on PCR test results as reference. Models compared included k‑nearest neighbours (KNN), logistic regression (LR), support vector machines (SVM), naïve Bayes (NB), XGBoost (XGB), random forest (RF), Multilayer perceptron (MLP). Logistic regression (LR) was the best performing model; b distribution of per class accuracies obtained by final LR classifiers and standard deviation from 70 bootstrapped models in predicting PCR test results from MIR spectral data. In both figures, accuracy refers to the how high the percentage prediction for each individual classification method is, while precision implies the statistical variation around those predictions
Fig. 5 a Averaged proportions of correct predictions of PCR‑confirmed Plasmodium falciparum‑infected individuals achieved during the training of the models; b averaged proportions of correct predictions of Plasmodium falciparum‑infected individuals achieved when the final model is challenged the previously unseen validation spectra

Page 9 of 13Mwanga et al. Malar J (2019) 18:341
chemometrics in surveillance of mosquito-borne dis-eases. In a recent study conducted using near-infra-red rather than MIR spectra, it was possible to detect infectious P. falciparum sporozoites in laboratory-reared and laboratory-infected Anopheles mosqui-toes with up to 90% accuracy [31]. Earlier studies had also demonstrated detection of various pathogens such as Wolbachia, Plasmodium and Zika virus in
different mosquito species [28–31]. Many of these ear-lier approaches relied on spectroscopy at near-infrared (NIR) frequencies (12,500 cm−1 to 400 cm−1) where the absorption intensity is due to overtone and combi-nation bands, which are relatively weak. Spectroscopy at MIR frequencies (4000 cm−1 to 400 cm−1) captures the fundamental vibrational modes of biological sam-ples, which are stronger and more information rich [38], thereby offering stronger signals than NIR, which reflects secondary modes. Advances in data analysis and machine learning techniques now make the large spectral datasets amenable to processing.
The distinctive features of the MIR spectra may be related to the biochemical changes in red blood cells following malaria infection [41, 42]. These differences may also result from Plasmodium-specific proteins present in infected human blood [60], or simply due to pathological manifestations of malaria such as anae-mia, iron deficiency or other inflammatory responses. Based on previous analyses of body fluids [55, 56, 61, 62], and earlier work by Roy et al. [42], Kozicki et al. [56], Khoshmanesh et al. [41], the spectral bands puta-tively responsible for the differences between Plasmo-dium-infected and Plasmodium-free specimens were examined (Table 1). Further analysis of the dominant spectral wavelengths showed that they were mostly in the fingerprint region associated with amino acids, carbohydrates, lipids, and proteins (Table 1 and Fig. 6). Nonetheless, more detailed analysis beyond this cur-rent work is still required to examine how variations in these specific bands influence the diagnostic capacity of this technology.
Bands in the C–H stretching regions are usually attributed to lipids synthesized during development of
Table 2 Performance of mid-infrared spectroscopy coupled with logistic regression, and the RDT (i.e. SD BIOLINE malaria Ag P.f/Pan 05FK60), both compared to PCR for identifying Plasmodium falciparum-infected individuals from the validation set
PCR Total % sensitivity % specificity % positive predictive value
% negative predictive valuePositive Negative
Mid‑infrared spectroscopy and machine learning (MIR‑ML)
Positive 26 2 28 92.8 91.7 92.8 91.7
Negative 2 22 24
28 24 52
Positive Negative % sensitivity % specificity % positive predictive value
% negative predictive value
SD BIOLINE malaria Ag P.f/Pan 05FK60 RDT
Positive 120 27 147 97.6 84.4 86.0 97.2
Negative 3 146 149
123 173 296
Fig. 6 Plots of 20 most dominant spectral features (wave numbers) influencing model prediction of Plasmodium‑infection status of the dried blood spot specimens. The positive coefficients are those most predictive of Plasmodium positive specimens while the negative coefficients are those most predictive of Plasmodium‑negative specimen. All the top 20 features are found in the fingerprint region (1730 cm−1–883 cm−1)

Page 10 of 13Mwanga et al. Malar J (2019) 18:341
P. falciparum and can change the make-up of infected erythrocytes and become detectable in the spectra. On the other hand, the region between 1250 and 800 cm−1 is sensitive to nucleic acid vibrations associated with proliferation of Plasmodium-specific ribosomes dur-ing parasite development and cell invasion [42]. Several peaks were observed in this region characteristic of sug-ars and peptides, consistent with parasite DNA (Table 1 and Fig. 6). In previous assessments, it was also shown that reduced absorbance in the carbohydrate regions at 1144 cm−1, 1101 cm−1 and 1085 cm−1 are likely associ-ated with lower glucose content in infected red blood cells, since these parasites metabolize glucose faster than normal cells [41, 42]. Perhaps the most obvious are the different haem vibration regions (Table 1), which show higher haemoglobin levels in non-infected than infected samples because Plasmodium catabolizes the complex haemoglobin protein into constituent lipids and biliru-bin. By tracking these key characteristics, it is possible to predict the infection status of the dried whole blood specimen.
This study should be considered only as an initial eval-uation of the approach, and more studies are required before the technology is field-deployable or effective. Fil-ter papers containing human DBS were scanned and the resulting spectra used to train algorithms to predict out-comes of nested PCR [40]. Comparison was made with results of tests considering only P. falciparum and also with results of tests considering any species of Plasmo-dium. In both cases, the technique achieved high accu-racy in distinguishing between infected and uninfected specimen. While this finding indicates that the technique could be applicable for diagnosis of different malaria par-asites, it also highlights the need to improve the approach so as to distinguish between different parasite species.
The field survey from which the DBS specimens were collected also had RDT data. Relative to PCR as refer-ence, the RDT results achieved slightly higher sensitiv-ity (97.6 vs 92.8%) but lower specificity (84.4 vs 91.7%) than the MIR spectroscopy approach (Table 2). In previ-ous studies, the same RDTs achieved sensitivity of 99.7% for P. falciparum, and 95.5% for non P. falciparum and a specificity of 99.5% for both [46, 63].
Significant improvements and field validation studies are still necessary before this technique can be deployed for actual screening and diagnosis. One avenue of improvement is the availability of more field data to vali-date this approach as a complementary tool for screening malaria, and potentially other blood-borne infections. Also, this current study did not include any quantifi-cation of infection intensities, which will be necessary to examine validity in areas of different transmission intensities, as well as potential role of this technology in
malaria elimination settings. Such future studies should also include: (a) greater analysis on biological basis of the observed signals and how this may be influenced by the natural history of malaria infections in humans, or its manifestations, such as anaemia; (b) determination of whether the method can distinguish between the differ-ent parasite stages, such as the asexual stages versus the sexual stages (i.e., gametocytes); (c) detailed examination and characterization of cases incorrectly identified by this new approach; and, (d) assessment of parasite detec-tion thresholds, and factors that may influence it if MIR spectroscopy and machine learning are used.
It takes 30 s to scan a single blood spot under MIR spectrometer, and the approach is considerably lower cost than PCR platforms. The MIR equipment presently costs ~ US$29,000 as an initial outlay, but there are no extended costs for reagents except for occasional replace-ment of the desiccants. It takes less than a minute to clean the crystal and anvil, position DBS on the crystal and col-lect the MIR spectra, thus any experienced staff member can scan more than 250 specimens per day. Compara-tively, average PCR systems cost between US$3000 and 10,000, and require reagents repeatedly. The cost of pro-cessing a DBS sample can be US$2–4 per unit and regu-larly takes up to 2 days to get back full results in batches typically not exceeding 100 specimens. Assuming a mod-est analysis of just 5000 samples per year, it would take ~ 2 years to recover full costs of switching from PCR to MIR-ML-based systems and break even. The onward costs of servicing are also low as the MIR equipment is robust. Compared to PCR, use of MIR-ML could there-fore potentially be developed into a cost-effective, quick and scalable approach. Besides, the same spectra, once collected, can be analysed for multiple characteristics, potentially making this approach a one-stop system for assessing multiple disease indicators with different speci-men types, such as DBS papers, blood slides, mosquitoes, and fluids. It is however not expected that the technology, in its current form, can replace current best practices for malaria surveillance or diagnostics, without further field validation.
One limitation of this current study is that the number of samples used was low, totalling only 296 (123 Plas-modium positive and 173 Plasmodium negative). It is expected that the quality of the predictions will improve as more data are available to train the models, especially if there is variation in localities from where the specimen originates, parasite densities, geographical locations, and demographics of infected individuals. A related limita-tion was that it was not possible to balance the Plas-modium-positive and Plasmodium-negative specimens by other variables such as anaemia, gender, age, period of storage, or parasitaemia prevalence in the different
Page 11 of 13Mwanga et al. Malar J (2019) 18:341
villages, all of which may influence malaria risk and the predictive values of test methods. Future studies should therefore test whether these factors can significantly influence outcomes of the prediction models.
ConclusionsThese results demonstrate that mid-infrared spectros-copy coupled with supervised machine learning could be used to screen for malaria parasites in human dried blood spots. This approach has the potential for rapid and high-throughput screening of Plasmodium infections in non-clinical field surveys, and possibly for diagnosis in clinical settings. However, before the approach can be used, we need additional field validation in other study sites with different parasite populations, and in-depth evaluation of the biological basis of the MIR signals. Improving the classification algorithms, and model training on larger datasets could also improve specificity and sensitivity. The MIR spectroscopy system is physically robust, lower-cost compared to PCR, requires minimum maintenance, and is reagent-free except for occasional replacement of desiccants.
Supplementary informationSupplementary information accompanies this paper at https ://doi.org/10.1186/s1293 6‑019‑2982‑9.
Additional file 1. Detection of five Plasmodium species from dried blood spots (DBS) by nested PCR method.
AcknowledgementsThe authors wish to thank all field technicians and senior health personnel who supported malaria diagnosis and DBS collection. The authors thank Ifakara laboratory team for performing PCR analysis.
Authors’ contributionsEPM, EM, EGM, HSN, SAM, DJS, JKS and FOO designed the study. EPM, EM, JKS and EGM performed and supervised experiments and collection of dried blood spots samples. EPM and MGJ analysed the data. EPM and CS designed the schematics. SA and EM supported with PCR analysis. EPM, EM, EGM and FOO wrote and revised the manuscript. HMF, MFM, FB, SAB, KW, AO, MTS, and PS reviewed and revised the manuscript. SAB trained EPM the Machine learning analysis. The manuscript has been approved by all authors prior to submission. All authors read and approved the final manuscript.
FundingThis research was supported by Wellcome Trust Intermediate Fellowship in Public Health & Tropical Medicine awarded to FOO (Grant No. WT102350/Z/13/Z), a Howard Hughes Medical Institute (HHMI)‑Gates International Research Scholarship awarded to FOO (Grant No. OPP1099295) and an MRC grant awarded to University of Glasgow (Grant No. MR/P025501/1). EPM, DJS, SAM and JKS were also supported by Wellcome Trust International Masters Fellowships in Tropical Medicine & Hygiene, (Grant Nos. WT214643/Z/18/Z, WT 214644/Z/18/Z, WT212633/Z/18/Z and WT200086/Z/15/Z respectively).
Availability of data and materialsAll data for this study will be available upon request. The analysis script was adapted from https ://githu b.com/Simon AB/Gonza lez‑Jimen ez_MIRS; and
has been changed to accommodate this specific analysis and deposited in a public repository. It is available at MwangaEP/Manuu‑ML‑Projects.
Ethics approval and consent to participateEthical approval for the study was obtained from Ifakara Health Institute’s Institutional Review Board (Ref. IHI/IRB/No: 007—2018), and from the Medical Research Coordinating Committee (MRCC) at the National Institutes of Medi‑cal Research (NIMR), Ref: NIMR/HQ/R.8a/Vol.IX/2895.
Consent for publicationPermission to publish this work was also obtained from the National Institutes of Medical Research (NIMR), REF: NIMR/HQ/P.12 VOL XXVIII/14.
Competing interestsThe authors declare that they have no competing interests.
Author details1 Environmental Health and Ecological Sciences Department, Ifakara Health Institute, Morogoro, Tanzania. 2 School of Chemistry, University of Glasgow, Glasgow G12 8QQ, UK. 3 Institute of Biodiversity, Animal Health and Com‑parative Medicine, University of Glasgow, Glasgow G12 8QQ, UK. 4 School of Life Sciences, University of Keele, Keele, Staffordshire ST5 5BG, UK. 5 KEMRI Wellcome Trust Research Programme, P.O. Box 230, Kilifi 80108, Kenya. 6 Centre for Tropical Medicine and Global Health, Nuffield Department of Medicine, University of Oxford, Old Road Campus Roosevelt Drive, Oxford OX3 7FZ, UK. 7 Interventions and Clinical Trials Department, Ifakara Health Institute, Bagamoyo, Tanzania. 8 School of Public Health, University of Queensland, Saint Lucia, Australia. 9 Department of Mathematics, Statistics and Computer Sci‑ence, Marquette University, Wisconsin, USA. 10 Institute for Disease Modeling, Bellevue, WA 98005, USA. 11 School of Public Health, University of Witwa‑tersrand, Johannesburg, South Africa.
Received: 8 July 2019 Accepted: 28 September 2019
References 1. World Health Organization. WHO Global Malaria Programme. Global tech‑
nical strategy for malaria, 2016–2030. Geneva: World Health Organization; 2015.
2. malERA Refresh Consultative Panel on Tools for Malaria Elimination. malERA: an updated research agenda for diagnostics, drugs, vaccines, and vector control in malaria elimination and eradication. PLoS Med. 2017;14:e1002455.
3. malERA Refresh Consultative Panel on Characterising the Reservoir and Measuring Transmission. malERA: an updated research agenda for characterising the reservoir and measuring transmission in malaria elimi‑nation and eradication. PLoS Med. 2017;14:e1002452.
4. Renggli S, Mandike R, Kramer K, Patrick F, Brown NJ, McElroy PD, et al. Design, implementation and evaluation of a national campaign to deliver 18 million free long‑lasting insecticidal nets to uncovered sleeping spaces in Tanzania. Malar J. 2013;12:85.
5. Bonner K, Mwita A, McElroy PD, Omari S, Mzava A, Lengeler C, et al. Design, implementation and evaluation of a national campaign to distribute nine million free LLINs to children under five years of age in Tanzania. Malar J. 2011;10:73.
6. Khatib RA, Killeen GF, Abdulla SMK, Kahigwa E, McElroy PD, Gerrets RPM, et al. Markets, voucher subsidies and free nets combine to achieve high bed net coverage in rural Tanzania. Malar J. 2008;7:98.
7. Mashauri FM, Kinung’Hi SM, Kaatano GM, Magesa SM, Kishamawe C, Mwanga JR, et al. Impact of indoor residual spraying of lambda‑cyhalo‑thrin on malaria prevalence and anemia in an epidemic‑prone District of Muleba, North‑western Tanzania. Am J Trop Med Hyg. 2013;88:841–9.
8. Geissbühler Y, Kannady K, Chaki PP, Emidi B, Govella NJ, Mayagaya V, et al. Microbial larvicide application by a large‑scale, community‑based program reduces malaria infection prevalence in urban Dar es Salaam, Tanzania. PLoS One. 2009;4:e5107.
9. WHO. Guidelines for the treatment of malaria, 3rd edn; 2015. http://www.who.int/malar ia/publi catio ns/atoz/97892 41549 127/en/. Accessed 3 Sept 2019.

Page 12 of 13Mwanga et al. Malar J (2019) 18:341
10. Payne D. Use and limitations of light microscopy for diagnosing malaria at the primary health care level. Bull World Health Organ. 1988;66:621–6.
11. Snounou G, Viriyakosol S, Jarra W, Thaithong S, Brown KN. Identifica‑tion of the four human malaria parasite species in field samples by the polymerase chain reaction and detection of a high prevalence of mixed infections. Mol Biochem Parasitol. 1993;58:283–92.
12. Snounou G, Viriyakosol S, Zhu XP, Jarra W, Pinheiro L, do Rosario VE, et al. High sensitivity of detection of human malaria parasites by the use of nested polymerase chain reaction. Mol Biochem Parasitol. 1993;61:315–20.
13. Perandin F, Manca N, Calderaro A, Piccolo G, Galati L, Ricci L, et al. Development of a real‑time PCR assay for detection of Plasmodium falciparum, Plasmodium vivax, and Plasmodium ovale for routine clinical diagnosis. J Clin Microbiol. 2004;42:1214–9.
14. Beadle C, Long GW, McElroy PD, Hoffman SL, Long GW, Weiss WR, et al. Diagnosis of malaria by detection of Plasmodium falciparum HRP‑2 antigen with a rapid dipstick antigen‑capture assay. Lancet. 1994;343:564–8.
15. Britton S, Cheng Q, McCarthy JS. Novel molecular diagnostic tools for malaria elimination: a review of options from the point of view of high‑throughput and applicability in resource limited settings. Malar J. 2016;15:88.
16. Okell LC, Ghani AC, Lyons E, Drakeley CJ. Submicroscopic infection in Plasmodium falciparum—endemic populations: a systematic review and metaanalysis. J Infect Dis. 2009;200:1509–17.
17. Singh B, Bobogare A, Cox‑Singh J, Snounou G, Abdullah MS, Rahman HA. A genus‑ and species‑specific nested polymerase chain reaction malaria detection assay for epidemiologic studies. Am J Trop Med Hyg. 1999;60:687–92.
18. WHO. Malaria policy advisory committee meeting: meeting report, Octo‑ber 2017. Geneva: World Health Organization; 2017. https ://apps.who.int/iris/handl e/10665 /25504 4. Accessed 12 June 2019.
19. Lloyd YM, Esemu LF, Antallan J, Thomas B, Tassi Yunga S, Obase B, et al. PCR‑based detection of Plasmodium falciparum in saliva using mitochon‑drial cox3 and varATS primers. Trop Med Health. 2018;46:22.
20. Buppan P, Putaporntip C, Pattanawong U, Seethamchai S, Jongwutiwes S. Comparative detection of Plasmodium vivax and Plasmodium falciparum DNA in saliva and urine samples from symptomatic malaria patients in a low endemic area. Malar J. 2010;9:72.
21. Al‑Shehri H, Power BJ, Archer J, Cousins A, Atuhaire A, Adriko M, et al. Non‑invasive surveillance of Plasmodium infection by real‑time PCR analysis of ethanol preserved faeces from Ugandan school children with intestinal schistosomiasis. Malar J. 2019;18:109.
22. Oriero EC, Jacobs J, van Geertruyden JP, Nwakanma D, D’alessandro U. Molecular‑based isothermal tests for field diagnosis of malaria and their potential contribution to malaria elimination. J Antimicrob Chemother. 2015;70:2–13.
23. Moody A. Rapid diagnostic tests for malaria parasites. Clin Microbiol Rev. 2002;15:66–78.
24. Wilson ML. Malaria rapid diagnostic tests. Clin Infect Dis. 2012;54:1637–41. 25. Fagbamigbe AF. On the discriminatory and predictive accuracy of
the RDT against the microscopy in the diagnosis of malaria among under‑five children in Nigeria. Malar J. 2019;18:46.
26. Cook J, Xu W, Msellem M, Vonk M, Bergström B, Gosling R, et al. Mass screening and treatment on the basis of results of a Plasmodium falciparum‑specific rapid diagnostic test did not reduce malaria incidence in Zanzibar. J Infect Dis. 2015;211:1476–83.
27. Tao D, McGill B, Hamerly T, Kobayashi T, Khare P, Dziedzic A, et al. A saliva‑based rapid test to quantify the infectious subclinical malaria parasite reservoir. Sci Transl Med. 2019;11:eaan4479.
28. Sikulu‑Lord MT, Maia MF, Milali MP, Henry M, Mkandawile G, Kho EA, et al. Rapid and non‑destructive detection and identification of two strains of Wolbachia in Aedes aegypti by near‑infrared spectroscopy. PLoS Negl Trop Dis. 2016;10:e0004759.
29. Fernandes JN, dos Santos LMB, Chouin‑Carneiro T, Pavan MG, Garcia GA, David MR, et al. Rapid, noninvasive detection of Zika virus in Aedes aegypti mosquitoes by near‑infrared spectroscopy. Sci Adv. 2018;4:eaat0496.
30. Esperança PM, Blagborough AM, Da DF, Dowell FE, Churcher TS. Detec‑tion of Plasmodium berghei infected Anopheles stephensi using near‑infrared spectroscopy. Parasit Vectors. 2018;11:377.
31. Ferreira Maia M, Kapulu M, Muthui M, Wagah M, Ferguson H, Dowell F, et al. Detection of malaria in insectary‑reared Anopheles gambiae using near‑infrared spectroscopy. Malar J. 2019;18:85.
32. Mayagaya VS, Michel K, Benedict MQ, Killeen GF, Wirtz RA, Ferguson HM, et al. Non‑destructive determination of age and species of Anopheles gambiae s.l. using near‑infrared spectroscopy. Am J Trop Med Hyg. 2009;81:622–30.
33. Lambert B, Sikulu‑Lord MT, Mayagaya VS, Devine G, Dowell F, Churcher TS. Monitoring the age of mosquito populations using near‑infrared spectroscopy. Sci Rep. 2018;8:5274.
34. Sikulu‑Lord MT, Devine GJ, Hugo LE, Dowell FE. First report on the application of near‑infrared spectroscopy to predict the age of Aedes albopictus Skuse. Sci Rep. 2018;8:9590.
35. Krajacich BJ, Meyers JI, Alout H, Dabiré RK, Dowell FE, Foy BD. Analysis of near infrared spectra for age‑grading of wild populations of Anopheles gambiae. Parasit Vectors. 2017;10:552.
36. Ntamatungiro AJ, Mayagaya VS, Rieben S, Moore SJ, Dowell FE, Maia MF. The influence of physiological status on age prediction of Anopheles arabiensis using near infra‑red spectroscopy. Parasit Vectors. 2013;6:298.
37. Milali MP, Sikulu‑Lord MT, Kiware SS, Dowell FE, Corliss GF, Povinelli RJ. Age grading An. gambiae and An. arabiensis using near infrared spectra and artificial neural networks. PLoS ONE. 2019;14(8):e0209451.
38. Gonzalez‑Jimenez M, Babayan SA, Khazaeli P, Doyle M, Walton F, Reedy E, et al. Prediction of malaria mosquito species and population age struc‑ture using mid‑infrared spectroscopy and supervised machine learning. Wellcome Open Res. 2019;4:76.
39. Sikulu M, Killeen GF, Hugo LE, Ryan PA, Dowell KM, Wirtz RA, et al. Near‑infrared spectroscopy as a complementary age grading and species identification tool for African malaria vectors. Parasit Vectors. 2010;3:49.
40. Mwanga EP, Mapua SA, Siria DJ, Ngowo HS, Nangacha F, Mgando J, et al. Using mid‑infrared spectroscopy and supervised machine‑learning to identify vertebrate blood meals in the malaria vector, Anopheles arabien-sis. Malar J. 2019;18:187.
41. Khoshmanesh A, Dixon MWA, Kenny S, Tilley L, McNaughton D, Wood BR. Detection and quantification of early‑stage malaria parasites in laboratory infected erythrocytes by attenuated total reflectance infrared spectros‑copy and multivariate analysis. Anal Chem. 2014;86:4379–86.
42. Roy S, Perez‑Guaita D, Andrew DW, Richards JS, McNaughton D, Heraud P, et al. Simultaneous ATR‑FTIR based determination of malaria parasitemia, glucose and urea in whole blood dried onto a glass slide. Anal Chem. 2017;89:5238–45.
43. Ministry of Health Gender, Elderly and Children‑MoHCDGEC/Tanzania community D, ICF. Tanzania Malaria Indicator Survey 2017—Final Report; 2018.
44. Kaindoa EW, Matowo NS, Ngowo HS, Mkandawile G, Mmbando A, Finda M, et al. Interventions that effectively target Anopheles funestus mosqui‑toes could significantly improve control of persistent malaria transmis‑sion in south–eastern Tanzania. PLoS ONE. 2017;12:e0177807.
45. Finda MF, Limwagu AJ, Ngowo HS, Matowo NS, Swai JK, Kaindoa E, et al. Dramatic decreases of malaria transmission intensities in Ifakara, south‑eastern Tanzania since early 2000s. Malar J. 2018;17:362.
46. Abbot. SD BIOLINE Malaria Ag P.f/Pan; 2019. https ://www.alere .com/en/home/produ ct‑detai ls/sd‑bioli ne‑malar ia‑ag‑p‑f‑pan.html. Accessed 12 June 2019.
47. Ministry of Health Tanzania, NMCP. National guidelines for malaria diag‑nosis and treatment. Malar Control Ser No 11; 2006.
48. GE Healthcare Life sciences. 903 Proteinsaver Card; 2019. https ://www.gelif escie nces.com/en/fj/shop/molec ular‑biolo gy/sampl e‑colle ction . Accessed 3 Oct 2019.
49. Bruker Optics. ALPHA II—the compact FTIR spectrometer for any indus‑try; 2019. https ://www.bruke r.com/produ cts/infra red‑near‑infra red‑and‑raman ‑spect rosco py/ft‑ir‑routi ne‑spect romet ers/alpha /overv iew.html. Accessed 12 June 2019.
50. Snounou G, Singh B. Nested PCR analysis of Plasmodium parasites. In: Doolan DL, editor. Methods in molecular medicine. Malaria methods and protocols, vol. 72. Totowa: Humana Press; 2002. p. 189–203.
51. Zhou X, Huang J‑L, Njuabe MT, Li S‑G, Chen J‑H, Zhou X‑N. A molecular survey of febrile cases in malaria‑endemic areas along China‑Myanmar border in Yunnan province, People’s Republic of China. Parasite. 2014;21:27.

Page 13 of 13Mwanga et al. Malar J (2019) 18:341
• fast, convenient online submission
•
thorough peer review by experienced researchers in your field
• rapid publication on acceptance
• support for research data, including large and complex data types
•
gold Open Access which fosters wider collaboration and increased citations
maximum visibility for your research: over 100M website views per year •
At BMC, research is always in progress.
Learn more biomedcentral.com/submissions
Ready to submit your research ? Choose BMC and benefit from:
52. Bruker Optics. OPUS spectroscopy software; 2019. https ://www.bruke r.com/produ cts/infra red‑near‑infra red‑and‑raman ‑spect rosco py/opus‑spect rosco py‑softw are.html. Accessed 12 June 2019.
53. Pedregosa F, Gramfort A, Michel V, Thirion B, Grisel O, Blondel M, et al. Scikit‑learn: machine learning in Python. J Mach Learn Res. 2011;12:2825–30.
54. Bell D, Peeling RW. Evaluation of rapid diagnostic tests: malaria. Nat Rev Microbiol. 2006;4:S34–8.
55. Zou Y, Xia P, Yang F, Cao F, Ma K, Mi Z, et al. Whole blood and semen iden‑tification using mid‑infrared and Raman spectrum analysis for forensic applications. Anal Methods. 2016;8:3763–7.
56. Kozicki M, Creek DJ, Sexton A, Morahan BJ, Wesełucha‑Birczyńska A, Wood BR. An attenuated total reflection (ATR) and Raman spectroscopic investigation into the effects of chloroquine on Plasmodium falciparum‑infected red blood cells. Analyst. 2015;140:2236–46.
57. Frosch T, Koncarevic S, Becker K, Popp J. Morphology‑sensitive Raman modes of the malaria pigment hemozoin. Analyst. 2009;134:1126–32.
58. Chen K, Yuen C, Aniweh Y, Preiser P, Liu Q. Towards ultrasensitive malaria diagnosis using surface enhanced Raman spectroscopy. Sci Rep. 2016;6:20177.
59. Newman DM, Heptinstall J, Matelon RJ, Savage L, Wears ML, Beddow J, et al. A magneto‑optic route toward the in vivo diagnosis of malaria: preliminary results and preclinical trial data. Biophys J. 2008;95:994–1000.
60. Lasonder E, Ishihama Y, Andersen JS, Vermunt AMW, Pain A, Sauerwein RW, et al. Analysis of the Plasmodium falciparum proteome by high‑accuracy mass spectrometry. Nature. 2002;419:537–42.
61. Laxmeshwar SS, Madhu Kumar DJ, Viveka S, Nagaraja GK. Preparation and properties of biodegradable film composites using modified cellulose fibre‑reinforced with PVA. ISRN Polym Sci. 2012;2012:154314.
62. Pretsch E, Bühlmann P, Badertscher M. Structure determination of organic compounds: tables of spectral data. Berlin: Springer; 2009.
63. Tseroni M, Pervanidou D, Tserkezou P, Rachiotis G, Pinaka O, Baka A, et al. Field application of SD Bioline Malaria Ag Pf/Pan rapid diagnostic test for malaria in Greece. PLoS ONE. 2015;10:e0120367.
Publisher’s NoteSpringer Nature remains neutral with regard to jurisdictional claims in pub‑lished maps and institutional affiliations.