Identification of hot spots of malaria transmission for targeted malaria control
11
1764 • JID 2010:201 (1 June) • Bousema et al MAJOR ARTICLE Identification of Hot Spots of Malaria Transmission for Targeted Malaria Control Teun Bousema, 1,2 Chris Drakeley, 1 Samwel Gesase, 3 Ramadhan Hashim, 3 Stephen Magesa, 4 Frank Mosha, 5 Silas Otieno, 5 Ilona Carneiro, 1 Jonathan Cox, 1 Eliapendavyo Msuya, 4 Immo Kleinschmidt, 1 Caroline Maxwell, 1 Brian Greenwood, 1 Eleanor Riley, 1 Robert Sauerwein, 2 Daniel Chandramohan, 1 and Roly Gosling 1 1 Department of Infectious and Tropical Diseases, London School of Hygiene and Tropical Medicine, London, United Kingdom; 2 Department of Medical Microbiology, Radboud University Nijmegen Medical Centre, Nijmegen, The Netherlands; 3 National Institute for Medical Research (NIMR) Tanga Research Centre, Tanga, 4 NIMR Amani Research Centre, Amani, and 5 Kilimanjaro Clinical Research Institute, Kilimanjaro Christian Medical College, Moshi, Tanzania Background. Variation in the risk of malaria within populations is a frequently described but poorly understood phenomenon. This heterogeneity creates opportunities for targeted interventions but only if hot spots of malaria transmission can be easily identified. Methods. We determined spatial patterns in malaria transmission in a district in northeastern Tanzania, using malaria incidence data from a cohort study involving infants and household-level mosquito sampling data. The parasite prevalence rates and age-specific seroconversion rates (SCRs) of antibodies against Plasmodium falciparum antigens were determined in samples obtained from people attending health care facilities. Results. Five clusters of higher malaria incidence were detected and interpreted as hot spots of transmission. These hot spots partially overlapped with clusters of higher mosquito exposure but could not be satisfactorily predicted by a probability model based on environmental factors. Small-scale local variation in malaria exposure was detected by parasite prevalence rates and SCR estimates for samples of health care facility attendees. SCR estimates were strongly associated with local malaria incidence rates and predicted hot spots of malaria transmission with 95% sensitivity and 85% specificity. Conclusions. Serological markers were able to detect spatial variation in malaria transmission at the microepi- demiological level, and they have the potential to form an effective method for spatial targeting of malaria control efforts. Malaria risk is not equally distributed within popula- tions. In addition to the well-established age depen- dency of attacks of clinical malaria [1, 2], many studies report considerable variation in susceptibility to clinical malaria in individuals of the same age. In longitudinal Received 8 October 2009; accepted 17 December 2009; electronically published 22 April 2010. Potential conflicts of interest: none reported. Financial support: The IPTi Consortium and the Gates Malaria Partnership, both of which are supported by the Bill and Melinda Gates Foundation. T.B. is supported by a Gates Grand Challenges Exploration Grant (grant 51991) and a Rubicon fellowship from the Netherlands Organization for Scientific Research (NWO; Rubicon 825.08.025). C.D. is supported by a grant from the Wellcome Trust (grant 078925). The funders had no role in study design, data collection and analysis, decision to publish, or preparation of the manuscript. Reprints or correspondence: Teun Bousema, Dept of Infectious and Tropical Diseases, London School of Hygiene and Tropical Medicine, Keppel St, London WC1E 7HT, United Kingdom ([email protected]). The Journal of Infectious Diseases 2010; 201(11):1764–1774 2010 by the Infectious Diseases Society of America. All rights reserved. 0022-1899/2010/20111-0021$15.00 DOI: 10.1086/652456 studies, this variation in susceptibility is manifested as a high number of malaria episodes in a relatively small subset of study participants, while other study partic- ipants remain malaria free during follow-up [3–7]. This finding may be partly explained by such human host factors as red blood cell polymorphisms [2, 7–9], but variation in exposure to malaria-infected mosquitoes is likely to play a more important role [4, 7, 9–12]. The recent suggestion that noninfected individuals should be considered to be nonexposed [6] highlights the im- portance of heterogeneity in malaria exposure for un- derstanding observed disease patterns [9, 13, 14]. Un- derstanding heterogeneity in malaria exposure also creates opportunities for focused malaria control [14]. Focused malaria control will have direct benefits not just for the individuals who are included in the control effort but also at the community level. Individuals who are bitten most often are most likely to be infected and can amplify transmission by transmitting the malaria parasites to a large number of mosquitoes [15]. This by guest on October 21, 2016 http://jid.oxfordjournals.org/ Downloaded from
-
Upload
independent -
Category
Documents
-
view
1 -
download
0
Transcript of Identification of hot spots of malaria transmission for targeted malaria control
1764 • JID 2010:201 (1 June) • Bousema et al
M A J O R A R T I C L E
Identification of Hot Spots of Malaria Transmissionfor Targeted Malaria Control
Teun Bousema,1,2 Chris Drakeley,1 Samwel Gesase,3 Ramadhan Hashim,3 Stephen Magesa,4 Frank Mosha,5
Silas Otieno,5 Ilona Carneiro,1 Jonathan Cox,1 Eliapendavyo Msuya,4 Immo Kleinschmidt,1 Caroline Maxwell,1
Brian Greenwood,1 Eleanor Riley,1 Robert Sauerwein,2 Daniel Chandramohan,1 and Roly Gosling1
1Department of Infectious and Tropical Diseases, London School of Hygiene and Tropical Medicine, London, United Kingdom; 2Departmentof Medical Microbiology, Radboud University Nijmegen Medical Centre, Nijmegen, The Netherlands; 3National Institute for Medical Research(NIMR) Tanga Research Centre, Tanga, 4NIMR Amani Research Centre, Amani, and 5Kilimanjaro Clinical Research Institute, Kilimanjaro ChristianMedical College, Moshi, Tanzania
Background. Variation in the risk of malaria within populations is a frequently described but poorly understoodphenomenon. This heterogeneity creates opportunities for targeted interventions but only if hot spots of malariatransmission can be easily identified.
Methods. We determined spatial patterns in malaria transmission in a district in northeastern Tanzania, usingmalaria incidence data from a cohort study involving infants and household-level mosquito sampling data. Theparasite prevalence rates and age-specific seroconversion rates (SCRs) of antibodies against Plasmodium falciparumantigens were determined in samples obtained from people attending health care facilities.
Results. Five clusters of higher malaria incidence were detected and interpreted as hot spots of transmission.These hot spots partially overlapped with clusters of higher mosquito exposure but could not be satisfactorilypredicted by a probability model based on environmental factors. Small-scale local variation in malaria exposurewas detected by parasite prevalence rates and SCR estimates for samples of health care facility attendees. SCRestimates were strongly associated with local malaria incidence rates and predicted hot spots of malaria transmissionwith 95% sensitivity and 85% specificity.
Conclusions. Serological markers were able to detect spatial variation in malaria transmission at the microepi-demiological level, and they have the potential to form an effective method for spatial targeting of malaria controlefforts.
Malaria risk is not equally distributed within popula-
tions. In addition to the well-established age depen-
dency of attacks of clinical malaria [1, 2], many studies
report considerable variation in susceptibility to clinical
malaria in individuals of the same age. In longitudinal
Received 8 October 2009; accepted 17 December 2009; electronically published22 April 2010.
Potential conflicts of interest: none reported.Financial support: The IPTi Consortium and the Gates Malaria Partnership, both
of which are supported by the Bill and Melinda Gates Foundation. T.B. is supportedby a Gates Grand Challenges Exploration Grant (grant 51991) and a Rubiconfellowship from the Netherlands Organization for Scientific Research (NWO;Rubicon 825.08.025). C.D. is supported by a grant from the Wellcome Trust (grant078925). The funders had no role in study design, data collection and analysis,decision to publish, or preparation of the manuscript.
Reprints or correspondence: Teun Bousema, Dept of Infectious and TropicalDiseases, London School of Hygiene and Tropical Medicine, Keppel St, LondonWC1E 7HT, United Kingdom ([email protected]).
The Journal of Infectious Diseases 2010; 201(11):1764–1774� 2010 by the Infectious Diseases Society of America. All rights reserved.0022-1899/2010/20111-0021$15.00DOI: 10.1086/652456
studies, this variation in susceptibility is manifested as
a high number of malaria episodes in a relatively small
subset of study participants, while other study partic-
ipants remain malaria free during follow-up [3–7]. This
finding may be partly explained by such human host
factors as red blood cell polymorphisms [2, 7–9], but
variation in exposure to malaria-infected mosquitoes is
likely to play a more important role [4, 7, 9–12]. The
recent suggestion that noninfected individuals should
be considered to be nonexposed [6] highlights the im-
portance of heterogeneity in malaria exposure for un-
derstanding observed disease patterns [9, 13, 14]. Un-
derstanding heterogeneity in malaria exposure also
creates opportunities for focused malaria control [14].
Focused malaria control will have direct benefits not
just for the individuals who are included in the control
effort but also at the community level. Individuals who
are bitten most often are most likely to be infected and
can amplify transmission by transmitting the malaria
parasites to a large number of mosquitoes [15]. This
by guest on October 21, 2016
http://jid.oxfordjournals.org/D
ownloaded from
Hot Spots of Malaria Transmission • JID 2010:201 (1 June) • 1765
amplified transmission can lead to 2- to 4-fold increases in the
basic reproductive number of malaria parasites (R0) [13]. If
malaria control efforts can be targeted to individuals who con-
tribute disproportionally to malaria transmission, community
protection could be achieved by eliminating transmission in a
relatively small fraction of human hosts [15]. Such targeted
interventions are likely to become increasingly important tools
in malaria elimination efforts once transmission in an area has
decreased but is maintained in hot spots of malaria transmis-
sion [16]. Community-wide coverage with such control meth-
ods as insecticide-treated nets is difficult to achieve [17] and
may result in substantial reductions in transmission intensity
but not in malaria elimination [17, 18].
The identification of hot spots of malaria transmission is
important for malaria elimination efforts but is not straight-
forward. Several field studies have shown that proximity to
vector-breeding sites (eg, the distance to the nearest body of
water [7, 19–21] or other potential breeding site [22]) is cor-
related with the risk of malaria. However, this proximity is
unlikely to be the sole predictor of malaria risk, because there
is variation in the productivity and longevity of breeding sites
[23] and because the association can be confounded by house-
hold factors [7, 9, 19, 22, 24] and the vicinity of alternative
hosts, such as cattle [25]. A more direct indicator of increased
malaria risk would be exposure to infected mosquitoes or se-
rological evidence of malaria exposure in the human population
[26, 27]. To successfully target transmission hot spots, simple
tools are required to reliably identify these hot spots.
In the present study, we determine heterogeneity in exposure
to infected Anopheles mosquitoes in relation to the incidence
of malaria disease in infants residing in an area of moderate
transmission intensity in Tanzania. Rather than use a predictive
model at the level of an individual, we aim to identify restricted
geographical areas in which there is a higher level of trans-
mission intensity. To achieve this objective, we used environ-
mental and household factors to develop a model that predicts
the areas that form hot spots of transmission and to determine
the value of serological markers of malaria exposure for this
purpose.
METHODS
Study area. This study was conducted in the Korogwe district
in the Tanga region of Tanzania. Malaria transmission previ-
ously was intense and perennial [28], but it has decreased in
recent years. In 2007, it was estimated to be 1–14 infectious
bites per person per year [29]. The study protocols were ap-
proved by the ethics review board of the National Institute for
Medical Research of Tanzania and by the ethics committee of
the London School of Hygiene and Tropical Medicine.
Clusters of clinical malaria episodes as indicators of hot
spots of malaria transmission. We defined a hot spot of ma-
laria transmission as an area with a higher-than-average level
of transmission intensity, which is reflected by a higher in-
cidence of malaria episodes in infants. This definition differs
from biologically based transmission focus (defined as a geo-
graphical area where the local Anopheles population sustains
R0 to a level 11), for which it is difficult to establish param-
eters. The data that were used were from a longitudinal study
in which infants 8–16 weeks of age who attended Expanded
Programme on Immunization clinics were enrolled in a trial
of the efficacy of intermittent preventive treatment for malaria
in infants (IPTi) [30]. Enrolled children had access to free
clinical care for up to 2 years at local health care facilities.
No active case detection was done, but parents and caretakers
were encouraged to bring their children to health care facilities
if the children were unwell. Case patients had a recorded body
temperature of �37.5�C or a history of fever in the previous
2 days in the presence of malaria parasites. In the complete
cohort of 1276 children, who were monitored between 2004
and 2008, a total of 877 children (68.7%) had no malaria
episodes, 258 (20.1%) had 1–2 episodes, and 141 (11.1%) had
�3 clinical episodes (maximum number of episodes, 14).
Clusters of clinical malaria episodes were determined using
SaTScan software (version 8.0; developed under the joint aus-
pices of Martin Kulldorff of the National Cancer Institute and
Farzard Mostashari of the New York City Department of
Health and Mental Hygiene) to assess categorical data (0, 1–
2, or �3 episodes for individuals with �3 months of follow-
up). Because we aimed to identify clusters that would allow
small-scale targeting, a maximum window of 10% of the pop-
ulation was used for scanning clusters of malaria episodes.
Exposure to mosquitoes as a predictor of malaria risk. In
the last year of the longitudinal study, exposure to mosquitoes
was assessed in the bedrooms of a selection of the study chil-
dren. We aimed to determine mosquito exposure for 400 house-
holds whose child did not have an episode of malaria during
the 2 years under study (400 of 877 households), for 100 house-
holds whose child experienced 1–2 clinical malaria episodes
(100 of 258 households), and for 100 households whose child
experienced �3 clinical malaria episodes (100 of 141 house-
holds). Households were randomly selected from these sub-
groups by use of computer-randomized tables. Written in-
formed consent was obtained from the head of household.
Adult mosquitoes were sampled by Centers for Disease Control
light traps (model 512; John W. Hock Company), by use of
standard protocols [31]. Each household was sampled on 3 oc-
casions: at the end of the wet season (May), at the beginning
of the dry season (July), and at the end of the dry season
(September). Every night that sampling occurred, a median of
14 mosquito traps (interquartile range [IQR], 10–16 mosqui-
toes) were set in the study area. The order in which households
were sampled was determined by randomization in blocks, en-
by guest on October 21, 2016
http://jid.oxfordjournals.org/D
ownloaded from

1766
Figure 1. Reported malaria episodes during follow-up. Dots denote individual households with 1 person participating in passive case detection foran average of 22 months. The color and size of the dots denote the no. of episodes experienced. Circles denote statistically significant clusters A (8individuals [23.5%] had no episodes, 8 [23.5%] had 1–2 episodes, and 18 [52.9%] had �3 episodes) ( ), B (4 individuals [19.1%] had noP p .003episodes, 1 [4.8%] had 1–2 episodes, and 16 [76.2%] had �3 episodes) ( ), C (3 individuals [13.0%] had no episodes, 10 [43.5%] had 1–2P p .001episodes, and 10 [43.5%] had �3 episodes) ( ), D (0 individuals had no episodes, 2 [25.0%] had 1–2 episodes, and 6 [75.0%] had �3 episodes)P p .004( ), and E (7 [14.9%] individuals had no episodes, 22 [46.8%] had 1–2 episodes, and 18 [38.3%] had �3 episodes) ( ). For householdsP p .05 P p .001outside clusters, 315 (78.4%) reported no malaria episodes, 57 (14.2%) reported 1–2 episodes, and 30 (7.5%) reported �3 episodes.
by guest on October 21, 2016
http://jid.oxfordjournals.org/D
ownloaded from
1767
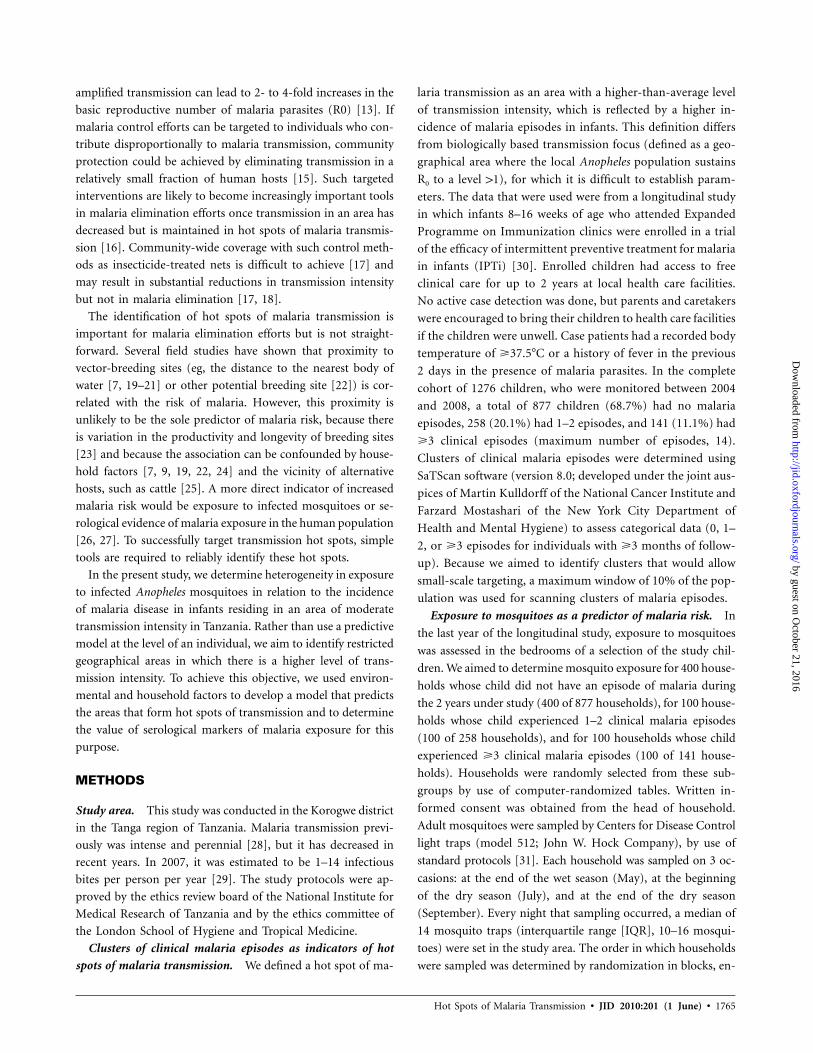
Figure 2. Exposure to Anopheles mosquitoes in April (the wet season) and clusters of mosquito exposure in April (the wet season), July (the startof the dry season), and September 2008 (the end of the dry season). Dots denote individual households. The color and size of the dots denote theno. of female Anopheles mosquitoes caught in a single night in the wet season, expressed in quintiles. Circles denote statistically significant clustersof exposure to female Anopheles mosquitoes in the wet season ( ) (brown), the beginning of the dry season ( ) (orange), and the end ofn p 2 n p 2the dry season ( ) (yellow).n p 3
by guest on October 21, 2016
http://jid.oxfordjournals.org/D
ownloaded from
1768 • JID 2010:201 (1 June) • Bousema et al
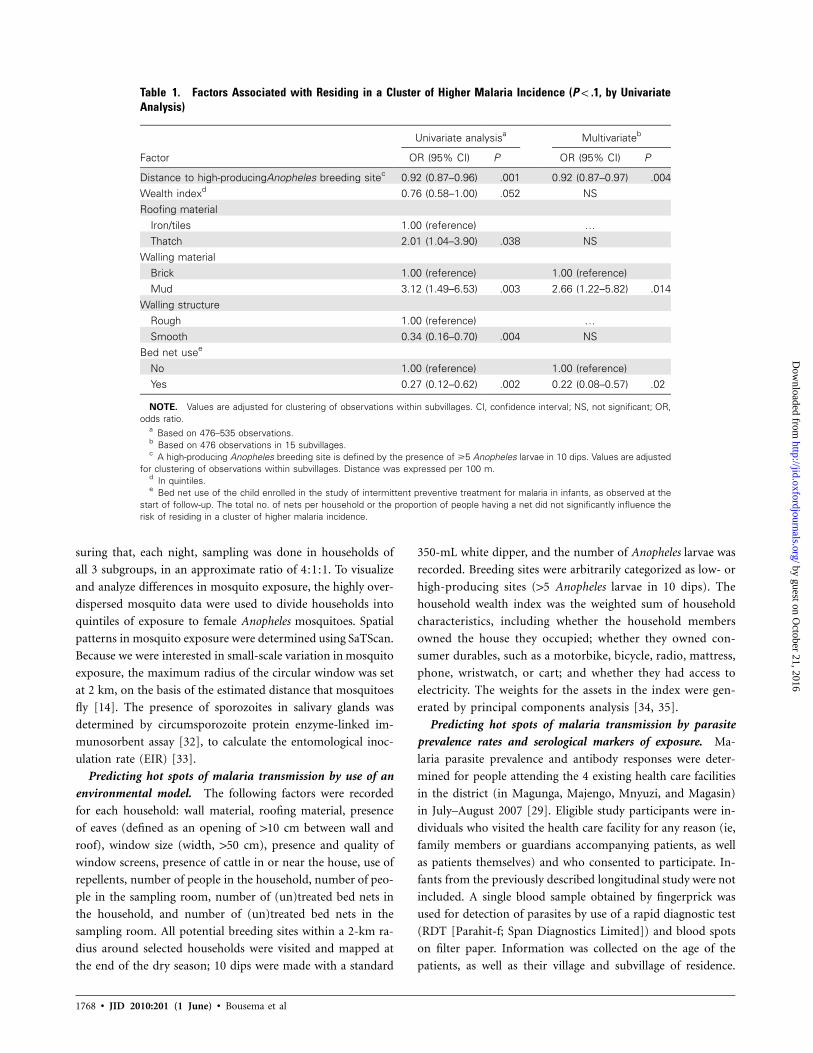
Table 1. Factors Associated with Residing in a Cluster of Higher Malaria Incidence ( , by UnivariateP ! .1Analysis)
Factor
Univariate analysisa Multivariateb
OR (95% CI) P OR (95% CI) P
Distance to high-producingAnopheles breeding sitec 0.92 (0.87–0.96) .001 0.92 (0.87–0.97) .004Wealth indexd 0.76 (0.58–1.00) .052 NSRoofing material
Iron/tiles 1.00 (reference) …Thatch 2.01 (1.04–3.90) .038 NS
Walling materialBrick 1.00 (reference) 1.00 (reference)Mud 3.12 (1.49–6.53) .003 2.66 (1.22–5.82) .014
Walling structureRough 1.00 (reference) …Smooth 0.34 (0.16–0.70) .004 NS
Bed net usee
No 1.00 (reference) 1.00 (reference)Yes 0.27 (0.12–0.62) .002 0.22 (0.08–0.57) .02
NOTE. Values are adjusted for clustering of observations within subvillages. CI, confidence interval; NS, not significant; OR,odds ratio.
a Based on 476–535 observations.b Based on 476 observations in 15 subvillages.c A high-producing Anopheles breeding site is defined by the presence of �5 Anopheles larvae in 10 dips. Values are adjusted
for clustering of observations within subvillages. Distance was expressed per 100 m.d In quintiles.e Bed net use of the child enrolled in the study of intermittent preventive treatment for malaria in infants, as observed at the
start of follow-up. The total no. of nets per household or the proportion of people having a net did not significantly influence therisk of residing in a cluster of higher malaria incidence.
suring that, each night, sampling was done in households of
all 3 subgroups, in an approximate ratio of 4:1:1. To visualize
and analyze differences in mosquito exposure, the highly over-
dispersed mosquito data were used to divide households into
quintiles of exposure to female Anopheles mosquitoes. Spatial
patterns in mosquito exposure were determined using SaTScan.
Because we were interested in small-scale variation in mosquito
exposure, the maximum radius of the circular window was set
at 2 km, on the basis of the estimated distance that mosquitoes
fly [14]. The presence of sporozoites in salivary glands was
determined by circumsporozoite protein enzyme-linked im-
munosorbent assay [32], to calculate the entomological inoc-
ulation rate (EIR) [33].
Predicting hot spots of malaria transmission by use of an
environmental model. The following factors were recorded
for each household: wall material, roofing material, presence
of eaves (defined as an opening of 110 cm between wall and
roof), window size (width, 150 cm), presence and quality of
window screens, presence of cattle in or near the house, use of
repellents, number of people in the household, number of peo-
ple in the sampling room, number of (un)treated bed nets in
the household, and number of (un)treated bed nets in the
sampling room. All potential breeding sites within a 2-km ra-
dius around selected households were visited and mapped at
the end of the dry season; 10 dips were made with a standard
350-mL white dipper, and the number of Anopheles larvae was
recorded. Breeding sites were arbitrarily categorized as low- or
high-producing sites (15 Anopheles larvae in 10 dips). The
household wealth index was the weighted sum of household
characteristics, including whether the household members
owned the house they occupied; whether they owned con-
sumer durables, such as a motorbike, bicycle, radio, mattress,
phone, wristwatch, or cart; and whether they had access to
electricity. The weights for the assets in the index were gen-
erated by principal components analysis [34, 35].
Predicting hot spots of malaria transmission by parasite
prevalence rates and serological markers of exposure. Ma-
laria parasite prevalence and antibody responses were deter-
mined for people attending the 4 existing health care facilities
in the district (in Magunga, Majengo, Mnyuzi, and Magasin)
in July–August 2007 [29]. Eligible study participants were in-
dividuals who visited the health care facility for any reason (ie,
family members or guardians accompanying patients, as well
as patients themselves) and who consented to participate. In-
fants from the previously described longitudinal study were not
included. A single blood sample obtained by fingerprick was
used for detection of parasites by use of a rapid diagnostic test
(RDT [Parahit-f; Span Diagnostics Limited]) and blood spots
on filter paper. Information was collected on the age of the
patients, as well as their village and subvillage of residence.
by guest on October 21, 2016
http://jid.oxfordjournals.org/D
ownloaded from
Hot Spots of Malaria Transmission • JID 2010:201 (1 June) • 1769
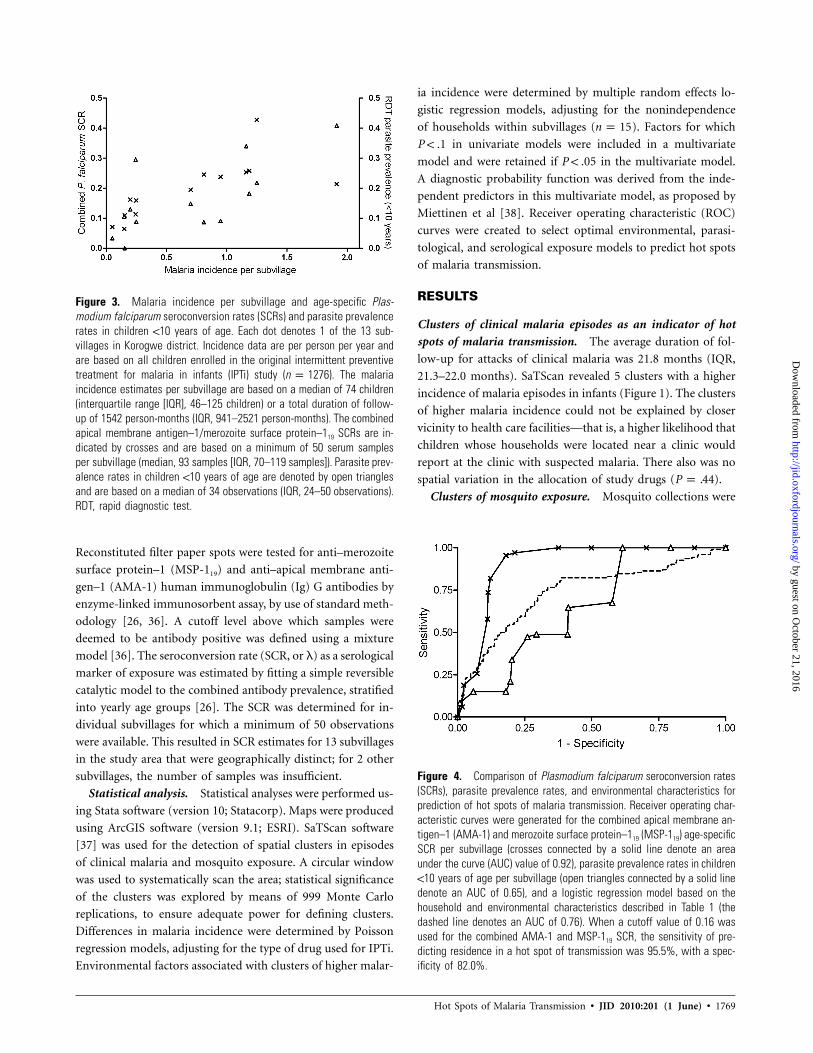
Figure 3. Malaria incidence per subvillage and age-specific Plas-modium falciparum seroconversion rates (SCRs) and parasite prevalencerates in children !10 years of age. Each dot denotes 1 of the 13 sub-villages in Korogwe district. Incidence data are per person per year andare based on all children enrolled in the original intermittent preventivetreatment for malaria in infants (IPTi) study ( ). The malarian p 1276incidence estimates per subvillage are based on a median of 74 children(interquartile range [IQR], 46–125 children) or a total duration of follow-up of 1542 person-months (IQR, 941–2521 person-months). The combinedapical membrane antigen–1/merozoite surface protein–119 SCRs are in-dicated by crosses and are based on a minimum of 50 serum samplesper subvillage (median, 93 samples [IQR, 70–119 samples]). Parasite prev-alence rates in children !10 years of age are denoted by open trianglesand are based on a median of 34 observations (IQR, 24–50 observations).RDT, rapid diagnostic test.
Figure 4. Comparison of Plasmodium falciparum seroconversion rates(SCRs), parasite prevalence rates, and environmental characteristics forprediction of hot spots of malaria transmission. Receiver operating char-acteristic curves were generated for the combined apical membrane an-tigen–1 (AMA-1) and merozoite surface protein–119 (MSP-119) age-specificSCR per subvillage (crosses connected by a solid line denote an areaunder the curve (AUC) value of 0.92), parasite prevalence rates in children!10 years of age per subvillage (open triangles connected by a solid linedenote an AUC of 0.65), and a logistic regression model based on thehousehold and environmental characteristics described in Table 1 (thedashed line denotes an AUC of 0.76). When a cutoff value of 0.16 wasused for the combined AMA-1 and MSP-119 SCR, the sensitivity of pre-dicting residence in a hot spot of transmission was 95.5%, with a spec-ificity of 82.0%.
Reconstituted filter paper spots were tested for anti–merozoite
surface protein–1 (MSP-119) and anti–apical membrane anti-
gen–1 (AMA-1) human immunoglobulin (Ig) G antibodies by
enzyme-linked immunosorbent assay, by use of standard meth-
odology [26, 36]. A cutoff level above which samples were
deemed to be antibody positive was defined using a mixture
model [36]. The seroconversion rate (SCR, or l) as a serological
marker of exposure was estimated by fitting a simple reversible
catalytic model to the combined antibody prevalence, stratified
into yearly age groups [26]. The SCR was determined for in-
dividual subvillages for which a minimum of 50 observations
were available. This resulted in SCR estimates for 13 subvillages
in the study area that were geographically distinct; for 2 other
subvillages, the number of samples was insufficient.
Statistical analysis. Statistical analyses were performed us-
ing Stata software (version 10; Statacorp). Maps were produced
using ArcGIS software (version 9.1; ESRI). SaTScan software
[37] was used for the detection of spatial clusters in episodes
of clinical malaria and mosquito exposure. A circular window
was used to systematically scan the area; statistical significance
of the clusters was explored by means of 999 Monte Carlo
replications, to ensure adequate power for defining clusters.
Differences in malaria incidence were determined by Poisson
regression models, adjusting for the type of drug used for IPTi.
Environmental factors associated with clusters of higher malar-
ia incidence were determined by multiple random effects lo-
gistic regression models, adjusting for the nonindependence
of households within subvillages ( ). Factors for whichn p 15
in univariate models were included in a multivariateP ! .1
model and were retained if in the multivariate model.P ! .05
A diagnostic probability function was derived from the inde-
pendent predictors in this multivariate model, as proposed by
Miettinen et al [38]. Receiver operating characteristic (ROC)
curves were created to select optimal environmental, parasi-
tological, and serological exposure models to predict hot spots
of malaria transmission.
RESULTS
Clusters of clinical malaria episodes as an indicator of hot
spots of malaria transmission. The average duration of fol-
low-up for attacks of clinical malaria was 21.8 months (IQR,
21.3–22.0 months). SaTScan revealed 5 clusters with a higher
incidence of malaria episodes in infants (Figure 1). The clusters
of higher malaria incidence could not be explained by closer
vicinity to health care facilities—that is, a higher likelihood that
children whose households were located near a clinic would
report at the clinic with suspected malaria. There also was no
spatial variation in the allocation of study drugs ( ).P p .44
Clusters of mosquito exposure. Mosquito collections were
by guest on October 21, 2016
http://jid.oxfordjournals.org/D
ownloaded from
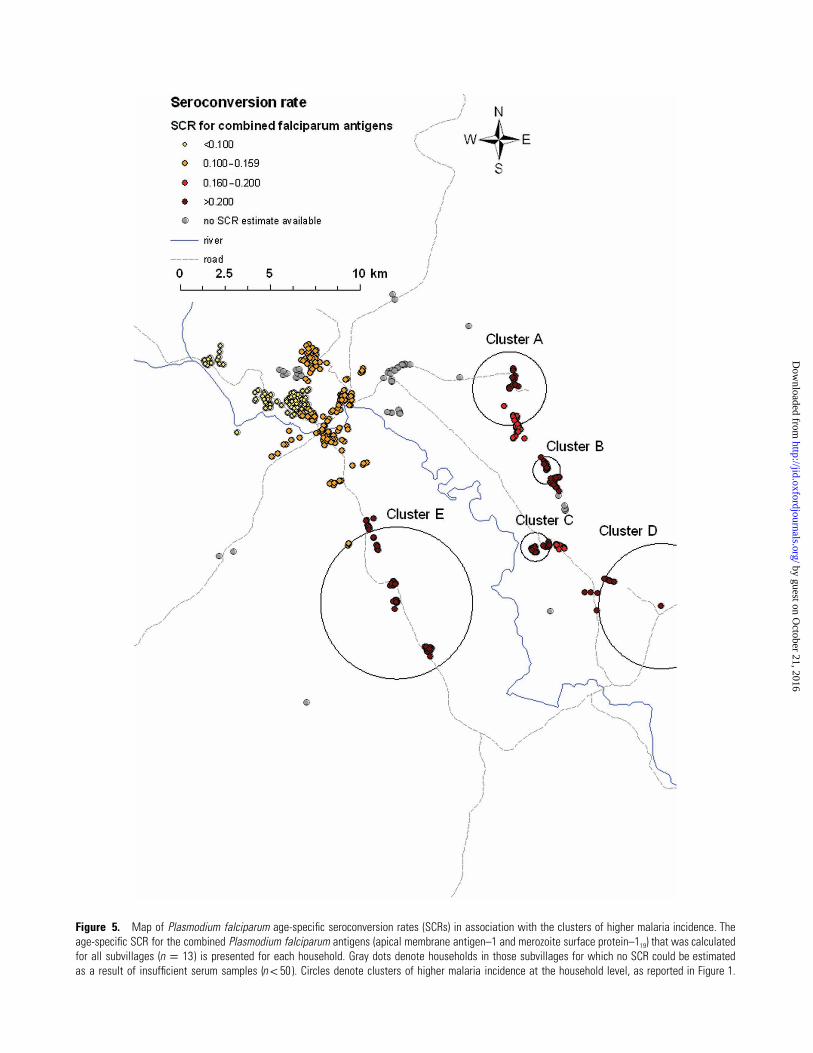
Figure 5. Map of Plasmodium falciparum age-specific seroconversion rates (SCRs) in association with the clusters of higher malaria incidence. Theage-specific SCR for the combined Plasmodium falciparum antigens (apical membrane antigen–1 and merozoite surface protein–119) that was calculatedfor all subvillages ( ) is presented for each household. Gray dots denote households in those subvillages for which no SCR could be estimatedn p 13as a result of insufficient serum samples ( ). Circles denote clusters of higher malaria incidence at the household level, as reported in Figure 1.n ! 50
by guest on October 21, 2016
http://jid.oxfordjournals.org/D
ownloaded from
Hot Spots of Malaria Transmission • JID 2010:201 (1 June) • 1771
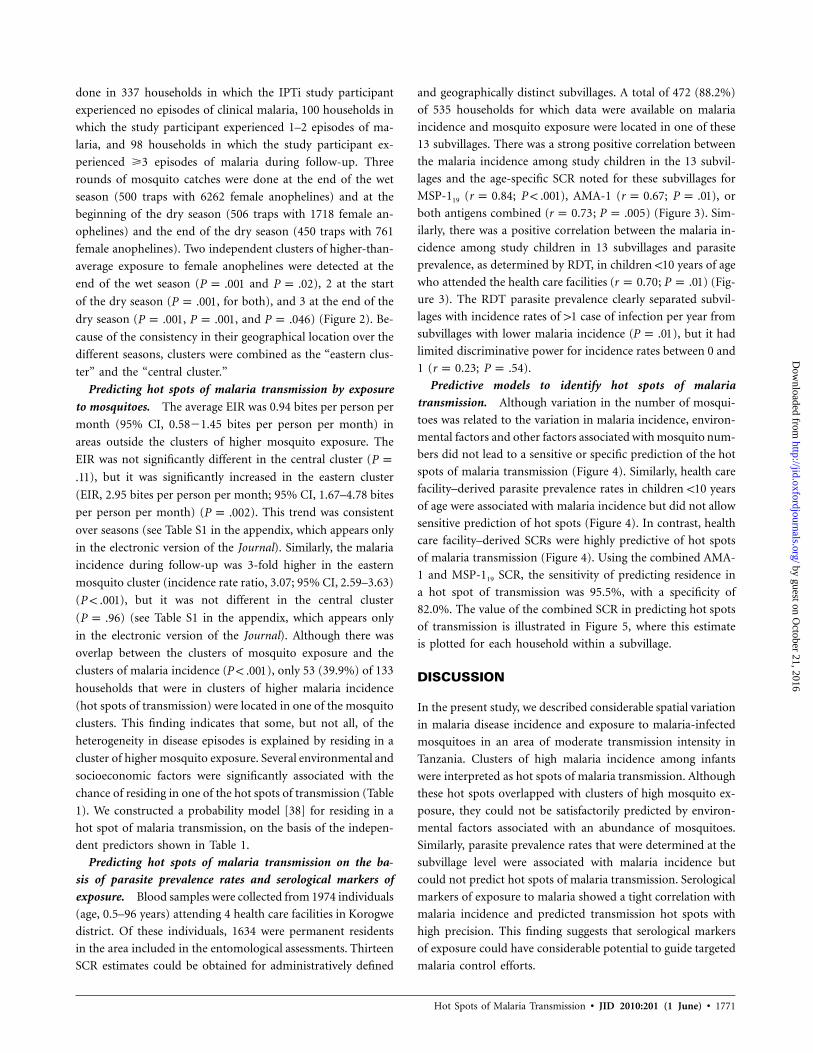
done in 337 households in which the IPTi study participant
experienced no episodes of clinical malaria, 100 households in
which the study participant experienced 1–2 episodes of ma-
laria, and 98 households in which the study participant ex-
perienced �3 episodes of malaria during follow-up. Three
rounds of mosquito catches were done at the end of the wet
season (500 traps with 6262 female anophelines) and at the
beginning of the dry season (506 traps with 1718 female an-
ophelines) and the end of the dry season (450 traps with 761
female anophelines). Two independent clusters of higher-than-
average exposure to female anophelines were detected at the
end of the wet season ( and ), 2 at the startP p .001 P p .02
of the dry season ( , for both), and 3 at the end of theP p .001
dry season ( , , and ) (Figure 2). Be-P p .001 P p .001 P p .046
cause of the consistency in their geographical location over the
different seasons, clusters were combined as the “eastern clus-
ter” and the “central cluster.”
Predicting hot spots of malaria transmission by exposure
to mosquitoes. The average EIR was 0.94 bites per person per
month (95% CI, 0.58�1.45 bites per person per month) in
areas outside the clusters of higher mosquito exposure. The
EIR was not significantly different in the central cluster (P p
), but it was significantly increased in the eastern cluster.11
(EIR, 2.95 bites per person per month; 95% CI, 1.67–4.78 bites
per person per month) ( ). This trend was consistentP p .002
over seasons (see Table S1 in the appendix, which appears only
in the electronic version of the Journal). Similarly, the malaria
incidence during follow-up was 3-fold higher in the eastern
mosquito cluster (incidence rate ratio, 3.07; 95% CI, 2.59–3.63)
( ), but it was not different in the central clusterP ! .001
( ) (see Table S1 in the appendix, which appears onlyP p .96
in the electronic version of the Journal). Although there was
overlap between the clusters of mosquito exposure and the
clusters of malaria incidence ( ), only 53 (39.9%) of 133P ! .001
households that were in clusters of higher malaria incidence
(hot spots of transmission) were located in one of the mosquito
clusters. This finding indicates that some, but not all, of the
heterogeneity in disease episodes is explained by residing in a
cluster of higher mosquito exposure. Several environmental and
socioeconomic factors were significantly associated with the
chance of residing in one of the hot spots of transmission (Table
1). We constructed a probability model [38] for residing in a
hot spot of malaria transmission, on the basis of the indepen-
dent predictors shown in Table 1.
Predicting hot spots of malaria transmission on the ba-
sis of parasite prevalence rates and serological markers of
exposure. Blood samples were collected from 1974 individuals
(age, 0.5–96 years) attending 4 health care facilities in Korogwe
district. Of these individuals, 1634 were permanent residents
in the area included in the entomological assessments. Thirteen
SCR estimates could be obtained for administratively defined
and geographically distinct subvillages. A total of 472 (88.2%)
of 535 households for which data were available on malaria
incidence and mosquito exposure were located in one of these
13 subvillages. There was a strong positive correlation between
the malaria incidence among study children in the 13 subvil-
lages and the age-specific SCR noted for these subvillages for
MSP-119 ( ; ), AMA-1 ( ; ), orr p 0.84 P ! .001 r p 0.67 P p .01
both antigens combined ( ; ) (Figure 3). Sim-r p 0.73 P p .005
ilarly, there was a positive correlation between the malaria in-
cidence among study children in 13 subvillages and parasite
prevalence, as determined by RDT, in children !10 years of age
who attended the health care facilities ( ; ) (Fig-r p 0.70 P p .01
ure 3). The RDT parasite prevalence clearly separated subvil-
lages with incidence rates of 11 case of infection per year from
subvillages with lower malaria incidence ( ), but it hadP p .01
limited discriminative power for incidence rates between 0 and
1 ( ; ).r p 0.23 P p .54
Predictive models to identify hot spots of malaria
transmission. Although variation in the number of mosqui-
toes was related to the variation in malaria incidence, environ-
mental factors and other factors associated with mosquito num-
bers did not lead to a sensitive or specific prediction of the hot
spots of malaria transmission (Figure 4). Similarly, health care
facility–derived parasite prevalence rates in children !10 years
of age were associated with malaria incidence but did not allow
sensitive prediction of hot spots (Figure 4). In contrast, health
care facility–derived SCRs were highly predictive of hot spots
of malaria transmission (Figure 4). Using the combined AMA-
1 and MSP-119 SCR, the sensitivity of predicting residence in
a hot spot of transmission was 95.5%, with a specificity of
82.0%. The value of the combined SCR in predicting hot spots
of transmission is illustrated in Figure 5, where this estimate
is plotted for each household within a subvillage.
DISCUSSION
In the present study, we described considerable spatial variation
in malaria disease incidence and exposure to malaria-infected
mosquitoes in an area of moderate transmission intensity in
Tanzania. Clusters of high malaria incidence among infants
were interpreted as hot spots of malaria transmission. Although
these hot spots overlapped with clusters of high mosquito ex-
posure, they could not be satisfactorily predicted by environ-
mental factors associated with an abundance of mosquitoes.
Similarly, parasite prevalence rates that were determined at the
subvillage level were associated with malaria incidence but
could not predict hot spots of malaria transmission. Serological
markers of exposure to malaria showed a tight correlation with
malaria incidence and predicted transmission hot spots with
high precision. This finding suggests that serological markers
of exposure could have considerable potential to guide targeted
malaria control efforts.
by guest on October 21, 2016
http://jid.oxfordjournals.org/D
ownloaded from
1772 • JID 2010:201 (1 June) • Bousema et al
In our cohort of children, we observed considerable vari-
ation in the number of reported malaria attacks. Although
two-thirds of the children experienced no clinical malaria
episodes during follow-up, 10% experienced 3–14 episodes.
This phenomenon is widely reported [3–7, 39], and host ge-
netic factors may account for approximately one-fourth of
this variation [39]. An individual-based model for malaria
risk should therefore take into account genetic regulators of
disease risk. When geographical clusters of disease incidence
are studied at the level of (sub-) villages in a genetically ho-
mogeneous area, much of this variation in disease risk will
be the result of heterogeneity in exposure to malaria-infected
mosquitoes. We observed in the study area 5 spatial clusters
of higher malaria disease incidence that we interpreted as hot
spots of malaria transmission. These hot spots partially over-
lapped with 2 clusters of higher-than-average exposure to Anoph-
eles mosquitoes. Small-scale heterogeneity in mosquito expo-
sure has been described elsewhere [12, 40, 41]. The extensive
sampling of mosquitoes in our study allowed us to determine
the EIR inside and outside the Anopheles clusters. The EIR in
one of these clusters was 2- to 3-fold higher than that in house-
holds outside the clusters; the other was characterized by a
higher exposure to Anopheles mosquitoes but not by a statis-
tically significant higher EIR. In line with this, malaria incidence
was increased in the former but not in the latter cluster. This
indicates that a higher exposure to mosquitoes is related to,
but not sufficient for, a higher incidence of malaria disease:
some households are disproportionally exposed to Anopheles
mosquitoes but not to infected mosquitoes.
Distance to the nearest breeding site [7, 14, 19–22, 42],
walling material [43], and bed net coverage [7] were inde-
pendent predictors of living in a hot spot of malaria trans-
mission. These were biologically plausible predictors of ma-
laria incidence and are likely to play an important role in de-
termining the risk of malaria at the level of individuals. However,
a probability model based on these 3 factors had limited dis-
criminating value in predicting hot spots of malaria transmission
(ie, spatial variation in the factors was not strongly related to
spatial variation in malaria incidence at subvillage level). In con-
trast to this model based on environmental factors, serological
markers of malaria exposure proved to be a sensitive and straight-
forward tool to identify small geographical areas with higher
malaria transmission intensity. Serological markers of exposure
previously were used to compare the level of malaria transmission
intensity of different regions [26, 27, 44]; the current data indicate
they can also be used at the microepidemiological level [20].
In our study, hot spots of malaria transmission could be
predicted with a sensitivity of 95% and a specificity of 82% by
the SCR based on the combined AMA-1 and MSP-119 antibody
responses. Perfect prediction of these hot spots would have
been impossible because of our simplistic approach, in which
we tried to associate SCR estimates on the subvillage level with
clusters of higher malaria incidence on the level of clusters of
households. As a consequence, some subvillages were only
partly in a cluster of higher malaria incidence, thereby reducing
the sensitivity and specificity of SCR estimates. In addition to
its higher discriminative value, the SCR approach has several
logistical advantages over models based on environmental fac-
tors. There is no need to visit individual households, examine
mosquito breeding sites, or undertake the tedious process of
sampling adult mosquitoes. Because of the longevity of anti-
body responses, SCR estimates are less susceptible to seasonal
fluctuations in malaria exposure than either a direct estimate
of EIR or parasite prevalence data [26, 27], and they are par-
ticularly useful in areas of low endemicity, where parasite prev-
alence rates are low. Because of the longevity of antibody re-
sponses, our findings indicate that hot spots of transmission
were remarkably stable over time. Parasite rates are important
indicators of global disease burden [45], but they have poor
discriminative value at lower levels of endemicity [46], as sup-
ported by our study.
A single cross-sectional survey or health care center–based
survey would be sufficient to obtain the relevant information
for SCR estimates [29]. A disadvantage of the current approach
is that there is a limit to the resolution for which an SCR
estimate can be obtained. The nature of the model, requiring
multiple observations from each age group, makes it impossible
to calculate household-specific SCRs, although this would be
possible for groups of households. This could be considered in
areas that are close to achieving malaria elimination and where
malaria is likely to be maintained in a few foci of transmission.
Sampling at the health care facility level will allow strategic
planning of malaria control efforts within districts at the level
of the smallest administrative unit.
Evidently, the SCR estimates above which areas will qualify
for expanded malaria control efforts will be dependent on the
level of transmission intensity in an area and therefore will be
site specific. The tight correlation with malaria incidence and
EIR [26, 44] will allow for a rational determination of an SCR
above which areas are included in extended malaria control
efforts for various levels of malaria endemicity.
Acknowledgments
We thank the study participants, the health care staff in the study area,the district medical officers, council health management teams, districtcouncils in Korogwe district, and the regional medical officers in the TangaRegion for their support and participation in the study. We thank JamesBeard for continuous database support and geographical information sys-tem work, Emmanuel Simbua of Tea Research Institute of Tanzania’s Mar-ikitanda Tea Research Meteorological Station in Amani (East Usambara)for providing rainfall data, Jamie Griffin (Imperial College, London, UnitedKingdom) for statistical advice, Rebecca Steinbach and Chris Grundy (Lon-don School of Hygiene and Tropical Medicine, London [LSHTM], UnitedKingdom) for assistance in mapping, and Laveta Stewart (LSHTM) for
by guest on October 21, 2016
http://jid.oxfordjournals.org/D
ownloaded from
Hot Spots of Malaria Transmission • JID 2010:201 (1 June) • 1773
serological assessments. We thank all the partners in the Joint MalariaProgram, the IPTi Consortium, and the National Malaria Control Programfor guidance and support.
References
1. Mwangi TW, Ross A, Snow RW, Marsh K. Case definitions of clinicalmalaria under different transmission conditions in Kilifi District,Kenya. J Infect Dis 2005; 191:1932–9.
2. Rogier C, Trape JF. Malaria attack in children exposed to high trans-mission: who is protected? Trans R Soc Trop Med Hyg 1993; 87:245–6.
3. Alonso PL, Sacarlal J, Aponte JJ, et al. Duration of protection withRTS,S/AS02A malaria vaccine in prevention of Plasmodium falciparumdisease in Mozambican children: single-blind extended follow-up of arandomised controlled trial. Lancet 2005; 366:2012–18.
4. Mwangi TW, Fegan G, Williams TN, Kinyanjui SM, Snow RW, MarshK. Evidence for over-dispersion in the distribution of clinical malariaepisodes in children. PLoS ONE 2008; 3:e2196.
5. Creasey A, Giha H, Hamad AA, El Hassan IM, Theander TG, Arnot DE.Eleven years of malaria surveillance in a Sudanese village highlights un-expected variation in individual disease susceptibility and outbreak se-verity. Parasitology 2004; 129:263–71.
6. Bejon P, Warimwe G, Mackintosh CL, et al. Analysis of immunity tofebrile malaria in children that distinguishes immunity from lack ofexposure. Infect Immun 2009; 77:1917–23.
7. Clark TD, Greenhouse B, Njama-Meya D, et al. Factors determiningthe heterogeneity of malaria incidence in children in Kampala, Uganda.J Infect Dis 2008; 198:393–400.
8. Williams TN. Human red blood cell polymorphisms and malaria. CurrOpin Microbiol 2006; 9:388–94.
9. Greenwood BM. The microepidemiology of malaria and its importanceto malaria control. Trans R Soc Trop Med Hyg 1989; 83:25–9.
10. Elissa N, Migot-Nabias F, Luty A, et al. Relationship between ento-mological inoculation rate, Plasmodium falciparum prevalence rate, andincidence of malaria attack in rural Gabon. Acta Trop 2003; 85:355–61.
11. Gaudart J, Poudiougou B, Dicko A, et al. Space-time clustering of child-hood malaria at the household level: a dynamic cohort in a Mali village.BMC Public Health 2006; 6:286.
12. Machault V, Gadiaga L, Vignolles C, et al. Highly focused anophelinebreeding sites and malaria transmission in Dakar. Malar J 2009; 8:138.
13. Woolhouse ME, Dye C, Etard JF, et al. Heterogeneities in the trans-mission of infectious agents: implications for the design of control pro-grams. Proc Natl Acad Sci U S A 1997; 94:338–42.
14. Carter R, Mendis KN, Roberts D. Spatial targeting of interventionsagainst malaria. Bull World Health Organ 2000; 78:1401–11.
15. Smith DL, McKenzie FE, Snow RW, Hay SI. Revisiting the basic re-productive number for malaria and its implications for malaria con-trol. PLoS Biol 2007; 5:e42.
16. World Health Organization. Global malaria control and elimination:report of a technical review. http://www.who.int/malaria/publications/atoz/9789241596756/en/]. Accessed 6 April 2010. Geneva: WorldHealth Organization, 2008.
17. Fegan GW, Noor AM, Akhwale WS, Cousens S, Snow RW. Effect ofexpanded insecticide-treated bednet coverage on child survival in ru-ral Kenya: a longitudinal study. Lancet 2007; 370:1035–9.
18. Bhattarai A, Ali AS, Kachur SP, et al. Impact of artemisinin-basedcombination therapy and insecticide-treated nets on malaria burdenin Zanzibar. PLoS Med 2007; 4:e309.
19. Oesterholt MJ, Bousema JT, Mwerinde OK, et al. Spatial and temporalvariation in malaria transmission in a low endemicity area in northernTanzania. Malar J 2006; 5:98.
20. Wilson S, Booth M, Jones FM, et al. Age-adjusted Plasmodium falci-parum antibody levels in school-aged children are a stable marker of mi-crogeographical variations in exposure to Plasmodium infection. BMCInfect Dis 2007; 7:67.
21. Staedke SG, Nottingham EW, Cox J, Kamya MR, Rosenthal PJ, DorseyG. Short report: proximity to mosquito breeding sites as a risk factorfor clinical malaria episodes in an urban cohort of Ugandan children.Am J Trop Med Hyg 2003; 69:244–6.
22. Kreuels B, Kobbe R, Adjei S, et al. Spatial variation of malaria incidencein young children from a geographically homogeneous area with highendemicity. J Infect Dis 2008; 197:85–93.
23. Fillinger U, Sombroek H, Majambere S, van Loon E, Takken W, LindsaySW. Identifying the most productive breeding sites for malaria mos-quitoes in The Gambia. Malar J 2009; 8:62.
24. Gamage-Mendis AC, Carter R, Mendis C, De Zoysa AP, Herath PR,Mendis KN. Clustering of malaria infections within an endemic pop-ulation: risk of malaria associated with the type of housing construc-tion. Am J Trop Med Hyg 1991; 45:77–85.
25. Molineaux L, Gramiccia G. The Garki Project. Research on the epi-demiology and control of malaria in the Sudan savannah of West Africa.Document 78/4320/1–6000. Geneva: World Health Organization 1980.
26. Drakeley CJ, Corran PH, Coleman PG, et al. Estimating medium- andlong-term trends in malaria transmission by using serological markersof malaria exposure. Proc Natl Acad Sci U S A 2005; 102:5108–13.
27. Corran P, Coleman P, Riley E, Drakeley C. Serology: a robust indicatorof malaria transmission intensity? Trends Parasitol 2007; 23:575–82.
28. Maxwell CA, Chambo W, Mwaimu M, Magogo F, Carneiro IA, Cur-tis CF. Variation of malaria transmission and morbidity with altitudein Tanzania and with introduction of alphacypermethrin treated nets.Malar J 2003; 2:28.
29. Stewart L, Gosling R, Griffin J, et al. Rapid assessment of malaria trans-mission using age-specific sero-conversion rates. PLoS One 2009; 4:e6083
30. Gosling R, Gesase S, Mosha J, et al. Protective efficacy and safety ofthree antimalarial regimens for intermittent preventive treatment formalaria in infants: a randomised, placebo-controlled trial. Lancet 2009;374:1521–32.
31. Mboera LE, Kihonda J, Braks MA, Knols BG. Influence of centers fordisease control light trap position, relative to a human-baited bed net,on catches of Anopheles gambiae and Culex quinquefasciatus in Tan-zania. Am J Trop Med Hyg 1998; 59:595–6.
32. Wirtz RA, Burkot TR, Graves PM, Andre RG. Field evaluation of enzyme-linked immunosorbent assays for Plasmodium falciparum and Plasmo-dium vivax sporozoites in mosquitoes (Diptera: Culicidae) from PapuaNew Guinea. J Med Entomol 1987; 24:433–7.
33. Drakeley C, Schellenberg D, Kihonda J, et al. An estimation of the en-tomological inoculation rate for Ifakara: a semi-urban area in a regionof intense malaria transmission in Tanzania. Trop Med Int Health 2003;8:767–74.
34. Filmer D, Pritchett LH. Estimating wealth effects without expendituredata–or tears: an application to educational enrollments in states of In-dia. Demography 2001; 38:115–32.
35. Armstrong Schellenberg JR, Mrisho M, Manzi F, et al. Health andsurvival of young children in southern Tanzania. BMC Public Health2008; 8:194.
36. Corran PH, Cook J, Lynch C, et al. Dried blood spots as a source ofanti-malarial antibodies for epidemiological studies. Malar J 2008; 7:195.
37. SaTScan T. http://www.satscan.org/. Accessed 7 April 2010.38. Miettinen OS, Henschke CI, Yankelevitz DF. Evaluation of diagnostic
imaging tests: diagnostic probability estimation. J Clin Epidemiol 1998;51:1293–8.
39. Mackinnon MJ, Mwangi TW, Snow RW, Marsh K, Williams TN. Her-itability of malaria in Africa. PLoS Med 2005; 2:e340.
40. Smith T, Charlwood JD, Takken W, Tanner M, Spiegelhalter DJ. Map-ping the densities of malaria vectors within a single village. Acta Trop1995; 59:1–18.
41. Hii JL, Smith T, Mai A, et al. Spatial and temporal variation in abun-dance of Anopheles (Diptera: Culicidae) in a malaria endemic area inPapua New Guinea. J Med Entomol 1997; 34:193–205.
42. Trape JF, Lefebvre-Zante E, Legros F, et al. Vector density gradients
by guest on October 21, 2016
http://jid.oxfordjournals.org/D
ownloaded from

1774 • JID 2010:201 (1 June) • Bousema et al
and the epidemiology of urban malaria in Dakar, Senegal. Am J TropMed Hyg 1992; 47:181–9.
43. Somi MF, Butler JR, Vahid F, Njau J, Kachur SP, Abdulla S. Is thereevidence for dual causation between malaria and socioeconomic status?Findings from rural Tanzania. Am J Trop Med Hyg 2007; 77:1020–7.
44. Mwanziva C, Shekalaghe S, Ndaro A, et al. Overuse of artemisinin-
combination therapy in Mto wa Mbu (river of mosquitoes), an areamisinterpreted as high endemic for malaria. Malar J 2008; 7:232.
45. Hay SI, Snow RW. The malaria Atlas Project: developing global mapsof malaria risk. PLoS Med 2006; 3:e473.
46. Hay SI, Smith DL, Snow RW. Measuring malaria endemicity fromintense to interrupted transmission. Lancet Infect Dis 2008; 8:369–78.
by guest on October 21, 2016
http://jid.oxfordjournals.org/D
ownloaded from