Effect of Variety on Rehydration Characteristics of Dried Apples
21
processes Article Effect of Variety on Rehydration Characteristics of Dried Apples Krzysztof Górnicki * , Aneta Choi ´ nska and Agnieszka Kaleta Institute of Mechanical Engineering, Warsaw University of Life Sciences, 02-787 Warsaw, Poland; [email protected] (A.C.); [email protected] (A.K.) * Correspondence: [email protected] Received: 14 October 2020; Accepted: 11 November 2020; Published: 13 November 2020 Abstract: The effect of dried apple varieties on their rehydration characteristics was investigated. Four varieties of apples, Champion, Cortland, Grey Reinette and Ligol, were taken into consideration. Rehydration properties and color of apples were investigated. In order to examine the influence of apple variety on its rehydration properties, the process of rehydration was modeled. The model parameters obtained for investigated apple varieties were compared. Apple cubes were dried in a tunnel dryer (air temperature 60 ◦ C and air velocity 2 m/s) and next rehydrated in distilled water at temperature: 20, 45 and 70 ◦ C. Mass, dry matter mass, volume and color attributes of apples (raw, dried and rehydrated) were measured. The process of rehydration was modeled using empirical (Peleg and Weibull models) and theoretical (the Fick’s second law) models. Results of the analysis showed that the apple variety affects values of mass and volume increase, dry matter decrease and color of the rehydrated apple. Discussed parameters were also affected by rehydration temperature. Fick’s second law model can be considered as the most appropriate. Apple variety and rehydration temperature influenced the values of the model’s constants. Obtained values enabled attempts of the explanation of the rehydration course. It can be stated that apple var. Champion showed a greater rate of water absorption during the entire process of rehydration than other investigated varieties. Keywords: apple; variety; material properties; rehydration; color 1. Introduction Rehydration belongs to one of the most significant quality properties of dehydrated foods. The quick and complete process of rehydration can lead to a reduction of labor costs and floor-space requirements and, very importantly, to improving the efficiency of production [1]. Moreover, some of the dried food products are consumed after their rehydrating (in milk or fruit juices). Therefore, a better understanding of the discussed process can cause the quality improvement of both dried and rehydrated products [2,3]. Rehydration is a complex process intended to restore the properties of the raw food product by contacting the dried product with liquid [4]. It can be assumed that during the described process, the following processes take place simultaneously: absorption of liquid by the dehydrated product, swelling of the rehydrated material and leaching of the solutes (vitamins, minerals, sugars, acids) from the product to the rehydrating medium. The kinetics of the mass transfer mechanisms depends on the rehydrating liquid [5,6]. Pre-drying treatments, drying and rehydration cause the changes in structure and composition of product tissue, which result in worsening of reconstitution characteristics. Rehydration can be, therefore, treated as a measure of the degree of alternations taking place during processing [7,8]. The effect of different parameters of pre-drying treatments, subsequent drying and rehydration on rehydration characteristics of food products has been widely investigated in the literature. Some examples are given below. Processes 2020, 8, 1454; doi:10.3390/pr8111454 www.mdpi.com/journal/processes
-
Upload
khangminh22 -
Category
Documents
-
view
3 -
download
0
Transcript of Effect of Variety on Rehydration Characteristics of Dried Apples

processes
Article
Effect of Variety on Rehydration Characteristics ofDried Apples
Krzysztof Górnicki * , Aneta Choinska and Agnieszka Kaleta
Institute of Mechanical Engineering, Warsaw University of Life Sciences, 02-787 Warsaw, Poland;[email protected] (A.C.); [email protected] (A.K.)* Correspondence: [email protected]
Received: 14 October 2020; Accepted: 11 November 2020; Published: 13 November 2020 �����������������
Abstract: The effect of dried apple varieties on their rehydration characteristics was investigated.Four varieties of apples, Champion, Cortland, Grey Reinette and Ligol, were taken into consideration.Rehydration properties and color of apples were investigated. In order to examine the influence ofapple variety on its rehydration properties, the process of rehydration was modeled. The modelparameters obtained for investigated apple varieties were compared. Apple cubes were dried in atunnel dryer (air temperature 60 ◦C and air velocity 2 m/s) and next rehydrated in distilled waterat temperature: 20, 45 and 70 ◦C. Mass, dry matter mass, volume and color attributes of apples(raw, dried and rehydrated) were measured. The process of rehydration was modeled using empirical(Peleg and Weibull models) and theoretical (the Fick’s second law) models. Results of the analysisshowed that the apple variety affects values of mass and volume increase, dry matter decrease andcolor of the rehydrated apple. Discussed parameters were also affected by rehydration temperature.Fick’s second law model can be considered as the most appropriate. Apple variety and rehydrationtemperature influenced the values of the model’s constants. Obtained values enabled attempts of theexplanation of the rehydration course. It can be stated that apple var. Champion showed a greaterrate of water absorption during the entire process of rehydration than other investigated varieties.
Keywords: apple; variety; material properties; rehydration; color
1. Introduction
Rehydration belongs to one of the most significant quality properties of dehydrated foods.The quick and complete process of rehydration can lead to a reduction of labor costs and floor-spacerequirements and, very importantly, to improving the efficiency of production [1]. Moreover, some ofthe dried food products are consumed after their rehydrating (in milk or fruit juices). Therefore, a betterunderstanding of the discussed process can cause the quality improvement of both dried and rehydratedproducts [2,3]. Rehydration is a complex process intended to restore the properties of the raw foodproduct by contacting the dried product with liquid [4]. It can be assumed that during the describedprocess, the following processes take place simultaneously: absorption of liquid by the dehydratedproduct, swelling of the rehydrated material and leaching of the solutes (vitamins, minerals, sugars,acids) from the product to the rehydrating medium. The kinetics of the mass transfer mechanismsdepends on the rehydrating liquid [5,6].
Pre-drying treatments, drying and rehydration cause the changes in structure and composition ofproduct tissue, which result in worsening of reconstitution characteristics. Rehydration can be, therefore,treated as a measure of the degree of alternations taking place during processing [7,8]. The effect ofdifferent parameters of pre-drying treatments, subsequent drying and rehydration on rehydrationcharacteristics of food products has been widely investigated in the literature. Some examples aregiven below.
Processes 2020, 8, 1454; doi:10.3390/pr8111454 www.mdpi.com/journal/processes

Processes 2020, 8, 1454 2 of 21
Taiwo et al. [9] studied the influence of pre-drying treatments (high-intensity electric fieldpulses and osmotic dehydration in sucrose solution) on characteristics of the rehydrated apples.Severini et al.’s [10] work was to study the effects of different combined systems of blanching anddehydration on the behavior during rehydration of cubed potatoes. Blanching was alternativelyperformed in hot distilled water, hot sugary-saline solution, by microwaves in distilled water or bymicrowaves in saline solution. Doymaz and Sahin [11] investigated the effect of pretreatment (with asolution of citric acid, blanching by immersing in hot water) on rehydration characteristics of broccolislices, whereas Kocabay and Ismail [12] applied two different pretreatments for okra (immersing in asalt solution or hot water).
Kumar et al. [13] studied the effect of convection, freeze and freeze-convection drying on carrotand pumpkin rehydration, whereas Giri and Prasad [14] investigated the influence of convection andmicrowave-vacuum dehydration on rehydration of button mushrooms. Yi et al. [15] studied howrehydration of pitaya was affected by convection, convection-explosion and puffing drying. The effectof drying air temperature on rehydration characteristics was investigated, among others, by Wang andChao [16] for apple, Vega-Gálvez et al. [17] for red bell pepper and Rafiq et al. [18] for parboiled rice.Giri and Prasad [14] studied how rehydration of microwave-vacuum dried button mushrooms wasaffected by the different pressures. Rhim et al. [19] evaluated the effect of freezing temperature onrehydration characteristics of freeze-dried rice porridge.
Some studies investigated the effect of water temperature on the rehydration behavior ofsuch food products as apples [9], mangos [4], carrots [20], parboiled rice [18]. The influence of therehydrating medium on rehydration characteristics has also been evaluated in the literature. Oliviera andIlincanu [21] rehydrated dried apple in milk and water, whereas Prothon et al. [22] immersed applein water and yogurt. Giraldo et al. [6] rehydrated candied mango fruit in the sucrose solutions ofdifferent concentrations.
The ability of the food products to absorb liquid also depends on the chemical composition ofthe material [23]. It can be presumed, therefore, that the product varieties influence the course ofthe rehydration but very little has been published on the considered subject. Markowski et al. [24]investigated the effect of six varieties of carrots (Kazan, Maxima, Nandor, Nektarina, Simba and Tito)on the water absorption of dried ones. It was noticed that the process of rehydration was significantlyinfluenced by variety. Kaptso et al. [25] studied the rehydration kinetics of the cowpea (varieties CWand CG) and bambara seeds (varieties BB and WB). The differences observed in the course of therehydration process underline the differences between the varieties and species. Ciurzynska et al.’s [26]work was to study the influence of variety on rehydration properties of vacuum-dried strawberries.The analysis showed that fruit variety Bounty obtained higher-final water content after one-hourimmersion in water in comparison to variety Pandora.
Apples are one of the basic horticultural products. Apple plantations are present all over the world,and Poland is a significant global producer of these fruits. Apples play a significant role in the humandiet. They are low caloric fruits containing typically about 86% of water, 12–14% of carbohydrate,0.3% of protein, 0.2% of lipids, 2% of dietary fiber (including pectins) and many important minerals(calcium, magnesium, potassium). Apples may help in reducing the effect of asthma and cholesterollevels and maintaining the weight [27–29].
Some information about the influence of apple varieties on their morphological and physicalcharacteristics and drying kinetics can be found in the literature. Willix et al. [30] obtained differentformulas for calculating the thermal conductivity of the following three varieties of apple: Cox’s Orange,Fiesta and Royal Gala. Chakespari et al. [31] stated that the mean values of properties such as length,width, thickness, geometric mean diameter, volume, surface area, mass and projected area for theShafi Abadi variety were significantly greater than of the Golab Kohanz variety. Santos et al. [32]investigated the infrared drying of apple slices of Fuji and Gala varieties. They found that themathematical model of drying common to both varieties cannot be representative. Torabi et al. [33]developed formulas for the prediction of the volume of three apple varieties (Red Delicious,

Processes 2020, 8, 1454 3 of 21
Golden Delicious, Granny Smith) based on the mass of fruit and also stated that one formulafor investigated varieties could not be representative. Cruz et al. [34] studied the convective drying ofapples from two varieties Golden Delicious and Granny Smith, and found that values of mass transferproperties such as moisture diffusion coefficient and moisture transfer coefficient were different forboth varieties. Pissard et al. [35] determined the phenolic compounds and dry matter content in peeland flesh of twenty apple varieties. Both properties showed great variability among the varieties.
There is, however, little or no information about the effect of variety on the rehydration behaviorof dried apples in the literature. Therefore, attempts were made to investigate the influence of applevariety on rehydration characteristics. The present study was conducted with the following objectives:
1. To determine the effect of variety and rehydration temperature on the rehydration characteristicsof dried apples;
2. To fit the experimental rehydration data obtained to the Peleg model, Weibull model and Fick’ssecond law model in order to: (i) estimate their suitability to describe the rehydration behaviorof dried apples, (ii) obtain the values of models constants which have physical meaning andtherefore can enable the explanation of the phenomena occurring during rehydration of differentvarieties of dried apples.
2. Materials and Methods
Four different varieties of apples, viz. Champion, Cortland, Grey Reinette and Ligol were procuredfrom a local market in Warsaw, Poland. Homogenous fruits were chosen for each variety according tosuch maturity indicators as fruit appearance and size [28]. Champion belongs to a dessert varietybut can also be used for cooking and processing. Its flesh is greenish-white with a cream undertone,medium loose, juicy, sweet, aromatic and tasty [36]. Cortland is a dessert variety. It has white,crispy, fine-grained, juicy, sweet, with medium contents of acids flesh. Cortland is aromatic and verytasty [36]. Grey Reinette has crispy, very juicy and green-yellow flesh. Its taste is acid; therefore,the variety is mostly used for cooking and processing [36]. Ligol belongs to a dessert variety. It hascream-colored, very juicy and tasty flesh [36]. Before the drying experiments, the apples were washed,hand peeled, and the outer cortex was cut into 10 ± 1 mm cubes. Drying was carried out on the sameday in the tunnel dryer at the drying air temperature 60 ◦C and air velocity 2 m/s. The final moisturecontent of dried samples was ca. 9% w.b. (0.098 d.b.). Drying equipment and a method of conductingthe experiments can be found in the paper by Kaleta and Górnicki [37]. The dried apples of the samevariety obtained from the three independent experiments were mixed and then stored for furtherinvestigations in a sealed container for approx. seven days at 20 ◦C.
Dried apples were rehydrated in distilled water at temperature Tr = 20, 45 and 70 ◦C.The temperature conditions were warranted with a water bath. The rehydration time amounted to 6 hat the water temperature 20 ◦C, 5 h at 45 ◦C and 4 h at 70 ◦C. Experiments were done in three repetitions.The water was not stirred, and its temperature was constant during the process of rehydration.The mass of each dried sample at the beginning of rehydration was 10 g. Mass of dried apple cubes todistilled water mass ratio amounted to 1:20. The WPE 300 scales (RADWAG, Radom, Poland) wereused for the measurement of the sample mass (with 0.001 g accuracy). The change of dry matter ofsolid during rehydration was measured in accordance with AOAC standards [38]. The volume changesof dried apple cubes during rehydration were measured by the buoyancy method using petroleumbenzine [39] with a relative error lower than 5%.
The color attributes of raw, dried and rehydrated apples were evaluated using a scanner(Canon CanoScan 5600F). Obtained color images were loaded into the sRGB color space. The meanbrightness of pixels in each RGB channel of the image was used to express color parameters. The fresh,dried and rehydrated (color inside the cubes were additionally measured for the rehydrated apples(cubes were cut)) apple cubes were randomly positioned on the scanner platen. A total numberof 20 images for each apple batch (different varieties and rehydration temperatures) were acquired.The ImageJ ver.47i software was used.

Processes 2020, 8, 1454 4 of 21
Two empirical models were adopted for describing the course of dried apple cubes rehydration,namely the Peleg model [40] and the Weibull model [41]. Such models were chosen because theirconstants have physical meaning.
Peleg model [40] is given by Equation (1):
M = M0 +t
k1 + k2t(1)
where M is the moisture content (dry basis), M0 is the initial moisture content (dry basis), t is thetime (h), k1 is the Peleg rate constant (h/d.b.), and k2 is the Peleg capacity constant (1/d.b.). When therehydration process lasted long enough (t→∞) the equilibrium moisture content can be determinedas follows:
Me = M0 +1k2
(2)
Constant k1 informs about the rate of water absorption during the early stage of the rehydration;on the other hand, constant k2 is related to the maximum capacity of water absorption [42,43]. The Pelegmodel has been used to describe the rehydration process of such dried products as carrots [44],mango [45] and potatoes [46].
The Weibull model is presented by the following equation:
M−M0
Me −M0= 1− exp
[−
(tβ
)α](3)
where Me is the moisture content at saturation (equilibrium moisture content, dry basis), α is thedimensionless shape parameter, and β is the scale parameter (h).
Constant α represents product behavior during rehydration. The initial rate of the rehydrationdecreases with an increase in the α value. Constant β is related to the kinetics of the process andpresents an inverse relation with the rehydration rate [43,47]. The Weibull model has been foundto give satisfactory results in the descriptions of rehydration of such dried materials as ready-to-eatbreakfast cereal [48], pumpkin [49] and Rosa rubiginosa fruits [43].
One theoretical model was also applied for describing the kinetics of rehydration. Different transportmechanisms take place during the discussed process, namely molecular diffusion, convection, hydraulic flowand capillary flow [50]. Theoretical models describing water absorption in foods are mostly basedon the water diffusion through a porous medium; therefore, Fick’s second law is frequently appliedfor mathematical modeling of rehydration. When following simplifying assumptions are considered:(1) the initial moisture content M0 in the material is uniform, (2) the water diffusion coefficientis constant, (3) moisture gradient at the center of material equals zero, (4) shrinkage is negligible,(5) the sample surface reaches equilibrium moisture content Me instantaneously after immersion inrehydrating medium, (6) the process can be treated as isothermal, the Fick’s second law describing therehydration of cubes receives the following form [51,52]:
M−M0
M0 −Me=
512π6
∞∑i=1
1
(2i− 1)2 exp[−(2i− 1)2π2 Dt
L2
]3
(4)
where D is the water diffusion coefficient (m2/h), and L is the cube thickness (m).Ten terms of the series were taken for the calculations. Theoretical models based on Fick’s second
law of diffusion with given above simplifying assumptions have been successfully applied to differentproducts such as carrots [53], dactyls [54] and soybeans [55].
The Levenberg–Marquardt nonlinear estimation method was applied to determine the model’sconstants while the significance of the influence of apple variety and the temperature of rehydratingwater on the course of rehydration was determined with the use of the ANOVA technique applyingthe Levene test of homogeneity of variances. Homogenous groups were tested using Tukey’s test HSD

Processes 2020, 8, 1454 5 of 21
(α = 0.05). Calculations were conducted using the Statistica 12.5 application. The above-discussedPeleg model, Weibull model and Fick’s second law model were chosen for describing the kinetics ofdried apple cubes rehydration because their model constants have physical meaning, and obtainedvalues of constants can be useful while discussing and explaining the course of different varieties ofdried apple rehydration. Moreover, a comparison of the results obtained for three discussed modelscan give the answer, which of then can be treated as the most appropriate for describing the rehydrationcharacteristics of dried apples.
The following statistical methods were used for finding the model suitability for the prediction ofrehydration kinetics of dried apples:
• Standard error of estimation SEE
SSE =
N∑i=1
(Mexp,i −Mpre,i
)2
N(5)
where Mexp,i is the i-th experimentally observed moisture content (dry basis), Mpre,i is the i-thpredicted moisture content (dry basis), and N is the number of observations.
Lower SEE values indicate better fitness of the established model. Witrowa-Rajchert andLewicki [56] and Rafiq et al. [18] used this statistical criterion for selecting the most suitable model topredict the rehydration kinetics.
• Coefficient of determination R2
R2 =
N∑i=1
(Mi −Mpre,i
)·
N∑i=1
(Mi −Mexp,i
)√
N∑i=1
(Mi −Mpre,i
)2·
N∑i=1
(Mi −Mexp,i
)2
(6)
The closer R2 to 1, the greater is the relationship between experimental and predicted values.The coefficient has been applied by, e.g., Doymaz and Sahin [11] and Markowski et al. [46].
• Root mean square error RMSE
RMSE =
1N
N∑i=1
(Mpre,i −Mexp,i
)2
12
(7)
The lower the RMSE values, the better is the goodness of the fit. Such a criterion has been used by,e.g., Kaleta et al. [57] and Ricce et al. [44].
3. Results and Discussion
The results of the experiments are shown in Figure 1. The figure presents functions (Peleg model)approximating results of three repetitions of mass gain (Figure 1a), dry matter loss (Figure 1b) andvolume increase (Figure 1c) measurements in the course of the rehydrating process.

Processes 2020, 8, 1454 6 of 21
Processes 2020, 8, x FOR PEER REVIEW 6 of 21
. . . .01 2
d m d mtm m
k k t= −
+ (10)
where md.m. is the dry matter (g), md.m.0 is the initial dry matter (g) and equilibrium dry matter:
. . . .02
1d m e d mm m
k= − (11)
• for volume:
01 2
tV Vk k t
= ++
(12)
where V is the volume (cm3), V0 is the initial volume (cm3) and equilibrium volume:
= +02
1eV V
k (13)
(a) (b)
(c)
Figure 1. Mass vs. time (a), dry matter vs. time (b) and volume vs. time (c) for the rehydration (at 20 °C) of dried apples of different varieties: (⎯⎯)—Champion, (⎯⎯)—Cortland, (⎯⎯)—Gray Reinette, (−−−)—Ligol.
According to the calculations, the Peleg model well described the mass gain, the dry matter loss, and the volume increase of dried apples during their rehydration, since the value of the coefficient of determination R2 was within 0.9595 to 0.9883 for mass, 0.9150 to 0.9959 for dry matter and 0.9137 to 0.9896 for volume.
Statistical analysis of the influence of apple variety on the mass gain, the dry matter loss and the volume increase of dried apples during their rehydration at 20 °C (division into homogenous groups) are shown in Table 1. In this table, numbers mean average values from three repetitions of measurements of the current mass, dry matter and volume of the rehydrated dried material (with the standard deviation), whereas homogenous groups for each time of rehydration were determined with the same letters.
Volu
me
(cm
3 )
Figure 1. Mass vs. time (a), dry matter vs. time (b) and volume vs. time (c) for the rehydration (at 20 ◦C)of dried apples of different varieties: (——)—Champion, (——)—Cortland, (——)—Gray Reinette,(−−−)—Ligol.
The Peleg model took the following form:
• for mass:
m = m0 +t
k1 + k2t(8)
where m is the mass (g), m0 is the initial mass (g) and equilibrium mass:
me = m0 +1k2
(9)
• for dry matter:
md.m. = md.m.0 −t
k1 + k2t(10)
where md.m. is the dry matter (g), md.m.0 is the initial dry matter (g) and equilibrium dry matter:
md.m.e = md.m.0 −1k2
(11)
• for volume:
V = V0 +t
k1 + k2t(12)
where V is the volume (cm3), V0 is the initial volume (cm3) and equilibrium volume:
Ve = V0 +1k2
(13)

Processes 2020, 8, 1454 7 of 21
According to the calculations, the Peleg model well described the mass gain, the dry matter loss,and the volume increase of dried apples during their rehydration, since the value of the coefficient ofdetermination R2 was within 0.9595 to 0.9883 for mass, 0.9150 to 0.9959 for dry matter and 0.9137 to0.9896 for volume.
Statistical analysis of the influence of apple variety on the mass gain, the dry matter loss andthe volume increase of dried apples during their rehydration at 20 ◦C (division into homogenousgroups) are shown in Table 1. In this table, numbers mean average values from three repetitions ofmeasurements of the current mass, dry matter and volume of the rehydrated dried material (with thestandard deviation), whereas homogenous groups for each time of rehydration were determined withthe same letters.
It can be noticed (Figure 1a) that for all investigated apple varieties, water uptake increased withincreasing rehydration time. The rate of the process was faster in the initial period and decreased upto the saturation level. Such a course of rehydration at the beginning could be explained by rapidfilling up of capillaries and cavities near the surface with the water. The cell walls absorb water,soften, and then according to the natural cellular structure elasticity, the cells return to their originalshape by drawing water into the inner cavities. In the further stage of the process, water absorptionslows down because the rehydrated sample gets close to the state of equilibrium [58–60]. A similarcharacter of mass changes during rehydration has been reported by, among others, Marabi et al. [61]for carrot, Markowski et al. [46] for potato and Maldonado et al. [4] for mango.
According to Table 1, the apple variety influenced the rehydration of the dried product. It canbe observed that at the beginning of the process (0–1.5 h), the course of the dried Championrehydration differed statistically significantly from the kinetics of dried Cortland, Gray Reinette andLigol (the difference between the mass gain for these three varieties was at the same time statisticallyinsignificant). The final mass was the greatest for the Cortland variety and the smallest for Ligol one,and the differences for all investigated apple varieties were statistically significant.
The results of the application of the Peleg model (Equations (8) and (9)) for approximating themass gain during the rehydration of investigated varieties of dried apples are presented in Table 2.It could be noticed that apple variety had a statistically significant influence on the value of theequilibrium mass of the rehydrated sample. The highest value, 52.93 g, demonstrated Cortland varietyrehydrated at 20 ◦C, the lowest 39.13 g Ligol one at 20 ◦C. The value of me for the same apple varietydepended in a statistically significant way on the temperature of rehydrating water. For the Ligolvariety, the discussed value increased with increasing temperature, but for the Champion and GreyReinette, me value for 70 ◦C was lower than for 45 ◦C. This may be explained in such a way thathigher temperature causes damage of cellular tissue and a decrease of permeability within the applestructure, and perhaps a loss of solids during rehydration. Similar trends for rehydration at highertemperatures have been noticed, among others, Femenia et al. [62] for broccoli stems, Garcia-Pascualet al. [41] for Boletus edulis mushroom and Maldonado et al. [4] for mangoes. The apple varietydemonstrated a statistically significant influence on the value of constant k1. The highest value at20 ◦C showed Cortland variety, the lowest one Champion variety. For Champion, Grey Reinette andLigol varieties, the k1 value decreased with increasing temperature. The results suggest that the rateof water absorption during the early stage of the rehydration at 20 ◦C was the highest for Championand the lowest for Cortland (Figure 1a) and, moreover, the discussed rate became higher at a highertemperature of rehydration. The achieved results confirm the statement that constant k2 was related tothe maximum capacity of water absorption [42,43]. The highest k2 value was obtained for Ligol at20 ◦C and the lowest for Cortland at 20 ◦C and the difference was statistically significant.

Processes 2020, 8, 1454 8 of 21
Table 1. Average values of mass (g), dry matter (g) and volume (cm3) of the rehydrated dried apples (with standard deviation) in the rehydration process at 20 ◦C.
Quantity Variety of Apple Time (h)
0 0.16 0.33 0.5 0.83 1.5 3 6
mass (g)
Champion 10 24.56 ± 0.11 c 27.51 ± 0.35 b 30.46 ± 0.60 b 32.86 ± 0.46 b 36.94 ± 0.34 b 41.34 ± 0.51 b 45.69 ± 1.15 bcCortland 10 16.42 ± 0.83 a 22.40 ± 1.57 a 24.48 ± 1.69 a 29.03 ± 1.91 a 34.04 ± 2.11 ab 42.03 ± 2.53 b 47.57 ± 2.31 c
Gray Reinette 10 19.34 ± 0.66 b 22.02 ± 0.72 a 24.69 ± 1.03 a 28.14 ± 0.90 a 32.24 ± 0.58 a 36.74 ± 0.28 a 41.34 ± 0.93 abLigol 10 19.07 ± 0.41 b 22.03 ± 0.41 a 24.28 ± 0.15 a 26.34 ± 0.04 a 30.84 ± 0.21 a 34.50 ± 0.04 a 38.28 ± 0.30 a
dry matter (g)
Champion 9.5 7.29 ± 0.25 b 6.73 ± 0.20 ab 6.18 ± 0.53 a 4.90 ± 0.27 a 4.01 ± 0.16 a 3.53 ± 0.09 a 3.11 ± 0.23 aCortland 9.5 7.80 ± 0.04 c 6.23 ± 0.07 a 5.84 ± 0.06 a 5.21 ± 0.13 a 4.60 ± 0.09 b 3.73 ± 0.13 ab 3.28 ± 0.01 a
Gray Reinette 9.5 7.79 ± 0.13 c 7.00 ± 0.20 b 6.21 ± 0.39 a 5.39 ± 0.24 a 4.68 ± 0.14 b 3.76 ± 0.07 ab 2.95 ± 0.18 aLigol 9.5 6.98 ± 0.09 a 6.32 ± 0.04 a 5.67 ± 0.13 a 5.01 ± 0.04 a 4.58 ± 0.20 b 3.97 ± 0.09 b 3.38 ± 0.05 a
volume (cm3)
Champion 20 29.66 ± 0.55 ab 32.67 ± 1.11 a 35.45 ± 1.68 a 38.32 ± 0.83 ab 41.84 ± 0.19 a 48.60 ± 1.33 a 51.55 ± 0.40 aCortland 20 27.08 ± 1.14 a 33.51 ± 2.14 a 34.88 ± 2.19 a 37.70 ± 2.25 a 41.75 ± 1.78 a 46.22 ± 2.65 a 50.32 ± 1.88 a
Gray Reinette 20 31.71 ± 0.78 b 34.99 ± 0.24 a 38.45 ± 0.54 a 42.87 ± 0.51 b 47.98 ± 0.63 b 57.91 ± 0.98 b 62.99 ± 0.55 bLigol 20 29.60 ± 1.89 ab 33.62 ± 2.53 a 35.90 ± 1.18 a 38.59 ± 0.21 ab 43.21 ± 1.09 ab 43.94 ± 0.98 a 49.09 ± 0.99 a
Values for the same quantity, followed by different letters in the same column, are significantly different at the 5% level (Tukey’s test HSD).

Processes 2020, 8, 1454 9 of 21
Table 2. Results of the application of the Peleg model (Equations (8) and (9)) for approximating themass gain during the rehydration of different varieties of dried apples.
Variety of Apple Tr (◦C) me (g) k1 (h/g) k2 (1/g) R2
Champion20 45.51 cd 0.0094 ab 0.0282 bc 0.974845 47.18 d 0.0081 a 0.0269 b 0.960870 44.48 bcd 0.0049 a 0.0290 bc 0.9656
Cortland 20 52.93 e 0.0238 e 0.0233 a 0.9595
Gray Reinette20 43.27 abcd 0.0181 d 0.0301 c 0.984745 45.36 cd 0.0151 bcd 0.0283 bc 0.962770 42.82 abc 0.0106 ab 0.0305 cd 0.9747
Ligol20 39.13 a 0.0176 cd 0.0343 e 0.984045 40.11 ab 0.0154 bcd 0.0332 de 0.988370 42.38 abcd 0.0103 abc 0.0309 cd 0.9796
The same letters in the same column indicate homogenous groups (α < 0.05, Tukey’s test HSD).
It can be observed (Figure 1b) that for all investigated apple varieties, solute loss increasedwith increasing rehydration time. The rate was faster at the beginning of the process and decreasedup to the saturation level. The explanation of such a course of rehydration could be the following.At the beginning of the process, there was a high rate of mass transfer because of the high differencebetween the solid concentration in rehydrated dried apple and rehydrating water. In the furtherstage, the rate of mass transfer slowed down because both concentrations approached the state ofequilibrium [60]. Similar rehydration kinetics had been observed by, among others, Górnicki [63] forparsley and apple var. Idared, Maté et al. [64] for potatoes and Stepien [65] for carrots.
According to Figure 1b and Table 1, it can be assumed that the apple variety had a statisticallyinsignificant influence on the loss of dry matter. The same statement regards the equilibrium dry matterand Peleg capacity constant k2 (Table 3). The highest value md.m.e = 3.387 g and k2 = 0.1636 1/g reachedChampion variety rehydrated at 70 ◦C, the lowest one md.m.e = 2.329 g and k2 = 0.1395 1/g Gray Reinetterehydrated at 45 ◦C, but the differences were statistically insignificant. As far as Peleg rate constant k1
was concerned, the statistically significant influence of dried apple variety could be observed. Forrehydration conducted at 20 ◦C, Gray Reinette showed the highest value of k1 = 0.0814 h/g, whereasLigol variety demonstrated the lowest value of k1 = 0.0468 h/g. The obtained results suggest that therate of dry matter loss during the early stage of the rehydration at 20 ◦C was the highest for Ligol andthe lowest for Gray Reinette variety (Figure 1b). The value of k1 for the same apple variety depended in astatistically significant way on the temperature of rehydrating water, and at 20 ◦C was higher than at 70 ◦C.
Table 3. Results of application of the Peleg model (Equations (10) and (11)) for approximating the drymatter loss during the rehydration of different varieties of dried apples.
Variety of Apple Tr (◦C) md.m.e (g) k1 (h/g) k2 (1/g) R2
Champion20 2.63 a 0.0584 cd 0.1455 a 0.965745 2.91 a 0.0380 abc 0.1517 a 0.947070 3.39 a 0.0143 a 0.1636 a 0.9378
Cortland 20 3.04 a 0.0568 cd 0.1549 a 0.9959
Gray Reinette20 2.42 a 0.0814 d 0.1412 a 0.978745 2.33 a 0.0468 bc 0.1395 a 0.924770 3.14 a 0.0234 ab 0.1572 a 0.9150
Ligol20 3.38 a 0.0468 bc 0.1633 a 0.984545 2.78 a 0.0577 cd 0.1489 a 0.977770 3.14 a 0.0243 ab 0.1571 a 0.9884
The same letters in the same column indicate homogenous groups (α < 0.05, Tukey’s test HSD).
Processes 2020, 8, 1454 10 of 21
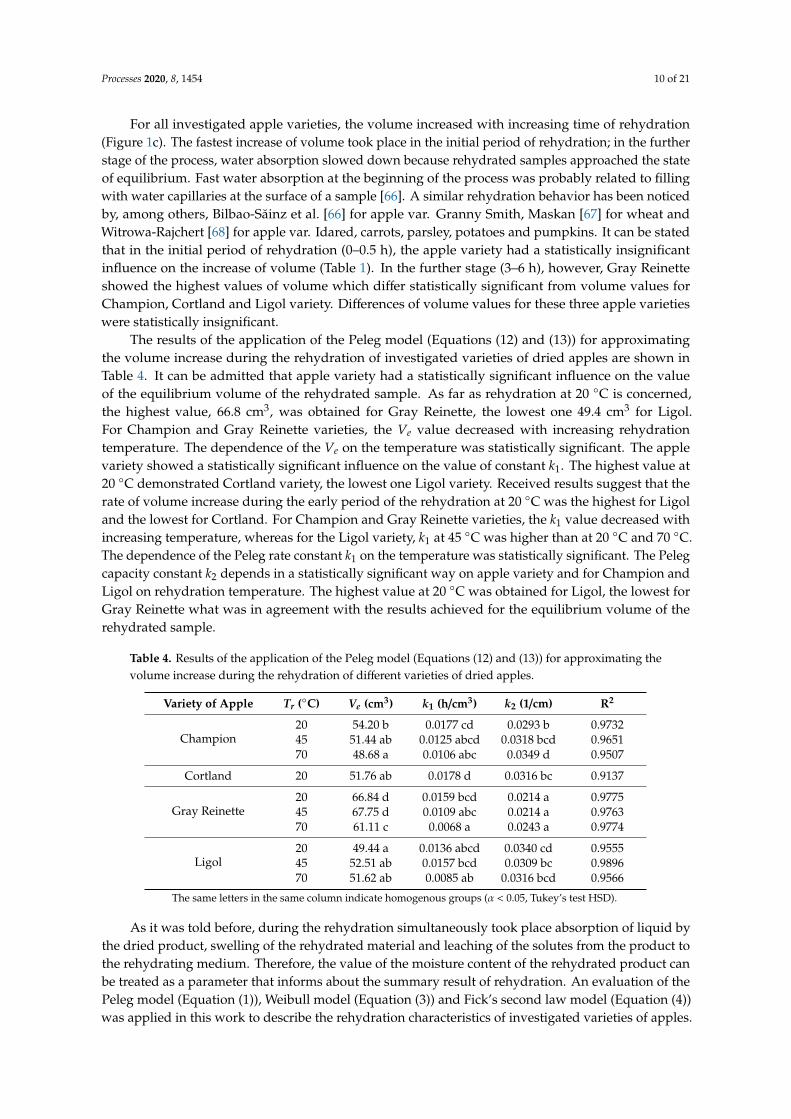
For all investigated apple varieties, the volume increased with increasing time of rehydration(Figure 1c). The fastest increase of volume took place in the initial period of rehydration; in the furtherstage of the process, water absorption slowed down because rehydrated samples approached the stateof equilibrium. Fast water absorption at the beginning of the process was probably related to fillingwith water capillaries at the surface of a sample [66]. A similar rehydration behavior has been noticedby, among others, Bilbao-Săinz et al. [66] for apple var. Granny Smith, Maskan [67] for wheat andWitrowa-Rajchert [68] for apple var. Idared, carrots, parsley, potatoes and pumpkins. It can be statedthat in the initial period of rehydration (0–0.5 h), the apple variety had a statistically insignificantinfluence on the increase of volume (Table 1). In the further stage (3–6 h), however, Gray Reinetteshowed the highest values of volume which differ statistically significant from volume values forChampion, Cortland and Ligol variety. Differences of volume values for these three apple varietieswere statistically insignificant.
The results of the application of the Peleg model (Equations (12) and (13)) for approximatingthe volume increase during the rehydration of investigated varieties of dried apples are shown inTable 4. It can be admitted that apple variety had a statistically significant influence on the valueof the equilibrium volume of the rehydrated sample. As far as rehydration at 20 ◦C is concerned,the highest value, 66.8 cm3, was obtained for Gray Reinette, the lowest one 49.4 cm3 for Ligol.For Champion and Gray Reinette varieties, the Ve value decreased with increasing rehydrationtemperature. The dependence of the Ve on the temperature was statistically significant. The applevariety showed a statistically significant influence on the value of constant k1. The highest value at20 ◦C demonstrated Cortland variety, the lowest one Ligol variety. Received results suggest that therate of volume increase during the early period of the rehydration at 20 ◦C was the highest for Ligoland the lowest for Cortland. For Champion and Gray Reinette varieties, the k1 value decreased withincreasing temperature, whereas for the Ligol variety, k1 at 45 ◦C was higher than at 20 ◦C and 70 ◦C.The dependence of the Peleg rate constant k1 on the temperature was statistically significant. The Pelegcapacity constant k2 depends in a statistically significant way on apple variety and for Champion andLigol on rehydration temperature. The highest value at 20 ◦C was obtained for Ligol, the lowest forGray Reinette what was in agreement with the results achieved for the equilibrium volume of therehydrated sample.
Table 4. Results of the application of the Peleg model (Equations (12) and (13)) for approximating thevolume increase during the rehydration of different varieties of dried apples.
Variety of Apple Tr (◦C) Ve (cm3) k1 (h/cm3) k2 (1/cm) R2
Champion20 54.20 b 0.0177 cd 0.0293 b 0.973245 51.44 ab 0.0125 abcd 0.0318 bcd 0.965170 48.68 a 0.0106 abc 0.0349 d 0.9507
Cortland 20 51.76 ab 0.0178 d 0.0316 bc 0.9137
Gray Reinette20 66.84 d 0.0159 bcd 0.0214 a 0.977545 67.75 d 0.0109 abc 0.0214 a 0.976370 61.11 c 0.0068 a 0.0243 a 0.9774
Ligol20 49.44 a 0.0136 abcd 0.0340 cd 0.955545 52.51 ab 0.0157 bcd 0.0309 bc 0.989670 51.62 ab 0.0085 ab 0.0316 bcd 0.9566
The same letters in the same column indicate homogenous groups (α < 0.05, Tukey’s test HSD).
As it was told before, during the rehydration simultaneously took place absorption of liquid bythe dried product, swelling of the rehydrated material and leaching of the solutes from the product tothe rehydrating medium. Therefore, the value of the moisture content of the rehydrated product canbe treated as a parameter that informs about the summary result of rehydration. An evaluation of thePeleg model (Equation (1)), Weibull model (Equation (3)) and Fick’s second law model (Equation (4))was applied in this work to describe the rehydration characteristics of investigated varieties of apples.

Processes 2020, 8, 1454 11 of 21
The calculations were carried out in the following way. The curve fitting computations with the dryingtime were carried on considered models. Then the regressions were undertaken to account for theeffect of rehydrating water temperature Tr on the model’s constants/parameters. The effects of Tr onthe model’s constants/parameters were also included in the models. The linear type of equations wasexamined. The constants/parameters combinations that gave the highest R2 values were consideredin the final model. Obtained equations were next used for determining the moisture content ofinvestigated varieties of apples at any time during rehydration. The established models were validatedby comparison of computed and measured moisture content in any particular rehydration run.
Table 5 presents the coefficients of constant equations for the Peleg model (Equations (1) and (2))and the results of statistical analyses on the rehydration modeling of different varieties of dried apples.The following linear type constant equations were examined:
k1 = A1 + A2Tr (14)
k2 = B1 + B2Tr (15)
Table 5. Coefficients of the constant equations for the Peleg model (Equations (1) and (2)) and results ofstatistical analyses on the rehydration modeling of different varieties of dried apples.
Variety of Apple Tr (◦C) Me (d.b.)Coefficients of Constant Equations
Constant SSE R2 RMSEA1 A2 B1 B2
Champion
20 16.78 bcd0.1098 −0.0011 0.0490 0.0005
k1 = 0.0875 ack2 = 0.0598 ab 6.8415 0.9795 0.6539
45 16.35 cd k1 = 0.0656 abk2 = 0.0614 abd 10.0500 0.9556 0.8473
70 11.48 a k1 = 0.0272 bk2 = 0.0875 c 3.4864 0.9727 0.539
Cortland 20 19.63 d k1 = 0.1428 dek2 = 0.0511 a 15.8500 0.9794 0.6144
Gray Reinette
20 20.21 d0.1660 −0.0016 0.0448 0.0004
k1 = 0.1630 efk2 = 0.0496 a 7.9579 0.9784 0.6842
45 18.48 cd k1 = 0.0896 ack2 = 0.0543 ab 6.0174 0.9795 0.5949
70 12.5 ab k1 = 0.0506 abk2 = 0.0803 c 4.5392 0.9768 0.5694
Ligol
20 12.56 ab0.1658 −0.0014 0.0804 −0.0002
k1 = 0.1288 cdek2 = 0.0799 cd 2.2635 0.9835 0.4173
45 14.28 abc k1 = 0.1125 cdk2 = 0.0703 bcd 5.8827 0.9527 0.8085
70 14.27 abc k1 = 0.0663 abk2 = 0.0703 bcd 1.9776 0.9864 0.4688
The same letters in the same column indicate homogenous groups (α < 0.05, Tukey’s test HSD).
The R2 values were greater than 0.9527, the RMSE ones were lower than 0.8473, and the SSEvalues were lower than 15.8500, so it can be admitted that the Peleg model described the rehydrationkinetics in a quite acceptable manner. Determined values for k1 ranged from 0.0272 to 0.1630 h/d.b.,while estimated values for k2 varied between 0.0496 and 0.0875 1/d.b. Obtained values for k1
were within the values reported in the literature for various foods, which vary within the range of0.0073–0.2317 h/d.b. for temperatures between 15 and 100 ◦C [41,47,69]. The determined values for k2
were slightly lower than the reported in the literature for food (in the temperature range 15–100 ◦C):0.074–1.57 1/d.b. [5,45,70,71].
It turned out that the Peleg rate constant depended in a statistically significant manner on theapple variety. The apple var. Champion showed the lowest values of k1 at the examined rehydrationtemperatures 20–70 ◦C. This suggests that the rate of water absorption in the early phase of therehydration process was the fastest for the Champion variety. The highest value of k1 at 20 ◦C wasobtained for Gray Reinette, whereas Ligol showed the highest k1 at 45 ◦C and 70 ◦C. The Pelegrate constant tended to decrease along with the rehydration temperature for investigated varieties,

Processes 2020, 8, 1454 12 of 21
and statistically significant differences were found between data. This suggests a higher rate ofwater absorption at a higher rehydration temperature. Therefore, it could be stated that watertransfer, related to the inverse of the constant k1, was promoted by the temperature increase. Similarbehavior, as far as the dependence on the temperature was concerned, has been found, among others,for chickpeas [72], mangos [45] and Rosa rubiginosa fruits [43].
It resulted from the conducted investigations that the Peleg capacity constant was influenced ina statistically significant manner by the apple variety. The highest value of k2 at 20 and 45 ◦C wasdemonstrated by apple var. Ligol, the lowest apple var. Grey Reinette, whereas at 70 ◦C Championvariety, showed the highest k2 value and Ligol the lowest one. The Peleg capacity constant forapple var. Grey Reinette increased with increasing temperature, and the differences were statisticallysignificant. The same tendency was observed for Champion, but the differences for the values ofk2 at 20 and 45 ◦C were statistically insignificant. Apple var. Ligol demonstrated the highest Pelegcapacity constant at 20 ◦C, whereas the k2 values at 45 and 70 ◦C were the same and lower than thevalue at 20 ◦C. The differences between the discussed constant at 20 ◦C and 45 ◦C was statisticallysignificant. The Peleg capacity constant was related to equilibrium moisture content Me by Equation (2).According to this equation, a growing value of Me means a decreasing value of k2. Equilibrium moisturecontent was a characteristic parameter of each product. The maximum capacity of water absorption ofbiological material depends on the type of product, structure of its tissue and chemical composition ofthe cells and could be modified by thermal treatments. The value of Me (so consequently k2) couldchange if the structure or other properties were modified by temperature during rehydration [47,58].The effect of rehydration temperature on Me depended on the product. The results found in theliterature indicate that equilibrium moisture content increased with increasing temperature [5,73],decreased with increasing rehydration temperature [42,72] or, in some cases, was independent oftemperature [74,75].
Table 6 shows the coefficients of constant equations for the Weibull model (Equation (3)) andthe results of statistical analyses on the rehydration modeling of different varieties of dried apples.The following linear-type constant equations were applied:
Me = Me1 + Me2Tr (16)
α = A1 + A2Tr (17)
β = B1r + B2Tr (18)
As can be seen from the statistical analysis results, the R2 values varied between 0.9580 and 0.9978,the RMSE ones fell within the range of 0.1602 to 0.8087, and the SSE values were between 0.3081 and14.2117. It could be therefore accepted that the Weibull model showed a slightly better fit upon theexperimental resulted than the Peleg model. The estimated values for α varied between 0.53 and 0.96,whereas calculated values for β range from 0.73 to 7.06 h. The following variation ranged for the valuesof discussed constants could be found in the literature: α = 0.530–0.701 and β = 0.25–1.867 h for mangoat rehydration temperatures 20–80 ◦C [45], α = 0.60–0.90 and β = 0.0414–0.1414 h for Morchella esculentamushrooms in the temperature range 15–70 ◦C [58], α = 0.409–1.069 and β = 0.0645–1.123 h for pumpkinat 30–60 ◦C [49], α = 0.614–0.893 and β = 0.807–2.75 h for parboiled rice at 30–50 ◦C [18], α = 0.428–0.598and β = 0.0817–0.4767 h for potato at 95 ◦C [46], α = 0.402–0.951 and β = 0.55–0.58 h for tomato forrehydration temperatures between 25 and 80 ◦C [47]. It can be accepted, therefore, that obtained valuesof α were within the values reported in the literature, whereas part of the estimated β values washigher than shown in the literature.

Processes 2020, 8, 1454 13 of 21
Table 6. Coefficients of the constant equations for the Weibull model (Equation (3)) and results of statistical analyses on the rehydration modeling of different varietiesof dried apples.
Variety of Apple Tr(◦C) Constant SSE R2 RMSE
Coefficients of Constant EquationsSSE R2 RMSE
Me1 Me2 A1 A2 B1 B2
Champion
20Me = 15.4613 abcα = 0.7446 ab;β = 2.1483 ab
6.1004 0.9817 0.637715.85 −0.0026 0.9007 −0.0064 2.3220 −0.0062 20.9321 0.9700 0.70612
45Me = 17.5000 abcα = 0.6670 ab;β = 2.4650 ab
6.5875 0.9709 0.6860
70 Me = 12.0491 abα = 0.5332 a; β = 0.7294 a 2.5934 0.9797 0.4856
Cortland 20Me = 17.9032 bcα = 0.7885 ab;β = 3.8746 ab
14.2117 0.9815 0.5888 - - - - - - - - -
Gray Reinette
20Me = 20.6185 cα = 0.7582 ab;β = 5.8016 b
6.6173 0.9820 0.643117.44 −0.0029 0.9516 −0.0053 3.8660 −0.0027 48.8417 0.9451 0.9786
45Me = 16.4272 abcα = 0.7811 b;β = 2.1755 ab
5.5915 0.9809 0.5912
70Me = 13.3600 aα = 0.6619 ab;β = 1.4970 a
3.6248 0.9814 0.5280
Ligol
20Me = 17.2583 abcα = 0.5996 a;β = 7.0607 b
0.3081 0.9978 0.16028.687 0.1849 0.7847 −0.0035 1.5260 0.0680 8.7741 0.9789 0.5321
45Me = 11.2023 aα = 0.9638 b;β = 1.5037 ab
5.2318 0.9580 0.8087
70Me = 14.6891 abα = 0.6585 ab;β = 1.9488 ab
0.7570 0.9948 0.3076
The same letters in the same column indicate homogenous groups (α < 0.05, Tukey’s test HSD).

Processes 2020, 8, 1454 14 of 21
It resulted from the investigations that the dimensionless shape parameter α depended on theapple variety but in a statistically insignificant manner. The apple var. Cortland showed the highestvalue of α at rehydration temperature 20 ◦C and then next in the sequence were Grey Reinette,Champion and Ligol. The sequence from the highest value of α to the lowest at 45 ◦C was the following:Ligol, Grey Reinette and Champion. The apple var. Ligol and Grey Reinette demonstrated at 70 ◦C thesame value of the dimensionless shape parameter, which was higher than α for Champion. As it waswritten, parameter α can be related to the rate of water absorption at the beginning of the rehydration.The lower the value of α, the faster was the rate of absorption. The obtained results were in goodaccordance with results obtained for Peleg rate constant k1, namely the process rate in the early phaseof the rehydration was the fastest for Champion variety and the lowest for Ligol and Grey Reinetteone at 45 and 70 ◦C. The dimensionless shape parameter tended to decrease with the rehydrationtemperature for apple var. Champion, whereas for Grey Reinette and Ligol, parameter α increasedfrom 20 to 45 ◦C, and then decreased along with temperature, but the differences were statisticallyinsignificant. A similar trend as for Champion was observed by Goula and Adamopoulos [47] fortomato, whereas Garcia-Pascual et al. [58] noticed for Morchella esculenta similar tendency as forGray Reinette and Ligol. However, the dimensionless shape parameter had also been found to beindependent of temperature [41,69].
It can be stated that the apple variety affects the value of the scale parameter β. Ligol showedthe highest value of β at the rehydration temperatures 20 and 70 ◦C, whereas Champion the lowestvalue. The sequence at 45 ◦C was reversed, but at this temperature, the differences were statisticallyinsignificant. According to Goula and Adamopoulos [47], parameter β represents the time needed toaccomplish approx. 63% of rehydration. The high value of the scale parameter suggests a difficulty ofthe material to absorb water during the rehydration, resulting in a low process rate [43]. Therefore,it can be assumed that the rate of absorption during the entire process of rehydration at 20 and 70 ◦Cwas the highest for Champion and the lowest for Ligol. The values of parameter β decreased withincreasing temperature for Grey Reinette (statistically significant differences), whereas Championdemonstrated the highest value of β at 45 ◦C and the lowest one at 70 ◦C. Ligol showed the highestβ value at 20 ◦C and the lowest one at 45 ◦C, but the differences were statistically insignificant.The following behavior as far as the dependence of β on the temperature was concerned could be foundin the literature: β value for pumpkin decreased when rehydration temperature increased [49], in caseof Morchella esculenta, discussed value decreased along with temperature except at 70 ◦C, where βvalue increased [58], whereas for tomato scale parameter increased with increasing temperature [47].Such a different effect of rehydration temperature on the value of the β parameter could be attributedto the different changes in the structure of material during the process of rehydration. Explanation ofthis phenomenon needs a deep understanding of the correlation between structure and mass transferprocess during the rehydration.
The values of equilibrium moisture content Me, identified from the Weibull model, dependedon apple variety, although the differences were statistically insignificant. The highest value of Me atrehydration temperature 20 ◦C showed apple var. Gray Reinette, whereas at 45 ◦C Champion and at70 ◦C Ligol. The lowest Me value at temperature 20 ◦C demonstrates Champion, whereas at 45 ◦CLigol and at 70 ◦C Champion. The values of equilibrium moisture content identified from the Weibullmodel and Peleg one were comparable. As far as the dependence on the temperature is concerned,the Me values for Gray Reinette decreased with increasing temperature, whereas apple var Championshows the highest value of Me at 45 ◦C and the lowest at 70 ◦C. On the other hand, Ligol demonstratedthe highest moisture equilibrium content at 20 ◦C and the lowest at 45 ◦C. The Weibull model, however,did not present statistically significant differences among temperatures for the Me values.
Table 7 presents the results of statistical analyses on the rehydration modeling of different varietiesof dried apples using Fick’s second law model (Equation (4)). The R2 were equal or greater than 0.9214except for apple var. Champion at 70 ◦C (0.8965), the RMSEs were equal or lower than 0.0865, and theSSEs were equal or lower than 0.0642 except for Champion at 70 ◦C (0.0972). It can be, therefore,

Processes 2020, 8, 1454 15 of 21
observed that Fick’s second law model describes the experimental data adequately. Comparing theresults obtained for the three discussed models, the diffusion model could be considered as the mostappropriate. The values determined for D/L2 range from 0.00772 to 0.06987 1/h and were found tobe lower than the values reported in the literature for mushrooms: 1.764–10.84 1/h [41,58]. It shouldbe underlined, however, that the values of the water diffusion coefficient reported in the literaturefor food materials were within the general range of 3.6·10−10 m2/h to 3.6·10−3 m2/h [76–79]. It turnedout from the investigations that the values of D/L2 depend on the apple variety, but the differenceswere statistically insignificant. The apple var. Champion demonstrated the highest values of D/L2
at the examined rehydration temperatures 20–70 ◦C. The lowest value of the discussed parameterat 20 ◦C was obtained for Grey Reinette, whereas Ligol showed the lowest D/L2 at 45 and 70 ◦C.The received results were in agreement with calculations obtained for the Peleg rate constant k1 andconfirm the statement that k1 was related to the rate of mass transfer, and its reciprocal could becompared with a water diffusion coefficient. The values of D/L2 increase with rehydration temperature,but the differences were statistically insignificant. The same dependence on temperature had beenobserved among others for amaranth grain [80], date palm fruits [54] and mango [4]. Cunninghamet al. [81] observed, however, a positive effect of temperature on water absorption of potatoes until60 ◦C, and then a negative effect was obtained. A similar tendency had been found by Garcia-Pascualet al. [58] for Morchella esculenta because the values of D/L2 increased with temperature except at 70 ◦C,where this value decreased.
Table 7. Results of statistical analyses on the rehydration modeling of different varieties of dried applesusing Fisk’s second law model (Equation (4)).
Variety of Apple Tr (◦C) D/L2 (1/h) SSE R2 RMSE
Champion20 0.01578 ab 0.0546 0.9542 0.056745 0.01926 ab 0.0470 0.9429 0.056070 0.06987 b 0.0972 0.8965 0.0865
Cortland 20 0.00894 a 0.0642 0.9680 0.0386
Gray Reinette20 0.00772 a 0.0242 0.9732 0.036745 0.01480 ab 0.0451 0.9474 0.050070 0.03124 ab 0.0576 0.9543 0.0620
Ligol20 0.01399 ab 0.0263 0.9700 0.043445 0.01446 ab 0.0483 0.9214 0.069570 0.02436 ab 0.0284 0.9604 0.0533
The same letters in the same column indicate homogenous groups (α < 0.05, Tukey’s test HSD).
Table 8 presents the results of statistical analyses on the color changes of different varieties ofraw, dried and dried apples during rehydration at different temperatures. The Gray Reinette variety(raw apple cubes) showed the lowest values of color attributes R and G (193.3 and 180.7, respectively),which differed statistically significant from discussed attributes for Champion, Cortland and Ligol.The differences between these three apple varieties were statistically insignificant.

Processes 2020, 8, 1454 16 of 21
Table 8. Results of statistical analyses on the RGB color attributes of different varieties of raw, driedand dried apples during rehydration at different temperatures.
Variety of Apple MaterialRGB Channel
R G B
Champion
Raw 203.2 ± 4.6 h 199.6 ± 4.6l m 173.7 ± 6.7 ij
Dried 235.4 ± 5.4 k 225.7 ± 6.1 n 178.4 ± 7.4 jk
Rehydrated
Tr (◦C) Place
20side 200.9 ± 5.5 fgh 196.0 ± 5.6 klm 165.6 ± 8.3 ghij
center 200.3 ± 8.0 fgh 196.3 ± 8.4 klm 166.4 ± 9.1 ghij
45side 203.5 ± 4.9 h 196.7 ± 4.7 klm 167.8 ± 7.5 ghij
center 204.6 ± 7.1 h 197.8 ± 7.3 klm 167.7 ± 8.4 ghij
70side 197.4 ± 6.0 defgh 189.7 ± 6.2 ghijklm 167.1 ± 5.2 ghij
center 198.7 ± 4.2 defgh 191.6 ± 3.8 hijklm 166.0 ± 3.4 ghij
Cortland
Raw 204.2 ± 5.7 h 202.7 ± 5.2 m 193.9 ± 5.3 k
Dried 230.2 ± 7.9 ik 201.1 ± 16.9 lm 163.2 ± 18.6 efghij
RehydratedTr (◦C) Place
20side 184.4 ± 7.6 a 152.6 ± 14.9 a 121.5 ± 20.2 a
center 187.7 ± 8.2 ab 160.7 ± 11.2 ab 133.4 ± 12.0 abc
Gray Reinette
Raw 193.3 ± 9.0 abcdefg 180.7 ± 10.2 efghi 145.6 ± 10.6 bcde
Dried 226.7 ± 9.3 ik 199.3 ± 10.2 lm 146.0 ± 9.1 bcdef
Rehydrated
Tr (◦C) Place
20side 185.4 ± 8.5 a 161.3 ± 15.1 abc 121.2 ± 16.5 a
center 190.5 ± 4.3 abcde 177.7 ± 6.7 efgh 151.0 ± 6.6 cdefg
45side 197.2 ± 5.7 bcdefgh 181.3 ± 9.6 efghij 146.0 ± 14.7 bcdef
center 201.8 ± 4.3 gh 187.0 ± 6.8 fghijkl 158.1 ± 8.0 defghi
70side 190.2 ± 8.8 abcde 175.2 ± 10.2 cdef 143.1 ± 11.4 bcd
center 197.3 ± 6.3 cdefgh 187.1 ± 6.1 fghijkl 157.2 ± 7.6 defghi
Ligol
Raw 202.9 ± 7.5 h 195.4 ± 7.9 jklm 171.2 ± 8.9 hij
Dried 221.5 ± 8.2 i 192.5 ± 9.6 ijklm 150.1 ± 10.1 cdefg
Rehydrated
Tr (◦C) Place
20side 189.3 ± 5.4 abcd 160.7 ± 9.6 ab 125.1 ± 10.8 a
center 189.3 ± 7.0 abcd 170.0 ± 11.8 bcde 145.4 ± 12.2 bcd
45side 190.4 ± 6.1 abcde 162.8 ± 10.6 abcd 129.3 ± 13.5 ab
center 197.7 ± 5.7 defgh 178.3 ± 7.0 efghi 152.9 ± 6.1 defg
70side 196.4 ± 5.1 bcdefgh 175.6 ± 8.1 defg 145.5 ± 11.0 bcde
center 199.1 ± 6.3 efgh 184.8 ± 7.4 fghijk 163.6 ± 8.3 fghij
The same letters in the same column indicate homogenous groups (α < 0.05, Tukey’s test HSD).
The Cortland variety showed the highest values of color attribute B (193.9), whereas GrayReinette demonstrated the lowest one (145.6). The differences between apple varieties were statisticallysignificant. Dry apple cubes of Gray Reinette and Ligol showed the lowest values of color attributes R,G and B (R: 226.7 and 221.5, G: 199.3 and 192.5, B: 146.0 and 150.1, respectively), whereas Championdemonstrated the highest ones, namely R = 235.4, G = 225.7 and B = 178.4. The differences betweenapple varieties were statistically significant. The color of the rehydrated cubes of apples was measuredin two places: at the surface of the side and in the center of the cube (cubes were cut). There was noeffect of the place of the color test on the R channel values of the rehydrated apples, whereas values forchannels G and B were greater at the center of the rehydrated apple cubes. The differences for GrayReinette (Tr = 20 ◦C—channel G) and Ligol (Tr = 20 ◦C—channel B, Tr 45 ◦C and 70 ◦C—channels Gand B) were statistically significant. The resulted of the statistical analysis showed the influence ofrehydration temperature on RGB channels. The values of each RGB channel increased with an increaseof Tr for rehydrated apple var. Ligol. The differences were statistically significant.
It turned out from the investigations that the values of RGB depend on the apple variety, and thedifferences were statistically significant. The apple var. Champion demonstrated the highest valuesof all RGB channels at the examined rehydration temperatures 20–70 ◦C. For apple var. Championrehydrated at Tr = 20 ◦C the values of R, G and B channels were higher than for other considered varieties.

Processes 2020, 8, 1454 17 of 21
Drying results in adverse changes that occur due to complex biochemical reactions and water lossand are dependent on the drying regime. Especially apples are exposed to undesirable quality changesdue to the high content of water and sugars, particularly glucose and fructose, as well as the presenceof pectins and malic acid [82]. The apple color change (especially the rapid increment in the initialstage of the drying process [83]) could be associated with the rapid synthesis of phenolic compoundsand the non-enzymatic browning reactions [84]. Nadian et al. [83] stated as the color changes ofpretreatment apples were visually different from the color changes of untreated slices at differentdrying times, and this difference could be related to the further progressing of chemical, biochemicaland physical changes in untreated apple by stimulating most of the enzymatic and non-enzymaticreactions. Additionally, color change in the apple could have resulted from the decomposition oforiginal pigments, the formation of brown pigments by enzymatic and non-enzymatic browningreactions and the formation of other undesirable pigments, wherein for pigments responsible forthe original apple color is believed chlorophyll (green color), carotenoids, flavonoids (yellow color)and anthocyanins (red color) [85]. The Millard reaction during which interaction between reducingsugars and amino acids occurs is easily stimulated in wet products during thermal processing [86] andalso be resulted from the product’s structural shrinkage that subsequently increases the opacity ofdehydrated samples [87,88]. The conducted research shows the influence of apple variety on both thecolor of the dried fruit and the color of the rehydrated dried material. Therefore, in order to obtaindried apples and rehydrated apple with desired (sensory attractive) color qualities, it should keep inmind the apple variety.
4. Conclusions
The following conclusions can be drawn from the conducted investigations.
1. Apple variety and temperature of rehydrating water had a statistically significant influence onthe value of the equilibrium mass of the rehydrated sample. The highest value demonstratedCortland variety rehydrated at 20 ◦C, the lowest Ligol one at 20 ◦C. The rate of water absorptionduring the early stage of rehydration at 20 ◦C was the highest for Champion and the lowest forCortland, and the discussed rate becomes higher at a higher rehydration temperature;
2. The apple variety had a statistically insignificant influence on the loss of dry matter. The rate ofdry matter loss during the early stage of the rehydration for some apple variety depended in astatistically significant way on the rehydration temperature, and at 20 ◦C was higher than at 70 ◦C;
3. Apple variety and temperature of rehydrating water had a statistically significant influence onthe value of the equilibrium volume of the rehydrated sample. The highest value demonstratedGray Reinette at 45 ◦C, the lowest Champion at 70 ◦C;
4. Comparing the results obtained for three considered models, namely Peleg model, Weibull modeland Fick’s second law model, the diffusion model can be considered as the most appropriate fordescribing the rehydration behavior of dried apples;
5. The values of the water diffusion coefficient to the second power of the cube thickness ratio(D/L2) depend on the apple variety, but the differences were statistically insignificant. Apple var.Champion demonstrated the highest values of D/L2 at the rehydration temperatures of 20–70 ◦C.The lowest value of the discussed parameter at 20 ◦C was obtained for Gray Reinette, whereas Ligolshowed the lowest D/L2 at 45 and 70 ◦C. The values of D/L2 increased with rehydration temperature,but the differences were statistically insignificant;
6. Taking into account all the obtained results, it can be stated that apple var. Champion showed agreater rate of water absorption during the entire process of rehydration than other investigatedvarieties; therefore, it could easily apply for special purpose food products;

Processes 2020, 8, 1454 18 of 21
7. The apple variety had a statistically significant influence on the color attribute B of raw apple.The highest value demonstrated Cortland, the lowest Gray Reinette one. The apple varietyhad a statistically significant influence on the color attribute of dried apple. The highest valuedemonstrated Champion, the lowest Gray Reinette and Ligol. Apple variety and temperatureof rehydrating water had a statistically significant influence on the color attribute of therehydrated apples.
Author Contributions: K.G., proposal of the research topic, data analysis, modeling, writing of the manuscript;A.C. experiments, data analysis; A.K. formal analysis, writing of the manuscript and critical revision of themanuscript. All authors have read and agreed to the published version of the manuscript.
Funding: This research received no external funding.
Conflicts of Interest: The authors declare no conflict of interest.
References
1. Deng, Y.; Luo, Y.; Wang, Y.; Yue, J.; Liu, Z.; Zhong, Y.; Zhao, Y.; Yang, H. Drying-induced protein andmicrostructure damages of squid fillets affected moisture distribution and rehydration ability duringrehydration. J. Food Eng. 2014, 123, 23–31. [CrossRef]
2. Krokida, M.K.; Philippopoulos, C. Rehydration of dehydrated foods. Dry. Technol. 2005, 23, 799–830. [CrossRef]3. Seguí, L.; Fito, P.; Fito, P.J. A study on the rehydration ability of isolated apple cells after osmotic dehydration
treatments. J. Food Eng. 2013, 115, 145–153. [CrossRef]4. Maldonado, S.; Arnau, E.; Bertuzzi, M. Effect of temperature and pretreatment on water diffusion during
rehydration of dehydrated mangoes. J. Food Eng. 2010, 96, 333–341. [CrossRef]5. Moreira, R.; Chenlo, F.; Chaguri, L.; Fernandes, C. Water absorption, texture, and color kinetics of air-dried
chestnuts during rehydration. J. Food Eng. 2008, 86, 584–594. [CrossRef]6. Giraldo, G.; Vazquez, R.; Martin-Esparza, M.E.; Chiralt, A. Rehydration kinetics and soluble solids lixiviation
of candied mango fruit as affected by sucrose concentration. J. Food Eng. 2006, 77, 825–834. [CrossRef]7. Lewicki, P.P. Effect of pre-drying treatment, drying and rehydration on plant tissue properties: A review.
Int. J. Food Prop. 1998, 1, 1–22. [CrossRef]8. Lewicki, P.P. Some remarks on rehydration of dried foods. J. Food Eng. 1998, 36, 81–87. [CrossRef]9. Taiwo, K.; Angersbach, A.; Knorr, D. Rehydration studies on pretreated and osmotically dehydrated apple
slices. J. Food Sci. 2002, 67, 842–847. [CrossRef]10. Severini, C.; Baiano, A.; De Pilli, T.; Carbone, B.F.; DeRossi, A. Combined treatments of blanching and
dehydration: Study on potato cubes. J. Food Eng. 2005, 68, 289–296. [CrossRef]11. Doymaz, I.; Sahin, M. Effect of temperature and pre-treatment on drying and rehydration characteristics of
broccoli slices. J. Food Meas. Charact. 2016, 10, 364–373. [CrossRef]12. Kocabay, Ö.G.; Ismail, O. Investigation of rehydration kinetics of open-sun dried okra samples.
Heat Mass Transf. 2017, 53, 2155–2163. [CrossRef]13. Kumar, H.S.P.; Radhakrishna, K.; Nagaraju, P.K.; Rao, D.V. Effect of combination drying on the physico-chemical
characteristics of carrot and pumpkin. J. Food Process. Preserv. 2001, 25, 447–460. [CrossRef]14. Giri, S.; Prasad, S. Drying kinetics and rehydration characteristics of microwave-vacuum and convective
hot-air dried mushrooms. J. Food Eng. 2007, 78, 512–521. [CrossRef]15. Yi, J.; Zhou, L.; Bi, J.; Liu, X.; Qinqin, C.; Wu, X. Influences of microwave pre-drying and explosion puffing
drying induced cell wall polysaccharide modification on physicochemical properties, texture, microstructureand rehydration of pitaya fruit chips. LWT 2016, 70, 271–279. [CrossRef]
16. Wang, J.; Chao, Y. Effect of 60Co irradiation on drying characteristics of apple. J. Food Eng. 2003, 56, 347–351. [CrossRef]17. Vega-Gálvez, A.; Lemus-Mondaca, R.; Bilbao-Sáinz, C.; Fito, P.; Andrés, A. Effect of air drying temperature
on the quality of rehydrated dried red bell pepper (var. Lamuyo). J. Food Eng. 2008, 85, 42–50. [CrossRef]18. Rafiq, A.; Chowdhary, J.; Hazarika, M.K.; Makroo, H.A. Temperature dependence on hydration kinetic
model parameters during rehydration of parboiled rice. J. Food Sci. Technol. 2015, 52, 6090–6094. [CrossRef]19. Rhim, J.-W.; Koh, S.; Kim, J.-M. Effect of freezing temperature on rehydration and water vapor adsorption
characteristics of freeze-dried rice porridge. J. Food Eng. 2011, 104, 484–491. [CrossRef]

Processes 2020, 8, 1454 19 of 21
20. Markowski, M.; Zielinska, D. Kinetics of water absorption and soluble-solid loss of hot-air-dried carrotsduring rehydration. Int. J. Food Sci. Technol. 2011, 46, 1122–1128. [CrossRef]
21. Oliveira, F.A.R.; Ilincanu, L. Rehydration of dried plant tissues: Basic concepts and mathematical modelling.In Processing Foods. Quality Optimization and Process Assessment; Oliveira, F.A.R., Oliveira, J.C., Eds.;CRC Press: Boca Raton, FL, USA; London, UK; New York, NY, USA; Washington, DC, USA, 1999; pp. 201–227.ISBN 978-0-8493-7905-5.
22. Prothon, F.; Ahrné, L.M.; Funebo, T.; Kidman, S.; Langton, M.; Sjöholm, I. Effects of combined osmotic andmicrowave dehydration of apple on texture, microstructure and rehydration characteristics. LWT 2001,34, 95–101. [CrossRef]
23. Rastogi, N.K.; Nayak, C.A.; Raghavarao, K. Influence of osmotic pre-treatments on rehydration characteristicsof carrots. J. Food Eng. 2004, 65, 287–292. [CrossRef]
24. Markowski, M.; Stankiewicz, I.; Zapotoczny, P.; Borowska, J. Effect of variety on drying characteristics andselected quality attributes of dried carrots. Dry. Technol. 2006, 24, 1011–1018. [CrossRef]
25. Kaptso, K.; Yanou, N.N.; Komnek, A.; Hounhouigan, J.; Scher, J.; Mbofung, C. Physical propertiesand rehydration kinetics of two varieties of cowpea (Vigna unguiculata) and bambara groundnuts(Voandzeia subterranea) seeds. J. Food Eng. 2008, 86, 91–99. [CrossRef]
26. Ciurzynska, A.; Piortrowski, D.; Janowicz, M.; Sitkiewicz, I.; Lenart, A. The influence of temperatureand pressure in vacuum-dryer chamber on rehydration of dried strawberries. Acta Agrophysica 2011, 17,289–300. (In Polish)
27. Guz, T.; Rydzak, L.; Domin, M. Influence of Selected Parameters and different methods of implementingvacuum impregnation of apple tissue on its effectiveness. Processes 2020, 8, 428. [CrossRef]
28. Sinha, N.K. Apples. In Handbook of Fruits and Fruit Processing; Hui, Y.H., Ed.; Blackwell Publishing:Ames, IA, USA, 2006; pp. 263–278. ISBN 978-0-470-27773-7.
29. Bora, G.C.; Pathak, R.; Ahmadi, M.; Mistry, P. Image processing analysis to track colour changes on appleand correlate to moisture content in drying stages. Food Qual. Saf. 2018, 2, 105–110. [CrossRef]
30. Willix, J.; Lovatt, S.J.; Amos, N. Additional thermal conductivity values of foods measured by a guarded hotplate. J. Food Eng. 1998, 37, 159–174. [CrossRef]
31. Chakespari, A.G.; Rajabipour, A.; Mobli, H. Mass modeling of two apple varieties by geometrical attributes.Austraian J. Agric. Eng. 2010, 1, 112–118.
32. Santos, E.D.S.; Corrêa, P.C.; Baptestini, F.M.; Botelho, F.M.; Magalhães, F.E.D.A. Mathematical modeling ofdehydration of ’Fuji’ and ’Gala’ apples slices using infrared. Food Sci. Technol. 2011, 31, 776–781. [CrossRef]
33. Torabi, A.; Tabatabaekoloor, R.; Hashemi, S.J. Volume modelling of three apple varieties based on physicalparameters. Int. J. Agric. Food Sci. Technol. 2013, 4, 461–466.
34. Cruz, A.C.; Guiné, R.P.F.; Gonçalves, J.C. Drying kinetics and product quality for convective drying of apples(cvs. Golden Delicious and Granny Smith). Int. J. Fruit Sci. 2015, 15, 54–78. [CrossRef]
35. Pissard, A.; Baeten, V.; Dardenne, P.; Dupont, P.; Lateur, M. Use of NIR Spectroscopy on Fresh Applesto Determine the Phenolic Compounds and Dry Matter Content in Peel and Flesh. Biotechnol. Agron.Soc. Environ. 2018, 22, 3–12. [CrossRef]
36. Ugolik, M.; Lech, W.; Kulawik, K. Varieties of Apple Trees; Plantpress: Cracow, Poland, 1996. (In Polish)37. Kaleta, A.; Górnicki, K. Some remarks on evaluation of drying models of red beet particles.
Energy Convers. Manag. 2010, 51, 2967–2978. [CrossRef]38. Horwitz, W. (Ed.) Official Methods of Analysis of AOAC International, 18th ed.; AOAC International:
Gaithersburg, MD, USA, 2005; ISBN 978-0-935584-75-2.39. Mazza, G. Dehydration of carrots. Int. J. Food Sci. Technol. 2007, 18, 113–123. [CrossRef]40. Peleg, M. An Empirical model for the description of moisture sorption curves. J. Food Sci. 1988, 53,
1216–1217. [CrossRef]41. Garcia-Pascual, P.; Sanjuan, N.; Bon, J.; Carreres, J.E.; Mulet, A. Rehydration process ofBoletus edulis
mushroom: Characteristics and modelling. J. Sci. Food Agric. 2005, 85, 1397–1404. [CrossRef]42. Solomon, W. Hydration kinetics of lupin (Lupinus albus) seeds. J. Food Process. Eng. 2007,
30, 119–130. [CrossRef]43. Ohaco, E.; Ichiyama, B.; Lozano, J.E.; De Michelis, A. Rehydration of Rosa rubiginosa fruits dried with hot air.
Dry. Technol. 2014, 33, 696–703. [CrossRef]

Processes 2020, 8, 1454 20 of 21
44. Ricce, C.; Rojas, M.L.; Miano, A.C.; Siche, R.; Augusto, P.E.D. Ultrasound pre-treatment enhances the carrotdrying and rehydration. Food Res. Int. 2016, 89, 701–708. [CrossRef]
45. Link, J.V.; Tribuzi, G.; Laurindo, J.B. Improving quality of dried fruits: A comparison between conductivemulti-flash and traditional drying methods. LWT 2017, 84, 717–725. [CrossRef]
46. Markowski, M.; Bondaruk, J.; Błaszczak, W. Rehydration behavior of vacuum-microwave-dried potato cubes.Dry. Technol. 2009, 27, 296–305. [CrossRef]
47. Goula, A.M.; Adamopoulos, K.G. Modeling the rehydration process of dried tomato. Dry. Technol. 2009, 27,1078–1088. [CrossRef]
48. Machado, M.F.; Oliveira, F.A.R.; Cunha, L.M. Effect of milk fat and total solids concentration on the kineticsof moisture uptake by ready-to-eat breakfast cereal. Int. J. Food Sci. Technol. 1999, 34, 47–57. [CrossRef]
49. Benseddik, A.; Azzi, A.; Zidoune, M.; Khanniche, R.; Besombes, C. Empirical and diffusion models ofrehydration process of differently dried pumpkin slices. J. Saudi Soc. Agric. Sci. 2019, 18, 401–410. [CrossRef]
50. Saguy, S.I.; Marabi, A.; Wallach, R. New approach to model rehydration of dry food particulates utilizingprinciples of liquid transport in porous media. Trends Food Sci. Technol. 2005, 16, 495–506. [CrossRef]
51. Crank, J. The Mathematics of Diffusion; Clarenton Press: Oxford, UK, 1975; ISBN 0-19-853344-6.52. Pabis, S.; Jayas, D.S.; Cenkowski, S. Grain Drying: Theory and Practice; John Wiley: New York, NY, USA, 1998;
ISBN 978-0-471-57387-6.53. Melquíades, Y.I.; López, C.; Rosas-Mendoza, M. Rehydration kinetics study of the dehydrated carrot
(daucus carota). Inf. Tecnol. 2009, 20, 65–72. [CrossRef]54. Falade, K.O.; Abbo, E.S. Air-drying and rehydration characteristics of date palm (Phoenix dactylifera L.) fruits.
J. Food Eng. 2007, 79, 724–730. [CrossRef]55. Gowen, A.; Abu-Ghannam, N.; Frias, J.M.; Oliveira, J.C. Influence of pre-blanching on the water absorption
kinetics of soybeans. J. Food Eng. 2007, 78, 965–971. [CrossRef]56. Witrowa-Rajchert, D.; Lewicki, P.P. Rehydration properties of dried plant tissues. Int. J. Food Sci. Technol.
2006, 41, 1040–1046. [CrossRef]57. Kaleta, A.; Górnicki, K.; Winiczenko, R.; Chojnacka, A. Evaluation of drying models of apple (var. Ligol)
dried in a fluidized bed dryer. Energy Convers. Manag. 2013, 67, 179–185. [CrossRef]58. Garcia-Pascual, P.; Sanjuan, N.; Melis, R.; Mulet, A. Morchella esculenta (morel) rehydration process
modelling. J. Food Eng. 2006, 72, 346–353. [CrossRef]59. McMINN, W.; Magee, T. Physical characteristics of dehydrated potatoes-Part II. J. Food Eng. 1997, 33,
49–55. [CrossRef]60. Sopade, P.; Xun, P.Y.; Halley, P.J.; Hardin, M. Equivalence of the Peleg, Pilosof and Singh–Kulshrestha models
for water absorption in food. J. Food Eng. 2007, 78, 730–734. [CrossRef]61. Marabi, A.; Livings, S.; Jacobson, M.; Saguy, S.I. Normalized Weibull distribution for modeling rehydration
of food particulates. Eur. Food Res. Technol. 2003, 217, 311–318. [CrossRef]62. Femenia, A.; Bestard, M.; Sanjuan, N.; Rosselló, C.; Mulet, A. Effect of rehydration temperature on the cell wall
components of broccoli (Brassica oleracea L. Var. italica) plant tissues. J. Food Eng. 2000, 46, 157–163. [CrossRef]63. Górnicki, K. Modelling of Selected Vegetables and Friuts Rehydration; Wydawnictwo SGGW: Warsaw, Poland,
2011. (In Polish)64. Maté, J.I.; Zwietering, M.H.; Riet, K.V. The effect of blanching on the mechanical and rehydration properties
of dried potato slices. Eur. Food Res. Technol. 1999, 209, 343–347. [CrossRef]65. Stepien, B. Rehydration of carrot dried using various methods. Acta Agrophysica 2008, 11, 239–251.66. Bilbao-Sainz, C.; Andrés, A.; Fito, P. Hydration kinetics of dried apple as affected by drying conditions.
J. Food Eng. 2005, 68, 369–376. [CrossRef]67. Maskan, M. Effect of maturation and processing on water uptake characteristics of wheat. J. Food Eng. 2001,
47, 51–57. [CrossRef]68. Witrowa-Rajchert, D. Rehydration as an Index of Changes Occuring in Plant. Tissues during Drying;
Fundacja Rozwój SGGW: Warsaw, Poland, 1999. (In Polish)69. Cunningham, S.; McMINN, W.; Magee, T.; Richardson, P. Modelling water absorption of pasta during
soaking. J. Food Eng. 2007, 82, 600–607. [CrossRef]70. Ergün, K.; Çalıskan, G.; Dirim, S.N. Determination of the drying and rehydration kinetics of freeze dried
kiwi (Actinidia deliciosa) slices. Heat Mass Transf. 2016, 52, 2697–2705. [CrossRef]

Processes 2020, 8, 1454 21 of 21
71. Rojas, M.L.; Augusto, P.E.D. Ethanol pre-treatment improves vegetable drying and rehydration: Kinetics,mechanisms and impact on viscoelastic properties. J. Food Eng. 2018, 233, 17–27. [CrossRef]
72. Turhan, M.; Sayar, S.; Gunasekaran, S. Application of Peleg model to study water absorption in chickpeaduring soaking. J. Food Eng. 2002, 53, 153–159. [CrossRef]
73. Lin, T.M.; Durance, T.D.; Scaman, C.H. Characterization of vacuum microwave, air and freeze dried carrotslices. Food Res. Int. 1998, 31, 111–117. [CrossRef]
74. Abu-Ghannam, N.; McKenna, B. The application of Peleg’s equation to model water absorption during thesoaking of red kidney beans (Phaseolus vulgaris L.). J. Food Eng. 1997, 32, 391–401. [CrossRef]
75. Singh, S.; Raina, C.S.; Bawa, A.S.; Saxena, D.C. Effect of pretreatments on drying and rehydration kineticsand color of sweet potato slices. Dry. Technol. 2006, 24, 1487–1494. [CrossRef]
76. Doulia, D.; Tzia, K.; Gekas, V. A knowledge base for the apparent mass diffusion coefficient (D EFF) of foods.Int. J. Food Prop. 2000, 3, 1–14. [CrossRef]
77. Maroulis, Z.; Saravacos, G.D.; Panagiotou, N.M.; Krokida, M.K. Moisture diffusivity data compilation forfoodstuffs: Effect of material moisture content and temperature. Int. J. Food Prop. 2001, 4, 225–237. [CrossRef]
78. Zogzas, N.P.; Maroulis, Z.B.; Marinos-Kouris, D. Moisture diffusivity data compilation in foodstuffs.Dry. Technol. 1996, 14, 2225–2253. [CrossRef]
79. Handbook of Industrial Drying, 2nd ed.; Mujumdar, A.S. (Ed.) Dekker: New York, NY, USA, 1995;ISBN 978-0-8247-8996-1.
80. Resio, A.N.C.; Aguerre, R.J.; Suárez, C. Study of some factors affecting water absorption by amaranth grainduring soaking. J. Food Eng. 2003, 60, 391–396. [CrossRef]
81. Cunningham, S.; McMINN, W.; Magee, T.; Richardson, P. Effect of processing conditions on the waterabsorption and texture kinetics of potato. J. Food Eng. 2008, 84, 214–223. [CrossRef]
82. Feng, H.; Tang, J. Microwave finish drying of diced apples in a spouted bed. J. Food Sci. 2006, 63,679–683. [CrossRef]
83. Nadian, M.H.; Rafiee, S.; Golzarian, M.R. Real-time monitoring of color variations of apple slices and effectsof pre-treatment and drying air temperature. J. Food Meas. Charact. 2016, 10, 493–506. [CrossRef]
84. Nicolas, J.J.; Richard-Forget, F.C.; Goupy, P.M.; Amiot, M.; Aubert, S.Y. Enzymatic browning reactions inapple and apple products. Crit. Rev. Food Sci. Nutr. 1994, 34, 109–157. [CrossRef]
85. Dixon, J.; Hewett, E.W. Temperature affects postharvest color change of apples. J. Am. Soc. Hortic. Sci. 1998,123, 305–310. [CrossRef]
86. Lozano, J.E. Fruit manufacturing: Scientific basis, engineering properties, and deteriorative reactions oftechnological importance. In Food Engineering Series; Springer: New York, NY, USA, 2006.
87. Contreras, C.; Martín-Esparza, M.; Chiralt, A.; Martínez-Navarrete, N. Influence of microwave application onconvective drying: Effects on drying kinetics, and optical and mechanical properties of apple and strawberry.J. Food Eng. 2008, 88, 55–64. [CrossRef]
88. Lewicki, P.P.; Gondek, E.; Witrowa-Rajchert, D.; Nowak, D. Effect of drying on respiration of apple slices.J. Food Eng. 2001, 49, 333–337. [CrossRef]
Publisher’s Note: MDPI stays neutral with regard to jurisdictional claims in published maps and institutionalaffiliations.
© 2020 by the authors. Licensee MDPI, Basel, Switzerland. This article is an open accessarticle distributed under the terms and conditions of the Creative Commons Attribution(CC BY) license (http://creativecommons.org/licenses/by/4.0/).