Trunk Injection: An Alternative Technique for Pesticide Delivery in Apples
13
Trunk injection: An alternative technique for pesticide delivery in apples A.H. VanWoerkom d, * , S.G. A cimovi c e , G.W. Sundin b , B.M. Cregg c , D. Mota-Sanchez a, b, c, d , C. Vandervoort b , J.C. Wise a a Department of Entomology, Michigan State University, East Lansing, MI 48824, USA b Department of Plant Pathology, Michigan State University, East Lansing, MI 48824, USA c Department of Horticulture, Michigan State University, East Lansing, MI 48824, USA d Trevor Nichols Research Center, Michigan State University, Fennville, MI 49408, USA e Arborjet Inc., USA article info Article history: Received 9 September 2013 Received in revised form 27 May 2014 Accepted 28 May 2014 Available online Keywords: Trunk injection Pest control Application technology Pesticide residue Choristoneura rosaceana Venturia inaequalis abstract Field studies, laboratory bioassays, and residue profile analysis were used to determine the seasonal effectiveness of trunk injected pesticides against key apple disease and insect pests. Insecticides formulated for trunk injection, imidacloprid (Ima-jet™), rynaxypyr (XCL-r8™), and emamectin benzoate (TREE-age™) were injected into semi-dwarf Empire apple trees Malus domestica (Borkhausen) and evaluated for a wide range of insect pests. The fungicide compounds, propiconazole (Alamo ® ), phos- phites (Phospho-jet), and penthiopyrad (Fontelis™), were injected into semi-dwarf MacIntosh (RedMax) apple trees M.domestica (Borkhausen) for control of apple scab fungus, Venturia inaequalis (Cooke). After the original single injection, imidacloprid was highly effective in controlling piercing and sucking pests such as the potato leafhopper, Empoasca fabae (Harris), and aphids (Aphididae), and emamectin benzoate was highly effective in controlling the oblique banded leaf roller, Choristoneura rosaceana (Harris), and potato leafhopper, E. fabae (Harris), and rynaxypyr was highly effective in controlling Oriental fruit moth, Grapholita molesta (Busck), and leafrollers all for two growing seasons. The residue profiles for in- secticides showed that vascular delivery was predominantly to foliage, with fruit residues far below the EPA maximum residue limits (MRLs), and low to no residues detected in apple flower parts. Phosphites provided significant levels of apple scab control over two seasons for the single injection after the foliage recovered from the phytotoxicity damage in the first season. Propiconazole and penthiopyrad showed limited effectiveness for the control of apple scab. The residue profiles for fungicides showed phosphites to be delivered primarily to foliage, but inconsistent foliar residue levels for the other two compounds suggests possible incompatibilities may be responsible for poor product performance. These in- compatibilities may include molecular or chemical properties. For example, on the molecular level such as the molecular size too large to fit through vascular tissue and chemical properties such as the viscosity of the compound resulting in poor translocation or pH. © 2014 Elsevier Ltd. All rights reserved. 1. Introduction Meeting the high food quality standards of domestic and global markets often requires the judicious use of crop protection materials, including pesticides (Wise and Whalon, 2009). Advances in crop protection chemistry in the last several decades have improved farmers' ability to grow specialty crops, such as apples, while enhancing margins of food safety for the consumer. Even though there has been significant evolution of the crop protection materials (i.e.; reduced-risk pesticides) available for pest management (USEPA, 1997), the spray equipment used by apple farmers has remained comparatively unchanged (McCartney and Obermiller, 2008). Scientists, like Pimentel and Levitan (1986), estimate that with conventional sprayers as little as 0.1% or less of * Corresponding author. 206 Center for Integrated Plant Systems, Michigan State University, East Lansing, MI 48824-1311, USA. Tel.: þ1 517 432 2668; fax: þ1 517 353 5598. E-mail address: [email protected] (A.H. VanWoerkom). Contents lists available at ScienceDirect Crop Protection journal homepage: www.elsevier.com/locate/cropro http://dx.doi.org/10.1016/j.cropro.2014.05.017 0261-2194/© 2014 Elsevier Ltd. All rights reserved. Crop Protection 65 (2014) 173e185
Transcript of Trunk Injection: An Alternative Technique for Pesticide Delivery in Apples
lable at ScienceDirect
Crop Protection 65 (2014) 173e185
Contents lists avai
Crop Protection
journal homepage: www.elsevier .com/locate/cropro
Trunk injection: An alternative technique for pesticide delivery inapples
A.H. VanWoerkom d, *, S.G. A�cimovi�c e, G.W. Sundin b, B.M. Cregg c,D. Mota-Sanchez a, b, c, d, C. Vandervoort b, J.C. Wise a
a Department of Entomology, Michigan State University, East Lansing, MI 48824, USAb Department of Plant Pathology, Michigan State University, East Lansing, MI 48824, USAc Department of Horticulture, Michigan State University, East Lansing, MI 48824, USAd Trevor Nichols Research Center, Michigan State University, Fennville, MI 49408, USAe Arborjet Inc., USA
a r t i c l e i n f o
Article history:Received 9 September 2013Received in revised form27 May 2014Accepted 28 May 2014Available online
Keywords:Trunk injectionPest controlApplication technologyPesticide residueChoristoneura rosaceanaVenturia inaequalis
* Corresponding author. 206 Center for Integrated PUniversity, East Lansing, MI 48824-1311, USA. Tel.: þ1 55598.
E-mail address: [email protected] (A.H. VanWo
http://dx.doi.org/10.1016/j.cropro.2014.05.0170261-2194/© 2014 Elsevier Ltd. All rights reserved.
a b s t r a c t
Field studies, laboratory bioassays, and residue profile analysis were used to determine the seasonaleffectiveness of trunk injected pesticides against key apple disease and insect pests. Insecticidesformulated for trunk injection, imidacloprid (Ima-jet™), rynaxypyr (XCL-r8™), and emamectin benzoate(TREE-age™) were injected into semi-dwarf Empire apple trees Malus domestica (Borkhausen) andevaluated for a wide range of insect pests. The fungicide compounds, propiconazole (Alamo®), phos-phites (Phospho-jet), and penthiopyrad (Fontelis™), were injected into semi-dwarf MacIntosh (RedMax)apple trees M.domestica (Borkhausen) for control of apple scab fungus, Venturia inaequalis (Cooke). Afterthe original single injection, imidacloprid was highly effective in controlling piercing and sucking pestssuch as the potato leafhopper, Empoasca fabae (Harris), and aphids (Aphididae), and emamectin benzoatewas highly effective in controlling the oblique banded leaf roller, Choristoneura rosaceana (Harris), andpotato leafhopper, E. fabae (Harris), and rynaxypyr was highly effective in controlling Oriental fruit moth,Grapholita molesta (Busck), and leafrollers all for two growing seasons. The residue profiles for in-secticides showed that vascular delivery was predominantly to foliage, with fruit residues far below theEPA maximum residue limits (MRLs), and low to no residues detected in apple flower parts. Phosphitesprovided significant levels of apple scab control over two seasons for the single injection after the foliagerecovered from the phytotoxicity damage in the first season. Propiconazole and penthiopyrad showedlimited effectiveness for the control of apple scab. The residue profiles for fungicides showed phosphitesto be delivered primarily to foliage, but inconsistent foliar residue levels for the other two compoundssuggests possible incompatibilities may be responsible for poor product performance. These in-compatibilities may include molecular or chemical properties. For example, on the molecular level suchas the molecular size too large to fit through vascular tissue and chemical properties such as the viscosityof the compound resulting in poor translocation or pH.
© 2014 Elsevier Ltd. All rights reserved.
1. Introduction
Meeting the high food quality standards of domestic and globalmarkets often requires the judicious use of crop protection
lant Systems, Michigan State17432 2668; fax: þ1 517 353
erkom).
materials, including pesticides (Wise andWhalon, 2009). Advancesin crop protection chemistry in the last several decades haveimproved farmers' ability to grow specialty crops, such as apples,while enhancing margins of food safety for the consumer.
Even though there has been significant evolution of the cropprotectionmaterials (i.e.; reduced-risk pesticides) available for pestmanagement (USEPA, 1997), the spray equipment used by applefarmers has remained comparatively unchanged (McCartney andObermiller, 2008). Scientists, like Pimentel and Levitan (1986),estimate that with conventional sprayers as little as 0.1% or less of
A.H. VanWoerkom et al. / Crop Protection 65 (2014) 173e185174
the pesticide contacts the target pest. Other studies show thatairblast sprayers are a relatively inefficient means of deliveringpesticides to their target, with only 29e56% of the applied spraysolution being deposited on the tree crown, and the remainingproduct drifting to ground or other off-target end points (Reichardet al., 1979; Steiner, 1969; Zhu et al., 2006). Some technical ad-vancements have come to the conventional ground sprayer, such asadding towers or nozzle sensors (Landers and Farooq, 2005;Landers, 2002, 2004), but the fundamental elements for deliv-ering materials to the tree crown have remained the same.
Pimentel and Levitan (1986) state that in most cases growersapply more pesticide than needed to account for the pesticide thatdoes not reach the target crop. This off-target contamination maybe lethal to many beneficial organisms such as pollinators, naturalenemies, and decomposers (Devine and Furlong, 2007). Zhu et al.(2006) found that many nurseries and orchards are located in orclose to the urban and suburban areas, making pesticide contami-nation of air, surrounding vegetation, and soil a threat to localresidents. Thus the resulting impact of the inefficient application ofpesticides on humans, beneficial insects, and the environment is agrowing concern worldwide (Pimentel and Levitan, 1986).
Trunk injection is an alternative to conventional airblastsprayers for delivering crop protection materials to tree fruit crops.Trunk injection of insecticides, including imidacloprid and ema-mectin benzoate, has become the preferred method for controllingEmerald ash borer in urban landscapes because of minimized risksto the public and non-target organisms (McCullough et al., 2005,Mota-Sanchez et al., 2008). Until now, research on the potentialfor using trunk injection in apple pest management has beenlimited primarily to disease control.
Trunk injection of the fungicide imazalil in apple trees showeddifferent levels of translocation and distribution after differenttimes of injection (Clifford et al., 1987). Post-harvest injectionresulted in extensive movement of fungicide up and down thetrunk and into branches, while injection before bud break stageshowed limited movement in the trunk and in the branches only atthe end of the season. In another apple study however, injections inMay provided a significant degree of apple scab protection in thenext two seasons for seven fungicides (Percival and Boyle, 2005).
Apple scab, the most serious fungal disease of apples in theEastern U.S., caused by the fungus V. inaequalis (Cooke), can requireas many as fifteen fungicide applications per season (Ellis et al.,1984). The inoculum develops in the spring in infected leavesfrom the previous season, and fruit infection results in scabby le-sions that crack and deform fruit directly impacting apple quality.Even minimal foliar infections can result in defoliation of appletrees, leading to a reduction of fruit size, quality, yield, loss ofwinter-hardiness, or even death of young trees (MacHardy, 1996).Conventional tactics for controlling apple scab require timely pre-infection application of fungicides to protect apple leaves andfruit (Sundin, 2009). If the primary scab infection can be completelycontrolled, significant savings can be made in limiting the other-wise season-long cover sprays (Jones and Sutton, 1996). Propico-nazole, phosphites, and penthiopyrad are registered in the U.S. foruse as foliar sprays in tree fruits for disease control (Wise et al.,2012).
Apples grown in the eastern U.S. are host of 10 or more differentunwanted insects, some of which are direct and indirect pests.Reduced-risk insecticides, such as imidacloprid, emamectin ben-zoate, rynaxypyr are registered in the U.S. for use as foliar sprays inapples for various direct and indirect insect pests (Wise et al. 2012).Direct insect pests include the oblique banded leaf rollerC. rosaceana (Harris) (OBLR), Oriental fruit moth Grapholita molesta(Busck) (OFM), codling moth Cydia pomonella (L.) (CM), plum cur-culio Conotrachelus nenuphar (Herbst) (PC), apple maggot
Rhagoletis pomonella (Walsh) (AM), Japanese beetle Popilliajaponica (Newman) (JB), rosy apple aphid Dysaphis plantaginea(Passerini) (RAA), while indirect pests include the spotted tenti-form leaf miner Phyllonorycter blancardella (Fabr.) (STLM), greenapple aphid Aphis pomi (Passerini) (GAA), and potato leafhopperE. fabae (Harris) (PLH). There are some direct pests that also feed onthe foliage, which can be considered direct and indirect feederssuch as the OBLR and OFM.
The purpose of this study was to test the effectiveness of theselected insecticides and fungicides delivered by trunk injection,for controlling the key disease and insect pests of Michigan apples.
2. Materials and methods
2.1. Injection procedure
Semi-dwarf apple treesM. domestica (Borkhausen) were chosenfor trunk injection at MSU Trevor Nichols Research Center inFennville, MI, USA (latitude 42.5951�: longitude �86.1561�) basedon overall health and crown structure, to assure uniform compounddelivery to the crown. There were five replicate trees per treatmentused in a randomized complete block design (RCBD). To calculatethe rate per tree pre-injection data were collected for each tree.This data included the trunk diameter one foot or 30.48 cm abovethe ground (DFH), calculating milliliters of compound per 2.54 cmof DFH, rate of compound in grams of active ingredient (g AI) perDFH inch, total volume for the injection solution per tree (all fourinjection ports combined), total volume of injection solution perinjection port (total volume per tree divided by four), and the dateof injection. These data were used for treatment preparation andrate calculation. The tree DFH was taken prior to injection bywrapping a forester's D-tape (Lufkin®, Sparks, MD) 30.48 cm abovethe ground for each repetition. The injection equipment includedan Arborjet Quick-jet™ injector and no. four Arborplugs (ArborjetInc., Woburn, MA), screwdriver-like plug tapper, hammer, cordlessdrill, and a 0.95 cm diameter wood drill bit. The injection systemand drill bit were sanitized before each injection with ArborjetCleanjet™ solution (Arborjet Inc. Woburn, MA). The drill bit wassterilized between each tree injection to prevent microbialcontamination or infection. The Quick-jet™ was used according tothe instruction manual provided by ArborJet. Injection ports weredrilled radially into the apple trunk 5.08 cm deep, and 30.48 cmabove the ground. The injection ports were strategically placedunder main scaffold branches around the trunk approximately atcardinal direction (N, S, E, W) orientations. The injection ports weresealed using Arborplugs so that the outside rim of the plug wasbeneath the bark with cambium tissue. The compound was theninjected at the desired rate in each plug through the one-way sili-cone valve in the Arborplug.
2.2. Insecticides injected
Treatment applications were injected at apple petal fall stage on5 May 2010 and in separate trees on 30 May 2011, with each ofthree insecticides formulated for trunk injection: imidacloprid 5%(Ima-jet™, Arborjet Inc., Woburn, MA), emamectin benzoate 4%(TREE-age™ Arborjet Inc., Woburn, MA), and rynaxypyr 4% (XCL-r8™, Arborjet Inc., Woburn, MA). There are four insecticide treat-ments, including a non-injected control, which is consideredtreatment one. Injections were conducted on twenty12.7e15.24 cm DFH semi-dwarf Empire apple trees M. domestica(Borkhausen). Predetermined lowand high rates of each compoundwere injected at volumes depending on tree DFH. A low rate of 0.2 gActive Ingredient (AI) per 2.54 cm DFH and high rate of 0.4 g AI per2.54 cm DFH were injected for all insecticides.

A.H. VanWoerkom et al. / Crop Protection 65 (2014) 173e185 175
All the experiments initiated in 2010 continued to be rated intothe 2011 season, are referred to as 2010 continuation.
2.3. Insecticide efficiency field evaluations
In-season plant protectionwas measured by conducting a seriesof field evaluations for the numbers of pests or level of foliar or fruitinjury in 2010 and 2011 seasons. All treatment replicates were ratedat specific days after treatment (DAT) intervals around the entiretree using the same evaluation techniques for each of the targetinsect species in the 2010 and 2011 seasons. In 2010 trees wererated for OBLR damage by counting the total number of infestedterminals per tree. Number of OFM flagged terminals and STLM leafmines were counted for a 2-min observation period per tree. PLHnumbers were measured by randomly selecting 20 shoots perreplicate and counting the number of live nymphs per shoot.
In the 2011 season, the 2010 continuation and 2011 new injec-tion plots, field evaluations were conducted for the same insects,but with a few additions. Fifty fruit per tree were assessed for PCfruit oviposition damage. The number of live RAA infested shootswere counted for 2 min. CM fruit infestations were assessed atharvest time at by collecting 25 (2010) and 100 (2011) fruits per treereplicate and dissecting them for larval identification. The numberof CM larvae and the total number of injured fruits were tallied. Thenumber of shoots with live colonies of GAA, A. spomi (Passerini),were counted for 2 min.
2.4. OBLR insecticide bioassays
Semi-field OBLR bioassays were conducted at three differenttime intervals, 7, 60, and 90 DAT for trees injected in the 2010 and2011 seasons. For each of the five tree replicates per treatmentthere were eight leaf punches (2.4 cm) collected from two leaves(upper crown, lower crown) on each cardinal direction side (N, S, E,W) of each tree. Tap water was used to moisten the filter paper(5.5 cm), which was pressed into a 5 cm wide Petri dish and thepunched leaf sections were placed inside. The puncher was steril-ized in acetone between each treatment. OBLR larvae from acontinuous laboratory colony, maintained at 25 �C in a walk-inenvironmental chamber with a photoperiod of 16:8 (L:D) h, wereused for the bioassays. Five first instar OBLR larvae were selectedand placed on the leaf disks spaced evenly within a dish. The disheswere sealed, labeled and placed in a walk-in environmentalchamber at 25 �C with photoperiod of 16:8 (L:D) h. After one weeklarval mortality was evaluated and leaf area consumed was calcu-lated. The eight leaf disks for all five tree replicates of each treat-ment were computer scanned against white copy paper andcalculated percent damage. Using Photoshop Elements 8, thenumber of white pixels (consumed region) and green pixels (intactfoliage) were estimated. The pixel data were transferred to Micro-soft Excel and percent foliage consumed was calculated.
2.5. Residue profiles of insecticide
2.5.1. Sample collection and preparationLeaf, fruit, and flower residue samples were taken over common
time intervals throughout the 2011 growing season, both for treesinjected in 2010 and those injected in 2011. For the 2010 continu-ation injection, leaf and flower samples were collected one year 11DAT (16 May 2011). For the 2010 continuation and 2011 injectionseasons, a leaf sample was taken on June 1 (one year 27 DAT for2010 continuation and two DAT for 2011). Leaf and fruit sampleswere then collected for both the 2010 continuation and 2011injected seasons. Samples were taken on June 6 (7 DAT and 1 year32 DAT), June 13 (14 DAT and 1 year 39 DAT), June 29 (30 DAT and 1
year 55 DAT), July 29 (60 DAT and 1 year 85 DAT), and lastly August28 (90 DAT and 1 year 115 DAT). Leaf, flower and fruit residuesamples were taken from three of the five replicate trees pertreatment. Aminimumof 10 g of tissuewas collected fromhigh andlow positions of the tree crown, and the N, S, E, W cardinal directionsides, totaling approximately 20 leaves,10 flowers and four fruit pertree. Each fruit was cut into four pieces from stem to calyx and twopieces were randomly selected from each fruit to form a 10 gcomposite sample. Each residue sample was stored in a 120 ml jar(Qorpak, Bridgeville, PA) with 50e100 ml of HPLC grade dichloro-methane and held in a cold room at 4 �C until samples were pro-cessed at Michigan State University (MSU) Pesticide Analyticallaboratory in East Lansing, MI.
Imidacloprid, emamectin benzoate, and rynaxypyr residueswere recovered in leaf, fruit, and flower tissue samples at specifictime intervals over the growing season following the protocoldeveloped by Wise et al. (2006). In brief, samples stored in HPLCgrade dichloromethane, ground and decanted through a columnpacked with 10e25 g of reagent-grade anhydrous sodium sulfate(EMD Chemicals, Inc.) to remove water. The samples were thenseparated from dichloromethane and dried using rotary evaporatorR-114 (Büchi Labortechnik AG, Flawil, Switzerland), and theremaining dry extract residue was dissolved in 2 ml of HPLC gradeacetonitrile. Dissolved sample residue was collected with a 3 mlsyringe (BD LuerLok Tip) and filtered through a connected 45-mmAcrodisc 33 mm syringe filter (Pall, East Hills, NY) to remove anyremaining particulates, and stored at 5 �C in 2 ml HPLC glass vials(Agilent Technologies Inc., Santa Clara, CA) until HPLC analysis.
2.5.2. Residue sample quantificationSamples were analyzed with a Waters 2695 Separator Module
HPLC equipped with Waters MicroMass ZQ mass spectrometerdetector (Waters, Milford, MA), and Waters X-Bridge C18 reversedphase column (50� 3.0 mm bore, 3.5 mm particle size, WatersCorp., Milford, MA) (Bayer, 1998). The mobile phase, solvent A, waswater with 0.1% formic acid, and solvent B was acetonitrile with0.1% formic acid, and was initially held at 80% solvent A and 20%solvent B and followed by a gradient. Column temperature was40 �C. Monitored ions for imidacloprid were 209 and 179 mz�1
(Da). Monitored ions for emamectin benzoate were 872.2 and886 mz�1 (Da) and for Rynaxypyr were 284 and 484.1 mz�1 (Da).The HPLC level of quantification for imidacloprid was 0.08 parts permillion (ppm) of AI, and level of detectionwas 0.016 ppm. The HPLClevel of quantification for emamectin benzoatewas 0.00065 ppm ofAI, and level of detection was 0.00013 ppm. The HPLC level ofquantification for rynaxypyr was 0.00551 ppm of AI, and level ofdetection was 0.00110 ppm.
2.6. Fungicides injected
Treatment applications weremade at silver tip growth stages on2 April 2010 and 14 April 2011. In the 2010 season, treatment ap-plications were made on 12.7e17.78 cm DFH semi-dwarf MacIn-tosh M. domestica (Borkhausen) (RedMax) apple trees. Low andhigh rates of propiconazole (Alamo®) and a single rate of phos-phites (Phospho-jet) were injected at volumes depending on DFH.A high rate of phosphites was injected at 11.1 g AI per 2.5 cm DFH, alow rate of propiconazole at 1.3 g AI per 2.54 cm DFH, and a highrate of propiconazole at 2.6 g AI per 2.54 cmDFH. Untreated controlwas represented with five non-injected trees.
The 2011 fungicide injection compared multiple-applicationregimes and one additional compound. There were 10 treatmentsthat were compared to an untreated non-injected control. In-jectionsweremade to 12.7e17.78 cmDFH treeswith a five replicatetrees per treatment in a randomized block design on the same

A.H. VanWoerkom et al. / Crop Protection 65 (2014) 173e185176
MacIntosh trees. Treatments included low and high rates of phos-phites (Phospho-jet, Arborjet Inc. Woburn, MA), low and high ratesof propiconazole (Alamo®, Arborjet Inc. Woburn, MA), and a highrate of penthiopyrad (Fontelis, DuPont Inc. Wilmington, DE). Theseinjection regimes shared a common total volume and allowedcomparison of single and dual injections over time. The first regimeinjected the total volume into a single set of four injection ports.The second regime was injected at two different times, with eachtime application conducted in a different set of four injection ports.The first set of injection ports were located 30.48 cm above theground and the second set of ports was12.7 cm above the first.
Twenty percent of the total compound volume was injected inthe first injection at silver tip stage on 14 April 11and the remainingeighty percent of the volume was applied when the foliage was atpink stage on 12 May 2011. The third regime split the total volumeinto two separate applications with another twenty and eightypercent split, but injecting into the same ports as the first appli-cation. The first application was at silver tip on 14 April 2011 andthe second was at pink stage. All three injection regimes were usedfor phosphites and propiconazole with low and high rates. Pen-thiopyrad used regime two and three with one high rate and a 50/50 percent total injected volume split instead of a 20/80 percentsplit.
Penthiopyrad treatments were not applied at ml per 2.54 cmDFH dosing. This compound was diluted to 24% due to the highviscosity of the compound. The first injectionwas made on 14 April2011. The second injection of penthiopyrad treatments 6e9 and 11was on 12 May 2011. Because of the growth stage of apple tree andweather conditions, the maximum tree uptake was between 3 and8 ml. There was a maximum of ±8 ml per injection site for thissecond injection. Treatments 2e5 and 10 took up the total intendedrates, for those volumes were under 8 ml.
All the experiments initiated in 2010 and evaluated in the 2011season are referred to as 2010 continuation.
2.7. Fungicide efficiency field evaluations
Season-long plant protection was measured by conducting aseries of field evaluations for the incidence of foliar and fruit applescab V. inaequalis (Cooke) in 2010 and 2011. Evaluations took placewhen the first symptoms were expected to be visible according toEnviroweather scab predictor (http://www.enviroweather.msu.edu/homeMap.php). All treatment replicates were rated at spe-cific DAT. The foliar apple scab was rated on a total of 20 evenlydistributed terminal shoots (from tip of shoots to first node onbranch) around the crown of each tree replicate by counting thenumber of diseased and total leaves per shoot for calculating thepercent incidence (Ehret et al., 2010). The mean percent infectionrate per 20 shoots was calculated. The incidence of fruit apple scabwas recorded on 25 fruits per tree replicate. The number of lesionson each fruit was counted, and the mean incidence was calculatedfor 25 fruit per tree replicate.
2.8. Residue profiles of fungicides
2.8.1. Sample collection and preparationPropiconazole, phosphite, and penthiopyrad residues were
recovered in leaf, fruit and flower tissue samples at specific timeintervals using the same collection and preparation techniques asthe insecticide trials. Phosphite samples, however, used thefollowing extraction method (Malusa and Tosi, 2005). Dependingon the sample size a specific volume of 1% H2SO4 sulfuric acid watersolution was added to the sample and then crushed. The sulfuricacid from the sample was decanted into a round bottom flaskthrough a filter paper (15 cm, Whatman™). Depending on the
sample size, a specific volume of lab grade (99.5%) isopropanol(Burdick and Jackson, Muskegon, MI) was added to the remainingsample, crushed again, and decanted a second time into the sameround bottom flask with previously decanted 1% sulfuric acid. Thesample was rotovaped to dryness and dissolved in 2 ml of the 1%H2SO4 solution.
Dissolved sample residue was collected with a 3 ml syringe (BDLuerLok Tip) and filtered through a connected 45-mm Acrodisc33 mm syringe filter (Pall, East Hills, NY), to remove any remainingparticulates, and stored at 5 �C in 2 ml HPLC glass vials (AgilentTechnologies Inc., Santa Clara, CA) until HPLC analysis.
2.8.2. Sample residue quantificationSamples were analyzed with a Waters 2695 Separator Module
HPLC equipped with Waters MicroMass ZQ mass spectrometerdetector (Waters, Milford, MA), and Waters X-Bridge C18 reversedphase column (50� 3.0 mm bore, 3.5 mm particle size, WatersCorp., Milford, MA) (Bayer, 1998). For penthiopyrad and phosphites,the mobile phase, solvent A, was water with 0.1% formic acid, andsolvent B was acetonitrile with 0.1% formic acid. Penthiopyrad wasinitially held at 30% solvent A and 70% solvent B and followed by agradient. Phosphites were initially held at 90% solvent A and 10%solvent B and followed by a gradient with a column temperature of40 �C. Propiconazole started at 79 �C using GC/MSD. Monitoredions for penthiopyrad were 254 nmmz�1 (Da). Monitored ions forpropiconazole were 173.1 and 259.1 mz�1 (Da). The HPLC level ofquantification for propiconazole was 1.26e�6 ppm of AI, and levelof detectionwas 0.52e�6 ppm. The HPLC/UV level of quantificationfor phosphites was 0.00123 ppm of AI, and level of detection was0.000246 ppm. The HPLC/UV level of quantification for penthio-pyrad was 0.08 ppm of AI, and level of detection was 0.016 ppm.
2.8.3. StatisticsFor some data sets, ANOVA was performed on square-root,
arcsine square-root, or log transformed data with Tukey's HSDand rawmeans were shown for comparison. Other data sets used t-tests with Levene's test to check equality of variances and if theywere found unequal they were grouped by treatments. If dataanalysis could not find significant differences because of zeros inthe data sets, data points were removed in order to meet as-sumptions of ANOVA.
3. Results
3.1. Field evaluations e insecticide
3.1.1. 2010 InjectionAt seven DAT (12 May) there was no difference in the number of
OBLR damage compared to the control (F¼ 0.263, df¼ 6, P¼ 0.949)(Table 1). Larval infestations likely occurred before the injectionstook place due to the fact that OBLR overwinter as larvae. At 40 DAT(14 June) the number of PLH nymphs were significantly lowest inthe high rate plots of imidacloprid, followed by emamectin ben-zoate, and rynaxypyr, compared to the untreated control(F¼ 35.945, df¼ 6, P¼ 0.0001) (Table 1). At 40 DAT (14 June) all sixtreatments reduced the number of STLM mines compared to thecontrol (F¼ 8.628, df¼ 6, P¼ 0.0001) (Table 1). At 40 DAT (14 June)the number of OFM flagging was significantly lower for imidaclo-prid high rate, and all rates of emamectin benzoate and rynaxypyr,but numbers in the imidacloprid low rate plots were not differentthan the untreated control (F¼ 11.558, df¼ 6, P¼ 0.0001) (Table 1).
3.1.2. 2010 Continuation injectionAt one year 18 DAT (23 May), treatments did not affect numbers
of GAA compared to the control (F¼ 7.22, df¼ 13.7, P¼ 0.0012), but

Table 1The 2010 insecticide mean number (±SE) of foliar insects or pest injury associatedwith in-season field evaluations 7 and 40 DAT, across the seven treatments (control,and low/high rates of imidacloprid, emamectin benzoate, and rynaxypyr). Meansfollowed by the same letter are not significantly different (P¼ 0.05, Tukey's HSD).ANOVA performed on square-root (SQR(Xþ0.5))transformed data; raw meansshown for comparison.
Treatment 7 DAT 40 DAT
# Leafroller # PLH nymphs # STLM mines # OFM flags
Damagedshoots
Per 20shoots
2 min count
Control 5.0 (0.9)a 1.9 (0.2)a 3.8 (1.3)a 13.6 (3.0)aImidacloprid low 5.2 (0.6)a 1.4 (0.1)a 0.4 (0.4)b 8.4 (1.5)abImidacloprid high 5.2 (1.6)a 0.2 (0.0)c 0.2 (0.2)b 5.0 (0.7)bcEmamectin
benzoate low4.0 (0.3)a 1.6 (0.1)a 0.0 (0.0)b 2.2 (0.7)c
Emamectinbenzoate high
4.8 (0.9)a 0.9 (0.1)b 0.0 (0.0)b 1.4 (0.5)c
Rynaxypyr low 4.2 (1.0)a 1.6 (0.2)a 0.0 (0.0)b 5.4 (1.0)bcRynaxypyr high 5.0 (0.7)a 0.7 (0.1)b 0.0 (0.0)b 2.4 (0.5)c
F¼ 0.263 F¼ 35.945 F¼ 8.628 F¼ 11.558P¼ 0.949 P¼ 0.0001 P¼ 0.0001 P¼ 0.0001
A.H. VanWoerkom et al. / Crop Protection 65 (2014) 173e185 177
resident counts were very low (Table 2). At one year 39 DAT (13June) the number of OBLR damaged shoots was significantly lowerfor the rynaxypyr high rate than the untreated control (F¼ 4.33,df¼ 6, P¼ 0.005) (Table 2). At one year 39 (13 June) the number of
Table 2The 2010 insecticide continuation mean number (±SE) of foliar insects or pest injury assseven treatments (control, and low/ high rates of imidacloprid, emamectin benzoate, ansignificantly different (P¼ 0.05, Tukey's HSD). ANOVA performed on square-root (SQR(Xþfollowed by the same letter are not significantly different (P¼ 0.05, t-tests, analysis is ba
Treatment 1 yr 18 DAT 1 yr 39 DA
# Live infested GAA shoots # OBLR da
2 min count
Control 1.8 (0.9)ab 49.2 (4.6)aImidacloprid low 0.0 (0.2)a 46.8 (6.9)aImidacloprid high 0.6 (0.2)ab 37.0 (7.6)aEmamectin benzoate low 1.4 (0.2)b 25.8 (6.0)aEmamectin benzoate high 2.0 (1.1)ab 35.4 (4.6)aRynaxypyr low 0.8 (0.2)b 26.0 (6.0)aRynaxypyr high 0.5 (1.1)ab 14.5 (1.7)b
F¼ 7.22 F¼ 4.33P¼ 0.0012 P¼ 0.005
Table 3The 2011 insecticide mean number (±SE) of foliar insects or pest injury associated within-low/ high rates of imidacloprid, emamectin benzoate, and rynaxypyr). For OFM, and STLMANOVA performed on square-root (SQR(Xþ0.5)) transformed data; raw means shown for(P¼ 0.05, t-tests, analysis is based on log transformed data); rawmeans shown for compat-tests, analysis is based on log transformed data); raw means shown for comparison. Rewere 0.0 in order to meet assumptions of ANOVA.
Treatment 14 DAT
# OBLR damage # PLH nymphs
Per 20 shoots
Control 44.8 (3.8)a 1.6 (0.2)aImidacloprid Low 43.0 (6.4)ab 0.1 (0.0)cImidacloprid High 45.4 (4.2)a 0.1 (0.0)cEmamectin Benzoate Low 30.8 (3.9)bc 0.7 (0.1)bEmamectin Benzoate High 30.0 (2.8)bc 0.6 (0.1)bcRynaxypyr Low 33.8 (5.8)abc 0.7 (0.1)bRynaxypyr High 28.4 (4.9)c 0.6 (0.1)bc
F¼ 2.59 F¼ 17.07P¼ 0.0398 P¼ 0.0006
PLH nymphs was significantly lower for both imidacloprid treat-ments than the control (F¼ 7.669, df¼ 6, P¼ 0.0002) (Table 2). Atone year 55 DAT (29 June) the number of OFM flagged terminalswas significantly lower for both emamectin benzoate and rynax-ypyr treatments than the untreated control (F¼ 8.97, df¼ 9.68,P¼ 0.0017) (Table 2). At one year 85 DAT (29 July) the number ofSTLM mines was significantly lower on all treatments than thecontrol. First was lowest in the rynaxypyr high rate plots, then thelow rate of imidacloprid, both emamectin benzoate rates, and lowrate of rynaxypyr treatments, followed by the high rate of imida-cloprid (F¼ 6.545, df¼ 6, P¼ 0.0004) (Table 2).
3.1.3. 2011 InjectionAt 14 DAT (13 June) the number of leafroller damages shoots was
significantly lower for emamectin benzoate treatments andrynaxypyr high compared to the control (F¼ 2.59, df¼ 6,P¼ 0.0398), but much of the damage would have been done beforethe time of injection (Table 3). At 14 DAT there were no significantdifferences in the number of RAA infestations for all treatments(F¼ 1.67, df¼ 4, P¼ 0.1962), but infestations would have occurredbefore the time of injection (Table 3). At 14 DAT (13 June) thenumber of PLH nymphs was significantly lower for all imidacloprid,emamectin benzoate, and rynaxypyr treatments than the untreatedcontrol (F¼ 17.07, df¼ 7.4, P¼ 0.0006) (Table 3). At 30 DAT (29June) the number of OFM flagged terminals was significantly lowerfor all imidacloprid, emamectin benzoate, and rynaxypyr
ociated within-season field evaluations throughout the growing season, across thed rynaxypyr). For OBLR, PLH, and STLM means followed by the same letter are not0.5))transformed data; raw means shown for comparison. For GAA and OFM meanssed on log transformed data); raw means shown for comparison.
T 1 yr 55 DAT 1 yr 85 DAT
mage # PLH nymphs # OFM flags # STLM mines
20 shoots 2-min count
2.6 (0.3)a 6.0 (0.7)a 7.2 (1.5)a0.8 (0.2)b 2.4 (0.7)bd 2.2 (1.0)bc
b 0.7 (0.1)b 3.2 (0.7)b 3.0 (1.6)bb 3.0 (0.3)a 1.8 (0.7)d 0.2 (0.2)bcb 2.3 (0.2)a 1.1 (1.4)bcd 0.9 (0.5)bcb 1.8 (0.2)ab 1.0 (0.7)c 0.8 (0.6)bc
1.5 (0.2)ab 2.7(1.4)abcd 0.0 (0.0)c
F¼ 7.669 F¼ 8.97 F¼ 6.545P¼ 0.0002 P¼ 0.0017 P¼ 0.0004
season field evaluations 14, 30, and 60 DAT, across the seven treatments(control, andmeans followed by same letter are not significantly different (P¼ 0.05, Tukey's HSD).comparison. For OBLR means followed by same letter are not significantly differentrison. For PLH means followed by same letter are not significantly different (P¼ 0.05,moved imidacloprid treatments data from RAA analysis because all replicate values
30 DAT 60 DAT
# Live infested RAA shoots # OFM flags # STLM mines
2-min count
1.2 (0.4)a 5.2 (0.9)a 5.0 (1.0)a0.0 (0.0) 1.0 (0.4)b 1.0 (0.5)b0.0 (0.0) 1.0 (0.5)b 1.2 (0.6)b0.2 (0.2)a 0.8 (0.4)b 0.0 (0.0)b0.2 (0.2)a 0.8 (0.6)b 0.0 (0.0)b0.8 (0.4)a 1.8 (0.9)b 0.0 (0.0)b0.6 (0.4)a 1.8 (0.9)b 0.2 (0.2)b
F¼ 1.67 F¼ 5.568 F¼ 14.437P¼ 0.1962 P¼ 0.001 P¼ 0.0001
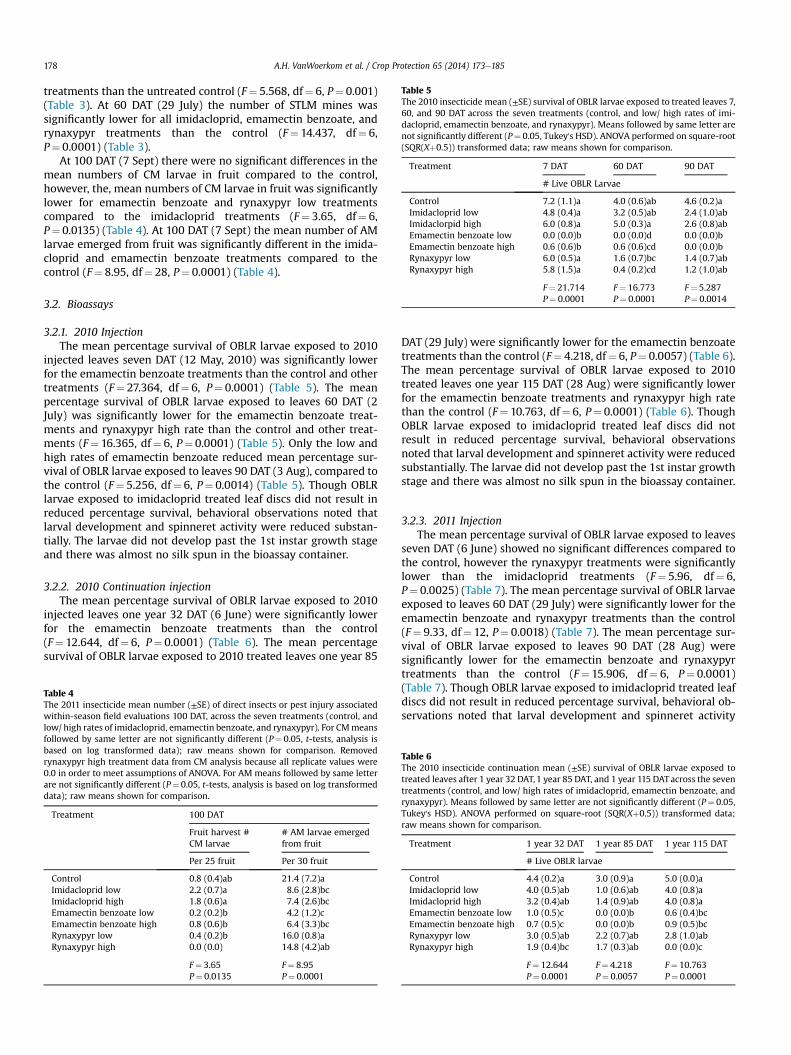
Table 5The 2010 insecticide mean (±SE) survival of OBLR larvae exposed to treated leaves 7,60, and 90 DAT across the seven treatments (control, and low/ high rates of imi-dacloprid, emamectin benzoate, and rynaxypyr). Means followed by same letter arenot significantly different (P¼ 0.05, Tukey's HSD). ANOVA performed on square-root(SQR(Xþ0.5)) transformed data; raw means shown for comparison.
Treatment 7 DAT 60 DAT 90 DAT
# Live OBLR Larvae
Control 7.2 (1.1)a 4.0 (0.6)ab 4.6 (0.2)aImidacloprid low 4.8 (0.4)a 3.2 (0.5)ab 2.4 (1.0)abImidaclorpid high 6.0 (0.8)a 5.0 (0.3)a 2.6 (0.8)abEmamectin benzoate low 0.0 (0.0)b 0.0 (0.0)d 0.0 (0.0)bEmamectin benzoate high 0.6 (0.6)b 0.6 (0.6)cd 0.0 (0.0)bRynaxypyr low 6.0 (0.5)a 1.6 (0.7)bc 1.4 (0.7)abRynaxypyr high 5.8 (1.5)a 0.4 (0.2)cd 1.2 (1.0)ab
F¼ 21.714 F¼ 16.773 F¼ 5.287P¼ 0.0001 P¼ 0.0001 P¼ 0.0014
A.H. VanWoerkom et al. / Crop Protection 65 (2014) 173e185178
treatments than the untreated control (F¼ 5.568, df¼ 6, P¼ 0.001)(Table 3). At 60 DAT (29 July) the number of STLM mines wassignificantly lower for all imidacloprid, emamectin benzoate, andrynaxypyr treatments than the control (F¼ 14.437, df¼ 6,P¼ 0.0001) (Table 3).
At 100 DAT (7 Sept) there were no significant differences in themean numbers of CM larvae in fruit compared to the control,however, the, mean numbers of CM larvae in fruit was significantlylower for emamectin benzoate and rynaxypyr low treatmentscompared to the imidacloprid treatments (F¼ 3.65, df¼ 6,P¼ 0.0135) (Table 4). At 100 DAT (7 Sept) the mean number of AMlarvae emerged from fruit was significantly different in the imida-cloprid and emamectin benzoate treatments compared to thecontrol (F¼ 8.95, df¼ 28, P¼ 0.0001) (Table 4).
3.2. Bioassays
3.2.1. 2010 InjectionThe mean percentage survival of OBLR larvae exposed to 2010
injected leaves seven DAT (12 May, 2010) was significantly lowerfor the emamectin benzoate treatments than the control and othertreatments (F¼ 27.364, df¼ 6, P¼ 0.0001) (Table 5). The meanpercentage survival of OBLR larvae exposed to leaves 60 DAT (2July) was significantly lower for the emamectin benzoate treat-ments and rynaxypyr high rate than the control and other treat-ments (F¼ 16.365, df¼ 6, P¼ 0.0001) (Table 5). Only the low andhigh rates of emamectin benzoate reduced mean percentage sur-vival of OBLR larvae exposed to leaves 90 DAT (3 Aug), compared tothe control (F¼ 5.256, df¼ 6, P¼ 0.0014) (Table 5). Though OBLRlarvae exposed to imidacloprid treated leaf discs did not result inreduced percentage survival, behavioral observations noted thatlarval development and spinneret activity were reduced substan-tially. The larvae did not develop past the 1st instar growth stageand there was almost no silk spun in the bioassay container.
3.2.2. 2010 Continuation injectionThe mean percentage survival of OBLR larvae exposed to 2010
injected leaves one year 32 DAT (6 June) were significantly lowerfor the emamectin benzoate treatments than the control(F¼ 12.644, df¼ 6, P¼ 0.0001) (Table 6). The mean percentagesurvival of OBLR larvae exposed to 2010 treated leaves one year 85
Table 4The 2011 insecticide mean number (±SE) of direct insects or pest injury associatedwithin-season field evaluations 100 DAT, across the seven treatments (control, andlow/ high rates of imidacloprid, emamectin benzoate, and rynaxypyr). For CMmeansfollowed by same letter are not significantly different (P¼ 0.05, t-tests, analysis isbased on log transformed data); raw means shown for comparison. Removedrynaxypyr high treatment data from CM analysis because all replicate values were0.0 in order to meet assumptions of ANOVA. For AM means followed by same letterare not significantly different (P¼ 0.05, t-tests, analysis is based on log transformeddata); raw means shown for comparison.
Treatment 100 DAT
Fruit harvest #CM larvae
# AM larvae emergedfrom fruit
Per 25 fruit Per 30 fruit
Control 0.8 (0.4)ab 21.4 (7.2)aImidacloprid low 2.2 (0.7)a 8.6 (2.8)bcImidacloprid high 1.8 (0.6)a 7.4 (2.6)bcEmamectin benzoate low 0.2 (0.2)b 4.2 (1.2)cEmamectin benzoate high 0.8 (0.6)b 6.4 (3.3)bcRynaxypyr low 0.4 (0.2)b 16.0 (0.8)aRynaxypyr high 0.0 (0.0) 14.8 (4.2)ab
F¼ 3.65 F¼ 8.95P¼ 0.0135 P¼ 0.0001
DAT (29 July) were significantly lower for the emamectin benzoatetreatments than the control (F¼ 4.218, df¼ 6, P¼ 0.0057) (Table 6).The mean percentage survival of OBLR larvae exposed to 2010treated leaves one year 115 DAT (28 Aug) were significantly lowerfor the emamectin benzoate treatments and rynaxypyr high ratethan the control (F¼ 10.763, df¼ 6, P¼ 0.0001) (Table 6). ThoughOBLR larvae exposed to imidacloprid treated leaf discs did notresult in reduced percentage survival, behavioral observationsnoted that larval development and spinneret activity were reducedsubstantially. The larvae did not develop past the 1st instar growthstage and there was almost no silk spun in the bioassay container.
3.2.3. 2011 InjectionThe mean percentage survival of OBLR larvae exposed to leaves
seven DAT (6 June) showed no significant differences compared tothe control, however the rynaxypyr treatments were significantlylower than the imidacloprid treatments (F¼ 5.96, df¼ 6,P¼ 0.0025) (Table 7). The mean percentage survival of OBLR larvaeexposed to leaves 60 DAT (29 July) were significantly lower for theemamectin benzoate and rynaxypyr treatments than the control(F¼ 9.33, df¼ 12, P¼ 0.0018) (Table 7). The mean percentage sur-vival of OBLR larvae exposed to leaves 90 DAT (28 Aug) weresignificantly lower for the emamectin benzoate and rynaxypyrtreatments than the control (F¼ 15.906, df¼ 6, P¼ 0.0001)(Table 7). Though OBLR larvae exposed to imidacloprid treated leafdiscs did not result in reduced percentage survival, behavioral ob-servations noted that larval development and spinneret activity
Table 6The 2010 insecticide continuation mean (±SE) survival of OBLR larvae exposed totreated leaves after 1 year 32 DAT,1 year 85 DAT, and 1 year 115 DATacross the seventreatments (control, and low/ high rates of imidacloprid, emamectin benzoate, andrynaxypyr). Means followed by same letter are not significantly different (P¼ 0.05,Tukey's HSD). ANOVA performed on square-root (SQR(Xþ0.5)) transformed data;raw means shown for comparison.
Treatment 1 year 32 DAT 1 year 85 DAT 1 year 115 DAT
# Live OBLR larvae
Control 4.4 (0.2)a 3.0 (0.9)a 5.0 (0.0)aImidacloprid low 4.0 (0.5)ab 1.0 (0.6)ab 4.0 (0.8)aImidacloprid high 3.2 (0.4)ab 1.4 (0.9)ab 4.0 (0.8)aEmamectin benzoate low 1.0 (0.5)c 0.0 (0.0)b 0.6 (0.4)bcEmamectin benzoate high 0.7 (0.5)c 0.0 (0.0)b 0.9 (0.5)bcRynaxypyr low 3.0 (0.5)ab 2.2 (0.7)ab 2.8 (1.0)abRynaxypyr high 1.9 (0.4)bc 1.7 (0.3)ab 0.0 (0.0)c
F¼ 12.644 F¼ 4.218 F¼ 10.763P¼ 0.0001 P¼ 0.0057 P¼ 0.0001
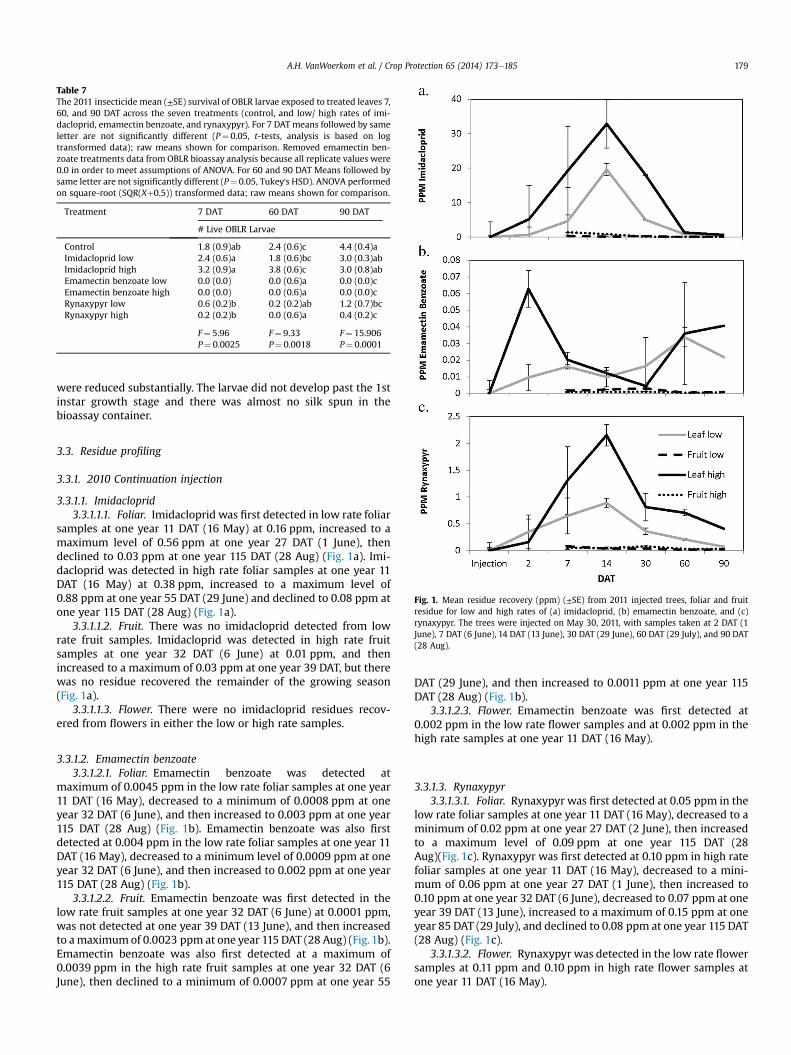
Table 7The 2011 insecticide mean (±SE) survival of OBLR larvae exposed to treated leaves 7,60, and 90 DAT across the seven treatments (control, and low/ high rates of imi-dacloprid, emamectin benzoate, and rynaxypyr). For 7 DAT means followed by sameletter are not significantly different (P¼ 0.05, t-tests, analysis is based on logtransformed data); raw means shown for comparison. Removed emamectin ben-zoate treatments data from OBLR bioassay analysis because all replicate values were0.0 in order to meet assumptions of ANOVA. For 60 and 90 DAT Means followed bysame letter are not significantly different (P¼ 0.05, Tukey's HSD). ANOVA performedon square-root (SQR(Xþ0.5)) transformed data; raw means shown for comparison.
Treatment 7 DAT 60 DAT 90 DAT
# Live OBLR Larvae
Control 1.8 (0.9)ab 2.4 (0.6)c 4.4 (0.4)aImidacloprid low 2.4 (0.6)a 1.8 (0.6)bc 3.0 (0.3)abImidacloprid high 3.2 (0.9)a 3.8 (0.6)c 3.0 (0.8)abEmamectin benzoate low 0.0 (0.0) 0.0 (0.6)a 0.0 (0.0)cEmamectin benzoate high 0.0 (0.0) 0.0 (0.6)a 0.0 (0.0)cRynaxypyr low 0.6 (0.2)b 0.2 (0.2)ab 1.2 (0.7)bcRynaxypyr high 0.2 (0.2)b 0.0 (0.6)a 0.4 (0.2)c
F¼ 5.96 F¼ 9.33 F¼ 15.906P¼ 0.0025 P¼ 0.0018 P¼ 0.0001
A.H. VanWoerkom et al. / Crop Protection 65 (2014) 173e185 179
were reduced substantially. The larvae did not develop past the 1stinstar growth stage and there was almost no silk spun in thebioassay container.
Fig. 1. Mean residue recovery (ppm) (±SE) from 2011 injected trees, foliar and fruitresidue for low and high rates of (a) imidacloprid, (b) emamectin benzoate, and (c)rynaxypyr. The trees were injected on May 30, 2011, with samples taken at 2 DAT (1June), 7 DAT (6 June), 14 DAT (13 June), 30 DAT (29 June), 60 DAT (29 July), and 90 DAT(28 Aug).
3.3. Residue profiling
3.3.1. 2010 Continuation injection
3.3.1.1. Imidacloprid3.3.1.1.1. Foliar. Imidacloprid was first detected in low rate foliar
samples at one year 11 DAT (16 May) at 0.16 ppm, increased to amaximum level of 0.56 ppm at one year 27 DAT (1 June), thendeclined to 0.03 ppm at one year 115 DAT (28 Aug) (Fig. 1a). Imi-dacloprid was detected in high rate foliar samples at one year 11DAT (16 May) at 0.38 ppm, increased to a maximum level of0.88 ppm at one year 55 DAT (29 June) and declined to 0.08 ppm atone year 115 DAT (28 Aug) (Fig. 1a).
3.3.1.1.2. Fruit. There was no imidacloprid detected from lowrate fruit samples. Imidacloprid was detected in high rate fruitsamples at one year 32 DAT (6 June) at 0.01 ppm, and thenincreased to a maximum of 0.03 ppm at one year 39 DAT, but therewas no residue recovered the remainder of the growing season(Fig. 1a).
3.3.1.1.3. Flower. There were no imidacloprid residues recov-ered from flowers in either the low or high rate samples.
3.3.1.2. Emamectin benzoate3.3.1.2.1. Foliar. Emamectin benzoate was detected at
maximum of 0.0045 ppm in the low rate foliar samples at one year11 DAT (16 May), decreased to a minimum of 0.0008 ppm at oneyear 32 DAT (6 June), and then increased to 0.003 ppm at one year115 DAT (28 Aug) (Fig. 1b). Emamectin benzoate was also firstdetected at 0.004 ppm in the low rate foliar samples at one year 11DAT (16 May), decreased to a minimum level of 0.0009 ppm at oneyear 32 DAT (6 June), and then increased to 0.002 ppm at one year115 DAT (28 Aug) (Fig. 1b).
3.3.1.2.2. Fruit. Emamectin benzoate was first detected in thelow rate fruit samples at one year 32 DAT (6 June) at 0.0001 ppm,was not detected at one year 39 DAT (13 June), and then increasedto amaximum of 0.0023 ppm at one year 115 DAT (28 Aug) (Fig.1b).Emamectin benzoate was also first detected at a maximum of0.0039 ppm in the high rate fruit samples at one year 32 DAT (6June), then declined to a minimum of 0.0007 ppm at one year 55
DAT (29 June), and then increased to 0.0011 ppm at one year 115DAT (28 Aug) (Fig. 1b).
3.3.1.2.3. Flower. Emamectin benzoate was first detected at0.002 ppm in the low rate flower samples and at 0.002 ppm in thehigh rate samples at one year 11 DAT (16 May).
3.3.1.3. Rynaxypyr3.3.1.3.1. Foliar. Rynaxypyr was first detected at 0.05 ppm in the
low rate foliar samples at one year 11 DAT (16 May), decreased to aminimum of 0.02 ppm at one year 27 DAT (2 June), then increasedto a maximum level of 0.09 ppm at one year 115 DAT (28Aug)(Fig. 1c). Rynaxypyr was first detected at 0.10 ppm in high ratefoliar samples at one year 11 DAT (16 May), decreased to a mini-mum of 0.06 ppm at one year 27 DAT (1 June), then increased to0.10 ppm at one year 32 DAT (6 June), decreased to 0.07 ppm at oneyear 39 DAT (13 June), increased to a maximum of 0.15 ppm at oneyear 85 DAT (29 July), and declined to 0.08 ppm at one year 115 DAT(28 Aug) (Fig. 1c).
3.3.1.3.2. Flower. Rynaxypyr was detected in the low rate flowersamples at 0.11 ppm and 0.10 ppm in high rate flower samples atone year 11 DAT (16 May).

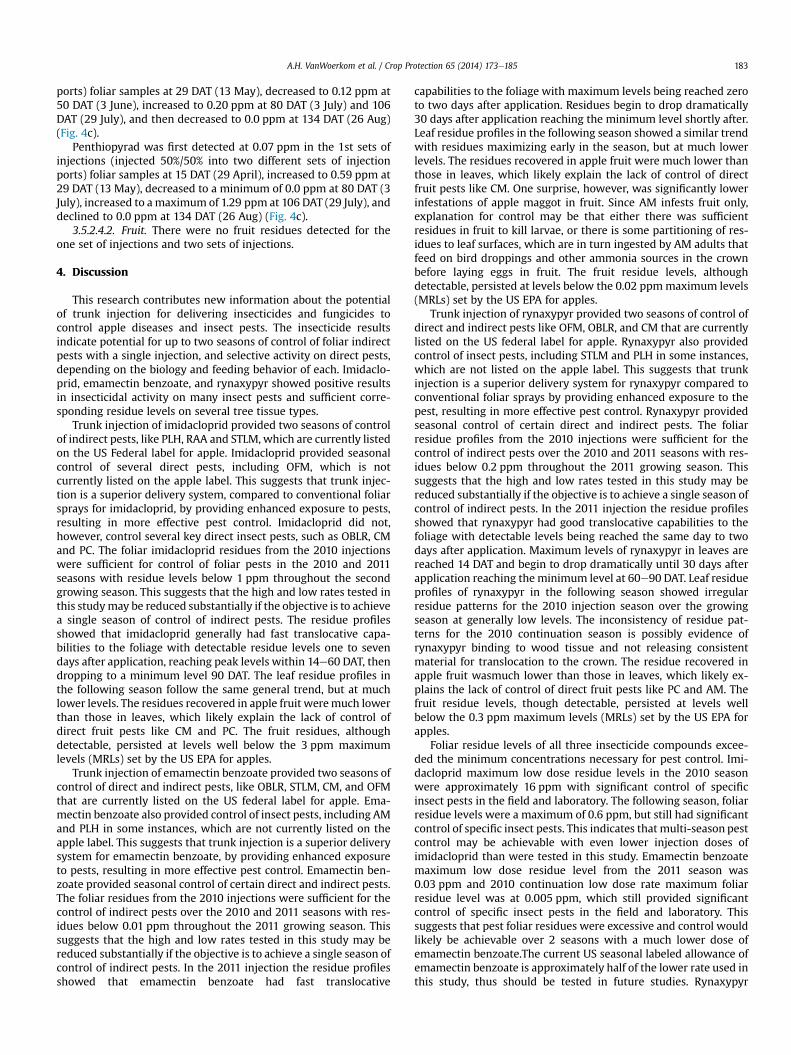
Fig. 2. Mean residue recovery (ppm) (±SE) from the 2010 continuation season, foliarand fruit residue for low and high rates of (a) imidacloprid, (b) emamectin benzoate,and (c) rynaxypyr. The trees were injected on May 5, 2010, with samples taken at 1year 11 DAT (16 May), 1 year 27 DAT (1 June), 1 year 32 DAT (6 June), 1 year 39 DAT (13June), 1 year 55 DAT (29 June), 1 year 85 DAT (29 July), and 1 year 115 DAT (28 Aug).
Table 8The 2010 fungicide mean (±SE) percentage of foliar tissue infected with apple scabout of 20 shoots per replicate throughout the growing season across the fourtreatments (control, phosphorous acid, and low/high rates of propiconazole). For 42,46, and 48 DAT means followed by the same letter are not significantly different(P¼ 0.05, Tukey's HSD). ANOVA performed on arcsine square-root (SQR(Xþ0.5))transformed data; raw means shown for comparison, analysis is based For 56 DATmeans followed by the same letter are not significantly different (P¼ 0.05, t-tests,analysis is based on log transformed data); raw means shown for comparison. PH e
significant phytotoxicity thus foliar data could not be collected. N/D e no data werecollected or compared.
Treatment 42 DAT 46 DAT 48 DAT 56 DAT
Percent infection
Control 3.2 (0.8)a 24.6 (2.3)a 29.5 (2.7)a 70.3 (2.5)aPhosphorous acid high PH PH 5.9 (2.3)b 9.5 (2.5)bPropiconazole low 0.7 (0.3)b 13.0 (1.8)b N/D 60.0 (2.5)aPropiconazole high 0.4 (0.2)b 20.1 (2.4)ab N/D 64.6 (2.5)a
F¼ 9.372 F¼ 4.824 F¼ 389.361 F¼ 2.93P¼ 0.008 P¼ 0.0422 P¼ 0.0001 P¼ 0.0653
A.H. VanWoerkom et al. / Crop Protection 65 (2014) 173e185180
3.3.2. 2011 Injection3.3.2.1. Imidacloprid
3.3.2.1.1. Foliar. Imidacloprid was first detected in the low ratefoliar samples at two DAT (1 June) at 0.63 ppm, increased to amaximum of 19.58 ppm at 14 DAT (13 June), then declined to aminimum of 0.33 ppm at 90 DAT (28 Aug) (Fig. 2a). Imidaclopridwas first detected high rate foliar samples at two DAT (1 June) at5.17 ppm, increased to a maximum of 32.85 ppm at 14 DAT (13June), then declined to 0.64 ppm at 90 DAT (28 Aug) (Fig. 2a).
3.3.2.1.2. Fruit. Imidacloprid was first detected in low rate fruitsamples at seven DAT (6 June) at 0.30 ppm, decreased to 0.12 ppmat 14 DAT (13 June), and increased to 0.28 ppm at 30 DAT (29 June)(Fig. 2a). Therewere no residues detected at 60 DAT (29 July) and 90DAT (28 Aug) (Fig. 2a). Imidacloprid was also first detected in highrate samples at seven DAT (6 June) at 1.37 ppm, increased to amaximum of 0.85 ppm at 14 DAT (13 June), then decreased to aminimum of 0.02 ppm at 90 DAT (28 Aug) (Fig. 2a).
3.3.2.2. Emamectin benzoate3.3.2.2.1. Foliar. Emamectin benzoate was first detected in the
low rate foliar samples at two DAT (1 June) at 0.01 ppm, increased
to 0.02 ppm at seven DAT (6 June), decreased to 0.01 ppm at 14 DAT(13 June), increased to a maximum of 0.03 ppm at 30 DAT (29 June),and decreased to 0.02 ppm at 90 DAT (28 Aug) (Fig. 2b). Emamectinbenzoate was first detected at a maximum of 0.06 ppm in high ratefoliar samples at two DAT (1 June), decreased to 0.004 ppm 30 DAT(29 June), and increased to 0.04 ppm at 90 DAT (28 Aug) (Fig. 2b).
3.3.2.2.2. Fruit. Emamectin benzoate was first detected in lowrate fruit samples at seven DAT (6 June) at 0.002 ppm, increased to amaximum 0.003 ppm at 30 DAT (29 June), decreased to0.0005 ppm at 60 DAT (29 July), and declined to a minimum to0.0009 ppm at 90 DAT (28 Aug)(Fig. 2b). Emamectin benzoate wasfirst detected at 0.0009 ppm in high rate fruit samples on sevenDAT (6 June), increased to a maximum of 0.001 ppm at 30 DAT (29June), decreased to a minimum of 0.0004 ppm at 60 DAT (29 July),and then declined to 0.0006 ppm at 90 DAT (28 Aug) (Fig. 2b).
3.3.2.3. Rynaxypyr3.3.2.3.1. Foliar. Rynaxypyr was first detected in the low rate
foliar samples at two DAT (1 June) at 0.35 ppm, increased tomaximum of 0.89 ppm at 14 DAT (13 June), and then decreased to aminimum of 0.07 ppm at 90 DAT (28 Aug) (Fig. 2c). Rynaxypyr wasfirst detected at 0.16 ppm in high rate foliar samples at two DAT (1June), increased to a maximum of 2.15 ppm at 14 DAT (13 June), andthen declined to a minimum of 0.41 ppm at 90 DAT (28 Aug)(Fig. 2c).
3.3.2.3.2. Fruit. Rynaxypyr was first detected at a maximum of0.08 ppm in the low rate fruit samples seven DAT (6 June),decreased to minimum of 0.015 ppm at 60 DAT (29 July), thenincreased to 0.02 ppm at 90 DAT (28 Aug) (Fig. 2c). Rynaxypyr wasalso first detected at 0.05 ppm in high rate foliar samples at sevenDAT (6 June), decreased to 0.04 ppm at 14 DAT (13 June), increasedto a maximum of 0.08 ppm at 30 DAT (29 June), declined to mini-mum of 0.031 ppm at 60 DAT (29 July), and then increased to0.033 ppm at 90 DAT (28 Aug) (Fig. 2c).
3.4. Field evaluations e fungicides
3.4.1. 2010 InjectionAt 42 DAT (14 May) the percent infection rate was significantly
lower for propiconazole treatments compared to the control(F¼ 9.372, df¼ 2, P¼ 0.008) (Table 8). No data were available forthe phosphite treatment because of significant foliar phytotoxicity.At 46 DAT (18 May) the percent infection rate was significantlylower in the propiconazole low treatment compared to the control(F¼ 4.824, df¼ 2, P¼ 0.0422) (Table 8). No data was available yet
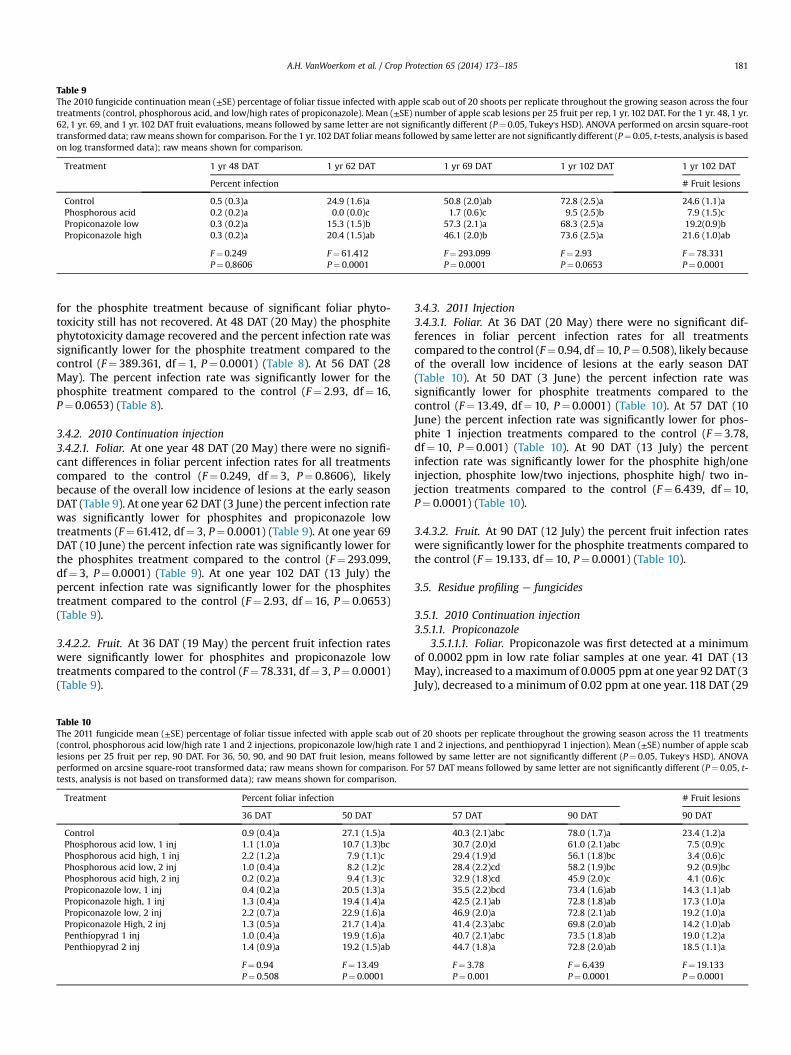
Table 9The 2010 fungicide continuation mean (±SE) percentage of foliar tissue infected with apple scab out of 20 shoots per replicate throughout the growing season across the fourtreatments (control, phosphorous acid, and low/high rates of propiconazole). Mean (±SE) number of apple scab lesions per 25 fruit per rep, 1 yr. 102 DAT. For the 1 yr. 48, 1 yr.62, 1 yr. 69, and 1 yr. 102 DAT fruit evaluations, means followed by same letter are not significantly different (P¼ 0.05, Tukey's HSD). ANOVA performed on arcsin square-roottransformed data; rawmeans shown for comparison. For the 1 yr. 102 DAT foliar means followed by same letter are not significantly different (P¼ 0.05, t-tests, analysis is basedon log transformed data); raw means shown for comparison.
Treatment 1 yr 48 DAT 1 yr 62 DAT 1 yr 69 DAT 1 yr 102 DAT 1 yr 102 DAT
Percent infection # Fruit lesions
Control 0.5 (0.3)a 24.9 (1.6)a 50.8 (2.0)ab 72.8 (2.5)a 24.6 (1.1)aPhosphorous acid 0.2 (0.2)a 0.0 (0.0)c 1.7 (0.6)c 9.5 (2.5)b 7.9 (1.5)cPropiconazole low 0.3 (0.2)a 15.3 (1.5)b 57.3 (2.1)a 68.3 (2.5)a 19.2(0.9)bPropiconazole high 0.3 (0.2)a 20.4 (1.5)ab 46.1 (2.0)b 73.6 (2.5)a 21.6 (1.0)ab
F¼ 0.249 F¼ 61.412 F¼ 293.099 F¼ 2.93 F¼ 78.331P¼ 0.8606 P¼ 0.0001 P¼ 0.0001 P¼ 0.0653 P¼ 0.0001
A.H. VanWoerkom et al. / Crop Protection 65 (2014) 173e185 181
for the phosphite treatment because of significant foliar phyto-toxicity still has not recovered. At 48 DAT (20 May) the phosphitephytotoxicity damage recovered and the percent infection rate wassignificantly lower for the phosphite treatment compared to thecontrol (F¼ 389.361, df¼ 1, P¼ 0.0001) (Table 8). At 56 DAT (28May). The percent infection rate was significantly lower for thephosphite treatment compared to the control (F¼ 2.93, df¼ 16,P¼ 0.0653) (Table 8).
3.4.2. 2010 Continuation injection3.4.2.1. Foliar. At one year 48 DAT (20 May) there were no signifi-cant differences in foliar percent infection rates for all treatmentscompared to the control (F¼ 0.249, df¼ 3, P¼ 0.8606), likelybecause of the overall low incidence of lesions at the early seasonDAT (Table 9). At one year 62 DAT (3 June) the percent infection ratewas significantly lower for phosphites and propiconazole lowtreatments (F¼ 61.412, df¼ 3, P¼ 0.0001) (Table 9). At one year 69DAT (10 June) the percent infection rate was significantly lower forthe phosphites treatment compared to the control (F¼ 293.099,df¼ 3, P¼ 0.0001) (Table 9). At one year 102 DAT (13 July) thepercent infection rate was significantly lower for the phosphitestreatment compared to the control (F¼ 2.93, df¼ 16, P¼ 0.0653)(Table 9).
3.4.2.2. Fruit. At 36 DAT (19 May) the percent fruit infection rateswere significantly lower for phosphites and propiconazole lowtreatments compared to the control (F¼ 78.331, df¼ 3, P¼ 0.0001)(Table 9).
Table 10The 2011 fungicide mean (±SE) percentage of foliar tissue infected with apple scab out(control, phosphorous acid low/high rate 1 and 2 injections, propiconazole low/high ratelesions per 25 fruit per rep, 90 DAT. For 36, 50, 90, and 90 DAT fruit lesion, means folloperformed on arcsine square-root transformed data; raw means shown for comparison. Ftests, analysis is not based on transformed data); raw means shown for comparison.
Treatment Percent foliar infection
36 DAT 50 DAT
Control 0.9 (0.4)a 27.1 (1.5)aPhosphorous acid low, 1 inj 1.1 (1.0)a 10.7 (1.3)bcPhosphorous acid high, 1 inj 2.2 (1.2)a 7.9 (1.1)cPhosphorous acid low, 2 inj 1.0 (0.4)a 8.2 (1.2)cPhosphorous acid high, 2 inj 0.2 (0.2)a 9.4 (1.3)cPropiconazole low, 1 inj 0.4 (0.2)a 20.5 (1.3)aPropiconazole high, 1 inj 1.3 (0.4)a 19.4 (1.4)aPropiconazole low, 2 inj 2.2 (0.7)a 22.9 (1.6)aPropiconazole High, 2 inj 1.3 (0.5)a 21.7 (1.4)aPenthiopyrad 1 inj 1.0 (0.4)a 19.9 (1.6)aPenthiopyrad 2 inj 1.4 (0.9)a 19.2 (1.5)ab
F¼ 0.94 F¼ 13.49P¼ 0.508 P¼ 0.0001
3.4.3. 2011 Injection3.4.3.1. Foliar. At 36 DAT (20 May) there were no significant dif-ferences in foliar percent infection rates for all treatmentscompared to the control (F¼ 0.94, df¼ 10, P¼ 0.508), likely becauseof the overall low incidence of lesions at the early season DAT(Table 10). At 50 DAT (3 June) the percent infection rate wassignificantly lower for phosphite treatments compared to thecontrol (F¼ 13.49, df¼ 10, P¼ 0.0001) (Table 10). At 57 DAT (10June) the percent infection rate was significantly lower for phos-phite 1 injection treatments compared to the control (F¼ 3.78,df¼ 10, P¼ 0.001) (Table 10). At 90 DAT (13 July) the percentinfection rate was significantly lower for the phosphite high/oneinjection, phosphite low/two injections, phosphite high/ two in-jection treatments compared to the control (F¼ 6.439, df¼ 10,P¼ 0.0001) (Table 10).
3.4.3.2. Fruit. At 90 DAT (12 July) the percent fruit infection rateswere significantly lower for the phosphite treatments compared tothe control (F¼ 19.133, df¼ 10, P¼ 0.0001) (Table 10).
3.5. Residue profiling e fungicides
3.5.1. 2010 Continuation injection3.5.1.1. Propiconazole
3.5.1.1.1. Foliar. Propiconazole was first detected at a minimumof 0.0002 ppm in low rate foliar samples at one year. 41 DAT (13May), increased to amaximum of 0.0005 ppm at one year 92 DAT (3July), decreased to a minimum of 0.02 ppm at one year. 118 DAT (29
of 20 shoots per replicate throughout the growing season across the 11 treatments1 and 2 injections, and penthiopyrad 1 injection). Mean (±SE) number of apple scabwed by same letter are not significantly different (P¼ 0.05, Tukey's HSD). ANOVAor 57 DAT means followed by same letter are not significantly different (P¼ 0.05, t-
# Fruit lesions
57 DAT 90 DAT 90 DAT
40.3 (2.1)abc 78.0 (1.7)a 23.4 (1.2)a30.7 (2.0)d 61.0 (2.1)abc 7.5 (0.9)c29.4 (1.9)d 56.1 (1.8)bc 3.4 (0.6)c28.4 (2.2)cd 58.2 (1.9)bc 9.2 (0.9)bc32.9 (1.8)cd 45.9 (2.0)c 4.1 (0.6)c35.5 (2.2)bcd 73.4 (1.6)ab 14.3 (1.1)ab42.5 (2.1)ab 72.8 (1.8)ab 17.3 (1.0)a46.9 (2.0)a 72.8 (2.1)ab 19.2 (1.0)a41.4 (2.3)abc 69.8 (2.0)ab 14.2 (1.0)ab40.7 (2.1)abc 73.5 (1.8)ab 19.0 (1.2)a44.7 (1.8)a 72.8 (2.0)ab 18.5 (1.1)a
F¼ 3.78 F¼ 6.439 F¼ 19.133P¼ 0.001 P¼ 0.0001 P¼ 0.0001
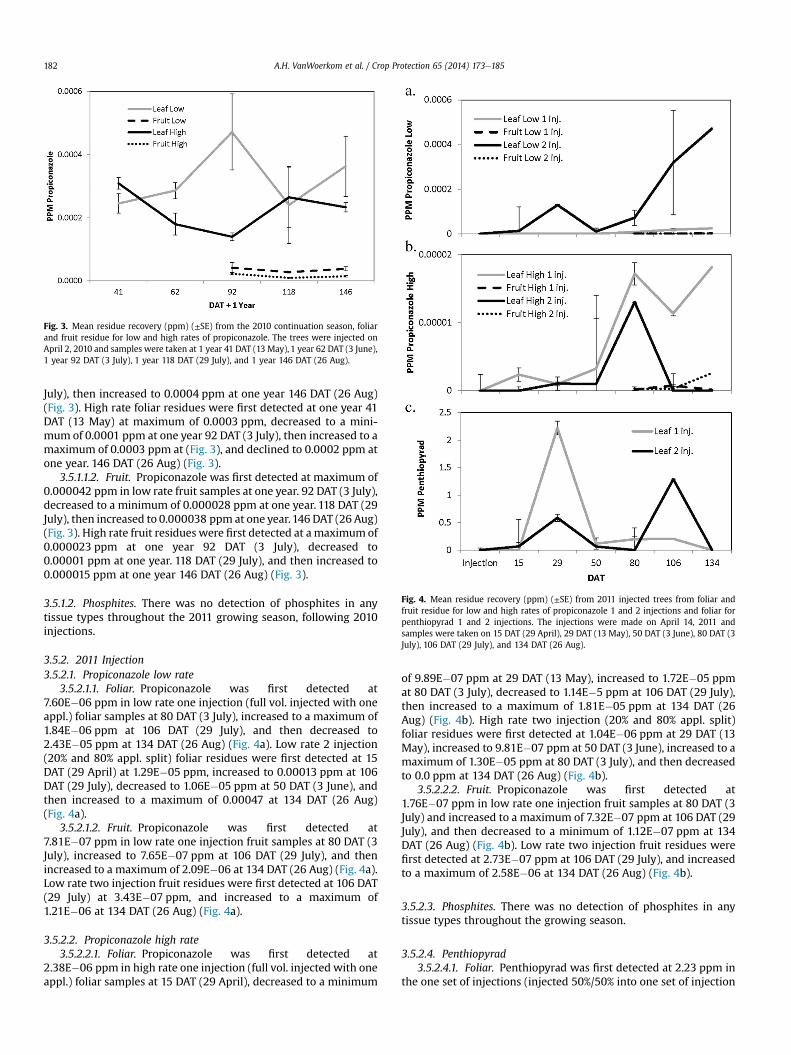
Fig. 3. Mean residue recovery (ppm) (±SE) from the 2010 continuation season, foliarand fruit residue for low and high rates of propiconazole. The trees were injected onApril 2, 2010 and samples were taken at 1 year 41 DAT (13 May), 1 year 62 DAT (3 June),1 year 92 DAT (3 July), 1 year 118 DAT (29 July), and 1 year 146 DAT (26 Aug).
Fig. 4. Mean residue recovery (ppm) (±SE) from 2011 injected trees from foliar andfruit residue for low and high rates of propiconazole 1 and 2 injections and foliar forpenthiopyrad 1 and 2 injections. The injections were made on April 14, 2011 andsamples were taken on 15 DAT (29 April), 29 DAT (13 May), 50 DAT (3 June), 80 DAT (3July), 106 DAT (29 July), and 134 DAT (26 Aug).
A.H. VanWoerkom et al. / Crop Protection 65 (2014) 173e185182
July), then increased to 0.0004 ppm at one year 146 DAT (26 Aug)(Fig. 3). High rate foliar residues were first detected at one year 41DAT (13 May) at maximum of 0.0003 ppm, decreased to a mini-mum of 0.0001 ppm at one year 92 DAT (3 July), then increased to amaximum of 0.0003 ppm at (Fig. 3), and declined to 0.0002 ppm atone year. 146 DAT (26 Aug) (Fig. 3).
3.5.1.1.2. Fruit. Propiconazole was first detected at maximum of0.000042 ppm in low rate fruit samples at one year. 92 DAT (3 July),decreased to a minimum of 0.000028 ppm at one year. 118 DAT (29July), then increased to 0.000038 ppm at one year.146 DAT (26 Aug)(Fig. 3). High rate fruit residues were first detected at amaximum of0.000023 ppm at one year 92 DAT (3 July), decreased to0.00001 ppm at one year. 118 DAT (29 July), and then increased to0.000015 ppm at one year 146 DAT (26 Aug) (Fig. 3).
3.5.1.2. Phosphites. There was no detection of phosphites in anytissue types throughout the 2011 growing season, following 2010injections.
3.5.2. 2011 Injection3.5.2.1. Propiconazole low rate
3.5.2.1.1. Foliar. Propiconazole was first detected at7.60E�06 ppm in low rate one injection (full vol. injected with oneappl.) foliar samples at 80 DAT (3 July), increased to a maximum of1.84E�06 ppm at 106 DAT (29 July), and then decreased to2.43E�05 ppm at 134 DAT (26 Aug) (Fig. 4a). Low rate 2 injection(20% and 80% appl. split) foliar residues were first detected at 15DAT (29 April) at 1.29E�05 ppm, increased to 0.00013 ppm at 106DAT (29 July), decreased to 1.06E�05 ppm at 50 DAT (3 June), andthen increased to a maximum of 0.00047 at 134 DAT (26 Aug)(Fig. 4a).
3.5.2.1.2. Fruit. Propiconazole was first detected at7.81E�07 ppm in low rate one injection fruit samples at 80 DAT (3July), increased to 7.65E�07 ppm at 106 DAT (29 July), and thenincreased to a maximum of 2.09E�06 at 134 DAT (26 Aug) (Fig. 4a).Low rate two injection fruit residues were first detected at 106 DAT(29 July) at 3.43E�07 ppm, and increased to a maximum of1.21E�06 at 134 DAT (26 Aug) (Fig. 4a).
3.5.2.2. Propiconazole high rate3.5.2.2.1. Foliar. Propiconazole was first detected at
2.38E�06 ppm in high rate one injection (full vol. injected with oneappl.) foliar samples at 15 DAT (29 April), decreased to a minimum
of 9.89E�07 ppm at 29 DAT (13 May), increased to 1.72E�05 ppmat 80 DAT (3 July), decreased to 1.14E�5 ppm at 106 DAT (29 July),then increased to a maximum of 1.81E�05 ppm at 134 DAT (26Aug) (Fig. 4b). High rate two injection (20% and 80% appl. split)foliar residues were first detected at 1.04E�06 ppm at 29 DAT (13May), increased to 9.81E�07 ppm at 50 DAT (3 June), increased to amaximum of 1.30E�05 ppm at 80 DAT (3 July), and then decreasedto 0.0 ppm at 134 DAT (26 Aug) (Fig. 4b).
3.5.2.2.2. Fruit. Propiconazole was first detected at1.76E�07 ppm in low rate one injection fruit samples at 80 DAT (3July) and increased to a maximum of 7.32E�07 ppm at 106 DAT (29July), and then decreased to a minimum of 1.12E�07 ppm at 134DAT (26 Aug) (Fig. 4b). Low rate two injection fruit residues werefirst detected at 2.73E�07 ppm at 106 DAT (29 July), and increasedto a maximum of 2.58E�06 at 134 DAT (26 Aug) (Fig. 4b).
3.5.2.3. Phosphites. There was no detection of phosphites in anytissue types throughout the growing season.
3.5.2.4. Penthiopyrad3.5.2.4.1. Foliar. Penthiopyrad was first detected at 2.23 ppm in
the one set of injections (injected 50%/50% into one set of injection
A.H. VanWoerkom et al. / Crop Protection 65 (2014) 173e185 183
ports) foliar samples at 29 DAT (13 May), decreased to 0.12 ppm at50 DAT (3 June), increased to 0.20 ppm at 80 DAT (3 July) and 106DAT (29 July), and then decreased to 0.0 ppm at 134 DAT (26 Aug)(Fig. 4c).
Penthiopyrad was first detected at 0.07 ppm in the 1st sets ofinjections (injected 50%/50% into two different sets of injectionports) foliar samples at 15 DAT (29 April), increased to 0.59 ppm at29 DAT (13 May), decreased to a minimum of 0.0 ppm at 80 DAT (3July), increased to amaximum of 1.29 ppm at 106 DAT (29 July), anddeclined to 0.0 ppm at 134 DAT (26 Aug) (Fig. 4c).
3.5.2.4.2. Fruit. There were no fruit residues detected for theone set of injections and two sets of injections.
4. Discussion
This research contributes new information about the potentialof trunk injection for delivering insecticides and fungicides tocontrol apple diseases and insect pests. The insecticide resultsindicate potential for up to two seasons of control of foliar indirectpests with a single injection, and selective activity on direct pests,depending on the biology and feeding behavior of each. Imidaclo-prid, emamectin benzoate, and rynaxypyr showed positive resultsin insecticidal activity on many insect pests and sufficient corre-sponding residue levels on several tree tissue types.
Trunk injection of imidacloprid provided two seasons of controlof indirect pests, like PLH, RAA and STLM, which are currently listedon the US Federal label for apple. Imidacloprid provided seasonalcontrol of several direct pests, including OFM, which is notcurrently listed on the apple label. This suggests that trunk injec-tion is a superior delivery system, compared to conventional foliarsprays for imidacloprid, by providing enhanced exposure to pests,resulting in more effective pest control. Imidacloprid did not,however, control several key direct insect pests, such as OBLR, CMand PC. The foliar imidacloprid residues from the 2010 injectionswere sufficient for control of foliar pests in the 2010 and 2011seasons with residue levels below 1 ppm throughout the secondgrowing season. This suggests that the high and low rates tested inthis studymay be reduced substantially if the objective is to achievea single season of control of indirect pests. The residue profilesshowed that imidacloprid generally had fast translocative capa-bilities to the foliage with detectable residue levels one to sevendays after application, reaching peak levels within 14e60 DAT, thendropping to a minimum level 90 DAT. The leaf residue profiles inthe following season follow the same general trend, but at muchlower levels. The residues recovered in apple fruit weremuch lowerthan those in leaves, which likely explain the lack of control ofdirect fruit pests like CM and PC. The fruit residues, althoughdetectable, persisted at levels well below the 3 ppm maximumlevels (MRLs) set by the US EPA for apples.
Trunk injection of emamectin benzoate provided two seasons ofcontrol of direct and indirect pests, like OBLR, STLM, CM, and OFMthat are currently listed on the US federal label for apple. Ema-mectin benzoate also provided control of insect pests, including AMand PLH in some instances, which are not currently listed on theapple label. This suggests that trunk injection is a superior deliverysystem for emamectin benzoate, by providing enhanced exposureto pests, resulting in more effective pest control. Emamectin ben-zoate provided seasonal control of certain direct and indirect pests.The foliar residues from the 2010 injections were sufficient for thecontrol of indirect pests over the 2010 and 2011 seasons with res-idues below 0.01 ppm throughout the 2011 growing season. Thissuggests that the high and low rates tested in this study may bereduced substantially if the objective is to achieve a single season ofcontrol of indirect pests. In the 2011 injection the residue profilesshowed that emamectin benzoate had fast translocative
capabilities to the foliage with maximum levels being reached zeroto two days after application. Residues begin to drop dramatically30 days after application reaching the minimum level shortly after.Leaf residue profiles in the following season showed a similar trendwith residues maximizing early in the season, but at much lowerlevels. The residues recovered in apple fruit were much lower thanthose in leaves, which likely explain the lack of control of directfruit pests like CM. One surprise, however, was significantly lowerinfestations of apple maggot in fruit. Since AM infests fruit only,explanation for control may be that either there was sufficientresidues in fruit to kill larvae, or there is some partitioning of res-idues to leaf surfaces, which are in turn ingested by AM adults thatfeed on bird droppings and other ammonia sources in the crownbefore laying eggs in fruit. The fruit residue levels, althoughdetectable, persisted at levels below the 0.02 ppmmaximum levels(MRLs) set by the US EPA for apples.
Trunk injection of rynaxypyr provided two seasons of control ofdirect and indirect pests like OFM, OBLR, and CM that are currentlylisted on the US federal label for apple. Rynaxypyr also providedcontrol of insect pests, including STLM and PLH in some instances,which are not listed on the apple label. This suggests that trunkinjection is a superior delivery system for rynaxypyr compared toconventional foliar sprays by providing enhanced exposure to thepest, resulting in more effective pest control. Rynaxypyr providedseasonal control of certain direct and indirect pests. The foliarresidue profiles from the 2010 injections were sufficient for thecontrol of indirect pests over the 2010 and 2011 seasons with res-idues below 0.2 ppm throughout the 2011 growing season. Thissuggests that the high and low rates tested in this study may bereduced substantially if the objective is to achieve a single season ofcontrol of indirect pests. In the 2011 injection the residue profilesshowed that rynaxypyr had good translocative capabilities to thefoliage with detectable levels being reached the same day to twodays after application. Maximum levels of rynaxypyr in leaves arereached 14 DAT and begin to drop dramatically until 30 days afterapplication reaching the minimum level at 60e90 DAT. Leaf residueprofiles of rynaxypyr in the following season showed irregularresidue patterns for the 2010 injection season over the growingseason at generally low levels. The inconsistency of residue pat-terns for the 2010 continuation season is possibly evidence ofrynaxypyr binding to wood tissue and not releasing consistentmaterial for translocation to the crown. The residue recovered inapple fruit wasmuch lower than those in leaves, which likely ex-plains the lack of control of direct fruit pests like PC and AM. Thefruit residue levels, though detectable, persisted at levels wellbelow the 0.3 ppm maximum levels (MRLs) set by the US EPA forapples.
Foliar residue levels of all three insecticide compounds excee-ded the minimum concentrations necessary for pest control. Imi-dacloprid maximum low dose residue levels in the 2010 seasonwere approximately 16 ppm with significant control of specificinsect pests in the field and laboratory. The following season, foliarresidue levels were a maximum of 0.6 ppm, but still had significantcontrol of specific insect pests. This indicates that multi-season pestcontrol may be achievable with even lower injection doses ofimidacloprid than were tested in this study. Emamectin benzoatemaximum low dose residue level from the 2011 season was0.03 ppm and 2010 continuation low dose rate maximum foliarresidue level was at 0.005 ppm, which still provided significantcontrol of specific insect pests in the field and laboratory. Thissuggests that pest foliar residues were excessive and control wouldlikely be achievable over 2 seasons with a much lower dose ofemamectin benzoate.The current US seasonal labeled allowance ofemamectin benzoate is approximately half of the lower rate used inthis study, thus should be tested in future studies. Rynaxypyr
A.H. VanWoerkom et al. / Crop Protection 65 (2014) 173e185184
maximum foliar low dose residue level from the 2011 season was0.9 ppm. The rynaxypyr low dose and rate 2010 continuationmaximum foliar residue level was 0.09 ppm. Both the low/ highdose and rate achieved minimalinsect pest control in the field andlaboratory in 2010 continuation and 2011 seasons indicatinginsufficient dose and rate, poor translocation, or compoundformulation drawbacks.
Insecticide residues in nectar have the potential to negativelyaffect beneficial pollinators. There were no residues recovered fromimidacloprid flower samples, a maximum of 0.0015 mg recoveredfrom emamectin benzoate, and a maximum of 0.1117 mg recoveredfrom rynaxypyr. Imidacloprid has an oral LD 50 of about 0.041 mgper bee (Nauen et al., 2001). Emamectin benzoate acute toxicity is0.0035 mg per bee, and rynaxypyr has an oral LD 50 of about 114 mgper bee (Bassi et al., 2009). The total residues detected in thecomposite flower samples were likely higher than what would befound in pollen or nectar alone. This provides preliminary evidencethat the injected rates may be safe for pollinators such as thehoneybee, but further research is needed.
Phosphites injected in the 2010 season initially caused severefoliar phytotoxicity, but afterward provided high levels of plantprotection for two field seasons. In fact the levels of apple scabcontrol in the second season were better than the current season.This suggests that when optimally distributed in the tree, lowerrates of phosphites may be adequate for apple scab control. Thismay also be a function of systemic acquired resistance (SAR) effectscontributing to the overall plant protection. SAR is an indirect effectknown as systemic acquired resistance. Phosphites are known toinduce a form of natural protection against diseases by initiatingpathogenesis-related (PR) proteins, and salicylic acid (Vallad andGoodman 2004). First there is abiotic/ abiotic trigger which pro-duces salicylic acid. The salicylic acid triggers the PR gene expres-sion which triggers the induced resistance. Different compoundstriggermore or less PR genes (Vallad and Goodman 2004). The 2011injection regimes of injecting the total volume into the same set ofports or injecting 20% volume into one set and 80% into the secondset of ports showedmuch less phytotoxicity with less volume beinginjected at one time, but with reduced scab control. An increasednumber of injection ports also may not play a role in more uniformcontrol. It has been shown with imidacloprid that more ports didnot improve spatial uniformity (A�cimovi�c et al. 2014). It is not clearwhat performance constraints are responsible for the overallweaker scab control in the 2011 injection plots.
The limited activity of trunk injected propiconazole on applescab suggests there were performance constraints related toresistance, persistence, translocation, or timing. The residue pro-files showed that propiconazole has slow translocative abilitieswith detectable residue levels 15 DAT and peak levels between 100and 130 DAT of which there is minimal active ingredient located inthe foliage. The leaf residue profiles in the following season showeda similar trend in the low rate, but at much lower levels. Thissuggests there was limited reservoir effect “feeding” the crown. Theresidues recovered in apple fruit were much lower than those inleaves. The low fruit and foliar residues likely explain the lack ofcontrol of leaf and fruit scab. Fruit residue levels were also far belowthe EPA MRL for apple.
Penthiopyrad showed minimal scab control over the 2011growing season. There were virtually no differences in the percentinfection compared to the control with both injection regimes. Theleaf residue profiles of the single and double injection showed thatthe first detectable residue is 15 DAT, which indicates slow trans-location. The active ingredient is translocated to the foliage at amaximum level of 2.23 ppm at 29 DAT then decreases rapidly to0.12 ppm 20 days later at 50 DAT, leaving minimal foliar residue.The residue profiles of the 2 injection, 20/80% split shows more
consistent foliar residue levels with two residue peaks, the firstmaximizing at 29 DAT and the second at 106 DAT. The cause ofminimal foliar and fruit scab control with the different injectionregimes is likely the result of limited active ingredient in the foliagecaused by poor translocation. The high viscosity of penthiopyradand propiconazole may be responsible for the poor translocationand injecting difficulties. These types of compounds may performbetter if diluted in water (Haugen and Stennes 1999), but may alsoresult in increased tree injury and labor time with a greater volumeinjected.
Apple scab protection in apples requires application before thefirst main infection period, which generally occurs at the firstspring rain in late March or April when green tissue is present. Thecombination of limited green tissue and cold overcast days resultsin minimal xylem translocation. To overcome this obstacle, thenumber of applications and application volumes should be mini-mized. Preparing active ingredients in formulations designed foroptimal translocation, low in viscosity and high concentration ofactive ingredient will also help.
The fungicide field evaluation and residue results on the applescab fungus V. inaequalis (Cooke) show many inconsistencies, butstill contribute new information about the potential of trunk in-jection for delivering fungicides to apples to control fungal patho-gens such as the apple scab fungus V. inaequalis (Cooke). Phosphitesprovided the best apple scab control, both in terms of duration andefficacy, although care must be taken to avoid phytotoxicity toapple foliage. Trunk injection also appears to be a superior deliverysystem for phosphites compared to conventional foliar sprays, sincenine or more foliar sprays are needed to provide season-longcontrol of apple scab. As stated previously (Percival and Boyle2005), there has been other study showing multiple season ef-fects on apple scab, which was experienced in the study withphosphites. Propiconazole showed limited activity on apple scab,both in terms of level of plant protection and duration of control.Penthiopyrad showed very low activity on apple scab, far less thanwhat has been observed with the conventional foliar spray controlof apple scab (Yanase et al. 2007).
With multiple seasons of the same pesticide residue chemistry,there is the question of resistance management. Pesticide resis-tance management is a key component of any IPM program (Wiseand Whalon 2009). Tree fruit pest management has historicallyrelied upon a temporal strategy for resistance management, byrotating chemistries (modes of action) between generations of atarget pest, thus changing the selection pressure on the populationover time. This conventional tactic is effective to the extent thatarthropod generations are distinct and not overlapping. Deliveringpesticides by trunk injection provides an opportunity to employ aspatial strategy for resistance management, whereby individualtrees or rows of trees can treated with different chemistries, thusexposing an arthropod population to a complex (or mosaic) ofmodes of action that can more effectively slow selection pressure.
This research provides an important insight into the potential oftrunk injection in apples, but there are still questions to beaddressed. The long-term impact of injections on apple tree healthis not yet understood. There may be many different beneficial or-ganisms at risk which live in apple trees. Research to determine theaffect of trunk injected compounds on various beneficial organismsis still needed. Another question to be addressed is the willingnessof the farmer to adapt to such an application strategy. The eco-nomics of trunk injection versus conventional pest managementtechniques have not yet been analyzed. A full economic analysis isneeded to determine the future potential and constraints for treefruit production. Future research should focus on compoundtransport, persistence, injection timings, volumes and rates,wounding, and risks to pollinators.
A.H. VanWoerkom et al. / Crop Protection 65 (2014) 173e185 185
Acknowledgments
Thanks to Dan Hulbert, Linda Raja, James Spica, Dana A�cimovi�cfor field, lab, and statistical analysis assistance, and the staff of theMSU Trevor Nichols Research Center in Fennville, Michigan for themaintenance of field plots. We appreciate Arborjet Inc. forproviding tree injection equipment and test materials, and Du Pontfor test materials. Thanks to the Michigan Apple Committee forproviding funding in support of this research.
References
A�cimovi�c, S.G., Van Woerkom, A.H., Reeb, P.D., Vandervoort, C., Garavaglia, T.,Cregg, B.M., Wise, J.C., 2014. Spatial and temporal distribution of trunk-injectedimidacloprid in apple tree canopy. Pest Manage. Sci. http://dx.doi.org/10.1002/ps.3747.
Bassi, A., Rison, J.L., Wiles, J.A., 2009. Chlorantraniliprole (DPX-E2Y45, Rynaxypyr®,Coragen®), a new diamide insecticide for control of codling moth (Cydiapomonella), Colorado potato beetle (Leptinotarsa decemlineata) and Europeangrapevine moth (Lobesia botrana). In: Ninth Slovenian Conference on PlantProtection (9. slovenskoposvetovanje o varstvurastlin), Nova Gorica (Slovenia),4e5 March 2009. Plant Protection Society of Slovenia; Chamber of Agricultureand Forestry of Slovenia, pp. 39e45.
Bayer, 1998. Residue Analytical Method for the Determination of Residues of Imi-dacloprid in Plant Material by HPLC. Bayer AG. Method No. 00573. Report No.MR-853/98.
Clifford, D.R., Gendle, P., Holgate, M.E., 1987. Uptake and movement of the fungicideimazalil following trunk injection into apple and plum trees by a novel, rapidtechnique. Ann. Appl. Biol. 111, 541e551.
Devine, G.J., Furlong, M.J., 2007. Insecticide use: contexts and ecological conse-quences. Agric. Human Values 24, 281e306.
Ellis, M.A., Madden, L.V., Wilson, L.L., 1984. Evaluation of an electronic apple scabpredictor for scheduling fungicides with a curative activity. Plant Dis. 68 (12),1055e1057.
Haugen, L., Stennes, M., 1999. Fungicide injection to control Dutchelm disease:understand the options. Plant Diagn. Q. 20, 29e38.
Jones, A., Sutton, T., 1996. Diseases of Tree Fruits in the East. NCR 45. Michigan StateUniversity Extension, East Lansing, Michigan.
Landers, A., 2004. Optimizing spray penetration and deposition with airblastsprayers in New York and Pennsylvania. Am. J. Enol. Viticult. 55, 434A.
Landers, A.J., 2002. Airblast sprayers. In: Pimentel, D. (Ed.), Encyclopedia of PestManagement. Marcel Dekker, New York, NY, pp. 11e12.
Landers, A., Farooq, M., 2005. Prevention is better than cure e reducing drift andimproving deposition in vineyards. In: Proceedings, International Conferenceon Pesticide Application for Drift Management, Washington, DC, pp. 385e391.
MacHardy, W.E., 1996. Apple Scab: Biology, Epidemiology, and Management.American Phytopathological Society (APS Press), St. Paul, Minnesota, USAxviþ545.
Malusa, Tosi, L., 2005. Phosphorous acid residues in apples after foliar fertilization:results of field trials. Food Addit. Contam. 22 (6), 541e548.
McCartney, S.J., Obermiller, J.D., 2008. Comparative performance of air-inductionand conventional nozzles on an axial fan sprayer in medium density appleorchards. Hort Technol. 18, 365e371.
McCullough, D.G., Cappaert, D., Poland, T.M., Lewis, P., Molongoski, J., 2005. Long-term (three-year) results of trunk injections for Emerald ash borer control inlandscape ash trees. FHTET-2005-16. In: Emerald Ash Borer Research andTechnology Development Meeting. USDA Forest Service Publication, Pittsburgh,PA, pp. 31e33.
Mota-Sanchez, D., Cregg, B.M., McCullough, D.G., Poland, T.M., Hollingworth, R.M.,2008. Distribution of Trunk-injected 14C-Imidacloprid in Ash Trees and Effectson Emerald Ash Borer (Coleoptera:Buprestidae). Adults. Crop Prot. 28, 655e661.
Nauen, R., Ebbinghaus-Kintscher, U., Schmuck, R., 2001. Toxicity and nicotinicacetylcholine receptor interaction of imidacloprid and its metabolites in Apis-mellifera (Hymenoptera: Apidae). Pest Manage. Sci. 57, 577e586.
Percival, G.C., Boyle, S., 2005. Evaluation of microcapsule trunk injections for thecontrol of apple scab and powdery mildew. Ann. Appl. Biol. 147, 119e127.
Pimentel, D., Levitan, L., 1986. Pesticides: amounts applied and amounts reachingpests. BioScience 36, 86e91.
Reichard, D.L., Fox, R.D., Brazee, R.D., Hall, F.R., 1979. Air velocities Delivered byOrchard Air Sprayers. ASAE.
Steiner, P.W., 1969. The Distribution of Spray Material Between Target and Non-target Areas of a Mature Apple Orchard by Airblast Equipment. Cornell Uni-versity, pp. 1e57. Masters Thesis.
Sundin, G.W., 2009. The 2009 Season Tree Fruit Diseases. MSU CAT-Alert BulletinSept 2009. http://ipmnews.msu.edu/fruit/Fruit/tabid/123/articleType/ArticleView/articleId/1027/The-2009-season-tree-fruit-diseases.aspx.
USEPA, 1997. Guidelines for Expedited Review of Conventional Pesticides under theReduced-risk Initiative and for Biological Pesticides. Pesticide Registration (PR)Notice 97-3(1997). http://www.epa.gov/opppmsd1/PR_Notices/pr97-3.html.
Vallad, G.E., Goodman, R.M., 2004. Systemic acquired resistance and induced sys-temic resistance in conventional agriculture. Crop Sci. 44, 1920e1934.
Wise, J., Schilder, A., Zandstra, B., Hanson, E., Gut, L., Isaacs, R., Sundin, G., 2012. 2013Michigan Fruit Management Guide. Extension Bulletin E-154. Michigan StateUniversity, East, Lansing, MI.
Wise, J., Coombs, A., VanderVoort, C., Gut, L., Hoffmann, E., Whalon, M., 2006. Use ofresidue profile analysis to identify modes of insecticide activity contributing tocontrol of plum curculio in apples. J. Econ. Entomol. 99, 2055e2064.
Wise, J., Whalon, M., 2009. A systems approach to IPM integration, ecologicalassessment and resistance management in tree fruit orchards. In: Ishaaya, I.,Rami Horowitz, A. (Eds.), Biorational Control of Arthropod Pests: Applicationand Resistance Management. Springer Publishing Ltd., Dordrecht, Heidelberg,London, New York, pp. 325e345 (Chapter 13). 409 pp.
Yanase, Y., Yoshikawa, Y., Kishi, J., Katsuta, H., 2007. The history of complex II in-hibitors and the discovery of penthiopyrad. In: Pesticide Chemistry: Crop Pro-tection, Public Health, Environmental Safety, pp. 295e301 (Chapter 5, part 31).
Zhu, H., Derksen, R.C., Guler, H., Krause, C.R., Ozkan, H.E., 2006. Foliar depositionand off-target loss with different spray techniques in nursery applications.Trans. ASABE 49, 325e334.