Modeling of Temperature-Induced Near-Infrared and Low-Field Time-Domain Nuclear Magnetic Resonance...
12
submitted papers Modeling of Temperature-Induced Near-Infrared and Low-Field Time-Domain Nuclear Magnetic Resonance Spectral Variation: Chemometric Prediction of Limonene and Water Content in Spray-Dried Delivery Systems LETI ´ CIA ANDRADE, IMADA. FARHAT, KASIA AEBERHARDT, RASMUS BRO, and SØREN BALLING ENGELSEN* University of Nottingham, School of Biosciences, Division of Food Sciences, Sutton Bonington Campus, Loughborough, LE12 5RD, UK (L.A.); Firmenich SA, Route de la Berge `re 7, 1217 Meyrin, Switzerland (I.A.F., K.A.); and University of Copenhagen, Faculty of Life Sciences, Department of Food Science, Quality & Technology, Rolighedsvej 30, DK-1958 Frederiksberg C, Denmark (R.B., S.B.E.) The influence of temperature on near-infrared (NIR) and nuclear magnetic resonance (NMR) spectroscopy complicates the industrial applications of both spectroscopic methods. The focus of this study is to analyze and model the effect of temperature variation on NIR spectra and NMR relaxation data. Different multivariate methods were tested for constructing robust prediction models based on NIR and NMR data acquired at various temperatures. Data were acquired on model spray-dried limonene systems at five temperatures in the range from 20 8C to 60 8C and partial least squares (PLS) regression models were computed for limonene and water predictions. The predictive ability of the models computed on the NIR spectra (acquired at various temperatures) improved significantly when data were preprocessed using extended inverted signal correction (EISC). The average PLS regression prediction error was reduced to 0.2%, corresponding to 1.9% and 3.4% of the full range of limonene and water reference values, respectively. The removal of variation induced by temperature prior to calibration, by direct orthogonalization (DO), slightly enhanced the predictive ability of the models based on NMR data. Bilinear PLS models, with implicit inclusion of the temperature, enabled limonene and water predictions by NMR with an error of 0.3% (corresponding to 2.8% and 7.0% of the full range of limonene and water). For NMR, and in contrast to the NIR results, modeling the data using multi-way N-PLS improved the models’ performance. N-PLS models, in which temperature was included as an extra variable, enabled more accurate prediction, especially for limonene (prediction error was reduced to 0.2%). Overall, this study proved that it is possible to develop models for limonene and water content prediction based on NIR and NMR data, independent of the measurement temperature. Index Headings: Near-infrared spectroscopy; NIR spectroscopy; Nuclear magnetic resonance; NMR; Chemometrics; Multiplicative signal correc- tion; MSC; Extended inverted signal correction; EISC; Direct orthogo- nalization; DO; Principal component analysis; PCA; Partial least squares; PLS; Multi-way PLS. INTRODUCTION Rapid spectroscopic techniques such as near-infrared (NIR) spectroscopy and low-field time-domain nuclear magnetic resonance (TD-NMR) spectroscopy play a prominent role in industrial quality control. The possibility of measuring in-line or on-line and the short analysis time (seconds) make both techniques interesting alternatives to classical analytical methods such as chromatography or solvent extraction methods, since speed is of paramount importance in process control and monitoring. However, in process analytical applications it is not always possible to keep the measure- ments’ conditions constant, and fluctuations in external variables such as temperature can have a strong influence on the measurement results. Temperature fluctuations usually induce nonlinear variations in NIR and NMR data, influencing and limiting the use of multivariate linear regression methods in data analysis. Several studies have been conducted to correct for spectral variation induced by temperature, especially for NIR, by the application of advanced chemometric multivariate techniques (the thesis presented by Wu ¨lfert 1 gives a good overview of most of these methods). One of the characteristics of NIR is its high sensitivity to temperature changes. In liquid and solid samples, NIR spectral variations due to temperature are usually related to the effect that temperature has on the absorption bands of functional groups forming inter- or intramolecular hydrogen bonds, resulting in nonlinear shifts and a narrowing of the spectral bands. 2 This is very clear in water spectra, in which the hydroxyl band shifts to lower wavelengths and becomes sharper when the temperature increases. 1 Several studies have been conducted on the analysis and correction of the temperature effect on NIR spectra of different liquid samples, 1–4 but very few results have been reported on solid systems, despite the wide use of the technique in determining a variety of quality parameters in a large number of solid systems, for example, in food and feed materials such as grains, dairy products, meat and meat products, vegetables, and fruits. 5 For these types of solid systems, as well as the samples under analysis in this work in which a liquid flavor is encapsulated in a glassy carbohydrate– water matrix, the temperature effect on NIR spectra results mainly from the impact of the temperature on hydrogen bonds. Received 5 November 2007; accepted 4 December 2008. * Author to whom correspondence should be sent. E-mail: [email protected]. Volume 63, Number 2, 2009 APPLIED SPECTROSCOPY 141 0003-7028/09/6302-0141$2.00/0 Ó 2009 Society for Applied Spectroscopy
-
Upload
independent -
Category
Documents
-
view
0 -
download
0
Transcript of Modeling of Temperature-Induced Near-Infrared and Low-Field Time-Domain Nuclear Magnetic Resonance...

submitted papers
Modeling of Temperature-Induced Near-Infrared and Low-FieldTime-Domain Nuclear Magnetic Resonance Spectral Variation:Chemometric Prediction of Limonene and Water Content inSpray-Dried Delivery Systems
LETICIA ANDRADE, IMAD A. FARHAT, KASIA AEBERHARDT, RASMUS BRO, andSØREN BALLING ENGELSEN*University of Nottingham, School of Biosciences, Division of Food Sciences, Sutton Bonington Campus, Loughborough, LE12 5RD, UK (L.A.);
Firmenich SA, Route de la Bergere 7, 1217 Meyrin, Switzerland (I.A.F., K.A.); and University of Copenhagen, Faculty of Life Sciences,Department of Food Science, Quality & Technology, Rolighedsvej 30, DK-1958 Frederiksberg C, Denmark (R.B., S.B.E.)
The influence of temperature on near-infrared (NIR) and nuclear magnetic
resonance (NMR) spectroscopy complicates the industrial applications of
both spectroscopic methods. The focus of this study is to analyze and model
the effect of temperature variation on NIR spectra and NMR relaxation
data. Different multivariate methods were tested for constructing robust
prediction models based on NIR and NMR data acquired at various
temperatures. Data were acquired on model spray-dried limonene systems
at five temperatures in the range from 20 8C to 60 8C and partial least
squares (PLS) regression models were computed for limonene and water
predictions. The predictive ability of the models computed on the NIR
spectra (acquired at various temperatures) improved significantly when
data were preprocessed using extended inverted signal correction (EISC).
The average PLS regression prediction error was reduced to 0.2%,
corresponding to 1.9% and 3.4% of the full range of limonene and water
reference values, respectively. The removal of variation induced by
temperature prior to calibration, by direct orthogonalization (DO),
slightly enhanced the predictive ability of the models based on NMR data.
Bilinear PLS models, with implicit inclusion of the temperature, enabled
limonene and water predictions by NMR with an error of 0.3%
(corresponding to 2.8% and 7.0% of the full range of limonene and
water). For NMR, and in contrast to the NIR results, modeling the data
using multi-way N-PLS improved the models’ performance. N-PLS
models, in which temperature was included as an extra variable, enabled
more accurate prediction, especially for limonene (prediction error was
reduced to 0.2%). Overall, this study proved that it is possible to develop
models for limonene and water content prediction based on NIR and NMR
data, independent of the measurement temperature.
Index Headings: Near-infrared spectroscopy; NIR spectroscopy; Nuclear
magnetic resonance; NMR; Chemometrics; Multiplicative signal correc-
tion; MSC; Extended inverted signal correction; EISC; Direct orthogo-
nalization; DO; Principal component analysis; PCA; Partial least squares;
PLS; Multi-way PLS.
INTRODUCTION
Rapid spectroscopic techniques such as near-infrared (NIR)spectroscopy and low-field time-domain nuclear magnetic
resonance (TD-NMR) spectroscopy play a prominent role inindustrial quality control. The possibility of measuring in-lineor on-line and the short analysis time (seconds) make bothtechniques interesting alternatives to classical analyticalmethods such as chromatography or solvent extractionmethods, since speed is of paramount importance in processcontrol and monitoring. However, in process analyticalapplications it is not always possible to keep the measure-ments’ conditions constant, and fluctuations in externalvariables such as temperature can have a strong influence onthe measurement results. Temperature fluctuations usuallyinduce nonlinear variations in NIR and NMR data, influencingand limiting the use of multivariate linear regression methodsin data analysis. Several studies have been conducted to correctfor spectral variation induced by temperature, especially forNIR, by the application of advanced chemometric multivariatetechniques (the thesis presented by Wulfert1 gives a goodoverview of most of these methods).
One of the characteristics of NIR is its high sensitivity totemperature changes. In liquid and solid samples, NIR spectralvariations due to temperature are usually related to the effectthat temperature has on the absorption bands of functionalgroups forming inter- or intramolecular hydrogen bonds,resulting in nonlinear shifts and a narrowing of the spectralbands.2 This is very clear in water spectra, in which thehydroxyl band shifts to lower wavelengths and becomes sharperwhen the temperature increases.1 Several studies have beenconducted on the analysis and correction of the temperatureeffect on NIR spectra of different liquid samples,1–4 but veryfew results have been reported on solid systems, despite thewide use of the technique in determining a variety of qualityparameters in a large number of solid systems, for example, infood and feed materials such as grains, dairy products, meat andmeat products, vegetables, and fruits.5 For these types of solidsystems, as well as the samples under analysis in this work inwhich a liquid flavor is encapsulated in a glassy carbohydrate–water matrix, the temperature effect on NIR spectra resultsmainly from the impact of the temperature on hydrogen bonds.
Received 5 November 2007; accepted 4 December 2008.* Author to whom correspondence should be sent. E-mail: [email protected].
Volume 63, Number 2, 2009 APPLIED SPECTROSCOPY 1410003-7028/09/6302-0141$2.00/0
� 2009 Society for Applied Spectroscopy
This effect can compromise the modeling of the data, limitingthe usefulness of calibration and prediction models.
The composition of solid systems, such as most foods, canalso be determined by NMR relaxometry, based on thedifferent magnetization decays of each component.6,7 Themagnitude of 1H-NMR signals is proportional to the separationof spin populations in the two possible spin states, whichdepends on temperature, according to the Boltzmann distribu-tion law.8,9 Increasing the temperature results in an excess ofprotons in the lower energy state, leading to a decrease of theNMR signal. For example, at 23 MHz (frequency of the NMRinstrument used in this study), this effect would lead to a 12%loss of signal magnitude over the temperature range of interest(20–60 8C). Moreover, temperature influences the mobility ofthe different components present in a sample, affecting theirrelaxation behavior. For example, for solid samples such asfood materials, in which water plays an important role,temperature affects the physical state of the samples. Thecombined impact of the increased temperature and plasticiza-tion by water could lead to the convergence of the relaxationtimes of the NMR decays of water and low molecular weight(Mw) carbohydrates.10
The advantages of multivariate analysis in exploiting datasuch as those obtained by NIR and NMR have been discussedelsewhere.11 Different strategies for handling spectral variationinduced by temperature have been described and reported, butgenerally two main chemometric approaches can be applied:either the implicit or explicit inclusion of the temperatureinterference into the model or the correction for it prior tomodel computation by preprocessing the data.1 Implicitinclusion of the temperature effect is very appealing forindustrial purposes, as knowledge of the temperature is notrequired. Often, temperature is not known or easily measured(e.g., in porous materials) or controlled (e.g., when samplingfrom drying or baking lines in factories).
Several data preprocessing tools have been developed fortemperature spectral correction. For example, although extend-ed inverted signal correction (EISC)12,13 was developed mainlyfor spectral scatter correction, it includes parameters to accountfor physical and chemical phenomena that may affect themeasured absorbance spectra, making EISC a potentialalternative for correcting for variations on NIR data inducedby temperature (to a certain extent). The main advantage of thisapproach is that knowledge of temperature is not required. Asecond data preprocessing method that has proved to besuccessful in the removal of the temperature effect on spectralvariation is the so-called direct orthogonalization (DO)14
approach, which, however, requires knowledge of the mea-surement temperature. Recently, multi-way chemometricmethods, characterized by addition of the temperature as anextra mode of variables, have been developed in order to modelspectroscopic data acquired at variable temperature. In thesemethods, the temperature effect on spectra is considered asvaluable information and therefore, instead of removing it,multi-way models take advantage of the trilinear data structurethat results from data acquisition at different temperatures. N-PLS, which is an extension of partial least squares (PLS)15,16
regression to multi-way data, is commonly used for buildingmulti-way regression models.17 However, if the variationinduced by temperature is highly nonlinear, the applicability ofmodels such as N-PLS may be limited.
Recently, a quantitative method for measuring flavor and
water content in spray-dried flavor delivery systems wasproposed.18 Low field TD-NMR and NIR data were acquiredon spray dried flavor delivery systems at a constant temperature(20 8C). Simple PLS regression models computed on the dataacquired, for the prediction of flavor and water content, showedexcellent predictive ability, with correlation coefficients (r)between 0.96 and 1.00 and low prediction errors compared tothe concentration range. The main goal of this study is todemonstrate the possibility of extending the flavor and watercontent prediction models to include a range of temperatures,i.e., to develop calibration models independent of thetemperature at which NIR or NMR data are acquired.
MATERIALS AND METHODS
Samples and Preparation. Near-infrared and NMR datawere acquired on a set of spray-dried limonene systems inwhich limonene, as a model flavor, was encapsulated in amatrix composed of maltodextrin and gum arabic. A completedescription of the samples, including preparation steps, haspreviously been reported.18 The initial sample set consisted offive samples: one control (not containing limonene) and fourothers with 2.6%, 5.1%, 9.2%, and 10.7% (w/w) limonene,determined by steam distillation (modified method 2.8.12,European Pharmacopoeia, 1997). The initial water content ofeach system was determined by Karl–Fisher titration19 as being5.4%, 6.1%, 5.4%, 4.6%, and 4.7% for the control and thesystems containing limonene, respectively.
A procedure similar to the one described by Andrade et al.18
was followed to obtain different levels of water content.Subsamples of each sample were stored at different relativehumidities (RH) at ambient temperature for a period of onemonth. The range of RHs were as follows: RH ¼ 0% (P2O5),and over the following saturated salt solutions: LiCl (RH ¼11%), CH3COOK (RH ¼ 22%), MgCl2 (RH ¼ 33%), K2CO3
(RH ¼ 40%), Mg(NO3)2 (RH ¼ 54%), NaBr (RH ¼ 59%),NaNO3 (RH ¼ 74%), KCl (RH ¼ 85%), and K2SO4 (RH ¼98%). Samples were stored in climate boxes twice (each timefor one month). The first set of samples, consisting of 25samples having different combinations of limonene and water,for which the final water-content range was 2.8% to 7.1%, wasanalyzed by NMR. The second set of samples, consisting of 35samples, with water content varying from 0% to 5.8%, wasused for NIR data acquisition. The difference in water-contentranges may suggest different storage temperatures or that thesolutions were not initially saturated.
Near-Infrared Measurements. Dispersive NIR data werecollected using a NIRSystems spectrophotometer 6500 (NIR-Systems Inc., Silver Spring, MD). Data were acquired in therange from 1100 nm to 2498 nm, with a sampling frequency of2 nm, using a halogen light source and a lead sulfide detector.The angle of the incident light was 1808 and reflectance wasmeasured at an angle of 458. The NIR reflectance spectra wererecorded at five temperature values, room temperature(approximately constant and equal to 20 8C), and 30, 40, 50,and 60 8C, in a rotating sample cup with a quartz window,which is especially useful for powder samples. The NIR spectrawere converted to log(1/R) units prior to data analysis using aninternal ceramic reference. In total, 175 NIR spectra werecollected (35 samples 3 5 temperature values).
Nuclear Magnetic Resonance Measurements. The NMRanalysis was performed using a 23.2 MHz benchtop pulsed 1H-NMR spectrometer (Oxford Instruments) equipped with an 18
142 Volume 63, Number 2, 2009

mm diameter variable temperature probe head. Spin-echo datawere acquired using the CPMG sequence20,21 at fivetemperature values, 20, 30, 40, 50, and 60 8C. A total of 128FID points (dwell time¼ 1 ls) were acquired along with 1024spin-echoes (1 point per echo) in the CPMG, with a 908–1808pulse spacing (s) of 3.5 ms in order to record the completedecay of limonene. The relaxation delay between consecutivescans was set to 5 s, and 16 scans were accumulated. Thereceiver gain (RG) was optimized and kept constant for allmeasurements. For each sample (i.e., at a given limonene andwater content), duplicate subsamples (;2.5 g) were analyzed.The exact mass of each sample was recorded and used tonormalize the acquired data. In total, 250 NMR spectra werecollected (25 samples 3 5 temperature values 3 2 duplicates).
Prior to NIR and NMR data acquisition, samples werethermally equilibrated at 20, 30, 40, 50, or 60 8C for a period of30 minutes.
Chemometrics. The advantages of chemometric tools inextracting spectral information from multivariate co-linear datasuch as NIR and NMR have been studied and discussed for thelast thirty years. A review by Munck et al.11 provides details. Asimilar procedure to the one described by Andrade et al.18 wasadopted to analyze both NIR and NMR data sets. Principalcomponent analysis (PCA)22,23 was applied to investigatepatterns and common trends in the data sets, and PLSregression15,16 was used to correlate the NIR or NMR data tolimonene and water content reference data, generatingmultivariate linear regression models. For modeling purposes,data preprocessing, outlier detection, variable selection, andcalibration are all interdependent phenomena. Therefore, aniterative procedure, where all aspects were continually revised,was performed and several models were computed. Theprediction models were mainly evaluated and compared onthe basis of the validation parameters: RMSECV (root meansquare error of cross-validation), r (correlation coefficient), andthe optimal number of PLS components as determined bycross-validation.
The design of the experiments involved data acquisition atfive different temperatures. This additional metavariable(temperature) enabled analysis of the data using two differentchemometric approaches:
Application of Standard Bilinear Chemometric Tech-niques. In this case, two-way or bilinear data matrices wereobtained by considering each sample at each temperature as anindependent sample. Modeling was then performed applyingtwo distinct strategies, implicitly and explicitly including thetemperature variation. To include the temperature variation inthe calibration models implicitly, data collected at differenttemperatures were appended vertically, resulting in 175 and250 samples for NIR and NMR data analysis, respectively. Thedifference in the number of samples is due to the difficulty inobtaining constant and similar water content values during thetwo independent storage periods in different RH environments.The sizes of the resulting data matrices were: 175 (samples) 3700 (wavelengths) for NIR and 250 (samples) 3 1152 (timevalues) for NMR. These data matrices were used to build PLSmodels for the prediction of limonene and water content.
The second two-way chemometric strategy tested was theexplicit inclusion of temperature variation in the calibrationmodels (knowledge of the temperature required). In this case,data collected at different temperatures were concatenated. Forboth data sets, NIR and NMR, the number of variables
increased five times, giving rise to the following data matrices:35 (samples) 3 3500 (wavelengths) for NIR and 50 (samples)3 5760 (time values) for NMR, used to build PLS models forthe prediction of limonene and water content.
Application of Multi-way Chemometric Techniques. In thiscase, three-way data arrays were obtained by considering eachsample measured at different temperatures as an independentsample, i.e., the temperature was considered as an extradimension. The size of the resulting data array was: 35(samples) 3 5 (temperatures) 3 700 (wavelengths) for NIR and50 (samples) 3 5 (temperatures) 3 1152 (time values) forNMR. To preserve and take advantage of the three-way datastructures, three-way N-PLS17 regression models were com-puted.
The final goal was to address the effect of temperaturevariation in NIR and NMR spectra and to compute models forthe prediction of limonene and water content, independent ofthe measurement temperature, i.e., models in which thetemperature variation was implicitly included. Models withexplicit inclusion of temperature were computed for compar-ison purposes.
Data Preprocessing. Two main possibilities to address theeffect of temperature were outlined above: inclusion of thetemperature variation into the calibration design (implicitly orexplicitly) and correction of the spectra for temperature-induced variations prior to computation with the models.Several studies have been conducted to develop suitable datapreprocessing techniques for temperature correction.1 In thisstudy, three preprocessing tools were tested on the NIR dataset, multiplicative signal correction (MSC),12,24 extendedinverted signal correction (EISC),13 and direct orthogonaliza-tion (DO).14 The selection of these tools was based on previouswork in which data preprocessing techniques were tested andcompared.12,14,25,26 The EISC model was used in its simplestform, with general implementation in wavelength (k) andwavelength squared (k2) but with no explicit interference oranalyte signals, such as was demonstrated in an infrared modelstudy of water by Martens et al.12 The comparison between thedifferent approaches was mainly based on the performance ofregression models computed on the raw and preprocessed data.
In the case of NMR, data preprocessing tools are verylimited, partly because chemometric techniques have onlyrecently been applied to time-domain NMR (TD-NMR). So far,data preprocessing methods are based mainly on normalizationapproaches and on Fourier and Laplace transformations.27,28
Normalization procedures are mainly used to correct fordifferences in sample quantity, not accounting for datavariations induced by temperature. Fourier and Laplacetransformations are simply applied to convert data acquired
TABLE I. Models and strategies applied to NIR and NMR data setsacquired on spray-dried limonene delivery systems at variable temper-ature.
Preprocessing
Two-way chemometricsThree-way
chemometrics
Implicitinclusion of T
Explicitinclusion of T
Explicitinclusion of T
None NMR, NIR NMR, NIR NMR, NIRMSC NIR NIR NIREISC NIR NIR NIRDO NMR, NIR NMR, NIR NMR, NIR
APPLIED SPECTROSCOPY 143

in the time domain to the Fourier or Laplace domain,respectively, not accounting for data variation induced bytemperature.27,28 In this work, DO was tested as a newapproach to account for TD-NMR data variation due totemperature. Since NMR data are not significantly affected byadditive and multiplicative effects, MSC and EISC are notapplicable.
As an overview, Table I summarizes the most importantcharacteristics of the models computed.
Multiplicative signal correction12,24 is a technique forremoving the variation caused by physical scatter that ariseswhen measuring directly on, for example, powder samples. InMSC, the average spectrum of all samples is calculated andsimple linear univariate regression between this spectrum andall other individual spectra is performed. The individuallyestimated offset and slope are then subtracted from and dividedby each individual spectrum, thereby yielding a correctedspectrum.26
The inverse of the MSC model was first described byHelland et al., who named it inverted scatter correction (ISC).29
Martens et al. have presented an extension of the ISC model,the so called EISC,12 which includes new parameters toaccount for physical and chemical phenomena that affect themeasured absorbance spectra. In a later study, EISC was shownto be superior to MSC, resulting in better PLS models for theprediction of protein content of wheat kernels, based on near-infrared transmittance data.13
Direct orthogonalization was proposed by Andersson14 as amultivariate method for removing factors that describeirrelevant phenomena from data in calibration situations. Toremove a specific factor, data are orthogonalized according toEq. 1, in which Y represents a vector (or matrix) with thefactor(s) for which spectra are to be corrected.
X0ortho ¼ X0 � X0YðY0YÞ�1Y0 ð1Þ
DO proved to be successful when applied to NIR andfluorescence data for the determination of the pre-crystalliza-tion stage in chocolate; the removal of chocolate recipecharacteristics from spectra by DO facilitated classification andregression tasks.30
It is worth mentioning that DO requires knowledge of thevariable whose features are to be subtracted from the data. Forexample, in the present study, when data are orthogonalizedwith respect to temperature, the DO preprocessing step requiresthat the temperature be known.
Variable Selection. Interval-PLS (iPLS)31 was used in anattempt to develop optimized parsimonious PLS regressionmodels for limonene and water-content predictions built onfewer variables (selected intervals of NIR and NMR datapoints). iPLS develops local PLS regression models usingsubintervals of the full-spectrum region, the predictionperformance of which is compared to the global (full-spectrum)model.31 Both for NIR and NMR, none of the data intervalstested resulted in better predictions when compared to themodeling of the global spectra and, therefore, we shall notdiscuss iPLS results further.
Validation. To validate and test the robustness of the modelscomputed on the NIR and NMR data sets (using the severalapproaches described previously), different cross-validationschemes were implemented. Each limonene and waterprediction model was cross-validated using different numbersof segments corresponding to duplicate samples, limonene orwater content, and temperature. The resulting models were thencompared and their robustness was assessed. All resultsreported are based on systematic cross-validation withduplicate samples in the same segment for the NMR dataand full cross-validation for the NIR data.
Bilinear chemometric models were computed in LatentiXversion 1.00 (Latent5, Copenhagen, Denmark). MSC, EISC,and DO preprocessing of data, as well as trilinear models, werecalculated in MATLAB version 7.2 (R2006a) (The MathWorks
FIG. 1. Raw NIR spectra acquired on spray-dried limonene delivery systemsat 20, 30, 40, 50, and 60 8C; spectra are shaded in grayscale (from low: lightgray, to high: dark gray) according to (A) water content, (B) limonene content,and (C) temperature.
144 Volume 63, Number 2, 2009

Inc., Natick, Ma) using the PLS Toolbox (version 4.0,Eigenvector Research, Inc., Wenatchee, WA).
RESULTS AND DISCUSSION
Near-Infrared Spectroscopy. From Fig. 1, which presentsthe raw NIR spectra gray-shaded according to water content,limonene content, and temperature, it is observed that watercontent is responsible for the largest raw spectral variation. InFig. 1A, where the samples are shaded according to watercontent, a systematic spectral variation can be identified (forexample, note the NIR spectral region around 1920 nm,characteristic of water presence, in which a clear spectralpattern according to water content is noticeable). However, asystematic effect of temperature could be identified when thespectra of individual samples at different temperatures wereinspected (results not shown).
Chemometrics. Raw and preprocessed data (MSC, EISC,and DO) were modeled by the different chemometricapproaches (two- and three-way techniques) described above.As an overview, Tables II and III summarize the main results ofthe PLS regression models computed for limonene and water-content prediction. The best predictive models were obtainedon EISC preprocessed data with implicit inclusion of thetemperature (two-way approach: 175 samples 3 700 wave-lengths).
Focusing on the two-way modeling (with implicit inclusionof the temperature), the performance and applicability of each
data preprocessing technique, MSC, EISC, and DO, wasjudged according to the limonene and water content predictionresults obtained when PLS models were computed on the rawand transformed data. PLS models were calculated andassessed by the predictions obtained from cross-validation.Preprocessing was done within the cross-validation, in order tobe able to assess the uncertainty stemming from thepreprocessing step.
For each preprocessed data set, local PLS models were alsocomputed, i.e., data acquired at 20, 30, 40, 50, and 60 8C weremodeled independently. The computation of the local modelswas mainly done to get an optimistic estimate of the RMSECVobtained for the global models. In principle, the global models,being more complex, should not be as accurate as local models,resulting in higher RMSECV values.
From the comparisons amongst all the models computed,EISC was identified to be the best approach. For limonene-content prediction, preprocessing the data using the EISCapproach resulted in simpler and more accurate models. Thecomputation of three principal components (PCs) resulted in aRMSECV value of 0.2% (for the raw data set, six PCs resultedin a RMSECV value of 0.3%). Moreover, when computingEISC data, the global model showed similar performance whencompared to the local models (in contrast to the resultsobtained when raw, MSC and DO data were computed). Forwater, EISC preprocessing did not result in simpler models orlower RMSECV values. However, it enabled the computation
TABLE II. PLS prediction results for determination of limonene content in spray-dried limonene delivery systems using models based on differentpreprocessed NIR data (1100 nm to 2498 nm).
Preprocessing
Two-way chemometrics (bilinear) Three-way chemometrics (trilinear)
X ¼ [175 3 700], implicit inclusion of T X ¼ [35 3 3500], explicit inclusion of T X ¼ [35 3 5 3 700], explicit inclusion of T
#PCsa RMSECV (%)b #PCsa RMSECV (%)b #PCsa RMSECV (%)b
None 6 0.3 5 0.3 5 0.3MSC 6 0.2EISC 3 0.2 3 0.3 3 0.3DO (T)c 6 0.2 5 0.3DO (water) 6 0.6DO (T þ water)c 4 0.9EISCþDO (T)c 3 0.2 3 0.3EISCþDO (water) 3 0.8EISCþDO (Tþwater)c 3 0.8
a Number of principal components used to describe the models.b Root mean square error of cross-validation.c Knowledge of temperature required in data preprocessing.
TABLE III. PLS prediction results for determination of water content using models based on different preprocessed NIR data (1100 nm to 2498 nm).
Preprocessing
Two-way chemometrics (bilinear) Three-way chemometrics (trilinear)
X ¼ [175 3 700], implicit inclusion of T X ¼ [35 3 3500], explicit inclusion of T X ¼ [35 3 5 3 3500], explicit inclusion of T
#PCsa RMSECV (%)b #PCsa RMSECV (%)b #PCsa RMSECV (%)b
None 6 0.2 6 0.2 5 0.2MSC 6 0.2EISC 6 0.2 6 0.2 6 0.2DO (T)c 6 0.2 6 0.2EISC þ DO (T)c 6 0.2 6 0.2
a Number of principal components used to describe the models.b Root mean square error of cross-validation.c Knowledge of temperature required in data preprocessing.
APPLIED SPECTROSCOPY 145
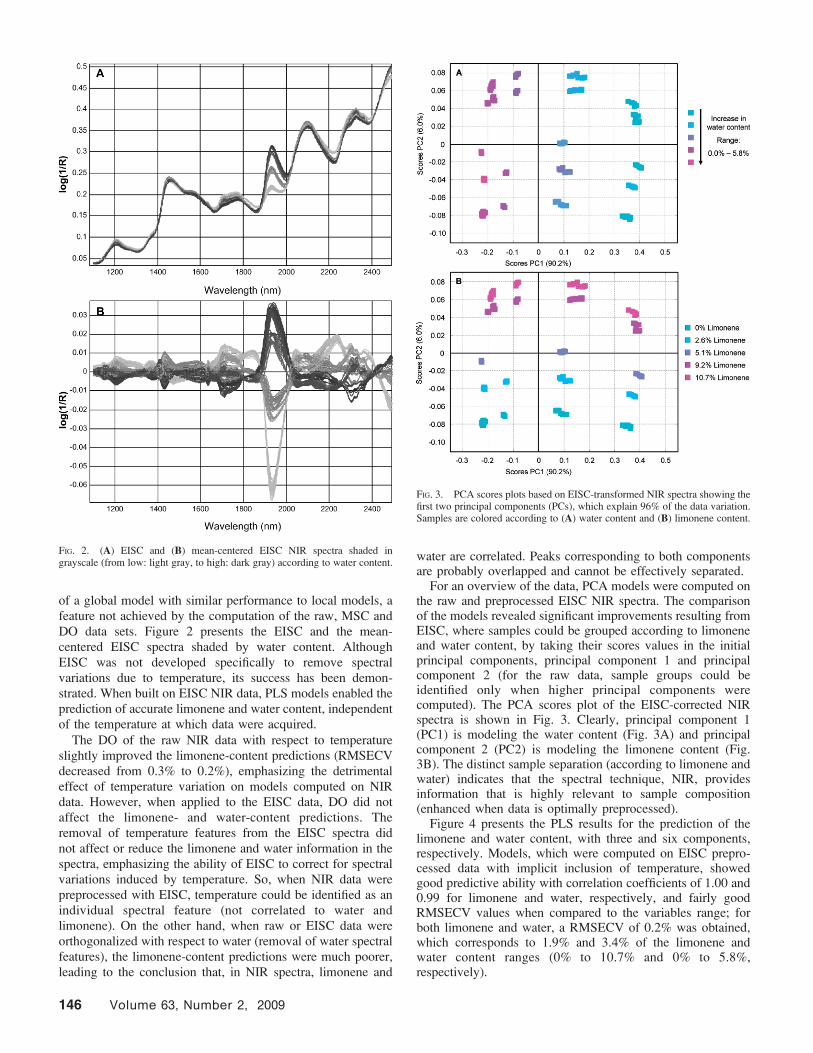
of a global model with similar performance to local models, afeature not achieved by the computation of the raw, MSC andDO data sets. Figure 2 presents the EISC and the mean-centered EISC spectra shaded by water content. Although
EISC was not developed specifically to remove spectralvariations due to temperature, its success has been demon-strated. When built on EISC NIR data, PLS models enabled theprediction of accurate limonene and water content, independentof the temperature at which data were acquired.
The DO of the raw NIR data with respect to temperatureslightly improved the limonene-content predictions (RMSECVdecreased from 0.3% to 0.2%), emphasizing the detrimentaleffect of temperature variation on models computed on NIRdata. However, when applied to the EISC data, DO did notaffect the limonene- and water-content predictions. Theremoval of temperature features from the EISC spectra did
not affect or reduce the limonene and water information in thespectra, emphasizing the ability of EISC to correct for spectralvariations induced by temperature. So, when NIR data werepreprocessed with EISC, temperature could be identified as anindividual spectral feature (not correlated to water andlimonene). On the other hand, when raw or EISC data wereorthogonalized with respect to water (removal of water spectralfeatures), the limonene-content predictions were much poorer,leading to the conclusion that, in NIR spectra, limonene and
water are correlated. Peaks corresponding to both componentsare probably overlapped and cannot be effectively separated.
For an overview of the data, PCA models were computed onthe raw and preprocessed EISC NIR spectra. The comparisonof the models revealed significant improvements resulting fromEISC, where samples could be grouped according to limoneneand water content, by taking their scores values in the initialprincipal components, principal component 1 and principalcomponent 2 (for the raw data, sample groups could beidentified only when higher principal components werecomputed). The PCA scores plot of the EISC-corrected NIRspectra is shown in Fig. 3. Clearly, principal component 1(PC1) is modeling the water content (Fig. 3A) and principalcomponent 2 (PC2) is modeling the limonene content (Fig.3B). The distinct sample separation (according to limonene andwater) indicates that the spectral technique, NIR, providesinformation that is highly relevant to sample composition(enhanced when data is optimally preprocessed).
Figure 4 presents the PLS results for the prediction of thelimonene and water content, with three and six components,respectively. Models, which were computed on EISC prepro-cessed data with implicit inclusion of temperature, showedgood predictive ability with correlation coefficients of 1.00 and0.99 for limonene and water, respectively, and fairly goodRMSECV values when compared to the variables range; forboth limonene and water, a RMSECV of 0.2% was obtained,which corresponds to 1.9% and 3.4% of the limonene andwater content ranges (0% to 10.7% and 0% to 5.8%,respectively).
FIG. 3. PCA scores plots based on EISC-transformed NIR spectra showing thefirst two principal components (PCs), which explain 96% of the data variation.Samples are colored according to (A) water content and (B) limonene content.
FIG. 2. (A) EISC and (B) mean-centered EISC NIR spectra shaded ingrayscale (from low: light gray, to high: dark gray) according to water content.
146 Volume 63, Number 2, 2009

A chemical and physical interpretation is very valuable inorder to build confidence in prediction models, allowing theextension of their applications. When calibration models arecomputed, predicted results should be accurate, but also othermodel parameters like the number of principal componentsshould make sense. In this work, the calibration sample set canbe regarded as a four-component mixture: maltodextrin andwater (typically ;80% of the encapsulating matrix), gumarabic (;20% of the matrix), and limonene. Since data werepreprocessed and mean centered prior to model computation,three PLS components should be sufficient to describe most ofthe composition of these systems. In the computation of thelimonene-content-prediction model, three components wereused; however, to model the water content, three extracomponents were required (six principal components). Theextra components were validated by the computation of PLSmodels using different cross-validation schemes (as mentionedabove). Some significant structure could also be identified inthe PLS loadings plots of the fourth, fifth, and sixth principalcomponents (results not shown). Although these componentsdescribed small data variances, they improved the predictiveability of the model. The regression coefficients plot led to thesame conclusions. The occurrence of additional PLS compo-nents has a logical physical meaning, as it can be associatedwith interactions between the water and the remainingcomponents in the carrier system. Moreover, the analysis ofthe scores plots of principal components four, five, and six (not
shown) revealed that these components were responsible formodeling small data variations associated with temperature thatwere not removed by EISC. Indeed, a past study reported byZachariassen et al.5 showed that a simple way to deal with andmodel NIR spectral variation induced by temperature is toincorporate additional PLS components in the predictionmodels, which proved to be applicable for on-line processmonitoring of ammonia in low methoxylated amidated pectinproduction.
Inspection of Tables II and III reveals that three-waymodeling of the data did not result in improvements of thelimonene- and water-content prediction results, which provesthat, indeed, NIR spectral variation induced by temperature isnot linear. More advanced three-way chemometric tools, suchas PARAFAC2,32,33 which have been developed for thehandling of nonlinearities in data sets, are planned to be testedin the future.
Nuclear Magnetic Resonance Spectroscopy. In contrast toNIR, Fig. 5 shows that the factor that mostly influences the
FIG. 4. Measured vs. predicted plots for (A) limonene and (B) water content.Samples are colored according to limonene and water content, respectively.Regression PLS models computed on EISC data with implicit inclusion oftemperature.
FIG. 5. Raw NMR relaxation decays acquired at 20, 30, 40, 50, and 60 8C,shaded according to (A) limonene content, (B) water content, and (C)temperature. For better visualization only data points acquired in the first threeseconds are plotted (total data time acquisition¼ 7 s).
FIG. 6. CPMG NMR decays acquired on a single sample (10.7% limoneneand 2.9% water) at 20, 30, 40, 50, and 60 8C; three-dimensional landscape.
APPLIED SPECTROSCOPY 147

NMR data is the limonene content. In the figure the samples arecolored according to limonene content and a systematicvariation is identifiable. However, when individual samplesare investigated, the temperature influence is clear. Figure 6,which presents the CPMG data acquired on a single sample atfive temperatures, illustrates the NMR data variation inducedby temperature.
Chemometrics. The best results for the limonene-contentprediction were obtained when CPMG data were used in theregression model (1024 variables). For water content, the bestpredictions resulted from using the entire FIDCPMG data set(128 FIDþ 1024 CPMG data points¼ 1152 variables). Theseresults reflect the different interactions between the limonene,the water, and the carrier material in the systems under study.Limonene, being a hydrophobic compound, exists in thesystems as discrete liquid oil droplets, with little interactionwith the carrier.34 Limonene molecules therefore have a longrelaxation time (on the scale of liquid relaxation decay times).In contrast, the interaction of water with the hydrophilic carrier(maltodextrin and gum arabic) leads to a significant decrease inits relaxation time, from a few seconds in pure water down tosub-milliseconds in the water-content range of interest in thisstudy (0% to 7%).10 The signal resulting from water istherefore expected to have largely relaxed by the time therefocusing 1808 pulse is applied in the FIDCPMG (3.5 ms),i.e., water information is mainly captured in the FID part of thesignal. It is therefore understandable that the computation ofthe FIDCPMG entire signal resulted in the best models forprediction of the water content. The FIDCPMG approach alsoallows the ‘‘capturing’’ of the water signal in the CPMG part ofthe data in the case of high water content (not relevant to thisstudy).
In this work, models computed on the raw data werecompared to models computed on orthogonalized data (DO),applied to remove the temperature effect. For limonene-content
prediction, DO with respect to water (removal of data variationdue to water content) was also tested. As in the studyperformed for the NIR data, two-way and three-way chemo-metric techniques were tested. As an overview, Tables IV andV summarize the regression models computed on the NMRdata for limonene- and water-content prediction. In contrast toNIR, trilinear modeling resulted in the best global predictionmodels, both for limonene and water determination, showingsimilar performance when compared to local models computedon data acquired at a constant temperature. As an example, Fig.6 illustrates the CPMG data landscape for an individualsample. From these results one can conclude that NMR datavariation induced by temperature is close to linear, resulting ina trilinear data matrix. This could be considered to be asurprising observation, since temperature has two oppositeeffects on the measured amplitudes of NMR signals: a decreasein magnitude according to the Boltzmann equation discussedabove, but also an increase in relaxation time due to theincrease in the rate of molecular mobility, leading to adifferential increase in the measured magnitudes at eachspecific time point along the decay. The linear behaviorobserved, describing the overall outcome of these effects,suggests that the latter dominates the former (;12% loss ofsignal magnitude when the temperature increases from 20 8C to60 8C). Moreover, at some of the high water content–hightemperature combinations, past studies showed that maltodex-trin (the main constituent of the sample matrix) undergoes aglass–rubber transition where significant and nonlinear changesin relaxation times are often observed.10,35 However, the carriermaterial of the samples under analysis was composed ofmaltodextrin and gum arabic, so it was decided to measure theglass transition temperatures (Tg) of the control samples(composed of maltodextrin, gum Arabic, and water; 0%limonene content) by differential scanning calorimetry(DSC).10 The DSC trace is shown in Fig. 7. Taking into
TABLE V. PLS prediction results for determination of water content using models based on raw and preprocessed NMR FIDCPMG data.
Preprocessing
Two-way chemometrics (bilinear) Three-way chemometrics (trilinear)
X ¼ [250 3 1152], implicit inclusion of T X ¼ [50 3 5760], explicit inclusion of T X ¼ [50 3 5 3 1152], explicit inclusion of T
#PCsa RMSECV (%)b #PCsa RMSECV (%)b #PCsa RMSECV (%)b
None 6 0.4 5 0.3 5 0.3DO (T)c 5 0.3 5 0.3
a Number of principal components used to describe the models.b Root mean square error of cross-validation.c Knowledge of temperature required in data preprocessing.
TABLE IV. PLS prediction results for determination of limonene content using models based on different preprocessed NMR CPMG data.
Preprocessing
Two-way chemometrics (bilinear) Three-way chemometrics (trilinear)
X ¼ [250 3 1024], implicit inclusion of T X ¼ [50 3 5120], explicit inclusion of T X ¼ [50 3 5 3 1024], explicit inclusion of T
#PCsa RMSECV (%)b #PCsa RMSECV (%)b #PCsa RMSECV (%)b
None 4 0.3 3 0.2 3 0.2DO (T)c 4 0.3 3 0.2DO (water) 4 0.4DO (T þ water)c 3 0.6
a Number of principal components used to describe the models.b Root mean square error of cross-validation.c Knowledge of temperature required in data preprocessing.
148 Volume 63, Number 2, 2009

account the experimental Tg values, no samples were identifiedas possibly being in the rubbery state (refer to Fig. 7),explaining to a certain extent the linear variation induced bytemperature in the NMR spectra.
The application of three-way chemometric models requires aknowledge of temperature (explicit inclusion of temperature inmodels), which is not convenient for industrial purposes.Temperature is usually not easily controllable (e.g., whensampling from production lines) or readily measurable (e.g., inporous or structured systems). However, from Tables IV andV, it is obvious that reasonable two-way prediction models,with implicit inclusion of temperature, can be computed forboth limonene- and water-content determination.
Figure 8 presents the scores plots from a two-way PCAmodel of the entire NMR data acquired (FIDCPMG), withimplicit inclusion of temperature (250 samples 3 1152 timevalues). From the analysis of the figure, component one can beassociated with the limonene content (Fig. 8A), whilecomponent two is related to water content (Fig. 8B). Whenplotting sample scores on the remaining components, compo-nents three and four (Fig. 9), it is clear that, although onlyexplaining 0.6% of the data variance, these components aremodeling the temperature. The grouping of the samplesaccording to limonene content, water content, and temperatureindicates that NMR provides quantitative information regard-ing sample composition and, as expected, that NMR issusceptible to temperature variations. From Tables IV and Vone can verify that for prediction models computed on the rawdata (row corresponding to ‘‘None’’ preprocessing in thetables), implicit inclusion of the temperature involved the useof an extra component in the modeling, the role of which is toaccount for temperature variations in the data set (illustrated inFig. 9).
The orthogonalization of the raw relaxation data with respectto temperature resulted in a slight improvement in thelimonene- and water-content predictions. The most pronouncedeffect was identified when comparing two-way modelscomputed with implicit inclusion of temperature for waterprediction. When temperature characteristics were removedfrom the spectra, by direct orthogonalization, a simpler modelwas achieved (one principal component less) and the prediction
error decreased from 0.4% to 0.3%. From these results,
temperature could be identified as an individual spectral feature
(not correlated to water and limonene). On the other hand,
removing water characteristics by applying DO had a
detrimental effect on the limonene-content prediction models,
leading to the conclusion that, similarly to NIR, limonene and
FIG. 7. Illustration of the experimental Tg space: the dashed curve representsthe fit of the experimental data for determination of dry Tg for the 19 DE(dextrose equivalent) maltodextrin studied in Avaltroni et al.;36 trianglesrepresent experimental values obtained on the control samples, composed ofmaltodextrin, gum Arabic, and water (0% of limonene content) by DSC;10
respective fit curve. The experimental Tg space for the limonene model systemsis illustrated by the gray rectangle.
FIG. 8. PCA scores plot based on FIDCPMG NMR decays showing the firsttwo principal components (PCs), which explain 99% of the data variation.Samples are colored according to (A) limonene content and (B) water content.250 samples are represented: duplicate data acquired on 25 samples at 5different temperatures.
FIG. 9. PCA scores plot based on FIDCPMG NMR data recorded on thelimonene samples showing the third and fourth components, which explain0.6% of the data variation. Samples are colored according to measurementtemperature.
APPLIED SPECTROSCOPY 149

water NMR features are overlapped. This feature is partiallyunderstandable, as in the FID part, due to the narrow windowof the acquisition time, the contributions of limonene and waterwould overlap.
As mentioned before, the best limonene- and water-contentprediction results were obtained when data (CPMG forlimonene and FIDCPMG for water) were considered as athree-way data matrix and modeled using three-way chemo-metric tools. For limonene- and water-content predictions, N-PLS models proved to be simpler than two-way models withimplicit inclusion of temperature (one principal componentless) and more accurate in the prediction results (lowerRMSECV values). For limonene content, the performance ofthe computed N-PLS model was very satisfying. A RMSECVvalue of 0.2% was obtained, corresponding to 1.9% of the totallimonene content range (0–10.7%). For water, when theRMSECV (0.3%) is compared to the overall water-contentrange (2.8–7.1%), the model performance can be questioned,once RMSECV corresponds to 7% of the water range.However, from an industrial point of view, the model is
perfectly applicable. When dealing with limonene deliverysystems (or similar flavor systems), water content needs to beless than ;12% to not affect the systems’ performancethroughout the processes for which they will be used. Anerror of 60.3% is acceptable when water-content predictionsare to be made in systems with water content around 7%.
For both water and limonene, three-way models computedon untreated data (raw data) performed as well as when datawere orthogonalized with respect to temperature, prior tomodel computation. This result emphasizes the trilinear natureof the NMR data set: once the effect of the temperature in thespectra was close to linear, N-PLS was able to model it. Figure10 illustrates the results obtained when N-PLS models werecomputed and applied for limonene- and water-contentprediction. Both models were tested using different cross-validation schemes.
As mentioned previously, fairly good limonene- and water-content predictions were obtained when two-way models withimplicit inclusion of the temperature effect were computed.These models have the largest potential for industrialapplications, as they do not require knowledge of thetemperature at which the data are measured. Especially forwater-content prediction, the results improved when data wereorthogonalized with respect to temperature, i.e., when thetemperature effect was removed prior to computation ofmodels. However, the application of DO requires knowledgeof the temperature in the data preprocessing step. Figures 11Aand 11B present the prediction results obtained when
FIG. 10. Predicted vs. measured plots for (A) limonene and (B) watercontents. Three-way regression N-PLS models computed on CPMG andFIDCPMG data for limonene and water content, respectively.
FIG. 11. Measured vs. predicted plots for (A) limonene and (B) water content.Data points are colored according to limonene and water content. Two-wayPLS models computed on CPMG and FIDCPMG data for limonene and watercontent, respectively, with implicit inclusion of temperature.
150 Volume 63, Number 2, 2009

temperature was implicitly included in the PLS modelscomputed on the raw NMR data for, respectively, limoneneand water. The addition of one extra component (whencompared to the three-way models) corrected—to someextent—for the temperature effect, resulting in acceptableRMSECV values (0.3% and 0.4% for limonene and watercontent, respectively).
Near-Infrared versus Nuclear Magnetic Resonance. Theresults of this study provide a comparison of the effect oftemperature on NIR and NMR spectroscopy, as well as on theperformance of the calibration and prediction models computedon the respective data. Slight prediction improvements resultedfrom the pre-orthogonalization of the NIR and NMR data withrespect to temperature. From these results, temperature couldbe identified as an individual spectral feature for bothtechniques, as extracting data variation induced by temperatureimproved the limonene- and water-content predictions. Forboth NIR and NMR, orthogonalizing data with respect to watercontent had a detrimental effect on the limonene-contentprediction, leading to the conclusion that, for NIR and NMR,limonene and water features are overlapped.
The N-PLS models computed on the NMR data set resultedin more accurate limonene- and water-content predictions whencompared to the results obtained when two-way models werecomputed. On the other hand, two-way modeling resulted inthe best models computed on the NIR data. This is a clearindication that temperature affects NIR and NMR spectroscopyin different ways. Probably, temperature induces linearvariations in NMR data, resulting in trilinear data matrices,which can be modeled by N-PLS. The shifts (absorbancechanges) induced by temperature in NIR spectra are probablyfar from linear, resulting in non-trilinear data matrices. This isalso common in Fourier transform infrared (FT-IR) spectros-copy as a result of changes in the dipolar characteristics ofbonds.36
Limonene- and water-content prediction models computedon the two data sets, NIR and NMR, showed similarperformance, with NIR consistently producing slightly betterprediction results. This may be due to the higher rank of NIRdata when compared to NMR data, with more informationabout sample composition being captured in the NIR spectra.Moreover, one of the drawbacks of NMR is its low sensitivity,which leads to poor data signal-to-noise ratios, if a moderatenumber of co-added NMR signals (number of scans) are to beselected to ensure a practical and acceptable measurement time.Low signal-to-noise ratio has a detrimental effect on theperformance of any analytical approach or chemometricmodel.37 Furthermore, as discussed previously, the combinedimpact of high temperature and plasticization by water cancause the carbohydrate matrix of the spray-dried powders toundergo some changes that would increase the rate ofmolecular mobility in the matrix, resulting in significantchanges in the relaxation times.10 Although glass–rubbertransitions were unlikely to be the cause of these changes,small changes in the mobility of the molecules can have animpact in the measured relaxation times.
CONCLUSION
The present investigation has shown the possibility ofdeveloping fast and nondestructive NIR and NMR methods forthe simultaneous quantitative analysis of limonene and watercontent in model delivery systems, independent of the
temperature at which data are acquired. Multivariate techniquesassociated with data preprocessing tools were able to model theNIR and NMR data variations induced by temperature,enabling the computation of limonene- and water-contentprediction models with satisfactory performance when consid-ering the data signal-to-noise ratio and the sensitivity of thereference techniques used, i.e., Karl–Fisher titration for watercontent and steam distillation for limonene content.18 Twodifferent approaches for handling data variation induced bytemperature were tested: implicit and explicit inclusion of thetemperature in the models, with the former, which does notrequire knowledge of the temperature, being the mostinteresting from an industrial perspective for on-line or at-lineanalysis.5
For the NIR data set, the predictive ability of the chemo-metric models improved when data were preprocessed usingthe EISC approach. The best prediction models were obtainedwhen two-way PLS was applied to model the EISC data, withimplicit inclusion of the temperature. Three and six compo-nents were used in the limonene- and water-content predic-tions, and RMSECV values of 0.2% were obtained,corresponding to 1.9% and 3.4% of the total limonene andwater content ranges, respectively.
In contrast with the NIR results, the best prediction modelsbased on the NMR data set were obtained when three-way PLSwas applied to the untreated data. Three and five componentswere used in the limonene and water content predictions andRMSECV values of 0.2% and 0.3% were obtained, corre-sponding to 1.9% and 7.0% of the total limonene and watercontent ranges, respectively. These models, however, requireknowledge of the temperature, and are thus of limited interest.It is worth mentioning that two-way models with fairly goodpredictive ability could be computed on the NMR dataacquired when temperature was implicitly included in themodels.
As an overall conclusion, temperature effects on NIR andNMR data could be successfully modeled by the application ofchemometrics, which can be very advantageous and could leadto the expansion of NIR and NMR applications in industry.The models computed on the two data sets, NIR and NMR,showed very similar performance, with NIR consistentlyenabling slightly better water- and limonene-content predic-tions.
ACKNOWLEDGMENTS
The authors wish to thank Associate Professor Lars Nørgaard for iPLSguidance and helpful discussions and Lisbeth T. Hansen for advice on the NIRexperimental work. A special thanks to Gilda Kischinovsky for proofreadingthis manuscript.
1. F. Wulfert, Ph.D. Thesis, University of Amsterdam, Amsterdam (2004).2. A. C. Peinado, F. van den Berg, M. Blanco, and R. Bro, Chemom. Intell.
Lab. Syst. 83, 75 (2006).3. D. Cozzolino, L. Liu, W. U. Cynkar, R. G. Dambergs, L. Janik, C. B.
Colby, and M. Gishen, Anal. Chim. Acta 588, 224 (2007).4. B. Jaillais, R. Pinto, A. S. Barros, and D. N. Rutledge, Vib. Spectrosc. 39,
50 (2005).5. C. B. Zachariassen, J. Larsen, F. van den Berg, and S. B. Engelsen,
Chemom. Intell. Lab. Syst. 76, 149 (2005).6. S. M. Jepsen, H. T. Pedersen, and S. B. Engelsen, J. Sci. Food Agric. 79,
1793 (1999).7. C. A. Toussaint, F. Medale, A. Davanel, B. Fauconneau, P. Haffray, and S.
Akoka, J. Sci. Food Agric. 82, 173 (2001).8. P. Langvin, Œuvres scientifiques de Paul Langevin (CNRS, Paris, 1950),
pp. 331–368.
APPLIED SPECTROSCOPY 151

9. D. H. Gultekin and J. C. Gore, J. Magn. Reson. 172, 133 (2004).10. H. Kumagai, W. MacNaughtan, I. A Farhat, and J. R. Mitchell, Carbohydr.
Polym. 48, 341 (2002).11. L. Munck, L. Nørgaard, S. B. Engelsen, R. Bro, and C. A. Andersson,
Chemom. Intell. Lab. Syst. 44, 31 (1998).12. H. Martens, J. P. Nielsen, and S. B. Engelsen, Anal. Chem. 75, 394 (2003).13. D. K. Pedersen, H. Martens, J. P. Nielsen, and S. B. Engelsen, Appl.
Spectrosc. 56, 1206 (2002).14. C. A. Andersson, Chemom. Intell. Lab. Syst. 47, 51 (1999).15. S. Wold, H. Martens, and H. Wold, Lecture Notes Math. 973, 286 (1983).16. P. Geladi and B. R. Kowalski, Anal. Chim. Acta 185, 1 (1987).17. R. Bro, J. Chemom. 10, 47 (1996).18. L. Andrade, I. Farhat, K. Aeberhardt, V. Normand, and S. B. Engelsen,
Food Biophys. 3, 33 (2008).19. G. Wieland, Water Determination by Karl Fischer Titration: Theory and
Applications (Git Verlag, Darmstadt, 1987).20. H. Y. Carr and E. M. Purcell, Phys. Rev. 94, 630 (1954).21. S. Meiboom and D. Gill, Rev. Sci. Instrum. 29, 688 (1958).22. H. Hotelling, J. Edu. Psychol. 24, 417 (1933).23. J. E. Jackson, J. Qual. Technol. 13, 125 (1981).24. P. Geladi, D. McDougall, and H. Martens, Appl. Spectrosc. 39, 491
(1985).25. M. Dyrby, R. V. Petersen, J. Larsen, B. Rudolf, L. Nørgaard, and S. B.
Engelsen, Carbohydr. Polym. 57, 337 (2004).26. L. Nørgaard, M. T. Hahn, L. B. Knudsen, I. A. Farhat, and S. B. Engelsen,
Int. Dairy J. 15, 1261 (2005).
27. P. T. Callaghan, C. H. Arns, P. Galvosas, M. W. Hunter, Y. Qiao, and K.
E. Washburn, Magn. Reson. Imaging 25, 441 (2007).
28. E. Tønning, D. Polders, P. T. Callaghan, and S. B. Engelsen, J. Magn.
Reson. 188, 10 (2007).
29. I. S. Helland, T. Næs, and T. Isaksson, Chemom. Intell. Lab. Syst. 29, 233
(1995).
30. G. Svenstrup, H. Heimdal, and L. Nørgaard, Int. J. Food Sci. Technol. 40,953 (2005).
31. L. Nørgaard, A. Saudland, J. Wagner, J. P. Nielsen, L. Munck, and S. B.
Engelsen, Appl. Spectrosc. 54, 413 (2000).
32. R. A. Harshman, S. Hong, and M. E. Lundy, J. Chemom. 17, 363 (2003).
33. T. Skov and R. Bro, Sens. Actuators, B 106, 719 (2005).
34. A. Soottitantawat, F. Bigeard, H. Yoshii, T. Furuta, M. Ohkawara, and P.
Linko, Innov. Food Sci. Emerg. 6, 107 (2005).
35. F. Avaltroni, P. E. Bouquerand, and V. Normand, Carbohydr. Polym. 58,323 (2004).
36. I. Capron, P. Robert, P. Colonna, M. Brogly, and V. Planchot, Carbohydr.
Polym. 68, 249 (2007).
37. L. Andrade, B. MacNaughtan, and I. A. Farhat, ‘‘An investigation into the
practical aspects of the quantitative analysis of solid-liquid systems using
low-field NMR’’, in Magnetic Resonance in Food Science: FromMolecules to Man, I. A. Farhat, P. S. Belton, and G. A. Webb, Eds.
(The Royal Society of Chemistry, Cambridge, UK, 2007), Chap. Food
Quality, pp. 114–122.
152 Volume 63, Number 2, 2009