Chemometric analysis of volatiles of propolis from different regions using static headspace GC-MS

J. Dairy Sci. 87:3138–3152 American Dairy Science Association, 2004.
Chemometric Analysis of ProteolysisDuring Ripening of Ragusano Cheese*
V. Fallico,1 P. L. H. McSweeney,2 K. J. Siebert,3
J. Horne,1 S. Carpino,1 and G. Licitra1,41CoRFiLaC,Regione Siciliana, 97100 Ragusa, Italy2Department of Food and Nutritional Sciences,University College, Cork, Ireland3Department of Food Science and Technology,Cornell University, Geneva, New York 144564Dipartimento di Scienze Agronomiche,Agrochimiche e delle Produzioni Animali,Catania University, Via Valdisavoia 5, Italy
ABSTRACT
Chemometric modeling of peptide and free amino aciddata was used to study proteolysis in Protected Denomi-nation of Origin Ragusano cheese. Twelve cheeses rip-ened 3 to 7 mo were selected from local farmers andwere analyzed in 4 layers: rind, external, middle, andinternal. Proteolysis was significantly affected bycheese layer and age. Significant increases in nitrogensoluble in pH 4.6 acetate buffer and 12% trichloroaceticacid were found from rind to core and throughout ripen-ing. Patterns of proteolysis by urea-PAGE showed thatrind-to-core and age-related gradients of moisture andsalt contents influenced coagulant and plasmin activi-ties, as reflected in varying rates of hydrolysis of thecaseins. Analysis of significant intercorrelations amongchemical parameters revealed that moisture, more thansalt content, had the largest single influence on ratesof proteolysis. Lower levels of 70% ethanol-insolublepeptides coupled to higher levels of 70% ethanol-solublepeptides were found by reversed phase-HPLC in theinnermost cheese layers and as the cheeses aged. Non-significant increases of individual free amino acids werefound with cheese age and layer. Total free amino acidsranged from 14.3 mg/g (6.2% of total protein) at 3 moto 22.0 mg/g (8.4% of total protein) after 7 mo. Glutamicacid had the largest concentration in all samples at eachtime and, jointly with lysine and leucine, accounted for48% of total free amino acids. Principal componentsanalysis and hierarchical cluster analysis of the data
Received March 17, 2004.Accepted May 15, 2004.Corresponding author: V. Fallico; e-mail: [email protected].*Use of names, names of ingredients, and identification of specific
models of equipment is for scientific clarity and does not constituteany endorsement of the product by the authors, CoRFiLac, UniversityCollege Cork, Cornell University, and Catania University.
3138
from reversed phase-HPLC chromatograms and freeamino acids analysis showed that the peptide profileswere more useful in differentiating Ragusano cheeseby age and farm origin than the amino acid data. Com-bining free amino acid and peptide data resulted in thebest partial least squares regression model (R2 = 0.976;Q2 = 0.952) predicting cheese age, even though the pep-tide data alone led to a similarly precise prediction (R2 =0.961; Q2 = 0.923). The most important predictors ofage were soluble and insoluble peptides with mediumhydrophobicity. The combined peptide data set also re-sulted in a 100% correct classification by partial leastsquares discriminant analysis of cheeses according toage and farm origin. Hydrophobic peptides were againdiscriminatory for distinguishing among sample classesin both cases.(Key words: Ragusano cheese, peptide, free aminoacid, chemometrics)
Abbreviation key: FAA = free AA, FDM = fat in DM,HCA = hierarchical cluster analysis, IP = 70% ethanol-insoluble peptides, PCA = principal component analy-sis, PDO = Protected Denomination of Origin,pH4.6SN = pH 4.6 acetate buffer-soluble nitrogen,PLSDA = partial least squares discriminant analysis,PLSR = partial least square regression, RP-HPLC =reversed-phase HPLC, S/M = salt in moisture, SP =70% ethanol-soluble peptides, TCASN = 12% TCA-solu-ble nitrogen, VIP = variable influence on the projection.
INTRODUCTION
The quality and unique character of some localcheeses with distinctive flavor attributes are closelyrelated to the environmental conditions of milk produc-tion, to the type of milk employed, and to the particulartechnology applied (Urbach, 1990). Pasture feeding isknown to contribute to the aroma compounds found in
CHEMOMETRICS OF RAGUSANO CHEESE PROTEOLYSIS 3139
milk and cheese made therefrom by providing volatilecompounds or their precursors that the animal cantransfer to milk via the rumen. Raw milk cheeses gener-ally have more heterogeneous microflora than cheesesmade from pasteurized milk, and the use of raw milkis often positively related to increased proteolysis andflavor development (Grappin and Beuvier, 1997). Manyof these peculiar features are present in Ragusanocheese, a traditional dairy product of the Hyblean areaof Sicily, Italy. It belongs to Caciocavallo cheese family,one of the major pasta filata cheese families togetherwith Mozzarella and Provolone. Typical dairy productsof southern Italy, pasta filata cheeses are made ac-cording to a unique manufacturing process. The distinc-tive trait of this technology is the stretching step, duringwhich the acidified curd is cut into long layers andthen kneaded in hot water to give various final shapes(Battistotti and Corradini, 1993). Ragusano cheese isa regulated Protected Denomination of Origin (PDO)cheese (Gazzetta Ufficiale Comunita Europea, 1996),produced according to a traditional cheese-making tech-nology (Licitra et al., 1998). Local forage, often pas-tures, is utilized for feeding cows, and the raw milk iscoagulated with rennet paste, using wooden cheese-making equipment and without adding any startercultures.
Such biodiversity is considered a distinctive featureof traditional cheeses by both the producers and theconsumers. The PDO mark should represent a guaran-tee for the consumers that cheeses were produced ac-cording to local milk production regulations and tradi-tional cheese-making techniques and cheese ripeningprocesses (Innocente, 1997). There is, therefore, an in-creasing need to establish methods for defining andcontrolling the qualitative characteristics of typicalcheeses in order to secure the consumers choices and toprotect traditional products against cheaper industrialimitations (Butikofer and Fuchs, 1997). The breakdownof the casein matrix during cheese ripening is consid-ered essential for texture and flavor development inmost cheese varieties, especially in hard- and semi-hard-type cheeses (Fox et al., 1993). Characterizationof proteolysis is usually performed using electrophoreticand chromatographic techniques, resulting in proteo-lytic profiles of increasing resolution. Because of thecomplexity of proteolytic patterns during cheese ripen-ing, chemometrics has been proposed recently as anobjective approach for the evaluation of proteolytic pro-files and data interpretation. Multivariate analysis ofchromatographic or electrophoretic data has beenshown to represent a powerful method for discrimina-tion between cheese varieties, cheese quality or for judg-ing cheese maturation (Noel et al., 1998; Pripp et al.,2000; Sousa et al., 2001). Chemometric characterization
Journal of Dairy Science Vol. 87, No. 10, 2004
of some typical Italian hard cooked cheeses, such asParmigiano Reggiano (Resmini et al., 1985) and GranaPadano (Resmini et al., 1993), has also been performedsuccessfully on the basis of free AA (FAA) data.
While characterization of primary proteolysis in Ra-gusano cheese has recently been reported (Fallico etal., 2003a), studies on secondary proteolysis and chemo-metric modeling of proteolytic profiles are not available.The aim of this study was to evaluate proteolysis inPDO Ragusano cheese during ripening by the applica-tion of chemometric analysis to peptide and FAA data.
MATERIALS AND METHODS
Cheese Sampling
Twelve PDO Ragusano cheeses were supplied by dif-ferent farmers located in the province of Ragusa. Ninecheeses were from one farm; 3 others were each fromdifferent farms. Three random replicates were takenfor each ripening period (3, 4, 6, and 7 mo) at whichRagusano cheese is tested to obtain the PDO mark.Cheeses were analyzed in 4 layers: rind (R), external(E), middle (M), and internal (I). The sampling patternused was previously reported by Licitra et al. (2000).Cheese samples analyzed in this study were identifiedusing an abbreviation (e.g., 3R) reporting cheese age(months) and layer.
Compositional Analysis
Grated cheese samples were analyzed in duplicate.Cheese analyses were as follows: total N by the Kjeldahlmethod (IDF, 1993), fat by the Gerber method (IDF,1997) and NaCl by the Volhard method (AOAC, 2000).Total solids were determined using a forced-air ovendrying method at 100°C for 24 h (AOAC, 2000), whileN soluble in pH 4.6 acetate buffer (pH4.6SN) and 12%TCA-soluble N (TCASN) were determined (Bynum andBarbano, 1985) and expressed as a percentage of thetotal N content.
Assessment of Proteolysis
Cheese N fractions soluble and insoluble in pH 4.6acetate buffer were prepared according to the methodof Kuchroo and Fox (1982) with some modifications. Amixture of grated cheese and water (1:2, wt/wt) washomogenized using a stomacher at 20°C for 10 min.The homogenate was adjusted to pH 4.6 using 0.1 MHCl and then heated to 40°C for 1 h. The suspensionwas centrifuged at 2460 × g for 30 min at 4°C, andthe supernatant was filtered through Whatman No.113filter paper and glass wool. Aliquots of filtrate(pH4.6SN) were stored at −20°C until used for analysis
FALLICO ET AL.3140
of FAA. Seventy percent ethanol-soluble and -insolublecheese fractions were prepared from pH4.6SN ac-cording to Kuchroo and Fox (1982) and freeze drieduntil analyzed by reversed phase-HPLC (RP-HPLC).
The pH 4.6-insoluble N of the cheeses was analyzedby urea-PAGE using a Protean IIxi vertical slab gel unit(Bio-Rad Laboratories Ltd., Watford, UK) according tothe method of Andrews (1983). The gels were stainedusing a modification of the method of Blakesley andBoezi (1977) with Coomassie brilliant blue G250.Freeze-dried aliquots of the 70% ethanol-soluble and -insoluble cheese extracts were analyzed by RP-HPLCas described by Lynch et al. (1996). Individual FAAwere analyzed in the pH4.6SN fraction of the cheesesas described by Fenelon et al. (2000).
Statistical Analyses
Chemical parameters were weighted by layer usingthe factors reported by Licitra et al. (2000). Age-inde-pendent effects of cheese layer on these weighted chemi-cal parameters were examined by one-way ANCOVA(layer as a weighted fixed factor, ripening time as acovariate). When significant main effects were found (P≤ 0.05), specific mean differences were determined us-ing Tukey’s honestly significant difference (HSD) test.This model was chosen largely because ripening timecovaried with moisture and salt in moisture (S/M) indirections that ran counter to expected relationshipsbetween these variables and proteolysis measures (e.g.,pH4.6SN). Relationships between the chemical param-eters were examined by correlations among the age-adjusted residuals. Analyses were performed using pro-cedures GLM, REG, and CORR in SAS v.8.2 (SAS Insti-tute, Cary, NC).
Three separate data sets were assembled for datafrom the 70% ethanol-soluble peptides (SP), 70% etha-nol-insoluble peptides (IP) and amino acids for the cor-responding cheeses. Samples for one 6-mo old cheesehad some technical problems during chromatographicanalysis and were therefore not included in the statisti-cal analysis. Data from RP-HPLC chromatograms ofthe SP and IP were obtained by visually recognizingsimilar peaks in the profiles and using the peak heightsunits (µAu) as variables for statistical analysis (Prippet al., 2000). The peak heights were found by convertingthe chromatograms to ASCII files. Concentrations ofindividual FAA were expressed as micromoles per gramof cheese and used as variables for statistical analysis.Cheese age and farm origin were modeled using thefollowing chemometric techniques. Principal compo-nents analysis (PCA) was performed standardizing thevariables (mean = 0; SD = 1). Hierarchical cluster analy-sis (HCA) was performed using squared Euclidean dis-
Journal of Dairy Science Vol. 87, No. 10, 2004
tances and centroid linkage without standardizing thevariables. Exploratory data analyses (PCA and HCA)were performed using Minitab for Windows 98 v.13(Minitab Inc., State College, PA). Partial least squaresregression (PLSR) (Wold et al., 2001) was carried outto model cheese age as a function of the measurementsusing the SIMCA-S v.6.01 program (Umetrics Inc., Kin-nelon, NJ). Models were constructed from each of 7 datasets (FAA, SP, IP, the 3 2-way combinations and all3 combined). Probability plots of the residuals wereexamined to screen for outliers; in the cases in whichthese were found, the corresponding samples were re-moved from the data set, and the analysis was repeated.Partial least squares discriminant analysis (PLSDA)(Barker and Rayens, 2003) was carried out separatelyon each of the 7 data sets to attempt to classify thesamples according to cheese age and farm origin usingthe SIMCA-S program. The optimal number of PLScomponents was selected for PLSR and PLSDA solu-tions using cross-validation (Wold, 1978).
RESULTS AND DISCUSSION
Chemical Composition
Age-adjusted means, weighted by layer, and meandifferences for the chemical parameters as functions ofcheese layer are shown in Table 1. Percentage moistureand salt, pH, ammonia, and the proportion of total Nsoluble at pH 4.6 and soluble in 12% TCA (TCASN) allincreased significantly from rind to core (F3,43 > 2.8).Percents protein and S/M both decreased significantlyacross the same layers (F3,43 > 3.4). The inner 2 layerswere not significantly different from one another amongany of these measures, but both were different fromthe rind among 5 of the 8 parameters where significantdifferences were found. The rind and external layerson the other hand had significantly different moisture,salt, and protein contents. This decreasing rate ofchange as one moved closer to the core suggests a possi-ble curvilinear relationship between the chemical pa-rameters and distance from the rind. Nonsignificantincreasing trends were observed from the rind to thecore for the proportion of pH4.6SN soluble in 12% TCA(TCASN/pH4.6SN) and for total FAA. In both cases.the largest mean difference was between the rind andexternal layers, lending additional support to the curvi-linearity hypothesis identified above.
Eight of the 11 chemical parameters had significantlinear relationships with ripening time. Percentagemoisture and protein both decreased significantly withincreasing ripening time (F1,43 > 65.2), while percentssalt, S/M, and all of the proteolysis measures exceptTCASN/pH4.6SN increased significantly with increas-ing ripening time (F1,43 > 7.9). The presence of these

CHEMOMETRICS OF RAGUSANO CHEESE PROTEOLYSIS 3141
Table 1. Age-adjusted weighted means for the effects of cross-section (rind, external, middle, and internal)on chemical composition of Ragusano cheese.1
Rind External Middle Internal
pH 5.22a 5.29ab 5.32ab 5.35b
Moisture, % 24.48a 35.85b 39.67c 41.23c
Salt, % 1.81a 2.40b 2.57b 2.51b
Protein, % 35.03a 28.92b 26.88c 26.54c
FDM, % 47.51 48.07 46.15 46.85S/M, % 7.59a 6.86ab 6.61ab 6.20b
pH4.6SN/TN, % 7.51a 13.20ab 16.08b 16.59b
TCASN/TN, % 6.08a 11.15ab 13.18b 13.93b
TCASN/pH4.6SN, % 80.80 83.94 82.26 85.00Total free amino acids, mg/g 14.30 20.50 21.86 22.02Ammonia, mg/g 0.36a 0.55ab 0.58ab 0.62b
a,b,cMeans sharing common superscripts were not significantly different (P < 0.05).1Protein = total nitrogen × 6.38 FDM = fat in dry matter. S/M = ((sodium chloride)/(moisture content)) ×
100. pH4.6SN/TN = pH 4.6 acetate buffer-soluble nitrogen as a percentage of total nitrogen. TCASN/TN =12% TCA-soluble nitrogen as a percentage of total nitrogen. TCASN/pH4.6SN = 12% TCA-soluble nitrogenas a percentage of pH 4.6 acetate buffer-soluble nitrogen.
strong linear relationships between ripening time andproteolysis suggests that ripening time by itself has apowerful influence on proteolysis. As Ragusano cheeseswere aged, proteolysis continued at least through 7 moeven in the presence of relatively low moisture and highS/M contents.
Significant correlations (P < 0.05) among the age-adjusted residuals of the chemical measurements areshown in Table 2. Moisture and pH were positivelyassociated with most of the measures of proteolysis(pH4.6SN, TCASN, FAA, and ammonia) and negativelyassociated with total protein. Salt in moisture, in con-trast, showed inverse correlations with the same mea-sures. It was positively associated with total proteinand negatively associated with the measures of proteol-ysis, although the association with FAA was not sig-nificant (R = −0.25). Nearly all of the proteolytic mea-sures were strongly and positively correlated with one
Table 2. Correlation matrix among age-adjusted residuals of chemical parameters in Protected Denomination of Origin (PDO) Ragusanocheese.1
Chemical pH4.6SN TCASN% TCASN% Totalvariables pH Moisture Salt Protein FDM S/M %TN TN pH4.6SN FAA
pHMoisture 0.620***Salt 0.464*** 0.752***Protein −0.645*** −0.967*** −0.777***FDMS/M −0.412** −0.695*** 0.634***pH4.6SN/TN 0.699*** 0.766*** 0.816*** −0.769*** −0.325*TCASN/TN 0.682*** 0.749*** 0.758*** −0.777*** −0.359* 0.939***TCASN/pH4.6SN 0.552*** 0.444**Total FAA 0.616*** 0.505*** 0.521*** −0.570*** 0.737*** 0.844*** 0.542***Ammonia 0.557*** 0.658*** 0.533*** −0.690*** −0.501*** 0.716*** 0.809*** 0.514*** 0.787***
1Pearson correlation coefficients at two-tailed significance levels of *P < 0.05; **P < 0.01; ***P < 0.001. Protein = total nitrogen × 6.38FDM = fat in dry matter. S/M = ((sodium chloride)/(moisture content)) × 100. pH4.6SN/TN = pH 4.6 acetate buffer-soluble nitrogen as apercentage of total nitrogen. TCASN/TN = 12% TCA-soluble nitrogen as a percentage of total nitrogen. TCASN/pH4.6SN = 12% TCA-solublenitrogen as a percentage of pH 4.6 acetate buffer-soluble nitrogen. Total FAA = total free amino acids.
Journal of Dairy Science Vol. 87, No. 10, 2004
another and negatively associated with total protein.The only exceptions were the absence of relationshipsbetween pH4.6SN and TCASN/pH4.6SN (R = +0.13) orbetween total protein and TCASN/pH4.6SN (R = −0.28).Both of these relationships, however, were in the ex-pected directions, and the latter was nearly significant(P = 0.056).
Salt on a total weight basis was positively correlatedwith moisture, pH, and most of the proteolytic mea-sures; salt was also negatively correlated with totalprotein. While these results were in agreement withthe finding of significantly lower salt contents in therinds compared with other cheese layers (Table 1), theyran decidedly counter to expectations. Guinee and Fox(1984), however, working with Romano-type cheeses,reported nearly identical results. After 122 d of ripen-ing, these researchers found the lowest salt concentra-tions in the outer layers, while the highest salt concen-

FALLICO ET AL.3142
trations were in the middle layers. They attributedthese results to the much faster rate of moisture lossin the outer layer relative to the rest of the cheese. Inan effort to maintain osmotic pressure and equilibrium,this rapid rate of moisture loss also caused a decreasein salt on a total weight basis relative to the rest of thecheese. Salt in moisture contents decreased from therind to the core just as they did in the present study.Our results show that the same process might occur inRagusano cheese.
Among the chemical parameters, moisture appearedto have the largest single influence on the rate of prote-olysis. Rind-to-core moisture gradients remained stableat about 16% throughout ripening, and probably ac-counted for differences among the proteolytic measuresin the same layers. The mechanism involved likely hasto do with decreases in microbial survival and enzy-matic activities at lower moisture contents. Decreasingmoisture produces a lowering of water activity and,consequently, enzymatic activities are limited. For ex-ample, Horne et al. (unpublished) found that decreasingmoisture contents in Ragusano cheeses were importantin lessening bitter and sour offtastes that result fromearly microbial activity. Kristiansen et al. (1999) re-ported a positive association between pH and moisturein Danbo-type cheeses that is consistent with resultsfound here. If the more alkaline pH resulted from in-creased levels of ammonia and other alkaline proteo-lytic products, then this relationship between pH andmoisture would support the hypothesis that proteolysisand moisture levels are integrally tied together. Thevery strong negative correlation between moisture andtotal protein (R = −0.967) and the positive correlationsbetween moisture and most of the proteolytic measures(Table 2) also support this hypothesis.
Similar, albeit usually weaker, relationships werefound between S/M and proteolysis. These were like-wise attributable to a relatively constant rind-to-coreS/M gradient at the different ripening times. The factthat this gradient still existed after 7 mo ripening (1.1%compared with 1.4% after 3 mo) was probably due tothe brine salting technique used in Ragusano cheeseproduction. Lee et al. (1980) noted that brine-saltedcheeses required a much longer time to attain uniformsalt distributions than did those that were dry saltedafter the milling step. Similar S/M gradients have beenfound by several others working with brine-salted Ital-ian cheeses (Fox and Guinee, 1987; Gobbetti et al.,1997). The absolute S/M contents reported here werealso consistent with those found in other PDO Ragu-sano cheeses (Licitra et al., 2000).
The effect S/M had on proteolysis again was likely tohave been due to the effect of moisture. Increasing S/M is known to inhibit rennet and microbial activities
Journal of Dairy Science Vol. 87, No. 10, 2004
(Fox and Guinee, 1987), and the significant negativecorrelations between S/M and some of the proteolyticmeasures found in the current study (Table 2) appearto confirm this idea. Melilli et al. (2004) also reportedsignificant increases in pH4.6SN and TCASN from therind to the core in Ragusano cheeses and attributedthose differences to large S/M gradients ranging from8.2 to 9.8%. Other researchers have reported similarrelationships in Cheddar and Romano-type cheeses(Guinee and Fox, 1984; Kelly et al., 1996). In the presentwork, S/M and thus the S/M gradients were far morefunctions of moisture content than they were of saltcontent. This is demonstrated by the patterns of inter-correlations (Table 2). Had salt contents been the prin-cipal drivers of the salt-to-moisture ratios, we wouldhave expected positive relationships with the proteo-lytic measures because salt itself was positively associ-ated with these measures. Instead, we found negativerelationships between S/M and all 5 of the proteolyticmeasures, although 2 were nonsignificant, which sug-gests that moisture had the greater influence. There-fore, the current results appear to indicate that differ-ences in proteolysis due to S/M are just as easily attrib-utable to moisture by itself.
Fat in dry matter (FDM) content did not appear toexert an influence on proteolysis. No significant differ-ences were found between cheese layers, which con-firms the results of Licitra et al. (2000). There waslikewise no significant linear trend between FDM andripening time. Fat in DM was significantly correlatedwith only TCASN/pH4.6SN (R = +0.55). Fat in DMlevels exceeded the minimum required for PDO Ragu-sano cheeses (40%, wt/wt) (Gazzetta Ufficiale Repub-blica Italiana, 1995) in all samples tested.
Among the individual measures of proteolysis, thestrongest relationships between other chemical param-eters such as pH, moisture, and salt were found withpH4.6SN and TCASN. These 2 variables were likewisestrongly and positively correlated with one another (R =+0.94). Significant rind-to-core differences were foundamong these 2 measures as well as among the ammoniameans (Table 1). Both measures increased significantlywith ripening time (F1,43 > 7.9), although a muchstronger effect was seen between pH4.6SN and ripeningtime (partial R2 = 0.195) than was seen between TCASNand ripening time (partial R2 = 0.127). These measuresare widely used as indices of proteolysis, both to quan-tify casein hydrolysis and to understand the contribu-tion of enzymatic activities from coagulant, milk, andmicroflora to this process. The majority of pH4.6SN ismade up of large- and medium-sized peptides producedby the action of residual rennet and plasmin, but it alsocontains numerous small-sized peptides, FAA and theircatabolites produced by microflora. Nitrogen soluble in

CHEMOMETRICS OF RAGUSANO CHEESE PROTEOLYSIS 3143
12% TCA, on the other hand, consists primarily ofsmall-sized peptides, FAA, and other minor nitrogenouscompounds produced by both starter and nonstarterbacteria (Fox et al., 1993). A high proportion of pH4.6SNin the current study was also soluble in 12% TCA, con-firming previously reported results for Ragusano cheese(Fallico et al., 2003a, 2003b). Age-adjusted weightedTCASN/pH4.6SN means from the different layersranged from 80.8 (± 0.75 standard errors) to 85.0% (±1.26 standard errors). Even at early stages of ripening,most of the pH4.6SN in Ragusano cheeses is made upof TCASN, with the highest ratios reached after 4 mo(results not shown). These results then point to theearly production of a considerable amount of low molec-ular mass peptides (2 to 20 amino acids), favored byhigh moisture contents. The production of these smallpeptides is important in the formation of cheese flavor(Sousa et al., 2001). The high proportions of TCASN/pH4.6SN are also indicative of the major role playedby adventitious bacteria, which are largely responsiblefor the production of TCASN, in Ragusano cheeseripening.
Electrophoretic Analysis
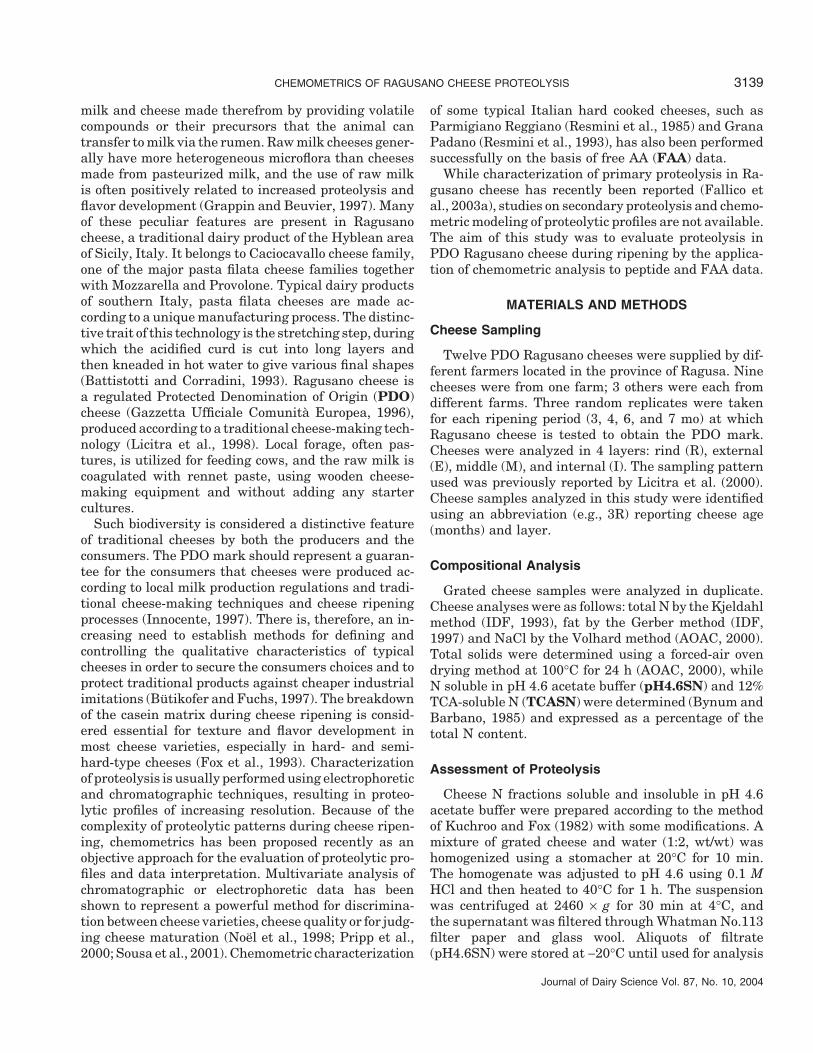
Urea-PAGE of the pH 4.6-insoluble N fraction of Ra-gusano cheese layers at selected ages is shown in Figure1. The extent of casein proteolysis was affected by bothcheese layer and age. Moderate hydrolysis of αs1-CNand β-CN were common features of both 3- and 4-moaged cheese profiles. Cheese layer had a major impacton proteolysis level at these times. The cheese surfaceshowed slight hydrolysis of native caseins, which wereprogressively more degraded in the inner layers. Prote-olysis largely increased in cheeses at 6 and 7 mo of age,with the inner layers always showing higher levels ofαs1-CN and β-CN degradation than the outer layers.
Plasmin action on β-CN was likely responsible forincreasing levels of β-CN f29-209 (γ1-CN), β-CN f106-209 (γ2-CN) and β-CN f108-209 (γ3-CN) (Sousa et al.,2001) from the rind to the core of the cheeses. Theproduction of γ-CN was also positively related with Ra-gusano cheese age, as the relative intensities of thebands increased with ripening time at each selectedlayer. Rennet activity on β-CN produced 2 peptides, β-CN f1-192 (β-I) and an unidentified fragment, migrat-ing in the same region as β-CN and showing a slightlyhigher mobility than native protein. Their levels wereaffected by both cheese layer and age, increasing inthe innermost layers and throughout ripening. Similarpeptides were detected in Gouda cheese made with dif-ferent amounts of rennet, increasing in intensity withcoagulant concentrations (Visser, 1993). Three peptidesmoving slower than γ-CN were detected at each level
Journal of Dairy Science Vol. 87, No. 10, 2004
of ripening. In a previous work, we showed that thesefragments were probably produced from β-CN by theaction of plasmin or microbial proteinases with a tryp-sin-like activity. These same fragments have been rec-ognized by polyclonal antibodies specific for β-CN andproduced exclusively by plasmin during in vitro hydro-lysis of whole casein with isolated dairy proteases (Fal-lico et al., 2003b).
Hydrolysis of αs1-CN produced a number of peptidesmoving faster than native casein. It has been shownthat these fractions are mainly proteolysis products ofαs1-CN (McSweeney et al., 1993; Fallico, et al., 2003b)due to rennet action. Residual chymosin (or perhapscathepsin D) activity produced the primary peptide αs1-CN f24-199 (αs1-I), showing the greatest levels in 3- and4 mo-old cheeses and in the innermost layers. The αs1-I in Cheddar cheese is further hydrolyzed by chymosinat the bond Leu101-Lys102 (Sousa et al., 2001). The grad-ual decrease of αs1-I level, as Ragusano cheese aged,was then related to the production of αs1-CN f102-199,with lower mobility than αs1-I. Cheese layer also affectedthe level of αs1-CN f102-199, gradually increasing inthe innermost layers of 6- and 7 mo-old cheeses. Fi-nally, the greater extent of αs1-CN hydrolysis at thesetimes produced a number of peptides having the highestelectrophoretic mobility.
Proteolysis of αs1-CN and β-CN in Ragusano cheesewas affected by both cheese layer and age, with a majorinfluence of chemical parameters on the layer-relatedhydrolysis. Increasing levels of peptides, found fromthe rind to the core of the cheeses, were associated withlayers having higher pH, moisture and salt contents.Moisture probably plays a major role in affecting prote-ase activity on caseins, as increasing moisture contents,and consequently higher water activity, are known tosupport enzyme activities (Kristiansen et al., 1999).Higher levels of γ-CN in the inner layers of Ragusanocheese were probably due to increasing moisture con-tents, but other factors also tend to be advantageousfor plasmin action on β-CN. The increase in cheese pHhas been shown to influence the degree of hydrationand aggregation of β-CN resulting in a modified suscep-tibility to hydrolysis by proteases (Creamer, 1985).Kelly et al. (1996) reported a positive relationship be-tween the amount of γ-CN and pH values in Cheddar-type cheese. The pH was positively associated withmoisture in Ragusano cheese and both had positivecorrelations with most of the indices of proteolysis. Fur-ther, the amounts of γ-CN in Ragusano cheese in-creased with salt content. Kelly et al. (1996) showedthat plasmin activity on β-CN was also positively influ-enced by salt concentration. Similarly, higher levels ofγ-CN were found in Danbo-type salted cheeses com-pared with the unsalted (Kristiansen et al., 1999).

FALLICO ET AL.3144
Figure 1. Urea-polyacrylamide gel electrophoretograms (pH 8.6) of the pH 4.6-insoluble N fraction from selected layers (R = rind, E =external, M = middle, I = internal) of PDO Ragusano cheese after 3 (a), 4 (b), 6 (c), and 7 (d) mo of age. Analyses were in triplicate.
The influence of salt concentration on coagulant ac-tivity was more complex, as reflected in varying ratesof hydrolysis of the caseins. It has been reported thatvariations of the salt content in cheese influence theability of chymosin to degrade β-CN (Fox and Walley,1971), while the degradation of αs1-CN was not affectedto the same extent (Mulvihill and Fox, 1979). Hydroly-sis of αs1-CN in Ragusano cheese increased throughoutripening and in the inner layers at each time. Produc-tion of αs1-I and αs1-CN f102-199 was therefore posi-tively related with increasing salt content of the cheese,as previously observed by others (McSweeney et al.,1993; Kelly et al., 1996). Salt concentration mainly af-
Journal of Dairy Science Vol. 87, No. 10, 2004
fected chymosin action on β-CN in Ragusano cheese.Profiles of 3- and 4-mo-old cheeses with <5% S/Mshowed a great extent of β-CN degradation with thelarger production of β-I. The large hydrolysis of β-CNin 6- and 7-mo old cheeses, with >5% S/M, was insteadmore related to γ-CN production by plasmin. Fox andWalley (1971) observed that proteolysis of β-CN by coag-ulant was significantly reduced by 5% S/M and com-pletely inhibited in the presence of 10% S/M.
RP-HPLC Chromatograms of IP and SP
The IP fraction of Ragusano cheese in 4 differentlayers at selected ages was analyzed by RP-HPLC (re-
CHEMOMETRICS OF RAGUSANO CHEESE PROTEOLYSIS 3145
sults not shown). The chromatograms displayed a highnumber of medium molecular weight peptides, uni-formly spread over the central and hydrophobic zonesof the acetonitrile gradient. Two main peaks dominatedthe 70% ethanol-insoluble N profiles of Ragusanocheese, eluting in the very hydrophobic region between50 and 60 min.
Analysis by RP-HPLC of the SP fraction of Ragusanocheese (results not shown) provided peptide profilessimilar to those reported for Parmigiano-Reggiano(Noel et al., 1998). Low molecular weight compounds ofRagusano cheese were contained within 4 peaks elutingwithin the first 30 min. Cheese age had no effect onthe qualitative peptide profile of Ragusano cheese butincreasing levels of low molecular weight peptides werefound from the cheese surface to the core. This findingrelates well with the data trend for the TCASN (Table1), which is reported to contain similar peptides to thosein the 70% ethanol-soluble cheese fraction (Kuchrooand Fox, 1982). Levels of TCASN constantly increasedfrom the outer to the inner layers during cheese ripen-ing (+43%, +55%, +70% and +73% at 3, 4, 6, and 7mo, respectively).
Individual FAA
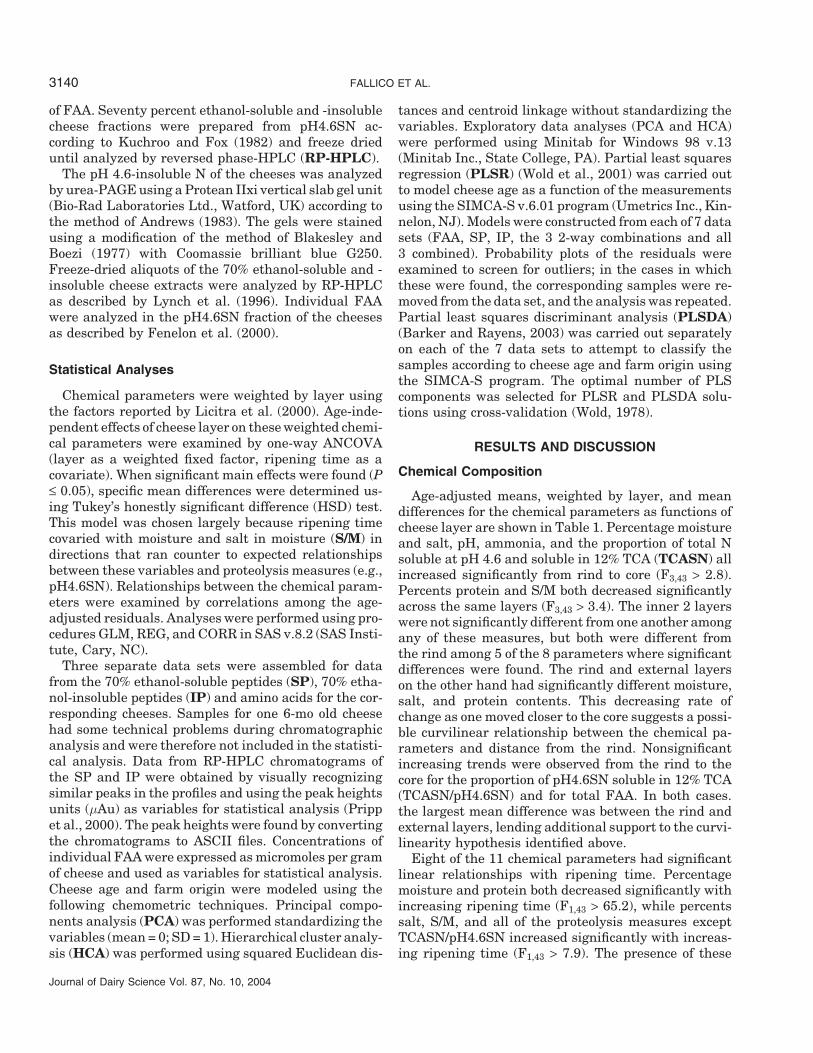
Analysis of raw data showed that absolute amountsof FAA varied to a large extent according to cheeseage, layer, and origin, agreeing with previous reports(McSweeney and Fox, 1993; Krause et al., 1997; Buti-kofer and Fuchs, 1997). The mean concentrations ofindividual FAA (milligrams per gram of cheese) in the4 layers of PDO Ragusano cheese at various ages areshown in Figure 2. The principal FAA in all cheeselayers at most ripening times were Glu, Lys, Leu, Pro,Val, Phe, Ile and Ser, accounting for 81 to 83% of thetotal FAA content. Similar amino acid profiles havebeen reported previously for different cheese varieties.High levels of the same individual FAA were found inParmigiano-Reggiano (Battistotti and Corradini, 1993)and, with the exception of Phe and Ile, in CanestratoPugliese (Albenzio et al., 2001). Polo et al. (1985) re-ported Glu, Val, Phe, Ile, and Pro as the main FAA in4-mo ripened Mahn cheese, accounting for between 67and 80% of total FAA.
Among the 8 principal FAA in Ragusano cheese, Glu,Lys, and Leu accounted for 48% of total FAA. Theywere also the main FAA in Provolone at 5 to 6 mo of age(Battistotti and Corradini, 1993) and in 2-mo ripenedCaciocavallo Silano (Corsetti et al., 2001) cheese, bothpasta filata cheeses similar to Ragusano. Glutamic acidwas the FAA with the largest concentration in all Ragu-sano cheese samples at each time. Its absolute amount,ranging from about 4 mg/g at 3 mo to 6 mg/g at 7 mo,
Journal of Dairy Science Vol. 87, No. 10, 2004
was always at least twice as large as either of the other2 most abundant FAA, Lys and Leu. Because of itsflavor-enhancing properties (Krause et al., 1997), glu-tamic acid might contribute to the development of Ragu-sano cheese flavor. Leucine might also be an importantprecursor of branched-chain volatile flavor compounds(Fox and Guinee, 1987).
Nonsignificant increases with cheese age and layerwere found for the levels of individual FAA in Ragusanocheese (results not shown). The amount of total FAAranged from 14.3 mg/g at 3 mo to 22.0 mg/g after 7 mo,representing the 6.2% to 8.4% of total protein. The sameratio in 2-mo ripened Caciocavallo Silano cheese variedfrom 4.7 to 8.6% (Corsetti et al., 2001), while in Provo-lone cheese after 5 to 6 mo of ripening it ranged from8.2 to 16.6% (Battistotti and Corradini, 1993).
PCA and HCA of Reversed Phase-HPLCChromatograms of Peptides
Exploratory data analysis of HPLC chromatogramsof peptides was performed to evaluate the influence oflayer and age on proteolysis of PDO Ragusano cheeses.Principal component analysis and HCA were first ap-plied to the IP data set, consisting of 58 recognizedpeaks. The first 11 principal components contained themeaningful variance in the data set (based on eigen-value > 1), and represented 89.3% of the total variance.Scores of the first 2 principal components, cumulativelyaccounting for 47.3% of the variance, were normalizedand plotted, as shown in Figure 3. The PCA biplot ar-ranged cheese samples into 2 major groups, analogousto the pattern identified by HCA (results not shown).All the samples contained in the large cluster were fromcheeses produced by the same farm, while the smallcluster grouped layers from 2 cheeses each derived fromdifferent farms. Variables with factor loadings higherthan 0.8 were plotted on the normalized score plot. Thehigh loading value for the farm variable on factor 1indicated that grouping of cheeses into separate clus-ters along the PC1 axis was largely according to thefarm origin. Based on variables with high loading val-ues, a group of 8 IP peaks were associated with theseparation of the samples between the 2 clusters. Thesepeaks corresponded to hydrophobic peptides since theyeluted at high acetonitrile concentrations in the RP-HPLC profiles. Differences in the most hydrophobicpeptides were also found to differentiate between RP-HPLC peptide mappings of Appenzeller and Parmi-giano-Reggiano cheeses (Noel et al., 1998). High loadingvalues for 2 peaks with medium hydrophobicity sepa-rated, on the PC2 axis, 3-mo aged cheeses from theother samples of the large cluster.

FALLICO ET AL.3146
Figure 2. Mean levels (n = 3) of individual free amino acids (mg/g cheese) in 4 selected layers (R = rind, E = external, M = middle, I =internal) of PDO Ragusano cheese after 3 (a), 4 (b), 6 (c), and 7 (d) mo of age.

CHEMOMETRICS OF RAGUSANO CHEESE PROTEOLYSIS 3147
Figure 3. Biplot of normalized scores and loading vectors of vari-ables with high loading obtained by principal component analysis ofdata from reversed-phase-HPLC chromatograms of the 70% ethanol-insoluble peptides from selected layers (R = rind, E = external, M =middle, I = internal) of PDO Ragusano cheese after 3, 4, 6, and 7 moof age.
Nine principal components were adequate to repre-sent 90.1% of the variance in the SP data set, consistingof 57 recognized peaks. The score plot of PC1 vs. PC2,which accounted for 63.2% of the data variation, isshown in Figure 4. A tendency for cheese samples togroup according to the farm origin was again observedon the PC1 axis, as previously reported for IP. Thedendrogram from HCA (results not shown) showed 2main clusters of similarity, with the larger one enclos-ing cheeses produced on one farm, while the smaller
Figure 4. Biplot of normalized scores and loading vectors of vari-ables with high loading obtained by principal component analysis ofdata from reversed-phase-HPLC chromatograms of the 70% ethanol-soluble peptides from selected layers (R = rind, E = external, M =middle, I = internal) of PDO Ragusano cheese after 3, 4, 6, and 7 moof age.
Journal of Dairy Science Vol. 87, No. 10, 2004
Figure 5. Biplot of normalized scores and loading vectors of vari-ables with high loading obtained by principal component analysis offree amino acids content from selected layers (R = rind, E = external,M = middle, I = internal) of PDO Ragusano cheese after 3, 4, 6, and7 mo of age.
cluster grouped cheeses having different farm origins.Based on variables with loading values higher than 0.8,most of the peaks accounting for the differences amongclusters were hydrophobic, having retention timeshigher than 35 min, while 3 of the peaks eluted inthe hydrophilic zone of the chromatograms. Cheesesgrouped by age along PC2, as confirmed by the highnegative correlation of the age variable with the sameaxis. With the exception of the rind samples, cheesesat 3 mo of age were separated into a subgroup withinthe main cluster because of the high loading values for(3) hydrophilic and (4) hydrophobic peaks. The HCAalso showed that rind samples at 3 mo and the external,medium and internal layers of a 7-mo-old sample hada high similarity with samples of the major cluster.
PCA and HCA of FAA
Principal component analysis (Figure 5) and HCA(results not shown) of individual FAA data separatedthe external, medium, and internal layers of one 6-mo-old and 2 7-mo-old cheeses into a small cluster andthe remainder of the samples in a larger one. Loadingvectors of variables with loading values higher than 0.8showed that, with the exceptions of Asp, Cys, Tyr, andHis, cheese layers within the small cluster had higherconcentrations of most FAA than the other samples.A high loading value for the farm variable, positivelycorrelated with PC2 axis, also in PCA analysis of FAAdata confirmed that farm origin greatly influenced pro-duction of soluble compounds in PDO Ragusano cheese.However, the low percentage of variance explained by

FALLICO ET AL.3148
Table 3 Results from partial least square regression modeling ofcheese age as a function of amino acid and peptide concentrations.
Data set n1 R2 2 Q2 3 Components4
FAA5 48 0.548 0.502 2SP6 46 0.899 0.864 3IP7 47 0.937 0.876 4FAA + SP 46 0.945 0.886 3FAA + IP 46 0.939 0.872 3SP + IP 45 0.961 0.923 4FAA + SP + IP 43 0.976 0.952 3
1Number of observations used after removal of outliers.2Multiple correlation coefficient squared.3Cross-validated multiple correlation coefficient squared.4Optimal number of PLS components selected by cross-validation.5FAA = Free amino acids.6SP = 70% ethanol-soluble peptides.7IP = 70% ethanol-insoluble peptides.
PC2 suggested that FAA were less influential than pep-tide data in differentiating cheeses by farm.
Models of Cheese Age
Construction of a model of cheese age as a functionof the analytical results is an inverse process becauseage is actually the independent variable that results inthe changes in the peptide and amino acid patterns.Inverse modeling has long been used in many applica-tions, perhaps most notably calibration models (Beebeet al., 1998). The data sets obtained in this study allhave more measurements than the number of samplesand are thus highly over-determined. This is problem-atic for many methods of multivariate analysis (Woldet al., 1984). Methods that employ PCA as part of theprocedure, however, effectively reduce the number ofmeasurements and increase the sample to measure-ment ratio. PLSR and PLSDA procedures typically usecross validation, a method of internal validation usingthe original data set, to test for the optimal number ofprincipal components to use (Wold, 1978).
The results for PLS models of sample age as a func-tion of the measurements are shown in Table 3. TheFAA data set was the poorest in modeling sample ageas shown by the low R2 and Q2. In the case of regressionmethods (Wold et al., 2001), the multiple correlationcoefficient squared (R2) is considered to represent theproportion of the variance explained by the model(model fit). The cross validated R2 (Q2) represents theability of a model to make predictions with new data(model predictive ability). Peptide profiles were muchbetter in modeling sample age, with the IP data setbeing the best of the three. Including FAA data withthe SP or the IP produced slight improvement of thefit (R2) or the predictive ability (Q2) of the correspondingmodels. The best 2-way combination was the combined
Journal of Dairy Science Vol. 87, No. 10, 2004
Figure 6. Comparison of actual and predicted cheese age fromthe model (R2 = 0.976, Q2 = 0.952) constructed from all 3 sets ofmeasurements (70% ethanol-soluble peptides, 70% ethanol-insolublepeptides and free amino acids).
SP and IP data set. The combination of all 3 data setsresulted in the strongest model for predicting cheeseage. In this model, all results from one 7-mo-old cheesewere considered outliers in the normal probability plotand were removed from the data set. A plot showingthe actual cheese age and that predicted from the modelbased on the combined analytical data is shown in Fig-ure 6. The model was based on 3 PLS components (Table3); that means that, although all of the measurementswere used, only 3 fundamental properties were neededto make the predictions. Each of these was a differentlinear combination of all the original measurements.
The SIMCA-S program provides a statistic that per-mits comparison of the relative influence of predictors,called the variable influence on the projection (VIP).Examining the VIP values for the model and the arith-metic signs of the corresponding coefficients is informa-tive about the directional effect of the more importantmeasurements. The 20 most important predictors wereall peptides and most had negative signed coefficients.The FAA were much less important in the model, butall except Cys had positive signed coefficients. Thesefindings are related to the tendency of the peptides todiminish in concentration with age because of theirhydrolysis and to the consequent production of FAA.

CHEMOMETRICS OF RAGUSANO CHEESE PROTEOLYSIS 3149
Table 4. Results of partial least squares discriminant analysis classification of samples by age. Probabilityof correct classification by chance in each case was 25%.
ClassificationData set n1 m2 R2 3 Q2 4 Components5 success (%)
FAA6 48 18 0.386 0.324 3 64.6SP7 48 57 0.806 0.710 5 93.8IP8 47 58 0.843 0.657 5 97.9FAA + SP 47 75 0.824 0.732 3 93.6FAA + IP 47 76 0.731 0.636 4 89.4SP + IP 47 115 0.901 0.806 6 100FAA + SP + IP 47 133 0.903 0.789 6 97.9
1Number of observations used after removal of outliers.2Number of measurements in data sets.3Multiple correlation coefficient squared.4Cross-validated multiple correlation coefficient squared.5Optimal number of partial least squares components selected by cross-validation.6FAA = Free amino acids.7SP = 70% ethanol-soluble peptides.8IP = 70% ethanol-insoluble peptides.
The most important predictors were 5 SP and 5 IPpeaks. All of the SP peaks but one had high retentiontimes on the reversed-phase column and are thus rela-tively nonpolar. The IP peaks were mainly of mediumretention behavior and thus medium relative polarity.
Classification of Samples by Age
The PLSDA was applied to the samples in an attemptto classify them according to their age. The results areshown in Table 4. Samples were classified according tothe group for which they had the best match. This canbe expressed in terms of the percentage of the samplesassigned to the correct class. As with the regression fitof sample age, the poorest performance was with theFAA data set. The SP data were better and IP per-formed best (97.9%). Adding FAA and SP to IP dataproduced no change in performance. The best perfor-mance, 100% correct classification, was seen with thecombination of SP and IP data. The 3-mo aged cheeseswere all correctly classified with all 7 data sets. The 4-mo cheeses were correctly classified in all the data setsexcept the FAA, while the 6-mo and particularly the 7-mo cheeses were more problematic. A plot of the rela-tionships between samples based on the classificationusing SP and IP is shown in Figure 7. The 3-mo cheeseswere widely separated from the rest, and there wassome overlap of the 6- and 7-mo samples, at least onthe first 2 principal components. Examination of VIPvalues revealed that 6 of the 10 most discriminatorycompounds for distinguishing between sample classeswere SP, with 2 of these being relatively polar and theothers quite hydrophobic. The other 4 peaks were IP,2 of which were relatively polar and the other 2fairly nonpolar.
Journal of Dairy Science Vol. 87, No. 10, 2004
Classification of Samples by Farm
Results from the exploratory analysis of peptide andFAA data revealed that the farm origin might be used asa variable for differentiating and classifying Ragusanocheese. The PLSDA was applied to the samples in anattempt to classify them according to the farm wherethey were made (Table 5). Of the 12 cheeses, 9 were
Figure 7. The distribution of the cheese samples classified ac-cording to age (� 3 mo; � 4 mo; ▲ 6 mo; ◆ 7 mo) by partial leastsquares discriminant of combined 70% ethanol-soluble and -insolu-ble peptides.
FALLICO ET AL.3150
Table 5. Results of partial least squares discriminant analysis classification of samples by farm. Probabilityof correct classification by chance in each case was 33.3%.
ClassificationData set n1 m2 R2 3 Q2 4 Components5 success (%)
FAA6 48 18 0.720 0.605 5 100SP7 48 57 0.963 0.886 6 100IP8 47 58 0.888 0.697 6 100FAA + SP 47 75 0.976 0.926 7 100FAA + IP 47 76 0.921 0.806 7 100SP + IP 47 115 0.979 0.929 7 100FAA + SP + IP 47 133 0.965 0.917 6 100
1Number of observations used after removal of outliers.2Number of measurements in data sets.3Multiple correlation coefficient squared.4Cross-validated multiple correlation coefficient squared.5Optimal number of partial least squares components selected by cross-validation.6FAA = Free amino acids.7SP = 70% ethanol-soluble peptides.8IP = 70% ethanol-insoluble peptides.
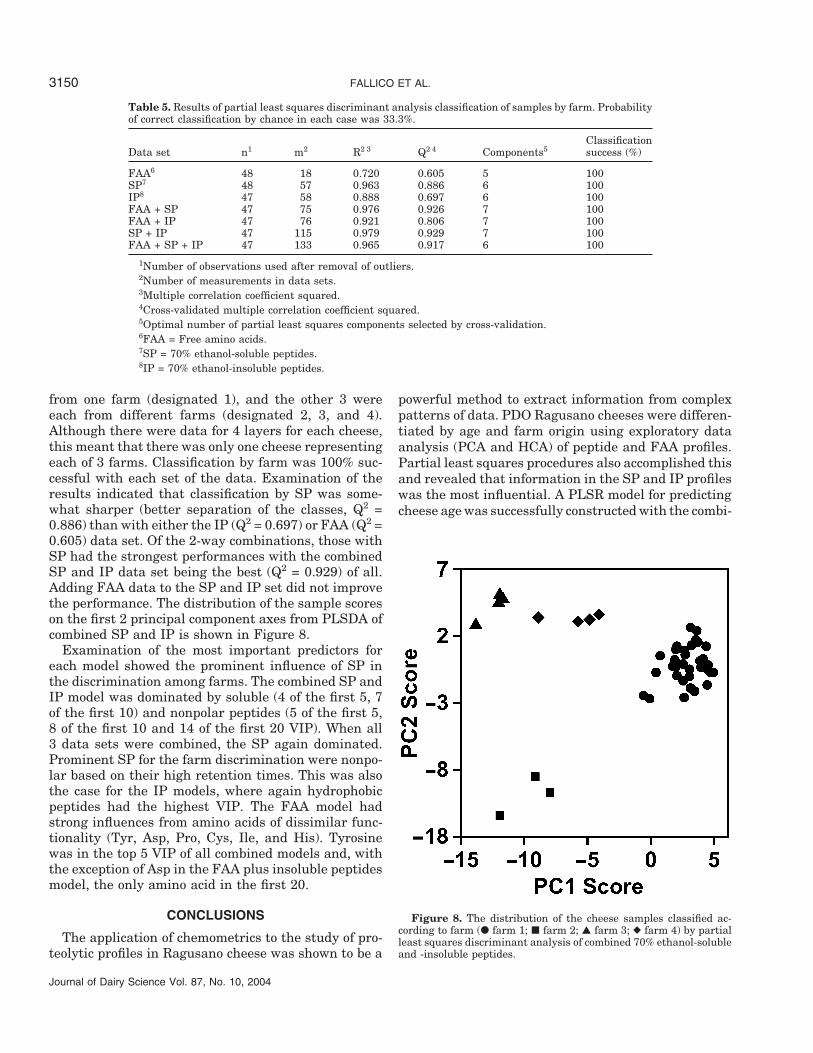
from one farm (designated 1), and the other 3 wereeach from different farms (designated 2, 3, and 4).Although there were data for 4 layers for each cheese,this meant that there was only one cheese representingeach of 3 farms. Classification by farm was 100% suc-cessful with each set of the data. Examination of theresults indicated that classification by SP was some-what sharper (better separation of the classes, Q2 =0.886) than with either the IP (Q2 = 0.697) or FAA (Q2 =0.605) data set. Of the 2-way combinations, those withSP had the strongest performances with the combinedSP and IP data set being the best (Q2 = 0.929) of all.Adding FAA data to the SP and IP set did not improvethe performance. The distribution of the sample scoreson the first 2 principal component axes from PLSDA ofcombined SP and IP is shown in Figure 8.
Examination of the most important predictors foreach model showed the prominent influence of SP inthe discrimination among farms. The combined SP andIP model was dominated by soluble (4 of the first 5, 7of the first 10) and nonpolar peptides (5 of the first 5,8 of the first 10 and 14 of the first 20 VIP). When all3 data sets were combined, the SP again dominated.Prominent SP for the farm discrimination were nonpo-lar based on their high retention times. This was alsothe case for the IP models, where again hydrophobicpeptides had the highest VIP. The FAA model hadstrong influences from amino acids of dissimilar func-tionality (Tyr, Asp, Pro, Cys, Ile, and His). Tyrosinewas in the top 5 VIP of all combined models and, withthe exception of Asp in the FAA plus insoluble peptidesmodel, the only amino acid in the first 20.
CONCLUSIONS
The application of chemometrics to the study of pro-teolytic profiles in Ragusano cheese was shown to be a
Journal of Dairy Science Vol. 87, No. 10, 2004
powerful method to extract information from complexpatterns of data. PDO Ragusano cheeses were differen-tiated by age and farm origin using exploratory dataanalysis (PCA and HCA) of peptide and FAA profiles.Partial least squares procedures also accomplished thisand revealed that information in the SP and IP profileswas the most influential. A PLSR model for predictingcheese age was successfully constructed with the combi-
Figure 8. The distribution of the cheese samples classified ac-cording to farm (� farm 1; � farm 2; ▲ farm 3; ◆ farm 4) by partialleast squares discriminant analysis of combined 70% ethanol-solubleand -insoluble peptides.

CHEMOMETRICS OF RAGUSANO CHEESE PROTEOLYSIS 3151
nation of peptide and FAA data, but the combined pep-tide data set without FAA was nearly as effective. TheSP and IP profiles were also the most useful for classify-ing cheese samples according to their age and farmorigin by PLSDA.
Analysis of cheese peptide data demonstrated thatRagusano cheese at 3 mo of age had clearly distinguish-able peptide profiles from those at the other ages exam-ined, which were essentially comparable. These find-ings related well with results from chemical analysesand confirmed our previous report (Fallico et al., 2003b).The early 4 mo of ripening are essential for producingthe peptide profile typical of Ragusano cheese and lessvariation occurs between 4 to 7 mo of ripening. Chemo-metric analyses showed that the farm origin stronglyaffected cheese peptide profiles. Relatively nonpolar SPand, to a lesser extent, fairly nonpolar IP were foundto be the most influential predictors in discriminatingcheeses produced by different farms. Both results pointto the factors characterizing the typical nature of Ragu-sano cheese. The traditional technology, providing forthe use of raw milk and wooden cheese-making equip-ment, generates cheeses having unique features butalso a great variability in cheese quality. This is linkedto the contribution of native microflora from the localmilk and environment to the cheese ripening, differingfrom farm to farm.
The extreme effects of the different contributions offarm-related native microflora to cheese ripening wasreflected in the large variability observed in the FAAprofile of Ragusano cheese. This probably preventedthe establishment of a chemometric model, as has beensuccessfully done by Resmini et al. (1985, 1993) forother traditional Italian cheeses. However, the sameauthors failed the application of a chemometric modelto the FAA profile of Provolone cheese (Resmini et al.,1988), and similar problems were found by Innocente(1997) when attempting to evaluate the typical natureof Montasio cheese. The failure cases were probablydue again to the typical nature of these cheeses, havingpeculiar qualitative and organoleptic features, but alsoa great variability in cheese quality (Fox et al., 1993).The effects of this variability are reflected on the bio-chemical events of cheese ripening, such as proteolysis,generating unpredictable profiles. In contrast, the uni-formity in Parmigiano-Reggiano and Grana Padanocheese quality, guaranteed by the well-standardizedtechnology, best fits to the chemometric modeling ofcompositional parameters. Further studies are neededto more deeply explore the relationships between vari-able microclimates, proteolysis, and development oftypical characters of PDO Ragusano cheese.
Journal of Dairy Science Vol. 87, No. 10, 2004
ACKNOWLEDGMENTS
The authors thank John Hannon, Concetta Pedilig-gieri, Giovanna Farina, and Glenda Leto for technicalassistance in cheese analysis. Financial support wasprovided by Assessorato Agricoltura e Foreste della Re-gione Siciliana, Palermo, Italy.
REFERENCES
Albenzio, M., M. R. Corbo, S. U. Rehman, P. F. Fox, M. De Angelis,A. Corsetti, A. Sevi, and M. Gobbetti. 2001. Microbiological andbiochemical characteristics of Canestrato Pugliese cheese madefrom raw milk, pasteurized milk or by heating the curd in hotwhey. Int. J. Food Microbiol. 67:35–48.
Andrews, A. T. 1983. Proteinases in normal bovine milk and theiraction on the caseins. J. Dairy Res. 50:45–55.
Association of Official Analytical Chemists. 2000. Official Methodsof Analysis. 17th ed. AOAC, Gaithersburg, MD.
Barker, M., and W. Rayens. 2003. Partial least squares for discrimina-tion. J. Chemom. 17:166–173.
Battistotti, B., and C. Corradini. 1993. Italian cheese. Page 221 inCheese: Chemistry, Physics and Microbiology. Vol. 2. P. F. Fox,ed. Chapman and Hall, London, United Kingdom.
Beebe, K. R., R. J. Pell, and M. B. Seascholtz. 1998. Chemometrics:A Practical Guide. John Wiley & Sons, Inc., New York, NY.
Blakesley, R. W., and J. A. Boezi. 1977. A new staining techniquefor proteins in polyacrylamide gels using Coomassie BrilliantBlue G250. Anal. Biochem. 82:580–581.
Butikofer , U., and D. Fuchs. 1997. Development of free amino acids inAppenzeller, Emmentaler, Gruyere, Raclette, Sbrinz and Tilsitercheese. Lait 77:91–100.
Bynum, D. G., and D. M. Barbano. 1985. Whole milk reverse osmoseretentates for Cheddar cheese manufacture: Chemical changesduring aging. J. Dairy Sci. 68:1–10.
Corsetti, A., M. R. Corbo, M. Albenzio, R. Di Cagno, M. Gobbetti, andP. F. Fox. 2001. Microbiology and biochemistry of CaciocavalloSilano cheese. Ital. J. Food Sci. 13:297–309.
Creamer, L. K. 1985. Water absorption by renneted casein micelles.Milchwissenschaft 40:589–591.
Fallico, V., L. Chianese, J. Horne, S. Carpino, and G. Licitra. 2003b.Influence of feeding strategy (pasture vs TMR) on proteolysis inRagusano cheese during ripening. J. Dairy Sci. 86(Suppl.1):367. (Abstr.)
Fallico, V., L. Chianese, S. Carpino, and G. Licitra. 2003a. Aspettiqualitativi equantitativi della proteolisi nel corso della stagiona-tura del formaggio Ragusano. Sci. Tecn. Latt.-Cas. 54:117–141.
Fenelon, M. A., P. O’Connor, and T. P. Guinee. 2000. The effect offat content on the microbiology and proteolysis in Cheddar cheeseduring ripening. J. Dairy Sci. 83:2173–2183.
Fox, P. F., and B. F. Walley 1971. Influence of sodium chloride onthe proteolysis of casein by rennet and by pepsin. J. Dairy Res.38:165–170.
Fox, P. F., and T. P. Guinee. 1987. Italian cheeses. Pages 221-255 inCheese: Chemistry, Physics and Microbiology. Vol. 2. P. F. Fox,ed. Elsevier Applied Sci., London, United Kingdom.
Fox, P. F., J. Law, P. L. H. McSweeney, and J. Wallace. 1993. Biochem-istry of cheese ripening. Pages 389–438 in Cheese: Chemistry,Physics and Microbiology. Vol. 1. P. F. Fox, ed. Chapman andHall, London, United Kingdom.
Gazzetta Ufficiale Comunita Europea. 1996. No. 1263. July 1, 1996.Gazzetta Ufficiale Repubblica Italiana. 1995. No. 133. June 9,1995.
Gobbetti, M., S. Lowney, E. Smacchi, B. Battistotti, P. Damiani, andP. F. Fox. 1997. Microbiology and biochemistry of Taleggio cheeseduring ripening. Int. Dairy J. 7:509–517.
Grappin, R., and E. Beuvier. 1997. Possible implications of milk pas-teurization on the manufacture and sensory quality of ripenedcheese. Int. Dairy J. 7:751–761.

FALLICO ET AL.3152
Guinee, T. P., and P. F. Fox. 1984. Studies on Romano-type cheese:General proteolysis. Ir. J. Food Sci. Technol. 8:105–114.
Innocente, N. 1997. Free amino acids and water-soluble nitrogen asripening indices in Montasio cheese. Lait 77:359–369.
International Dairy Federation. 1993. Standard Method 20B: Milk.Determination of nitrogen content. IDF, Brussels, Belgium.
International Dairy Federation. 1997. Standard Method 152A: Milkand milk products. Determination of fat content (general guidanceon the use of butyrometric methods). IDF, Brussels, Belgium.
Kelly, M., P. F. Fox, and P. L. H. McSweeney. 1996. Effect of salt-in-moisture on proteolysis in Cheddar-type cheese. Milchwis-senschaft 51:498–501.
Krause, I., A. Bockhardt, and H. Klostermeyer. 1997. Characteriza-tion of cheese ripening by free amino acids and biogenic aminesand influence of bactofugation and heat treatment of milk. Lait77:101–108.
Kristiansen, K. R., A. S. Deding, D. F. Jensen, Y. Ardo, and K. B.Qvist. 1999. Influence of salt content on ripening of semi-hardround-eyed cheese of Danbo-type. Milchwissenschaft 54:19–23.
Kuchroo, C. N., and P. F. Fox. 1982. Soluble nitrogen in Cheddarcheese: Comparison of extraction procedures. Milchwissenschaft37:331–335.
Lee, H. J., N. F. Olson, and D. B. Lund. 1980. Diffusion of salt, fattyacids and esterases in Mozzarella cheese. J. Dairy Sci. 63:513–518.
Licitra, G., G. Portelli, P. Campo, G. Longombardo, G. Farina, S.Carpino, and D. M. Barbano. 1998. Technology to produce Ragu-sano cheese: A survey. J. Dairy Sci. 81:3343–3349.
Licitra, G., P. Campo, M. Manenti, G. Portelli, S. Scuderi, S. Carpino,and D. M. Barbano. 2000. Composition of Ragusano cheese duringaging. J. Dairy Sci. 83:404–411.
Lynch, C. M., P. L. H. McSweeney, P. F. Fox, T. M. Cogan, and F. B.Drinan. 1996. Manufacture of Cheddar cheese with and withoutadjunct lactobacilli under controlled microbiological conditions.Int. Dairy J. 6:851–867.
McSweeney, P. L. H., and P. F. Fox. 1993. Cheese: Methods of chemi-cal analysis. Pages 341-388 in Cheese: Chemistry, Physics, andMicrobiology. Vol. 1: General Aspects. 2nd ed. P. F. Fox, ed. Chap-man and Hall, London, United Kingdom.
McSweeney, P. L. H., N. F. Olson, P. F. Fox, A. Healy, and P. Hojrup.1993. Proteolytic specificity of chymosin on bovine αs1-casein. J.Dairy Res. 60:401–412.
Journal of Dairy Science Vol. 87, No. 10, 2004
Melilli, C., D. M. Barbano, M. Manenti, J. M. Lynch, S. Carpino, andG. Licitra. 2004. Lipolysis and proteolysis in Ragusano cheeseduring brine salting at different temperatures. J. Dairy Sci.87:2359–2374.
Mulvihill, D. M., and P. F. Fox. 1979. Proteolytic specificity of chy-mosin on bovine αs1-casein. J. Dairy Res. 46:641–651.
Noel, Y., Y. Ardo, S. Pochet, A. Hunter, P. Lavanchy, W. Luginbuhl,D. Le Bars, A. Polychroniadou, and L. Pellegrino. 1998. Charac-terisation of protected denomination of origin cheeses: Relation-ships between sensory texture and instrumental data. Lait78:569–588.
Polo, C., M. Ramo, and R. Sanchez. 1985. Free amino acids by highperformance liquid chromatography and peptide by gel elctro-phoresis in Mahon cheese during ripening. Food Chem. 16:85–96.
Pripp, A. H., S. Leszek, and T. Sorhaug. 2000. Chemometrical analysisof proteolytic profiles during cheese ripening. Int. Dairy J.10:249–253.
Resmini, P., J. A. Hogenboom, C. Pazzaglia, and L. Pellegrino. 1993.Gli amminoacidi liberi nella caratterizzazione analitica delformaggio Grana Padano. Sci. Tecn. Latt.-Cas. 1:7–19.
Resmini, P., L. Pellegrino, C. Pazzaglia, and J. A. Hogenboom. 1985.Gli amminoacidi liberi nella tipizzazione del formaggio Parmi-giano Reggiano, ed in particolare nel prodotto grattuggiato. Sci.Tecn. Latt.-Cas. 36:557–592.
Resmini, P., L. Pellegrino, J. A. Hogenboom, and M. Bertuccioli. 1988.Indagine sulla composizione in amminoacidi liberi del formaggioProvolone quale possible elemento caratterizzante. Sci. Tecn.Latt.-Cas. 39:81.
Sousa, M. J., Y. Ardo, and P. L. H. McSweeney. 2001. Advances inthe study of proteolysis during cheese ripening. Int. Dairy J.11:327–345.
Urbach, G. 1990. Effect of feed on flavor in dairy foods. J. Dairy Sci.73:3639–3650.
Visser, S. 1993. Proteolytic enzymes and their relation to cheeseripening and flavour: An overview. J. Dairy Sci. 76:329–350.
Wold, S. 1978. Cross-validatory estimation of the number of compo-nents in factor and principal components models. Technometrics20:397–405.
Wold, S., A. Ruhe, H. Wold, and I. W. J. Dunn. 1984. The collinearityproblem in linear regression: The partial least squares approachto generalized inverses. SIAM J. Sci. Statist. Comput. 5:735–743.
Wold, S., M. Sjostrom, and L. Eriksson. 2001. PLS-regression: A basictool of chemometrics. Chemom. Intell. Lab. Syst. 58:109–130.
Copyright © 2022 FDOKUMEN