Bioactive flavone dimers from Ouratea multiflora (Ochnaceae)

Molecules 2014, 19, 10370-10385; doi:10.3390/molecules190710370
molecules ISSN 1420-3049
www.mdpi.com/journal/molecules
Article
Variation in the Bioactive Compound Content at Three Ripening Stages of Strawberry Fruit
Sandra Voća 1, Jana Šic Žlabur 1,*, Nadica Dobričević 1, Lidija Jakobek 2, Marijan Šeruga 2,
Ante Galić 1 and Stjepan Pliestić 1
1 Department of Agricultural Technology, Storage and Transport, Faculty of Agriculture, University
of Zagreb, Svetošimunska cesta 25, HR-10000 Zagreb, Croatia; E-Mails: [email protected] (S.V.);
[email protected] (N.D.); [email protected] (A.G.); [email protected] (S.P.) 2 Department of Applied Chemistry and Ecology, Faculty of Food Technology, J. J. Strossmayer,
University of Osijek, Kuhačeva 18, HR-31000 Osijek, Croatia;
E-Mails: [email protected] (L.J.); [email protected] (M.S.)
* Author to whom correspondence should be addressed; E-Mail: [email protected];
Tel.: +385-012393683; Fax: +385-012393919.
Received: 27 May 2014; in revised form: 7 July 2014 / Accepted: 8 July 2014 /
Published: 17 July 2014
Abstract: During the harvest season of two consecutive years, five strawberry cultivars
(‘Arosa’, ‘Elsanta’, ‘Marmolada’, ‘Miss’ and ‘Raurica’), grown in the continental part of
the Republic of Croatia, were examined. Strawberry fruits quality was evaluated by
individual phenol compounds, individual anthocyanins and fruit color. Fruits were
harvested in three different periods. Analyzed strawberry cultivars show very good average
values of the studied phenolic acids and flavonoids with predominant caffeic acid and
epicatechin content in all researched strawberry cultivars. Considering the content of
individual anthocyanins, pelargonidin 3-glucoside is predominant in strawberry extract
followed by cyanidin-3-glucoside and pelargonidin 3-rutinoside. The correlation between
individual anthocyanin content and chromaticity parameters was detected in all strawberry
cultivars, additionally correlation coefficients and statistical significance were much lower.
The results show a positive association between cultivar and harvest time on strawberry
pulp color, with each of the color variables, a, b, a/b ratio, C, L and h° values.
Keywords: Fragaria x ananassa Duch.; harvest period; anthocyanin content; phenolic
acids; flavonoids
OPEN ACCESS

Molecules 2014, 19 10371
1. Introduction
Strawberry fruit (Fragaria x ananassa Duch.) is rich source of vitamins and beneficial dietary
compounds. Worldwide, strawberry is one of the most popular fruits for human consumption,
appreciated for its unique flavour. In addition to the usual nutrients, such as vitamins and minerals,
strawberries are rich in anthocyanins, flavonoids and phenolic acids [1,2]. Besides sweetness, acidity
and flavour, the development of red or scarlet color is one of the most important characteristics
affecting strawberry fruit quality, as well as contributing to a consumer’s initial impression [3].
The ripening process of strawberry fruits not only strongly affects the favourable nutrition composition
of fruits but also contributes to the creation of the characteristic fruit taste. To achieve the maximum
quality in terms of fruit flavor and color, strawberry fruits must be harvested at stage of full maturity.
The final ripening stage of the fruit comprises a series of biochemical and physiological processes
which inter alia include: modification of cell walls, the conversion of starch into sugars, alterations in
pigment biosynthesis, accumulation of flavour and aromatic volatiles as well as heightened level of
polyphenols and other antioxidant compounds [4,5]. Harvest dynamics of strawberry fruits have a very
important role in terms of fruit quality and yield quantity. Strawberry genotype as well as harvest
period and other factors such as: selection of mulch, air temperature and humidity during the
maturation period, irrigation and plant protection have strong influences on harvest dynamics.
Maturation dynamics and harvest period are the main factors influencing the significant differences
between cultivation years [6].
The characteristic strawberry fruit color results from the pigment compounds anthocyanins.
Different studies have shown that strawberries have a simple anthocyanin profile, with pelargonidin
3-glucoside (PG) as predominant pigment, followed by cyanidin 3-glucoside (CG) [3,7]. Pelargonidin
3-glucoside (PG), the major anthocyanin compound found in strawberries is most responsible for the
bright red color of fresh strawberries [3]. Attractive color is a very important sensory characteristic for
the fresh consumption of fruits as well as it for the processed strawberry food products such as juice,
jam, dehydrated fruits, etc., Anthocyanins show a significant nutritional value directly associated with
a number of benefits for human health ranging from antioxidant potential, anticancer activity, anti-
inflammatory and anti-angiogenic properties [8–14]. Strawberry genotype strongly correlates with the
anthocyanin profile present in fruits [15]. Various studies have shown the significance of strawberry
germplasm on the nutritional and sensory parameters of the fruits [16]. The aim of this study was to
investigate the changes in the quantity of anthocyanins and phenols content during the harvest season,
and how the composition of anthocyanins, mainly pelargonidin 3-glucoside, pelargonidin 3-rutinoside
and cyanidin 3-glucoside affects fruit color.
2. Results
2.1. The Individual Anthocyanin Composition of Selected Strawberry Varieties
Results of analyzed individual anthocyanins in different strawberry cultivars are shown in Table 1.
The Pg 3-gluc was identified as the major anthocyanin in all analyzed cultivars. The highest value of
Pg 3-gluc (432.28 mg kg−1) was measured in variety ‘Marmolada’ in the third harvest period second
research year while the lowest value (107.94 mg kg−1) was in the variety ‘Raurica’ in the third harvest

Molecules 2014, 19 10372
period of the first research year. The lowest values for Pg 3-gluc content were noted in both research
years for cultivars ‘Elsanta’, ‘Miss’ and ‘Raurica’. The Cy 3-gluc concentration ranged from 35.90 to
88.41 mg kg−1 in the first research year and from 35.31 to 87.13 mg kg−1 in the second year. The
highest value of the Cy 3-gluc was noted in the ‘Arosa’, ‘Raurica’ and ‘Elsanta’ cultivars, while the
lowest values were noted in ‘Marmolada’ and ‘Miss’ cultivars. The concentration of Pg 3-gluc were
also different depending on the studied cultivars. Concentrations of Pg 3-rut were more even. Lower
values were noted in cultivars ‘Raurica’ (23.65–64.32 mg kg−1) and ‘Marmolada’ (34.37–61.24 mg kg−1)
in the first year. From all analyzed individual anthocyanins high statistically significant differences
between strawberry variety and harvest period in both research years were determined.
Table 1. Content of individual anthocyanins (mg kg−1) in selected strawberry varieties
harvested in three harvest periods during two research years.
First research yearStrawberry
cultivar Harvest period
Cyanidin 3-glucoside **
Pelargonidin 3-glucoside **
Pelargonidin 3-rutinoside **
Arosa 1 81.23 b 321.54 a 55.21 b 2 82.87 a 317.18 b 50.92 b
3 82.66 a 309.08 b 85.33 a
Elsanta 1 72.32 b 234.32 b 46.79 c 2 78.02 b 222.25 b 57.65 b
3 86.29 a 254.98 a 67.17 a
Marmolada 1 45.21 b 325.11 a 61.24 a 2 48.10 b 263.39 b 50.11 b
3 68.42 a 336.49 a 34.37 c
Miss 1 66.94 a 194.84 c 81.94 a 2 35.90 b 241.82 b 68.21 b
3 40.42 b 255.78 a 59.15 b
Raurica 1 85.08 a 220.61 a 64.32 a 2 75.42 b 177.25 b 35.81 b
3 88.41 a 107.94 b 23.65 b
Second research year
Arosa 1 78.73 b 205.18 c 51.67 a 2 76.28 b 318.37 b 37.97 b
3 87.13 a 385.66 a 40.63 b
Elsanta 1 70.32 a 245.21 a 41.23 b 2 64.24 b 235.83 b 48.87 b
3 68.08 a 240.75 a 58.10 a
Marmolada 1 44.85 b 420.17 b 64.90 a 2 46.30 b 260.51 c 42.28 b
3 56.50 a 432.28 a 39.76 b
Miss 1 50.81 a 201.82 b 55.12 a 2 39.06 b 259.44 a 44.86 b
3 35.31 b 252.10 a 56.78 a
Raurica 1 69.30 a 245.14 b 41.93 a 2 57.89 b 227.21 c 39.59 a
3 58.52 b 278.49 a 17.12 b
Results with different letters are significantly different (p < 0.05); ** p < 0.01.

Molecules 2014, 19 10373
2.2. Phenolic Compounds Determined in Selected Strawberry Varieties
The content of select three phenolic acids (caffeic, chlorogenic and ellagic acid) and four flavonoids
(epicatehin, catehin, procyanidin B2 and rutin) are shown in Table 2. High statistically significant
differences were determined in five strawberry cultivars for analyzed phenolic compounds in both
research years. Among the analyzed phenolic acids in strawberry fruits, caffeic acid is predominant.
Caffeic acid content is the highest in all analyzed strawberry varieties compared with other determined
phenolic acids. According to the presence, chlorogenic acid and ellagic acid follow with slight
modifications in the variety ‘Marmolada’ in the second and third harvest period (Table 2). Variety
‘Arosa’ through all three harvest periods in both research years had the highest average value of
caffeic acid (65.84 mg kg−1 in the first year; 65.26 mg kg−1 in the second research year). The amount of
chlorogenic acid was statistically significantly different considering the strawberry variety and harvest
period in range from 6.17 to 81.22 mg kg−1 in the first year, and 6.80 to 97.43 mg kg−1 in the second
research year. The minimum values of chlorogenic acid were determined in both research years in the
variety ‘Marmolada’ in the second and third harvest period. The highest value of chlorogenic acid was
determined in the varietiy ‘Arosa’ in the first harvest period in both research years. Ellagic acid
amounts were uniform in both years. Variety ‘Miss’ had the highest value of extracted ellagic acid in
both years in the first harvest period. The amount of epicatechin was 20.60 to 93.17 mg kg−1 in the first
and 12.82 to 84.45 mg kg−1 in the second research year. The highest values were observed in fruits of
strawberry variety ‘Miss’ in the third harvest period in both years. Average values of catechin were
uniform in both years, regardless of the harvest period. The amount of procyanidin B2 was the highest
in ‘Arosa’ in the second harvest period in both research years. Quantity of rutin ranged from
4.07 mg kg−1 to 85.12 mg kg−1 in the first and from 4.83 mg kg−1 to 96.74 mg kg−1 in the second
research year. The highest value of rutin was recorded in variety ‘Arosa’ in the first harvest period in
both years. The quantity of rutin was uneven, depending on the variety and harvest period.
Table 2. Phenolic compounds content (mg kg−1) in samples of selected strawberry varieties
harvested in three harvest periods during two research years.
First Research Year
Phenolic Acid Flavonoids
Strawberry
Cultivar
Harvest
Period
Caffeic
Acid
Chlorogenic
Acid
Ellagic
Acid Epicatechin Catechin
Procyanidin
B2 Rutin
** ** ** ** ** ** ** **
Arosa
1 85.22 a 81.22 a 24.17 a 42.12 b 72.14 a 72.01 b 85.12 a
2 57.91 b 32.38 b 24.26 a 44.98 b 36.11 c 84.07 a 30.97 b
3 54.39 b 34.93 b 22.43 b 83.89 a 65.74 b 51.74 c 35.25 b
Elsanta
1 29.62 b 28.18 a 23.53 a 64.79 b 53.19 a 28.42 a 40.01 a
2 42.85 a 18.99 b 21.46 ab 82.32 a 40.60 b 21.20 b 4.07 c
3 22.44 c 30.52 a 20.99 ab 83.26 a 52.59 a 28.73 a 13.91 b
Marmolada
1 41.22 a 25.12 a 22.61 a 52.11 a 68.29 a 33.22 a 39.11 b
2 13.11 c 6.17 b 21.51 ab 49.54 a 26.46 c 30.74 a 27.65 c
3 24.07 b 8.48 b 22.54 a 20.60 c 43.52 b 24.18 b 47.24 a

Molecules 2014, 19 10374
Table 2. Cont.
First Research Year Phenolic Acid Flavonoids
Strawberry Cultivar
Harvest Period
Caffeic Acid
Chlorogenic Acid
Ellagic Acid
Epicatechin Catechin Procyanidin
B2 Rutin
** ** ** ** ** ** ** **
Miss 1 70.57 a 40.32 b 25.74 a 58.22 b 72.82 a 23.43 b 74.08 a
2 31.51 b 50.30 a 22.10 ab 51.15 b 51.27 b Trace c 6.01 c 3 17.03 c 12.67 c 20.73 ab 93.17 a 30.85 c 52.45 a 21.08 b
Raurica 1 24.64 a 15.87 b 23.22 a 47.15 a 67.60 a 68.99 a 64.32 a
2 12.86 b 27.10 a 21.90 ab 45.43 ab 33.36 b 17.84 c 16.79 c
3 14.23 b 20.37 ab 21.33 ab 43.65 b 34.99 b 43.27 b 32.50 b
Second research year Arosa 1 92.73 a 97.43 a 22.13 ab 41.11 b 85.30 a 75.78 b 96.74 a
2 34.73 c 14.67 c 21.70 ab 30.96 c 37.17 c 89.52 a 23.74 c
3 68.33 b 40.36 b 23.84 a 63.82 a 62.52 b 58.61 c 55.92 b
Elsanta 1 30.16 a 31.16 a 23.18 a 61.82 a 50.29 a 31.01 a 35.22 a
2 26.69 b 23.30 ab 21.21 ab 51.99 a 43.47 ab 24.65 b 12.96 b
3 16.65 c 14.35 b 20.71 ab 23.73 b 37.02 b 30.02 a 10.46 b
Marmolada 1 43.99 a 33.40 a 23.47 a 47.69 a 66.77 a 29.01 a 41.81 a
2 12.83 b 6.80 b 21.66 b 39.91 ab 28.38 c 25.82 ab 39.16 a
3 24.77 b 8.61 b 23.17 a 36.32 b 39.19 b 21.65 b 19.15 b
Miss 1 58.22 a 38.62 a 24.18 a 55.22 b 68.21 a 25.22 b 58.10 a
2 18.27 b 21.82 b 20.56 b 38.99 c 46.49 b Trace c 4.83 c
3 18.89 b 13.10 b 22.13 ab 84.45 a 33.58 c 57.78 a 39.51 b
Raurica 1 13.01 ab 17.61 b 21.90 ab 29.84 b 58.53 a 62.02 a 43.18 a
2 18.16 a 30.55 a 22.13 a 52.60 a 33.06 b 16.98 b 21.76 b
3 11.43 b 21.76 b 21.04 ab 12.82 c 29.58 b 37.39 b 23.79 b
Results with different letters are significantly different (p < 0.05); ** p < 0.01.
2.3. Color Variables in Different Cultivars of Strawberry Fruit
Analyzed color variables in different strawberry cultivars for first and second research year are
presented in Tables 3 and 4. The a value in all the cultivars expect ‘Raurica’ was lower in the first
research year. There are also significant differences in a value between first, second and third harvest
period in all analyzed cultivars. The highest b value was observed in the ‘Arosa’ cultivar in the second
year, while the lowest value was determined in same year for the ‘Miss’ cultivar. Significant
differences were noted in L, chroma and h° between cultivars, year of research and harvest period.
‘Arosa’ cultivar showed lower hue angle and L in both years, a synonym of redder and darker colour,
while color intensity, c was the highest in the first year and also very high in the second year. ‘Raurica’
showed higher L during both years, which is in accordance with the observation that they are less red
color than the other analyzed strawberry cultivars. Significant differences in L and hue h° values
between harvest times and strawberry pulp color were observed in both years (p < 0.01). L values in
second and third harvest period in both research years are higher. Opposite to that, chroma values were
always higher in the first harvest period. Also in second research year, L values were lower in first two
harvest periods and higher in third harvest period compare with first research year. Cultivar
‘Marmolada’ showed lower values for hue angle and greater values for a/b (high color) than the other
cultivars, indicating higher coloration. ‘Arosa’ and ‘Elsanta’ showed intermediate a/b values, while

Molecules 2014, 19 10375
lower values were recorded for ‘Miss’ followed by ‘Raurica’, the less colored cultivar. During the first
year, second harvest produced minimum a/b values and minimum values for Hue angle, while during
the second year at the same harvest periods those values were maximum for a/b values and also very
high for Hue angle.
Table 3. Effects of cultivar and harvest time on strawberry pulp colour variables during
first research year. Values are means ± SD.
a b a/b Ratio C L h° ** ** ** ** ** **
Har
vest
tim
e
Fir
st
‘Arosa’ 19.9 bc ± 0.11 13.3 c ± 0.58 1.50 c ± 0.072 27.0 a ± 0.27 20.3 i ± 0.41 39.4 a ± 0.87‘Elsanta’ 20.8 a ± 0.49 12.4 f ± 0.55 1.68 ab ± 0.086 27.6 a ± 0.67 21.0 h ± 0.15 39.7 a ± 0.39
‘Marmolada’ 19.5 bcd ± 0.34 13.3 c ± 0.30 1.46 cd ± 0.057 23.3 d ± 0.48 23.7 fg ± 0.5 32.8 d ± 0.83‘Miss’ 19.3 de ± 0.25 14.6 ab ± 0.43 1.32 efg ± 0.050 24.6 bc ± 0.42 28.4 ab ± 0.2 39.9 a ± 0.26
‘Raurica’ 19.2 de ± 0.18 14.5 ab ± 0.50 1.32 efg ± 0.059 24.0 c ± 0.15 26.9 c ± 0.23 39.6 a ± 0.46
Sec
ond
‘Arosa’ 16.8 hi ± 0.21 14.2 b ± 0.33 1.19 h ± 0.017 20.9 e ± 0.22 25.9 d ± 0.34 38.2 b ± 0.42‘Elsanta’ 19.4 cd ± 0.22 13.2 cd ± 0.32 1.47 cd ± 0.052 22.9 d ± 0.28 24.1 ef ± 0.0 31.8 e ± 0.36
‘Marmolada’ 17.5 g ± 0.40 12.6 def ± 0.25 1.39 de ± 0.015 20.9 e ± 0.27 24.4 e ± 0.47 28.3 f ± 0.80‘Miss’ 16.5 i ± 0.17 13.4 c ± 0.37 1.24 gh ± 0.038 19.8 f ± 0.37 24.4 e ± 0.27 34.2 c ± 0.24
‘Raurica’ 18.7 ef ± 0.42 15.0 a ± 0.28 1.25 gh ± 0.050 24.4 bc ± 0.26 28.7 a ± 0.21 39.6 a ± 0.15
Th
ird
‘Arosa’ 20.1 b ± 0.69 11.6 g ± 0.38 1.73 a ± 0.094 27.6 a ± 0.57 21.3 h ± 0.16 39.1 a ± 0.94‘Elsanta’ 18.2 f ± 0.24 14.5 ab ± 0.49 1.26 gh ± 0.058 24.2 bc ± 0.29 28.0 b ± 0.08 39.2 a ± 0.24
‘Marmolada’ 21.2 a ± 0.41 13.2 cde ± 0.33 1.61 b ± 0.017 27.6 a ± 0.51 21.3 h ± 0.15 39.9 a ± 0.20‘Miss’ 17.2 gh ± 0.24 12.5 ef ± 0.48 1.37 ef ± 0.067 20.5 e ± 0.32 23.5 g ± 0.27 32.6 de ± 0.17
‘Raurica’ 19.4 cd ± 0.37 15.1 a ± 0.14 1.29 fg ± 0.029 24.8 b ± 0.15 28.5 a ± 0.12 39.7 a ± 0.52
a = red-green values; b = blue-yellow values; C = chroma; L = lightness; h° = angle; different letters indicate
significant differences between means at p ≤ 0.05. * p < 0.05, ** p < 0.01, NS not significant.
Table 4. Effects of cultivar and harvest time on strawberry pulp colour variables during
second research year. Values are means ± SD.
a b a/b Ratio C L h° ** ** ** ** ** **
Har
vest
tim
e
Fir
st
‘Arosa’ 36.0 a ± 0.53 24.1 a ± 0.39 1.49 bcd ± 0.0 43.1 a ± 0.21 14.6 f ± 0.54 33.5 ef ± 1.04‘Elsanta’ 21.1 d ± 0.70 17.9 c ± 0.16 1.18 g ± 0.04 27.4 d ± 0.72 20.8 d ± 0.52 39.8 ab ± 0.71
‘Marmolada’ 35.0 a ± 1.58 22.0 b ± 0.31 1.59 b ± 0.05 41.1 b ± 1.53 13.8 f ± 1.11 31.5 gh ± 0.94‘Miss’ 19.6 e ± 0.14 12.9 fg ± 0.52 1.52 bcd ± 0.00 23.4 f ± 0.15 23.9 c ± 0.32 32.8 efg ± 0.32
‘Raurica’ 19.4 e ± 0.18 12.6 gh ± 0.41 1.54 bc ± 0.04 22.9 f ± 0.26 24.1 c ± 0.24 32.1 fgh ± 1.41
Sec
ond
‘Arosa’ 16.5 i ± 0.27 12.4 ghi ± 0.41 1.32 f ± 0.05 21.4 g ± 0.61 24.4 c ± 0.51 30.2 h ± 2.53 ‘Elsanta’ 32.8 b ± 0.62 12.1 hi ± 0.42 2.70 a ± 0.11 40.7 b ± 0.82 20.9 d ± 0.82 36.4 c ± 0.62
‘Marmolada’ 17.7 gh ± 0.61 12.4 ghi ± 0.44 1.43 def ± 0.09 20.8 gh ± 0.53 24.5 c ± 0.44 31.9 fgh ± 0.81‘Miss’ 30.2 c ± 1.53 11.3 i ± 0.22 2.67 a ± 0.12 35.4 c ± 2.31 19.0 e ± 1.35 30.9 gh ± 1.87
‘Raurica’ 16.7 hi ± 0.34 13.8 de ± 0.30 1.21 g ± 0.05 21.4 g ± 0.59 26.1 b ± 0.43 39.9 b ± 0.86
Th
ird
‘Arosa’ 17.1 ghi ± 0.01 11.8 hi ± 0.50 1.45 cde ± 0.06 20.3 gh ± 0.34 23.6 c ± 0.21 32.5 efg ± 0.33‘Elsanta’ 16.1 i ± 0.22 13.6 def ± 0.47 1.19 g ± 0.03 19.9 h ± 0.52 26.0 b ± 0.83 35.9 cd ± 1.12
‘Marmolada’ 18.2 fg ± 0.25 13.4 ef ± 0.42 1.36 ef ± 0.06 24.2 ef ± 0.64 25.9 b ± 0.34 41.1 a ± 1.14 ‘Miss’ 16.4 i ± 0.29 12.3 ghi ± 0.50 1.33 f ± 0.06 19.8 h ± 0.35 24.5 c ± 0.35 4.1 de ± 0.17
‘Raurica’ 19.2 ef ± 0.24 14.1 d ± 0.39 1.36 ef ± 0.03 24.9 e ± 0.12 28.5 a ± 0.01 39.3 ab ± 0.85
a = red-green values; b = blue-yellow values; C = chroma; L= lightness; h° = angle; different letters indicate
significant differences between means at p ≤ 0.05, * p < 0.05, ** p < 0.01, NS not significant.

Molecules 2014, 19 10376
2.4. Correlation Coefficients between Cromacity Parameters and Individual Anthocyanin (Cy 3-gluc,
Pg 3-gluc and Pg 3-rut)
A high correlation coefficient (p < 0.01) was observed between Cy 3- gluc and a (Table 5) in first
research year with values ranging from −0.84 (‘Elsanta’) to 0.96 (‘Miss’); while in second research
year (Table 5), except for cultivar ‘Elsanta’, no other cultivars show significant correlation between
these values. High correlation coefficients between cyanidin 3-glucoside and b (0.72) for ‘Miss’ in the
first research year and −0.88 for ‘Raurica’ in thesecond research year. A significant correlation was
determined for cultivar ‘Elsanta’ (0.62) in the second research year. A high significant correlation was
determined between a/b ratio and cyanidin 3-glucoside. In the first research it was most evident in
cultivars ‘Elsanta’ (−0.79), ‘Raurica’ (0.71) and ‘Marmolada’ (0.85). In the second research year a
significant correlation was observed for cultivars ‘Elsanta’ (−0.62), ‘Marmolada’ (−0.53) and
‘Raurica’ (0.85). In the first research year, high correlations were determined between chroma and
cyanidin 3-glucoside, particularly in cultivars ‘Marmolada’ (0.88), ‘Miss’ (0.99) and ‘Elsanta’ (−0.57).
In the second research year there were no significant correlations between cyanidin 3-glucoside and
chroma value. High significant correlations were also determined between cyanidin 3-glucoside and
the parameter L, in cultivars ‘Marmolada’ (−0.86), ‘Elsanta’ (0.88) and ‘Miss’ (0.92) in the first
research year; while in the second research year, significant correlations were observed in cultivars
‘Raurica’ (−0.75) and ‘Marmolada’ (0.58). High correlations were determined between hue angle and
cyanidin 3-glucoside, particularly in cultivars ‘Marmolada’ (0.84) and ‘Miss’ (0.91), in the first
research year and cultivars ‘Raurica’ (−0.86) and ‘Marmolada’ (0.88) in the second research year.
Table 5. Correlation coefficients (r) between chromaticity parameters a, b, a/b ratio, C, L
and h° and cyanidin-3-glucoside in five strawberry cultivars in both research years.
First Research Year Strawberry Cultivars a b a/b Ratio C L h°
‘Arosa’ −0.00 NS −0.12 NS 0.08 NS −0.07 NS −0.08 NS 0.35 NS ‘Elsanta’ −0.84 ** 0.71 ** −0.79 ** −0.57 * 0.88 ** 0.02 NS
‘Marmolada’ 0.76 ** 0.20 NS 0.85 ** 0.88 ** −0.86 ** 0.84 ** ‘Miss’ 0.96 ** 0.72 ** 0.27 NS 0.99 ** 0.92 ** 0.91 **
‘Raurica’ 0.83 ** −0.39 NS 0.71 ** 0.04 NS −0.40 NS 0.08 NS ‘Arosa’ −0.25 NS −0.30 NS 0.27 NS −0.31 NS 0.22 NS 0.34 NS
‘Elsanta’ −0.53 * 0.62 * −0.62 * −0.50 NS 0.11 NS 0.49 NS ‘Marmolada’ −0.49 NS −0.46 NS −0.53 * −0.39 NS 0.58 * 0.88 **
‘Miss’ 0.02 NS 0.49 NS −0.08 NS 0.02 NS 0.10 NS 0.02 NS ‘Raurica’ 0.50 NS −0.88 ** 0.85 ** −0.04 NS −0.75 ** −0.86 **
Correlation coefficients between each chromaticity value and cyaniding 3-glucoside with statistically
significant; differences of the estimated correlations presented as * p < 0.05, ** p < 0.01, NS not significant.
Additionally, the correlation coefficient between chromaticity parameters and the second major
strawberry anthocyanin, pelargonidin 3-glucoside, was determined in both research years (Table 6).
In the first research year significant correlations were observed between pelargonidin 3-glucoside and
a (‘Marmolada’, 0.92 and ‘Miss’ −0.89); b (‘Marmolada’, 0.80; ‘Miss’, −0.89 and ‘Raurica’, −0.54);
a/b ratio (‘Marmolada’, 0.77); h° (‘Marmolada’, 0.86; ‘Miss’, −0.99 and ‘Elsanta’ 0.58) and L
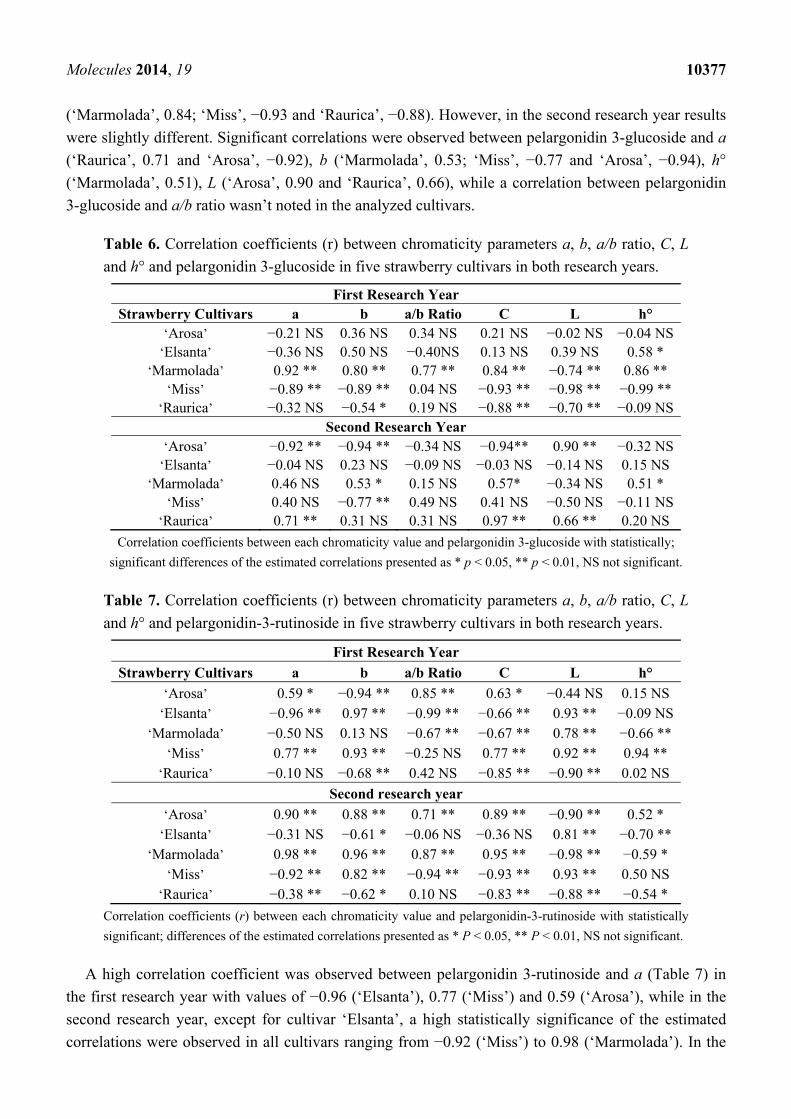
Molecules 2014, 19 10377
(‘Marmolada’, 0.84; ‘Miss’, −0.93 and ‘Raurica’, −0.88). However, in the second research year results
were slightly different. Significant correlations were observed between pelargonidin 3-glucoside and a
(‘Raurica’, 0.71 and ‘Arosa’, −0.92), b (‘Marmolada’, 0.53; ‘Miss’, −0.77 and ‘Arosa’, −0.94), h°
(‘Marmolada’, 0.51), L (‘Arosa’, 0.90 and ‘Raurica’, 0.66), while a correlation between pelargonidin
3-glucoside and a/b ratio wasn’t noted in the analyzed cultivars.
Table 6. Correlation coefficients (r) between chromaticity parameters a, b, a/b ratio, C, L
and h° and pelargonidin 3-glucoside in five strawberry cultivars in both research years.
First Research Year Strawberry Cultivars a b a/b Ratio C L h°
‘Arosa’ −0.21 NS 0.36 NS 0.34 NS 0.21 NS −0.02 NS −0.04 NS‘Elsanta’ −0.36 NS 0.50 NS −0.40NS 0.13 NS 0.39 NS 0.58 *
‘Marmolada’ 0.92 ** 0.80 ** 0.77 ** 0.84 ** −0.74 ** 0.86 ** ‘Miss’ −0.89 ** −0.89 ** 0.04 NS −0.93 ** −0.98 ** −0.99 **
‘Raurica’ −0.32 NS −0.54 * 0.19 NS −0.88 ** −0.70 ** −0.09 NSSecond Research Year
‘Arosa’ −0.92 ** −0.94 ** −0.34 NS −0.94** 0.90 ** −0.32 NS‘Elsanta’ −0.04 NS 0.23 NS −0.09 NS −0.03 NS −0.14 NS 0.15 NS
‘Marmolada’ 0.46 NS 0.53 * 0.15 NS 0.57* −0.34 NS 0.51 * ‘Miss’ 0.40 NS −0.77 ** 0.49 NS 0.41 NS −0.50 NS −0.11 NS
‘Raurica’ 0.71 ** 0.31 NS 0.31 NS 0.97 ** 0.66 ** 0.20 NS
Correlation coefficients between each chromaticity value and pelargonidin 3-glucoside with statistically;
significant differences of the estimated correlations presented as * p < 0.05, ** p < 0.01, NS not significant.
Table 7. Correlation coefficients (r) between chromaticity parameters a, b, a/b ratio, C, L
and h° and pelargonidin-3-rutinoside in five strawberry cultivars in both research years.
First Research Year
Strawberry Cultivars a b a/b Ratio C L h°
‘Arosa’ 0.59 * −0.94 ** 0.85 ** 0.63 * −0.44 NS 0.15 NS ‘Elsanta’ −0.96 ** 0.97 ** −0.99 ** −0.66 ** 0.93 ** −0.09 NS
‘Marmolada’ −0.50 NS 0.13 NS −0.67 ** −0.67 ** 0.78 ** −0.66 ** ‘Miss’ 0.77 ** 0.93 ** −0.25 NS 0.77 ** 0.92 ** 0.94 **
‘Raurica’ −0.10 NS −0.68 ** 0.42 NS −0.85 ** −0.90 ** 0.02 NS
Second research year
‘Arosa’ 0.90 ** 0.88 ** 0.71 ** 0.89 ** −0.90 ** 0.52 * ‘Elsanta’ −0.31 NS −0.61 * −0.06 NS −0.36 NS 0.81 ** −0.70 **
‘Marmolada’ 0.98 ** 0.96 ** 0.87 ** 0.95 ** −0.98 ** −0.59 * ‘Miss’ −0.92 ** 0.82 ** −0.94 ** −0.93 ** 0.93 ** 0.50 NS
‘Raurica’ −0.38 ** −0.62 * 0.10 NS −0.83 ** −0.88 ** −0.54 *
Correlation coefficients (r) between each chromaticity value and pelargonidin-3-rutinoside with statistically
significant; differences of the estimated correlations presented as * P < 0.05, ** P < 0.01, NS not significant.
A high correlation coefficient was observed between pelargonidin 3-rutinoside and a (Table 7) in
the first research year with values of −0.96 (‘Elsanta’), 0.77 (‘Miss’) and 0.59 (‘Arosa’), while in the
second research year, except for cultivar ‘Elsanta’, a high statistically significance of the estimated
correlations were observed in all cultivars ranging from −0.92 (‘Miss’) to 0.98 (‘Marmolada’). In the

Molecules 2014, 19 10378
first research year, significant correlations were observed between pelargonidin 3-rutinoside and b
(‘Arosa’, −0.94; ‘Raurica’, −0.68; ‘Miss’, −0.68 and ‘Elsanta’, 0.97), a/b ratio (‘Elsanta’, −0.99;
‘Marmolada’, −0.67 and ‘Arosa’, 0.85), chroma (‘Raurica’, −0.85; ‘Marmolada’, −0.67; ‘Elsanta’,
−0.66; ‘Miss’, 0.77 and ‘Arosa’, −0.63), h° (‘Raurica’, −0.90; ‘Marmolada’, 0.78; ‘Miss’, 0.92 and
‘Elsanta’, 0.93), and L (‘Marmolada’, −0.99; ‘Miss’, 0.94). In the second research year, significant
correlations were observed between pelargonidine 3-rutinoside and b (‘Miss’, 0.82; ‘Arosa’, 0.88;
‘Marmolada’, 0.96; ‘Raurica’, −0.62 and ‘Elsanta’, −0.61), a/b ratio (‘Miss’, −0.94; ‘Arosa’, 0.71 and
‘Marmolada’, 0.87), chroma (‘Miss’, −0.93 ‘Raurica’, −0.83; ‘Arosa’, 0.89 and ‘Marmolada’, 0.95), L
(ranged from 0.98 ‘Marmolada’ to 0.93 ‘Miss’), h° (‘Elsanta’, −0.51; ‘Marmolada’, −0.59; ‘Raurica’,
−0.54 and ‘Arosa’, 0.52).
3. Discussion
3.1. The Individual Anthocyanin Composition of Selected Strawberry Varieties
HPLC determination of individual anthocyanins in this research suggests the presence of three
major anthocyanins: Pg 3-gluc, Cy 3-gluc and Pg 3-rut (3.1.). Similar results by individual anthocyanin
content were reported by other authors [17,18]. According to the literature citations
Pg 3-malonylglucoside was the second most abundant anthocyanin in the strawberry samples, varying
from 0% to 33.5%. In general, the content of individual anthocyanins is influenced significantly by
strawberry cultivar, harvest period and climatic conditions, as also indicated in a number of literature
citations [3,6,19]. The proportions found among Pg 3-gluc, Cy 3-gluc and Pg 3-rut were consistent for
analyzed samples of the same variety, suggesting a characteristic anthocyanin distribution. A
significant difference in the individual anthocyanins content between the studied strawberry varieties
in different harvest stage in both research years is directly correlated to the edaphic and climatic
factors [20]. Comparisons of the anthocyanin composition of analyzed strawberry cultivars during both
research years can be used to determine the highly significant differences. The main reasons for the
large differences between the two years of research is because of climatic conditions, the values of
temperature and precipitation (Tables 8 and 9) were significantly different. Also, day-length must not
be neglected and together with temperature, both influenced by latitude, are the most important factors
influencing on basic nutritional composition of strawberry fruits [21].
3.2. Phenolic Compounds Determined in Selected Strawberry Varieties
Strawberry fruits are a rich source of many bioactive phytochemicals for human consumption.
Phenol compounds that are found in strawberries include anthocyanins, flavonols, catechins and
proanthocyanidins [18,22]. The determined phenolic acids (caffeic acid, chlorogenic acid and ellagic
acid) content in the strawberry varieties analyzed in this research are in agreement with the literature
data of other authors [18,22]. High contents of ellagic acid in the five analyzed strawberry cultivars are
a very important characteristic of strawberry fruit because ellagic acid is a natural antimutagenic and
anticancer compound [15,23]. Concentrations of analyzed phenol compounds (phenolic acids and
falvonoids) differed with strawberry cultivar, but the changes during ripening were ambiguous. Highly
significant statistical differences were determined for phenol composition in analyzed strawberry

Molecules 2014, 19 10379
cultivars (p < 0.01), respectively. Strawberry genotype strongly affects a wide range of phenol values
from total flavonoids to phenolic acids. Obtained results are in agreement with the literature data [18,24].
3.3. Color Variables in Different Cultivars of Strawberry Fruit
The pulp color was dependent on harvest period with high statistical differences. Fruit color is also
a cultivar characteristic, so the differences among them are to be expected. Effects of cultivar and
harvest period on strawberry pulp color parameters for the first year and second year of research shows
considerably significant differences (p < 0.001). The results show a positive association between
cultivar and harvest period on strawberry pulp color, with each of the color variables (a, b, a/b ratio, C,
L and h° values). The decrease in chroma means an increase in the tonality of the fruit color. The
decrease of chroma values could have been caused by an increase in total anthocyanin content and a
decrease in chlorophyll composition, and according to [3] and [19], by development of dark,
pigmented compounds, which tend to mask color. According to the harvest time and pulp color
variables, data presented above (Section 2.3) shows that the strawberry colors are satisfying even at
early stages of commercial harvest. Fruits from all analyzed cultivars show high values of color
variables at all three harvest periods. However, the changes in colorimetric parameters varied
depending on climate conditions and the anthocyanin composition in the different strawberry cultivars.
3.4. Correlation Between Cromacity Parameters and Individual Anthocyanins (Cy 3-gluc, Pg 3-gluc
and Pg 3-rut)
The high correlation coefficient between cyanidin 3-glucoside content and cromacity parameter a
determined for cultivars ‘Elsanta’ and ‘Miss’ suggesting that the analyzed strawberry fruits with high
determined content of Cy 3-gluc present a characteristic intensive red color which shows a strong
connection between anthocyanin content and the development of fruit color. Strawberry fruits of all
analyzed cultivars contained only small amounts of pelargonidine 3-rutinoside. Despite that fact, the
pelargonidine 3-rutinoside content in strawberry cultivars correlates with all analyzed color
measurements more than the other two anthocyanins and can be directly linked to the red color in most
of the studied cultivars. Obtained results of correlation coefficients between pelargonidine 3-rutinoside
and the parameter a suggest that Pg 3-rut is responsible for the expression of red color in the fruits of
all analyzed cultivars. The correlation coefficient between color variables (b, L, C, hue angle) and the
second major anthocyanin, pelargonidin 3-rutinoside, was calculated too but also could not be
generalized to all cultivars [25,26]. In all analyzed strawberry cultivars the correlation coefficients
between color variables and Pg 3-rut were high, which assumes a strong connection between the full
red characteristic strawberry color and satisfactory content of Pg 3-rut. Determination of color
variables and correlation between characteristic cultivar color and individual anthocyanin profile
of strawberry fruits has always been variable, primarily due to the effect of many other parameters
that are involved in color stability of fresh fruits, such as pH, temperature, light, oxygen,
enzymatic and non-enzymatic reactions and l-ascorbic acid (l-AA) [27]. Color stability is
influenced by process of anthocyanin condensation [28] and copigmentation (interaction of
anthocyanins with polyphenols) [29,30].

Molecules 2014, 19 10380
4. Experimental Section
4.1. Fruit Material
Cold stored (frigo) strawberry plants of cultivars ‘Arosa’, ‘Elsanta’, ‘Marmolada’, ‘Miss’ and
‘Raurica’ were planted in black plastic foil. Fertilizers and water were provided by fertirrigation. The
strawberries were planted at a planting density of 40.000 plants/ha in an open field on alluvium soil in
the Zagreb area. The above mentioned strawberry cultivars for the purpose of this research were
selected for the main reason of examining the possibilities for extending the consumption season of
strawberry fruits. Namely, earlier maturity strawberry varieties (‘Elsanta’, ‘Miss’) until later
strawberry varieties (‘Raurica’) were studied. The experiment was designed as a random block design
with three blocks. Fruits were harvested during the end of May and through June in two research years
(Table 8) with average of 29.9 mm precipitation in the first year and 85.8 mm precipitation in the
second research year (Table 9); mean air temperature of 19.9 °C in the irst and 20.5 °C in the second
research year (Table 10). Also strawberry fruits were harvested when the fruits were at full maturity which
is fundamentally determined by the appearance of their characteristic red coloration. Strawberry fruits were
stored at −20 °C until intended chemical analysis. The following quality parameters of harvested fruits
were determined: individual anthocyanins, fruit color variables and content of phenolic compounds.
Table 8. Harvest dates of strawberry cultivars in two years of research.
Cultivar
Year of Research
1st Year Harvest Date 2nd Year Harvest Date
1. 2. 3. 1. 2. 3.
‘Arosa’ 02 Junuary 10 Junuary 17 Junuary 29 May 06 Junuary 12 Junuary ‘Elsanta’ 02 Junuary 10 Junuary 17 Junuary 24 May 31 May 07 Junuary
‘Marmolada’ 02 Junuary 10 Junuary 17 Junuary 29 May 06 Junuary 12 Junuary ‘Miss’ 02 Junuary 10 Junuary 17 Junuary 24 May 31 May 07 Junuary
‘Raurica’ 02 Junuary 10 Junuary 17 Junuary 01 Junuary 07 Junuary 12 Junuary
Table 9. Rainfall (mm) during the two research years.
Year Decade January February March April May June
First
I 2.4 11.0 13.4 37.5 40.5 24.4
II 7.5 26.7 9.7 21.3 42.4 3.4
III 17.8 36.2 33.1 12.0 0.0 2.1
Amount 27.7 73.9 56.2 70.8 82.9 29.9
Second
I 53.1 0.6 27.6 52.5 23.5 54.5
II 0.6 7.2 24.9 37.4 2.6 17.1
III 0.1 33.4 19.6 40.6 68.4 14.2
Amount 53.8 41.2 72.1 130.5 94.5 85.8
Molecules 2014, 19 10381
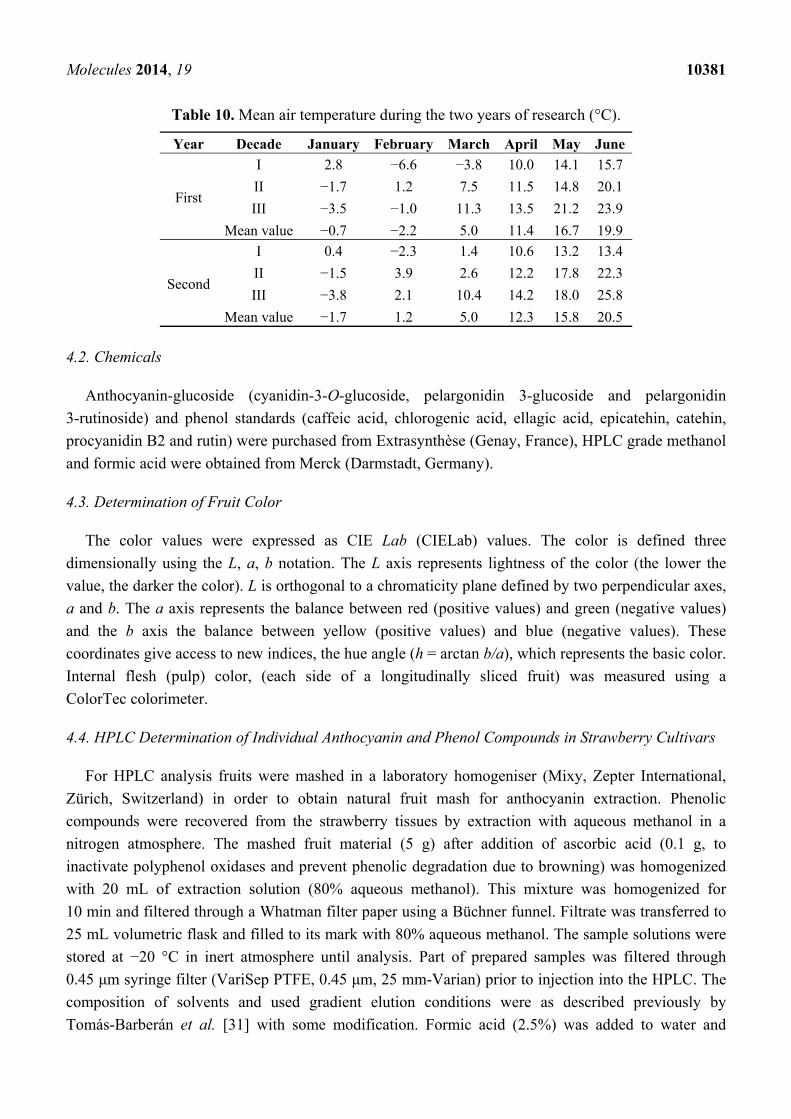
Table 10. Mean air temperature during the two years of research (°C).
Year Decade January February March April May June
First
I 2.8 −6.6 −3.8 10.0 14.1 15.7
II −1.7 1.2 7.5 11.5 14.8 20.1
III −3.5 −1.0 11.3 13.5 21.2 23.9
Mean value −0.7 −2.2 5.0 11.4 16.7 19.9
Second
I 0.4 −2.3 1.4 10.6 13.2 13.4
II −1.5 3.9 2.6 12.2 17.8 22.3
III −3.8 2.1 10.4 14.2 18.0 25.8
Mean value −1.7 1.2 5.0 12.3 15.8 20.5
4.2. Chemicals
Anthocyanin-glucoside (cyanidin-3-O-glucoside, pelargonidin 3-glucoside and pelargonidin
3-rutinoside) and phenol standards (caffeic acid, chlorogenic acid, ellagic acid, epicatehin, catehin,
procyanidin B2 and rutin) were purchased from Extrasynthèse (Genay, France), HPLC grade methanol
and formic acid were obtained from Merck (Darmstadt, Germany).
4.3. Determination of Fruit Color
The color values were expressed as CIE Lab (CIELab) values. The color is defined three
dimensionally using the L, a, b notation. The L axis represents lightness of the color (the lower the
value, the darker the color). L is orthogonal to a chromaticity plane defined by two perpendicular axes,
a and b. The a axis represents the balance between red (positive values) and green (negative values)
and the b axis the balance between yellow (positive values) and blue (negative values). These
coordinates give access to new indices, the hue angle (h = arctan b/a), which represents the basic color.
Internal flesh (pulp) color, (each side of a longitudinally sliced fruit) was measured using a
ColorTec colorimeter.
4.4. HPLC Determination of Individual Anthocyanin and Phenol Compounds in Strawberry Cultivars
For HPLC analysis fruits were mashed in a laboratory homogeniser (Mixy, Zepter International,
Zürich, Switzerland) in order to obtain natural fruit mash for anthocyanin extraction. Phenolic
compounds were recovered from the strawberry tissues by extraction with aqueous methanol in a
nitrogen atmosphere. The mashed fruit material (5 g) after addition of ascorbic acid (0.1 g, to
inactivate polyphenol oxidases and prevent phenolic degradation due to browning) was homogenized
with 20 mL of extraction solution (80% aqueous methanol). This mixture was homogenized for
10 min and filtered through a Whatman filter paper using a Büchner funnel. Filtrate was transferred to
25 mL volumetric flask and filled to its mark with 80% aqueous methanol. The sample solutions were
stored at −20 °C in inert atmosphere until analysis. Part of prepared samples was filtered through
0.45 μm syringe filter (VariSep PTFE, 0.45 μm, 25 mm-Varian) prior to injection into the HPLC. The
composition of solvents and used gradient elution conditions were as described previously by
Tomás-Barberán et al. [31] with some modification. Formic acid (2.5%) was added to water and

Molecules 2014, 19 10382
methanol and following mobile phases were set up: 95% water + 5% methanol (A); 88% water + 12%
MeOH (B) and 20% water + 80% MeOH (C). The following gradient elution was used for the
separation of individual anthocyanins and phenol compounds: 100% A was held isocratic until 5 min,
at 15 min gradient elution was reach to 100% B, held isocratic for 3 more minutes. From 18 to 35 min
a linear gradient was used to reach 75% B and 25% C, and then 50% B and 50% C at 50 min, and
100% C at 52 min, then maintained isocratic until 57 min. The column was then washed with 100% A
at 60 min. Operating conditions were as follows: flow rate 1.0 mL min−1, column temperature 20 °C,
injection volume 20 μL of the standards and sample extracts. The measurements were performed on a
UV/VIS-photodiode array detector with the highest detection sensitivity at 510 nm. The analytical
HPLC system employed consisted of a Varian LC system (Santa Clara, CA, USA) equipped with a
ProStar 230 solvent delivery module, ProStar 330 UV-Vis Detector, and ProStar 330 Photodiode
Array Detector (PDA) Detector. Anthocyanin separation was done in a Nucleosil C-18 5 µm
(250 × 4.6 mm I.D.) column equipped with a Nucleosil C-18 guard column, 5 µm (10 × 4.6 mm I.D.).
4.5. Statistical Analysis
According to a randomized block design of the field experiment (with three replicates), ANOVA
and Duncan’s multiple range tests were performed to determine the significance of differences within
the examined factors (harvest time and cultivar) and between the combination of factors (where
interaction was proven significant), using the commercial software 9.3 (SAS 2010) [32]. Values are
presented as the mean ± SD of three replications. p-values lower than 0.05, either from ANOVA or
Duncan’s multiple range test were considered statistically significant. Regression analysis was
calculated for cyanidin-3-glucoside, pelargonidine-3-glucoside, and pelargonidine-3-rutinoside and
each of the color variables estimated with a portable colorimeter.
5. Conclusions
Strawberry fruits are a good source of antioxidative compounds. The results of this study confirm
that climatic conditions during the ripening of fruits significantly affect the concentration of phenolic
compounds and individual anthocyanin content. Statistical analysis of differences between the
cultivars showed that cultivar has the main impact on the concentration of anthocyanin and the pulp
color. The results show a positive association between cultivar and harvest time on strawberry pulp
color, with each of the color parameters, a, b, a/b ratio, C, L and h° values. Color of strawberry fruits is
an important quality attribute. Measuring color parameters can be used to monitor pigment evolution
and anthocyanin content and can provide an objective judgment of food quality. Climatic conditions,
agricultural techniques and type of strawberry varieties greatly affect the presence of the individual
phenolic compound anthocyanins characteristic of strawberry fruit. Therefore, for strawberry fruits
intended for human consumption, it seems important to have a simple and non-destructive technique
for anthocyanin content determination, and in this way easily and quickly assess and monitor
strawberry fruit quality on a large number of cultivars.

Molecules 2014, 19 10383
Acknowledgements
This work was supported by Research Support 2 University of Zagreb 2.1.2.12.
Author Contributions
Sandra Voća carried out all the experiments. Nadica Dobričević and Stjepan Pliestić contributed to
the designing of the experiments. Sandra Voća, Jana Šic Žlabur and Ante Galić wrote the paper. Lidija
Jakobek and Marijan Šeruga helped in interpretation of data and discussion of results. All authors have
read and approved the final manuscript.
Conflicts of Interest
The authors declare no conflict of interest.
References
1. Dujmović Purgar, D.; Duralija, B.; Voća, S.; Vokurka, A.; Ercisli, S.A. Comparison of fruit
chemical characteristics of two wild grown Rubus species from different locations of Croatia.
Molecules 2012, 17, 10390–10398.
2. Terefe, N.S.; Yang, Y.H.; Knoerzer, K.; Buckow, R.; Versteeg, C. High pressure and thermal
inactivation kinetics of polyphenol oxidase and peroxidase in strawberry puree. Innov. Food Sci.
Emerg. Tech. 2010, 11, 52–60.
3. Crecente-Campo, J.; Nunes-Damaceno, M.; Romero-Rodríguez, M.A.; Vázquez-Odériz, M.L.
Color, anthocyanin pigment, ascorbic acid and total phenolic compound determination in organic
versus conventional strawberries (Fragaria x ananassa Duch., cv. Selva). J. Food Comp. Anal.
2012, 28, 23–30.
4. Voća, S.; Dobričević, N.; Družić, J.; Duralija, B.; Skendrović-Babojelić, M.; Dermišek, D.;
Čmelik, Z. The change of fruit quality parameters in day-neutral strawberries cv. Diamante grown
out of season. Int. J. Food Sci. Nutr. 2009, 60, 248–254.
5. Voća, S.; Dragović-Uzelac, V.; Družić, J.; Dobričević, N.; Šindrak, Z.; Duralija, B.; Pliestić, S.
Changes in antioxidative components in fruit of five strawberry cultivars during three harvest
times. Ital. J. Food Sci. 2010, 4, 408–415.
6. Stapleton, S.C.; Chandler, C.K; Legard, D.E.; Price J.F.; Sumler, J.C. Transplant Source Affects
Fruiting Performance and Pests of Sweet Charlie Strawberry in Florida. HortTechnology 2011,
11, 61-65.
7. Lopes da Silva, F.; de Pascual-Teresa, S.; Rivas-Gonzalo, J.; Santos-Buelga, C. Identification of
anthocyanin pigments in strawberry (cv. Camarosa) by LC using DAD and ESI-MS detection.
Eur. Food Res. Tech. 2002, 214, 248– 253.
8. Wang, H.; Nair, M.G.; Strasburg, G.M.; Chang, Y.C.; Booren, A.M.; Gray, J.I.; Dewitt, D.L.
Antioxidant and anti-inflammatory activities of anthocyanins and their aglycon, cyanidin, from
tart cherries. J. Nat. Prod. 1999, 62, 294–296.
9. Clifford, M.N. Anthocyanins—Nature, occurrence and dietary burden. J. Sci. Food Agric. 2000,
80, 1063–1072.

Molecules 2014, 19 10384
10. Matsumoto, H.; Nakamura, Y.; Hirayama, M.; Yoshiki, Y.; Okubo, K. Antioxidant activity of
black currant anthocyanin aglycons and their glycosides measured by chemiluminescence in a
neutral pH region and in human plasma. J. Agric. Food Chem. 2002, 50, 5034–5037.
11. Kong, J.; Chia, L.; Goh, N.; Chia, T.; Brouillard, R. Analysis and biological activities of
anthocyanins. Phytochemisty 2003, 64, 923–933.
12. Rossi, A.; Serraino, I.; Dugo, P.; di Paola, R.; Mondello, L.; Genovese, T.; Morabito, D.;
Dugo, G.; Sautebin, L.; Caputi, A.P.; et al. Protective effects of anthocyanins from blackberry in a
rat model of acute lung inflammation. Free Rad. Res. 2003, 37, 891–900.
13. Voća, S.; Dobričević, N.; Dragović-Uzelac, V.; Duralija, B.; Družić, J.; Čmelik, Z.;
Skendrović-Babojelić, M. Fruit quality of new early ripening strawberry cultivars in Croatia.
Food Tech. Biotech. 2008, 46, 292–298.
14. Sadilova, E.; Stintzing, F.C.; Kammerer, D.R.; Carle, R. Matrix dependent impact of sugar and
ascorbic acid addition on color and anthocyanin stability of black carrot, elderberry and
strawberry single strength and from concentrate juices upon thermal treatment. Food Res. Int.
2009, 42, 1023–1033.
15. Diamanti, J.; Capocasa, F.; Denoyes, B.; Petit, A.; Chartier, P.; Faedi, W.; Maltoni, M.L.;
Battino, M.; Mezzetti, B. Standardized method for evaluation of strawberry (Fragaria x ananassa
Duch.) germplasm collections as a genetic resource for fruit nutritional compounds. J. Food
Comp. Anal. 2012, 28, 170–178.
16. Olbricht, K.; Ulrich, D.; Weiss, K.; Grafe, C.; Variation in the amounts of selected volatiles in a
model population of Fragaria ananassa Duch. as influenced by harvest year. J. Agric. Food
Chem. 2011, 59, 944–952.
17. Määttää-Riihinen, K.R.; Kamal-Eldin, A.; Törrönen, A.R. Identification and quantification of
phenolic compounds in berries of Fragaria and Rubus species (Family Rosaceae). J. Agric. Food
Chem. 2004, 52, 6178–6187.
18. Buendia, B.; Gil, M.I.; Tudela, J.A.; Gady, A.L.; Medina, J.J.; Soria, C.; López, J.M.;
Tomás-Barberán, F.A. HPLC-MS analysis of proanthocyanidin oligomers and other phenolics in
15 strawberry cultivars. J. Agric. Food Chem. 2010, 58, 3916–3926.
19. Ornelas-Paz, J.J.; Yahia, E.M.; Ramírez-Bustamante, N.; David Pérez-Martínez, J.;
Del Pilar Escalante-Minakata, M.; Ibarra-Junquera, V.; Acosta-Muñiz, C.; Guerrero-Prieto, V.;
Ochoa-Reyes, E. Physical attributes and chemical composition of organic strawberry fruit
(Fragaria x ananassa Duch, Cv.Albion) at six stages of ripening. Food Chem. 2013, 138, 372–381.
20. Meyers, K.J.; Watkins, C.B.; Pritts, M.P.; Liu, R.H. Antioxidant and antiproliferative activities of
strawberries. J. Agric. Food Chem. 2003, 51, 6887–6892.
21. Kruger, E.; Josuttisa, M.; Nestby, R.; Toldam-Andersend, T.B.; Carlene, C.; Mezzetti, B.
Influence of growing conditions at different latitudes of Europe on strawberry growth performance,
yield and quality. J. Berry Res. 2012, 2, 143–157.
22. Aaby, K.; Wrolstad, R.E.; Ekeberg, D.; Skrede, G. Polyphenol composition and antioxidant
activity in strawberry purees; impact of achene level and storage. J. Agric. Food Chem. 2007, 55,
5156–5166.
23. Larrosa, M.; García-Conesa, M.T.; Espín, J.C.; Tomás-Barberán, F.A. Ellagitannins, ellagic acid
and vascular health. Mol. Aspects Med. 2010, 31, 513–539.

Molecules 2014, 19 10385
24. Aaby, K.; Mazur, S.; Nes, A.; Skrede, G. Phenolic compounds in strawberry (Fragaria x ananassa
Duch.) fruits: Composition in 27 cultivars and changes during ripening. Food Chem. 2012, 132,
86–97.
25. Ngo, T.; Wrolstad, R.E.; Zhao, Y. Color quality of Oregon strawberries—Impact of genotype,
composition, and processing. J. Food Sci. 2007, 72, C025–C032.
26. Bodelón, O.G.; Avizcuri, J.M.; Fernández-Zurbano, P.; Dizy, D. Pressurization and cold storage
of strawberry purée: Colour, anthocyanins, ascorbic acid and pectin methylesterase. LWT-Food
Sci. Technol. 2013, 52, 123–130.
27. Bakowska, A.; Kucharska, A.Z.; Oszmianski, J. The effects of heating, UV irradiation and storage
on stability of the anthocyanin-polyphenol copigment complex. Food Chem. 2003, 81, 349–355.
28. Brouillard, R.; Dangles, O. Anthocyanin molecular interactions: The first step in the formation of
new pigments during wine aging? Food Chem. 1994, 51, 365–371.
29. Bishop, P.D.; Nagel, C.W. Characterization of the condensation product of malvidin
3,5-diglucoside and catechin. J. Agric. Food Chem. 1984, 32, 1022–1026.
30. Lapidot, T.; Harel, S.; Akiri, B.; Granit, R.; Kanner, J. pH dependent forms of red wine
anthocyanins as antioxidants. J. Agric. Food Chem. 1999, 47, 67–70.
31. Tomás-Barberán, F.A.; Gil, M.I.; Cremin, P.; Waterhouse, A.L.; Hess-Pierce, B.; Kader, A.A.
HPLC-DAD-ESIMS Analysis of Phenolic Compounds in Nectarines, Peaches, and Plums.
J. Agric. Food Chem 2001, 49, 4748–4760.
32. SAS/STAT, version 9.3; SAS Institute: Cary, NC, USA, 2010.
Sample Availability: Samples are available from the authors.
© 2014 by the authors; licensee MDPI, Basel, Switzerland. This article is an open access article
distributed under the terms and conditions of the Creative Commons Attribution license
(http://creativecommons.org/licenses/by/3.0/).
Copyright © 2022 FDOKUMEN