The origin of conodonts and of vertebrate mineralized skeletons
Generationof composites forbone tissue-engineeringapplications consisting of gellan gum hydrogelsmineralized with calcium and magnesiumphosphate phases by enzymatic meansTimothy E. L. Douglas1*, Grzegorz Krawczyk2, Elzbieta Pamula2, Heidi A. Declercq3,David Schaubroeck4, Miroslaw M. Bucko2, Lieve Balcaen5, Pascal Van Der Voort6, Vitaliy Bliznuk7,Natasja M. F. van den Vreken8, Mamoni Dash1, Rainer Detsch9, Aldo R. Boccaccini9, Frank Vanhaecke5,Maria Cornelissen3 and Peter Dubruel11Polymer Chemistry and Biomaterials (PBM) Group, Department of Organic Chemistry, Ghent University, Belgium2Department of Biomaterials, Faculty of Materials Science and Ceramics, AGH University of Science and Technology, Krakow, Poland3Department of Basic Medical Science – Histology Group, Ghent University, Belgium4Centre for Microsystems Technology (CMST), ELIS, Imec, Ghent, Belgium5Department of Analytical Chemistry, Ghent University, Belgium6Department of Inorganic Chemistry, COMOC, Ghent University, Belgium7Department of Materials Science and Engineering, Zwijnaarde, Belgium8Department of Basic Medical Science – Biomaterials Group, Ghent University, Belgium9Department of Materials Science and Engineering, Institute of Biomaterials (WW7), University of Erlangen-Nuremberg, Erlangen, Germany
Abstract
Mineralization of hydrogels, desirable for bone regeneration applications, may be achieved enzymaticallyby incorporation of alkaline phosphatase (ALP). ALP-loaded gellan gum (GG) hydrogels weremineralizedby incubation in mineralization media containing calcium and/or magnesium glycerophosphate (CaGP,MgGP). Mineralization media with CaGP:MgGP concentrations 0.1:0, 0.075:0.025, 0.05:0.05,0.025:0.075 and 0:0.1 (all valuesmol/dm3, denotedA, B, C, D andE, respectively)were compared.Mineralformationwas confirmed by IR and Raman, SEM, ICP-OES, XRD, TEM, SAED, TGA and increases in the themass fraction of the hydrogel not consisting of water. Cawas incorporated intomineral to a greater extentthanMg in samplesmineralized inmediaA–D.Mg content and amorphicity ofmineral formed increased inthe order A<B<C<D. Mineral formed in media A and B was calcium-deficient hydroxyapatite (CDHA).Mineral formed in medium C was a combination of CDHA and an amorphous phase. Mineral formed inmedium D was an amorphous phase. Mineral formed in medium E was a combination of crystalline andamorphousMgP. Young’s moduli and storagemoduli decreased in dependence of mineralizationmediumin the order A>B>C>D, but were significantly higher for samples mineralized in medium E. Theattachment and vitality of osteoblastic MC3T3-E1 cells were higher on samples mineralized in mediaB–E (containing Mg) than in those mineralized in medium A (not containing Mg). All samples underwentdegradation and supported the adhesion of RAW264.7monocytic cells, and samplesmineralized inmediaA and B supported osteoclast-like cell formation. Copyright © 2014 John Wiley & Sons, Ltd.
Received 22 April 2013; Revised 6 November 2013; Accepted 7 January 2014
Keywords hydrogel; composite; calcium phosphate; magnesium phosphate; enzyme; gellan gum; osteo-blast; cytocompatibility
1. Introduction
Gellan gum (GG) is an anionic calcium-binding polysaccha-ride produced by bacteria (Fialho et al., 2008; Giavasis
*Correspondence to: Timothy E. L. Douglas, Polymer Chemistryand Biomaterials (PBM)Group, Department of Organic Chemistry,Ghent University, Krijgslaan 281S4, 9000 Ghent, Belgium.E-mail: [email protected]
Copyright © 2014 John Wiley & Sons, Ltd.
JOURNAL OF TISSUE ENGINEERING AND REGENERATIVE MEDICINE RESEARCH ARTICLEJ Tissue Eng Regen Med (2014)Published online in Wiley Online Library (wileyonlinelibrary.com) DOI: 10.1002/term.1875

et al., 2000; Okamoto and Kubota,1996), which has been ap-plied in hydrogel form as a tissue-engineering (TE) scaffold(Fan et al., 2010; Oliveira et al., 2010). Further advantagesof gellan gum are its low cost and the fact that it is not ani-mal-derived, avoiding regulatory concerns. Gelation is in-duced by cooling a GG–CaCl2 solution to body temperature,while cells and bioactive substances such as enzymes canbe incorporated before gelation at temperatures> 37 °C(Oliveira et al., 2010; Douglas et al., 2012a).
Mineralization of hydrogels is desirable for bone TEapplications in order to promote bioactivity, i.e. theformation of a chemical bond with surrounding bonetissue after implantation (LeGeros, 1991). Potentialfurther advantages of mineralization are the promotionof osteoblastic differentiation through increased stiffness(Engler et al., 2006; Rowlands et al., 2008; Evans et al.,2009) and enhanced binding of growth factors that stim-ulate bone healing (Ruhe et al., 2005). Furthermore, incontrast to traditional ceramics, hydrogels can serve asdelivery vehicles for bioactive substances such as growthfactors and enzymes. As mineralized hydrogels consistmainly of water and contain a polymer component, theyare expected to undergo more rapid degradation than’traditional’ calcium phosphates, such as β-tricalciumphosphate (β-TCP) and hydroxyapatite (HA), whoseresorption remains incomplete after several months oreven years (Draenert et al., 2013; Gunther et al., 1998;Hwang et al., 2012; Moore et al., 2001).
Hydrogel mineralization can be achieved by addition ofenzymes such as alkaline phosphatase (ALP) (Gkioniet al., 2010), which causes mineralization of bone by cleav-age of phosphate from organic phosphate, thereby increas-ing the local phosphate concentration and enablingprecipitation of insoluble phosphate salts. ALP has beenadded to hydrogel materials to induce their mineralizationwith calcium phosphate (CaP) during incubation in solu-tions containing calcium and glycerophosphate (GP), whichserves as a substrate for ALP (Beertsen and van den Bos,1992; Douglas et al., 2012a, 2012b, 2012c; Filmon et al.,2000; Spoerke et al., 2009; Yamauchi et al., 2004). ALPhas been implanted in vivo as a coating on titanium-basedimplants (Schouten et al., 2009) and as a component of col-lagen sheets (Beertsen and van den Bos, 1992; Doi et al.,1996) and synthetic oligo[poly(ethylene glycol)fumarate](OPF) hydrogels (Bongio et al., 2013). No severe inflamma-tory reactions were observed in any of these studies,suggesting low immunogenicity of ALP.
However, ALP-induced enzymatic mineralization withCaP enriched with Mg or magnesium phosphate (MgP) re-mains unexplored. MgP is gaining interest as an alternativeto CaP, due to its comparable cytocompatibility and abilityto support osteoblast adhesion and expression of osteoblas-tic markers at themRNA level (Tamimi et al., 2012). Thanksto the cytocompatibility of MgP, bone cements based onMgP have been developed as alternatives to CaP cements(Ewald et al., 2011; Klammert et al., 2010; Mestres andGinebra, 2011; Moseke et al., 2011; Tay et al., 2007). Anadditional justification for the use of magnesiumphosphate-based ceramics is their faster resorption in vivo
compared to calcium phosphate-based ceramics (Klammertet al., 2011). Mg-substituted hydroxyapatite coatings ontitanium implants have promoted proliferation anddifferentiation of osteoblast-like cells and improved earlyosseointegration in vivo (Zhao et al., 2013).
In a previous study, enzymatic mineralization of GGwithCaP by incubation in a mineralization solution containingcalcium glycerophosphate (CaGP), which served as asource of calcium and organic phosphate, led to enhancedmechanical properties and adhesion and proliferation ofosteoblastic cells (Douglas et al., 2012a). In this study, thisstrategy was extended to induce enzymatic mineralizationof GG with mineral consisting of CaP and MgP phases, byincubation in solutions of CaGP and magnesiumglycerophosphate (MgGP). The CaGP:MgGP concentrationratio in themineralizationwas varied in order to investigateits influence on the nature of mineral formed. Resultingmineralized hydrogels were characterized physicochemi-cally, using infrared (IR) and Raman spectroscopy, X-raydiffraction (XRD), selected area electron diffraction(SAED), transmission electronmicroscopy (TEM), scanningelectron microscopy (SEM), ion-coupled plasma opticalemission spectroscopy (ICP-OES), thermogravitationalanalysis (TGA) and increases in the dry mass percentage,i.e. the mass fraction of the hydrogel not consisting of wa-ter. Mechanical properties were evaluated by compressivetesting and rheometry. With a view to evaluating the suit-ability of mineralized hydrogels as scaffolds for applicationsin bone TE, their degradation, cytocompatibility and abilityto support adhesion and proliferation of osteoblasts andformation of osteoclast-like cells were also evaluated.
The present study aimed to fill the following gaps in thescientific literature: (a) the development of composites ofhydrogels and mineral containing Mg by enzymatic means;(b) the influence of mineralization medium, i.e. differentCaGP:MgGP concentration ratios, on the incorporation ofMg and Ca into mineral formed; and (c) the effect ofvarying Mg and Ca content on composite mechanicalproperties, osteoblast behaviour and osteoclast formation,which is the first step towards creeping resorption.
2. Materials and methods
2.1. Materials
Unless stated otherwise, all materials, including GG(Gelzan™ CM, G1910), ALP (P7640), CaGP (50043)and MgGP (17766) were obtained from Sigma-Aldrich.The GG preparation used was classified as ’low-acyl’ bythe manufacturer.
2.2. Production and characterization of GGhydrogels containing ALP
ALP was incorporated into GG hydrogels by a modifica-tion of the method of Oliveira et al. (2010). Briefly, an
T. E. L. Douglas et al.
Copyright © 2014 John Wiley & Sons, Ltd. J Tissue Eng Regen Med (2014)DOI: 10.1002/term
aqueous GG solution was heated to 90 °C and mixed withan aqueous CaCl2 solution to achieve final GG and CaCl2w/v concentrations of 0.7% and 0.03%, respectively.The resulting solution was mixed and allowed to cool to50 °C. At 50 °C, ALP solution was added to achieve a finalALP concentration of 2.5mg/ml. This temperature waschosen in order to avoid the excessive deactivation ofALP associated with higher temperatures, while permit-ting good mixing and preventing premature gelation dur-ing casting due to cooling. ALP in milk has been reportedto retain more than 80% of its activity after heating for10min at 50 °C (Fadilogwlu et al., 2004). In anotherstudy, ALP in milk showed no loss of activity after30min at 50 °C (Lombardi et al., 2000), while ALP in se-rum heated for 30min was not inactivated at all at 45 °Cand only by 28% at 50 °C (Neale et al., 1965). Hydrogelcylinders of volume 250μl, diameter 8mm and thickness5mm were prepared by casting 40ml GG–CaCl2 solutionat 50 °C in glass Petri dishes of diameter 10 cm at roomtemperature and cutting out cylinders with a hole punch.Casting took place immediately after ALP addition to min-imize ALP activity loss. Finally, the GG–CaCl2 solution wasallowed to cool at room temperature for 20min to gelify.
2.3. Mineralization of gels
Gel mineralization was induced at room temperature byincubation in mineralization medium containing differentconcentrations of CaGP and MgGP. Five different CaGP:MgGP concentration ratios were compared: 0.1:0,0.075:0.025, 0.05:0.05, 0.025:0.075 and 0:0.1 (all valuesmol/dm3). These mineralization media were denoted asA, B, C, D and E, respectively (see Table 1). The mineraliza-tion medium was changed every day. After conclusion ofmineralization after 7 days, the gels were rinsed three timesin Milli-Q water and subsequently incubated in Milli-Qwater for 1 day with the aim of removing residual CaGP.
2.4. Calculation of mass change due tomineralization by measurement of dry masspercentage
The dry mass percentage, i.e. the hydrogel weightpercentage not consisting of water, was calculated as:(weight after incubation and subsequent freeze-drying/weight after incubation but before freeze-drying)×100.This served as a measure of the extent of mineral
formation. Freeze-drying was performed for 24 h. Experi-ments were performed in triplicate.
2.5. Thermogravimetric analysis (TGA)
Thermogravimetric analysis (TGA) was performed usinga Hi-Res TGA 2950 Thermogravimetric Analyser (TA In-struments). Lyophilized samples (n= 3) were heatedfrom 30 ºC to 800 ºC in a helium atmosphere at a rateof 10 ºC/min under constant monitoring of remainingweight percentage, to determine the mass percentage oflyophilized samples attributable to mineral.
2.6. Physicochemical and morphologicalcharacterization
After mineralization experiments and subsequent lyophili-zation, the molecular structure of the hydrogels wasexamined using IR and Raman spectroscopy, XRD, TEM,SAED, EDS, ICP-OES and SEM. Samples were lyophilizedfor 48 h prior to analysis.
IR spectra of the powdered samples dispersed in KBrtablets were recorded using a Galaxy 6030 Fourier trans-form IR spectrophotometer (Mattson, Madison, WI, USA).
Raman spectra were recorded using a Kaiser OpticalSystems Rxn1-532 device equipped with a 532 nm(Nd:YAG) laser source. Spectra were recorded after 10accumulations of 5 s each.
X-ray diffraction (XRD) analysis was performed usingan X’Pert Pro diffractometer (Panalytical) with theX’Celerator strip detector, CuKα1 radiation (50 kV, 30mA)and the standard Bragg–Brentano geometry. The diffrac-tion patterns were collected in the 2 θ angle range of10–90º with formal step of 0.001º; the total time of eachmeasurement was 8 h. The diffractograms were analysedwith the help of ICDD cards 01-084-1147 and 01-089-6440 for bobierrite and hydroxyapatite, respectively.
Transmission electron microscopy (TEM) analysis wasperformed using a JEM-2200FS FEG (Jeol) instrumentoperated at 200 kV. Conventional TEM brightfield(TEM BF), selected area electron diffraction (SAED) andscanning transmission (STEM) modes were used in thiswork. An in-column omega filter was used to diminishchromatic aberration caused by inelastic scattering ofprimary electrons in thick areas of the sample. EDSspectrometry was used in combination with STEM modeto measure chemical compositions and produce elementalmappings of the material agglomerates. Lyophilizedhydrogel samples were prepared by chopping them upwith a razor blade to obtain powders. A lacey carbonsupport film on a Cu grid was then repeatedly dipped intothis powder.
SEM analysis was performed using a Jeol JSM-5600instrument. The instrument was used in the secondaryelectron mode (SEI). The SEM instrument was equippedwith an electron microprobe JED 2300. Prior to analysis,
Table 1. Mineralization medium concentrations used in study
Mineralizationmedium
Concentration
CaGP (mol/dm3) MgGP (mol/dm3)
A 0.1 0B 0.075 0.025C 0.05 0.05D 0.025 0.075E 0 0.1
Gellan gum and calcium and magnesium phosphate composites
Copyright © 2014 John Wiley & Sons, Ltd. J Tissue Eng Regen Med (2014)DOI: 10.1002/term

lyophilized samples were coated with a thin layer of gold(ca. 20 nm), using a plasma magnetron sputter coater.
The concentrations of Ca, Mg and P were determinedby inductively coupled plasma optical emission spectros-copy (ICP-OES), using a Spectro Arcos Optical EmissionSpectrometer (Spectro, Germany). Before analysis,lyophilized hydrogel samples were dissolved in 1ml14M HNO3 and further diluted (200×) with 0.3 M
HNO3 (HNO3 of analytical grade; ChemLab, Belgium).The instrument was calibrated by means of six standardsolutions, with Ca, Mg and P concentrations in the range0–15mg/l. Yttrium was added to all solutions as an inter-nal standard in order to correct for possible instrumentinstabilities and matrix effects. Measurements wereperformed in triplicate.
2.7. Mechanical testing
Hydrogel samples were subjected to compressive testingusing a Hounsfield Universal Testing Machine H10KM.Samples were placed between the piston heads at apredefined distance. Displacement was applied at a rateof 4mm/min until the samples were compressed to 50%of their original height, up to a maximum load of 80N.During displacement, force was recorded with a 100Nload cell every 0.5 s, using Qmat software. Compressivestress was calculated as the force recorded divided bythe cross-sectional area. Compressive strain was calcu-lated as the distance moved during compression dividedby the initial distance between piston heads. Finally,Young’s modulus was calculated as the gradient of thestress–strain curve.
In addition, the viscoelastic properties of all types ofgels were determined using a rheometer (Anton PaarPhysica, MCR 301) equipped with a PP25 rotating headof diameter 25mm. Storage modulus (G′) and lossmodulus (G′′) values were recorded at a strain of 0.01%and an angular frequency of 10 rad/s. For all hydrogelsevaluated, n= 5.
2.8. Degradation testing
Degradation of hydrogel samples was evaluated using anextreme solution test and a simulation solution test,according to ISO 10993-14 norm ’Identification and quan-tification of degradation products from ceramics’. Prior totesting, the hydrogel samples were sterilized by autoclav-ing for 20min in 50ml Milli-Q water at 115 ºC and 1.2 bar.
For the extreme solution test, a citric acid buffer solu-tion, pH3, at 37 ºC was prepared by dissolution of 21 gcitric acid monohydrate in 500ml Milli-Q water in a1000ml volumetric flask, addition of 200ml 1M NaOH so-lution and dilution to the mark with Milli-Q water;40.4ml of this solution was mixed with 59.6ml 0.1M
HCl to yield the desired buffered citric acid solution.Hydrogel samples were weighed, placed in glass vessels
and 2ml citric acid solution was added/0.1 g sample.
After 120 h incubation at 37 °C, the samples were re-moved from solution and reweighed. The experimentswere repeated five times/sample group. Samplescontaining 2.5mg ALP/ml hydrogel mineralized in mediaA–E were compared. Samples containing 0mg ALP/mlhydrogel mineralized in medium A served as controls.
For the simulation solution test, a Tris–HCl buffer, pH7.4,was prepared by dissolving 13.25g tris(hydroxymethyl)aminomethane in 500ml Milli-Q water and adjusting thepH with an appropriate amount of 1M HCl to pH7.4 at atemperature of 37 °C. Milli-Q water was added until a finalvolume of 1000ml was reached.
The hydrogel samples were weighed, placed incontainers and 15.6ml Tris–HCl buffer was added. After120 h of incubation at 37 °C, the samples were removedfrom the buffer and reweighed. The buffer was retainedand 1ml was mixed with 1ml 14M HNO3 for ICP-OESanalysis, as described in Section 2.6. The experimentswere repeated five times/sample group. Samplescontaining 2.5mg ALP/ml hydrogel mineralized in mediaA–E were compared.
2.9. Cell biological characterization
2.9.1. Sterilization
Prior to cell experiments, the samples were sterilized asdescribed in Section 2.8.
2.9.2. Cytocompatibility testing
Cytocompatibility was evaluated by determining the via-bility of human fibroblastic cells HFF-1 (human foreskinfibroblasts; ATCC) after culture in eluate from hydrogelsamples. HFF cells were cultured in Dulbecco’s modifiedEagle’s medium (DMEM; Glutamax™) supplemented with15% fetal bovine serum (FBS), 0.1% sodium pyruvate and0.1% penicillin/streptomycin (all Gibco, Invitrogen).
The colorimetric MTT assay, using a 3-(4, 5-dimethyldiazol-2-yl)-2, 5-diphenyltetrazolium bromide(MTT; Merck Promega) was performed to quantify cell via-bility. The tetrazolium component is reduced in living cellsby mitochondrial dehydrogenase enzymes to a water-insolu-ble purple formazan product, which can be solubilized by ad-dition of lysis buffer andmeasured using spectrophotometry.
Eluate was produced by incubating four hydrogelsamples in 2ml cell culture medium (corresponding to asurface:volume ratio of 5.52 cm2/ml) for 48 h. The eluatewas diluted by factors of 1 (undiluted), 2, 4, 6, 8, 16, 32and 64. HFF cells (10 000/well of a 96-well plate) weresubsequently incubated in eluate at the aforementioneddilutions for 72h. Afterwards, the eluate was replacedby 0.2ml (0.5mg/ml) MTT reagent and the cells wereincubated for 4 h at 37 °C. The MTT reagent was removedand replaced by 0.2ml lysis buffer (1% Triton X-100 inisopropanol/0.04 N HCl) for 30min. The dissolvedformazan solution was measured spectrophotometri-cally at 580 nm (Universal Microplate Reader EL 800,
T. E. L. Douglas et al.
Copyright © 2014 John Wiley & Sons, Ltd. J Tissue Eng Regen Med (2014)DOI: 10.1002/term

Biotek Instruments). Triplicate measurements wereperformed. The viability was calculated as a percentageof control cultures.
2.9.3. Osteoblast seeding on GG hydrogels
Cells of the osteoblastic cell line MC3T3-E1 (ATCC) wereseeded onto hydrogel samples. Each hydrogel sample wasplaced in a well of a 24-well plate and a suspension of100 000 cells in 1ml cell culture medium [α-minimalessential medium (α-MEM) supplemented with 10% FBSand 0.5% penicillin–streptomycin; all Gibco, Invitrogen]was added. After incubation for 4h to allow attachment,1ml supplementary cell culture medium was added.
2.9.4. Osteoblast adhesion
To visualize cell attachment and distribution on thehydrogels, the cell cultures were evaluated using fluores-cence microscopy, which was performed as follows. A live/dead staining (Calcein AM/propidium iodide) wasperformed to evaluate cell viability. The cells were rinsedand the supernatant was replaced by 1ml phosphate-buff-ered saline (PBS) solution supplemented with 2μl (1mg/ml) calcein AM (Anaspec, USA) and 2μl (1mg/ml)propidium iodide. The cultures were incubated for 10minat room temperature, washed twice with PBS solution andevaluated by fluorescence microscopy (Type U-RFL-T,Olympus, Aartselaar, Belgium). Evaluations were performed1 day and 6 days post-seeding.
2.9.5. Osteoblast proliferation
Cell vitality was investigated using an MTT assay; 2mlMTT reagent was added directly to the hydrogel samplesin 24-well plates and incubated for 4 h at 37 °C.Subsequently, the samples were transferred to 48-wellplates, 0.5ml lysis buffer was added and incubated for30min at 37 °C on a gyratory shaker (70 rpm); 0.2ml ofthe resulting solution was used for the spectrophotomet-ric measurement. Evaluations were performed 1 and 11days post-seeding. The viability was expressed as apercentage of control cultures after 11 days.
2.9.6. Culture of osteoclast precursor cells (RAW264.7 monocytic cells)
Monocytic cells from the RAW 264.7 cell line were cul-tured on samples as described previously (Detsch et al.,2010, 2011; Schaefer et al., 2011). Briefly, 600μl of asuspension of 100 000 cells/ml were incubated in RPMImedium on the samples for 14 days and stimulated withmacrophage colony-stimulating factor (M-CSF, 25 ng/ml) and receptor activator of NF-κB ligand (RANKL;40 ng/ml). These factors induce the differentiation ofthe monocytes into osteoclast-like cells (Wei et al., 2001;Jung et al., 2002). The formation of actin ring structuresand the multinuclearity of osteoclast-like cells wereverified by immunofluorescence microscopy (Axioplan 2
Imaging, Zeiss, Germany). The RAW 264.7 cells werefixed on the samples and stained with phalloidin and4′,6-diamidino-2-phenylindole (DAPI).
2.10. Statistical analysis
Statistical analysis was performed using SPSS statisticssoftware (IBM Corp., USA). The results of dry masspercentage, TGA, compressive testing and rheometricalmeasurements were analysed using a one-way analysisof variance (ANOVA) combined with Tukey’s post hoc test.p< 0.05 was considered significant.
3. Results
3.1. Physicochemical characterization ofmineralized hydrogels
Formation of mineral was investigated by IR and Ramanspectroscopy, XRD, SAED, TEM, EDS, ICP-OES and SEM.
The IR spectrum of GG without the presence of ALP andmineralized for 7 days in mineralization medium A wasrepresentative for the IR spectrum of GG without ALPand mineralized for 7 days in mineralization medium E(Figure 1). The absorption bands in these IR spectra werecomparable to the absorptions present in the IR spectrum
Figure 1. Infrared spectra of gellan gum (GG) hydrogels without(A, control) and with ALP after mineralization for 7 days in me-dia A–E. The spectra obtained after mineralization in media Aand B were indistinguishable; for comparison, the IR spectra ofpure GG and CDHA are shown. Dotted lines mark the OH– andHPO4
2– absorptions; transmittance is expressed in arbitrary units
Gellan gum and calcium and magnesium phosphate composites
Copyright © 2014 John Wiley & Sons, Ltd. J Tissue Eng Regen Med (2014)DOI: 10.1002/term

of pure GG. Typical absorption bands of CaP or MgP werenot found. The IR spectrum of GG with ALP and mineral-ized in medium A was representative for the IR spectrumof GG with ALP and mineralized in medium B. In these IRspectra, absorption bands typical for apatite could befound at 568 and 605 cm–1 due to the ν4 vibration compo-nents of PO4
3–. The peaks around 970, 1045 and 1100 cm–1
arose from the ν1 and ν3 stretching of PO43– groups. The
typical absorptions due to the vibration and stretching ofOH– groups in hydroxyapatite appeared as weak shoul-ders around 640 and 3570 cm–1. The small absorptionband at 870 cm–1 arose from the ν5 P–O(H) deformationof HPO4
2– groups. The absorbance at 1138 cm–1, arisingfrom the ν3 vibration component of HPO4
2– groups,confirmed the presence of HPO4
2– in the apatite lattice(Van Den Vreken et al., 2006). The precipitated mineralin these samples is not pure hydroxyapatite, but acalcium-deficient apatite (CDHA). In the IR spectra ofsamples mineralized in media C, D and E, the bandprofiles of the PO4
3– absorptions in the regions 530–640and 950–1120 cm–1 were clearly different, indicating thata mineral phase other than CDHA was precipitated in theGG. The absorption bands of the PO4
3– absorptions in theIR spectrum of sample D were not resolved, which istypical for the presence of an amorphous mineral phase.In the IR spectrum of the GG with ALP and mineralized inmedium E, only the absorption band in the region530–640 cm–1 was not resolved. This might indicate thatboth an amorphous and a crystalline magnesiumphosphate were present in this sample.
In Raman spectra (Figure 2) bands typical for PO43– and
HPO42– groups were detected in samples containing ALP,
while no bands were seen in the ALP-free control sample.In samples mineralized in media A–D, Raman bands char-acteristic for the ν1 stretching of PO4
3– groups weredetected at 960 cm–1 (Koutsopoulos, 2002; Ryu et al.,2010). Other bands observed at 1010 cm–1 may be charac-teristic for the ν1 stretching of HPO4
2– groups in CaP
phases containing HPO42–, such as CDHA (Koutsopoulos,
2002). The spectrum of the sample mineralized in me-dium E was markedly different from the others. A bandcorresponding to ν1 stretching of PO4
3– groups wasdetected at 960 cm–1, while the band at 1010 cm–1, corre-sponding to ν1 stretching of HPO4
2– groups, was much lessintense. Further bands were observed at 583 cm–1 (ν4bending of PO4
3– groups) and 281, 216 and 184 cm–1.The XRD patterns (Figure 3) of the samples mineral-
ized in media A and B show the presence of peaks at about26° and 32° (Koutsopoulos, 2002; Ryu et al., 2010),corresponding to the (002) and (211) planes of apatite,respectively. The low intensity and low resolution of thesepeaks implies that the crystalline phase is not highlycrystalline or present in high amounts. Peaks could notbe identified in the samples mineralized in media C andD, suggesting the presence of an amorphous mineralphase only. The X-ray diffraction pattern of the sampleincubated in medium E is markedly different, with peaksobserved at approximately 11° and 13°, which areconsistent with the presence of a hydrated magnesiumphosphate phase (bobierrite) (Brown et al., 1986).
TEM BF micrographs and corresponding SAED patterns,presented as negatives, are shown in Figure 4. The SAEDpatterns of samples mineralized in media A, B and C(Figure 4Aii, Bii, Cii) exhibit a ring electron diffractionpattern, typical for polycrystalline specimens with randomorientations of individual crystals, although there is also acontribution from the amorphous part of the samples.Samples A and B display diffraction rings correspondingto the (002) and (211) planes that are characteristic of acrystalline apatite phase (Mahamid et al., 2008; Ryu et al.,2010). These diffraction rings are less well-defined in thepattern of the samples mineralized in medium C,suggesting a higher degree of amorphicity. SAED patternsof samples mineralized in media D and E exhibit broad,blurred rings typical of an amorphous mineral phase(Figure 4 Dii, Eii). No diffraction spots from a crystallinestate were detected.
TEM images of samples A and B (Figure 4Ai, Bi) showneedle-like crystals of length approximately 50–100 nm,characteristic of CDHA (Juhasz et al., 2010), while
Figure 2. Raman spectra of GG gels containing 2.5mg/ml ALPmineralized for 7 days in media A–E. Control, GG containing0mg/ml ALP mineralized for 7 days in medium A
Figure 3. XRD analysis of GG gels containing 2.5mg/ml ALPmineralized for 7 days in media A–E
T. E. L. Douglas et al.
Copyright © 2014 John Wiley & Sons, Ltd. J Tissue Eng Regen Med (2014)DOI: 10.1002/term

deposits in sample C (Figure 4 Ci, Di) were more sphere-shaped, with an approximate diameter of 10 nm.Deposits in samples D and E were irregularly shaped(Figure 4Di, Ei).
TEM images and EDS spectrometry-based elementalmapping (Figure 5) demonstrate that the strength of thesignal for Ca relative to Mg was dependent on mineraliza-tion medium and decreased in the order A>B>C>D>
E. The Ca signal was stronger than the Mg signal in sam-ples A–D and weaker in sample E. No Mg signal was seenin sample A. Ca and Mg present were homogeneously dis-tributed on the surface of specimens.
Elemental composition of samples was determinedusing ICP-OES (Tables 2, 3). Mg was absent in samplesmineralized in medium A. A small amount of Ca wasdetected in samples mineralized in medium E, due tothe use of CaCl2 as a crosslinking agent during hydrogelformation. In ALP-free samples, Ca, Mg and P weredetected, presumably due to incomplete removal of CaGPand/or MgGP by washing, which in turn is probably dueto binding of these species to GG. In samples containingALP, Ca, Mg and P were detected in greater amounts thanin ALP-free samples, demonstrating the formation ofmineral. ICP-OES measurements also revealed that Cawas incorporated to a greater extent than Mg in mineralformed. For samples mineralized in media B, C and D,elemental mass percentages of Mg were inferior to thoseof Ca by factors of> 30, 9 and 2.5, respectively (Table 2),while elemental molar concentrations were inferior byfactors of> 20, 5 and 1.5, respectively (Table 3). Elemen-tal mass percentage (Table 2) and molar concentration(Table 3) were higher for Ca in samples mineralized inmedium A, which contains only CaGP, than for Mg in sam-ples mineralized in medium E, which contains only MgGP.
SEM showed the formation of mineral-like deposits inthe samples containing ALP mineralized in media A–E(Figure 6a–d, ei, eiii), while in the absence of ALP, nomineral deposits were observed (Figure 6 ac, ec). In allsamples containing ALP, the GG polymer network was vis-ible. In samples mineralized in media A and B (Figure 6a,b), roughly spherical deposits with an approximate diam-eter of 200 nmwere observed, as well as larger aggregatesof such deposits. In samples mineralized in media C and D(Figure 6c, d), deposits were of the same dimensions, butwith a more spherical morphology and smoother surface.Aggregates of such deposits were not seen. In samplesmineralized in medium E, irregularly shaped depositswere seen (Figure 6ei) but at certain points, plate-shapedcrystals were observed (Figure 6eii) (Tamimi et al., 2012).
3.2. Calculation of dry mass percentage and TGAanalysis
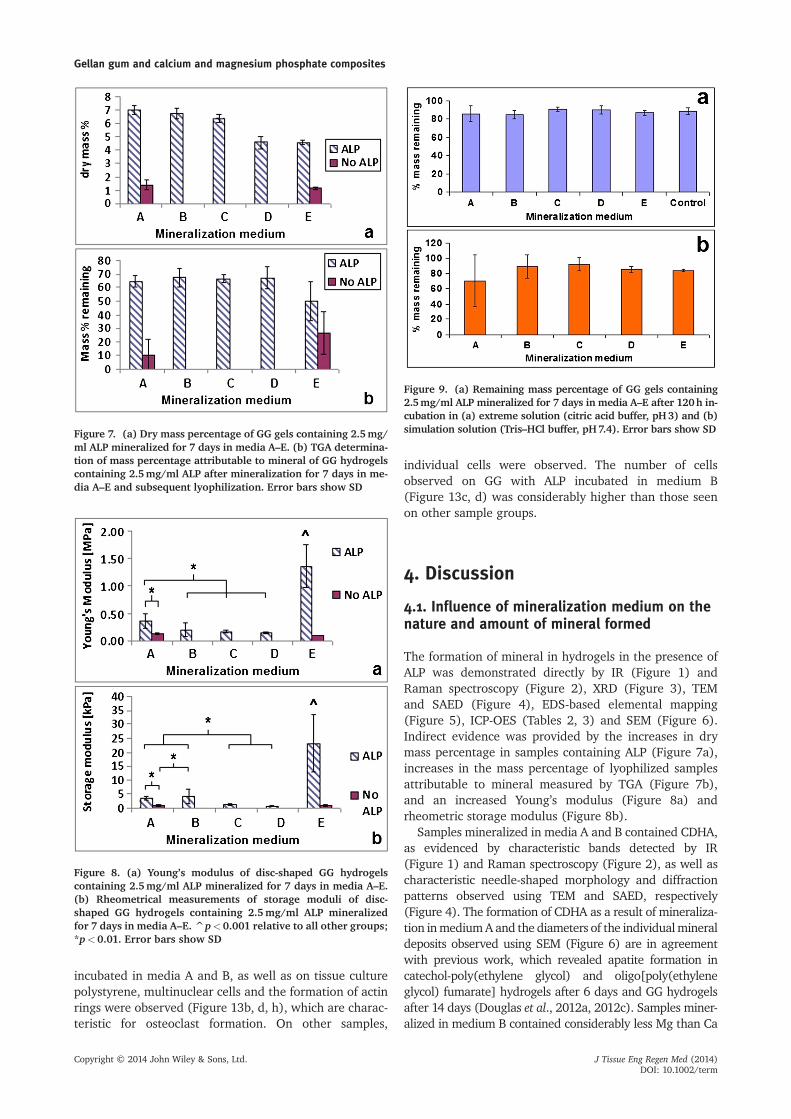
The dry mass percentages of GG samples mineralizedin different mineralization media are shown inFigure 7a. Dry mass percentages were significantlyhigher in samples containing ALP. Regarding theinfluence of mineralization medium, dry mass percent-age was similar for the samples mineralized in mediaA–C, in the approximate range 6–7%, with no signifi-cant differences. In contrast, dry mass percentages ofsamples mineralized in media D and E (4–5%) were
Figure 4. TEM images (i, left column) and SAED diffraction pat-terns (ii, right column) of GG hydrogels containing 2.5mg/mlALP mineralized for 7 days in mineralization media A–E
Gellan gum and calcium and magnesium phosphate composites
Copyright © 2014 John Wiley & Sons, Ltd. J Tissue Eng Regen Med (2014)DOI: 10.1002/term

similar to each other with no significant difference, butwere also significantly lower than values for samplesmineralized in media A–C.
TGA analysis of lyophilized hydrogels (Figure 7b) re-vealed that the mass percentage remaining at 800 ºC,which is attributable to mineral, was significantly higherfor samples containing ALP than for ALP-free controls.The mass percentage remaining at 800 ºC was similar forsamples mineralized in media A–D (approximately65%), and was lower in samples mineralized in mediumE (approximately 50%). However, no significant differ-ences were observed between samples containing ALPmineralized in media A–E, or between ALP-free samplesmineralized in media A or E.
3.3. Influence of mineralization on hydrogelmechanical properties
Compressive testing of hydrogels (Figure 8a) after 7 daysof incubation in mineralization solution revealed anincrease in Young’s modulus due to ALP incorporation.For samples containing ALP, Young’s modulus was depen-dent on the mineralization medium. Samples mineralizedin medium A were significantly stiffer than those mineral-ized in media B–D. The samples mineralized in medium Edisplayed a Young’s modulus which was at least threetimes higher than that of all other groups.
Rheometric testing results (Figure 8b) were consistentwith the results of compressive testing. The storage
Figure 5. TEM images (left column) and corresponding EDS elemental mapping images showing distribution of the elements Ca (sec-ond column from left), Mg (third column from left) and P (fourth column from left) in GG hydrogels containing 2.5mg/ml ALP min-eralized for 7 days in media A–E
T. E. L. Douglas et al.
Copyright © 2014 John Wiley & Sons, Ltd. J Tissue Eng Regen Med (2014)DOI: 10.1002/term

moduli of samples mineralized in media A and B weresignificantly higher than those of samples mineralized inmedia C and D. The storage modulus of samples mineral-ized in medium E was four or more times higher than thatof all other groups.
3.4. Degradation of mineralized hydrogels
Degradation tests in extreme solution (Figure 9a) re-vealed no apparent differences in percentage massremaining after incubation. Samples mineralized in mediaA–E lost opacity and became transparent, but maintainedtheir shape, suggesting that the ceramic phase waswashed out but that hydrogel integrity was maintained.
Degradation tests in extreme solution (Figure 9b) alsorevealed no apparent differences in percentage massremaining after incubation. Samples mineralized in me-dium E became less opaque without becoming fully trans-parent. ICP-OES of degradation products (Table 4)showed that Ca, P and Mg were released from all samples.Release of Mg and P increased in the order A<B<C<DE. Release of Ca and P was similar for groups A and B but
increased in the order A, B<C<D<E. In groups C andD, the amounts of Ca and Mg released were comparable.
3.5. Cell biological characterization
3.5.1. Cytocompatibility testing
Cytocompatibility testing revealed comparable cell viabilityfor all sample groups at all eluate dilutions (Figure 10). Themost pronounced differences were seen for cells cultured inundiluted eluate (1/1), where samples mineralized inmedium A displayed markedly inferior viability (ca. 40%)compared to all other groups (ca. 60%), except for samplesmineralized inmedium E (ca. 50%). This suggests that toxicsubstances are released by sample groups, and that thepresence of magnesium in samples reduces cytotoxicity.
3.5.2. Growth and adhesion of osteoblasts
Live/dead staining (Figure 11) of cells revealed that fewcells were observed on GG without ALP after 1 day(Figure 11m) and 6 days (Figure 11n), and that these cellshad a poorly-spread morphology, typical of non-attached
Table 2. ICP-OES determination of elemental Ca, P and Mg mass percentages in GG hydrogels containing 2.5 and 0mg/ml ALP af-ter mineralization for 7 days in media A–E and subsequent lyophilization
ALP concentration(mg/ml)
Mineralizationmedium
Mass of element in samples (%)
Ca P Mg
% SD % SD % SD
2.5 A 26.8 0.9 15.0 0.6 0.0 0.02.5 B 25.1 0.6 14.8 0.3 0.7 0.02.5 C 22.1 2.0 14.9 1.4 2.4 0.22.5 D 14.2 0.1 12.8 0.0 5.0 0.02.5 E 1.5 0.1 12.2 0.1 12.6 0.20 A 8.8 1.3 5.0 0.7 0.0 0.00 B 9.8 0.9 6.7 0.6 0.9 0.00 C 7.3 1.4 6.3 1.1 2.1 0.30 D 3.9 0.1 6.0 0.1 3.6 0.20 E 0.2 0.0 5.0 0.2 4.7 0.2
Values are presented as mean±SD (n=3).
Table 3. ICP-OES determination of elemental molar concentrations of Ca, P and Mg/unit mass sample (μmol/mg) in GG containing2.5 and 0mg/ml ALP after mineralization for 7 days in media A–E and subsequent lyophilization
ALPconcentration(mg/ml)
Mineralizationmedium
μmol element/mg sample
Ca P Mg
μmol/mg SD μmol/mg SD μmol/mg SD
2.5 A 6.7 0.2 4.8 0.2 0.0 0.02.5 B 6.3 0.1 4.8 0.1 0.3 0.02.5 C 5.5 0.5 4.8 0.4 1.0 0.12.5 D 3.5 0.0 4.1 0.0 2.1 0.02.5 E 0.4 0.0 3.9 0.0 5.2 0.10 A 2.2 0.3 1.6 0.2 0.0 0.00 B 2.5 0.2 2.1 0.2 0.4 0.00 C 1.8 0.3 2.0 0.3 0.9 0.10 D 1.0 0.0 1.9 0.0 1.5 0.10 E 0.0 0.0 1.6 0.1 2.0 0.1
Values are presented as mean±SD (n=3).
Gellan gum and calcium and magnesium phosphate composites
Copyright © 2014 John Wiley & Sons, Ltd. J Tissue Eng Regen Med (2014)DOI: 10.1002/term

cells. In contrast, larger numbers of cells adhered to GGcontaining ALP after 1 day, independently of the mineral-ization medium (Figure 11c, e, g, i, k). The cells had awell-spread morphology typical of attached cells andsimilar to that seen on the positive control, tissue culturepolystyrene (Figure 11a). After 6 days, layers of viablecells were observed in the positive control (Figure 11b)and samples mineralized in media C (Figure 11h), D(Figure 11j) and E (Figure 11l), with no dead cells. Onsamples mineralized in media A (Figure 11d) and B(Figure 11f), only isolated groups of cells were observed.On samples mineralized in medium A (Figure 11d), non-viable red cells were seen.
Cell viability assays (Figure 12) showed, as expected,that cell number after 11 days was higher than after 1
day. Cell viability on samples containing ALP was superiorto that on ALP-free controls, independently of the mineral-ization medium used. After 1 day, viability was highest onsamples mineralized inmedium E and lowest for those min-eralized in medium A. After 11 days, viability was similar inall samples, except for samples mineralized in medium A,which displayed markedly lower viability (approximately50–60% of that for other mineralized groups).
3.5.3. Adhesion and differentiation of osteoclastprecursor cells
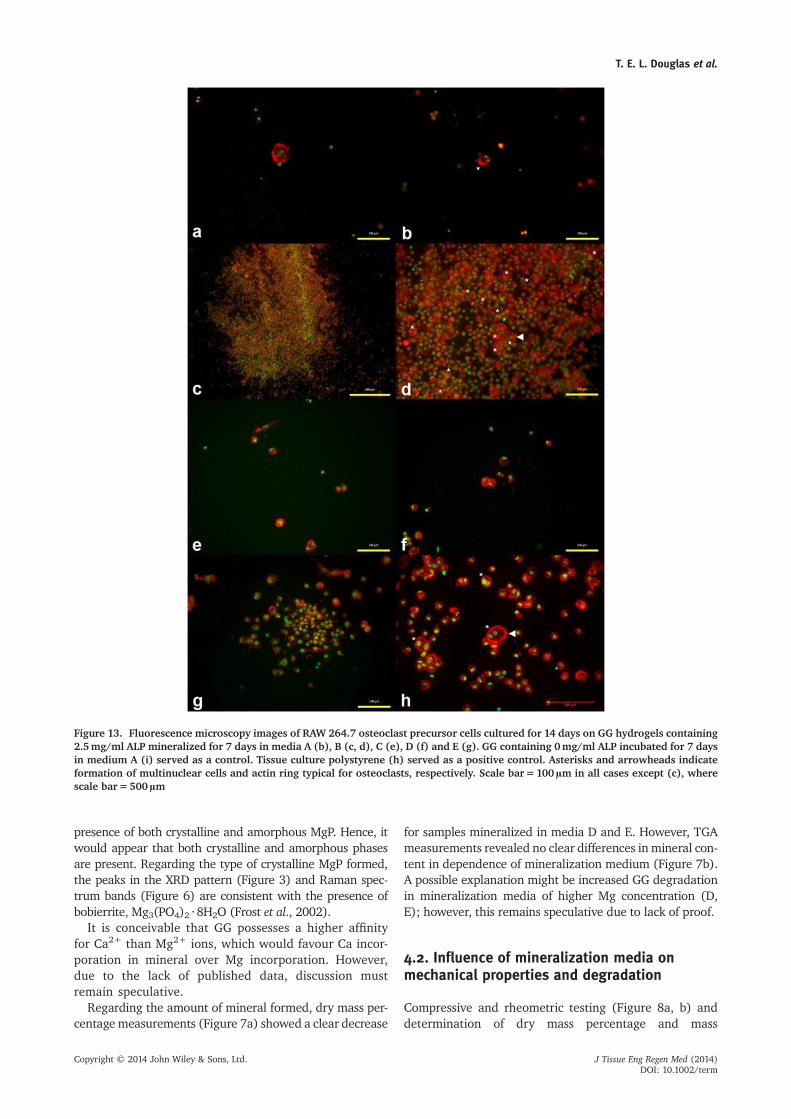
RAW 264.7 monocytic cells were observed on GG withoutALP and GG with ALP after 14 days, independently of themineralization medium (Figure 13a–g). On GG with ALP
Figure 6. SEM images of GG hydrogels containing 2.5mg/ml ALP mineralized for 7 days in media A (A), B (B), C (C), D (D) and E (Ei,Eii). Samples containing 0mg/ml ALP mineralized for 7 days in medium A (Ac) and medium E (Ec) served as controls. Scale bar=1μm in all cases except for (Eii), where scale bar=10μm
T. E. L. Douglas et al.
Copyright © 2014 John Wiley & Sons, Ltd. J Tissue Eng Regen Med (2014)DOI: 10.1002/term
incubated in media A and B, as well as on tissue culturepolystyrene, multinuclear cells and the formation of actinrings were observed (Figure 13b, d, h), which are charac-teristic for osteoclast formation. On other samples,
individual cells were observed. The number of cellsobserved on GG with ALP incubated in medium B(Figure 13c, d) was considerably higher than those seenon other sample groups.
4. Discussion
4.1. Influence of mineralization medium on thenature and amount of mineral formed
The formation of mineral in hydrogels in the presence ofALP was demonstrated directly by IR (Figure 1) andRaman spectroscopy (Figure 2), XRD (Figure 3), TEMand SAED (Figure 4), EDS-based elemental mapping(Figure 5), ICP-OES (Tables 2, 3) and SEM (Figure 6).Indirect evidence was provided by the increases in drymass percentage in samples containing ALP (Figure 7a),increases in the mass percentage of lyophilized samplesattributable to mineral measured by TGA (Figure 7b),and an increased Young’s modulus (Figure 8a) andrheometric storage modulus (Figure 8b).
Samples mineralized in media A and B contained CDHA,as evidenced by characteristic bands detected by IR(Figure 1) and Raman spectroscopy (Figure 2), as well ascharacteristic needle-shaped morphology and diffractionpatterns observed using TEM and SAED, respectively(Figure 4). The formation of CDHA as a result of mineraliza-tion inmediumA and the diameters of the individualmineraldeposits observed using SEM (Figure 6) are in agreementwith previous work, which revealed apatite formation incatechol-poly(ethylene glycol) and oligo[poly(ethyleneglycol) fumarate] hydrogels after 6 days and GG hydrogelsafter 14 days (Douglas et al., 2012a, 2012c). Samples miner-alized in medium B contained considerably less Mg than Ca
Figure 7. (a) Dry mass percentage of GG gels containing 2.5mg/ml ALP mineralized for 7 days in media A–E. (b) TGA determina-tion of mass percentage attributable to mineral of GG hydrogelscontaining 2.5mg/ml ALP after mineralization for 7 days in me-dia A–E and subsequent lyophilization. Error bars show SD
Figure 8. (a) Young’s modulus of disc-shaped GG hydrogelscontaining 2.5mg/ml ALP mineralized for 7 days in media A–E.(b) Rheometrical measurements of storage moduli of disc-shaped GG hydrogels containing 2.5mg/ml ALP mineralizedfor 7 days in media A–E. ^p<0.001 relative to all other groups;*p<0.01. Error bars show SD
Figure 9. (a) Remaining mass percentage of GG gels containing2.5mg/ml ALP mineralized for 7 days in media A–E after 120h in-cubation in (a) extreme solution (citric acid buffer, pH3) and (b)simulation solution (Tris–HCl buffer, pH7.4). Error bars show SD
Gellan gum and calcium and magnesium phosphate composites
Copyright © 2014 John Wiley & Sons, Ltd. J Tissue Eng Regen Med (2014)DOI: 10.1002/term

(Tables 2, 3). This may be due to hydroxyapatite’s higheraffinity for Ca2+ than Mg2+, which was reported by Aobaet al. (1992). Neumann and Mulryan (1971) showed thatmost Mg associated with hydroxyapatite is located at thesurface of crystals and thus is excluded from the crystal bulk.An explanation proposed byMartin and Brown (1997), whoinvestigated the effect of Mg2+ on hydroxyapatite forma-tion at 37 ºC, was based on the higher degree of hydrationof Mg2+ ions and the slower rate of dehydration comparedto Ca2+ ions. Mg2+ ions adsorb to CaP surfaces but do notdehydrate rapidly enough to become incorporated intoCaP crystal structures, and instead remain complexed in
aqueous species on the surfaces. As a result, the solutiondoes not reach the critical supersaturation required for theprecipitation of magnesium-containing solids, and there-fore Mg is incorporated to a much lesser extent than Ca.Hydroxyapatite is less soluble than MgP phases. For exam-ple, solubility products of 3.37×10–59 and 1×10–36 at25 °C have been reported for hydroxyapatite (McDowellet al., 1977) and the MgP phase bobierrite Mg3(PO4)2 · 8H2O (Taylor et al., 1963), respectively.
Samples mineralized in media C and D contained moreMg than those mineralized in media A and B (Tables 2, 3),They were also less crystalline, as shown by changes in the
Figure 10. Cytocompatibility testing of GG hydrogels containing 2.5mg/ml ALP mineralized for 7 days in media A–E. GG containing0mg/ml ALP incubated for 7 days in medium A served as a control
Table 4. ICP-OES determination of mass of elemental Ca, P and Mg released/mg sample after 120h incubation in Tris-HCl buffer atpH7.4. Prior to incubation in buffer, samples (GG hydrogels containing 2.5mg/ml ALP) were mineralized for 7 days in media A–E
ALPconcentration(mg/ml)
Mineralizationmedium
μg element released/mg sample
Ca P Mg
μg/mg SD μg/mg SD μg/mg SD
2.5 A 0.21 0.19 0.50 0.19 bdl bdl2.5 B 0.18 0.03 0.44 0.05 0.07 0.012.5 C 0.29 0.04 0.06 0.06 0.26 0.032.5 D 0.68 0.07 1.07 0.13 0.60 0.082.5 E bdl bdl 1.80 0.09 2.02 0.11
Values are presented as mean±SD (n=3).bdl, below detection limit of apparatus.
T. E. L. Douglas et al.
Copyright © 2014 John Wiley & Sons, Ltd. J Tissue Eng Regen Med (2014)DOI: 10.1002/term

bands detected by IR (Figure 1), as well as the disappear-ance of diffraction peaks characteristic for apatite, blurringof diffraction rings and changes in deposit morphology tomore rounded shapes on the nanometer and millimeterscale, as observed using XRD, SAED, TEM and SEM,respectively (Figures 3, 4, 6). Samples mineralized inmedium C appeared to contain a mixture of CDHA andan amorphous mineral phase, while those mineralized inmedium D contained an amorphous mineral phase. Sam-ples mineralized in medium D contained approximatelytwice as much Mg and two-thirds as much Ca comparedto samples mineralized in medium C (Tables 2, 3).
This increase in amorphicity with increasingMg is consis-tent with the findings of other authors. Bachra et al. (1965)found that increasing Mg concentrations in solutions ofCa2+ and PO4
3– led to a decrease in the crystallinity of theCaP phase formed, from apatite to amorphous calciumphosphate (ACP). This may be due to the stabilization ofACP by Mg2+, which decreases its solubility, leading to anincrease in the rate of ACP precipitation and a decrease intransformation of ACP to hydroxyapatite, as reported byBoskey and Posner (1974) and Blumenthal et al. (1977).
Abbona et al. (1986) caused precipitation of mineralphases by mixing solutions of phosphate ions with solutionscontaining an equal concentration of Ca and Mg ions, i.e.[Ca2+ +Mg2+]=[PO4
2–]) at Mg:(Ca+Mg) ratios between0 and 1. At all [Ca2++Mg2+] and [PO4
2–] concentrations inthe range 0.01–0.5M, predominantly amorphous calciumphosphate was formed initially at all Mg:(Ca+Mg) ratiosexcept 1, i.e. in the absence of Ca2+ ions. Hence, the differ-ences in mineral phases in dependence of mineralizationmedium can be explained as follows. In medium A, theACP formed initially transforms to CDHA over 7 days. Inmedium B, the concentration of Mg2+ is too low to inhibittransformation of ACP to CDHA. In media C and D, the con-centrations of Mg2+ are sufficiently high to partially andtotally inhibit transformation, respectively.
Pure MgP mineral phases were only detected in thecalcium-free mineralization medium E, which is inagreement with the results of Abbona et al. (1986).Regarding the nature of the MgP formed, SAED results (Fig-ure 4) suggest the presence of amorphous MgP, while XRDresults (Figure 3) suggest the presence of crystalline MgPand IR (Figure 1), and SEM (Figure 6) results suggest the
Figure 11. Live/dead staining of MC3T3-E1 cells cultured for 1 day(left column) and 6 days (right column) on GG hydrogels containing2.5mg/ml ALP mineralized for 7 days in media A (c, d), B (e, f), C (g,h),D (i, j) andE (k, l). GGcontaining0mg/mlALP incubated for 7daysin medium A served as a control (m, n). Tissue culture polystyreneserved as a positive control (a, b). Green, viable cells; red, dead cells
Figure 12. Viability of MC3T3-E1 cells cultured for 1 and 11 dayson GG hydrogels containing 2.5mg/ml ALP mineralized for 7days in media A–E. GG containing 0mg/ml ALP incubated for 7days in medium A served as a control. Tissue culture polystyreneserved as a positive control. Error bars show SD
Gellan gum and calcium and magnesium phosphate composites
Copyright © 2014 John Wiley & Sons, Ltd. J Tissue Eng Regen Med (2014)DOI: 10.1002/term
presence of both crystalline and amorphous MgP. Hence, itwould appear that both crystalline and amorphous phasesare present. Regarding the type of crystalline MgP formed,the peaks in the XRD pattern (Figure 3) and Raman spec-trum bands (Figure 6) are consistent with the presence ofbobierrite, Mg3(PO4)2 · 8H2O (Frost et al., 2002).
It is conceivable that GG possesses a higher affinityfor Ca2+ than Mg2+ ions, which would favour Ca incor-poration in mineral over Mg incorporation. However,due to the lack of published data, discussion mustremain speculative.
Regarding the amount of mineral formed, dry mass per-centage measurements (Figure 7a) showed a clear decrease
for samples mineralized in media D and E. However, TGAmeasurements revealed no clear differences in mineral con-tent in dependence of mineralization medium (Figure 7b).A possible explanation might be increased GG degradationin mineralization media of higher Mg concentration (D,E); however, this remains speculative due to lack of proof.
4.2. Influence of mineralization media onmechanical properties and degradation
Compressive and rheometric testing (Figure 8a, b) anddetermination of dry mass percentage and mass
Figure 13. Fluorescence microscopy images of RAW 264.7 osteoclast precursor cells cultured for 14 days on GG hydrogels containing2.5mg/ml ALP mineralized for 7 days in media A (b), B (c, d), C (e), D (f) and E (g). GG containing 0mg/ml ALP incubated for 7 daysin medium A (i) served as a control. Tissue culture polystyrene (h) served as a positive control. Asterisks and arrowheads indicateformation of multinuclear cells and actin ring typical for osteoclasts, respectively. Scale bar=100μm in all cases except (c), wherescale bar=500μm
T. E. L. Douglas et al.
Copyright © 2014 John Wiley & Sons, Ltd. J Tissue Eng Regen Med (2014)DOI: 10.1002/term

percentage of lyophilized samples attributable to mineral(Figure 7a, b) showed that the amount of mineralformed does not correlate with mechanical properties.Samples mineralized in medium E were markedly stiffer.Samples mineralized in media A and B were stiffer thanthose mineralized in media C and D. On the basis ofthe results presented in this paper, it is not possible todetermine the underlying reasons for these differences.Assuming that stiffness increases with increasing contactbetween mineral deposits, it can be speculated that thedeposits in samples of higher stiffness are more tightlypacked, leading to increased contact area with sur-rounding deposits. For example, the deposits in samplesmineralized in media C and D were in the form ofindividual spheres, while the deposits in samples miner-alized in media A and B were more irregularly shapedand formed larger aggregates, suggesting superior pack-ing (Figure 6). Further research is needed to determinethe influence of mineral deposit morphology on com-pressive modulus.
As regards degradation testing, no differences inmass percentage remaining were observed betweensample groups, neither in extreme nor in simulationsolution (Figure 8). Furthermore, values appeared tobe similar after incubation in both solutions. Takinginto account the fact that mineral was washed out ofthe samples in extreme solution, and that the hydrogelcomponent appeared impervious to both extreme andsimulation solutions, one possible explanation is thatthe loss of mass due to dissolution of mineral may becompensated by entry of solution into the hydrogelcomponent. Another reason for the lack of differencesobserved may be the low mass percentage attribut-able to mineral in hydrated mineralized samples(Figure 7a).
Samples were sterilized by autoclaving in Milli-Q waterprior to degradation testing in citric acid or Tris–HClbuffer. As the hydrogel component appeared to withstanddegradation, the decrease in percentage mass remainingfrom 100% to average values in the range 70–90%(Figure 8) may possibly be due to osmosis of water outof the samples into the buffer.
Increased release of Ca, P in the order A, B<C<D (Ta-ble 4) is consistent with the decrease in crystallinity (Fig-ures 1–4). Considering the ratios of the amounts of Caand Mg present in sample groups B, C and D (Tables 2,3), the amounts of Mg released were disproportionallyhigh. This suggests that Mg was present predominantlyon the surface of CaP deposits and/or that any Mg-containing mineral phase present was more soluble thanthe CaP phases present, as discussed in Section 4.1 above.Elemental release was highest from sample group E,suggesting higher solubility of the amorphous and/orcrystalline MgP phases compared to the amorphousand/or crystalline CaP phases present in sample groupsA–D.
On the basis of these results, it can be concluded thatall sample groups underwent degradation.
4.3. Influence of mineralization media oncytocompatibility, osteoblast proliferation andosteoclast-like cell formation
Enzymatically mineralized samples with different Ca andMg contents showed similar cytocompatibilities (Figure 9).Hence, changes in Ca and/or Mg content do not have amarked influence.
Enzymatic mineralization of GG led to far superior adhe-sion of viable cells, as demonstrated by live/dead staining(Figure 10) and cell vitality testing (Figure 11). The poorcell adhesion on GG without ALP is consistent with theresults of a previous study (Douglas et al., 2012a) andmay be due to poor adsorption of adhesive proteins fromserum, and hence cell adhesion. The presence of mineralon the surface of mineralized GG may enable adsorptionof adhesive serum proteins and thus aid adhesion.
A possible reason for higher proliferation on samplescontaining Mg might be a stimulatory effect of Mg on pro-liferation, which has been reported for Mg-dopedtricalcium phosphate (TCP) (Sader et al., 2009;Xue et al., 2008) octocalcium phosphate (OCP) (Boaniniet al., 2012) and hydroxyapatite (Cai et al., 2010; Bracciet al., 2009; Landi et al., 2006). Pure MgP in the form ofnewberyite (MgHPO4 3H2O) showed good cytocom-patibility and supported colonization by osteoblastic cells(Tamimi et al., 2012). Magnesium phosphate cementsbased on struvite (MgNH4PO4 8H2O) have shown supe-rior cytocompatibility to brushite (CaHPO4 2H2O) andCDHA cements (Ewald et al., 2011). In this study, thestimulatory effect was comparable for samples mineral-ized in media B–E, despite differences in Mg content(Tables 2, 3). In addition, the Mg-containing mineralphase present (B, CDHA; C, CDHA and amorphous min-eral phase; D, amorphous mineral phase; E, crystallineand amorphous MgP) and the increase of Mg release inthe order B>C>D>E did not influence proliferation.Therefore, the influence of Mg is independent of mineralphase and extent of Mg release and manifests itself at alow Mg content, equal to or less than the Mg content insamples mineralized in medium B (Tables 2, 3), but doesnot increase further with increasing Mg content.
Despite the lower amount of mineral formed in samplesonly containing MgP, vitality was superior after 1 day,suggesting superior adhesion. Cell adhesion has beenimproved by addition of Mg to hydroxyapatite (Websteret al., 2002) and carbonated apatite (Yamasaki et al., 2002,2003), andMg2+ has been reported to promote cell adhesionand migration better than Ca2+ (Lange et al., 1994, 1995).One possible explanation might be enhanced integrinreceptor expression due to Mg, which has been describedpreviously for Mg-doped Al2O3 (Zreiqat et al., 2002).
With regard to osteoclast-like cell formation from RAW264.7 precursors, the superior formation observed onsamples incubated in media A and B (Figure 13b–d) maybe due to preferential osteoclastic differentiation on apa-tite in comparison to amorphous CaP and combinationsapatite and other CaP phases, such as TCP, as reported
Gellan gum and calcium and magnesium phosphate composites
Copyright © 2014 John Wiley & Sons, Ltd. J Tissue Eng Regen Med (2014)DOI: 10.1002/term

previously (Detsch et al., 2010, 2011). It is also conceivablethe higher amounts of Mg present in and/or released fromsamples incubated in media C–E may inhibit osteoclast for-mation, as reported for Mg-doped TCP (Roy and Bose,2012) and magnesium hydroxide implants (Janning et al.,2010). The formation of osteoclasts is the first step towardscreeping resorption of the materials. The reason for thehigher cell number on samples incubated in medium Bcompared to A could conceivably be a stimulatory effectof Mg on RAW 264.7 number on cell adhesion and prolifer-ation, as discussed above.
In summary, the results of physicochemical and cellbiological characterization suggest that enzymatic miner-alization GG with MgP, ACP containing Mg or CDHAcontaining Mg may be preferable to mineralization withCDHA for bone TE applications.
5. Conclusions
This study showed the feasibility of creating mineralizedGG hydrogels, tailoring the Ca and Mg contents by incor-poration of ALP during hydrogel formation and varyingthe concentrations of CaGP and MgGP in mineralizationmedia. Mineral formed in mineralization media A, B, C,D and E appeared to be CDHA, CDHA, CDHA and an
amorphous mineral phase, an amorphous mineral phaseand a mixture of crystalline and amorphous MgP, respec-tively. Ca was incorporated into mineral to a greaterextent than Mg. Mineralization led to an increase in stiff-ness, which was not proportional to the amount of min-eral formed and was dependent on mineralizationmedium, decreasing in the order E>A, B>C, D.Samples with Mg incorporated into mineral, i.e. thosemineralized in media B–E, enhanced osteoblast attach-ment and proliferation.
Conflict of Interest
The authors have declared that there is no conflict ofinterest.
Acknowledgements
T.E.L.D. and L.B. acknowledge the Research Foundation Flanders(FWO) for support in the framework of postdoctoral fellowships.H.A.D. thanks Ghent University for financial support through aBOF Postdoctoral Grant. P.V.D.V. acknowledges Ghent University(GOA Grant No. 01G00710). Tom Planckaert, Danny Vandeputand Alina Grünewald are thanked for technical assistance.Professor Ronald M. Verbeeck is thanked for helpful discussions.
References
Abbona F, Lundager Masen HE, Boistelle R.1986; The intital phases of calcium andmagnesium phosphates precipitated fromsolutions of high to medium concentra-tions. J Cryst Growth 74: 581–590.
Aoba T, Moreno EC, Shimoda S. 1992;Competitive adsorption of magnesium andcalcium ions onto synthetic and biologicalapatites. Calcif Tissue Int 51: 143–150.
Bachra BN, Trautz OR, Simon SL. 1965;Precipitation of calcium carbonates andphosphates. 3. The effect of magnesiumand fluoride ions on the spontaneousprecipitation of calcium carbonates andphosphates. Arch Oral Biol 10: 731–738.
Beertsen W, Van Den Bos T. 1992; Alkalinephosphatase induces the mineralization ofsheets of collagen implanted subcutane-ously in the rat. J Clin Invest 89: 1974–1980.
Blumenthal NC, Betts F, Posner AS. 1977;Stabilization of amorphous calciumphosphate by Mg and ATP. Calcif TissueRes 23: 245–250.
Boanini E, Torricelli P, Fini M, et al. 2012;Magnesium and strontium dopedoctacalcium phosphate thin films by ma-trix assisted pulsed laser evaporation. JInorg Biochem 107: 65–72.
Bongio M, Nejadnik MR, Birgani ZT, et al.2013; In vitro and in vivo enzyme-mediated biomineralization of oligo[poly(ethylene glycol)] fumarate hydrogels.Macromol Biosci 13: 777–788.
Boskey AL, Posner AS. 1974; Magnesium sta-bilization of amorphous calcium phos-phate: a kinetic study. Mater Res Bull 9:907–916.
Bracci B, Torricelli P, Panzavolta S, et al.2009; Effect of Mg2+, Sr2+, and Mn2+ onthe chemicophysical and in vitro biologicalproperties of calcium phosphate biomi-metic coatings. J Inorg Biochem 103:1666–1674.
Brown WE, Mathew M, Takagi S. 1986; Crys-tal structures of bobierrite and syntheticMg3(PO4)2•8H2O. Am Mineralog 71:1229–1233.
Cai YL, Zhang JJ, Zhang S, et al. 2010; Oste-oblastic cell response on fluoridated hy-droxyapatite coatings: the effect ofmagnesium incorporation. Biomed Mater5: 054114.
Detsch R, Hagmeyer D, Neymann M, et al.2010; The resorption of nanocrystallinecalcium phosphates by osteoclast-like cells.Acta Biomater 6: 3223–3233.
Detsch R, Schaefer S, Deisinger U, et al.2011; In vitro osteoclastic activity studieson surfaces of 3D printed calcium phos-phate scaffolds. J Biomater Applic 26:359–380.
Doi Y, Horiguchi T, Moriwaki Y, et al. 1996;Formation of apatite–collagen complexes.J Biomed Mater Res 31: 43–49.
Douglas T, Wlodarczyk M, Pamula E, et al.2012a; Enzymatic mineralization of gellangum hydrogel for bone tissue-engineeringapplications and its enhancement bypolydopamine. J Tissue Eng Regen MedDOI: 10.1002/term.1616
Douglas TE, Gassling V, Declercq HA, et al.2012b; Enzymatically induced mineraliza-tion of platelet-rich fibrin. J Biomed MaterRes A 100: 1335–1346.
Douglas TE, Messersmith PB, Chasan S, et al.2012c; Enzymatic mineralization ofhydrogels for bone tissue engineering byincorporation of alkaline phosphatase.Macromol Biosci 12: 1077–1089.
Draenert M, Draenert A, Draenert K. 2013;Osseointegration of hydroxyapatite and re-modeling–resorption oftricalciumphosphate ceramics. Microsc ResTech 76: 370–380.
Engler AJ, Sen S, Sweeney HL, et al. 2006;Matrix elasticity directs stem cell lineagespecification. Cell 126: 677–689.
Evans ND, Minelli C, Gentleman E, et al. 2009;Substrate stiffness affects early differentia-tion events in embryonic stem cells. Eur CellMater 18: 1–13; discussion, 13–14.
Ewald A, Helmschrott K, Knebl G, et al. 2011;Effect of cold-setting calcium and magne-sium phosphate matrices on protein ex-pression in osteoblastic cells. J BiomedMater Res B Appl Biomater 96: 326–332.
Fadilogwlu S, Erkmen O, Sekerogwlu G.2004; Inactivation of alkaline phosphatasein milk. Food Technol Biotechnol 42: 27–32.
Fan J, Gong Y, Ren L, et al. 2010; In vitroengineered cartilage using synovium-derived mesenchymal stem cells with in-jectable gellan hydrogels. Acta Biomater6: 1178–1185.
Fialho AM, Moreira LM, Granja AT, et al.2008; Occurrence, production, and appli-cations of gellan: current state and per-spectives. Appl Microbiol Biotechnol 79:889–900.
FilmonR, BasleMF, Barbier A, et al. 2000; Poly(2-hydroxy ethyl methacrylate)-alkaline
T. E. L. Douglas et al.
Copyright © 2014 John Wiley & Sons, Ltd. J Tissue Eng Regen Med (2014)DOI: 10.1002/term

phosphatase: a composite biomaterialallowing in vitro studies of bisphosphonateson the mineralization process. J BiomaterSci Polym Ed 11: 849–868.
Frost RL, Martens W, Williams PA, et al.2002; Raman and infrared spectroscopicstudy of the vivianite-group phosphatesvivianite, baricite, and bobierrite.Mineralog Mag 66: 1063–1073.
Giavasis I, Harvey LM, McNeil B. 2000; Gellangum. Crit Rev Biotechnol 20: 177–211.
Gkioni K, Leeuwenburgh SC, Douglas TE,et al. 2010; Mineralization of hydrogelsfor bone regeneration. Tissue Eng B Rev16: 577–585.
Gunther KP, Scharf HP, Pesch HJ, et al. 1998;[Integration properties of bone substitutematerials. Experimental studies on ani-mals]. Orthopade 27: 105–117.
Hwang JW, Park JS, Lee JS, et al. 2012; Com-parative evaluation of three calcium phos-phate synthetic block bone graft materialsfor bone regeneration in rabbit calvaria.J Biomed Mater Res B Appl Biomater100: 2044–2052.
Janning C, Willbold E, Vogt C, et al. 2010;Magnesium hydroxide temporarily enhanc-ing osteoblast activity and decreasing theosteoclast number in peri-implant boneremodelling. Acta Biomater 6: 1861–1868.
Juhasz JA, Best SM, Bonfield W. 2010; Prep-aration of novel bioactive nano-calciumphosphate–hydrogel composites. SciTechnol Adv Mater 11: 1–7.
Jung CR, Schepetkin IA, Woo SB, et al. 2002;Osteoblastic differentiation of mesenchy-mal stem cells by mumie extract. DrugDev Res 57: 122–133.
Klammert U, Ignatius A, Wolfram U, et al.2011; In vivo degradation of low tempera-ture calcium and magnesium phosphateceramics in a heterotopic model. ActaBiomater 7, 3469–3475.
Klammert U, Reuther T, Blank M, et al. 2010;Phase composition, mechanical perfor-mance and in vitro biocompatibility ofhydraulic setting calcium magnesiumphosphate cement. Acta Biomater6: 1529–1535.
Koutsopoulos S. 2002; Synthesis and charac-terization of hydroxyapatite crystals: areview study on the analytical methods. JBiomed Mater Res 62: 600–612.
Landi E, Tampieri A, Mattioli-Belmonte M,et al. 2006; Biomimetic Mg- and MgCO3-substituted hydroxyapatites: synthesis,characterization and in vitro behaviour. JEur Ceram Soc 26: 2593–2601.
Lange TS, Bielinski AK, Kirchberg K, et al.1994; Mg2+ and Ca2+ differentially regu-late β1-integrin-mediated adhesion of der-mal fibroblasts and keratinocytes tovarious extracellular matrix proteins. ExpCell Res 214: 381–388.
Lange TS, Kirchberg J, Bielinsky AK, et al.1995; Divalent cations (Mg2+, Ca2+) dif-ferentially influence the β1-integrin-medi-ated migration of human fibroblasts and
keratinocytes to different extracellularmatrix proteins. Exp Dermatol 4: 130–137.
Legeros RZ. 1991; Calcium Phosphates inOral Biology and Medicine. Karger: Basel.
Lombardi P, Avallone L, D’Angelo A, et al.2000; Buffalo-milk enzyme levels, theirsensitivity to heat inactivation, and theirpossible use as markers for pasteurization.J Food Prot 63: 970–973.
Mahamid J, Sharir A, Addadi L, et al. 2008;Amorphous calcium phosphate is a majorcomponent of the forming fin bones ofzebrafish: indications for an amorphousprecursor phase. Proc Natl Acad Sci U S A105: 12748–12753.
Martin RI, Brown PW. 1997; The effects ofmagnesium on hydroxyapatite formationin vitro from CaHPO4 and Ca4(PO4)2O at37.4 °C. Calcif Tissue Int 60: 538–546.
McDowell H, Gregory TM, Brown ME. 1977;Solubility of Ca5(PO4)3OH in the systemCa(OH)2–H3PO4–H2O at 5, 15, 25 and 37°C.J Res Natl Bur Stand A 81A: 273–281.
Mestres G, Ginebra MP. 2011; Novel magne-sium phosphate cements with high earlystrength and antibacterial properties. ActaBiomater 7: 1853–1861.
Moore WR, Graves SE, Bain GI. 2001; Syn-thetic bone graft substitutes. ANZ J Surg71: 354–361.
Moseke C, Saratsis V, Gbureck U. 2011;Injectability and mechanical properties ofmagnesium phosphate cements. J MaterSci Mater Med 22: 2591–2598.
Neale FC, Clubb JS, Hotchkis D, et al. 1965;Heat stability of human placental alkalinephosphatase. J Clin Pathol 18: 359–363.
Neumann WF, Mulryan BJ. 1971; Synthetichydroxyapatite crystals. IV. Magnesium in-corporation. Calcif Tissue Res 7: 133–138.
Okamoto T, Kubota K. 1996; Sol–gel transi-tion of polysaccharide gellan gum.Carbohydr Polym 30: 149–153.
Oliveira JT, Martins L, Picciochi R, et al.2010; Gellan gum: a new biomaterial forcartilage tissue engineering applications.J Biomed Mater Res A 93: 852–863.
Rowlands AS, George PA, Cooper-White JJ.2008; Directing osteogenic and myogenicdifferentiation of MSCs: interplay of stiff-ness and adhesive ligand presentation. AmJ Physiol Cell Physiol 295: C1037–1044.
RoyM, Bose S. 2012;Osteoclastogenesis and os-teoclastic resorption of tricalcium phosphate:effect of strontium and magnesium doping. JBiomed Mater Res A 100A: 2450–2461.
Ruhe PQ, Boerman OC, Russel FG, et al.2005; Controlled release of rhBMP-2loaded poly(DL-lactic-co-glycolic acid)/cal-cium phosphate cement compositesin vivo. J Control Release 106: 162–171.
Ryu J, Ku SH, Lee H, et al. 2010; Mussel-in-spired polydopamine coating as a univer-sal route to hydroxyapatite crystallization.Adv Funct Mater 20: 2132–2139.
Sader MS, Legeros RZ, Soares GA. 2009;Human osteoblasts adhesion and prolifera-tion on magnesium-substituted tricalcium
phosphate dense tablets. J Mater Sci MaterMed 20: 521–527.
Schaefer S, Detsch R, Uhl F, et al. 2011; Howdegradation of calcium phosphate bonesubstitute materials is influenced by phasecomposition and porosity. Adv Eng Mater13: 342–350.
Schouten C, VanDen Beucken JJ, De Jonge LT,et al. 2009; The effect of alkaline phospha-tase coated onto titanium alloys on bone re-sponses in rats. Biomaterials 30: 6407–6417.
Spoerke ED, Anthony SG, Stupp SI. 2009;Enzyme directed templating of artificialbone mineral. Adv Mater 21: 425–430.
Tamimi F, Le Nihouannen D, Bassett DC,et al. 2012; Biocompatibility of magnesiumphosphate minerals and their stability un-der physiological conditions. ActaBiomater 7: 2678–2685.
Tay KC, Loushine BA, Oxford C, et al. 2007;In vitro evaluation of a Ceramicrete-basedroot-end filling material. J Endod 33:1438–1443.
Taylor AW, Frazier AW, Gurney EL, et al.1963; Solubility products of di- andtrimagnesium phosphates and the dissoci-ation of magnesium phosphate solutions.Trans Faraday Soc 59: 1585–1589.
Van Den Vreken NM, Pieters IY, De MaeyerEA, et al. 2006; Apatite formation in com-posites of α-TCP and degradable polyes-ters. J Biomater Sci Polym Ed 17: 953–967.
Webster TJ, Ergun C, Doremus RH, et al.2002; Hydroxylapatite with substitutedmagnesium, zinc, cadmium, and yttrium.II. Mechanisms of osteoblast adhesion. JBiomed Mater Res 59: 312–317.
Wei S, Teitelbaum SL, Wang MWH, et al.2001; Receptor activator of nuclearfactor-κB ligand activates nuclear factor-κB in osteoclast precursors. Endocrinology142: 1290–1295.
Xue W, Dahlquist K, Banerjee A, et al. 2008;Synthesis and characterization oftricalcium phosphate with Zn and Mgbased dopants. J Mater Sci Mater Med19: 2669–2677.
Yamasaki Y, Yoshida Y, Okazaki M, et al.2003; Action of FGMgCO3Ap–collagencomposite in promoting bone formation.Biomaterials 24: 4913–4920.
Yamasaki Y, Yoshida Y, Okazaki M, et al.2002; Synthesis of functionally gradedMgCO3 apatite accelerating osteoblast ad-hesion. J Biomed Mater Res 62: 99–105.
Yamauchi K, Goda T, Takeuchi N, et al. 2004;Preparation of collagen/calcium phosphatemultilayer sheet using enzymatic minerali-zation. Biomaterials 25: 5481–5489.
Zhao SF, Jiang QH, Peel S, et al. 2013; Effects ofmagnesium-substituted nanohydroxyapatitecoating on implant osseointegration. ClinOral Implants Res 24(Suppl A100): 34–41.
Zreiqat H, Howlett CR, Zannettino A, et al.2002; Mechanisms of magnesium-stimulated adhesion of osteoblastic cells tocommonly used orthopaedic implants. JBiomed Mater Res 62: 175–184.
Gellan gum and calcium and magnesium phosphate composites
Copyright © 2014 John Wiley & Sons, Ltd. J Tissue Eng Regen Med (2014)DOI: 10.1002/term
Copyright © 2022 FDOKUMEN